Embed Size (px)
Citation preview


Introduction
Set up 4 SRRA Stations, out of 121,with additional
sensors.
Cost of setting up of each station is around $17590
AUD(Rs.90.00 Lakhs) including civil works and
installation.
All the sensors are traceable to the World
Meteorological Organization (WMO) and World
Radiometric Reference (WRR) with high accuracy to
ensure the good quality of recorded data.
Solar sensors are calibrated every 2 years in our
calibration laboratory

Sl.
No.
State Stations
1 Gujarat 1
2 Haryana 1
3 Tamil Nadu 1
4 West Bengal 1
Total 4

Details of Four Stations
• 4 Stations:
– 4 regions (North, East, South and West) of the country.
– 1-National Institute of Solar Energy, Gurgaon; Haryana
– 2-Bengal Engineering & Science University, Kolkata;
– 3-Prathyusha Institute of Technology & Management, Thiruvallur
Chennai;
– 4- Gujarat Energy Research & Management Institute, Gandhi Nagar
• Objectives:
– Measure the solar radiation(GHI,DNI&DHI) and metrological
parameters and Study effect of suspended particulate matter
(aerosol), water vapor, gases in the atmosphere on scattering or
absorption of solar radiation
– Provide continuous information on radiation, metrological
parameters, aerosol column, atmospheric turbidity, ozone column,
water vapor in the atmosphere.

5
Location
• Well exposure locations
• Free Horizon
• Strong network signal
Organization
• Academic institutions , R&D institutions etc for mutual beneficial
• Safe and Secured Places
Avoid
• Close proximity of industrial heat source
• High tension power lines nearby

MEASUREMENT STATIONS

Ultrasonic Wind Sensor (wind speed and wind
Direction)
Rain Gauge
Temp and RH Sensor
GPS
Solar Tracker
Radiation Sensors
Solar Panel
Data logger
Battery

Advanced Measurement Station(AMS)
Sun Photometer on solar tracker @ 1.5 m
6m Tower
Lightening Arrestor
Scatterometer

Thiruvallur Chennai 13.09N 79.97E Elev-36m 20/10/11

Thiruvallur Chennai 13.09N 79.97E Elev-36m 20/10/11
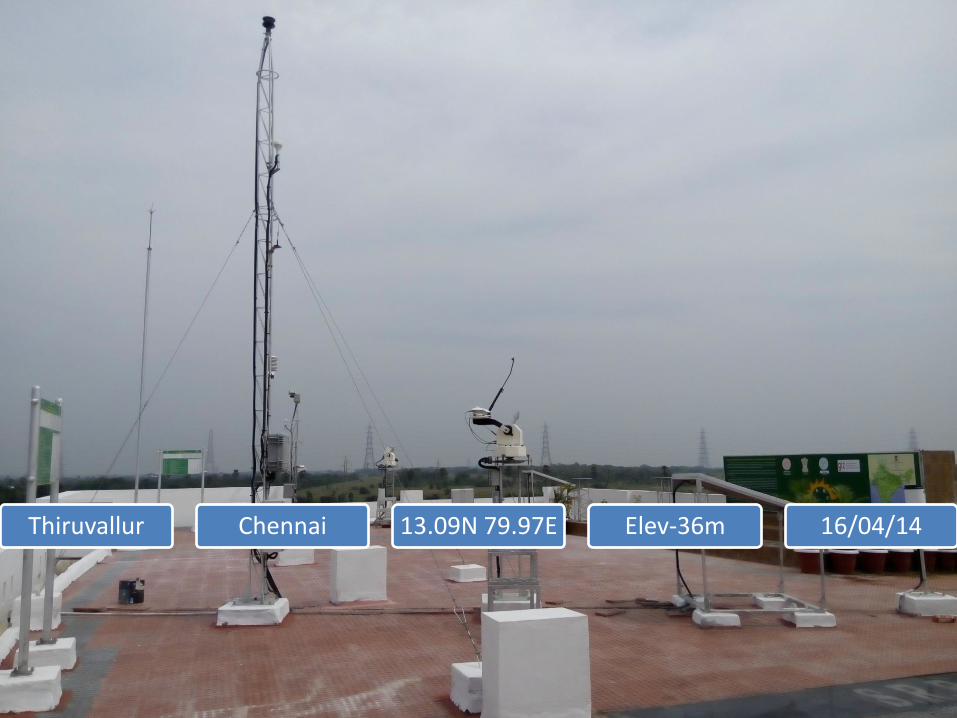
Thiruvallur Chennai 13.09N 79.97E Elev-36m 16/04/14

Gurgaon Haryana 28.42N 77.15E Elev-259m 20/10/11

Gurgaon Haryana 28.42N 77.15E Elev-259m 21/04/14

Gandhinagar Gujarat 72.66E 23.15N Elev-65m 07/08/11

Gandhinagar Gujarat 72.66E 23.15N Elev-65m 19/05/14

Howrah West Bengal 22.55N 88.30E Elev-51m 14/09/13
06/05/14
INSTRUMENTATION

Meteorological Sensors
Ultrasonic Anemometer
Rain Gauge
Barometer Temperature & Humidity sensor

Pyrheliometer-SNIP(Eppley)
Pyranometer-PSP (Eppley)
Solar Tracker-Geonica

Direct Beam Filter Spectrometer-YES, USA
Scatterometer - Envirotech USA
Albedometer-Hukseflux-SRA20
Pyrgeometer-Hukseflux-IR20 Silicon Pyranometer

Sensors installed at field Station
Sl. No Instrument Model & Make
1 Pyranometer PSP, Eppley/Hukseflux Make
2 Pyranometer with Shade PSP, Eppley/Hukseflux Make
2 Pyrheliometer PSP, Eppley/Hukseflux Make
3 Solar Tracker System Sun Tracker, Geonica
4 Rain Gauge 52203, R.M. Young
5 Wind Speed and Direction Sensors Ultrasonic 85000, R.M. Young
6 Temperature Sensor Model 41382VC ,R.M. Young
7 Relative Humidity Sensor
8 Pressure Sensor 61302 L , R.M. Young

Sensors installed at field Station
Sl. No Instrument Model & Make
9 Data logger 3000 SeriesGeonica
10 Solar Panels 80 Watts X 2, Moserbear
11 GPS External Garmin, USA
12 GPRS Antenna Geonica, High Gain
13 Battery Charge Controller PWM 20 Watts
14 External Batteries Exide 42 AH x 2 numbers
15 6m& 1.5m Mast Galvanized Triangular Mast
16 GPRS Connectivity Data/Voice Card
17 Direct Beam Filter Spectrometer Yankee, USA
18 Albedo meter & Pyrgeometer Hukseflux, Netherland
19 Scatterometer Envirotech Sensors, USA
20 Silicon Pyranometer Licor, USA
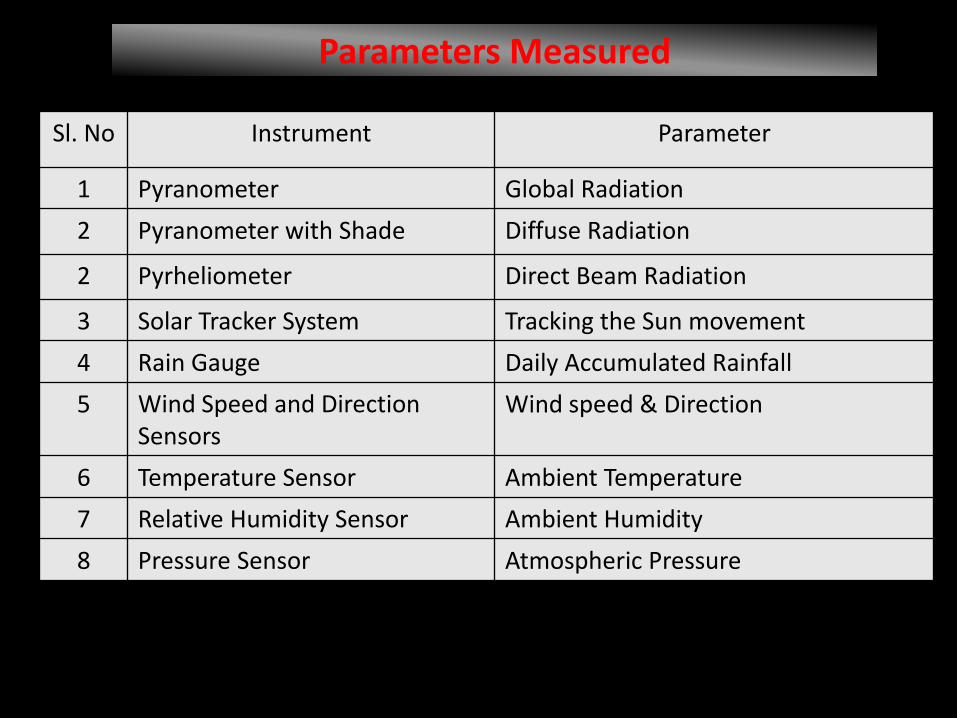
Parameters Measured
Sl. No Instrument Parameter
1 Pyranometer Global Radiation
2 Pyranometer with Shade Diffuse Radiation
2 Pyrheliometer Direct Beam Radiation
3 Solar Tracker System Tracking the Sun movement
4 Rain Gauge Daily Accumulated Rainfall
5 Wind Speed and Direction Sensors
Wind speed & Direction
6 Temperature Sensor Ambient Temperature
7 Relative Humidity Sensor Ambient Humidity
8 Pressure Sensor Atmospheric Pressure

Instruments Parameter
Direct Beam Filter
spectrometer
(Sun Photometer)
Direct spectral irradiance
at narrow wavelengths
Albedo meter Albedo (shortwave
reflection)
of the earth’s surface
(upwelling)
Pyrgeometer Incoming long wave
radiation (downwelling)
Scatterometer Atmospheric visibility /
extinction
Silicon Pyranometer Global radiation on
horizontal & inclined plane
with spectral response as
crystalline Si PV
Continued

Wavelength(nm) Importance
300,325 Absorption by small size aerosol
368 Weak absorption by ozone
500 Aerosol, dust particle
615,675,778,870,940 Water vapour
1020 Weak absorption by ozone and water vapour
Spectrometer Details
Measurements of various parameters from AMS are useful in many ways. For example, UV radiation for solar system durability, Aerosol Optical Depth (AOD) for accurate DNI estimates and to find out the contribution of anthropogenic & natural aerosols, Reflectivity of the Earth surface for surface characterization, Infrared Sky Radiation for estimation of thermal losses, Atmospheric visibility for measuring the transparency of the atmosphere and for the estimation of the amount of light scattered by smoke, dust, haze, fog, rain etc

DATA COLLECTION
&
QUALITY ASSESSMENT

SRRA-SolMap data flow diagram

Quality Assessment
The field solar & meteorological data collected is archived in Central Receiving Server.
Fully automated quality control procedure is in force in the data processing & analysis.
QC includes flagging and gap filling method using quality check algorithms directly applying on the raw data.
For the values of Global Horizontal Irradiance (GHI), Direct Normal Irradiance (DNI) and Diffuse Horizontal Irradiance (DHI), applied quality control is based on Baseline Surface Radiation Network (BSRN) rules by the World Meteorological Organization(WMO), elaborated by the Management and Exploitation of Solar Resource Knowledge(MESOR).
QC controlled data is available in report format as well as time series data. Reports are generated on daily, monthly and yearly basis besides 1 minute, 10 minute and 1 hourly time series data.

SRRA/SolMap data Processing
report/data product
generator
SRRA Level 2
QC’d data
Mirror SRRA Level 1
raw data
reports/data products (1 min, 10 min, 1h, 1 M, …)
QC tests
Flagging
report/data product
generator
SRRA Level 3
gap-filled data reports/data products (1 h, 1 d, monthly, …)
Gap filling procedure
SRRA Level 1
raw data field stations

Quality Assessment
SRRA Level 1
Raw Data
Physical limits (radiation + ambient air parameters)
Limits of a clean & dry clear sky condition (radiation)
Coherence between measurements (radiation)
QC tests
Flagging
Tracking Error (radiation)
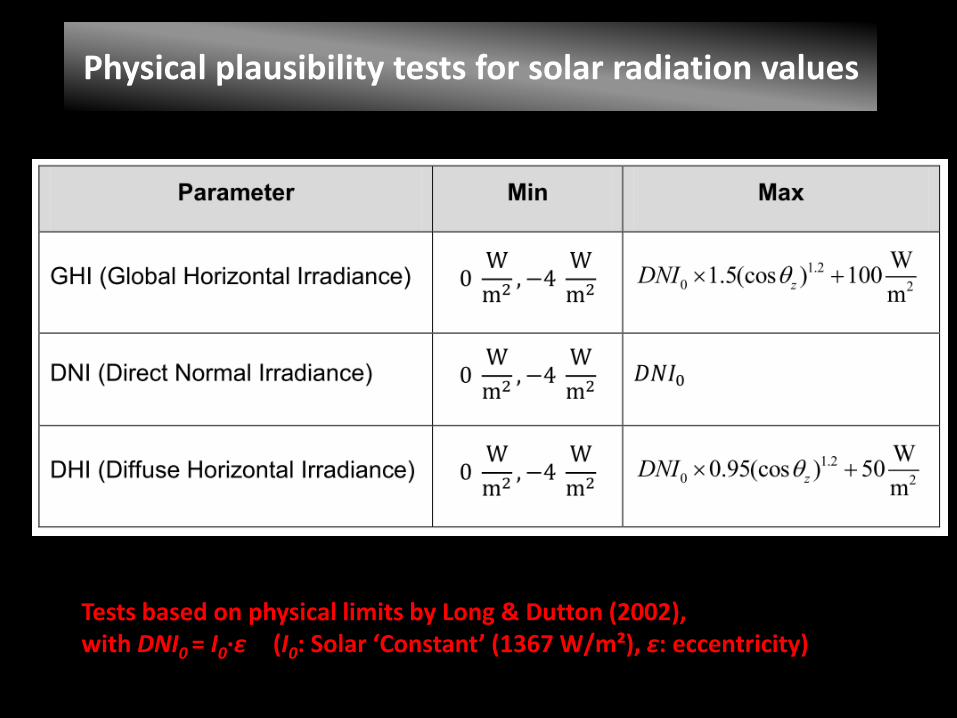
Physical plausibility tests for solar radiation values
Tests based on physical limits by Long & Dutton (2002), with DNI0 = I0∙ε (I0: Solar ‘Constant’ (1367 W/m²), ε: eccentricity)

Test of coherence between measurements for solar radiation values
Tests on coherence between measurements by Long & Dutton (2002) and Long & Shi (2008)

Test against limits of a clean and dry clear sky condition for solar radiation values
Tests based on a clean and dry clear sky condition (Long & Dutton, 2002)
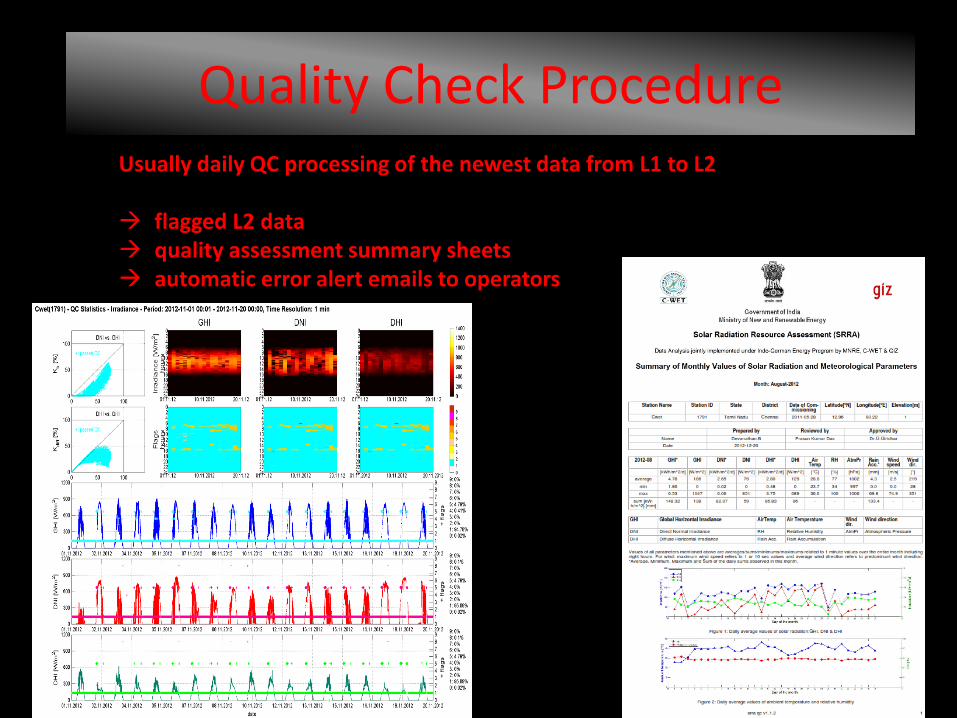
Quality Check Procedure Usually daily QC processing of the newest data from L1 to L2
flagged L2 data quality assessment summary sheets automatic error alert emails to operators


SRRA flagging convention 0____ : Missing value 1____ : Value seems to be correct. 2____ : Value is smaller than the minimum physical limit. 3____ : Value is greater than the maximum physical limit. 4____ : Value is higher than the value for a clear sky condition, inside max physical limit 5____ : GHI measured and GHI calculated by sum of diffuse and direct do not match, inside the clear sky and physical limits 6____ : DHI is greater than GHI beyond the acceptable tolerance. 7____ : Value is below the min limit derived from a model. 8____ : Tracking error, DHI-Pyranometer-Shading error, all other test approved 9____ : Shading by obstructions _000_ : The value doesn’t exceed the limits (also for missing values). _xxx_ : The value exceeds the limit by xxx=|xmeas-xlim| ____0: not replaced ____1: replaced by linear interpolation ____2: replaced by satellite data ____3: replaced manually by other values from a different source ____4: replaced by data from a model / night hours set to 0

Flag
Erro
r %
Thiruvallur (GHI)


References 1. Kumar A, Gomathinayagam S, Giridhar G, Mitra I, Vashistha R, Meyer R,
Schwandt M, Chhatbar K, 2014. Field experiences with the operation of solar radiation resource assessment stations in India . Energy Procedia 49 ( 2014 ) 2351 – 2361, Elsevier
2. Marko Schwandt, Kaushal Chhatbar, Richard Meyer, Indradip Mitra, Ramadhan Vashistha, Godugunur Giridhar, S. Gomathinayagam, Ashvini Kumar: Quality check procedures and statistics for the Indian SRRA solar radiation measurement network: 2013 ISES Solar World Congress
3. Marko Schwandt, Kaushal Chhatbar, Richard Meyer, Katharina Fross, Indradip Mitra, Ramadhan Vashistha, Godugunur Giridhar, S. Gomathinayagam, Ashvini Kumar: Development and test of gap filling procedures for solar radiation data of the Indian SRRA measurement network: 2013 ISES Solar World Congress

Thank you