Embed Size (px)
Citation preview

T R A N S P O R T O F F I N E S A N D S BY C U R R E N T S
A N D W A V E S
By Leo C. Van Rijn, 1 Martin W. C. Nieuwjaar, 2 Theo van der Kaay, 3 Eelco Nap, 4 and Arnold van Kampen s
ABSTRACT: The transport process of fine sands in combined current and wave conditions in a flume was studied. Two types of sediment material were used, a very fine sand with a median diameter of about 100 ~m and a medium-fine sand with a diameter of 200 txm. The current velocities were varied in the range of 0.1- 0.5 m/s (following and opposing the waves). Irregular waves with a single-topped spectrum and peak period of 2.5 s were generated. The significant wave height varied in the range of 0.075 m to 0.18 m. The water depth was about 0.5 m in all tests. Time-averaged fluid velocities were measured by an electromagnetic current meter. Time-averaged sediment concentrations were measured by a pump sampler. The transport rate was obtained by integration of the product of velocity and concentration over the depth. The generation of waves in following or opposing currents causes a decrease of the time-averaged velocities in the near-bed region. A larger wave height results in larger concentrations and in a more uniform dis- tribution over the depth. The influence of the current direction on the concentration profile and the transport rate is negligible.
INTRODUCTION
T h e k n o w l e d g e of the suspended sed imen t t ranspor t process in c o m b i n e d cur ren t and n o n b r e a k i n g w a v e condi t ions is r a the r l imited. D e t a i l e d f ield data are scarce because of the difficult ies in measu r ing bo th the fluid ve- locit ies and sed imen t concen t ra t ions unde r w a v e condi t ions . M o s t of the avai lable exist ing da ta are r e l a t ed to the longshore sed imen t t ranspor t pro- cesses in the surf zone (Jaffe et al. 1984; O s b o r n e and G r e e n w o o d 1992). F l u m e studies of sand t ranspor t by waves and currents were mos t ly re la ted to bed- load t ranspor t ( I n m a n and B o w e n 1963; H a r m s 1969; Qu ick 1983). I n m a n and B o w e n (1963) s tud ied the inf luence of a ve ry w e a k cur ren t of 0.06 m/s on the bed - load t ranspor t process . T ranspo r t in and against the wave d i rec t ion was observed . S e d i m e n t suspension was of m ino r impor - tance. H a r m s (1969) s tudied r ipple migra t ion and found tha t the r ipples were a symmet r i c and r o u n d e d ; the r ipple character is t ics were s t rongly re- la ted to the re la t ive s t rength of the w a v e and current mot ion . D a t a on concen t ra t ions and t ranspor t ra tes were no t g iven by Harms . Qu ick (1982) s tudied the inf luence of re la t ive ly s t rong currents ( _ 0.5 m/s) c o m b i n e d with waves on the bed - load t ranspor t process . T h e ne t t ranspor t ra te was always
~Sr. Engr., Delft Hydraulics, P.O. Box 152, Emmeloord, The Netherlands. ZGrad. Student, Coast. Dept. of Tech., Univ. of Delft, P.O. Box 5048, Delft,
The Netherlands. 3Grad. Student, Coast. Dept. of Tech., Univ. of Delft, P.O. Box 5048, Delft,
The Netherlands. 4Grad. Student, Coast. Dept. of Tech., Univ. of Delft, P.O. Box 5048, Delft,
The Netherlands. SGrad. Student, Coast. Dept. of Tech., Univ. of Delft, P.O. Box 5048, Delft,
The Netherlands. Note. Discussion open until August 1, 1993. To extend the closing date one month,
a written request must be filed with the ASCE Manager of Journals. The manuscript for this paper was submitted for review and possible publication on October 17, 1991. This paper is part of the Journal of Waterway, Port, Coastal, and Ocean En- gineering, Vol. 119, No. 2, March/April, 1993. �9 ISSN 0733-950X/93/0002- 0123/$1.00 + $.15 per page. Paper No. 2644.
123

in the direction of the wave propagation as long as the opposing current was not larger than 0.2 m/s.
Bosman (1982) and Bosman and Steetzel (1986) studied the effect of currents combined with waves on the suspended load transport over a sloping bed of 100 Ixm sand (nonuniform conditions). An extension of their exper- imental results is presented in this study, which is a part of a long-term experimental research of (fine) sand transport in combined currents and waves started in 1987 as a joint effort of Delft University of Technology and Delft Hydraulics. This research program was also sponsored by the MAST-program of the European Communities and by the Rijkswaterstaat of the Dutch Ministry of Public Works. The main objective of this research program is the systematic study of the suspended sediment transport process under currents and nonbreaking waves both in a flume and in a basin. In the present paper, the suspended sediment transport process of fine sands in currents (following and opposing) superimposed by nonbreaking waves in a flume is studied.
The instantaneous suspended sediment transport rate can be computed from the product of the instantaneous velocities and concentrations defined as Uz(x, t) = ue + ae(x, t) and Cz(x, t) = Cz + ~z(x, t) with tiz, ~ being the fluctuating components at a certain elevation above the bed and Uz = 1/L1/T f f Uz dx dt and ca = 1/L1/T f f Cz dx dt being the time and space- averaged velocity and concentration at the same elevation above the bed (L is the average bed form length and Tis the wave period). Space averaging over length L must be applied to eliminate the strong influence of the bed forms on the local variables (Bosman and Steetzel 1986). The instantaneous transport rate Q is defined as
Q~,, = UzCz dz
= f~a +~ [UzCz + Uzez + azC~ + az~z] dz . . . . . . . . . . . . . . . . . . . . . . . . . (1)
with h = water depth; ~1 = water surface elevation; and a = bed boundary level.
Averaging over a longitudinal distance of several bed form lengths (in- dicated by ()) and over time (indicated by an overbar) and assuming rela- tively small waves (~q < h) and relatively small sediment concentrations near the water surface, the time- and space-averaged suspended transport rate qs can be represented as
q, = ~Q~ = ~ [ ~ - ~ + ~ + ~ - ~ + -(-ff~] dz
= f ' [UzCe + uz-(~ + (a---~zCz + ~ ] dz . . . . . . . . . . . . . . . . . . . . . . . (2)
By definition (dz) = 0 and (ti e) = 0, giving
f; qs = uzc~ dz + ~ dz . . . . . . . . . . . . . . . . . . . . . . . . . . . . . . . . . (3)
The first term on the right-hand side of (3) represents the steady current- related suspended transport component q .... which can be determined by measuring the vertical distribution ot the time- and space-averaged velocities
124

and concentrations. The second term represents the transport by the fluc- tuating components due to turbulence and waves. Since the orbital velocities are much larger than the turbulent velocities, the second term on the right- hand side of (3) is termed the wave-related suspended transport component qs,w. Thus, qs = q~,c + q~,w. The total sediment transport rate q, can be obtained by adding the current-related bed-load transport rate qb,c and the wave-related bed-load transport rate qb.w. Thus, q, = (q~,c + qb,~) + (q~.w + qb,w) = q,,c + qt,w.
In the present study, attention is focussed primarily on the current-related suspended transport rate q,,~ for two types of bed material (dso= 100 and 200 Izm). In some tests the total wave-related transport component q,,w was also measured.
The experimental results have been used to determine the influence of wave height, current velocity, and sediment size on the current-related transport rate. The results have also been used to verify the predictive capability of the sediment transport models of Bijker (1971), Nielsen (1985), and Van Rijn (1985, 1989).
EXPERIMENTAL SETUP
The experiments were conducted in a flume of the Laboratory of Fluid Mechanics of the Civil Engineering Department of the Delft University, The Netherlands. The flume has a total length of approximately 45 m, a width of 0.8 m, and a depth of 1.0 m. Irregular waves (single-topped spec- trum) were generated in combination with following or opposing currents. The current was generated by a constant-head system in the laboratory. In the flume, a horizontal sand bed (length 25 m, thickness 0.1 m) was installed. The water was recirculated through a settling basin where most of the sediment load was trapped.
The direction of the current was established by manipulation of gate valves and the use of (temporary) weirs. By adjusting the height of the weir at the end of the flume, the desired water depth (0.5 m) was obtained. A wave damping structure was present at the end of the flume.
The water entering the flume had no initial sediment load. Consequently, the concentration profiles were generated by erosion of sediment particles in the section with the sand bed. To provide enough length for establishing equilibrium concentrations, the measuring section was situated at a distance of approximately thirty times the water depth from the beginning of the bed.
Two types of sediment material were used: a very fine sand of about 100 Ixm (dl0 = 80 Ixm, ds0 = 105 txm, d9o = 150 I~m) and a fine sand of about 200 Ixm (dl0 = 150 t~m, ds0 = 205 Ixm, dg0 = 295 txm). Before the sand was brought into the flume, the silt particles were washed out while pebbles and shells were removed by sieving (3 mm sieve). During the experiments, little variation in particle size was observed at the measuring location.
Water-level variations were measured with a resistance probe near the location where the concentrations and velocities were measured. The mea- suring period was chosen to be 30 rain. Assuming Rayleigh-distributed wave heights, the characteristic wave parameters were computed from the wave spectrum, as follows: Hs = 4(mo)~ Tz = (mo/m2)~ and Tp = 1 / f p , in which: Hs -- significant wave height; Tz = zero-crossing period; Tp = wave spectrum peak period; fp = wave spectrum peak frequency; and m n = nth order moment of wave spectrum.
The characteristic amplitudes of the orbital horizontal velgcity U~ and
125

the displacement ~{~ just outside the wave boundary layer were computed using linear wave theory. Significant wave height was used for the charac- teristic wave height and the wave spectrum peak period for the characteristic wave period. To account for the presence of the current, the relative peak period and the corresponding wave length were used in the wave formulas (Jonsson et al. 1970).
Sediment concentrations were determined from water-sediment samples using a pump sampling instrument. This instrument consisted of an array of ten intake tubes of 3 mm internal diameter connected to the pumps by plastic hoses. The lowest intake tube was placed at about 0.01 m above the crest level of the bed forms. The intake openings were placed transverse to the plane of orbital motion. This arrangement yields a trapping ratio (mea- sured concentration divided by true concentration) less than unity because the sediment particles cannot always follow the curved fluid paths into the intake tubes. The concentrations were corrected for this effect (Bosman et al. 1987). The intake velocity was about 1.4 re~s, satisfying sampling re- quirements. The 10 L samples (sampling period of 20 rain) were collected in calibrated buckets.
The fluid velocities were measured using an electromagnetic velocity me- ter with a measuring volume of about 3 • 3 x 3 mm 3 below the probe. The velocities were measured at the same elevations above the mean bed as those of the concentrations starting at the lowest point and working upwards. A time-averaging period of 256 s (approx. 100 waves) was applied, which gave reproducible results as shown by preliminary tests.
Space averaging over the bed form length was performed by movement of the sediment concentration and fluid velocity instruments forward and backward over a certain longitudinal distance by use of an oscillating carriage on top of the flume. The velocity of the moving carriage (approx. 0.01 m/s) was small compared with the fluid velocity and large compared with the bed-form migration velocity. The error in the time-averaged velocity was less than 0.00125 m/s in the present tests. Preliminary tests showed that a space-averaging distance of 0.6 m (approx. 5 ripple lengths) was sufficiently large to give reproducible results (inaccuracy of about 30%).
The mean bed level at the measuring section was determined using an electronic profile follower and a signal integrator in three longitudinal sec- tions before and after each test.
Based on these results, the distance between the lowest measuring point (velocity and concentration) and the mean bed level was determined in each test.
The applied test program is given in Tables 1 and 2. The test code refers to the approximate sediment size, wave height, and current velocity. For example, T100,10, - 4 0 represents an experiment with a mean sediment size of 100 p~m, a wave height of approximately 10 cm, and a current velocity of approximately 40 cm/s against (negative sign) the wave direction. All experiments were performed in a water depth of approximately 0.5 m. Detailed velocity and concentration data are presented by Van der Kaaij and Nieuwjaar (1987) and by Nap and Van Kampen (1988).
EXPERIMENTAL RESULTS
Time and Bed-Averaged Concentrations Fig. 1 shows the influence of wave height on the concentration profiles
for the 200 ~m sediment. An increase of the wave height yields: (1) An increase of the sediment concentrations which is relatively large in case of
126

TAB
LE
1.
Bas
ic H
ydra
ulic
Dat
a fo
r 10
0 i~
m S
edim
ent
Test
nu
mbe
r (1
) T
10
0,7
.5,1
0
T10
0,7.
5, -
10
7'10
0,7.
5,20
T
100,
7.5,
-
20
7/0
0,7
.5,4
0
7/0
0,7
.5,
-40
T10
0,10
,10
7/0
0,1
0,
- 10
7
/00
,10
,20
T10
0,10
, -
20
T10
0,10
,40
7/0
0,1
0,
- 40
7/0
0,1
5,1
0
T10
0,15
, -
10
7/0
0,1
5,2
0
T1
00
,15
,-2
0
T10
0,15
,40
T10
0,15
, -
40
T10
0,18
,10
T1
00
,18
,- 1
0 7
/00
,18
,20
7/0
0,1
8,
- 20
T
10
0,1
8,-
40
Wat
er
dept
h h (m
) (2
)
0.5
10
0
.48
0
0.5
10
0
.49
0
0.5
20
0
.49
0
0.5
00
0
.50
0
0.4
90
0
.49
0
0.5
00
0.4
90
0
.49
0
0.4
90
0
.50
4
0.4
94
0.5
05
0
.50
4
0.4
96
0
.49
4
0.5
10
0.4
86
0
.50
0
Wav
e he
ight
tt,
(m
) (3
) 0.
073
0.07
1 0.
075
0.07
1
0.0
77
0.
072
0.10
4
0.10
1
0.10
1 0.
105
0.09
5 O
. 103
0.
147
0.1
48
0.
149
0.1
48
0.14
0 0.
141
0.18
0
0.1
80
0
.18
0
0.1
80
0
.17
7
Pea
k pe
riod
Tp
(S)
(4)
2.3
2
.3
2.3
2
.2
2.3
2
.4
2.3
2
.3
2.3
2.3
2
.3
2.5
2
.6
2.3
2
.6
2.3
2.
3 2
.7
2.6
2.3
2
.6
2.3
2
.5
Cur
rent
ve
loci
ty
(m/s
) (5
) 0.
101
- 0
.09
4
0.19
1 -0
.18
4
0.3
64
- 0
.39
0
0.1
00
-0
.10
6
0.2
00
- 0
.20
0
0.3
50
-0
.39
0
0.0
92
-0.1
20
0
.19
3
-0.2
10
0
.38
6
- 0
.38
0
0.0
90
-0.1
31
0
.18
3
-0.2
10
-
0.4
00
Sedi
men
t si
ze
d5o
(l~m
) (6
)
108
100
106
111
108
112
107
110
100
111
109
113
107
110
109
112
105
113
105
111
111
112
111
Rip
ple
heig
ht
Ar
(m)
(7)
0.0
10
0.0
10
0
.01
3
0.0
09
0.0
12
0.
015
0.0
10
0
.00
8
0.0
12
0
.00
9
0.0
14
0
.01
4
0.0
09
0
.00
8
0.01
1 0
.00
6
0.01
5 0
.01
9
0.0
09
0
.00
7
0.01
1 0
.00
7
0.01
5
Rip
ple
leng
th
hr
(m)
(8)
0.0
66
0
.06
3
0.0
84
0.0
68
0
.09
4
0.0
89
0
.06
6
0.0
60
0.
081
0.0
63
0.
111
0.1
10
0.
065
0.0
62
0
,07
8
0.0
63
0
.11
8
0.14
5 0
.06
7
0.0
68
0
.07
9
0.0
60
0
.11
4
Cur
rent
-rel
ated
be
d-lo
ad
trans
port
rate
qb
,c
(kg/
sm)
(9)
1.0
-10
-5
-1.0
"10
s
4.0
' 10
-s
-2.0
-10
.5
1.5"
10
.3
-1.1
.10
-3
5.0"
10
-5
- 1.
0"
10 -5
1
.7.1
0 .
4
-1.2
.10
-4
1.
5" 1
0 -3
-2.3
"10
3
6.0
' 10
.5
-1.4
.10
.4
4
.0.1
0 .
4
- 1.
6'
10 -
4
2.8
' 10
3
-6.2
.10
-3
1.1
.10
-4
-1.6
"10
4
4.5
.10
-4
-3.9
.10
-4
-2.6
"10
3
Cur
rent
-rel
ated
su
spen
ded-
load
tra
nspo
rt ra
te
qs,c
(k
g/sm
) (lo
) 2
.6"
10 -4
-3.6
"10
4
1.8
' 10
3
-3.0
-10
.3
3.3
" 10
2
-3.2
-10
-2
1
.1"1
0
3
-1.6
"10
3
7.5
" 10
3
-6.9
.10
.3
4
.8-1
0
2 -5
.0-1
0
2 2
.3'
10 .3
--5
.3-1
0 .
3
1.1
"10
2
--1
.4"1
0
2 9
.7'
10
2 --
8.1
-10
-2
4.0
-10
-3
--
7.2
"10
3
1.2"
10
-2
--1
.9.1
0 -
2
--9
.3.1
0 -
2

TA
BL
E
2.
Bas
ic H
ydra
ulic
Dat
a fo
r 20
0 p,
m S
edim
ent
E,
13o
Test
nu
mbe
r (1
) T
20
0,7
.5,1
0
/20
0,7
.5,2
0
/20
0,7
.5,4
0
T2
00
,10
,10
T2
00
,10
, -
10
/20
0,1
0,2
0
/20
0,1
0,
- 20
72
00
,10
,40
72
00
,10
, -
40
72
00
,12
,10
/20
0,1
2,
- 10
/20
0,1
2,2
0
72
00
,12
, -
20
/20
0,1
2,4
0
72
00
,12
, -
40
72
00
,15
,10
72
00
,15
, -
10
72
00
,15
,20
T2
00
,15
,- 2
0
72
00
,15
, -
40
/20
0,1
7.5
,-2
0
72
00
,18
.5,-
40
Wat
er
dept
h h (m
) (2
)
0.5
1
0.5
1
0.5
0
0.5
2
0.4
9
0.5
1
0.4
9
0.5
1
0.5
0
0.5
2
0.5
0
0.5
1
0.4
9
0.5
1
0.5
0
0.5
0
0.5
0
0.5
1
0.4
9
0.5
1
0.5
0
0.5
2
Wav
e he
ight
H,
(m
) (3)
0
.07
6
0.0
74
0.0
76
0.1
06
0.0
98
0.0
99
0.0
96
0.0
98
0.1
01
0.1
21
0.1
15
0.1
23
0.1
16
0
.11
9
0.1
18
0.1
46
O. 1
49
0.1
51
O. 1
47
0.1
46
0.17
7
0.1
86
Peak
pe
riod
rp
(S)
(4)
2.6
2.4
2.4
2
.6
2.5
2.5
2.5
2.6
2.5
2.5
2.5
2.6
2.5
2.5
2.6
2.4
2.5
2.4
2.5
2.5
2.5
2.4
Cur
rent
ve
loci
ty
tJ
(m/s)
(5
) 0
.11
0.2
3
0.4
5
0.1
2
-0.1
3
0.2
2
- 0
.22
0.4
5
-0.4
5
0.1
0
-0.1
2
0.2
2
- 0.
23
0.4
4
- 0
.44
0.1
1
-0.1
3
0.2
2
- 0
.23
-0.4
4
-0.2
3
- 0.
43
Sedi
men
t si
ze
dso
(~m)
(6)
20
0
20
3
20
3
20
5
20
9
21
2
20
9
20
5
20
6
20
8
21
2
20
3
20
6
20
4
20
0
21
8
22
3
21
1
20
5
2O0
20
5
21
1
Rip
ple
heig
ht
A (m)
(7)
0.0
16
0.0
15
0.0
14
0.0
17
0.0
13
0.0
17
0.0
19
0.0
19
0.0
21
0.0
16
0.0
16
0.0
17
0.0
18
0.0
18
0.0
20
0.0
18
0.0
17
0.016
0.0
13
0.0
24
0.0
13
0.0
29
Rip
ple
leng
th
k,
(m)
(8)
0.0
93
0.0
99
0.1
34
0.0
92
0.0
89
0.0
99
0.1
14
0.1
53
0.1
56
0.10
0
0.1
02
0.1
08
0.1
11
0.17
4
0.1
55
0.1
00
0
.10
9
0.1
11
0.0
92
0.1
88
0.0
95
0.2
00
Cur
rent
-rel
ated
be
d-lo
ad
trans
port
rate
qb
,c
(kg/
sm)
(9)
4.1
" 10
6
1.9
" 10
4
1.6
" 10
3
6.2
-10
-5
3.3
-10
-5
2.4
" 10
.4
-1.3
'10
4
2.8
-10
3
-3.7
-10
.3
1.9
" 10
4
3.4
' 10
5
3.5
- 10
4
-1.7
.10
-4
5.2
' 10
3
-3.6
.10
.3
1.2
.10
.4
8.1
-10
-2
6.7
" 10
4
-- 1
.0.1
0 -
4
--8
.3"1
0
3
--4
.6"1
0
4
-- 8
.5"
10
.3
Cur
rent
-rel
ated
su
spen
ded-
load
tra
nspo
rt ra
te
qs,c
(k
g/sm
) (1
0)
2.3
" 10
5
2.1
'10
4
1.1
"10
2
8.6
" 10
5
1.5
' 10
4
9.5
" 10
-4
-7.8
.10
-4
2.1
"10
2
2.5
.10
2
3.7
.10
-4
- 2.
6-10
-4
1.7
.10
3
-1.6
-10
3
2.5
.10
-2
2.9
.10
2
7.3
.10
4
- 1.
0.10
-3
4.5
-10
3
-3.1
.10
3
-4.0
.10
.2
-3.7
.10
3
-6.0
" 10
2

5
T
N
FIG. 1.
0.8
0.50"70"6 I u=O(m/s)
0 . 4 - ~
0..5
0 . 2
0.1
0 ~"~ 10-,3 10-2 10-I 100
~, c (kg/~ ~) 0 . 8
0.7
0.6
0.5
0.4
0.3
0,2
0.1
0 10-3
\ \ \
10-2 10-1 10 0 > C (kg/rn 5)
0 . S r
0.7 l I~1 _~ O.l(m/s)
0.6
"~ 0.5
O.4
0 . 3
0 . 2
101
o.1 ~ 1
0 " " 10-5 10-2 10-1 10 o
> C (kg/m 5) 0.8 0.7 ~ , ~ X , , I~l ~_ o.4(m/s)
".', ",,,g
\ \ \
10-2 10-t 10 0 ~, c (kg/~ 3)
0.6
"% 0.5
T o . 4
0.3
0.2
-- 0
101 10 -3
�9 H s _~ 0.075 (m) (following)
+ M s _~ 0.100 (m) (following)
x H s ~_ 0.1,00 (m) (opposing)
, H s _~ 0.120 (m) (following)
H s ~ 0.120 (m) (opposing) �9 M s _~ 0.150 (m) (following)
u H s _~ 0,150 (m) (opposing)
lO 1
101
Influence of Wave Height on Concentration Profile for 200 i~m Sediment
a weak current a = 0.1 and 0.2 m/s, and relatively small in case of a strong current of ~ = 0.4 m/s, (2) an increase of the steepness of the concentration profile as a result an increased wave-induced mixing (larger orbital velocities and larger ripple heights). Similar results have been obtained for the ex- periments with the 100 [zm sediment. It is noted that the sediment concen- trations in the upper layers of the depth at the current velocities of 0.4 m/s are somewhat too small (about 30%), because the flume was not long enough for establishing equilibrium concentrations in the upper half of the flow depth.
Fig. 2 shows the influence of the current velocity on the concentrations. A weak current of 0.1 m/s superimposed on the waves negligibly influences the magnitude of the concentrations. A stronger current of 0.2 m/s increases the concentrations in the upper layer due to increased mixing effects, while those in the near-bed region remain approximately constant. A relatively strong current of 0.4 m/s increases the concentrations over the entire profile.
129

0.8
0.7
0.6
0.5
o.4
0 . 3
0 . 2
5
T
FIG. 2, ment
~ Hs_~O.O75(m)
10-3 10-2 10-1 100 �9 C (kg/rn 3)
0.8
0.7 ~ H s 012(m)
0.6 X o.8 ~ ~ , O. 4 \ "~u
O. 5 X X
0,2 ""
0.1
0 10-3 10-2 10-1 100
> C (kg/m 5)
�9 0 ~ 0 (m/s) + ~ -~ 0.1 (m/s)
. . . . . . . . . x O ~-0.1 (m/s)
�9 ~ ~- 0.2 (m/s) ......... A 6 ~-0.2 (m/s)
�9 ~-~ 04(m/s) . . . . . . . . . o ~ _ ~ - 0 . 4 (m/s)
Influence of Current Velocity
0.8, , ~ Hs~-O.lO(m) 0.71 ~
0.6 I 'P'
~ o . 5 1
T o . 4 1 X '
0 . 3 1
o.21 % 0 . 1 1 " - ",X
lO 1 lO-5 lO-2 lO-1 lO 0 lO 1 - - - ~ C (kg/m 5)
0.8 ~, Hs~O.15(m) 0.7 - X
0.6 -X lq ~o.5 ~,\ ~,,,, . \ \ ~1
0.3 'e 0.2- " "'" '
0.1 ~ . ) .
0 ~' 101 10-3 10-2 10 -1 100 101
�9 C (kg/m 3)
(following)
(following) (opposing) (following) (opposing) (following) (opposing)
on Concentration Profile for 200 ~m Sedi-
The current direction has a minor effect on the concentration profiles. Comparison of near-bed concentrations (at the same wave height and cur- rent velocity) for a different current direction shows maximum differences of about 30%. In case of an opposing current the concentrations in the upper layers are slightly larger, as shown by the broken curves in Fig. 2. This may be caused by an increased upward mixing due to the presence of larger velocity gradients, which are generated in opposing currents. This trend was also observed with the 100 pom sediment.
When a very weak current (Itil = 0.1 m/s) or no current is superimposed on the waves, the measured concentration profiles can be presented by the following distribution:
cz = Cb exp . . . . . . . . . . . . . . . . . . . . . . . . . . . . . . . . . . . . . . . . . . . (4)
130

in which cz = time- and bed-averaged concentration at height z; Cb = reference concentration at z = 0; and Lc = vertical length scale (order ripple height).
Eq. (4) cannot be used when a stronger current (la[ = 0.2, 0.4 m/s) is superimposed on the waves. For increasing current velocities the current- induced mixing becomes more important, resulting in larger sediment con- centrations in the upper layers.
Time- and Bed-Averaged Fluid Velocities Measured velocity profiles show a clear influence of the waves in both
experiments (100 p~m and 200 ~m sediment). Fig. 3 shows measured current velocity profiles of following currents for the 200 ~m experiments. The velocities are made dimensionless with the depth-averaged velocity a. For comparison, the current velocity profile measured over the same rippled bed without waves (after stopping the wave generator) is also shown. In the tests with a = _0.1 m/s and ___0.2 m/s, the presence of waves causes a decrease of the velocities in the near-bed layer (z/h < 0.2) and in the near-surface layer (z/h > 0.6) and an increase of the velocities in the in- termediate layer. These deviations are ~rnost pronounced when the peak value of the near-bed orbital velocity (Us) is relatively large compared to the depth-averaged velocity (t~).
L JI �9 - tl
0.6
o.st , , I /l,
T:-:., L �9 t 9 ,,11 I 1.2"t2"
0 0.250.500.751.001.251.50 ~, U z / a
0 .8 0 ~ _ 0 . 4 m / s v I
0 .7 i
0 .6 I
0.4 x
0 5 /
0"2. / /
0.1
0 ~ ' ~ 0 0.250.500.751.001.251.50
U z / ~
FIG. 3.
0.8
0.7
0.6
0 .5
0.4
0 .3
0.2
0.1
0
~_~ 0 . 2 m / s ~ t
I 0 0 . 2 5 0 . 5 0 0 . 7 5 1 . 0 0 1 . 2 5 1 . 5 0
= Uz /~
o H s-~ 0 . 0 7 5 (m)
x H s_~ 0 .100 ( m )
v H s _~ 0 .120 (m)
[] H s _~ 0 .150 ( m )
cu r ren t and waves
. . . . . . . . . cu r ren t a lone
H s = s ign i f i can t wave he igh t
O = d e p t h - m e a n ve loc i t y
Influence of Waves on Current Velocity Profile: Following Current
131

Fig. 4 shows the current velocity profiles of opposing currents for the 200 Ixm experiment. The presence of waves causes a decrease of the current velocities in the near-bed region (z/h < 0.2), which is significantly larger than in the case of following currents, and an increase of the velocities in upper layer (z/h > 0.5). These deviations are most pronounced with rela- tively large waves combined with a weak opposing current (a = -0 .1 m/s). Similar effects for opposing and following currents were observed by Kemp and Simons (1982, 1983) for a plane bed.
Ripple and Roughness Characteristics Two-dimensional ripples were observed for relatively small waves without
a current. The ripples became three-dimensional with increasing wave height and current velocity. The ripples were symmetrical with waves alone and asymmetrical when a current was superimposed on the waves. The overall ripple dimensions are given in Tables 1 and 2. The near-bed velocities measured in a current alone (after stopping the wave generator) were an- alyzed by fitting a logarithmic distribution to the measured velocities to determine the physical bed roughness height ks (Van Rijn 1990). The ks values were found to be on the order of 3 -7 times the ripple height. A clear influence of the ripple steepness (= 0.1 to 0.2) could not be detected.
0.8
0,7
0,6
~ 0 . 5
0.4
0.3
0.2
0.1
0 0
0.8
0.7
0.6
% 0 . 5
T O.4
0.5
0.2
0.1
0 0
FIG. 4.
5" ' - 0 . 1 m / s I t l t L,,
t / , I
/
~ v /
O. 250.500.751.001.251.50
0.8 5-~ - 0 . 2 m / s
0.7
0.6 '~
0.5 _I
[3.4 r
0,3 ~
0.2 ~ / ~ t
0.1 . ~ r . . /
0 ~ ' 0 0 . 2 5 0 . 5 0 0 . 7 5 1 , 0 0 1 . 2 5 1 . 5 0
U z / ~
i~_~ - 0 . 4 m / s
o / l
O. 2 5 0 . 5 0 0 . 7 5 1 . 0 0 1 . 2 5 1 . 5 0 ~- u z / ~
o H s _~ 0 .075 (m)
x H s _~ 0.100 (m)
v H s _~ 0 .120 ( m )
[] Hs -~ 0 .150 ( m )
cu r ren t and waves
. . . . . . . . . c u r r e n t a lone
H s = s ign i f i can t wave he igh t
O = d e p t h - m e a n ve loc i t y
Influence of Waves on Current Velocity Profile: Opposing Current
132

Current-Related Sediment Transport The total current-related sediment transport rate qt,c passing a section
was determined as the sum of the current-related suspended-load transport qs,c and the current-related bed-load transport qb.r Thus q,,c = qs,c + qb,c.
The current-related bed-load transport rate was estimated from the mea- sured bed-form characteristics, as follows:
qb.c = 0.6ps(1 -- p ) V r A r . . . . . . . . . . . . . . . . . . . . . . . . . . . . . . . . . . . . . . (5)
in which Ps = sediment density = 2,650 kg/m3; p = porosity factor of bed material = 0.4; vr = ripple migration velocity; and A = ripple height.
The measured qb,c values are presented in Tables 1 and 2. The inaccuracy of these values may be rather large, because only a few ripples were studied close to the flume window.
The current-related suspended-load transport is defined as the integration of the product of the time- and space-averaged concentrations cz and ve- locities u~ from the bed-form crest to the water surface (see Fig. 5). Thus:
f: = uzc~ d z . . . . . . . . . . . . . . . . . . . . . . . . . . . . . . . . . . . . . . . . . . (6) qs,c /2Ar
To estimate the local-transport rate in the unmeasured regions between the lowest measuring point and the ripple crest and between the highest mea- suring point and the water surface (see Fig. 5), the following methods were applied:
�9 The concentrations between the lowest measuring point and the ripple crest are represented by an exponential function cz = exp(Az + B). The A and B coefficients were obtained by fitting of this latter equation to the concentrations in the lowest three measuring points.
�9 The fluid velocities between the lowest measuring point and the ripple crest level are represented by the following exponential func- tion: uz = u l ( z / z l ) ~ in which ul = fluid velocity measured in the lowest measuring point zl.
�9 The concentrations between the highest measuring point and the
ZL
z2
V
\ l ~ L ~ qs,c
C2C1 f~, ~ 1/2 /kr ~qb,c
concentrotion
ZL
z2 U1 Z 1 V ~ ~ ' m v ; 1/2 Z~r
--- velocity FIG. 5. Extrapolation of Measured Concentration and Velocity Profiles
133

water surface are represented by a linear function giving a concen- tration equal to zero at the water surface. The fluid velocities between the highest measuring point and the water surface are assumed to be constant and equal to the fluid velocity in the highest measuring point.
The first assumption is the most crucial because it is related to the ex- trapolation of the concentrations in a region with large gradients, which may result in considerable errors. Therefore, other distributions were ap- plied in preliminary computations giving variations of the transport rates of about 30%. This latter value is supposed to be the inaccuracy of the mea- sured current-related suspended-load transport rates.
The transport rates based on the aforementioned method are reported in Table 1. Analysis of the measured current-related transport rates showed almost no influence of the wave direction on the transport rates. Fig. 6 shows the current-related transport q,,~ as a function of the significant wave height for different velocities. Fig. 7 shows the influence of the current velocity for different wave heights. In both graphs, the data points have been omitted for clearness. The following phenomena can be observed:
�9 Relatively large increase of the transport rate with increasing wave height (qt,c "~ Hi ) when a weak current (a = 0.1 m/s) is present.
�9 Relatively small increase of the transport rate with increasing wave height (q,,~ -~ H~) when a strong current (a = 0.4 m/s) is present.
�9 Relatively large increase of the transport rate with increasing depth- averaged velocity [q,,~ ~ (a) 4-~ when low waves (HJh = 0.15) are present.
~ Relatively small increase of the transport rate with increasing depth- averaged velocity [q~,~ ~ (a) 2.5] when high waves (HJh = 0.35) are present.
10 0
10 -1
x.~ 10_2 +2
o- 10_3"
I 10_4 .
10-5 0.05
f i ( m / s )
~ 0 . 4
/ 1 /
/ / / I
o.io ' o 5 o '
H s (rn)
I00 #m
200 ~rn
0.50
FIG. 6. Current-Related Transport Rate as Function of Wave Height for Different Current Velocities
134
10 0
10 -1 ED
10-2. D cr 10_3 .
T 10_4 .
10-5
H s ( m )
~ 0.18 0.15 0,10 0 07
~).12 / / / / / /
1 / 1 1 / /
0.10 / i / / /
0 . 0 7 5 / /
011 0.'2 0.'3 0.'4 0.5 ; ~ (~/~)
1 O0 #m
. . . . . . . . . 200 /~m
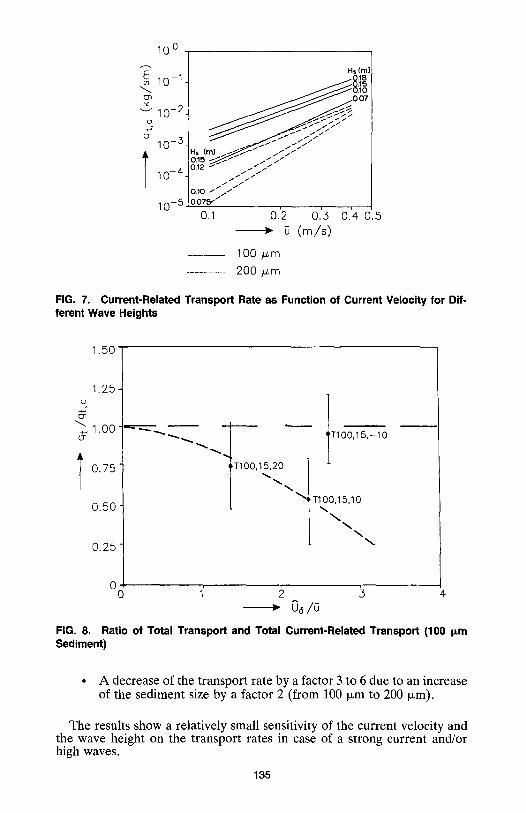
FiG, 7. Current-Related Transport Rate as Function of Current Velocity for Dif- ferent Wave Heights
1.50
1.25 o
d 1.00 o-
T 0.75
0.50 -
0.25
FIG. 8.
~ [ ~ '" 'T100,15,-10
0 o 1' 2 3 4 0~/~
Ratio of Total Transport and Total Current-Related Transport (100 i~m Sediment)
�9 A decrease of the transport rate by a factor 3 to 6 due to an increase of the sediment size by a factor 2 (from 100 Ixm to 200 txm).
The results show a relatively small sensitivity of the current velocity and the wave height on the transport rates in case of a strong current and/or high waves.
135

10 1
E co 10 0 E~ 2~ v c~
(3- 10-1 @
o
o o_ 10 -2
(3
03
o 10 - 3 @ E
10-4
10-5 10-5
/ /
/ / / �9
p/'/ / / /
/
/,.,/ )
/ /
/ /
/ / /
' x _ , ,6o
-
t -/ / / /
/ / / / / ~ / / / / / /
100 /zm-sediment x Bijker �9 Nielsen o Van Rijn
10-4 10-3 10-2 10-1 10 0 computed transport rate, qs,c (kg/sm)
101
FIG. 9. Measured and Computed Transport Rates for 100 v m Sediment
Wave-Related Sediment Transport To obtain quantitative information of the relative importance of the total
wave-related transport rate (q,,w) with respect to the total current-related transport (%c), special sand balance tests were performed. These tests con- sisted of measuring the sediment mass eroded from the bed between the flume entrance and a section S at a distance of 15 m from the entrance. Since there was no sediment feed at the flume entrance, the total time- averaged transport rate qt passing the section S is equal to the eroded mass divided by the elapsed time period. The eroded mass was obtained by weighing (underwater) the bed material mass before and after the tests.
Time- and space-averaged velocity and concentration profiles and bed- form characteristics were simultaneously obtained at section S to determine the total current-related transport qt.c = qs,c + qb,~, see (5) and (6).
Three experiments with the 100 txm sediment were performed: two ex- periments with a following current of about 0.1 m/s and 0.2 m/s (7"100,15,10 and T100,15,20), and one experiment with an opposing current of about 0.1 m/s (T100,15, - 10). The significant wave height was about 0.15 m in all three tests. The experimental results are presented in Fig. 8 showing the ratio of the total transport rate q~and the total current-related transport rate q,,c as a function of the ratio U~/a. The most important results are:
�9 The total transport rate q, = q,,w + qt, c is smaller than the total
136

10 1
E 10 0
v
(3-
. 10-1
o
c 10 -2 o
o 10 - 3
E
10-4
10-5 10-5
/ / / �9 / / / / /
j /
/ / / / / / /
/ / / i
X~/~/~ '/ �9 / <x �9
~ , ' �9
• / �9 �9
factor 2 / / ( 200 /~m-sediment ~ , / ~ � 9 x Bijker
�9 Nielsen / / / / / x o �9 o Van Rijn
/ / )O �9 / / / �9 /
)O �9
10-4 10-3 10-2 10-1 10 0 computed transport rote, qs,c (kg/sm)
101
FIG. 10. Measured and Computed Transport Rates for 200 ~m Sediment
N 1.0
-6 r r~
>~ 0 8 o g
~ 0 . 6
--~ 0 . 4
m g E 02
T100,10,10 Bijker Nielsen Van Rijn
�9 measured
\
\ \ X
�9 \ '-~,
"~ ~,
�9
5 10-2 5 10-I 5 10 0
�9 sediment concentration (kg/m 3)
H s = 0.104 m u = 0.10 m/s
0 I 10-3 5
FIG. 11. Measured and Computed Concentration Profiles (T100,10,10)
137
101

< N
1.0
Z3
>~ 0.8 o
*j o~ 0.6
~z
2 0.4
rn
E 0.2
I 10-2
T1 00,10,40
~ " " �9 ~i - - ~ . Van Rijn
: I . . . . . . Bijker J . . . . . . . . Nielsen
~ ; ~ . -,~ �9 measured
\ \ H s = 0.095 m ~ ' ~ \ u = 0.55 m / s
' \ ' , \ \ . i
%% �9 I I
5 10-1 5 100 5 sediment concentrat ion (kg /m 3)
FIG. 12. Measured and Computed Concentration Profiles (T100,10,40)
101
< N
1.0
Z3
~> 0.8 O
g
o~ 0.6
2 0.4
E 0.2 1:3
t FIG. 13.
\
\
I I
T100,18 , -10 Bijker Nielsen Van Rijn
�9 measured
H s = 0.18 m u = --0.151 m / s
i
5 10-2 5 10-1 5 100 > sediment concentrat ion (kg /m 5)
5 101
Measured and Computed Concentration Profiles (T100,18,-10)
current-related transport rate q,.c for a following current, which means that the wave-related transport q,.w is directed against the wave and current direction. The wave-related transport is largest for a weak following current (T100,15,10). The wave-related transport seems to be negligible in case of an opposing current (T100 ,15 , - 10).
138

< N
1.0
23
>~ 0.8 O J3 (3
o~ 0.6 ~ z
-~ 0.4
co
g E 0.2
~D
l O' 1 0 - 3
1" T 1 0 0 , 1 8 , - 4 0 ",. \
Bi jker ~, Nielsen Van Rijn I
�9 m e a s u r e d
Hs= 0.177 m
u = - 0 . 4 m, /s
5 10-2 >
% : '
'" \ , \ , \ % �9 %
%
% %
, n
5 10-1 5 10 0 5 101 sed imen t c o n c e n t r a t i o n (kg/m 3)
FIG. 14. Measured and Computed Concentration Profiles (T100,18,- 40)
The underlying mechanism of (wave-related) transport processes against the wave direction is strongly related to the near-bed eddy motions.
When the wave crest (superimposed on a following current) passes a ripple, the near-bed velocities will be relatively large and a strong eddy with high sand concentrations is generated at the ripple back. When the wave trough passes the ripple, the eddy is lifted and carried against the wave propagation direction. After that, the eddy disintegrates at higher levels. Some of the sediment particles will fall back to the bed during this process. Simultaneously, another eddy is generated at the ripple front when the wave trough passes. During this phase of the wave cycle, the near-bed velocities are relatively small and thus the eddy velocities and the corresponding sand concentration in the eddy are also relatively small. Thus, near the bed, there is a process of relatively large concentrations transported by relatively small velocities against the wave direction and a process of relatively small con- centrations transported in the wave direction by relatively large velocities. Quantitative estimates of both processes indicate a net wave-related trans- port against the wave direction in case of a following current (Nap and Van Kampen 1988).
Finally, the importance of the wave-related transport q,.w in or against the current direction is discussed. Although only three experiments were qarried out, the wave-related transport seems to be of less importance for U~/~i < 2. Neglecting the q,,w component with respect to the q,,c component results in a systematic error of about 30%.
COMPARISON OF MEASURED AND COMPUTED TRANSPORT RATES
Applied Formulas The following three methods were applied to compute the current-related
suspended-transport rates: the Bijker (1971) method, the Nielsen (1985) method, and the Van Rijn (1985, 1989) method. These methods are all based on the computation of a time-averaged concentration and velocity
139
profile. The b-coefficient of Bijker formula, originally proposed to be b = 5 (Bijker 1971) for longshore transport, was used as a calibration parameter in this study (nonbreaking waves). A value of b = 1 yielded the best overall results. Since random waves were generated in the flume tests, a charac- teristic wave height and period must be defined to represent the wave spectrum. The methods of Bijker and Nielsen were originally developed for regular waves. Therefore, a probabilistic method based on the assumption of Rayleigh-distributed wave heights was applied. The transport rates were computed for individual wave heights and then multiplied (weighted) by the probability of occurrence of each wave height class. The method of Van Rijn (1985, 1989) has been developed for irregular waves applying the sig- nificant wave height and the peak period.
All three methods are sensitive to the bed roughness value kw. Analysis of the experimental data shows ks values up to 7 times the ripple height At. Therefore, transport computations were carried out for ks values in this latter range. The ks values giving the best agreement between measured and computed transport rates (Figs. 9 and 10) are
�9 Bijker: ks is approximately 3Ar for the 100 ~m sediment and approx. 1At for the 200 ~m sediment.
�9 Nielsen: k~ is approximately 3A r for the 100 ~zm sediment and ap- prox. 1Ar for the 200 p~m sediment.
�9 Van Rijn: ks is approximately 3& for the 100 ~m sediment and the 200 ~m sediment.
Results Measured and computed current-related suspended transport rates q,,c
according to the three methods are presented in Figs. 9 and 10. The Bijker method overestimates (factor of 3 to 5) the transport rates in
case of a weak current (0.1 and 0.2 m/s) and underestimates (factor of 3)
-5. N
0P 17)
O g 2 o~ 0.6
~z
-~ o4 co
E 0.2 ~D
1.0 , ,
0.8 , "~ ~,
%%% " ~
-
0 ~ 10-5 5
T200 ,15 , - 10
} - i s =
7 =
o- .~ ~
10-2 10-1 5 100 5 �9 sediment concentrat ion ( k g / m 3)
Bijker Nielsen Van Rijn measured
0.149 m
-0.1.3 m / s
01
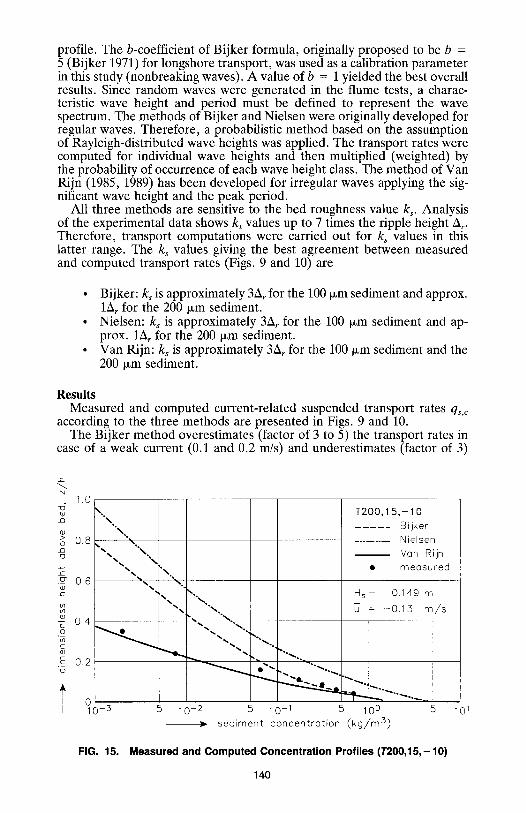
FIG. 15. Measured and Computed Concentration Profiles (T200,15,-10)
140

the transport rates in case of a strong current (0.4 m/s) for both the 100 p.m and the 200 Ixm sediment. About 48% of the predicted transport rates are within a factor of 2 of the measured values. The discrepancies are mainly related to the computation of the sediment concentration profile. Figs. 11- 16 show measured and computed concentration profiles. For a weak current (0.1), the concentrations are largely overestimated in the major part of the water depth. The predicted near-bed concentration is somewhat too small for the 100 jxm sediment, but shows good agreement for the 200 ~m sedi- ment. For a relatively strong current (0.4 m/s), the shape of the concentra- tion profile is much better represented, but now the predicted near-bed concentrations are much too small, resulting in an underprediction of the transport rates (Figs. 12, 14, and 16). Based on these results, it is concluded that the parabolic mixing coefficient distribution applied by Bijker is not correct for the combination of waves and a weak current, whereas the bed concentration prediction is not correct when a strong current is present.
The Nielsen method overestimates (factor of 5 to 10) the transport rates for the 200 Ixm sediment, mainly because the predicted concentrations are too large near the bed (weak currents 0.1, 0.2 m/s) and in the upper part of the water column (Figs. 15 and 16). The transport rates are also over- predicted (factor 5 to 10) for the 100 ~m sediment in case of a strong current (0.4 m/s). This large overprediction cannot be explained from the predicted concentration profiles (Figs. 12 and 14), which show reasonable agreement in the near-bed region. The approximation function for the computation of the transport rates proposed by Nielsen is possibly not correct for fine sand (100 ~m) in a strong current. Closer agreement between measured and computed transport rates would have been obtained by numerical integra- tion of the concentration and velocity profiles instead of using the approx- imation function. Finally, it is noted that the Nielsen method is quite sen- sitive to the particle size of the bed material.
The Van Rijn method shows reasonable results over the full range of conditions. About 73% of the predicted transport rates are within a factor
<. N
1.0
.Q
~> o.8 o
2 0.6
A_
-~ 0.4
g E 0.2
t
. - \
0 I 10-3 5
\ \ \ \
\
\
" X
% .
10-2 5 10-1 5 100 > sediment concentration (kg /m 3)
T200,15,- 40 Bijker Nielsen Van Rijn
�9 measured
Hs= 0.146 m 0.44 m / s
5
FIG. 16. Measured and Computed Concentration Profiles (T200,15,-40)
141
101

of 2 of the measured values. The computed concentrations show good agree- ment in the near-bed region both for the 100 ixm and the 200 Ixm sediment. The concentrations in the upper layers are reasonably well predicted, with exception of the tests with large waves (H, = 0.18 m) over a bed of 100 t~m sediment (Figs. 13 and 14).
CONCLUSIONS
The main findings of this study can be summarized as follows: The generation of waves in following or opposing currents causes a de-
crease of the time-averaged velocities in the near-bed region (z/h < 0.2). This effect increases for a larger wave height and is most pronounced for an opposing current. The waves cause a decrease of the near-surface ve- locities for a following current and an increase of the near-surface velocities in case of an opposing current.
A larger wave height leads to larger concentrations and to a steeper (more uniform) concentration profile, probably as a result of an increase of the wave-related mixing.
A weak current superimposed on the waves hardly affects the concen- tration profile. A strong current increases both the concentrations in the near-bed region and in the upper layer. The influence of the current direction (following or opposing) on the concentration profile is negligible.
The physical bed roughness height was found to be 3 to 7 times the ripple height.
The current-related transport rate varies with H i for a weak current and with H ] for a strong current. The transport rate varies with (2) 4 for low waves and with (a) z5 for high waves. The transport rate shows a decrease by a factor of 3 to 6 for an increase of sediment size from 100 p~m to 200 p,m.
The magnitude of the wave-related transport rate is much smaller than the current-related transport rate (qt,w/qt.c < 0.3) for a ratio U~/ft < 2. The wave-related transport was found to be against the wave and current di- rection in some tests.
Comparisons of measured and predicted transport rates based on the methods of Bijker, Nielsen, and Van Rijn were performed, The Bijker method overestimates the transport rate for a weak current, but underes- timates the transport rate for a strong current. The method of Nielsen shows discrepancies (factor of 5 to 10) for the 200 txm sediment and for the 100 p,m sediment combined with a strong current. The method of van Rijn shows reasonably good results over the full range of conditions.
ACKNOWLEDGMENTS
The Delft University of Technology is gratefully acknowledged for pro- viding flume facilities to perform a detailed study of the sediment transport process.
APPENDIX, REFERENCES
Bijker, E. W. (1971). "'Longshore transport computations." J. Wtrwy., Harb., and Coast., Engrg., 97(4), 687-703.
Bosman, J. J. (1982). "Concentration distributions under waves and currents." Rep. M1875, Delft Hydraulics, Delft, The Netherlands (in Dutch).
Bosman, J. J., and Steetzel, H. J. (1986). "Time and bed averaged concentrations under waves." Proc., Coastal Engrg. Conf., Taiwan, 986-1001.
142

Bosman, J. J., van der Velden, E., and Hulsbergen, C. H. (1987). "Sediment con- centration measurements by transverse suction." Coast. Engrg., 12, 353-371.
Harms, J. C. (1969). "Hydraulic significance of some sand ripples." Geol. Soc. Am. Bull., 80.
Inman, D. L., and Bowen, A. J. (1963). "Flume experiments on sand transport by waves and_currents." Proc., 8th Coastal Engrg. Conf., Lisbon, 137-150.
Jaffe, B. E., Sternberg, R. W., and Sallenger, A. H. (1984). "The role of suspended sediment in shore-normal beach profile changes." Proc., Coast. Engrg., Conf., Houston, Tex., 1983-1997.
Jonsson, I. G., Skougaard, C. H., and Wang, J. A. (1970). "Interaction between waves and currents." Proc., Coast. Engrg. Conf., 489-508.
Kemp, P. H., and Simons, R. R. (1982). "The interaction between waves and a turbulent current: Waves propagating with the current." J. Fluid Mech., 116,227- 251.
Kemp, P. H., and Simons, R. R. (1983). "The interaction between waves and a turbulent current: Waves propagating against the current." J. Fluid Mech., 130, 73-91.
Nap, E., and Van Kampen, A. (1988). Sediment concentrations and transport in case of irregular non-breaking waves with a current, part A and B. Dept. of Coast. Engrg., Tech. Univ. of Delft, Delft, The Netherlands.
Nielsen, P. (1985). "Short manual of coastal bottom boundary layers and sediment transport." Rep. TM85/1, Public Works Dept., Sydney, Australia.
Osborne, P. D., and Greenwood, B. (1992). "Frequency-dependent cross-shore suspended sediment transport, part 1 and 2." Marine Geol., 106, 1-51.
Quick, M. C. (1983). "Sediment transport by waves and currents." Can. J. Civ. Engrg., 10(7), 142-149.
Van der Kaaij, T. H., and Nieuwjaar, M. W. C. (1987). Sediment concentrations and transport in case of irregular non-breaking waves with a current, part A and B. Dept. of Coast. Engrg., Tech. Univ. of Delft, Delft, The Netherlands.
Van Rijn, L. C. (1989). "Handbook of sediment transport in current and waves." Rep. H461, Delft Hydraulics, Delft, The Netherlands.
Van Rijn, L. C. (1985). "Two-dimensional vertical mathematical model for sus- pended sediment transport by currents and waves." Rep. $488 part IV, Delft Hydraulics, Delft, The Netherlands.
Van Rijn, L. C. (1990). Principles of fluid flow and surface waves in rivers, estuaries, seas and oceans. Aqua Publications, Amsterdam, The Netherlands.
143