Embed Size (px)
Citation preview
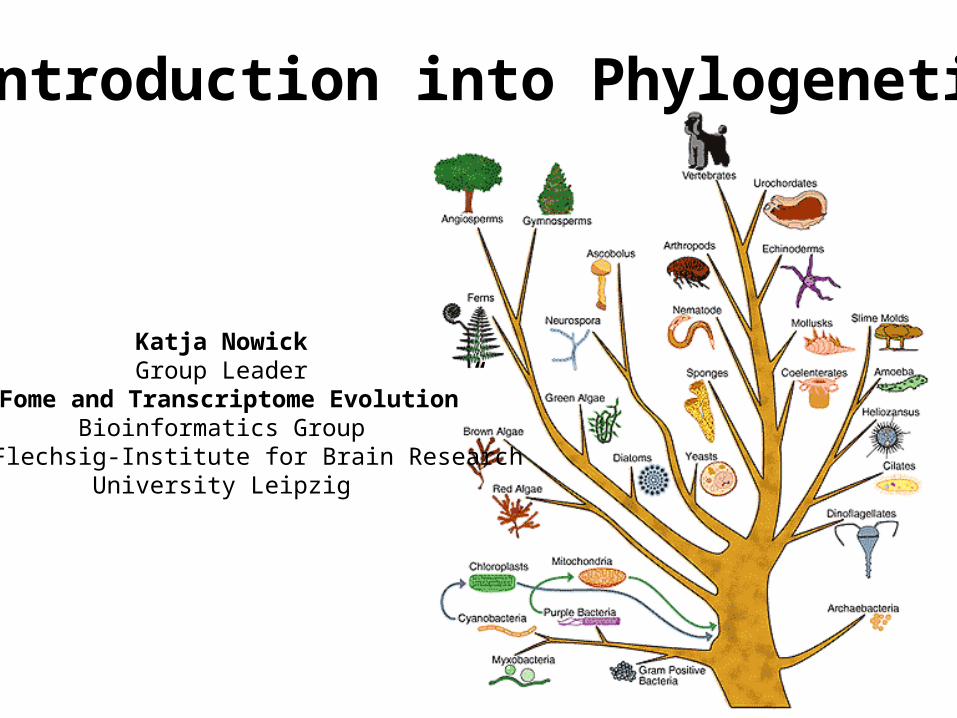
Introduction into Phylogenetics
Katja NowickGroup Leader
“TFome and Transcriptome Evolution”Bioinformatics Group
Paul-Flechsig-Institute for Brain ResearchUniversity Leipzig
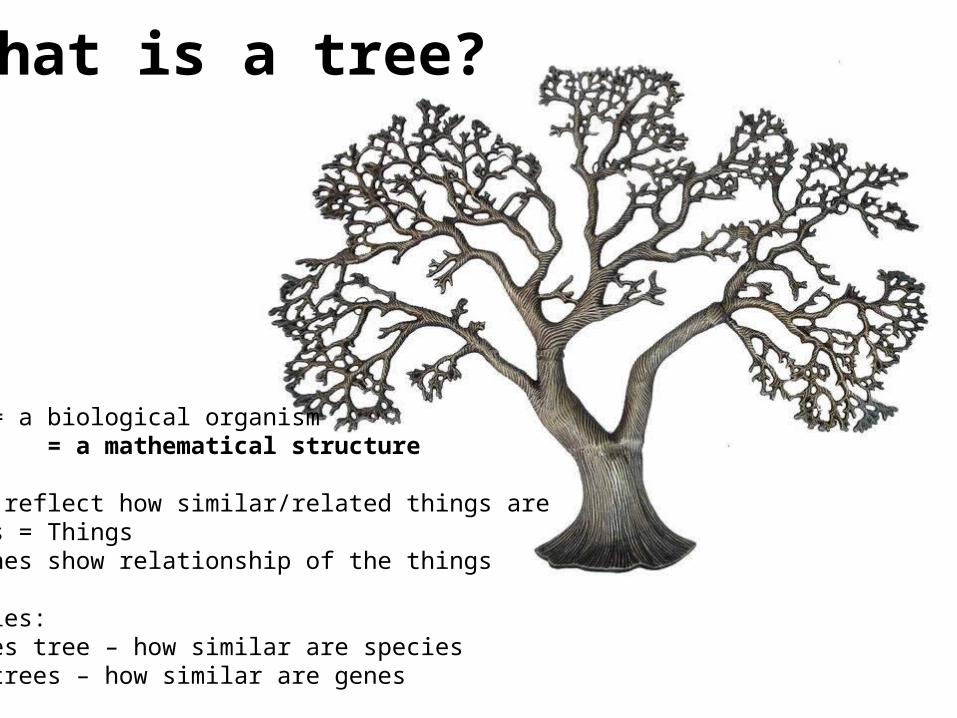
Tree = a biological organism = a mathematical structure
Trees reflect how similar/related things areLeaves = Things Branches show relationship of the things
Examples:Species tree – how similar are speciesGene trees – how similar are genes…
What is a tree?
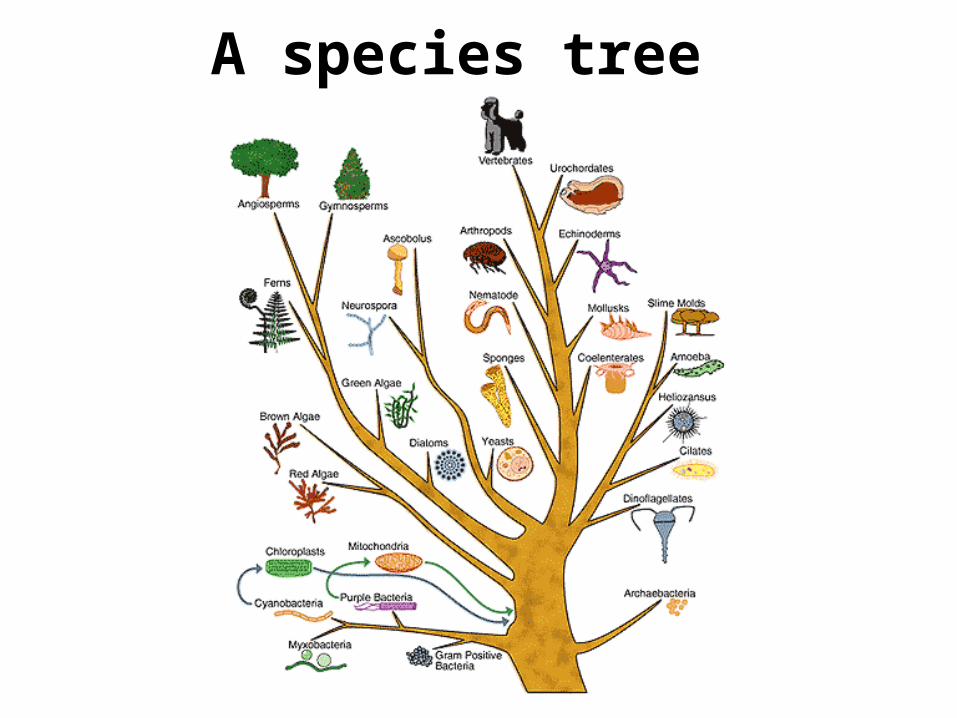
A species tree
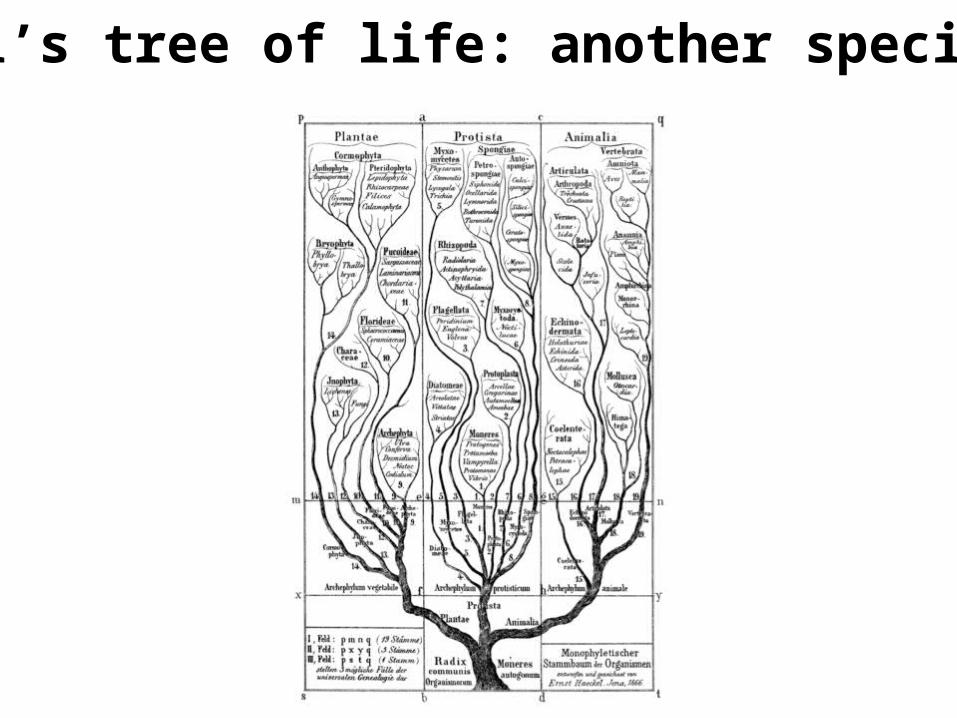
Haeckel’s tree of life: another species tree
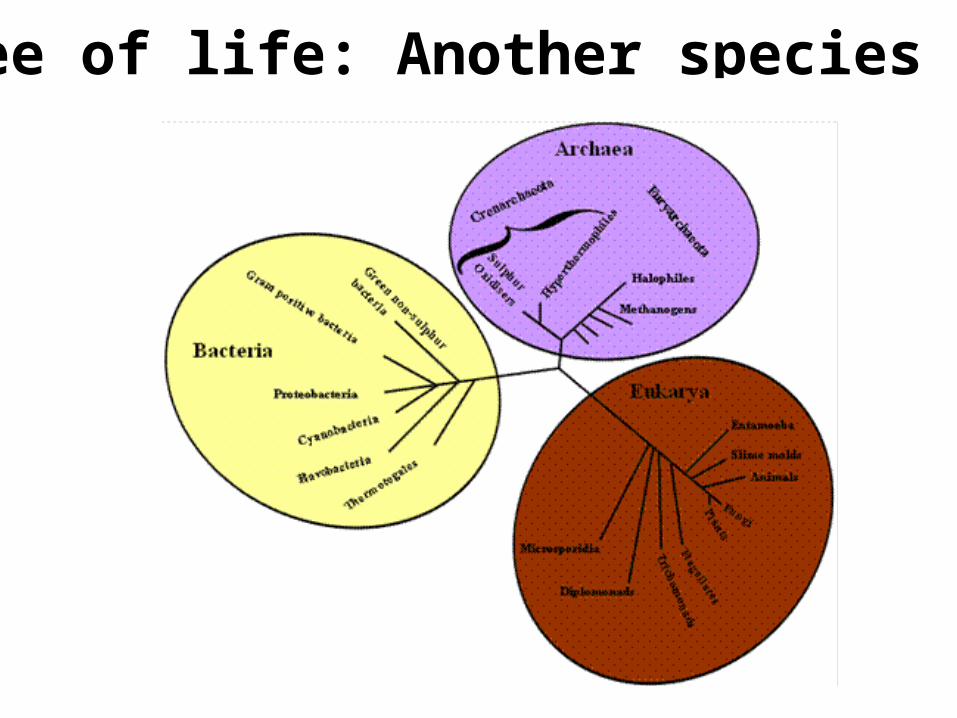
Tree of life: Another species tree
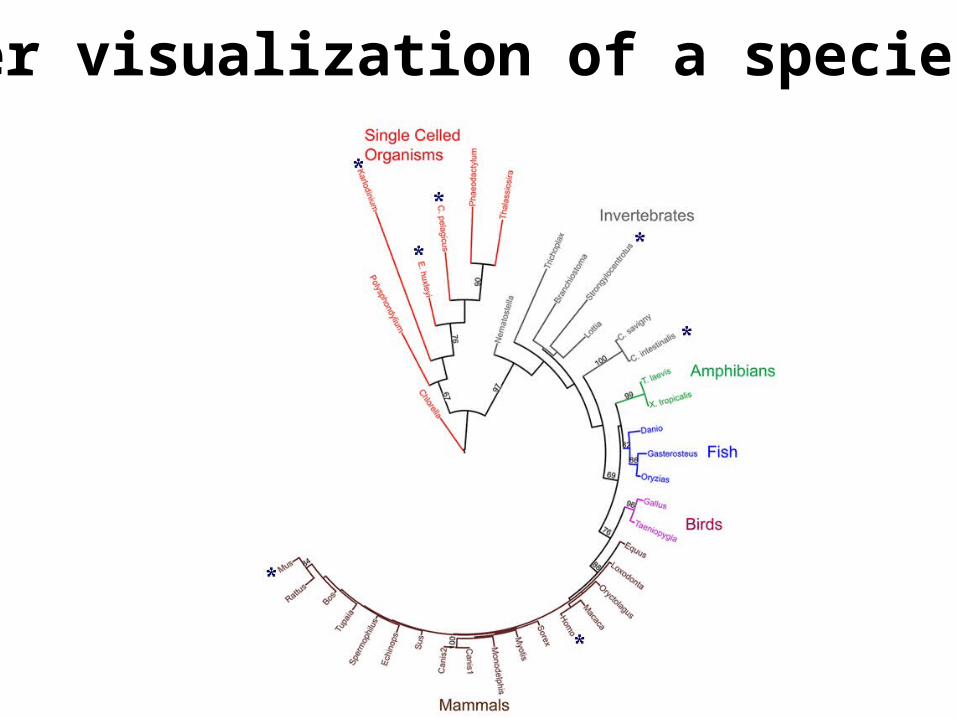
Another visualization of a species tree
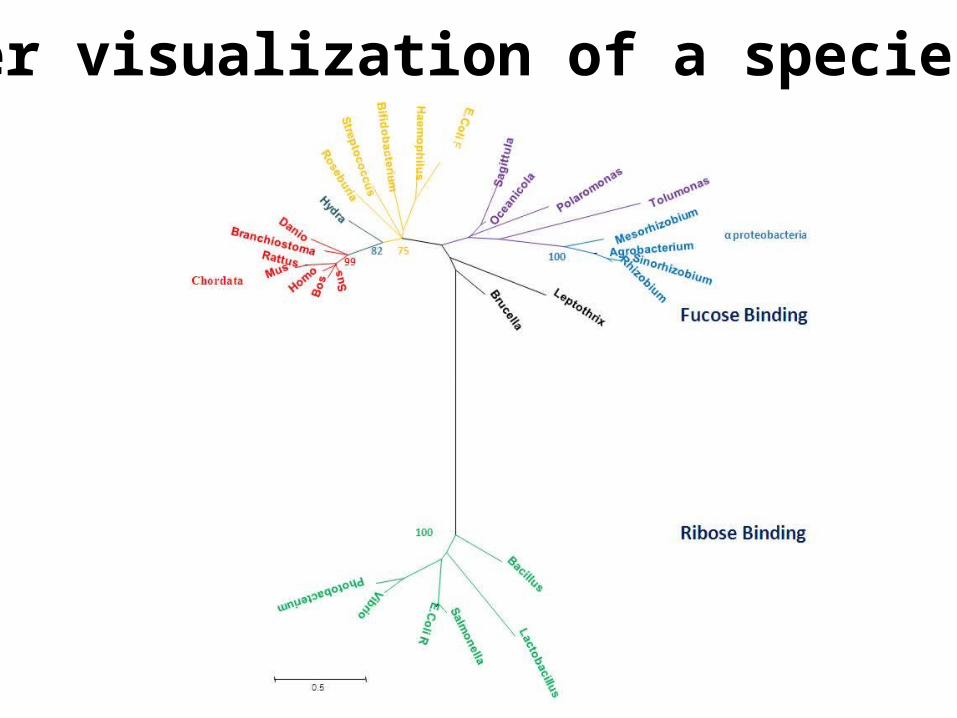
Another visualization of a species tree
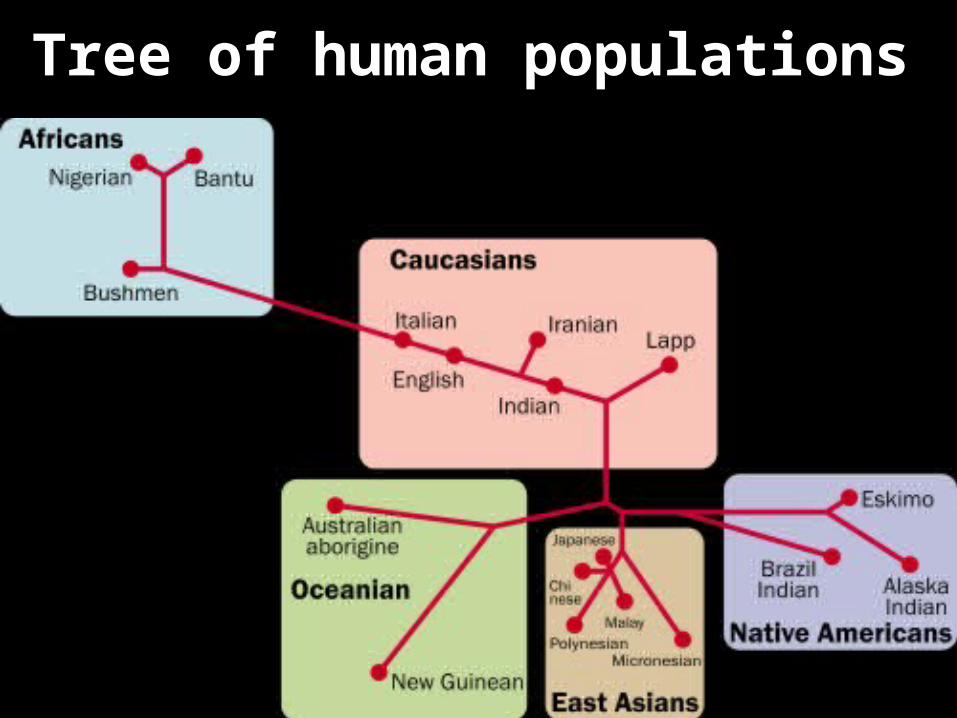
Tree of human populations
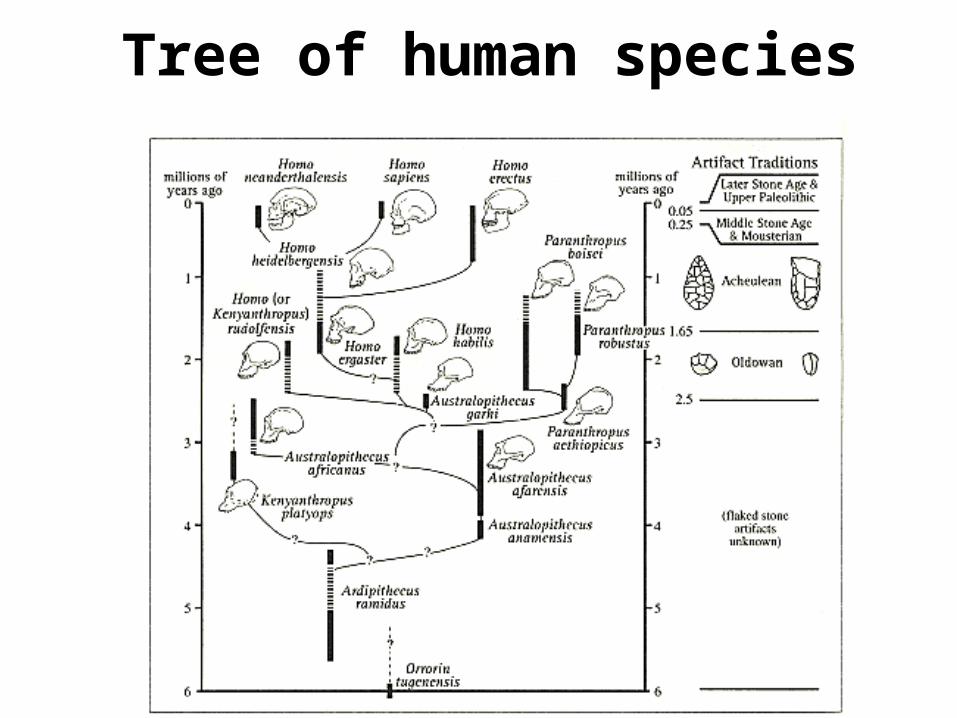
Tree of human species
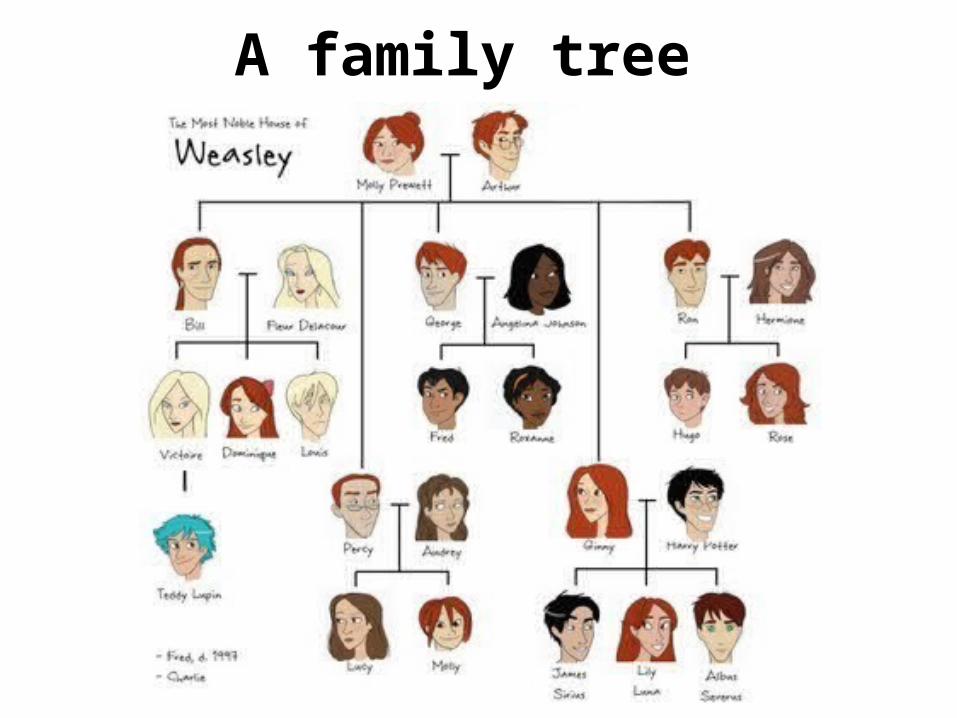
A family tree
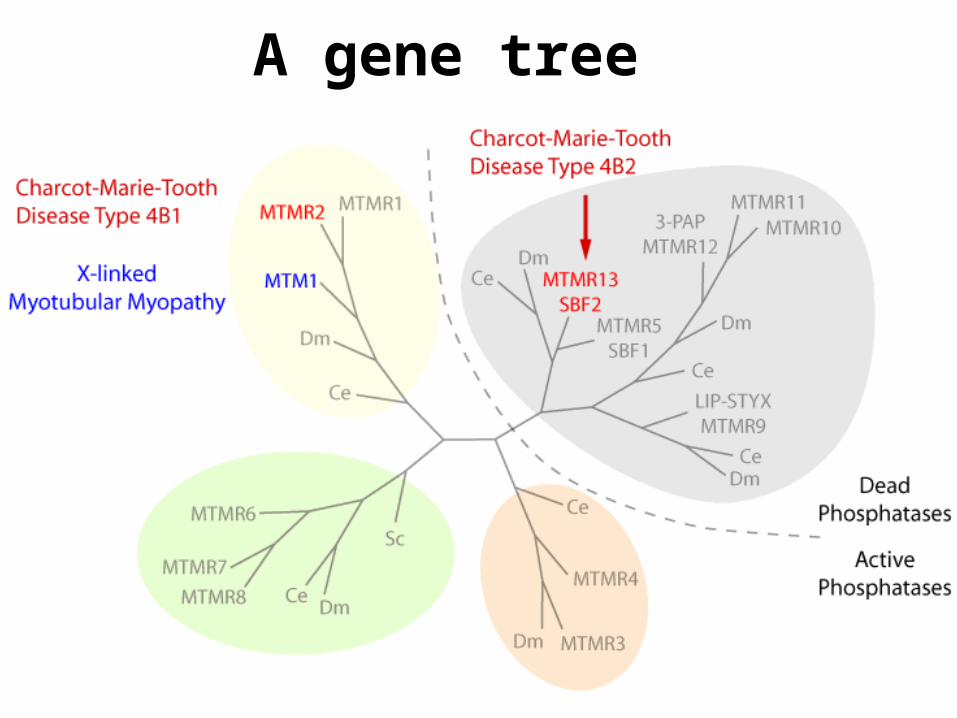
A gene tree

Another gene tree
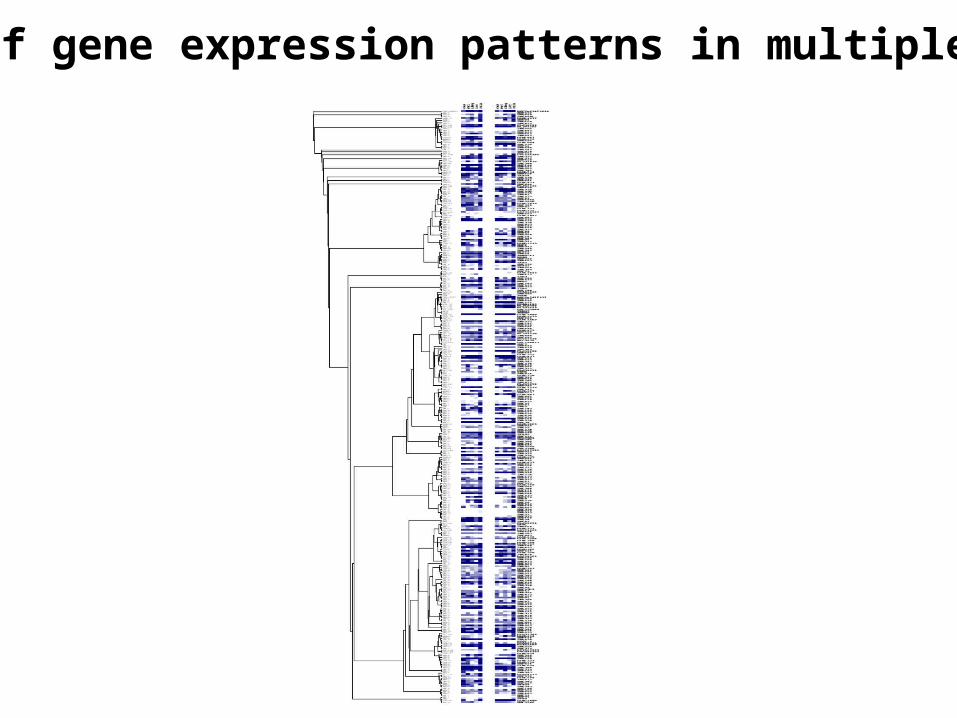
A tree of gene expression patterns in multiple tissues

A tree of Gene Ontology groups
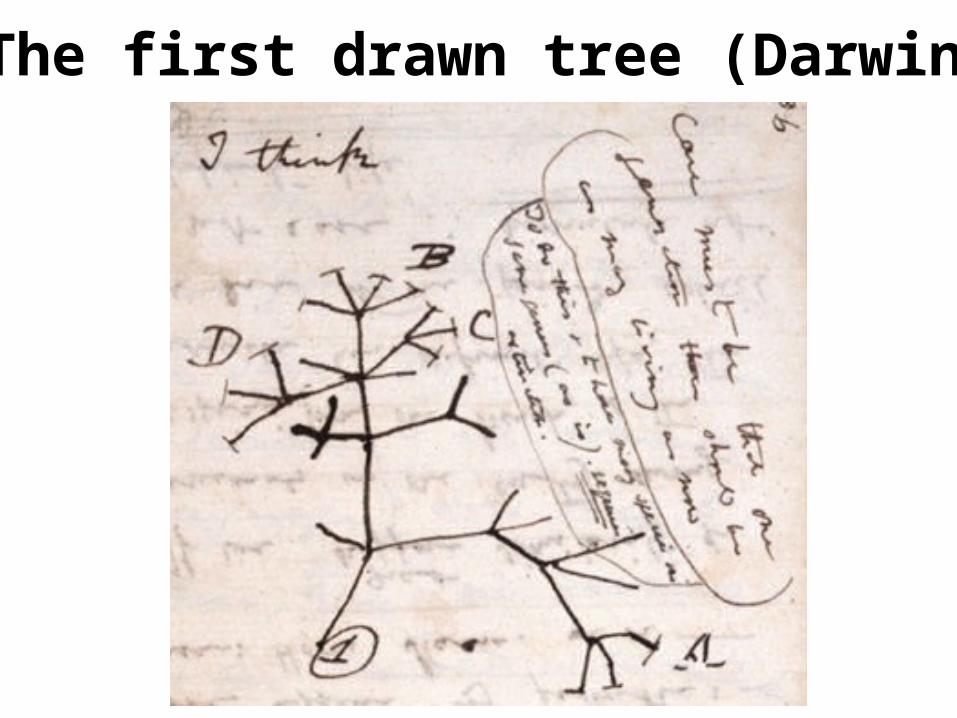
The first drawn tree (Darwin)
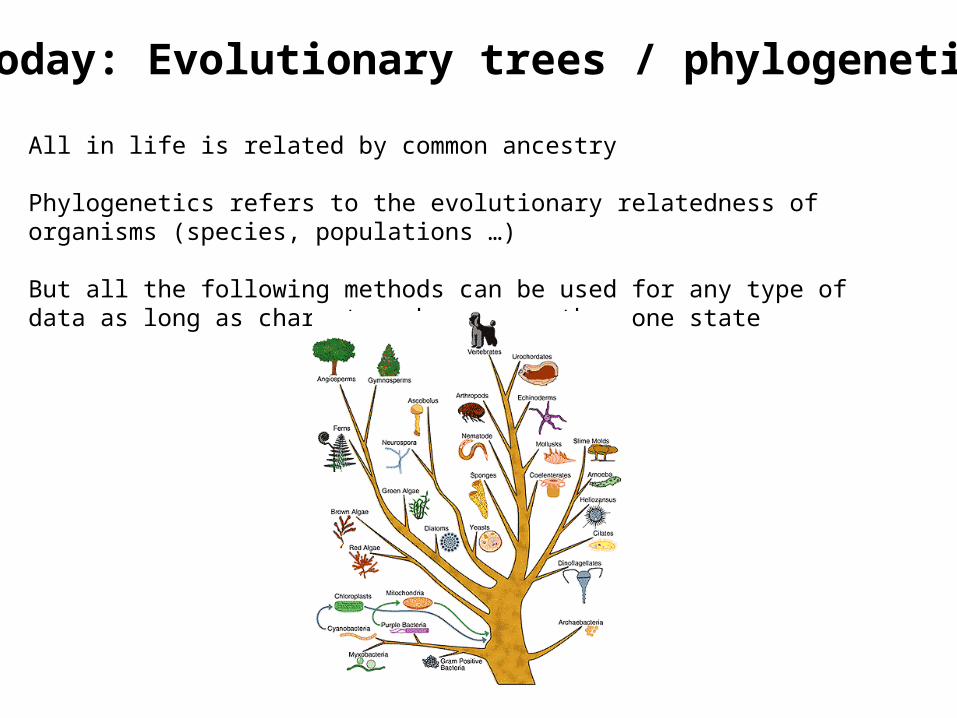
All in life is related by common ancestry
Phylogenetics refers to the evolutionary relatedness of organisms (species, populations …)
But all the following methods can be used for any type of data as long as characters have more than one state
Topic today: Evolutionary trees / phylogenetic trees
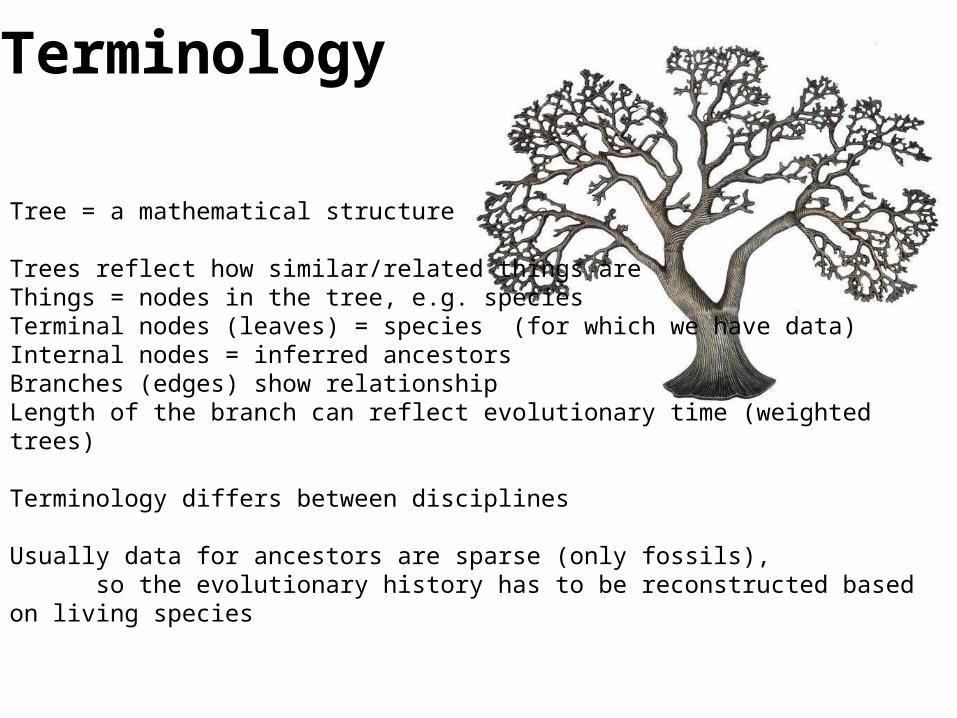
Tree = a mathematical structure
Trees reflect how similar/related things areThings = nodes in the tree, e.g. speciesTerminal nodes (leaves) = species (for which we have data)Internal nodes = inferred ancestorsBranches (edges) show relationshipLength of the branch can reflect evolutionary time (weighted trees)
Terminology differs between disciplines
Usually data for ancestors are sparse (only fossils), so the evolutionary history has to be reconstructed based on living species
Terminology
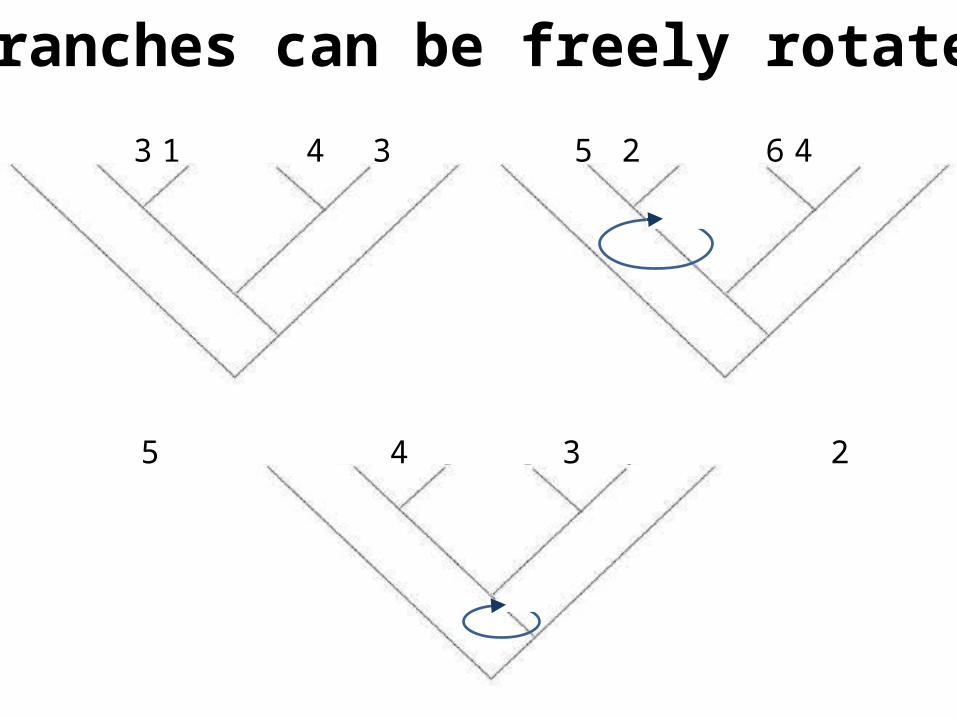
Branches can be freely rotated
1 2 3 4 5 6 1 3 2 4 5 6
1 5 4 3 2 6
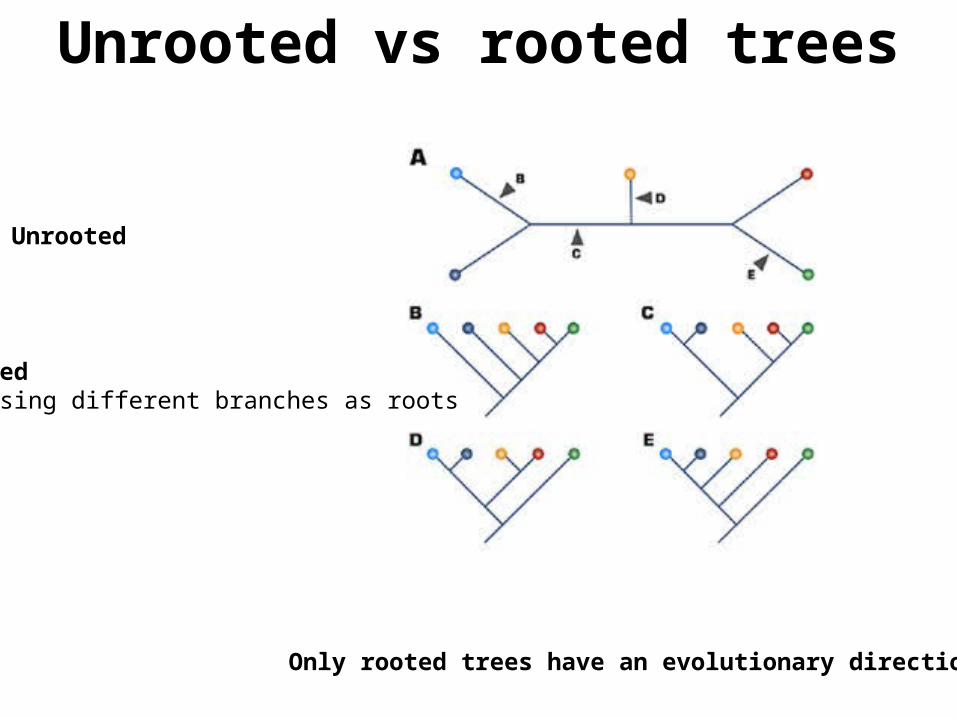
Unrooted vs rooted trees
Only rooted trees have an evolutionary direction
Unrooted
RootedChoosing different branches as roots
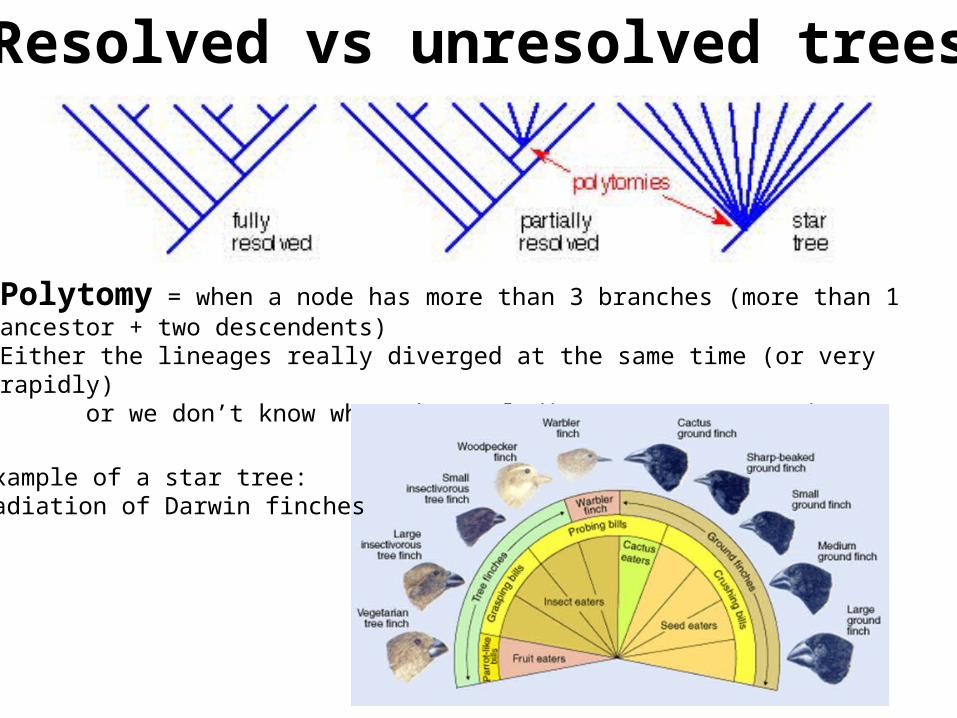
Polytomy = when a node has more than 3 branches (more than 1 ancestor + two descendents)Either the lineages really diverged at the same time (or very rapidly) or we don’t know what the real divergence pattern is
Resolved vs unresolved trees
Example of a star tree:Radiation of Darwin finches
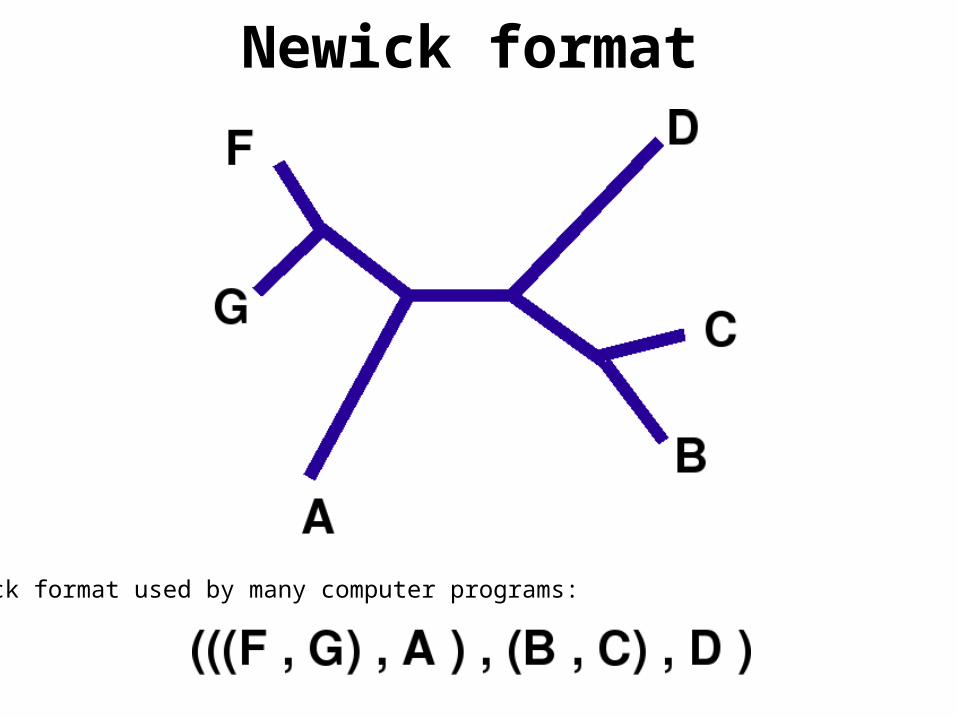
Newick format used by many computer programs:
Newick format
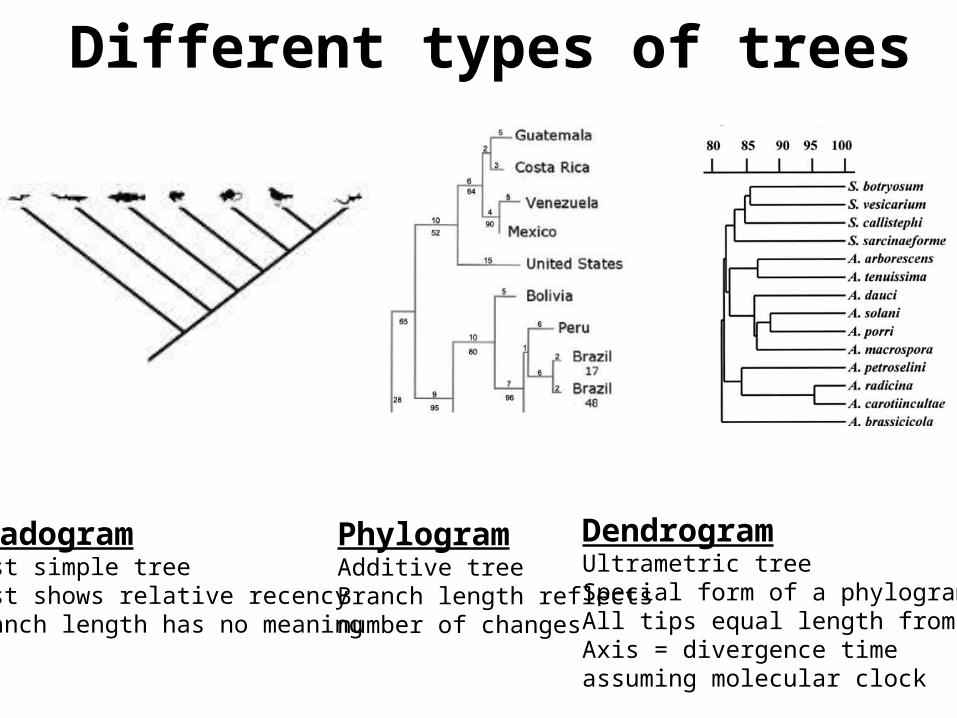
CladogramMost simple tree Just shows relative recencyBranch length has no meaning
PhylogramAdditive treeBranch length reflects number of changes
DendrogramUltrametric treeSpecial form of a phylogramAll tips equal length from rootAxis = divergence time assuming molecular clock
Different types of trees
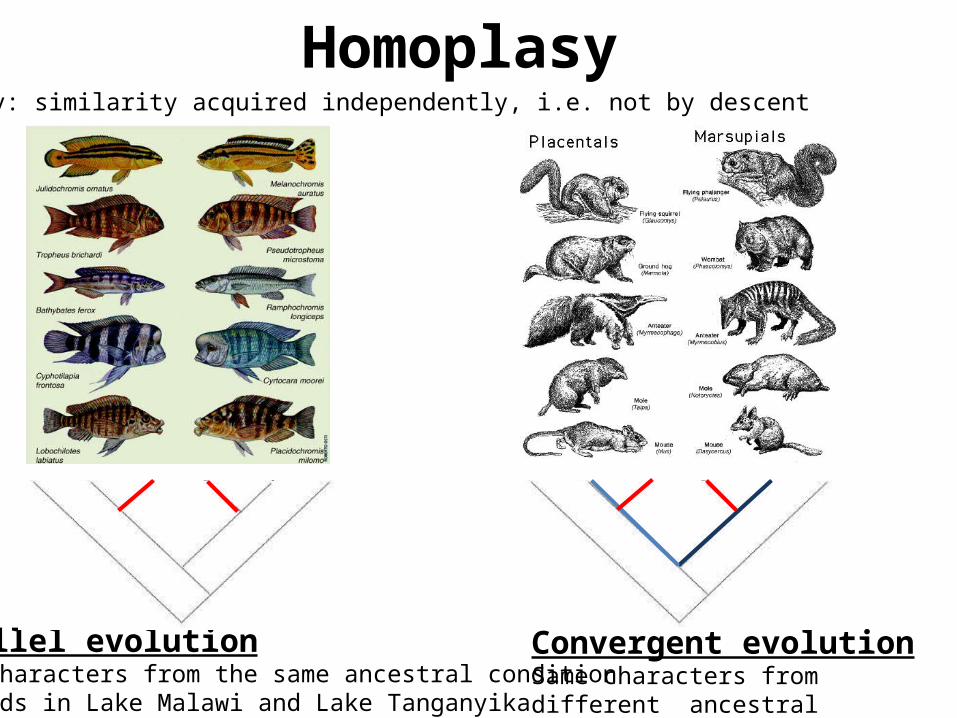
Parallel evolutionSame characters from the same ancestral conditioncichlids in Lake Malawi and Lake Tanganyika
Convergent evolutionSame characters from different ancestral condition
Homoplasy: similarity acquired independently, i.e. not by descent
Homoplasy
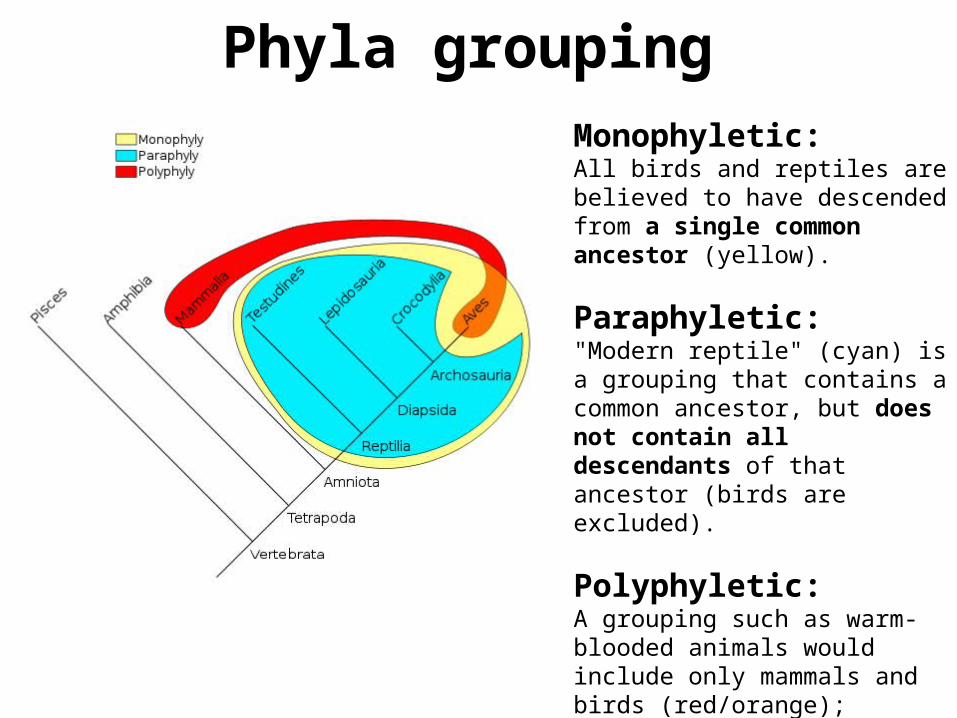
Monophyletic: All birds and reptiles are believed to have descended from a single common ancestor (yellow).
Paraphyletic:"Modern reptile" (cyan) is a grouping that contains a common ancestor, but does not contain all descendants of that ancestor (birds are excluded).
Polyphyletic: A grouping such as warm-blooded animals would include only mammals and birds (red/orange); members of this grouping do not include the most recent common ancestor
Phyla grouping
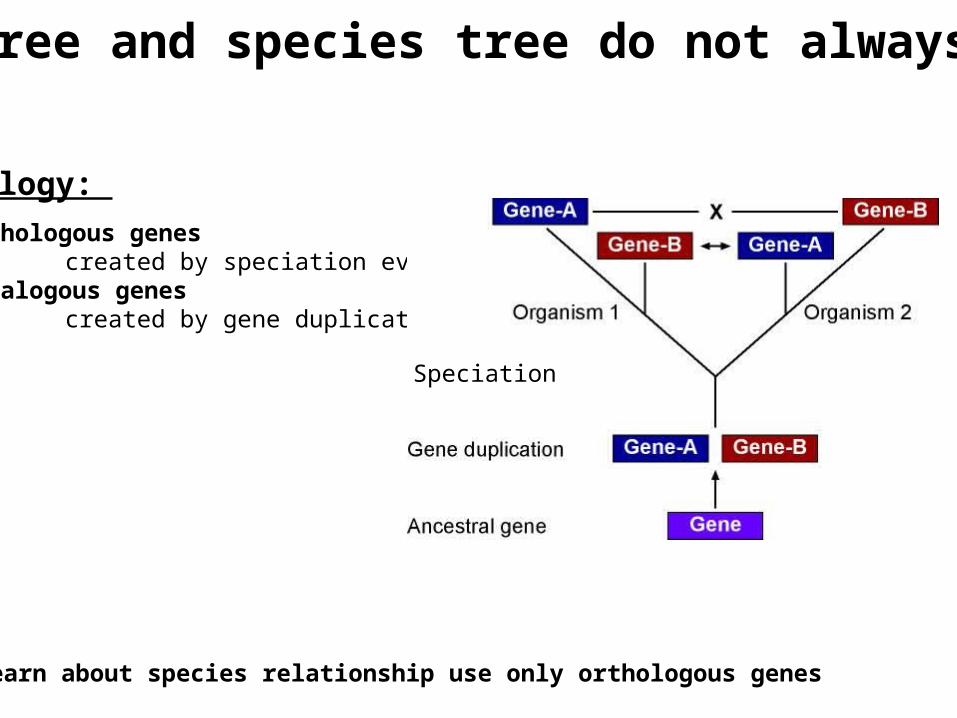
Homology: 1. Orthologous genes created by speciation event2. Paralogous genes created by gene duplication
To learn about species relationship use only orthologous genes
Gene tree and species tree do not always agree
Speciation

Traditionally, morphological characters have been used to infer phylogenies
For any phylogenetic analysis, always need to look at many characters: For example, birds and bats have wings, while crocodiles and humans do not. If these were the only data available, we would tend to group crocodiles with humans, and birds with bats
Molecular phylogenetics uses DNA, protein sequence characters
Characters for trees
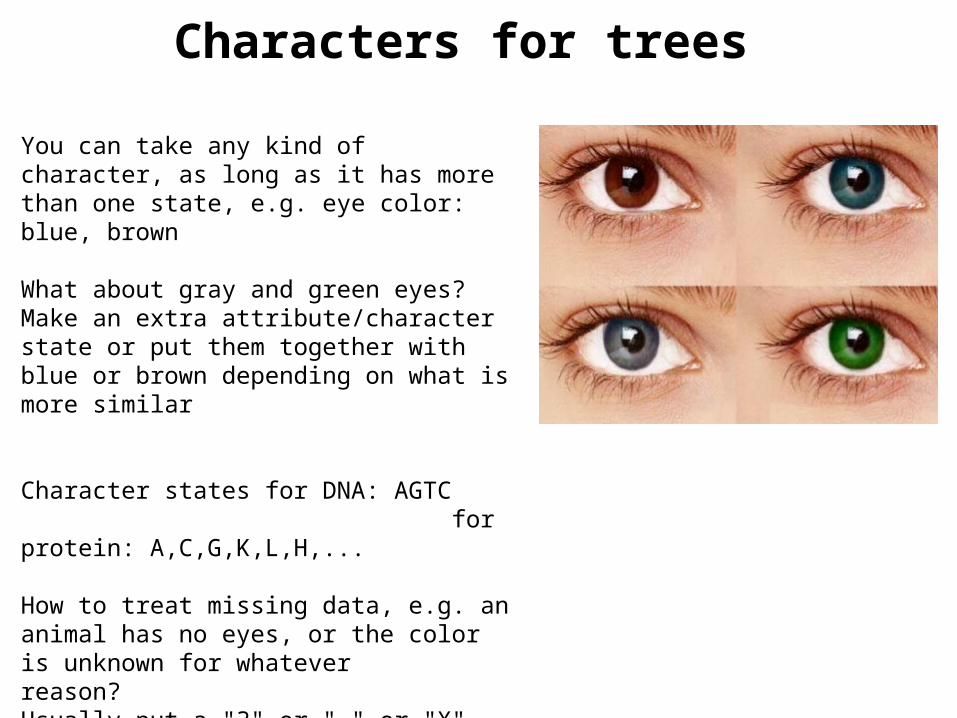
You can take any kind of character, as long as it has more than one state, e.g. eye color: blue, brown
What about gray and green eyes? Make an extra attribute/character state or put them together with blue or brown depending on what is more similar
Character states for DNA: AGTC for protein: A,C,G,K,L,H,... How to treat missing data, e.g. an animal has no eyes, or the color is unknown for whatever reason?Usually put a "?" or "-" or "X", or "N", the latter things are common for sequence data
Characters for trees
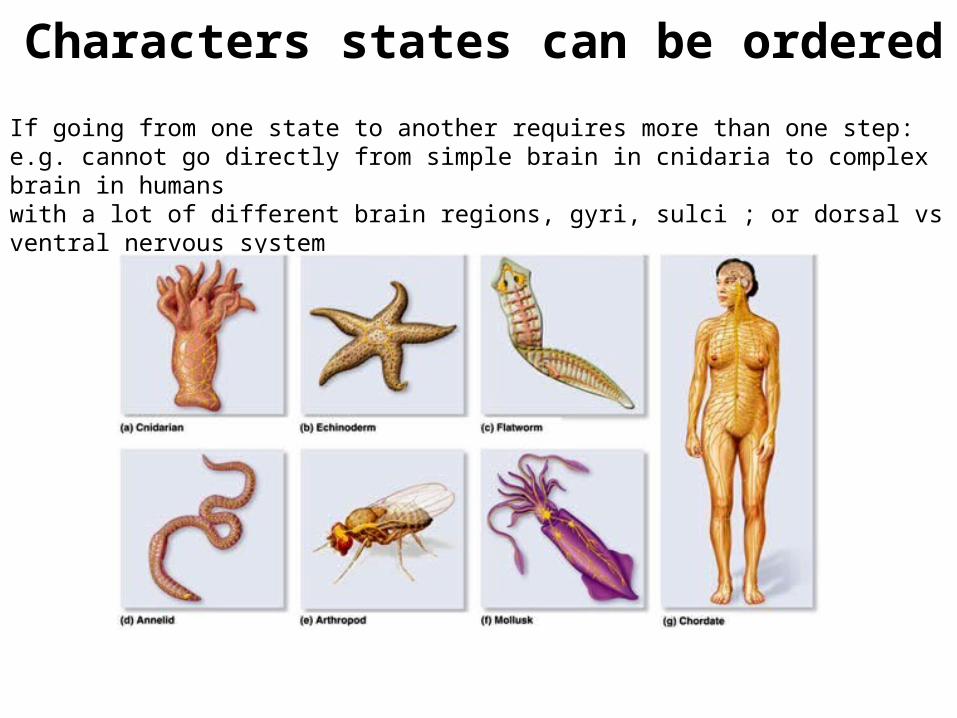
If going from one state to another requires more than one step:e.g. cannot go directly from simple brain in cnidaria to complex brain in humans with a lot of different brain regions, gyri, sulci ; or dorsal vs ventral nervous system
Characters states can be ordered
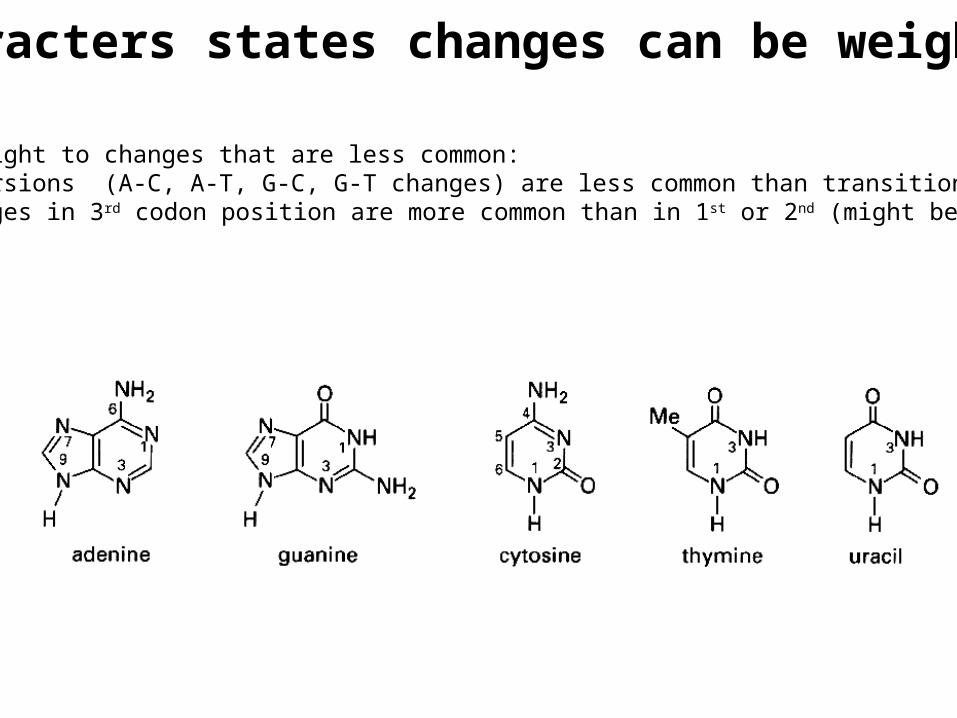
Characters states changes can be weighted
Give more weight to changes that are less common: e.g. transversions (A-C, A-T, G-C, G-T changes) are less common than transitions changes in 3rd codon position are more common than in 1st or 2nd (might be neutral)
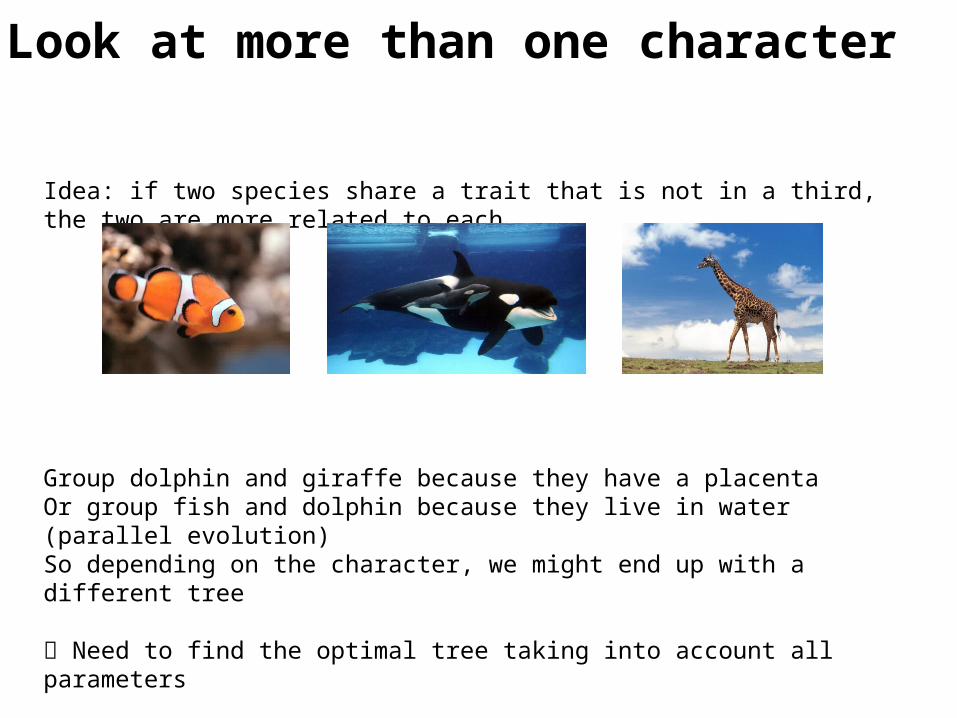
Idea: if two species share a trait that is not in a third, the two are more related to each
Group dolphin and giraffe because they have a placentaOr group fish and dolphin because they live in water (parallel evolution)So depending on the character, we might end up with a different tree
Need to find the optimal tree taking into account all parameters
Look at more than one character
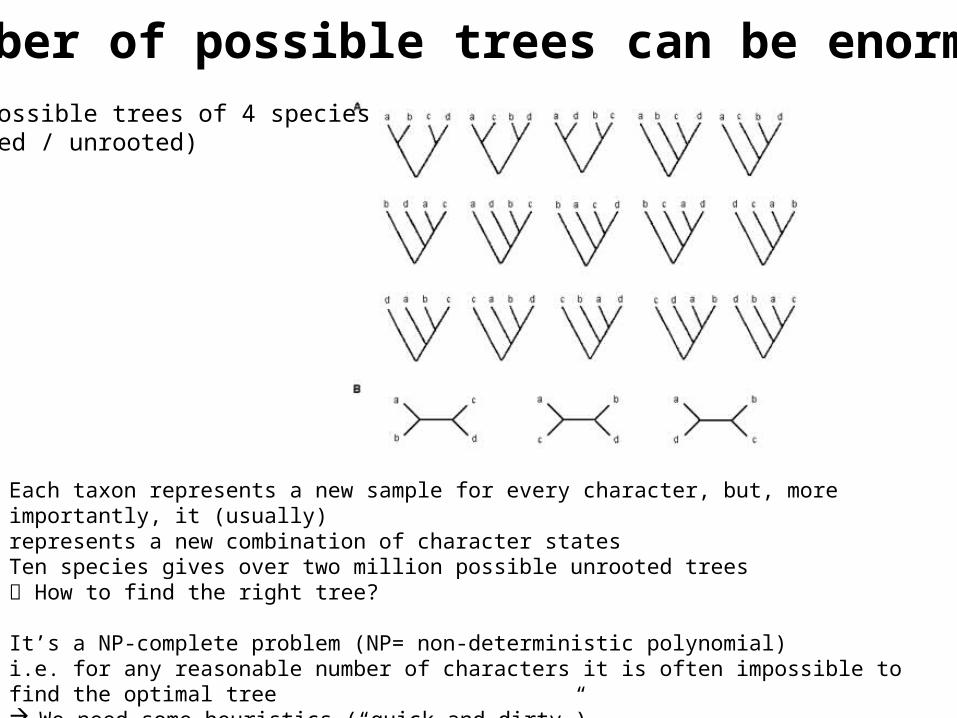
Each taxon represents a new sample for every character, but, more importantly, it (usually) represents a new combination of character statesTen species gives over two million possible unrooted trees How to find the right tree?
It’s a NP-complete problem (NP= non-deterministic polynomial)i.e. for any reasonable number of characters it is often impossible to find the optimal tree We need some heuristics (“quick and dirty”) Different methods might produce different tress
Number of possible trees can be enormousAll possible trees of 4 species (rooted / unrooted)
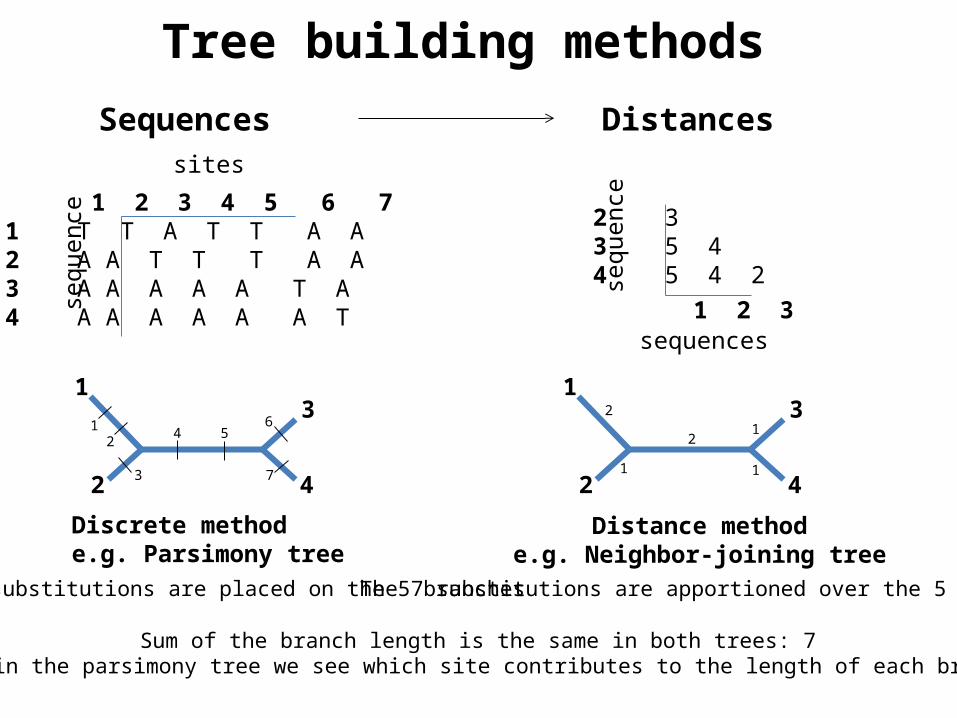
Sequences Distances
1 2 3 4 5 6 71 T T A T T A A2 A A T T T A A3 A A A A A T A4 A A A A A A T
2 33 5 44 5 4 2 1 2 3se
quen
ce
sites
sequences
sequ
ence
1
2
3
4
1
2
3
4
12
3
4 56
7 1
21
1
2
Discrete methode.g. Parsimony tree
Distance methode.g. Neighbor-joining tree
The 7 substitutions are placed on the 5 branches The 7 substitutions are apportioned over the 5 branches
Sum of the branch length is the same in both trees: 7But in the parsimony tree we see which site contributes to the length of each branch
Tree building methods

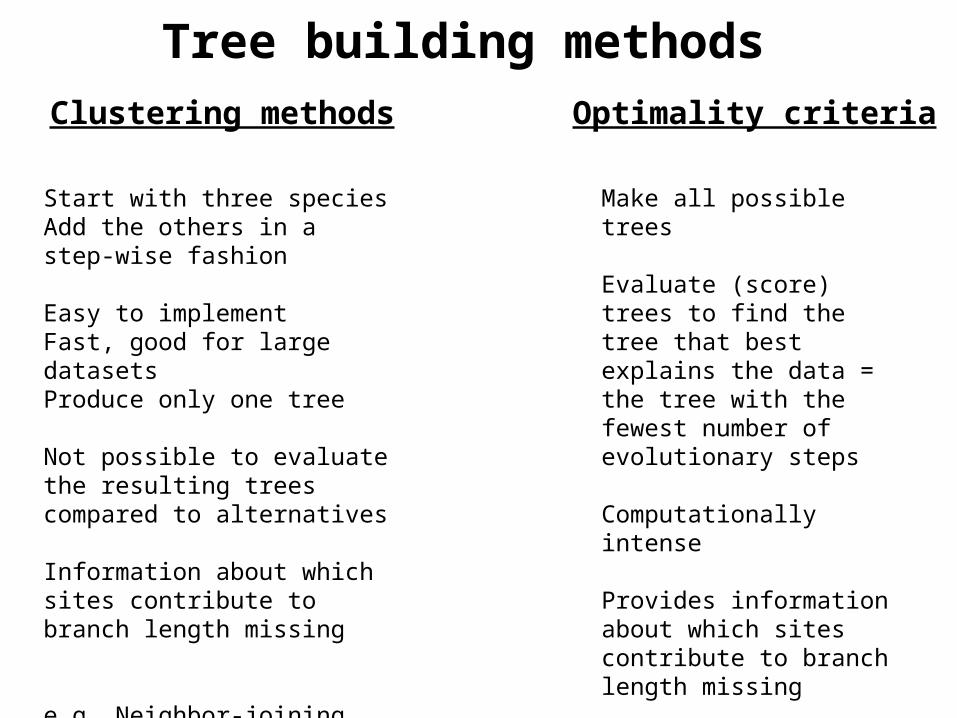
Clustering methods Optimality criteria
Start with three speciesAdd the others in a step-wise fashion
Easy to implementFast, good for large datasetsProduce only one tree
Not possible to evaluate the resulting trees compared to alternatives
Information about which sites contribute to branch length missing
e.g. Neighbor-joining tree
Make all possible trees
Evaluate (score) trees to find the tree that best explains the data = the tree with the fewest number of evolutionary steps
Computationally intense
Provides information about which sites contribute to branch length missing
e.g. Maximum Parsimony treeMaximum Likelihood
Tree building methods
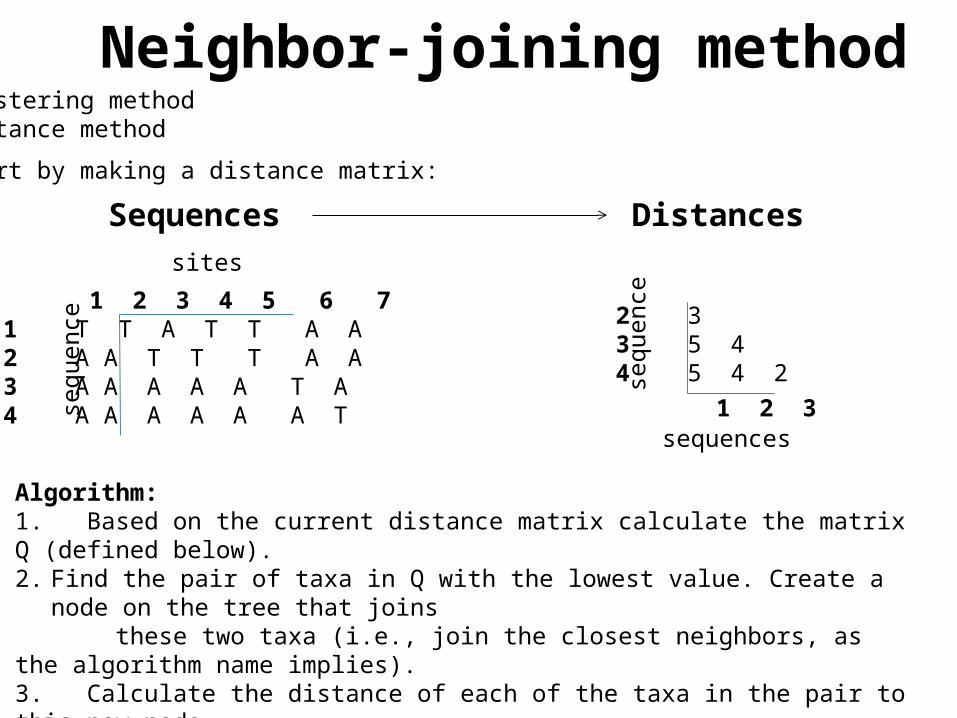
Neighbor-joining methodClustering methodDistance method
Start by making a distance matrix:
Algorithm:1. Based on the current distance matrix calculate the matrix Q (defined below).2. Find the pair of taxa in Q with the lowest value. Create a node on the tree that joins these two taxa (i.e., join the closest neighbors, as the algorithm name implies).3. Calculate the distance of each of the taxa in the pair to this new node.4. Calculate the distance of all taxa outside of this pair to the new node.5. Start the algorithm again, considering the pair of joined neighbors as a single taxon and using the distances calculated in the previous step.
Sequences Distances
1 2 3 4 5 6 71 T T A T T A A2 A A T T T A A3 A A A A A T A4 A A A A A A T
2 33 5 44 5 4 2 1 2 3se
quen
ce
sites
sequences
sequ
ence
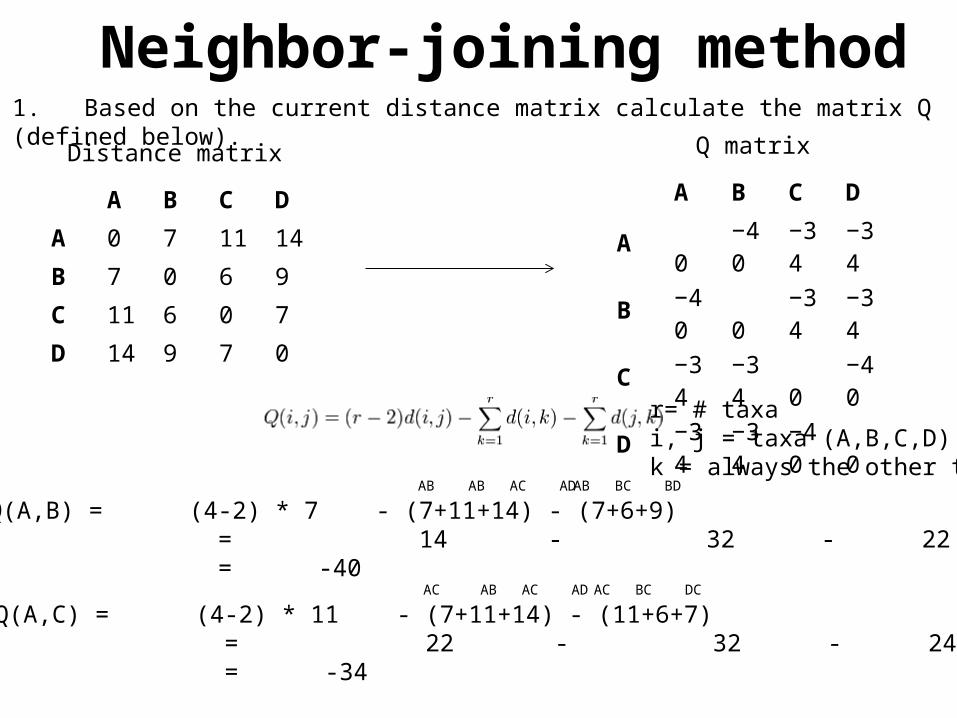
1. Based on the current distance matrix calculate the matrix Q (defined below).
A B C D
A 0 7 11 14
B 7 0 6 9
C 11 6 0 7
D 14 9 7 0
A B C D
A 0 −40 −34 −34
B −40 0 −34 −34
C −34 −34 0 −40
D −34 −34 −40 0
Distance matrix Q matrix
r= # taxai, j = taxa (A,B,C,D)k = always the other taxa
AB: Q(A,B) = (4-2) * 7 - (7+11+14) - (7+6+9) = 14 - 32 - 22 = -40
AB AC AD AB BC BD AB
AC: Q(A,C) = (4-2) * 11 - (7+11+14) - (11+6+7) = 22 - 32 - 24 = -34…
AB AC AD AC BC DC AC
Neighbor-joining method
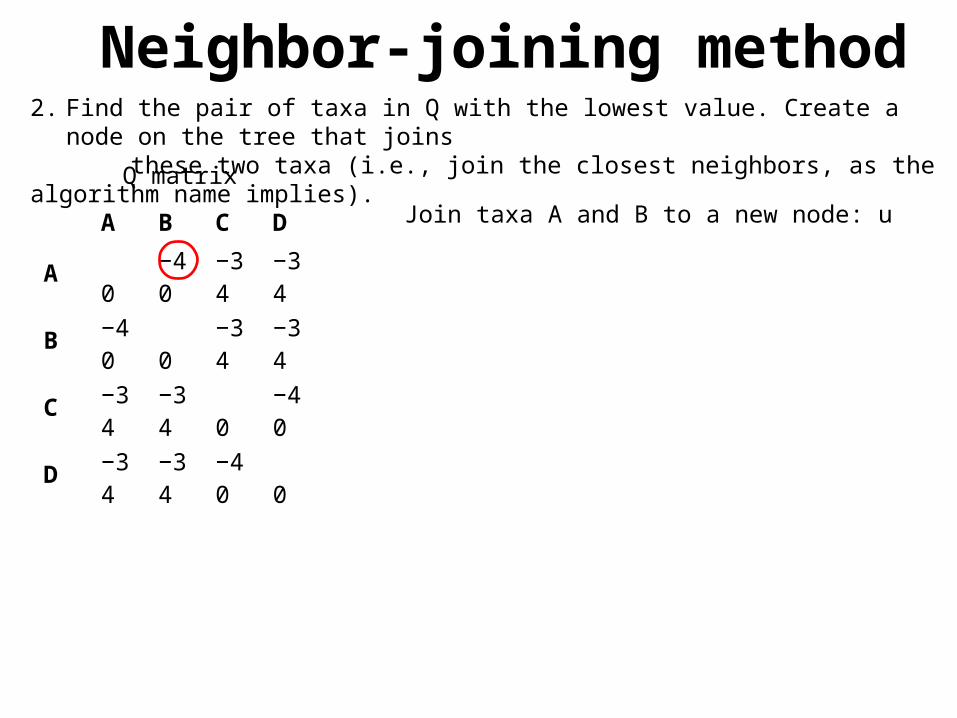
2. Find the pair of taxa in Q with the lowest value. Create a node on the tree that joins these two taxa (i.e., join the closest neighbors, as the algorithm name implies).
A B C D
A 0 −40 −34 −34
B −40 0 −34 −34
C −34 −34 0 −40
D −34 −34 −40 0
Q matrix
Join taxa A and B to a new node: u
Neighbor-joining method
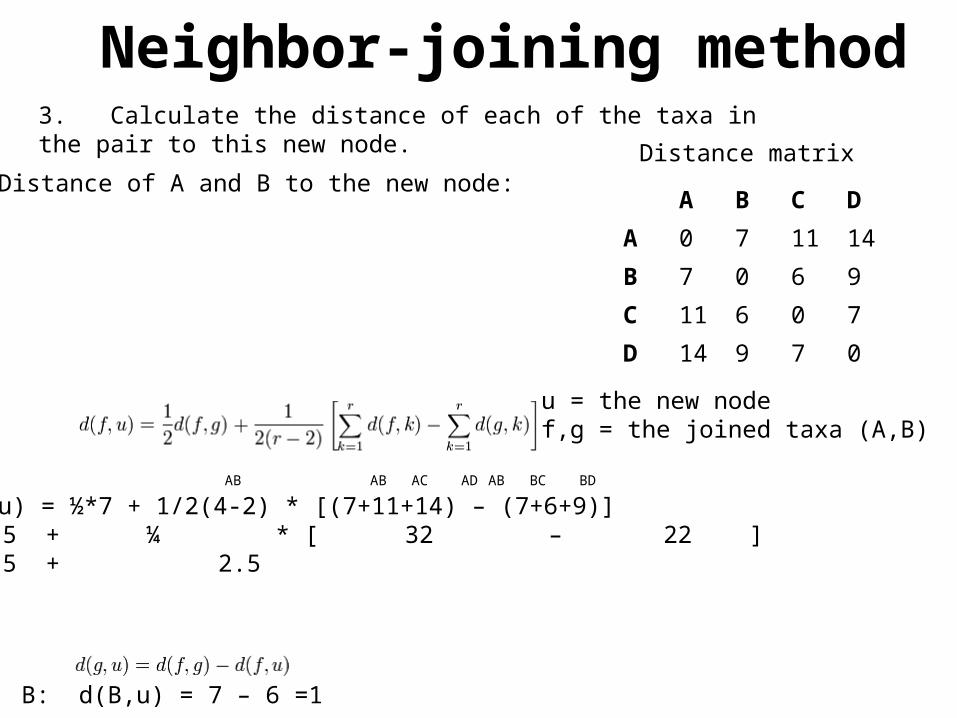
Distance of A and B to the new node:
u = the new nodef,g = the joined taxa (A,B)
A: d(A,u) = ½*7 + 1/2(4-2) * [(7+11+14) – (7+6+9)]= 3.5 + ¼ * [ 32 – 22 ] = 3.5 + 2.5= 6
AB AC AD AB BC BD AB
B: d(B,u) = 7 – 6 =1
3. Calculate the distance of each of the taxa in the pair to this new node.
Neighbor-joining method
A B C D
A 0 7 11 14
B 7 0 6 9
C 11 6 0 7
D 14 9 7 0
Distance matrix
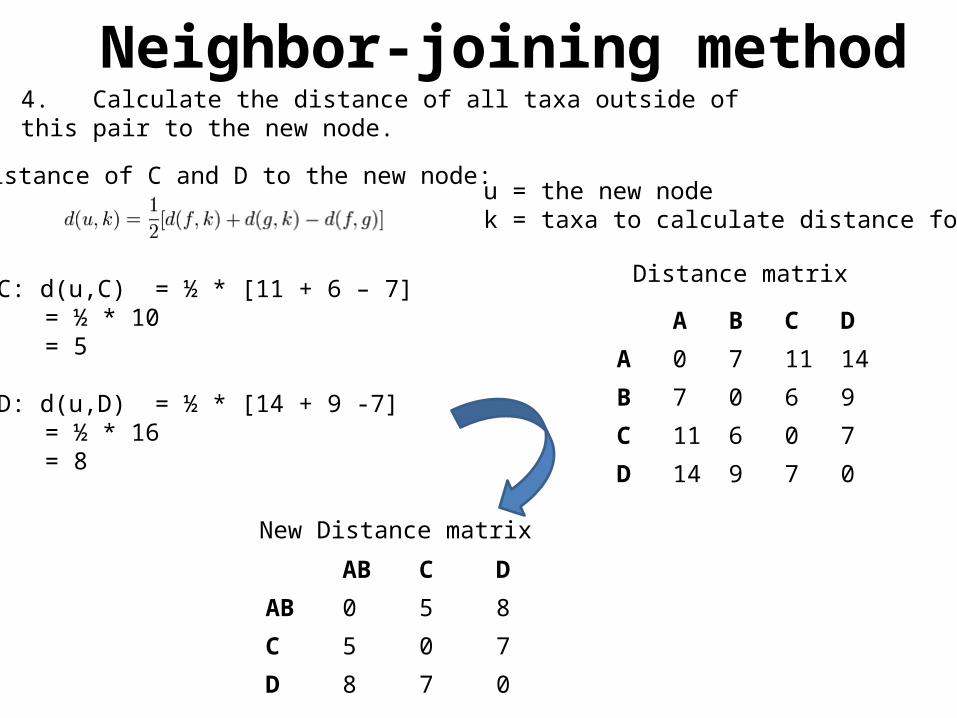
Distance of C and D to the new node:u = the new nodek = taxa to calculate distance for (C,D)
A B C D
A 0 7 11 14
B 7 0 6 9
C 11 6 0 7
D 14 9 7 0
Distance matrixC: d(u,C) = ½ * [11 + 6 – 7]
= ½ * 10= 5
D: d(u,D) = ½ * [14 + 9 -7]= ½ * 16= 8
AB C D
AB 0 5 8
C 5 0 7
D 8 7 0
New Distance matrix
4. Calculate the distance of all taxa outside of this pair to the new node.
Neighbor-joining method
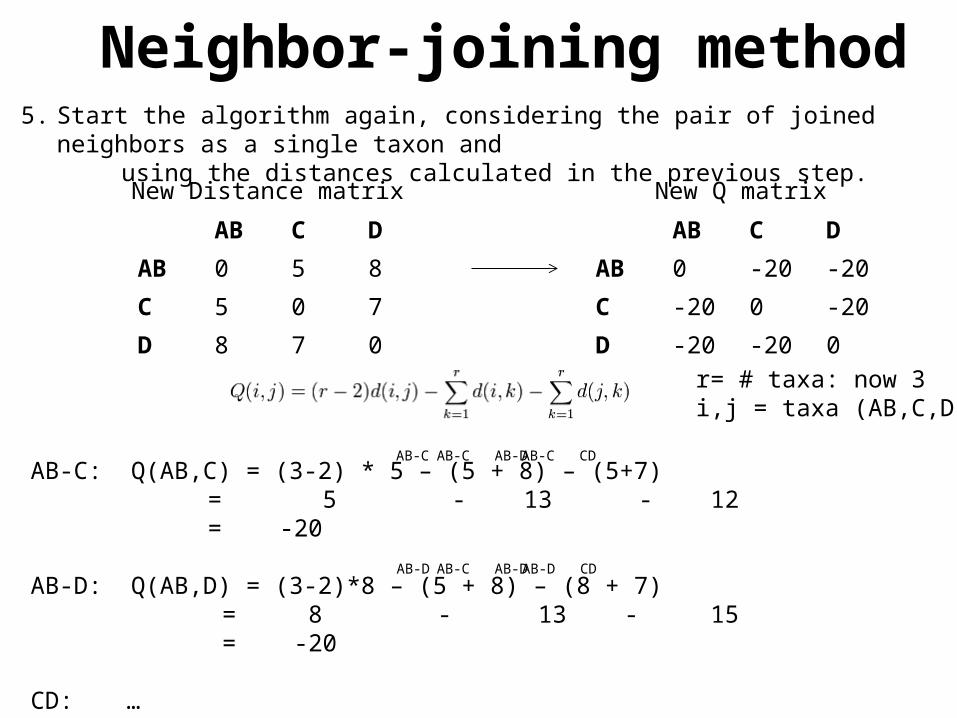
5. Start the algorithm again, considering the pair of joined neighbors as a single taxon and using the distances calculated in the previous step.
AB C D
AB 0 5 8
C 5 0 7
D 8 7 0
New Distance matrix New Q matrix
AB-C: Q(AB,C) = (3-2) * 5 – (5 + 8) – (5+7) = 5 - 13 - 12 = -20
AB-D: Q(AB,D) = (3-2)*8 – (5 + 8) – (8 + 7) = 8 - 13 - 15 = -20
CD: …
r= # taxa: now 3i,j = taxa (AB,C,D)
AB-C AB-D AB-C CD AB-C
AB-C AB-D AB-D CD AB-D
AB C D
AB 0 -20 -20
C -20 0 -20
D -20 -20 0
Neighbor-joining method
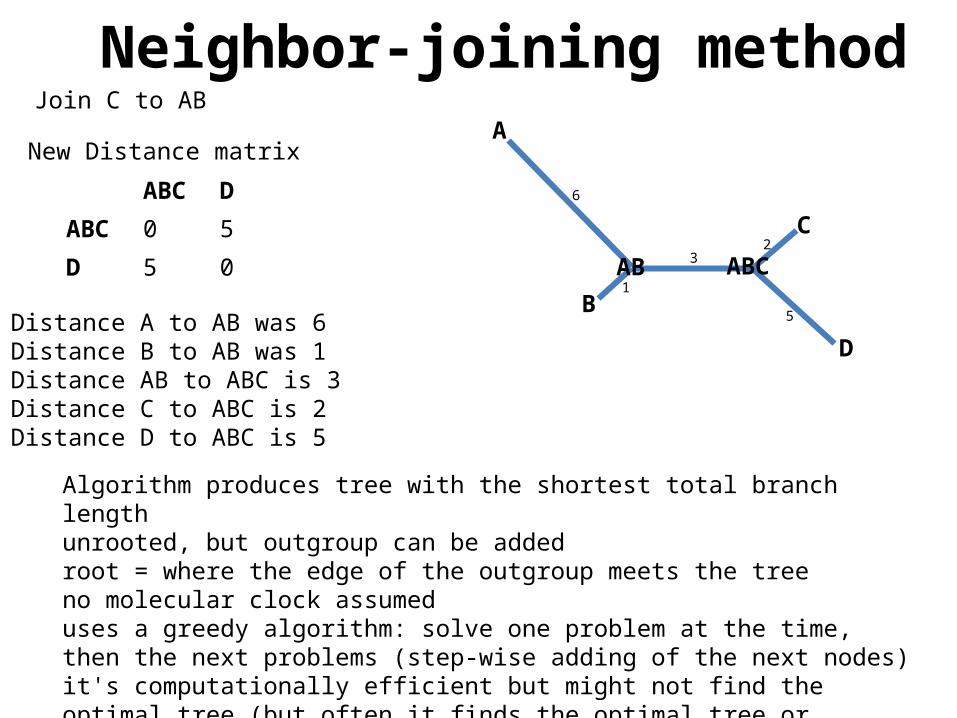
Algorithm produces tree with the shortest total branch lengthunrooted, but outgroup can be added root = where the edge of the outgroup meets the treeno molecular clock assumeduses a greedy algorithm: solve one problem at the time, then the next problems (step-wise adding of the next nodes)it's computationally efficient but might not find the optimal tree (but often it finds the optimal tree or something close)
ABC D
ABC 0 5
D 5 0
New Distance matrix
Distance A to AB was 6Distance B to AB was 1Distance AB to ABC is 3Distance C to ABC is 2Distance D to ABC is 5
A
B
C
D
1
6
2
5
3AB ABC
Neighbor-joining methodJoin C to AB
Clustering methods Optimality criteria
Start with three speciesAdd the others in a step-wise fashion
Easy to implementFast, good for large datasetsProduce only one tree
Not possible to evaluate the resulting trees compared to alternatives
Information about which sites contribute to branch length missing
e.g. Neighbor-joining tree
Make all possible trees
Evaluate (score) trees to find the tree that best explains the data = the tree with the fewest number of evolutionary steps
Computationally intense
Provides information about which sites contribute to branch length missing
e.g. Maximum Parsimony treeMaximum Likelihood
Tree building methods
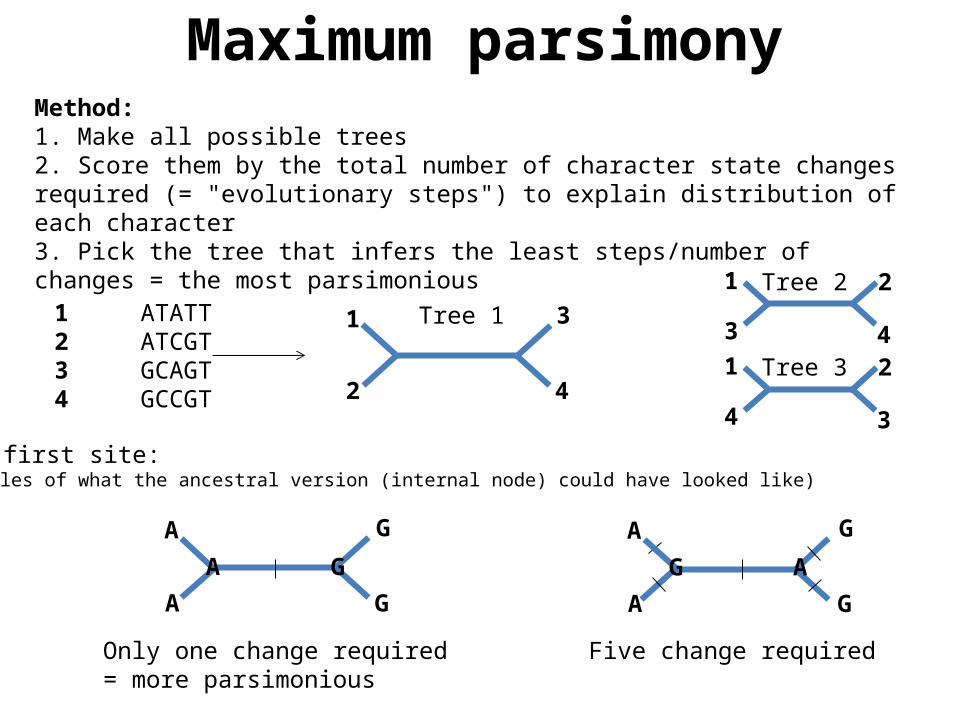
Maximum parsimonyMethod: 1. Make all possible trees2. Score them by the total number of character state changes required (= "evolutionary steps") to explain distribution of each character3. Pick the tree that infers the least steps/number of changes = the most parsimonious
A
A
G
G
For the first site:(two examples of what the ancestral version (internal node) could have looked like)
A G
Only one change required= more parsimonious
A
A
G
GG A
Five change required
1
2
3
4
Tree 11 ATATT2 ATCGT3 GCAGT4 GCCGT
1
3
2
4
Tree 2
1
4
2
3
Tree 3
A
A
G
G
1
2
3
4
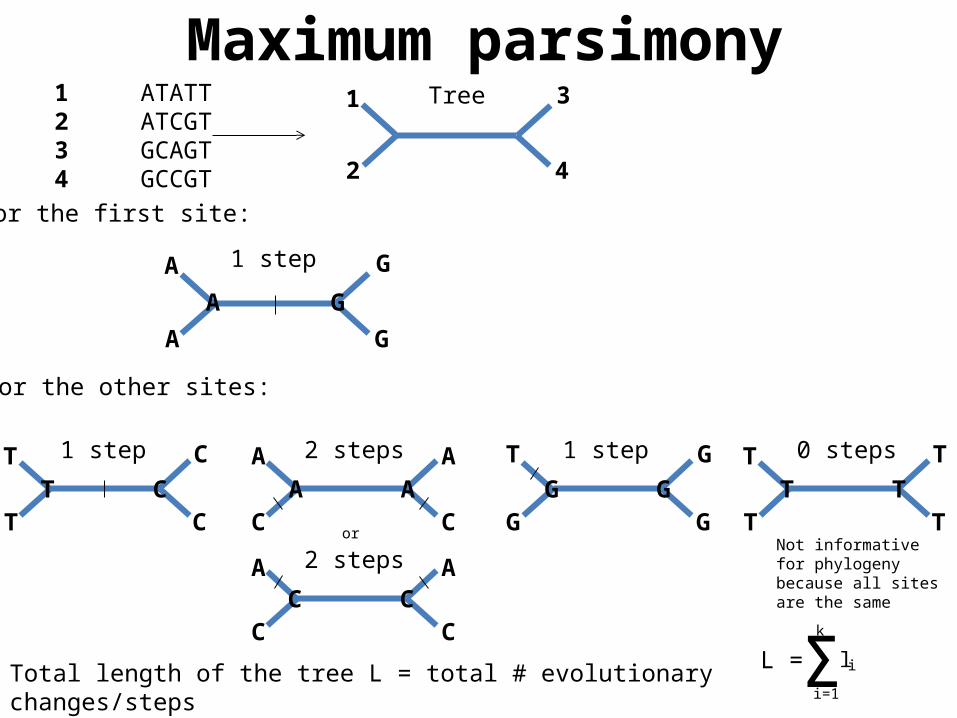
Tree1 ATATT2 ATCGT3 GCAGT4 GCCGT
For the first site:
A G
1 step
For the other sites:
T
T
C
CT C
1 step A
C
T
GA A
2 steps A
C
G
GG G
1 step T
T
T
TT T
0 steps
A
CC C
2 steps A
C
orNot informative for phylogeny because all sites are the same
Total length of the tree L = total # evolutionary changes/steps = sum of length l of each site k; here: 1 + 1 + 2 + 1 + 0 = 5
ΣL =k
i=1
l i
Maximum parsimony
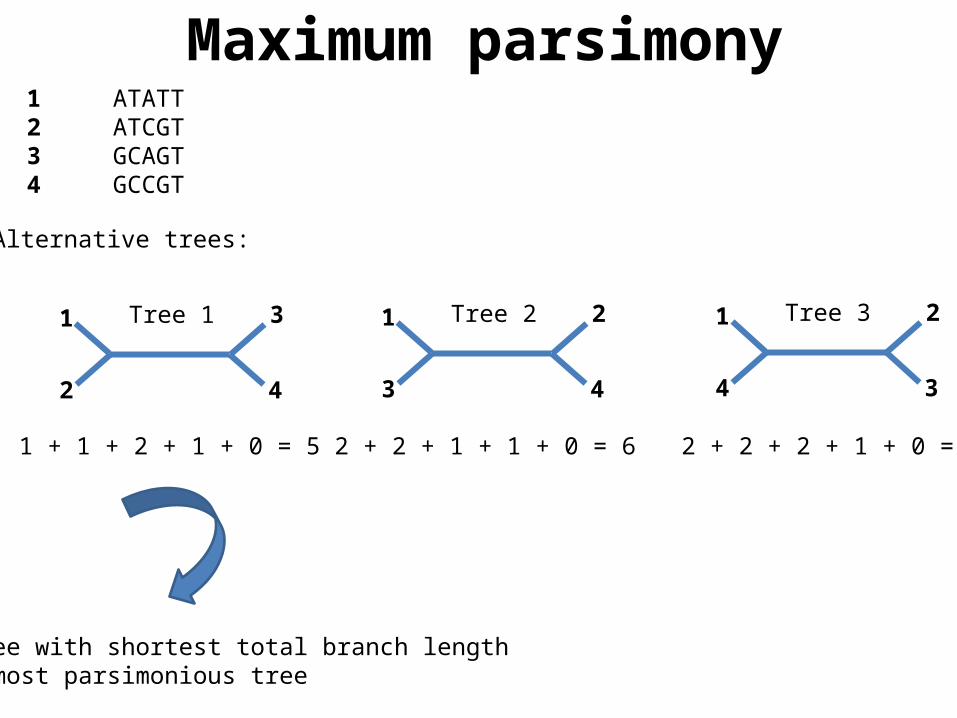
Alternative trees:
1
2
3
4
Tree 1 1
3
2
4
Tree 2 1
4
2
3
Tree 3
1 + 1 + 2 + 1 + 0 = 5 2 + 2 + 1 + 1 + 0 = 6 2 + 2 + 2 + 1 + 0 = 7
1 ATATT2 ATCGT3 GCAGT4 GCCGT
Tree with shortest total branch length= most parsimonious tree
Maximum parsimony
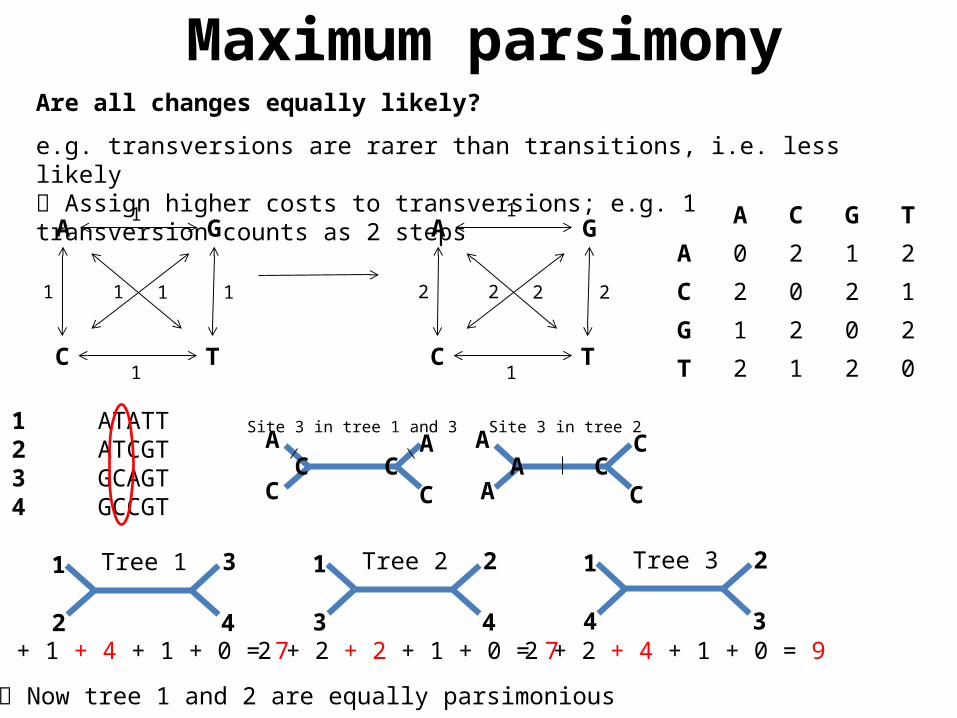
Are all changes equally likely?
e.g. transversions are rarer than transitions, i.e. less likely Assign higher costs to transversions; e.g. 1 transversion counts as 2 steps
A G
C T
1
11
1
1 1
A G
C T
1
22
1
2 2
1
2
3
4
Tree 1 1
3
2
4
Tree 2 1
4
2
3
Tree 3
1 + 1 + 4 + 1 + 0 = 7 2 + 2 + 2 + 1 + 0 = 7 2 + 2 + 4 + 1 + 0 = 9
1 ATATT2 ATCGT3 GCAGT4 GCCGT
A
CC C
Site 3 in tree 1 and 3A
C
A
AA C
Site 3 in tree 2C
C
Now tree 1 and 2 are equally parsimonious
A C G T
A 0 2 1 2
C 2 0 2 1
G 1 2 0 2
T 2 1 2 0
Maximum parsimony
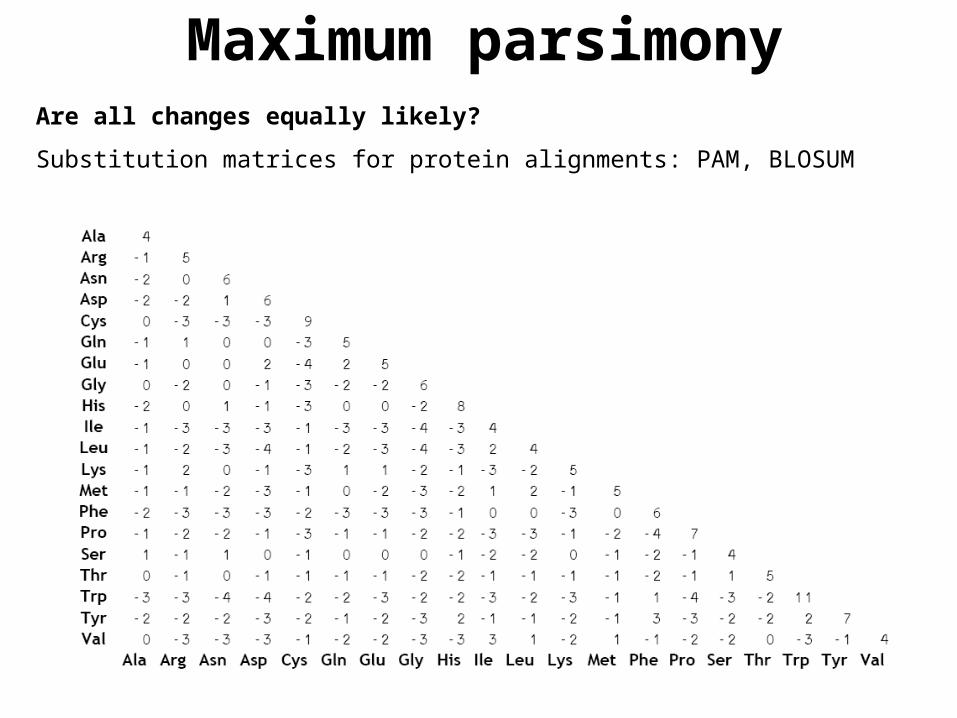
Are all changes equally likely?
Substitution matrices for protein alignments: PAM, BLOSUM
Maximum parsimony
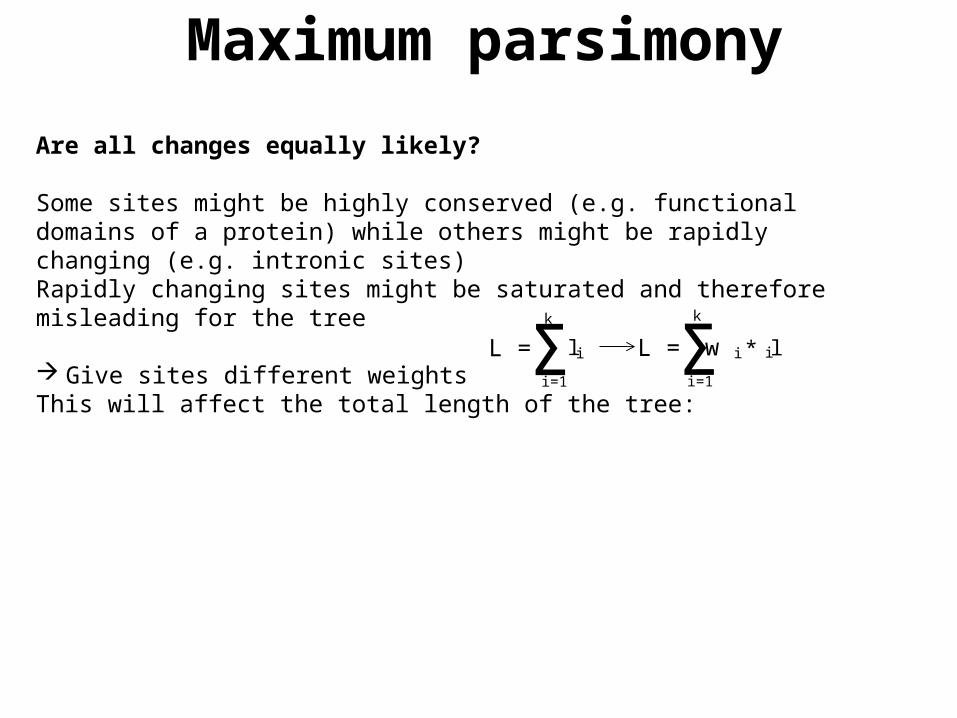
Are all changes equally likely?
Some sites might be highly conserved (e.g. functional domains of a protein) while others might be rapidly changing (e.g. intronic sites)Rapidly changing sites might be saturated and therefore misleading for the tree
Give sites different weightsThis will affect the total length of the tree: ΣL =
k
i=1
w * liiΣL =k
i=1
l i
Maximum parsimony
After scoring all trees find the most-parsimonious trees (MPTs)
often exist a number of equally MPTsif too many, maybe because of too many missing data; insufficient data to resolve the tree completelyoften only parts of the tree (sub trees) differ between the MPTs, e.g. a few taxa jump aroundcan make a consensus tree
Maximum parsimony
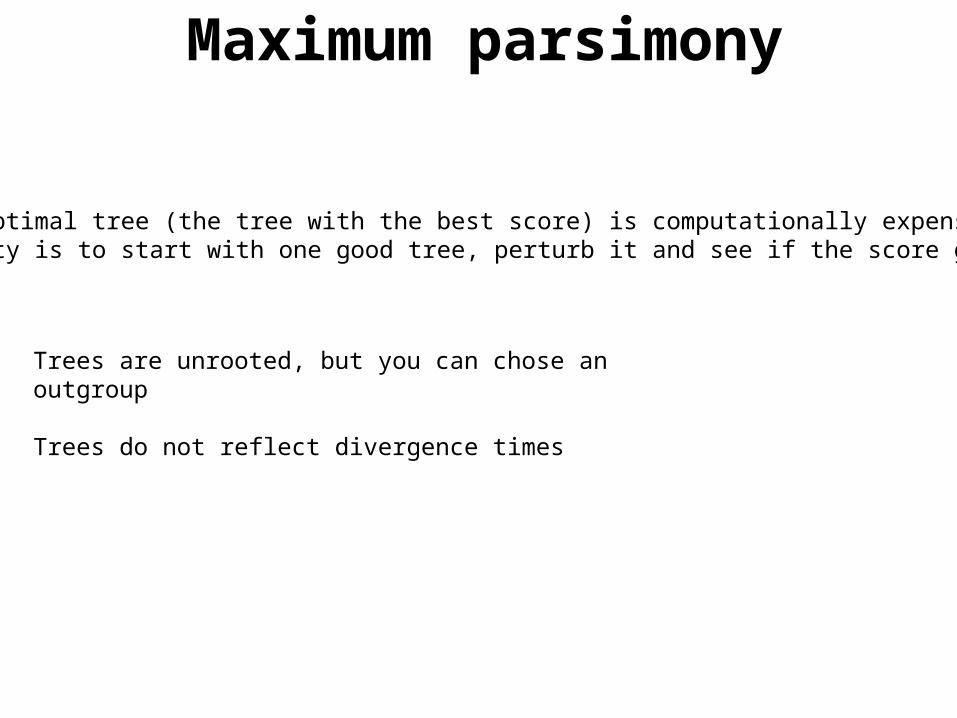
Trees are unrooted, but you can chose an outgroup
Trees do not reflect divergence times
Finding the optimal tree (the tree with the best score) is computationally expensive a possibility is to start with one good tree, perturb it and see if the score gets better
Maximum parsimony
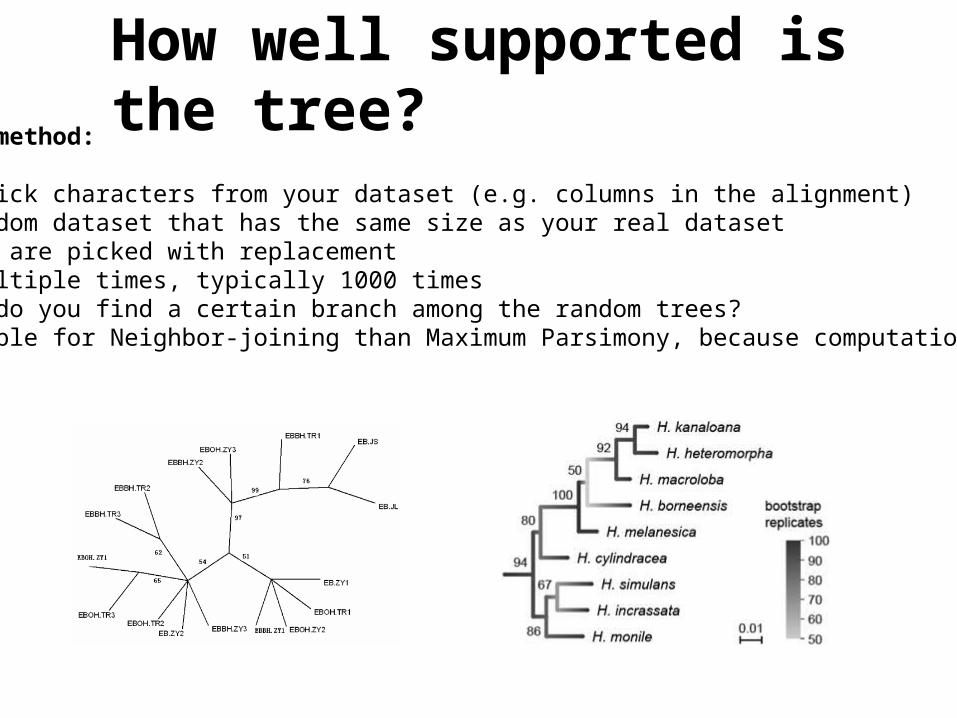
How well supported is the tree?Bootstrap method:
Randomly pick characters from your dataset (e.g. columns in the alignment)Make a random dataset that has the same size as your real datasetCharacters are picked with replacementDo this multiple times, typically 1000 timesHow often do you find a certain branch among the random trees?More suitable for Neighbor-joining than Maximum Parsimony, because computationally intense
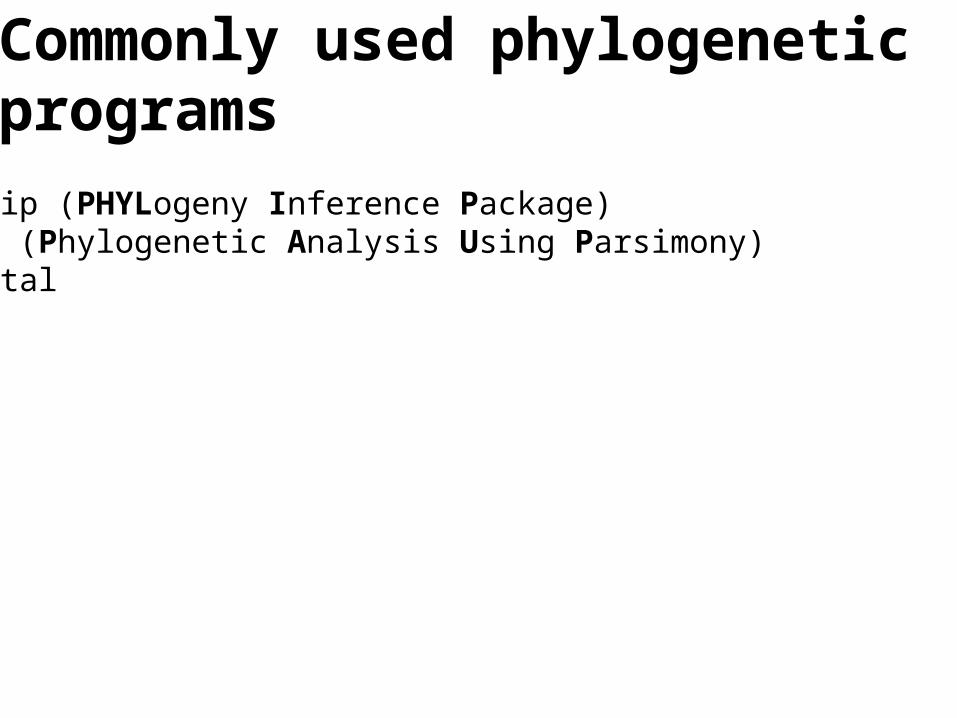
Commonly used phylogenetic programs
Phylip (PHYLogeny Inference Package)PAUP (Phylogenetic Analysis Using Parsimony)Clustal


![The Redwood gazette. (Redwood Falls, Minn.), 1902-09-03, [p ].GREAT NORTHERN LANDS in Red River Valley. IMPROVED FARMS, HOMESTEADS. O. B. TlJRRELL. Take A Bellows when yon get tfome](https://img.pdfslide.us/doc/110x75/60cabcc054ac5762f668d1cc/the-redwood-gazette-redwood-falls-minn-1902-09-03-p-great-northern-lands.jpg)


![Low-Latency Interfaces for Mixed-Timing Domains [in DAC-01] Tiberiu ChelceaSteven M. Nowick Department of Computer Science Columbia University {tibi,nowick}@cs.columbia.edu](https://img.pdfslide.us/doc/110x75/56649d4b5503460f94a281a6/low-latency-interfaces-for-mixed-timing-domains-in-dac-01-tiberiu-chelceasteven.jpg)


![CEN ISSS workshop e-invoicing Cen 19 06 2008 Engel Flechsig[1]](https://img.pdfslide.us/doc/110x75/5444311cafaf9fac098b4816/cen-isss-workshop-e-invoicing-cen-19-06-2008-engel-flechsig1.jpg)