Embed Size (px)
Citation preview

Introduction & Chapter 1
Jie Zhang
Account and Information Systems Department
College of Business Administration
The University of Texas at El Paso
Jie Zhang, QMB 2301 Fundamentals of Business Statistics, UTEP 1

• LO1 List ways statistics is used.
• LO2 Know the differences between descriptive and inferential statistics.
• LO3 Understand the differences between a sample and a population.
• LO4 Explain the difference between qualitative and quantitative
variables.
• LO5 Compare the differences between discrete and continuous
variables.
• LO6 Recognize the levels of measurement in data.
Jie Zhang, QMB 2301 Fundamentals of Business Statistics, UTEP 2
Uses of Statistics
• Statistics is one of the tools used to make decisions in business
• We apply statistical concepts in our lives
• As a student of business or economics, basic knowledge and skills to organize, analyze, and transform data and to present the information.
Jie Zhang, QMB 2301 Fundamentals of Business Statistics, UTEP 3

Why Study Statistics?
1. Numerical information is everywhere
2. Statistical techniques are used to make decisions that affect our daily lives
3. The knowledge of statistical methods will help you understand how decisions are made and give you a better understanding of how they affect you.
No matter what line of work you select, you will find yourself faced with decisions where an understanding of data analysis is helpful.
Jie Zhang, QMB 2301 Fundamentals of Business Statistics, UTEP 4

Who Uses Statistics?
• Statistical techniques are used extensively by marketing, accounting, quality control, consumers, professional sports people, hospital administrators, educators, politicians, physicians, etc...
Jie Zhang, QMB 2301 Fundamentals of Business Statistics, UTEP 5

Where you have seen “Statistics”?
Application fields of statistics
— sports ( movie “Money Ball”)
— stock market/finance
— weather forecast
— machine learning/computer/internet
— politics
— biology/medicine
Jie Zhang, QMB 2301 Fundamentals of Business Statistics, UTEP 6

What is statistics?
• The science of collecting, organizing, presenting, analyzing and interpreting data to assist in making more effective decisions
• Broadly defined, Statistics is a scientific discipline devoted to the study of data
Jie Zhang, QMB 2301 Fundamentals of Business Statistics, UTEP 7

• Data: the lowest level of abstraction from which information and then knowledge are derived
Data Information Knowledge
• Example: Academic records of children in elementary school
Jie Zhang, QMB 2301 Fundamentals of Business Statistics, UTEP 8

Course will cover• Introduction: descriptive and inferential statistics, sample and population, types
of variables, level of measurement in data etc.
• Describing Data: Frequency Tables, Frequency Distributions, and Graphic Presentation
• Describing Data: Numerical Measures
• Describing Data: Displaying and Exploring Data Exam 1 Review
• A Survey of Probability Concepts
• Discrete Probability Distributions
• Continuous Probability
• Sampling Methods and the Central Limit Theorem
• Estimation and Confidence Intervals
• One-sample Tests of Hypothesis
Jie Zhang, QMB 2301 Fundamentals of Business Statistics, UTEP 9

Statistical Techniques in Business & Economics, The University of Texas at El Paso Edition. (Lind, 15th Edition, McGraw-Hill)
Textbook
Jie Zhang, QMB 2301 Fundamentals of Business Statistics, UTEP 10

Course Logistics
• Instructor: Jie Zhang, Office: Room 315, Email: [email protected]
• Grading: Assignments 40%, Final Exam 40%, Attendance 20%
• Final exam date:
Jie Zhang, QMB 2301 Fundamentals of Business Statistics, UTEP 11

Hans Rosling: The best stats you've ever seen
Jie Zhang, QMB 2301 Fundamentals of Business Statistics, UTEP 12
Joel Selanikio: The surprising seeds of a big-data revolution in healthcare
The power of statistics

Types of Statistics – Descriptive Statistics and Inferential Statistics
Jie Zhang, QMB 2301 Fundamentals of Business Statistics, UTEP 13
Descriptive Statistics - methods of organizing, summarizing, and presenting data in an informative way.
EXAMPLE 1: The United States government reports the population of the United States was 179,323,000 in 1960; 203,302,000 in 1970; 226,542,000 in 1980; 248,709,000 in 1990, and 265,000,000 in 2000.
EXAMPLE 2: According to the Bureau of Labor Statistics, the average hourly earnings of production workers was $17.90 for April 2008.

Jie Zhang, QMB 2301 Fundamentals of Business Statistics, UTEP 14
Inferential Statistics: A decision, estimate, prediction, or generalization about a population, based on a sample.
Note: In statistics the word population andsample have a broader meaning. A population or sample may consist of individuals or objects

Population versus Sample
Jie Zhang, QMB 2301 Fundamentals of Business Statistics, UTEP 15
A population is a collection of all possible individuals, objects, or measurements of interest.
A sample is a portion, or part, of the population of interest

Why take a sample instead of studying every member of the population?
Jie Zhang, QMB 2301 Fundamentals of Business Statistics, UTEP 16
1. Prohibitive cost of census
2. Destruction of item being studied may be required
3. Not possible to test or inspect all members of a population being studied

Usefulness of a Sample in Learning about a Population
• Using a sample to learn something about a population is done extensively in business, agriculture, politics, and government.
EXAMPLE: Television networks constantly monitor the popularity of their programs by hiring Nielsen and other organizations to sample the preferences of TV viewers.
Jie Zhang, QMB 2301 Fundamentals of Business Statistics, UTEP 17

Types of Variables
• A. Qualitative or Attribute variable - the characteristic being studied is nonnumeric.
EXAMPLES: Gender, religious affiliation, type of automobile owned, state of birth, eye color are examples.
• B. Quantitative variable - information is reported numerically.
EXAMPLES: balance in your checking account, minutes remaining in class, or number of children in a family.
Jie Zhang, QMB 2301 Fundamentals of Business Statistics, UTEP 18

Quantitative Variables - Classifications
Jie Zhang, QMB 2301 Fundamentals of Business Statistics, UTEP 19
Quantitative variables can be classified as either discrete or continuous.
A. Discrete variables: can only assume certain values and there are usually “gaps” between values.
EXAMPLE: the number of bedrooms in a house, or the number of hammers sold at the local Home Depot (1,2,3,…,etc).
B. Continuous variable can assume any value within a specified range.
EXAMPLE: The pressure in a tire, the weight of a pork chop, or the height of students in a class.

Summary of Types of Variables
Jie Zhang, QMB 2301 Fundamentals of Business Statistics, UTEP 20

Four Levels of Measurement
Jie Zhang, QMB 2301 Fundamentals of Business Statistics, UTEP 21
Interval level - similar to the ordinal level, with the additional property that meaningful amounts of differences between data values can be determined. There is no natural zero point.
EXAMPLE: Temperature on the Fahrenheit scale.
Ratio level - the interval level with an inherent zero starting point. Differences and ratios are meaningful for this level of measurement.
EXAMPLES: Monthly income of surgeons, or distance traveled by manufacturer’s representatives per month.
Nominal level - data that is classified into categoriesand cannot be arranged in any particular order.
EXAMPLES: eye color, gender, religious affiliation.
Ordinal level – data arranged in some order, but the differences between data values cannot be determined or are meaningless.
EXAMPLE: During a taste test of 4 soft drinks, Mellow Yellow was ranked number 1, Sprite number 2, Seven-up number 3, and Orange Crush number 4.
Nominal-Level Data
Jie Zhang, QMB 2301 Fundamentals of Business Statistics, UTEP 22
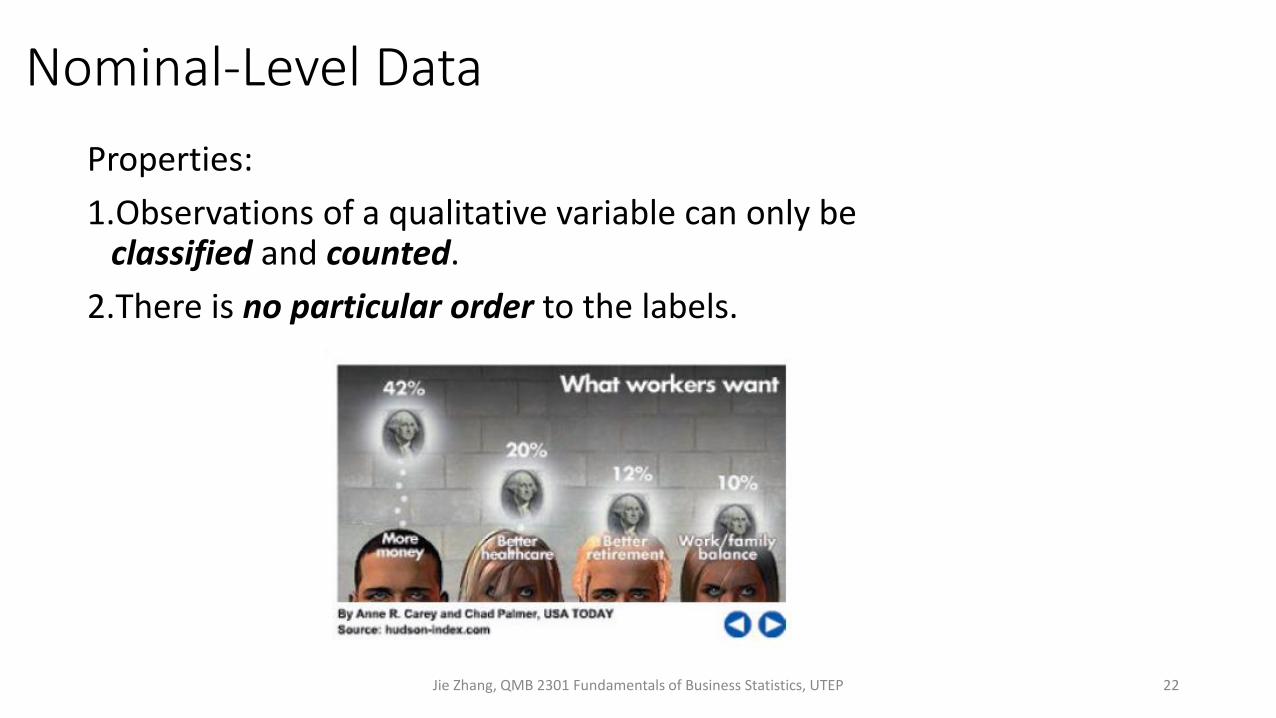
Properties:
1.Observations of a qualitative variable can only be classified and counted.
2.There is no particular order to the labels.

Ordinal-Level Data
Jie Zhang, QMB 2301 Fundamentals of Business Statistics, UTEP 23
Properties:
1.Data classifications are represented by sets of labels or names (high, medium, low) that have relative values.
2.Because of the relative values, the data classified can be ranked or ordered.

Interval-Level Data
Jie Zhang, QMB 2301 Fundamentals of Business Statistics, UTEP 24
Properties:
1.Data classifications are ordered according to the amount of the characteristic they possess.
2.Equal differences in the characteristic are represented by equal differences in the measurements.
Example: Women’s dress sizes listed on the table.

Ratio-Level Data
Jie Zhang, QMB 2301 Fundamentals of Business Statistics, UTEP 25
• Practically all quantitative data is recorded on the ratio level of measurement.
• Ratio level is the “highest” level of measurement.
Properties:1.Data classifications are ordered according to the amount of the
characteristics they possess.2.Equal differences in the characteristic are represented by equal
differences in the numbers assigned to the classifications.3.The zero point is the absence of the characteristic and the ratio between
two numbers is meaningful.

Why Know the Level of Measurement of a Data?
Jie Zhang, QMB 2301 Fundamentals of Business Statistics, UTEP 26
• The level of measurement of the data dictates the calculations that can be done to summarize and present the data.
• To determine the statistical tests that should be performed on the data
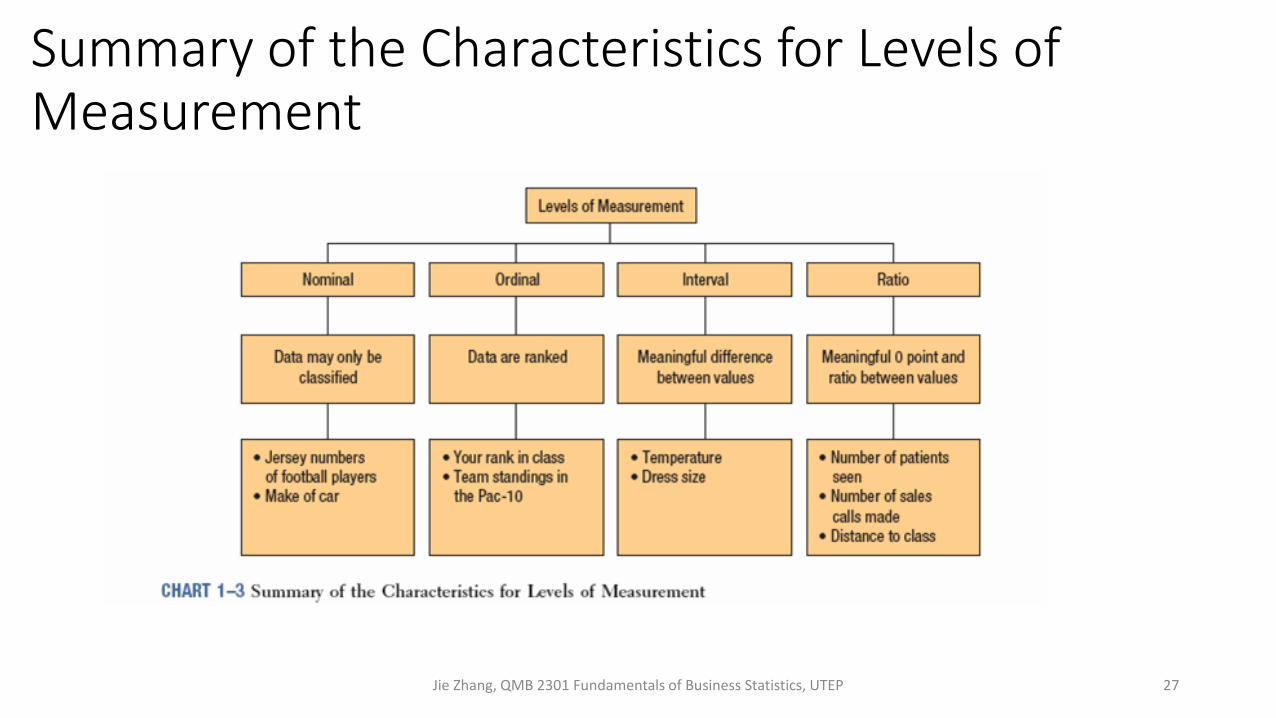
Summary of the Characteristics for Levels of Measurement
Jie Zhang, QMB 2301 Fundamentals of Business Statistics, UTEP 27