Embed Size (px)
Citation preview
September 8, 2013
The Parenting Gap Richard V. Reeves and Kimberly Howard
Introduction
“The well Educating of Children is so much the Duty and Concern of Parents, and the Welfare and Prosperity of the Nation so much depends on it.” – John Locke, Some Thoughts Concerning Education,
1693
The United States suffers from gaps in income, education and opportunity. The most important gap of all may be in parenting: a gap that harms wellbeing, limits social mobility, and ultimately damages our economy, too. If we want a better society, we need better parents.
It is obvious that parents are huge contributors to the knowledge, skills and character of their children. We can argue about the size of the parenting effect, compared to genetics, economics, culture, schooling, and so on. There is no question, however, that the quality of parenting is one of the most—perhaps the most important contributor to a good, fair, responsible society.
The central role of parenting in promoting opportunity is challenging too, since there are practical and moral limits to the reach of public policy. It is difficult enough to improve the quality of public schools, let alone the quality of private parents.
There are also strong moral objections to heavy-handed interventions into the domain of parenting. In a free society, families operate as mostly private institutions. Except in extreme cases of neglect or abuse, parents are at liberty to do things their own way—even when their own way is hopeless.
Parents, then, are mostly private agents whose actions have dramatic public consequences for education, crime, welfare, mobility and productivity. This does not mean that policymakers have no role to play. Even within the limits of practicality and philosophy, there is scope for the implementation of policies. The question is whether they work.
Public policy to address the parenting gap falls into one of two broad camps: building the skills of parents, or providing services to supplement their efforts. The first set seeks to make parents better; the latter to make them less relevant.
Skill-building approaches focus on improving parental styles and behavior and/or strengthening the relationship between parent and child. Most parenting programs fall into this first category of intervention. The goal is to help the parent do a better job, and so help the child to have a better life.
Interventions that seek to supplement the efforts of parents typically take the form of extra educational investment (especially in the early years), mentoring schemes, scholarships, and so on. Most early childhood programs fall into this second category. As Frank Furstenberg puts it: “The main line of attack must involve better schools equipped with more skilled
September 8, 2013 2
teachers that provide a more extensive program of education with longer days and summer months…to compensate for skills not acquired in the home” (Furstenberg 2011). The goal is, in effect, to detach the opportunities of the child from the abilities of the parents.
In recent years, greater emphasis has been placed on providing supplements to parenting than on improving parenting. In particular, significant investments have been made in early childhood programs. And some of the most high-profile school-based reforms, such as the KIPP program, have adopted a child-focused approach, with the longer school days and school terms that Furstenberg advocates.
Many of these policy interventions have been successful, but not as successful as advocates hoped. A particular disappointment is that Head Start, a flagship early childhood program, appears to be having no measurable impact on academic performance through third grade (Puma et al. 2012).
This is therefore an opportune moment to look again at the scope for interventions that tackle the problem of poor parenting more directly: in other words, parents themselves. On the face of it, helping parents do a better job seems a more time-consuming and complex task than simply supplementing their efforts. But it may in fact be the only way to properly address the parenting gap and its negative consequences.
How much do parents matter?
As achievement gaps between low income and high income children persist and grow (Reardon 2011), more attention has been paid to the differences in parenting behavior across socioeconomic classes. Affluent parents spend more time with their children than less affluent parents and they spend the time differently (Putnam 2012). High-income parents talk with their school-aged children for three hours more per week than low-income parents (Phillips 2011). They also provide around four-and-a-half extra hours per week of time in novel or stimulating places, such as parks or churches, for their infants and toddlers.
In a famous study, Betty Hart and Todd R. Risley (1995) found large gaps in the amount of conversation by social and economic background. Children in families on welfare heard about 600 words per hour, working-class children heard 1,200 words, while children from professional families heard 2,100 words. By the age of three, Hart and Risley estimated, a poor child would have heard 30 million fewer words at home than one from a professional family. Moreover, Kalil, Ryan, and Corey (2012) found that highly educated mothers more appropriately tailor activities to the developmental stage of the child than those with only a high school education.
Are these differences in parenting behavior a major factor behind differences in their children’s outcomes? This central question has provoked a considerable body of research.
There are large correlations between the behavior of parents and outcomes for their children. Children with parents who score highly on both warmth and control – labeled ‘authoritative parents’ – are more competent and happier (Baumrind and Black 1967; Baumrind 1991). Children with parents who read to them have larger vocabularies (Brooks-Gunn and Markman 2005). Children with a secure attachment to their parents during infancy
September 8, 2013 3
are more socially skilled later in life than peers without secure attachments in infancy (Sroufe 2002).
The weakness of this correlational research is that the observed relationship could be the effect of parents on the child, the effect of the child on the parents, or the product of the two. It is also difficult to tease out the importance of parenting from the importance of genes, family income, and other traits of the parents.
In The Nurture Assumption, Judith Rich Harris (1998) pointed out these flaws in interpreting the correlations between parent characteristics and child outcomes, and argued that parenting does not matter as much as we assume. More recently, Bryan Caplan, in Selfish Reasons to Have More Kids, argues that parents should worry less about their parenting because their children’s outcomes depend mostly on their genetic makeup in any case. Citing a series of twin studies and adoption studies, Caplan says that children of successful adults will also likely be successful adults - whether or not their parents force them to practice piano.
But the more general conclusion from twin and adoption studies is that variance in child outcomes is explained by variance in genetic inputs, non-shared environment, and shared family environment - of which parenting is of course a piece. Bruce Sacerdote (2007) found that parental education and family size of adoptive families were better predictors of schooling and behavioral outcomes for adopted children than family income or neighborhood characteristics. In fact, children assigned to high education, small families were 16 percentage points more likely to graduate from college than children assigned to less educated, larger families. This suggests a strong impact from parental investment. Parenting may be especially important for those who are not born to successful adults. For example, among adopted children whose biological parents had a history of criminality, those who were placed in "dysfunctional homes" were three times more likely to engage in criminal behavior themselves than those who were placed in "stable, supportive environments" (Maccoby 2002).
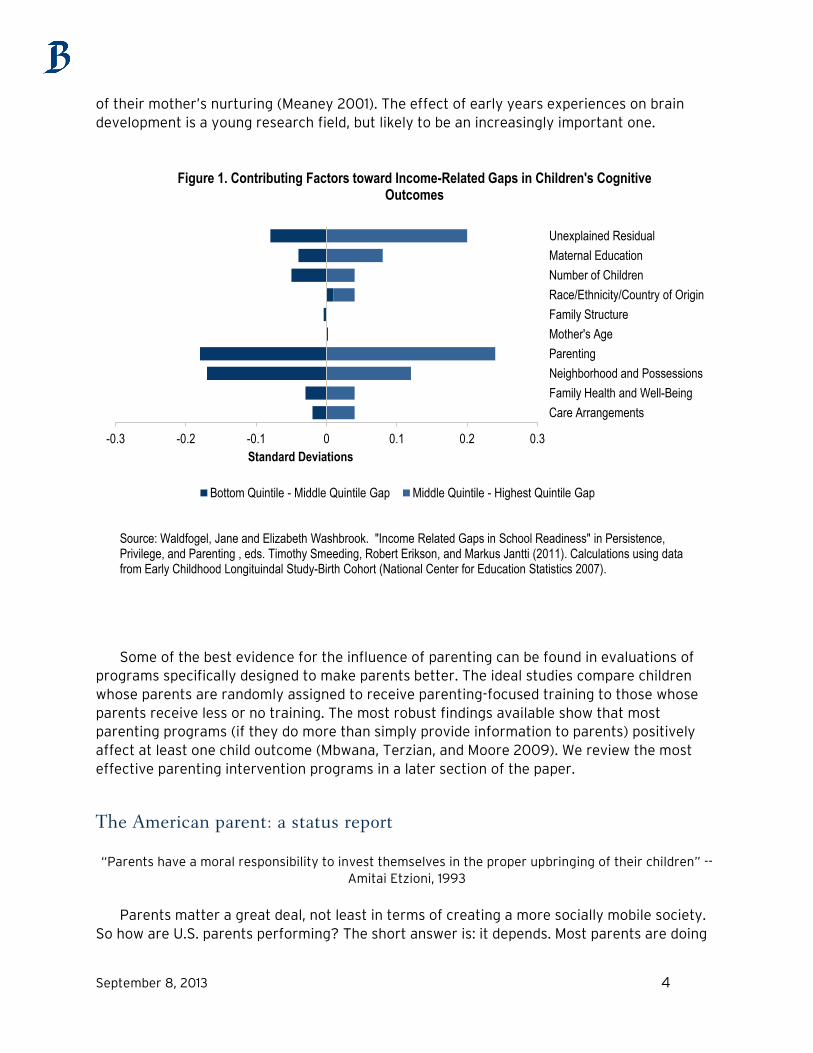
Contemporary research typically addresses not whether parenting matters, but how much it matters as one of many factors that influence child outcomes. Waldfogel and Washbrook (2011) estimate that parenting behavior (including maternal sensitivity, reading to a child, out-of-home activities, parenting style, and expectations) explains about 40 percent of the income-related gaps in cognitive outcomes for children at age four (as Figure 1 shows). Indeed, parenting behavior explained more of the gap between top income quintile children and bottom income quintile children than any other factor, including maternal education, family size, and race. Similarly, maternal sensitivity, measured when the child is six months and again at 15 months, explains one-third of the math and language skills gap at the beginning of kindergarten between black and white children (Murnane et al. 2006).
An emerging wave of research that finds meaningful effects of parenting is in the field of brain development research. In his book How Children Succeed, Paul Tough cites a study finding that rats with nurturing mothers—those who licked and groomed them when they were stressed—were more brave and curious in their adulthood. Importantly, this difference in adult outcomes was linked to actual visible differences in the development of their brains as a result
September 8, 2013 4
of their mother’s nurturing (Meaney 2001). The effect of early years experiences on brain development is a young research field, but likely to be an increasingly important one.
Some of the best evidence for the influence of parenting can be found in evaluations of programs specifically designed to make parents better. The ideal studies compare children whose parents are randomly assigned to receive parenting-focused training to those whose parents receive less or no training. The most robust findings available show that most parenting programs (if they do more than simply provide information to parents) positively affect at least one child outcome (Mbwana, Terzian, and Moore 2009). We review the most effective parenting intervention programs in a later section of the paper.
The American parent: a status report
“Parents have a moral responsibility to invest themselves in the proper upbringing of their children” --Amitai Etzioni, 1993
Parents matter a great deal, not least in terms of creating a more socially mobile society. So how are U.S. parents performing? The short answer is: it depends. Most parents are doing
-0.3 -0.2 -0.1 0 0.1 0.2 0.3
Care Arrangements Family Health and Well-Being Neighborhood and Possessions Parenting Mother's Age Family Structure Race/Ethnicity/Country of Origin Number of Children Maternal Education Unexplained Residual
Standard Deviations
Figure 1. Contributing Factors toward Income-Related Gaps in Children's Cognitive Outcomes
Bottom Quintile - Middle Quintile Gap Middle Quintile - Highest Quintile Gap
Source: Waldfogel, Jane and Elizabeth Washbrook. "Income Related Gaps in School Readiness" in Persistence, Privilege, and Parenting , eds. Timothy Smeeding, Robert Erikson, and Markus Jantti (2011). Calculations using data from Early Childhood Longituindal Study-Birth Cohort (National Center for Education Statistics 2007).
September 8, 2013 5
well. Some are doing great. But a minority is performing badly by comparison. Gaps in parenting quality are wide.
Measuring Parenting Of course, parenting is about much more than bedtime stories. A robust, stable measure is
required upon which to base any plausible analysis. Our analysis employs the Social Genome Model (SGM) dataset (see Appendix A) which is based on the Bureau of Labor Statistics’ Children of the National Longitudinal Survey of Youth, 1979 (CNLSY). The CNLSY contains data on all children born to the mothers of the National Longitudinal Survey of Youth 1979 (NLSY79) beginning in 1986. Our sample therefore consists of 5,783 children who were born in the late 1980s and early 1990s.
The CNLSY measures parenting using the well-validated HOME-SF scale (Home Observation for Measurement of the Environment- Short Form). The HOME scale consists of mother self-reports and interviewer observations on the emotional and learning environment of the home.1 We track HOME scores for mothers when their child is in infancy (age 0-2), early childhood (age 3-5), and middle childhood (age 10-15). Items in the HOME scale vary by age of the child, but the mother is asked questions such as how often she reads to the child or how she would respond to a tantrum. Interviewers assess items including whether the mother encourages a child to contribute to the conversation and whether the child’s play environment appears safe.2
The HOME-SF scale has been widely used (Mott 2004), and researchers have created subscales to measure specific aspects of parenting, such as parental warmth and parental verbal skills, which predict child outcomes (Linver, Brooks-Gunn, and Cabrera 2004). However, for the purposes of this paper we employ the entire HOME scale both for comparability across childhood stages and to most broadly measure the behavior and environment that parents provide for their children.
An important caveat: any measure of parenting quality rests on a judgment of what constitutes quality. The HOME scale is one of the most widely used scales, but it contains items that could favor certain groups. One measure, for example, is whether or not there are toys in the home. This item could favor more advantaged parents, if the reason lower income parents do not supply toys is that they cannot afford them.
In order to examine the impact of parenting quality, our research focuses on the ends of the distribution: in other words, on the strongest and weakest parents. The weakest parents score in the bottom 25% percent of parents on the HOME scale in two or more of the three stages of their child’s life; the strongest parents are those that score in the top 25 percent of parents on the HOME in two or more stages.3
1 Data from the HOME scale are only currently available for the mother – a clear limitation of the dataset.
By looking at parenting over multiple years of a
2 A full list of items on the HOME scale can be found at http://www.nlsinfo.org/site/childya/nlsdocs/guide/Appendixes/A-HOMEScales.htm. 3 This categorizes 20.85 percent of parents as the weakest parents and 17.55 percent of parents as the strongest parents.
September 8, 2013 6
child's life, our research approach recognizes that parents can improve (or worsen) over time, and narrows our focus to parents who are consistently underperforming or excelling.
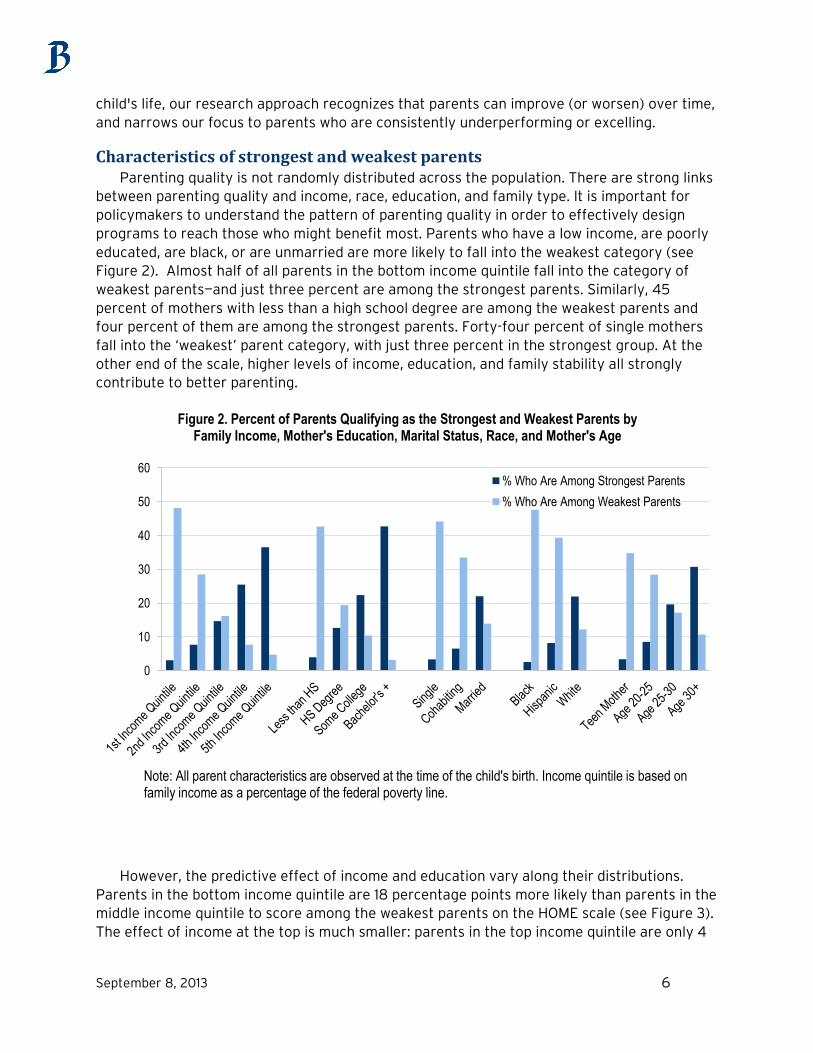
Characteristics of strongest and weakest parents Parenting quality is not randomly distributed across the population. There are strong links
between parenting quality and income, race, education, and family type. It is important for policymakers to understand the pattern of parenting quality in order to effectively design programs to reach those who might benefit most. Parents who have a low income, are poorly educated, are black, or are unmarried are more likely to fall into the weakest category (see Figure 2). Almost half of all parents in the bottom income quintile fall into the category of weakest parents—and just three percent are among the strongest parents. Similarly, 45 percent of mothers with less than a high school degree are among the weakest parents and four percent of them are among the strongest parents. Forty-four percent of single mothers fall into the ‘weakest’ parent category, with just three percent in the strongest group. At the other end of the scale, higher levels of income, education, and family stability all strongly contribute to better parenting.
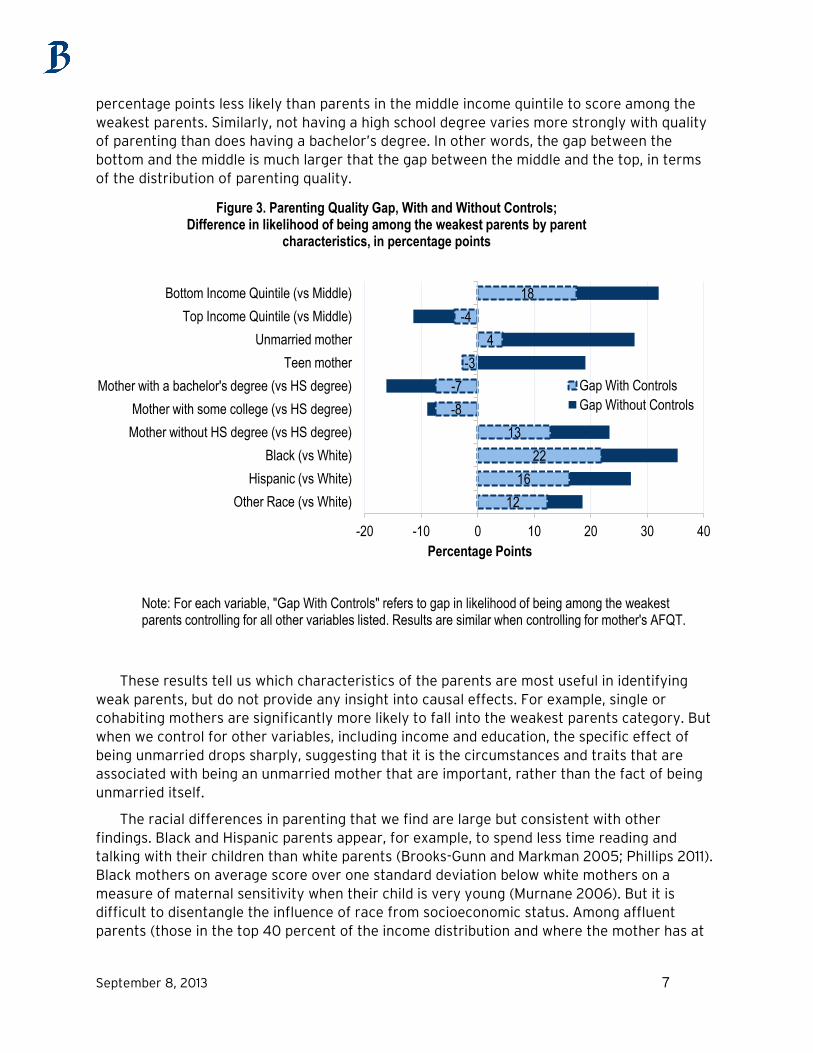
However, the predictive effect of income and education vary along their distributions. Parents in the bottom income quintile are 18 percentage points more likely than parents in the middle income quintile to score among the weakest parents on the HOME scale (see Figure 3). The effect of income at the top is much smaller: parents in the top income quintile are only 4
0
10
20
30
40
50
60
Figure 2. Percent of Parents Qualifying as the Strongest and Weakest Parents by Family Income, Mother's Education, Marital Status, Race, and Mother's Age
% Who Are Among Strongest Parents % Who Are Among Weakest Parents
Note: All parent characteristics are observed at the time of the child's birth. Income quintile is based on family income as a percentage of the federal poverty line.
September 8, 2013 7
percentage points less likely than parents in the middle income quintile to score among the weakest parents. Similarly, not having a high school degree varies more strongly with quality of parenting than does having a bachelor’s degree. In other words, the gap between the bottom and the middle is much larger that the gap between the middle and the top, in terms of the distribution of parenting quality.
These results tell us which characteristics of the parents are most useful in identifying weak parents, but do not provide any insight into causal effects. For example, single or cohabiting mothers are significantly more likely to fall into the weakest parents category. But when we control for other variables, including income and education, the specific effect of being unmarried drops sharply, suggesting that it is the circumstances and traits that are associated with being an unmarried mother that are important, rather than the fact of being unmarried itself.
The racial differences in parenting that we find are large but consistent with other findings. Black and Hispanic parents appear, for example, to spend less time reading and talking with their children than white parents (Brooks-Gunn and Markman 2005; Phillips 2011). Black mothers on average score over one standard deviation below white mothers on a measure of maternal sensitivity when their child is very young (Murnane 2006). But it is difficult to disentangle the influence of race from socioeconomic status. Among affluent parents (those in the top 40 percent of the income distribution and where the mother has at
12 16
22 13
-8 -7
-3 4
-4 18
-20 -10 0 10 20 30 40
Other Race (vs White) Hispanic (vs White)
Black (vs White) Mother without HS degree (vs HS degree) Mother with some college (vs HS degree)
Mother with a bachelor's degree (vs HS degree) Teen mother
Unmarried mother Top Income Quintile (vs Middle)
Bottom Income Quintile (vs Middle)
Percentage Points
Figure 3. Parenting Quality Gap, With and Without Controls; Difference in likelihood of being among the weakest parents by parent
characteristics, in percentage points
Gap With Controls Gap Without Controls
Note: For each variable, "Gap With Controls" refers to gap in likelihood of being among the weakest parents controlling for all other variables listed. Results are similar when controlling for mother's AFQT.
September 8, 2013 8
least a high school degree) the vast majority of black (85 percent) and Hispanic (88 percent) parents qualify as average or above.
It is also possible that the relationship between race and parenting quality is influenced by racial bias in CNLSY interviewer assessment of parents. Almost 75 percent of black mothers were interviewed by a white interviewer. This may mean that they were rated more harshly than if they had been interviewed by a black interviewer, an effect found by Berger, McDaniel, and Paxson (2006) in another large study from the 1990s.
These findings dramatize the significance of quality of parenting for equality of opportunity. Children who already face higher hurdles to personal success in the form of poverty, worse schooling, or racism are also disadvantaged by the weaker performance of their parents in preparing them for the world. The parenting gap is a contributor to the opportunity gap.
Parenting and Opportunity There is growing concern in the U.S. over low rates of intergenerational mobility, and in
particular, sluggish rates of upward mobility from the bottom rungs of society. There is a unanimous non-partisan clamor for “more opportunity,” but little agreement on the steps necessary to create it. Few would disagree about the value of parenting in promoting mobility. But it is one thing to say it; quite another to show it.
On track to the middle class: the influence of parents The SGM contains a series of success measures at each life stage (Sawhill, Winship, and
Grannis 2012). These “on track” indicators provide a valuable benchmark for assessing the disparities in child outcomes by the quality of their parents.
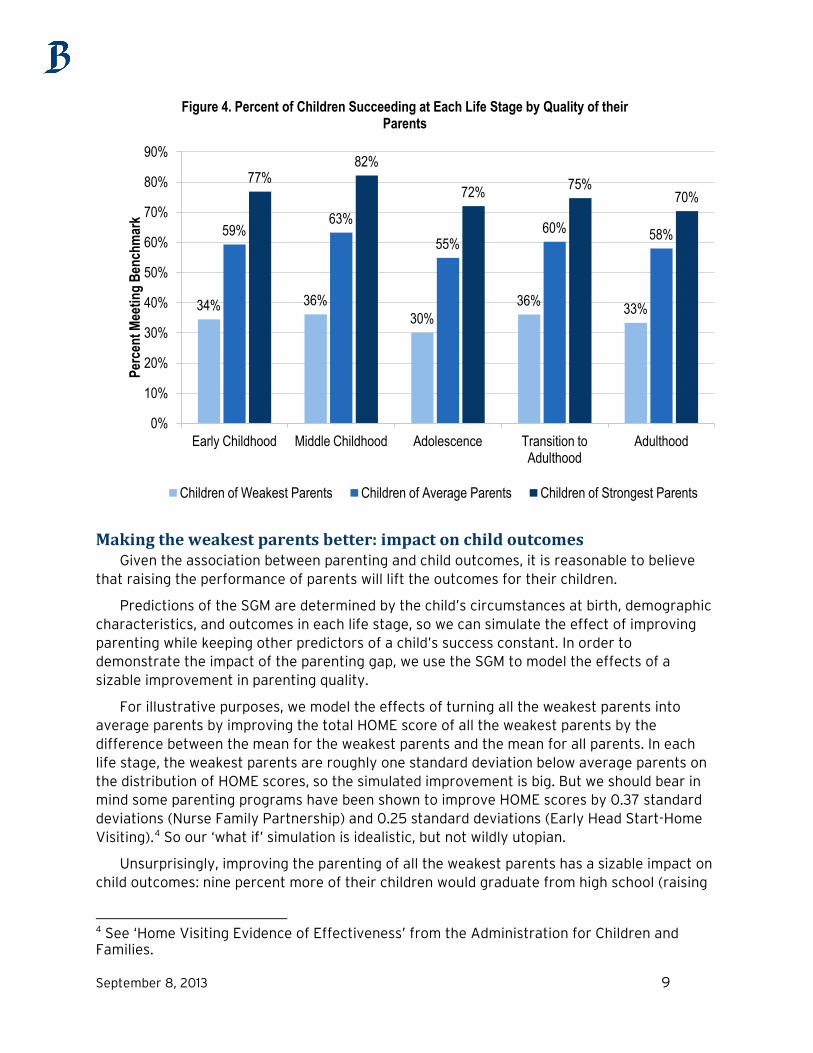
The relationship between parenting quality and a child’s chances of doing well comes through in our analysis loud and clear. Figure 4 shows that children of the strongest parents succeed in each life stage at much higher rates than children of the weakest parents. (Note that the data presented here are raw gaps, i.e., without controls for income, etc.) By the end of adolescence, three out of four children with the strongest parents graduate high school with at least a 2.5 GPA, while avoiding being convicted of a crime or becoming a teen parent. By contrast, only 30 percent of children with the weakest parents manage to meet these benchmarks.
September 8, 2013 9
Making the weakest parents better: impact on child outcomes Given the association between parenting and child outcomes, it is reasonable to believe
that raising the performance of parents will lift the outcomes for their children.
Predictions of the SGM are determined by the child’s circumstances at birth, demographic characteristics, and outcomes in each life stage, so we can simulate the effect of improving parenting while keeping other predictors of a child’s success constant. In order to demonstrate the impact of the parenting gap, we use the SGM to model the effects of a sizable improvement in parenting quality.
For illustrative purposes, we model the effects of turning all the weakest parents into average parents by improving the total HOME score of all the weakest parents by the difference between the mean for the weakest parents and the mean for all parents. In each life stage, the weakest parents are roughly one standard deviation below average parents on the distribution of HOME scores, so the simulated improvement is big. But we should bear in mind some parenting programs have been shown to improve HOME scores by 0.37 standard deviations (Nurse Family Partnership) and 0.25 standard deviations (Early Head Start-Home Visiting).4
Unsurprisingly, improving the parenting of all the weakest parents has a sizable impact on child outcomes: nine percent more of their children would graduate from high school (raising
So our ‘what if’ simulation is idealistic, but not wildly utopian.
4 See ‘Home Visiting Evidence of Effectiveness’ from the Administration for Children and Families.
34% 36% 30%
36% 33%
59% 63%
55% 60% 58%
77% 82%
72% 75% 70%
0%
10%
20%
30%
40%
50%
60%
70%
80%
90%
Early Childhood Middle Childhood Adolescence Transition to Adulthood
Adulthood
Perc
ent M
eetin
g Ben
chm
ark
Figure 4. Percent of Children Succeeding at Each Life Stage by Quality of their Parents
Children of Weakest Parents Children of Average Parents Children of Strongest Parents
September 8, 2013 10
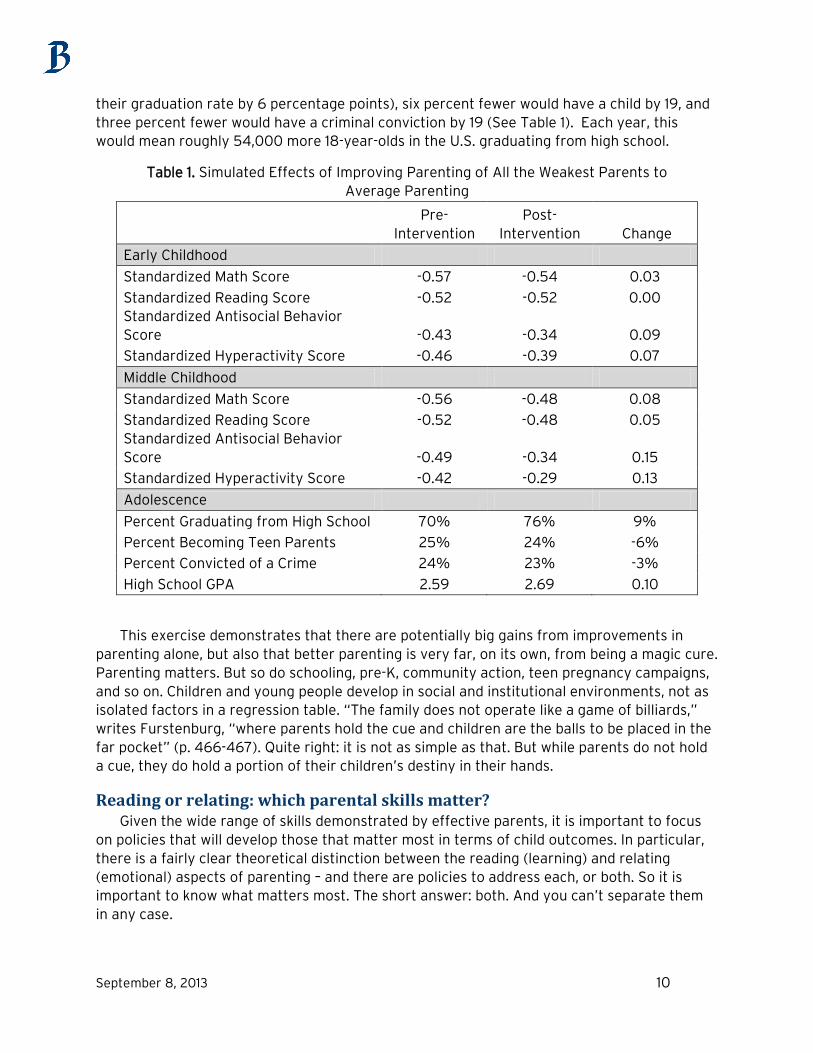
their graduation rate by 6 percentage points), six percent fewer would have a child by 19, and three percent fewer would have a criminal conviction by 19 (See Table 1). Each year, this would mean roughly 54,000 more 18-year-olds in the U.S. graduating from high school.
Table 1. Simulated Effects of Improving Parenting of All the Weakest Parents to Average Parenting
Pre-
Intervention Post-
Intervention Change
Early Childhood
Standardized Math Score -0.57 -0.54 0.03
Standardized Reading Score -0.52 -0.52 0.00 Standardized Antisocial Behavior Score -0.43 -0.34 0.09
Standardized Hyperactivity Score -0.46 -0.39 0.07
Middle Childhood
Standardized Math Score -0.56 -0.48 0.08
Standardized Reading Score -0.52 -0.48 0.05 Standardized Antisocial Behavior Score -0.49 -0.34 0.15
Standardized Hyperactivity Score -0.42 -0.29 0.13
Adolescence
Percent Graduating from High School 70% 76% 9%
Percent Becoming Teen Parents 25% 24% -6%
Percent Convicted of a Crime 24% 23% -3%
High School GPA 2.59 2.69 0.10
This exercise demonstrates that there are potentially big gains from improvements in parenting alone, but also that better parenting is very far, on its own, from being a magic cure. Parenting matters. But so do schooling, pre-K, community action, teen pregnancy campaigns, and so on. Children and young people develop in social and institutional environments, not as isolated factors in a regression table. “The family does not operate like a game of billiards,” writes Furstenburg, “where parents hold the cue and children are the balls to be placed in the far pocket” (p. 466-467). Quite right: it is not as simple as that. But while parents do not hold a cue, they do hold a portion of their children’s destiny in their hands.
Reading or relating: which parental skills matter? Given the wide range of skills demonstrated by effective parents, it is important to focus
on policies that will develop those that matter most in terms of child outcomes. In particular, there is a fairly clear theoretical distinction between the reading (learning) and relating (emotional) aspects of parenting – and there are policies to address each, or both. So it is important to know what matters most. The short answer: both. And you can’t separate them in any case.
September 8, 2013 11
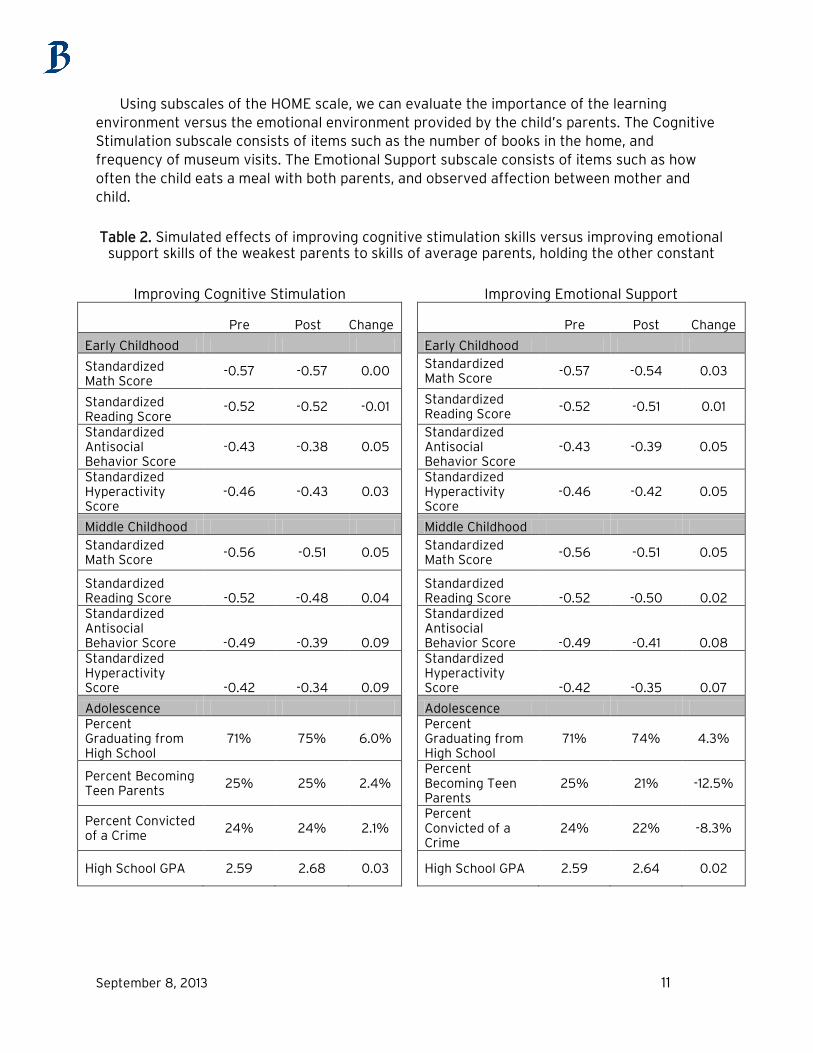
Using subscales of the HOME scale, we can evaluate the importance of the learning environment versus the emotional environment provided by the child’s parents. The Cognitive Stimulation subscale consists of items such as the number of books in the home, and frequency of museum visits. The Emotional Support subscale consists of items such as how often the child eats a meal with both parents, and observed affection between mother and child.
Table 2. Simulated effects of improving cognitive stimulation skills versus improving emotional support skills of the weakest parents to skills of average parents, holding the other constant
Improving Cognitive Stimulation
Improving Emotional Support
Pre Post
Change
Pre Post
Change
Early Childhood
Early Childhood
Standardized Math Score
-0.57 -0.57 0.00
Standardized Math Score
-0.57 -0.54 0.03
Standardized Reading Score
-0.52 -0.52 -0.01
Standardized Reading Score
-0.52 -0.51 0.01
Standardized Antisocial Behavior Score
-0.43 -0.38 0.05
Standardized Antisocial Behavior Score
-0.43 -0.39 0.05
Standardized Hyperactivity Score
-0.46 -0.43 0.03
Standardized Hyperactivity Score
-0.46 -0.42 0.05
Middle Childhood
Middle Childhood Standardized Math Score
-0.56 -0.51 0.05
Standardized Math Score
-0.56 -0.51 0.05
Standardized Reading Score -0.52 -0.48 0.04
Standardized Reading Score -0.52 -0.50 0.02
Standardized Antisocial Behavior Score -0.49 -0.39 0.09
Standardized Antisocial Behavior Score -0.49 -0.41 0.08
Standardized Hyperactivity Score -0.42 -0.34 0.09
Standardized Hyperactivity Score -0.42 -0.35 0.07
Adolescence
Adolescence Percent Graduating from High School
71% 75% 6.0%
Percent Graduating from High School
71% 74% 4.3%
Percent Becoming Teen Parents
25% 25% 2.4%
Percent Becoming Teen Parents
25% 21% -12.5%
Percent Convicted of a Crime
24% 24% 2.1%
Percent Convicted of a Crime
24% 22% -8.3%
High School GPA 2.59 2.68 0.03
High School GPA 2.59 2.64 0.02
September 8, 2013 12
For this analysis, the scores of the weakest parents on each of the cognitive and emotional subscales were artificially boosted to the level of average parents, while holding all other parents’ scores constant. We then simulated their children’s outcomes in each case.5
Improvements in children’s reading and math test scores at age 5 and 11 are small and similar between the two simulations, as are predicted improvements in behavioral scores at age 5 and 11.
Adolescent outcomes, however, differ by simulation. The behavioral outcomes of adolescence are significantly predicted by the Emotional Support measure of parenting, but not the Cognitive Stimulation measure. We predict that if we could solely improve the emotional skills of the weakest parents, 12.5 percent fewer of their children would be teen parents and 8.3 percent fewer would be convicted of a crime by the age of 19 (see Table 2). In contrast, graduation from high school and high school GPA are both significantly predicted by the Cognitive Stimulation parenting measure.6
In terms of parental attributes, then, both reading (the cognitive environment) and relating (the emotional environment) affect child outcomes. Importantly, it also appears that improvements in the two aspects of parenting are not interchangeable.
Current policy – a critical overview There is a strong prima facie case for developing policies to improve the performance of
the weakest parents, and thereby the opportunities for their children. Of course we are not starting with a blank sheet of paper. There is a panoply of policies already in operation. The question is which, if any, are having any real effect.
Parenting programs in the U.S. vary widely by time and intensity, focus (improving mother’s vocabulary, improving parent-child attachment, etc), intervention strategy (information, practice, etc), location (home-based, center-based, both), and qualifications of the program staff (nurses, paraprofessionals, etc), among other things. In practice, many parenting interventions are one part of a multi-faceted program, such as Incredible Years or Early Head Start.
However, the parenting programs of most interest today are home visiting programs, in which services are delivered directly to the homes of participants. Collectively, state
5 This is done by improving the scores of all the weakest parents by the average amount that the weakest parents fall below the mean (roughly .6 to 1.1 standard deviations) on cognitive stimulation or emotional support in each stage of infancy, early childhood, and middle childhood. Although both simulations are based on ‘utopian’ improvements in parenting scores, the weakest parents are on average slightly worse at Cognitive Stimulation than Emotional Support and thus the Cognitive Stimulation simulation requires slightly larger improvements. In infancy, early childhood, and middle childhood, the difference in amount of improvement needed to get the weakest parents to average is .09, .16, and .01, respectively.
6 Emotional support scores in infancy, early childhood, and middle childhood are jointly significant in predicting teen birth at the p<.01 level and jointly significant in predicting teen conviction at the p<.05 level. Cognitive stimulation scores in infancy, early childhood, and middle childhood are jointly significant in predicting high school graduation and GPA at the p<.01 level.
September 8, 2013 13
governments make around $1.4 billion available for home visiting programs (Pew Center on the States 2011).
Most home visiting programs have shown disappointing results, however. Brooks-Gunn and Markman (2005) conclude that “few home-visiting programs have altered children’s school readiness” because most are not intensive enough; nor are home visitors well enough trained or supervised. Another hurdle for parenting programs is keeping families engaged; parenting programs will always be limited in their reach because they are voluntary and require a time commitment from the parents.
However, certain programs, such as Nurse Family Partnership, have decades of evaluations showing positive effects. With the mixed evidence available, the right question is not whether parenting programs work but rather which parenting programs work for outcomes that we care about.
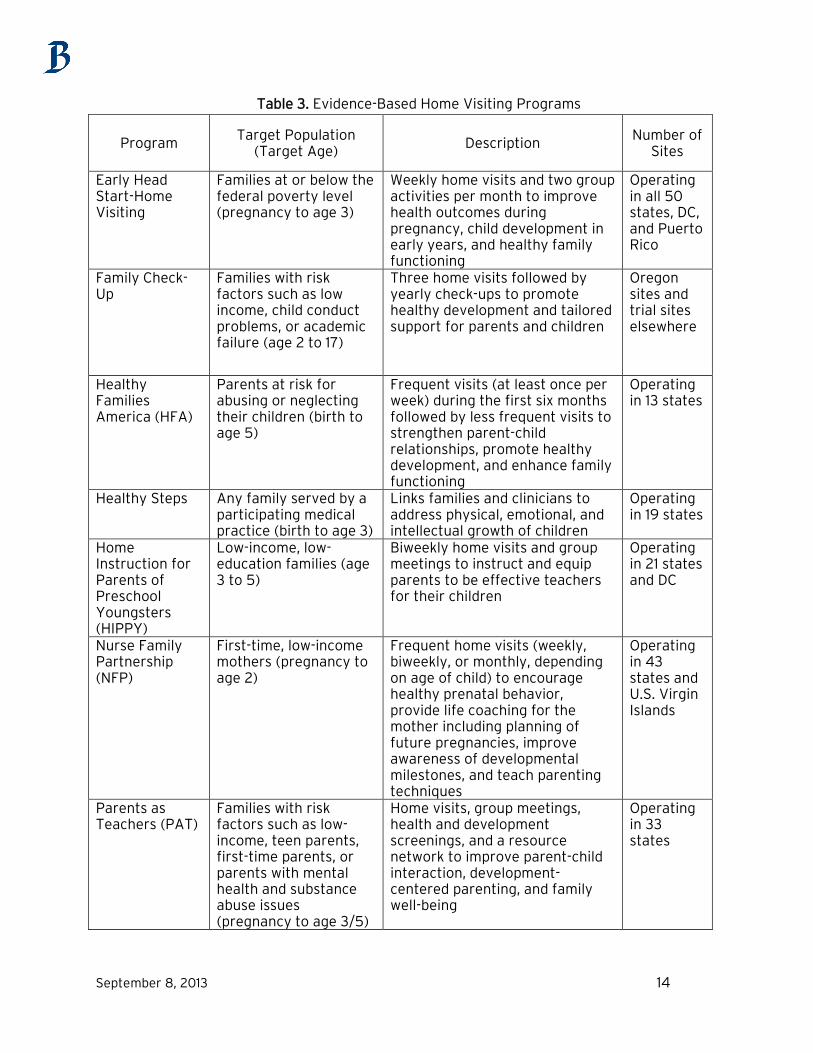
The federal government has recently taken initial steps toward greater investments in effective home visiting programs. The Affordable Care Act allocates $1.5 billion over the next five years to the Maternal Infant Early Childhood Home Visiting (MIECHV) program which will help states to establish early home visiting programs for at-risk parents. To this end, the Department of Health and Human Services (HHS) carefully reviewed eleven large-scale home visiting programs with the most available evaluations. Of these prioritized programs, HHS reports that seven meet their requirements for federal funding, meaning the programs show two or more significant favorable effects, with effects lasting at least one year after enrollment (see Table 3).
This prioritizing of programs with proven effectiveness is not reflected in current policy, especially at the state and local level. Of the money spent by the states, 58 percent was given to local communities with few or no requirements to adhere to evidence-based models (Pew Center on the States 2011). Moreover, there is no monitoring of whether the programs in place are producing results.
September 8, 2013 14
Table 3. Evidence-Based Home Visiting Programs
Program Target Population
(Target Age) Description
Number of Sites
Early Head Start-Home Visiting
Families at or below the federal poverty level (pregnancy to age 3)
Weekly home visits and two group activities per month to improve health outcomes during pregnancy, child development in early years, and healthy family functioning
Operating in all 50 states, DC, and Puerto Rico
Family Check-Up
Families with risk factors such as low income, child conduct problems, or academic failure (age 2 to 17)
Three home visits followed by yearly check-ups to promote healthy development and tailored support for parents and children
Oregon sites and trial sites elsewhere
Healthy Families America (HFA)
Parents at risk for abusing or neglecting their children (birth to age 5)
Frequent visits (at least once per week) during the first six months followed by less frequent visits to strengthen parent-child relationships, promote healthy development, and enhance family functioning
Operating in 13 states
Healthy Steps Any family served by a participating medical practice (birth to age 3)
Links families and clinicians to address physical, emotional, and intellectual growth of children
Operating in 19 states
Home Instruction for Parents of Preschool Youngsters (HIPPY)
Low-income, low-education families (age 3 to 5)
Biweekly home visits and group meetings to instruct and equip parents to be effective teachers for their children
Operating in 21 states and DC
Nurse Family Partnership (NFP)
First-time, low-income mothers (pregnancy to age 2)
Frequent home visits (weekly, biweekly, or monthly, depending on age of child) to encourage healthy prenatal behavior, provide life coaching for the mother including planning of future pregnancies, improve awareness of developmental milestones, and teach parenting techniques
Operating in 43 states and U.S. Virgin Islands
Parents as Teachers (PAT)
Families with risk factors such as low-income, teen parents, first-time parents, or parents with mental health and substance abuse issues (pregnancy to age 3/5)
Home visits, group meetings, health and development screenings, and a resource network to improve parent-child interaction, development-centered parenting, and family well-being
Operating in 33 states
September 8, 2013 15
Good policy = better parents = more social mobility It is clear that greater investments in parenting programs in the name of social mobility
will have to follow careful evaluation and assessment. Evidence is king.
The SGM allows us to estimate the long term effects of parenting programs with proven short-term effects on children’s cognitive and behavioral outcomes. Since we are interested in the effects of parenting on mobility, we reviewed programs that intervened with the parents and measured outcomes of the child.
For the purposes of this paper, we have chosen to model the effects of the Home Instruction for Parents of Preschool Youngsters (HIPPY) program, one of seven programs identified by HHS as an evidence-based model. The goal of the HIPPY program, offered when children are age 3 to 5, is to effectively train parents to be their child’s first teacher. Families enrolled in HIPPY receive biweekly home visits from a paraprofessional for 30 weeks out of the year, along with biweekly group meetings. Families are given books and toys, along with instruction on how to use the materials for teaching.
In an RCT evaluation of the HIPPY program in New York, children of families enrolled in HIPPY scored 0.75 standard deviations above control students on reading assessments and 0.68 standard deviations above control students on teacher assessments of classroom adaptation in the one-year follow-up when children were in first grade (Baker, Piotrkowski, and Brooks-Gunn 1998).7
From this evaluation, we know that training parents to teach their children using books and toys led to an improvement in their child’s reading scores and behavior in the classroom. This model is especially useful for examining the effects of parenting because the HIPPY home visitors worked with the parents, not the children, and for many home visits, children were not even present (Baker, Piotrkowski, and Brooks-Gunn 1999). Thus the evaluation of HIPPY demonstrates the potential for an approach that solely targets parenting.
Families enrolled in this study were low-income, roughly one third reported public assistance as their primary income, and two-thirds of families were non-white.
We simulate how these short term effects can translate into effects for children later in life, up to and including high school. Our modeling predicts that if all low-income families were enrolled in HIPPY, three percent more low-income children would graduate from high school and six percent fewer would become teen parents.
7 These findings were not replicated in a later cohort in the same study and thus should be cautiously interpreted. Authors found no differences between cohorts that could explain the failure of replication (Baker, Piotrkowski, and Brooks-Gunn 1999).
September 8, 2013 16
Table 4. Simulated Effects of HIPPY for Low-Income Children
Pre-
Intervention Post-
Intervention Change
Early Childhood
Standardized Math Score -0.37 -0.37 0.00
Standardized Reading Score -0.38 0.37 0.75
Standardized Antisocial Behavior Score -0.20 -0.20 0.00
Standardized Hyperactivity Score -0.24 0.44 0.68
Middle Childhood
Standardized Math Score -0.34 -0.16 0.19
Standardized Reading Score -0.32 -0.02 0.30
Standardized Antisocial Behavior Score -0.26 -0.18 0.07
Standardized Hyperactivity Score -0.19 0.08 0.26
Adolescence
Percent Graduating from High School 75.4% 77.5% 3%
Percent Becoming Teen Parents 21.1% 20.0% -6%
Percent Convicted of a Crime 21.1% 20.9% -1%
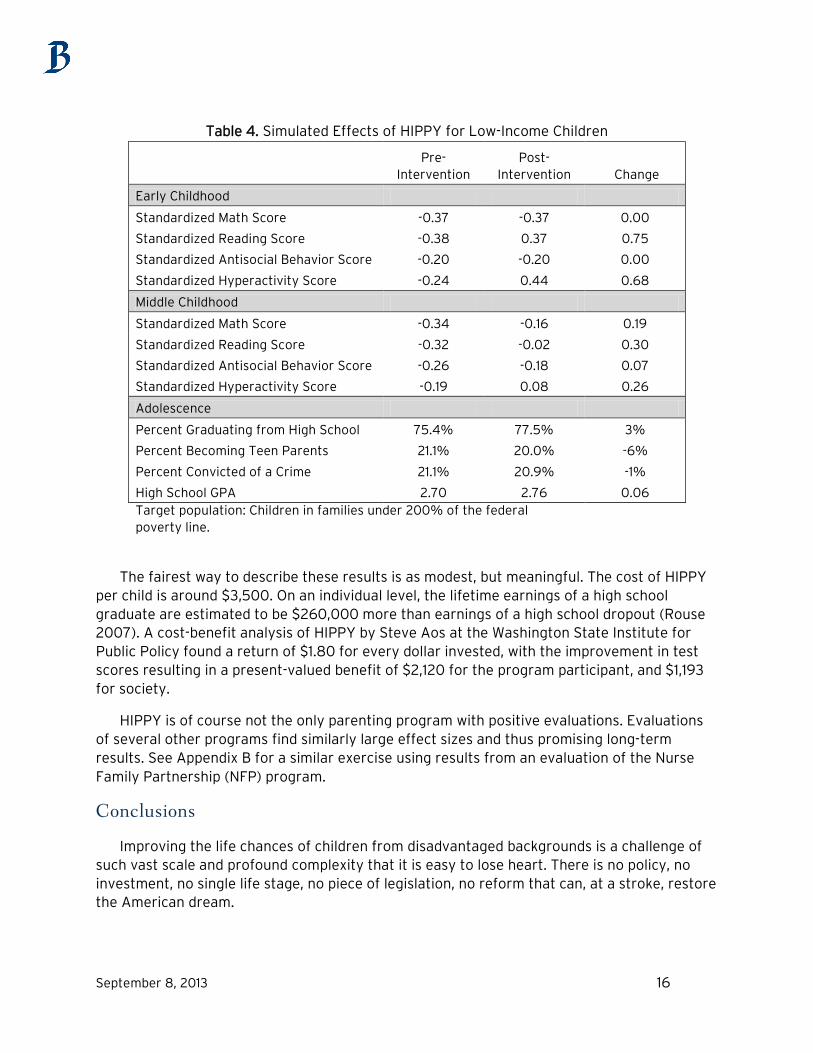
High School GPA 2.70 2.76 0.06 Target population: Children in families under 200% of the federal poverty line.
The fairest way to describe these results is as modest, but meaningful. The cost of HIPPY per child is around $3,500. On an individual level, the lifetime earnings of a high school graduate are estimated to be $260,000 more than earnings of a high school dropout (Rouse 2007). A cost-benefit analysis of HIPPY by Steve Aos at the Washington State Institute for Public Policy found a return of $1.80 for every dollar invested, with the improvement in test scores resulting in a present-valued benefit of $2,120 for the program participant, and $1,193 for society.
HIPPY is of course not the only parenting program with positive evaluations. Evaluations of several other programs find similarly large effect sizes and thus promising long-term results. See Appendix B for a similar exercise using results from an evaluation of the Nurse Family Partnership (NFP) program.
Conclusions
Improving the life chances of children from disadvantaged backgrounds is a challenge of such vast scale and profound complexity that it is easy to lose heart. There is no policy, no investment, no single life stage, no piece of legislation, no reform that can, at a stroke, restore the American dream.
September 8, 2013 17
It will take concerted, determined, decades-long action on a whole range of fronts to move the mobility needle. Much of the necessary change is in any case beyond the reach of public policy.
But there are things we can do, and therefore things we should do in order to improve the prospects for our least lucky children. Tackling the parenting gap is on that list. Not because it is quick or easy; it is slow, patient work.
Currently, the U.S. spends significantly more on pre-K education than on parenting programs. In the last 5 years (2009-2013), the federal government has allocated $37.5 billion to Head Start, 25 times the $1.5 billion that it has allocated to evidence-based home visiting programs over the next five years. The Obama administration is proposing an increase in investments on both. But the relative weight of policy remains strongly on the side of supplementing parenting, rather than improving parenting. The analysis presented in this paper suggests that parenting may be worthy of a greater share of public investment. There is strong evidence that parenting influences child outcomes, and some evidence that good programs can improve parenting.
We have to be honest. Programs to improve parenting are currently patchy in quality, at best. Many seem to be a waste of public money at a time when every dollar counts, and must be accounted for. But there are others proven to work: not as miracle cures, but as authentic contributions to a healthier and fairer society.
September 8, 2013 18
Appendix A: The Social Genome Model
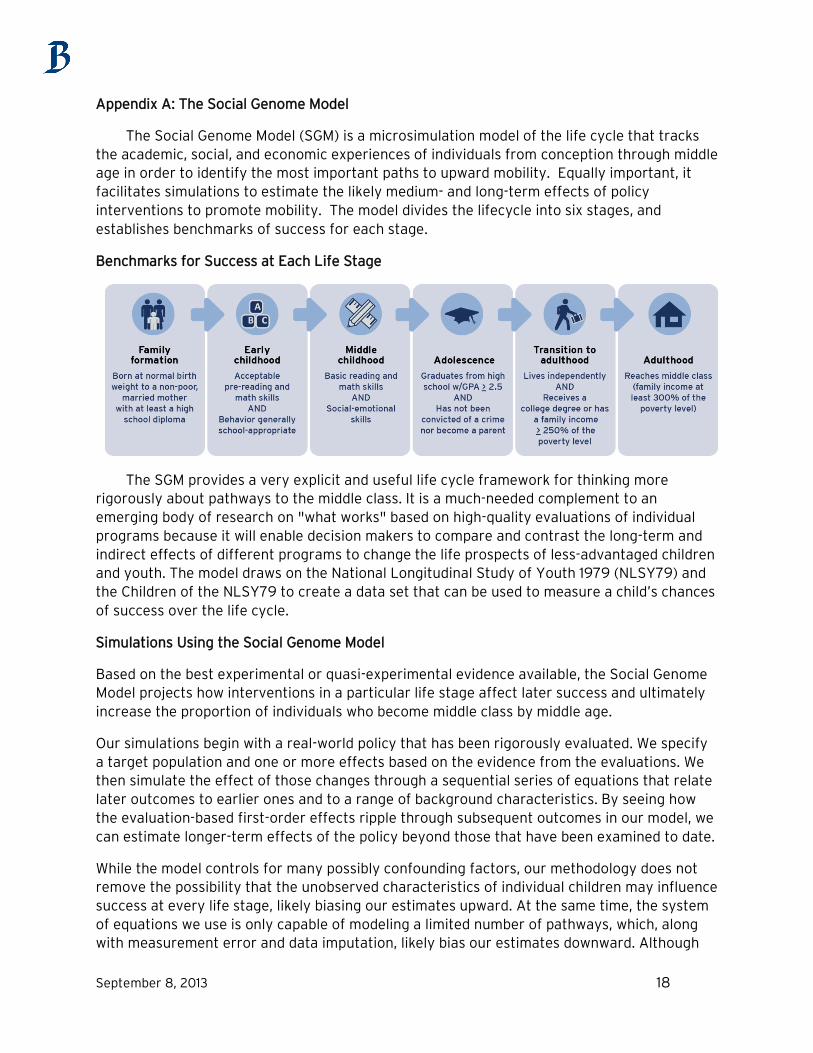
The Social Genome Model (SGM) is a microsimulation model of the life cycle that tracks the academic, social, and economic experiences of individuals from conception through middle age in order to identify the most important paths to upward mobility. Equally important, it facilitates simulations to estimate the likely medium- and long-term effects of policy interventions to promote mobility. The model divides the lifecycle into six stages, and establishes benchmarks of success for each stage.
Benchmarks for Success at Each Life Stage
The SGM provides a very explicit and useful life cycle framework for thinking more rigorously about pathways to the middle class. It is a much-needed complement to an emerging body of research on "what works" based on high-quality evaluations of individual programs because it will enable decision makers to compare and contrast the long-term and indirect effects of different programs to change the life prospects of less-advantaged children and youth. The model draws on the National Longitudinal Study of Youth 1979 (NLSY79) and the Children of the NLSY79 to create a data set that can be used to measure a child’s chances of success over the life cycle.
Simulations Using the Social Genome Model
Based on the best experimental or quasi-experimental evidence available, the Social Genome Model projects how interventions in a particular life stage affect later success and ultimately increase the proportion of individuals who become middle class by middle age.
Our simulations begin with a real-world policy that has been rigorously evaluated. We specify a target population and one or more effects based on the evidence from the evaluations. We then simulate the effect of those changes through a sequential series of equations that relate later outcomes to earlier ones and to a range of background characteristics. By seeing how the evaluation-based first-order effects ripple through subsequent outcomes in our model, we can estimate longer-term effects of the policy beyond those that have been examined to date.
While the model controls for many possibly confounding factors, our methodology does not remove the possibility that the unobserved characteristics of individual children may influence success at every life stage, likely biasing our estimates upward. At the same time, the system of equations we use is only capable of modeling a limited number of pathways, which, along with measurement error and data imputation, likely bias our estimates downward. Although
September 8, 2013 19
the model could be improved, and our estimates should be considered somewhat preliminary as a result, the model provides plausible estimates of how short-term treatment effects compound over time while avoiding the resource and time constraints of much longer-term randomized controlled trials. For more information about the model and how the simulations work, see “Guide to the Brookings Social Genome Model” (Winship and Owen 2013).
September 8, 2013 20
Appendix B: Modeling the NFP Program
Nurse Family Partnership is a large, well-known program with decades of evaluations. The program consists of frequent home visits for first-time, low-income mothers, to encourage healthy prenatal behavior; provide life coaching for the mother, including planning of future pregnancies; improve awareness of developmental milestones; and teach parenting techniques.
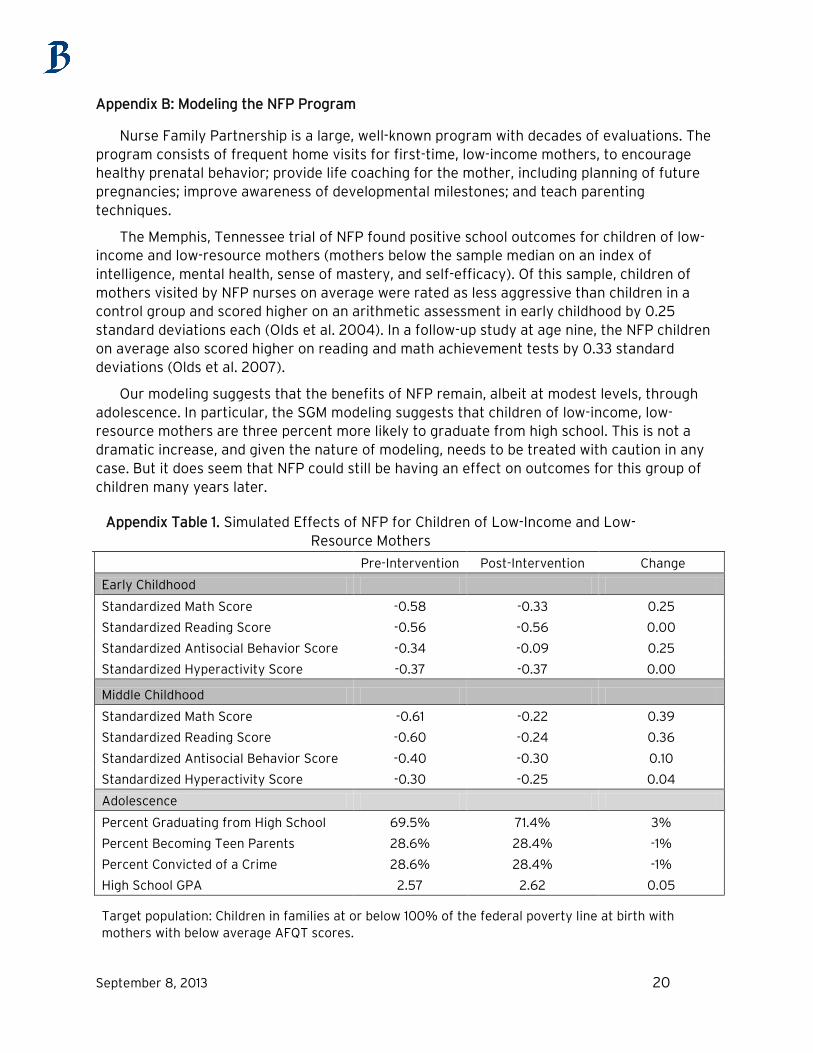
The Memphis, Tennessee trial of NFP found positive school outcomes for children of low-income and low-resource mothers (mothers below the sample median on an index of intelligence, mental health, sense of mastery, and self-efficacy). Of this sample, children of mothers visited by NFP nurses on average were rated as less aggressive than children in a control group and scored higher on an arithmetic assessment in early childhood by 0.25 standard deviations each (Olds et al. 2004). In a follow-up study at age nine, the NFP children on average also scored higher on reading and math achievement tests by 0.33 standard deviations (Olds et al. 2007).
Our modeling suggests that the benefits of NFP remain, albeit at modest levels, through adolescence. In particular, the SGM modeling suggests that children of low-income, low-resource mothers are three percent more likely to graduate from high school. This is not a dramatic increase, and given the nature of modeling, needs to be treated with caution in any case. But it does seem that NFP could still be having an effect on outcomes for this group of children many years later.
Appendix Table 1. Simulated Effects of NFP for Children of Low-Income and Low-Resource Mothers
Pre-Intervention Post-Intervention Change
Early Childhood
Standardized Math Score -0.58 -0.33 0.25
Standardized Reading Score -0.56 -0.56 0.00
Standardized Antisocial Behavior Score -0.34 -0.09 0.25
Standardized Hyperactivity Score -0.37 -0.37 0.00
Middle Childhood
Standardized Math Score -0.61 -0.22 0.39
Standardized Reading Score -0.60 -0.24 0.36
Standardized Antisocial Behavior Score -0.40 -0.30 0.10
Standardized Hyperactivity Score -0.30 -0.25 0.04
Adolescence
Percent Graduating from High School 69.5% 71.4% 3%
Percent Becoming Teen Parents 28.6% 28.4% -1%
Percent Convicted of a Crime 28.6% 28.4% -1%
High School GPA 2.57 2.62 0.05
Target population: Children in families at or below 100% of the federal poverty line at birth with mothers with below average AFQT scores.
September 8, 2013 21
References
Aos, Steve, Roxanne Lieb, Jim Mayfield, Marna Miller, and Annie Pennucci. 2004. Benefits and Costs of Prevention and Early Intervention Programs for Youth. Olympia, WA: Washington State Institute for Public Policy.
Baker, Amy J.L., Chaya S. Piotrkowski, and Jeanne Brooks-Gunn. 1998. “The Effects of the Home Instruction Program for Preschool Youngsters (HIPPY) on Children’s School Performance at the End of the Program and One Year Later.” Early Childhood Research Quarterly 13(4): 571-588.
Baker, Amy J.L., Chaya S. Piotrkowski, and Jeanne Brooks-Gunn. 1999. “The Home Instruction Program for Preschool Youngsters (HIPPY)” The Future of Children 9(1): 116-133.
Baumrind, Diana and Allen E. Black 1967. “Socialization Practices Associated with Dimensions of Competence in Preschool Boys and Girls.” Child Development 38(2): 291-327.
Baumrind, Diana. 1991. “The Influence of Parenting Style on Adolescent Competence and Substance Abuse.” Journal of Early Adolescence 11(1):56-95.
Berger, Lawrence M., Marla McDaniel, and Christina Paxson. 2006. “How Does Race Influence Judgments about Parenting?” Focus 24(2): 24-30.
Brooks-Gunn, Jeanne and Lisa B. Markman. 2005. “The Contribution of Parenting to Ethnic and Racial Gaps in School Readiness.” In The Future of Children 15(1): 139-168.
Caplan, Bryan. 2011. Selfish Reasons to Have More Kids: Why Being a Great Parent is Less Work and More Fun than You Think. New York: Basic Books.
Furstenberg, Frank. 2011. “The Challenges of Finding Causal Links between Family Educational Practices and Schooling Outcomes.” In Whither Opportunity, edited by Greg J. Duncan and Richard J. Murnane, 465-482. New York: Russell Sage Foundation.
Harris, Judith Rich. 1998. The Nurture Assumption: Why Children Turn Out the Way They Do. New York, NY: Free Press.
Hart, Betty and Todd R. Risley. 1995. Meaningful Differences in the Everyday Experiences of Young American Children. Baltimore, MD: Paul H. Brookes Publishing Co.
Kalil, Ariel, Rebecca Ryan, and Michael Corey. 2012. “Diverging Destinies: Maternal Education and the Developmental Gradient in Time with Children.” Demography, 49(4), 1361-1383.
Linver, Miriam R., Jeanne Brooks-Gunn, and Natasha Cabrera. 2004. “The Home Observation for Measurement of the Environment (HOME) Inventory: The Derivation of Conceptually Designed Subscales.” Parenting: Science and Practice 4(2,3): 99-114.
Maccoby, Eleanor E. 2000. “Parenting and Its Effects on Children: On Reading and Misreading Behavior Genetics.” Annual Review of Psychology 51:1-27.
September 8, 2013 22
Mbwana, Kassim, Mary Terzian, and Kristin A. Moore. 2009. “What Works for Parent Involvement Programs for Children: Lessons from Experimental Evaluations of Social Interventions.” Child Trends FactSheet Publication #2009-47.
Meaney, Michael J. 2001. “Maternal Care, Gene Expression, and the Transmission of Individual Differences in Stress Reactivity across Generations.” Annual Review of Neuroscience 24: 1161-1192.
Mott, Frank L. 2004. “The Utility of the HOME-SF Scale for Child Development Research in a Large National Longitudinal Survey: The National Longitudinal Survey of Youth 1979 Cohort.” Parenting: Science and Practice 4(2,3): 259-270.
Murnane, Richard J., John B. Willett, Kirsten L. Bub, and Kathleen McCartney. 2006. “Understanding Trends in the Black-White Achievement Gaps during the First Years of School.” Brookings-Wharton Papers on Urban Affairs.
Olds, David L., Harriet Kitzman, Robert Cole, JoAnn Robinson, Kimberly Sidora, Dennis W. Luckey, et al. 2004. “Effects of Nurse Home-Visiting on Maternal Life Course and Child Development: Age 6 Follow-Up Results of a Randomized Trial.” Pediatrics, 114(6), 1550–1559.
Olds, David L., Harriet Kitzman, Carole Hanks, Robert Cole, Elizabeth Anson, Kimberly Sidora-Arcoleo, et al. 2007. “Effects of Nurse Home Visiting on Maternal and Child Functioning: Age-9 Follow-up of a Randomized Trial.” Pediatrics 120(4): 832-845.
Pew Center on the States. 2011. States and the New Federal Home Visiting Initiative: An Assessment from the Starting Line. Washington, DC: Pew Charitable Trusts.
Phillips, Meredith. 2011. “Parenting, Time Use, and Disparities in Academic Outcomes.” In Whither Opportunity, edited by Greg J. Duncan and Richard J. Murnane, 207-228. New York: Russell Sage Foundation.
Puma, Michael, Stephen Bell, Ronna Cook, Camilla Heid, Pam Broene, Frank Jenkins, et al. 2012. “Third Grade Follow-Up to the Head Start Impact Study Final Report.” OPRE Report #2012-45. Washington, DC: Administration for Children and Families, U.S. Department of Health and Human Services.
Putnam, Robert. 2012, June 29. “Requiem for the American Dream? Unequal Opportunity in America.” Aspen, CO: Address at the Aspen Ideas Festival 2012.
Reardon, Sean. 2011. “The Widening Academic Achievement Gap between the Rich and the Poor: New Evidence and Possible Explanations.” In Whither Opportunity, edited by Greg J. Duncan and Richard J. Murnane, 91-116. New York: Russell Sage Foundation.
Rouse, Cecilia Elena. 2007. “The Labor Market Consequences of an Inadequate Education,” in The Price We Pay: The Economic and Political Consequences of Inadequate Education, edited by Clive Belfield and Henry M. Levin. Washington, DC: Brookings Institution Press.
Sacerdote, Bruce. 2007. “How Large are the Effects from Changes in Family Environment? A Study of Korean American Adoptees.” The Quarterly Journal of Economics, 122(1): 119-157.
September 8, 2013 23
Sawhill, Isabel V., Scott Winship, and Kerry Searle Grannis. 2012. “Pathways to the Middle Class: Balancing Personal and Public Responsibilities.” Washington, DC: The Brookings Institution.
Sroufe, Alan L. 2002. “From Infant Attachment to Promotion of Adolescent Autonomy: Prospective, Longitudinal Data on the Role of Parents in Development.” In Parenting and the Child’s World, edited by John G. Borkowski, Sharon Landesman Ramey and Marie Bristol-Power, 187-202. New Jersey: Lawrence Erlbaum Associates.
Tough, Paul. 2012. How Children Succeed: Grit, Curiosity, and the Hidden Power of Character. New York: Houghton Mifflin Harcourt.
Waldfogel, Jane and Elizabeth Washbrook. 2011. “Income-Related Gaps in School Readiness in the United States and United Kingdom.” In Persistence, Privilege, and Parenting: The Comparative Study of Intergenerational Mobility, edited by Timothy Smeeding, Robert Erikson, and Markus Jantti. 175-208. New York: Russell Sage Foundation.
Winship, Scott and Stephanie Owen. 2013. “Guide to the Brookings Social Genome Model.” Washington, DC: The Brookings Institution.