Embed Size (px)
DESCRIPTION
Adaptive QoS Control Based on Benefit Optimization for Video Servers Providing Differential Services Ing-Ray Chen, Sheng-Yun Li, I-Ling Yen Presented by YunXian Zhou Yili Zhang. Introduction. Issue: video streaming over Internet the deployment of broadband technologies and services. - PowerPoint PPT Presentation
Citation preview

Adaptive QoS Control Based on Benefit Optimization for Video Servers
Providing Differential Services
Ing-Ray Chen, Sheng-Yun Li, I-Ling Yen
Presented by
YunXian ZhouYili Zhang
Introduction
Issue: video streaming over Internet
the deployment of broadband technologies and services

Introduction (cont)
Goal: use efficient QoS control schemes explore multiplexing benefits in bandwidth
management deal with the exponential growth of users
demanding streaming services over Internet
Introduction (cont)
Focus on the server end: optimize disk bandwidth allocations by means of admission control and data
placement schemes Goal reduce the overall cost per request maximize the maximum number of
concurrent requests with QoS guarantees

Introduction (cont)
Other research efforts: deal with mixed workloads by means of admission control and disk
scheduling mechanisms

Literature Review Lee and Sabata: benefit functions and resource demand functions
associated with application requests each application has a dimension of QoS
requirements and its "benefit" values use benefit optimization to design QoS admission
control Key design: a portion of the resources is reserved
to serve requests with degraded QoS.

Literature Review (cont)
Shortcoming: no dynamic resource reservation scheme for a
maximized system benefit require each application to supply a benefit
function based on QoS levels of the system.

Literature Review (cont)Cheng et al.: priority-based admission control algorithms benefit value associated with each user based on
QoS offered by server introduce "penalty" for rejections high priority requests served with highest QoS
level low priority requests can have a range of QoS
levels for flexibility.

Literature Review (cont)
Shortcoming: based on hypothetical QoS levels with no
real data support.

This paper A new periodic greedy reservation
algorithm
Goal: optimize benefit throughput
benefit throughput: amount of benefit values earned per time unit

Contributions of this paper
true QoS characteristics of a video server with real data support
benefit throughput is theoretically derived from algorithms, given the benefit/penalty and input traffic information of requests

Contributions of this paper (cont) Algorithms are executed at run time utilizing the
theoretical results obtained at static time
adjust the resource allocation greedily and periodically to optimize benefit throughput dynamically
a full disk simulation model for a video server to evaluate the merit of various algorithms

Background and System Model
Assumptions:1. Single disk with multiple video titles such as Star Wars, each
video title has 3 QoS versions: MPEG, H.263, H.261 Generally, the more bandwidth a video coding scheme consumes, the better
video quality users can get. MPEG-1: 1.5Mbps; Better quality because its DCT coefficients are kept,
quantization step is small so fidelity is larger H.263 & H.261: support real time video coding; H.263 supports more
format sizes (88*72) than H.261 and it can use half pixel resolution for motion prediction. H.263 operates at a transmission rate <64Kbps while H.261 at 64K*P bps (for ISDN) where 1 <= P <= 32
Basic coding theory: DCT + motion compensation (I-P-B or Intra/Inter frame)

2. We can use CTL/CDL/Hybrid to store and transmit VBR video data• VBR: Variable Bit Rate and it mainly comes from the elimination of time
redundancy and spatial redundancy of video coding• CTL: Constant Time Length and stored block size is proportional to
playback bit rate. • CDL: Constant Data Length and stored block size is constant• Hybrid: Data written in CDL blocks, but different numbers of blocks are
read in each service round according to user playback rate
3. Video service request arrival rate is (change dynamically) and departure rate is (normally a constant)
Background and System Model

Background and System Model4. The disk service cycle time is Tsr, it is larger than or equals to the total disk seek time plus disk read time. Then we get maximum disk blocks allowed for a Tsr
Under statistical admission control, convolve single user pdf curve of
into U users pdf curve of
Find the maximum number of users U
so that the intersection value of u users
pdf curve value and the maximum disk
blocks requested is less than disk overload ratio
When a user departs, resource is released or distributed to other users.
Blocks amount requested by user u in a service round Tsr
Disk seek time per block
Disk read time per block

Background and System Model
5. Baseline QoS control algorithm: QoS level granted to a user is never changed during the service lifetime.
6. Greedy QoS control algorithm: QoS level granted to a user can be raised, but not degraded, during the service lifetime.
7. All video titles stored in the server have same number of QoS levels. Each video title has three file versions stored
8. Each QoS level i is associated with a benefit value . The higher the QoS level, the larger the benefit value. Level 1 is the highest QoS level

Background and System Model
9. The assignment of benefit values to QoS levels is done by service provider
10. The benefit each admitted user brings to the system depends on the QoS received by the user during its service period.
For example:
11. Use a penalty value q to model the effect of rejection

Reservation Algorithms for QoS control
The algorithms are based on resource reservations ni * bi = Bi
We can first partition the resources into multiple parts Bi, one for each QoS level and then compute the benefit throughput for that resource allocation method
The system always admits users into highest QoS region; if resources there are used up, it will admit users into the next QoS region and so on
The benefit throughput value is dictated by the user arrival/departure rate and benefit/penalty functions

Baseline Algorithm
1. For a video title, there are M video versions corresponding to M QoS levels
2. Each QoS level i can admits up to ni users
3. The system behaves as if it contains M queue with size ni, one for each QoS level.
4. Free slots due to user departure are filled with new arrivals only in decreasing order of QoS
5. If free slot can’t be found in any of the queues, the user will be rejected by the server
6. The input arrival rate to QoS level i+1 is spill-over rate from queue i when queue i is full

Baseline Algorithm
i
i
i
i
i
i
i
i
i
i
i
i
i
n
j
j
n
ii
ni
n
ni
n
i
ni
n
iiii
ni
n
i
iiniii
iniinii
j
n
n
n
npppp
np
pppp
pp
12
2
02
2
000
0
2101
)(!
11
)(!
1
!...
!21
!
!...
!2!1
!
...

Baseline Algorithm

Baseline Algorithm
M
j
jM
nM
MM
M
in
j
ji
kin
ki
M
in
j
ji
ini
niii
i
M
in
j
jii
ini
ni
ii
ii
i
i
M
i inii
iiniii
M
iiiniii
M
ii
j
nq
j
kkv
q
j
nn
v
q
jp
nn
ppp
v
qppp
npppv
qnpppv
qv
BT
M
i
i
i
i
i
i
i
i
i
i
i
1
1
1
1
1rej
1
2
2
1rej
10
02
2
00
1rej
10
21
1rej21
1rej
)(!
11
)(!
1
)
)(!
11
)(!
1
)
)(!
11
)!
...2!2
((
)
))(!
11(
)!
...2!2
((
)...
)...2((
))...2((
)i level QoS of throughput(
penaltyrejection users -benefit departure users
How to get best partition set (n1*,n2*,..nM*) that maximizes system benefit
throughput?
Ni is the maximum number of requests at QoS level i that the system is able
to admit statistically when all Tsr is allocated to service requests at this QoS
level only.
ni is the maximum number of slots in QoS level i
Bi is the bandwidth allocated to QoS level i and
bi is the bandwidth of QoS level i allocated to each user request
Baseline Algorithm

Baseline Algorithm
MM
M
i
M
ii
i
MM
i
iM
M
i i
i
MM
MMM
i
ii
MM
M
i
iiM
ii
M
iii
NnnN
NN
N
nN
N
n
bN
bn
bN
bn
bN
bn
B
bn
BbNbNbN
B
bnBBbn
1
1
11
22
22
1 11
11
2211
111
1
1...
...
1)(

Baseline Algorithm
Procedures:
1. Given Tsr, disk seek latency and disk read/write rate, get the maximum data blocks requested for a Tsr cycle
2. Get the pdf of data blocks requested over one Tsr by observation for a single user when accessing a specific version of video data (Assume we are only using baseline algorithm)
3. Convolving the single user pdf into u users pdf curve

Baseline Algorithm
4. Search a maximum value of Ni so that the intersection value of the pdf curve for Ni users with the maximum data blocks value is less than the disk overload ratio. Then we get (N1, N2, N3)
5. Based on the equation (2) in P7, get multiple (n1, n2, n3) and input them as parameters to the Benefit Throughput equation in P6, get the BT value
6. Extract the (n1*, n2*, n3*) under which the BT value is the maximum one

Baseline Algorithm
7. Multiply ni* by the bandwidth requirement of the video version in level i and get the optimal disk bandwidth for that level, then divide it by the total disk bandwidth to get the optimal bandwidth distribution percentage for QoS level i

Baseline Algorithm
QoS level Allocation: i, i+1, i+2
Accommodated users:
n1=3 n2=4 n3=4 total =11
i
i+1
i+2
Bandwidth required for each request: bi = 2*bi+1 = 4*bi+2
Accommodated users:
n1=1 n2=4 n3=12 total=17
For both cases, = total disk bandwidth
22 i
ikk
i
ikkk Bnb

Baseline Algorithm
SPNP model: T_arrival is the arrival event of
user request P_i (i=1,2,3) is the queue for QoS
level i to handle user requests T_departure_i (i=1,2,3) is the
departure event of different QoS levels
P_ti (i=1,2,3) is the transitional place to decide where an incoming request flows to based on the status of current QoS level queue
T_ij (i,j=1,2,3) is the immediate transition
T_rejection is the immediate transition of rejection

Greedy QoS-Control Algorithm
User in lower QoS level is raised to higher level upon a departure in higher QoS level
A departure of a user at level i can trigger a ripple-promotion effect and potentially M-i users can have their QoS levels promoted by one level
Adopt the longest time first policy for fairness The benefit throughput based on baseline QoS control scheme
will become a lower bound for the greedy algorithm

Greedy QoS-Control Algorithm
QoS dynamically redistributed
i
i+1
i+2
Wait another request

Greedy QoS-Control Algorithm

Greedy QoS-Control Algorithm
Petri Net model: To record the elapsed time for each user request, each token should
have additional attributes such as the percentage time spent in each P_i
Add T_21 and T_32 to indicate the QoS adjustment upon a higher QoS level departure. It also take fairness into consideration when selecting a lower level token
The rate for T_departure_i is proportional to the different tokens in P_i with their different departure rate based on their history
It seems not possible to switch to another video format in the middle of video session, instead, some coding scheme such as H.261 can offer different QoS levels automatically by adjusting some parameters such as quantization step, window size, etc.

Periodic and Dynamic Resource Reservation
Procedures:• Assume we are only using baseline algorithm
• Given Tsr, disk seek latency and disk read/write rate, get the maximum data blocks requested for a Tsr cycle
• Get the pdf of data blocks requested over one Tsr by observation for a single user when accessing a specific format/version of video data

Periodic and Dynamic Resource Reservation
• Convolving the single user pdf into u users pdf curve
• Search a maximum value of Ni • the intersection value of the pdf curve for
Ni users with the maximum data blocks value is less than the disk overload ratio.
• get (N1, N2, N3)

Periodic and Dynamic Resource Reservation
• get multiple (n1, n2, n3) sets
• input them as parameters to the Benefit Throughput equation to get the BT values
• Extract the (n1*, n2*, n3*) under which the BT value is the maximum one

Periodic and Dynamic Resource Reservation
• Multiply n1* by the bandwidth requirement of QoS level 1 and get the total disk blocks requested by users at QoS level 1
• divided by Tsr and the total disk bandwidth to get the optimal bandwidth distribution percentage for users at QoS level 1, the same with QoS level 2 and 3 .

Periodic and Dynamic Resource Reservation
• Get the value (n1*, n2*, n3*) for different arrival rate, calculate the corresponding BT based on the equation discussed and get the table.
• Arrival rate can be monitored by observing the number of users arriving at the system over an observation period.
• Periodically query the table to select new value for (n1*, n2*…)

Periodic and Dynamic Resource Reservation

Periodic and Dynamic Resource Reservation
The time complexity to compute (n1*,n2*,……nM*) will be upper bounded by the number of ways to divide NM into M sets subject to equation 2---O((NM)^(M-1))

Periodic and Dynamic Resource Reservation
M is decided by acceptable lowest QoS level i
"time-differentiated" services
in "business" time periods, less QoS levels to guarantee QoS
in "couch" time periods, more QoS levels to accommodate more users

Modeling and Analysis
5 algorithms for comparison Higest-QoS-only (N1,0,0..0) (HQO); Lowest-QoS-only (0,0,..,NM) (LQO); Equal-Share (N1/M,N2/M...NM/M) (ES) Baseline (n1*,n2*,……nM*) Greedy (n1*,n2*,……nM*)

Modeling and Analysis
Disk characteristics: Make: Seagate Capacity: 20G = 512 bytes/sector * 64
sectors/track * 4096 tracks/side * 160 sides Disk seek time and rotational latency :
16.5 msec Read/write rate: 33Mbps

Modeling and Analysis
Disk characteristics and data model:
video title: "Star Wars"; different movie titles are simulated by using different group of picture entry points into the trace files
video formats: MPEG-1, H.263, H.261 for each video title
Modeling and Analysis The disk is filled with video titles randomly
A mapping table to map the data physical location with playback cycles to eliminate extra seek time for video data

Modeling and Analysis Compute N1, N2 and N3
N1=55; N2=197; N3=552

Modeling and AnalysisOptimal (n1*, n2*, ... , nM*) under the Baseline Algorithm
Based on (N1, N2, N3), consider arrival rate at [10, 60], given values for mu, v1,v2,v3, and q, build the table for (n1*, n2*, n3*) and corresponding benefit throughput

Modeling and Analysis

Modeling and Analysis The benefit throughput obtained at the
optimal setting (n1*, n2*, ... , nM*) increases as input arrival rate increases
as input arrival rate exceeds a threshold, the benefit throughput deteriorates because many users are rejected

Part of SPNP program for baseline algorithm
enabling_type en_t_12() { if (mark("P_1") >= n1) return 1; else return 0;}
enabling_type en_t_rejection() { if (mark("P_3") >= n3) return 1; else return 0;}
rate_type dep_rate_1() { return (mark("P_1") * mu);}
enabling_type en_t_11() { if (mark("P_1") < n1) return 1; else return 0;}

Part of SPNP program for baseline algorithm
reward_type X_1(){ return(rate("T_departure_1")); }
reward_type X_rejection() { if ((mark("P_1") == n1) && (mark("P_2") == n2) && (mark("P_3") == n3) ) return lamb1; else return 0.0;}
reward_type X_12() { if ((mark("P_1") == n1)) return lamb1; else return 0.0;}
reward_type X_23() { if ((mark("P_1") == n1) && (mark("P_2") == n2)) return lamb1; else return 0.0;}

Part of SPNP program for baseline algorithm
ac_final() {
pr_expected("departure 1 is ", X_1);
pr_expected("departure 2 is ", X_2);
pr_expected("departure 3 is ", X_3);
pr_expected("rejection is ", X_rejection);
pr_expected("T_12 rate is ", X_12);
pr_expected("T_23 rate is ", X_23);}

Results-1

Results-2
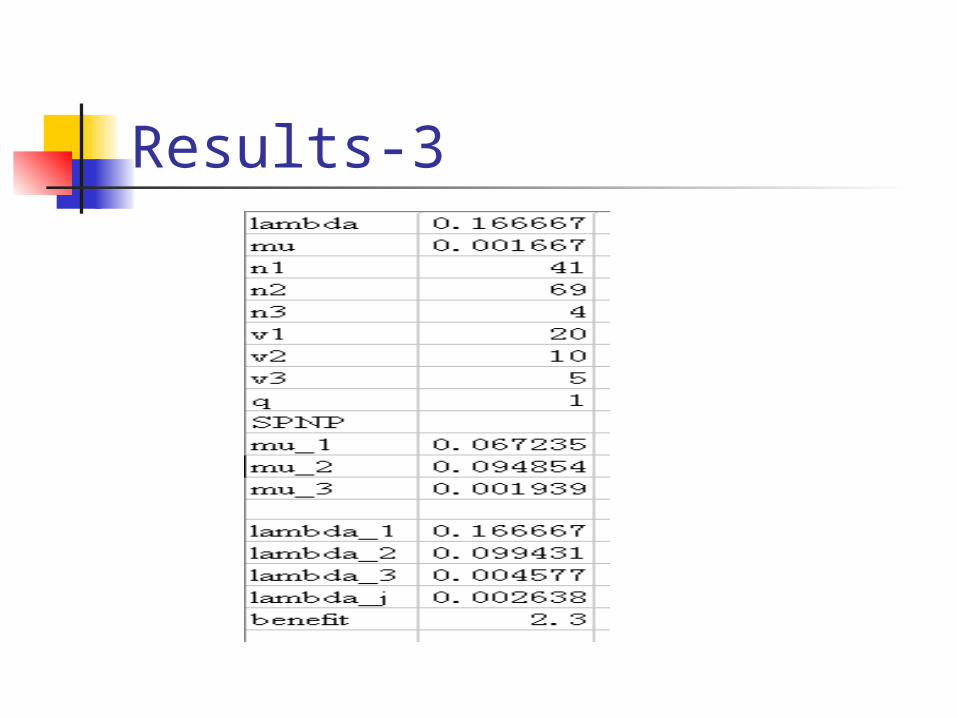
Results-3

Modeling and Analysis Numerical Data

Modeling and Analysis The benefit throughput obtained by the
baseline QoS control algorithm is much better than HQO, LQO, ES.
HQO results in a heavy loss of benefit in all cases except when the system is very lightly loaded.

Modeling and Analysis LQO can perform well only when heavily
loaded
ES falls within HQO, LQO with the benefit throughput obtainable being modest all the time

Simulation validation Develop a single-disk simulator to validate
baseline and greedy algorithms

Simulation validation All admitted requests are arranged in a
scheduled queue in every cycle based on the disk locations of data blocks to be accessed
the disk read/write heads only need to scan the disk in one direction once to collect all the data needed for all streams

Simulation result

Simulation result Greedy algorithm always performs better
than baseline algorithm

Simulation result

Simulation result

Simulation result Greedy algorithm is able to serve more
clients at the highest or medium QoS compared with the baseline algorithm

Simulation result

Simulation result There are fewer clients being served at the lowest
QoS level under the greedy algorithm than the baseline algorithm
The greedy algorithm uses the same optimal (n1*, n2*, n3*) set for QoS control
Baseline and greedy algorithm yield same rejection rate, total number of users, and system throughput

Conclusion Baseline and greedy QoS control algorithms
are based on the concept of resource reservation

Conclusion dynamically re-allocate resources reserved
to requests at different QoS levels to maximize benefit throughput.

Conclusion The greedy algorithm allows the QoS level
to be raised during the service lifetime of users.
The greedy algorithm outperforms other algorithms in terms of the benefit throughput, without sacrificing the performance of the system

Future Work Users may have difference in acceptable
lowest QoS level? Users may have special cost/service
requirement? What if there are multiple disks in the
server? What if video titles do not have same QoS
levels?