Embed Size (px)
Citation preview
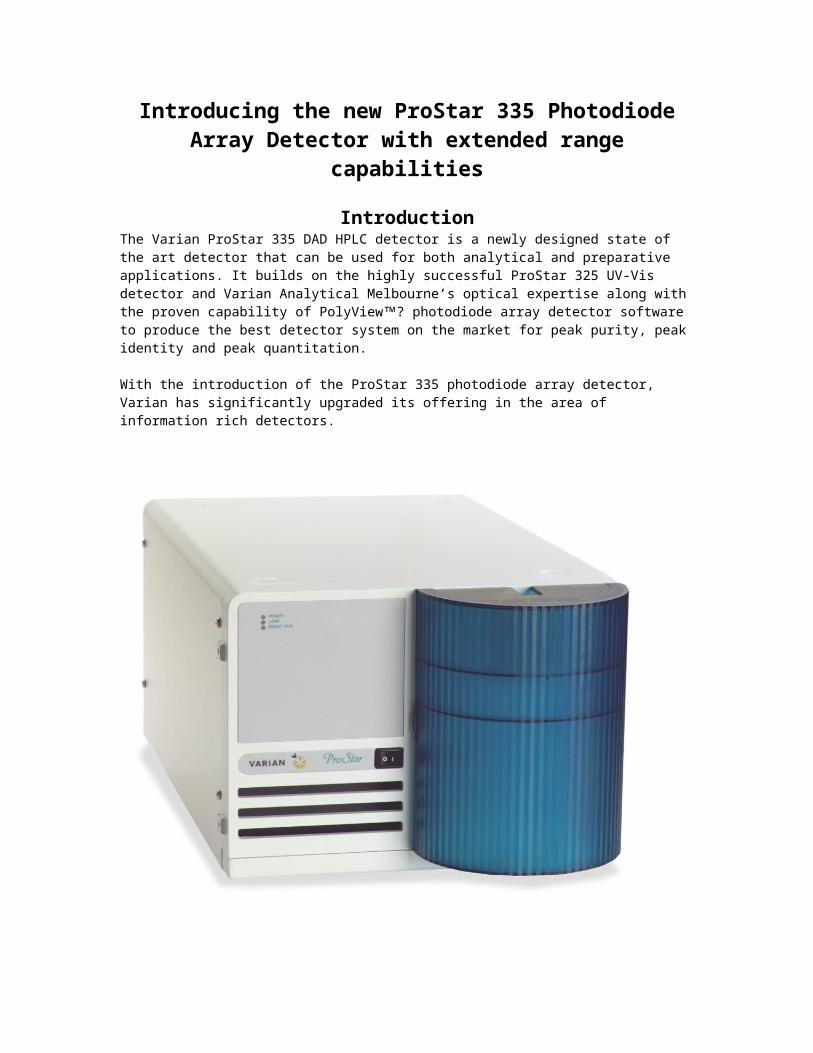
Introducing the new ProStar 335 Photodiode Array Detector with extended range capabilities
IntroductionThe Varian ProStar 335 DAD HPLC detector is a newly designed state of the art detector that can be used for both analytical and preparative applications. It builds on the highly successful ProStar 325 UV-Vis detector and Varian Analytical Melbourne’s optical expertise along with the proven capability of PolyView? photodiode array detector software to produce the best detector system on the market for peak purity, peak identity and peak quantitation.
With the introduction of the ProStar 335 photodiode array detector, Varian has significantly upgraded its offering in the area of information rich detectors.
Figure 1 ProStar 335 detector
The ProStar 335 has many common parts with the ProStar 325 UV-Vis detector. The flow cells, lamps and cables are all the same for both products. In addition, many of the service parts including the main CPU board and the power supply are the same in both products. This commonality allows customers to interchange parts as needed and to stock fewer parts for the product. This commonality also allowed the development and introduction of a new photodiode array detector only nine months after the previous introduction of the ProStar 325. Note, there is one difference on the front panel of the ProStar 335 from the ProStar 325. The square
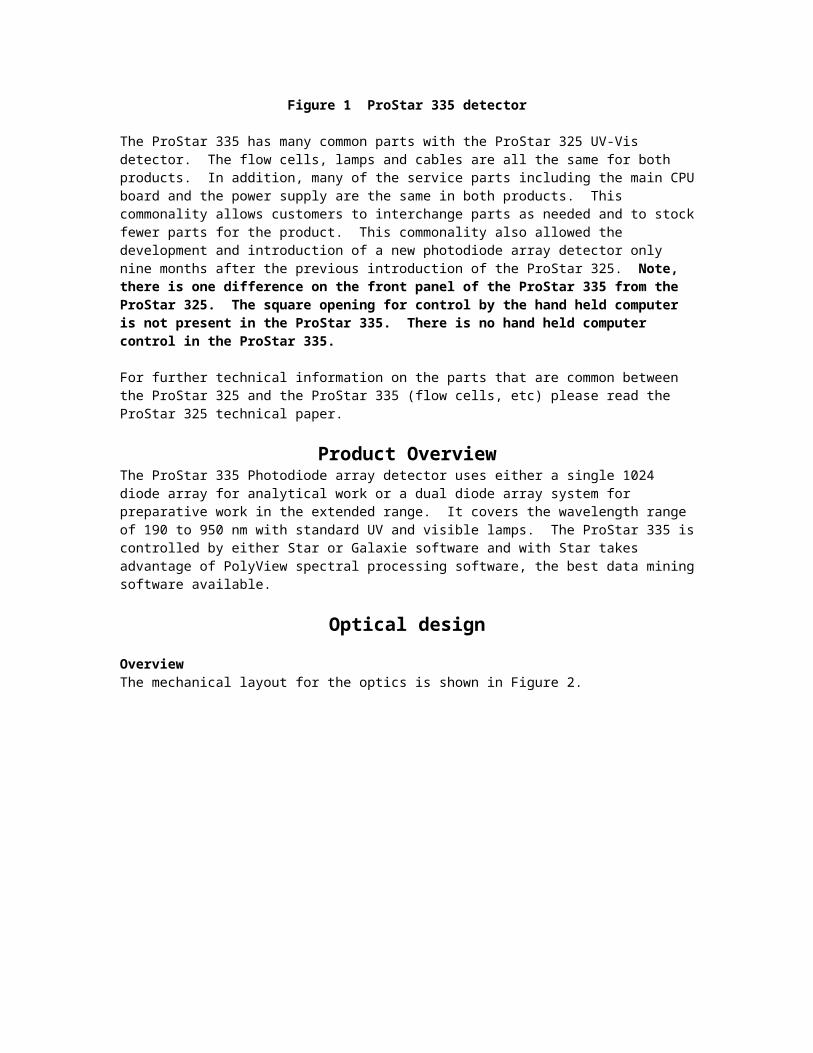
opening for control by the hand held computer is not present in the ProStar 335. There is no hand held computer control in the ProStar 335.
For further technical information on the parts that are common between the ProStar 325 and the ProStar 335 (flow cells, etc) please read the ProStar 325 technical paper.
Product OverviewThe ProStar 335 Photodiode array detector uses either a single 1024 diode array for analytical work or a dual diode array system for preparative work in the extended range. It covers the wavelength range of 190 to 950 nm with standard UV and visible lamps. The ProStar 335 is controlled by either Star or Galaxie software and with Star takes advantage of PolyView spectral processing software, the best data mining software available.
Optical designOverviewThe mechanical layout for the optics is shown in Figure 2.
“Figure 2 Mechanical optical diagramThis is essentially the same layout as the ProStar 325 optics.
LampsThe UV lamp is located at the extreme right hand side of the instrument. It is a deuterium lamp that puts out light from below 190 nm to about 350 nm in significant amounts and then into the visible. It also has intensity peaks at 656 nm and to a lesser extent at 486 nm. It is accessible though the front panel with an interlock to prevent it from being removed from its housing while plugged in. This prevents the operator viewing the UV lamp directly while it is turned on.
The UV lamp is completely enclosed in a large housing to prevent any drafts from affecting the stability of the lamp. This housing is cooled to about 10 °C above ambient temperature by a fan, which pushes air from the rear of the unit through the front door. Keeping the lamp housing cool, allows the rest of the detector to run cooler. The flow cell usually is 2 or 3 C above ambient
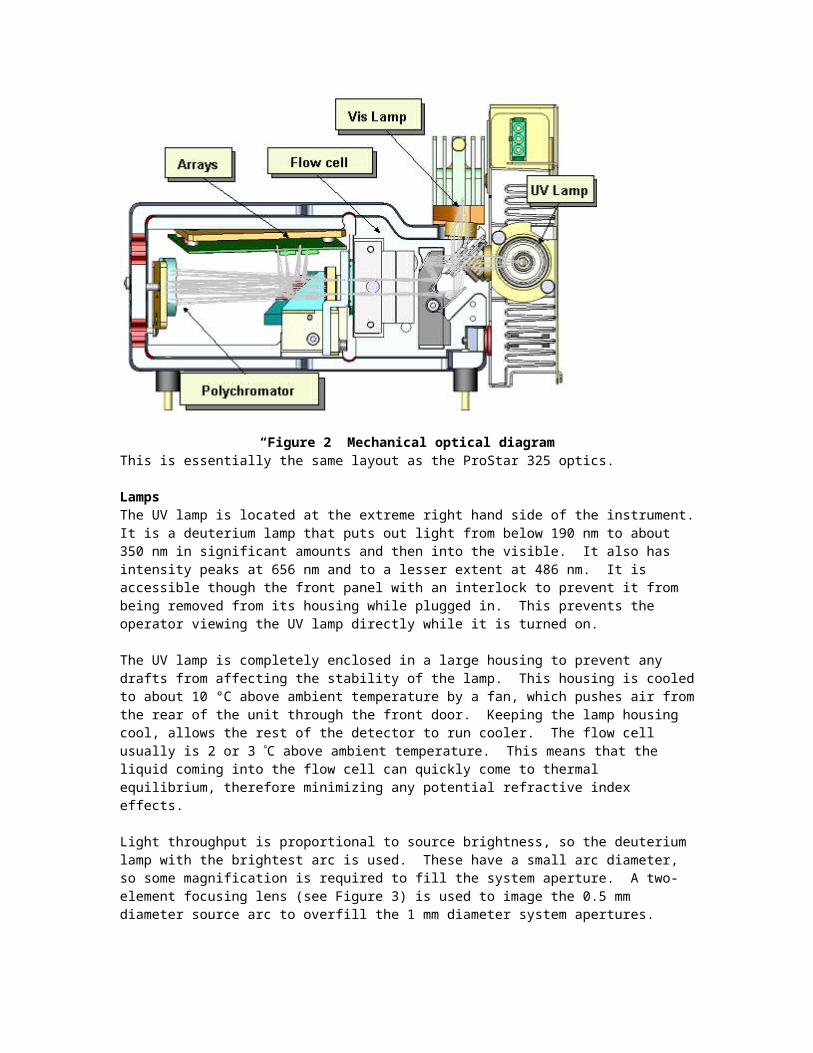
temperature. This means that the liquid coming into the flow cell can quickly come to thermal equilibrium, therefore minimizing any potential refractive index effects.
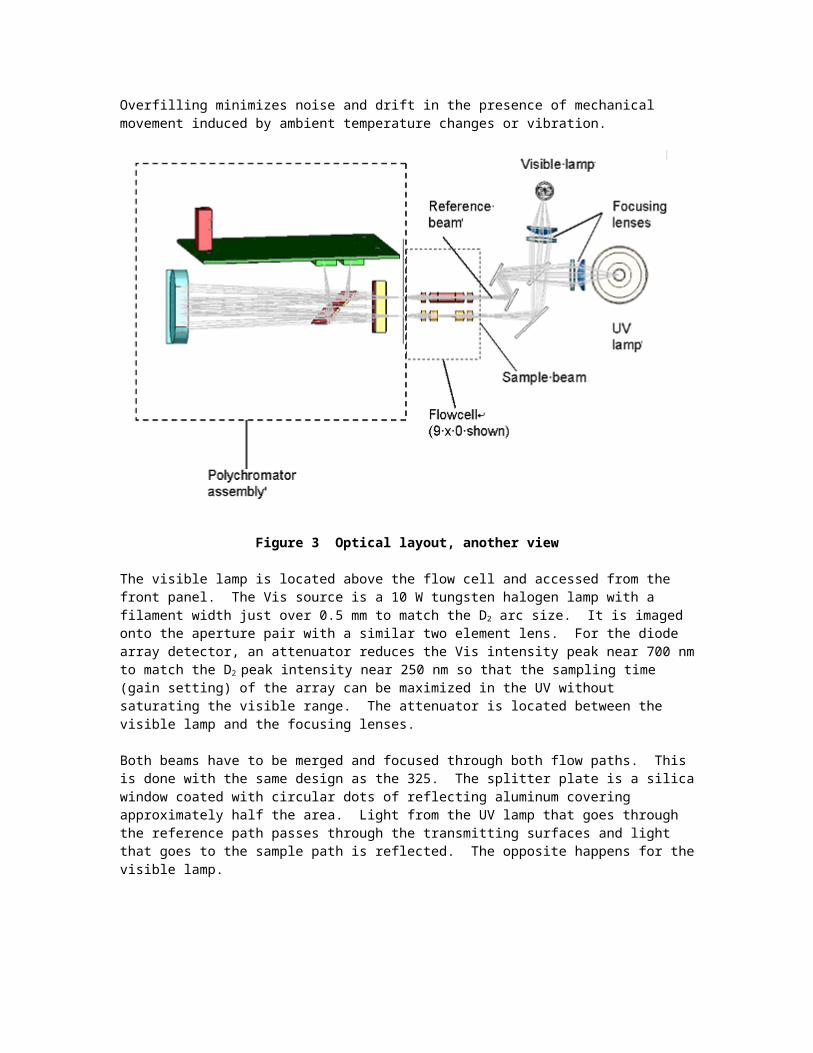
Light throughput is proportional to source brightness, so the deuterium lamp with the brightest arc is used. These have a small arc diameter, so some magnification is required to fill the system aperture. A two-element focusing lens (see Figure 3) is used to image the 0.5 mm diameter source arc to overfill the 1 mm diameter system apertures. Overfilling minimizes noise and drift in the presence of mechanical movement induced by ambient temperature changes or vibration.
Figure 3 Optical layout, another view
The visible lamp is located above the flow cell and accessed from the front panel. The Vis source is a 10 W tungsten halogen lamp with a filament width just over 0.5 mm to match the D2 arc size. It is imaged onto the aperture pair with a similar two element lens. For the diode array detector, an attenuator reduces the Vis intensity peak near 700 nm to match the D2 peak intensity near 250 nm so that the sampling time (gain setting) of the array can be maximized in the UV without saturating the visible range. The attenuator is located between the visible lamp and the focusing lenses.
Both beams have to be merged and focused through both flow paths. This is done with the same design as the 325. The splitter plate is a silica window coated with circular dots of reflecting aluminum covering approximately half the area. Light from the UV lamp that goes through the reference path passes through the transmitting surfaces and light that goes to the sample path is reflected. The opposite happens for the visible lamp.
Flow cell opticsTo get the lowest noise and best linearity, the highest light throughput possible is required. To minimize refractive index effects which cause baseline upsets, the light must not hit the walls of the flow cell.
To ensure the beam is clear of the cell walls, limiting apertures are placed before and after the cell and cell optics. One of these is the polychromator entry mask located on the optics housing just after (to the left of) the flow cell and the other is a mask that precedes the cell and is also mounted on the beam splitter block to the right of the flow cell. There are two apertures on each side of the flow cell, one for the sample side and one for the reference side. These minimize light hitting the cell walls.
To obtain maximum light throughput, the cell imaging is crucial, and occurs when source and aperture images of maximum size are formed at each end of the cell creating a pencil beam that just clears the cell walls. This is very difficult to do mechanically unless the cell windows form part of the imaging system so lenses are used as cell windows.
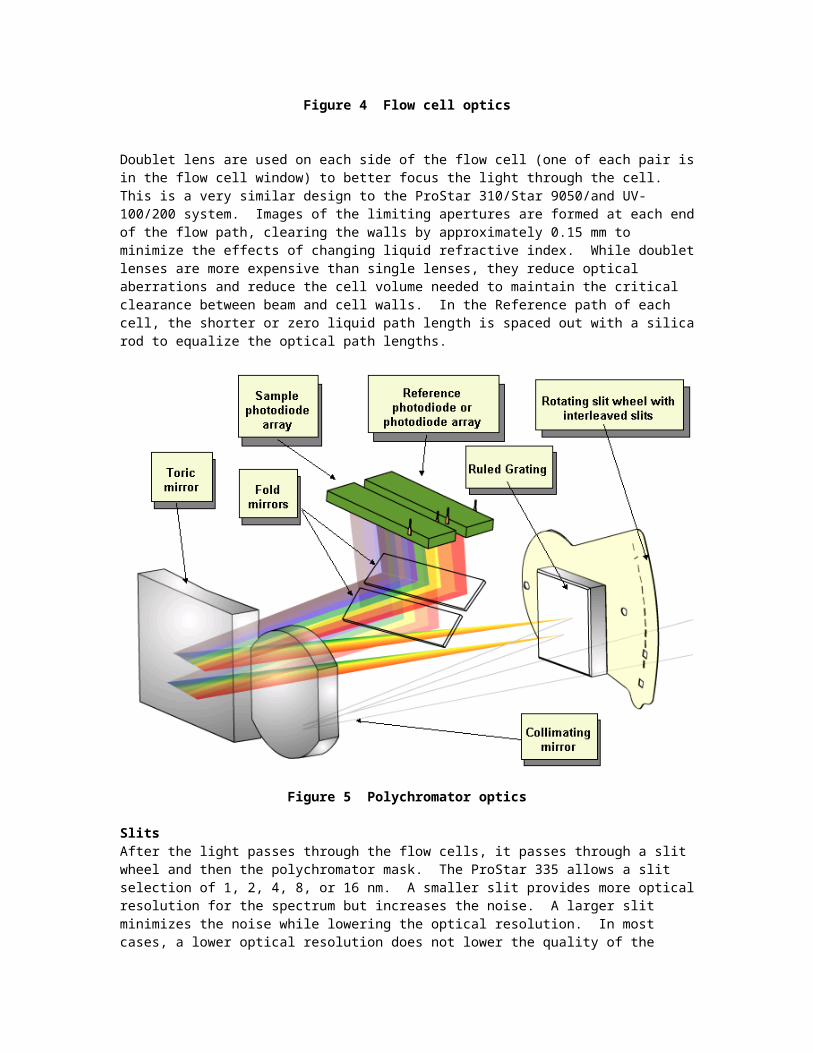
Figure 4 Flow cell optics
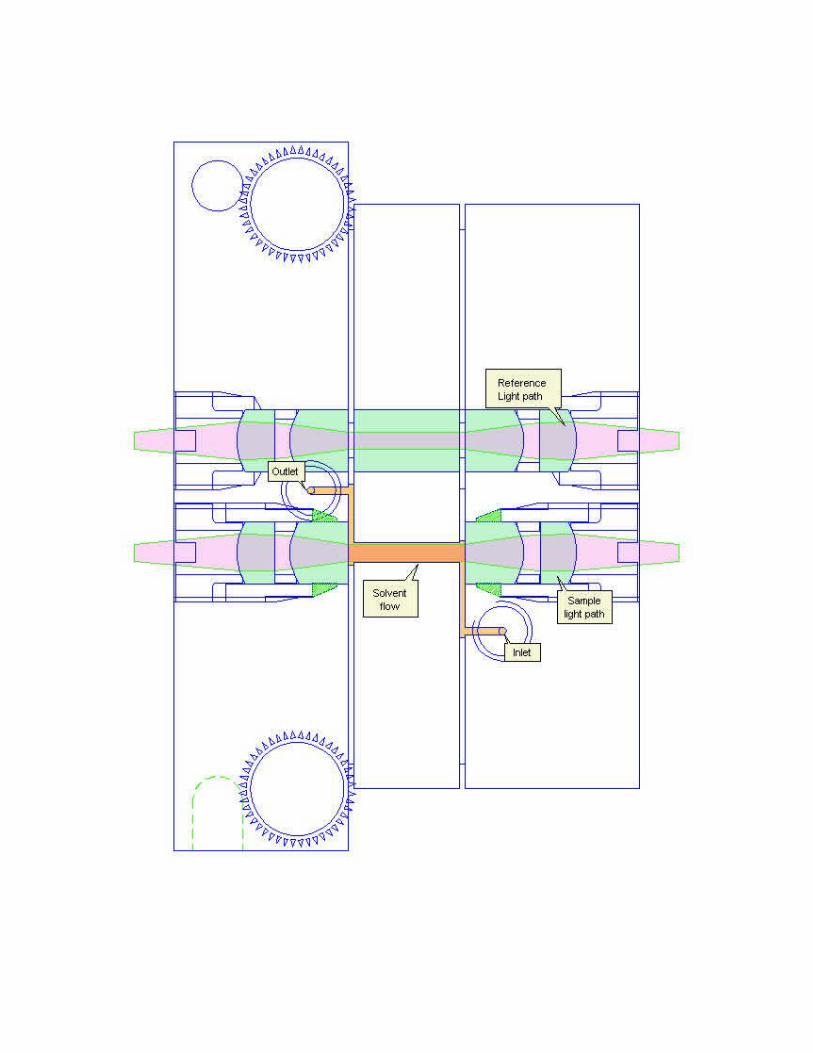
Doublet lens are used on each side of the flow cell (one of each pair is in the flow cell window) to better focus the light through the cell. This is a very similar design to the ProStar 310/Star 9050/and UV-100/200 system. Images of the limiting apertures are formed at each end of the flow path, clearing the walls by approximately 0.15 mm to minimize the effects of changing liquid refractive index. While doublet lenses are more expensive than single lenses, they reduce optical aberrations and reduce the cell volume needed to maintain the critical clearance between beam and cell walls. In the Reference path of each cell, the shorter or zero liquid path length is spaced out with a silica rod to equalize the optical path lengths.
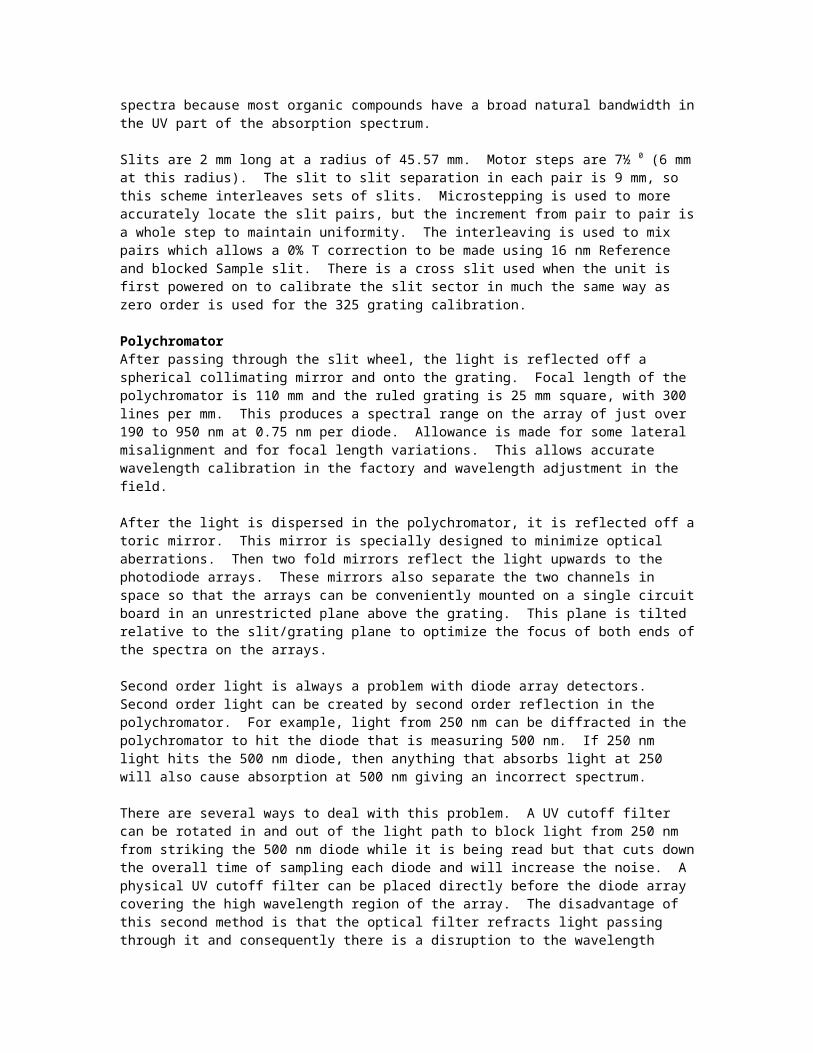
Figure 5 Polychromator optics
SlitsAfter the light passes through the flow cells, it passes through a slit wheel and then the polychromator mask. The ProStar 335 allows a slit selection of 1, 2, 4, 8, or 16 nm. A smaller slit provides more optical resolution for the spectrum but increases the noise. A larger slit minimizes the noise while lowering the optical resolution. In most cases, a lower optical resolution does not lower the quality of the spectra because most organic compounds have a broad natural bandwidth in the UV part of the absorption spectrum.
Slits are 2 mm long at a radius of 45.57 mm. Motor steps are 7½ 0 (6 mm at this radius). The slit to slit separation in each pair is 9 mm, so this scheme interleaves sets of slits. Microstepping is used to more accurately locate the slit pairs, but the increment from pair to pair is a whole step to maintain uniformity. The interleaving is used to mix pairs which allows a 0% T correction to be made using 16 nm Reference and blocked Sample slit. There is a cross slit used when the unit is first powered on to calibrate the slit sector in much the same way as zero order is used for the 325 grating calibration.
PolychromatorAfter passing through the slit wheel, the light is reflected off a spherical collimating mirror and onto the grating. Focal length of the polychromator is 110 mm and the ruled grating is 25 mm square, with 300 lines per mm. This produces a spectral range on the array of just over 190 to 950 nm at 0.75 nm per diode. Allowance is made for some lateral misalignment and for focal length variations. This allows accurate wavelength calibration in the factory and wavelength adjustment in the field.
After the light is dispersed in the polychromator, it is reflected off a toric mirror. This mirror is specially designed to minimize optical aberrations. Then two fold mirrors reflect the light upwards to the photodiode arrays. These mirrors also separate the two channels in space so that the arrays can be conveniently mounted on a single circuit board in an unrestricted plane above the grating. This plane is tilted relative to the slit/grating plane to optimize the focus of both ends of the spectra on the arrays.
Second order light is always a problem with diode array detectors. Second order light can be created by second order reflection in the polychromator. For example, light from 250 nm can be diffracted in the polychromator to hit the diode that is measuring 500 nm. If 250 nm light hits the 500 nm diode, then anything that absorbs light at 250 will also cause absorption at 500 nm giving an incorrect spectrum.
There are several ways to deal with this problem. A UV cutoff filter can be rotated in and out of the light path to block light from 250 nm from striking the 500 nm diode while it is being read but that cuts down the overall time of sampling each diode and will increase the noise. A physical UV cutoff filter can be placed directly before the diode array covering the high wavelength region of the array. The disadvantage of this second method is that the optical filter refracts light passing through it and consequently there is a disruption to the wavelength scale at that region of the spectrum corresponding to the transition between the filter and the unobstructed light path.
Varian, Inc. has developed a new approach to solving this problem. This is called Seamless Spectral Coverage Technology (Patent applied for). The optical transmission characteristics of the window are not uniform but are specifically varied so that only light having wavelengths lying in an appropriate wavelength range can pass through and be detected. An interference filter having the required light transmission characteristics is fabricated directly onto the window. This is done by depositing thin films of the required thickness directly onto to window to create the required interference filter. The window is masked prior to the deposition of the film to ensure that the interference filter is fabricated only above those pixels that should receive only those wavelengths that are transmitted by the filter.
Dual and Single arraysThe ProStar 335 is available in two versions, a single array version and a dual array version. The single array version is designed for microbore to analytical work while the dual array is designed for analytical to preparative work. (Using only a single array, lowers the cost of the unit and therefore the price to the customer.)
In the single array unit, the reference is a pair of 2.4 mm square diodes centered on 250 and 600 nm. The size of the diodes gives them a bandwidth of about 72 nm. If only the D2 lamp is on, the 250 nm diode is used as a reference for the whole wavelength range. If only the Vis lamp is on, the 600 nm diode is used over the whole range. If both are on, the 250 nm diode references wavelengths below 400 nm and the 600 nm diode references wavelengths above 400 nm, with "blend region" between the two to reduce spectral artifacts induced by slow wavelength drifts
Optical alignment and calibrationThe optical system is aligned at the factory. This is done in three stages. First, the arrays are positioned in the detector and the deuterium lamp is used to move the arrays to the correct position.
Secondly, a Hg lamp is inserted into the deuterium lamp holder and the detector and the optical components are adjusted to give the best positioning of the spectrum on the array. Various aspects of the optics are adjusted using the Hg lines.
Thirdly, a wavelength calibration is then done using the same Hg arc lamp and the diagnostic software. During this calibration, three Hg lines (253.656, 546.074 and 912.297 nm?) are used as standards. The difference between the diode where each line should be theoretically found and the actual diode at which it is found is determined. This error is then fitted by a quadratic curve and a calibration table is made up relating the diodes to their wavelength. This procedure can be performed by a Varian service person if they have a Hg lamp.
Fine tuning the optical calibrationWhen the lamp is first turned on, the ProStar 335 will go through a procedure that will result in a “fine tuning” of the optical calibration. Once the deuterium lamp is on, the detector will find the 656 nm line of deuterium and adjust the calibration table for any changes in the position of the line. This is done automatically and is not dependent on the solvent in the flow cell or how the cell is aligned although a cell must be in the detector and sufficient light must pass through the system at 656 nm.
Signal ProcessingAfter the light is captured on the photodiode array, it goes through a series of signal processing steps.
1. The diode array is sampled periodically and digital intensity data is produced.2. A correction to this data is made for the dark current.3. Another correction is made for 0%T.4. A filter is used to adjust the digital data to reflect the value of the slit bandwidth.5. The signals from each diode are then converted to wavelengths.6. The digital data is converted to absorbances.7. The response filter is applied to the data.8. A zero absorbance correction is performed9. If the detector is a dual array detector and the flow cell is a prep flow cell and the
absorbance is greater than 0.9 AU, the detector goes into extended range mode.10. The data is bunched together based on the data bunching parameter and the data is sent
to the workstation.
All of these steps are done automatically without any intervention by the user. However some user inputs can affect data processing at several of the steps.
Step 1 – Diode SamplingEach diode array can be sampled 1, 2, 4, 8 or 16 times every 100 msec. The rate is set by how much light intensity is falling on the diode array. The more light that hits the array, the more frequently the array will have to be sampled or else the array will be saturated and problems such as negative peaks or “flat” baselines can occur. If only a small amount of light is hitting the array, the gain on the amplifier will have to be increased to get a larger signal and minimize the noise.
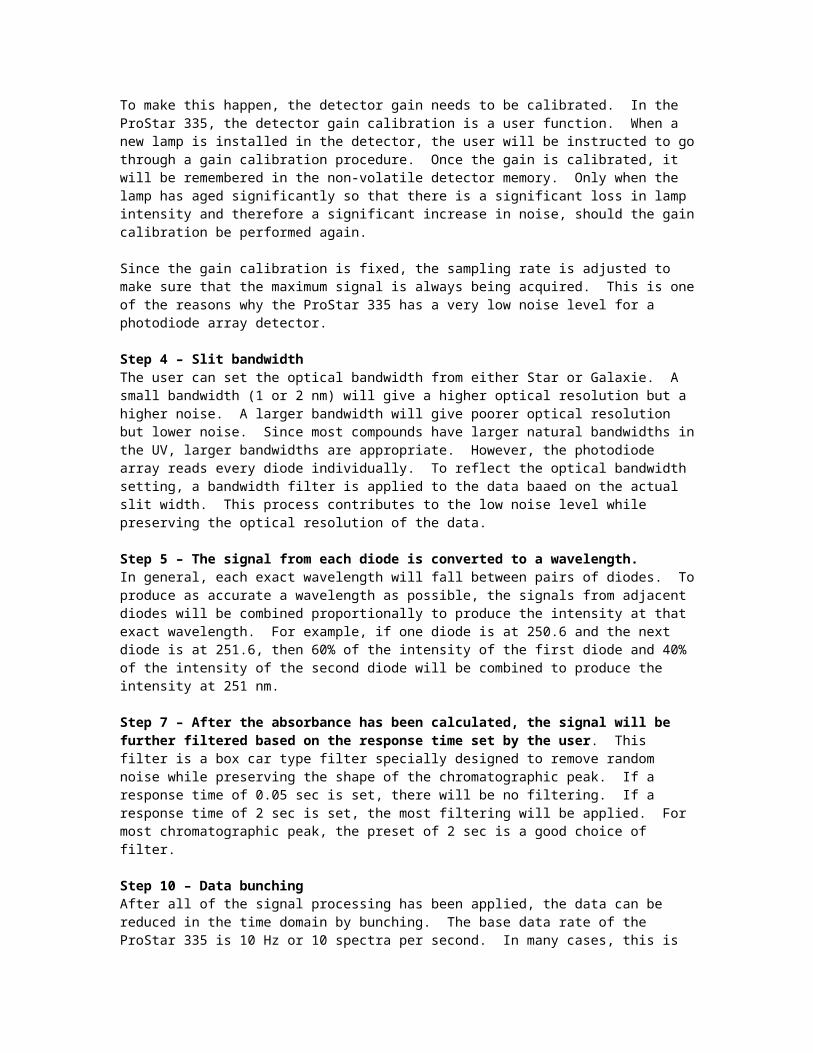
To make this happen, the detector gain needs to be calibrated. In the ProStar 335, the detector gain calibration is a user function. When a new lamp is installed in the detector, the user will be instructed to go through a gain calibration procedure. Once the gain is calibrated, it will be remembered in the non-volatile detector memory. Only when the lamp has aged significantly so that there is a significant loss in lamp intensity and therefore a significant increase in noise, should the gain calibration be performed again.
Since the gain calibration is fixed, the sampling rate is adjusted to make sure that the maximum signal is always being acquired. This is one of the reasons why the ProStar 335 has a very low noise level for a photodiode array detector.
Step 4 – Slit bandwidthThe user can set the optical bandwidth from either Star or Galaxie. A small bandwidth (1 or 2 nm) will give a higher optical resolution but a higher noise. A larger bandwidth will give poorer optical resolution but lower noise. Since most compounds have larger natural bandwidths in the UV, larger bandwidths are appropriate. However, the photodiode array reads every diode individually. To reflect the optical bandwidth setting, a bandwidth filter is applied to the data baaed on the actual slit width. This process contributes to the low noise level while preserving the optical resolution of the data.
Step 5 – The signal from each diode is converted to a wavelength. In general, each exact wavelength will fall between pairs of diodes. To produce as accurate a wavelength as possible, the signals from adjacent diodes will be combined proportionally to produce the intensity at that exact wavelength. For example, if one diode is at 250.6 and the next diode is at 251.6, then 60% of the intensity of the first diode and 40% of the intensity of the second diode will be combined to produce the intensity at 251 nm.
Step 7 – After the absorbance has been calculated, the signal will be further filtered based on the response time set by the user. This filter is a box car type filter specially designed to remove random noise while preserving the shape of the chromatographic peak. If a response time of 0.05 sec is set, there will be no filtering. If a response time of 2 sec is set, the most filtering will be applied. For most chromatographic peak, the preset of 2 sec is a good choice of filter.
Step 10 – Data bunchingAfter all of the signal processing has been applied, the data can be reduced in the time domain by bunching. The base data rate of the ProStar 335 is 10 Hz or 10 spectra per second. In many cases, this is much more data than needed. Good area quantitation can be obtained with as little as 15 points per peak. By using the bunching parameters, the size of the data file and the amount of network traffic can both be reduced significantly.
The flow cellThe same flow cells are used in both the ProStar 325 and he ProStar 335. The flow cell design provides true dual beam operation for low noise and drift in the analytical mode and extended range capability for preparative HPLC. All of the flow cells are made of three blocks of Titanium with Teflon® gaskets between the blocks.
The layout of the flow 9x0 cell is shown in Figure 6. This is called a 9x0 flow cell because the cell has a 9 mm sample path and a 0 mm reference path. No sample flows through the reference path.
The light beam is directed through both the sample and reference side of the flow cell. Liquid goes into the flow cell body at the inlet as shown in the diagram and through a proprietary thermal equilibration system that minimizes band spreading (patent applied for) while adjusting the temperature of the liquid in the flow cell. This minimizes refractive index effects. The liquid then goes through the 9 mm cell path and out through the outlet. The liquid moves between the inlet and outlet and the flow cell itself through galleries created in the Teflon gaskets between the blocks.
Figure 6 General design of the 9x0 flow cell
For the preparative flow cells, the path is illustrated in Figure 7.
Figure 7 Flow path for the 9x1 preparative flow cell
In this design, the mobile phase first flows through the sample side and then across and back through the reference side.
The preparative flow cell design is different in several ways from the analytical flow cell design. The preparative flow cells have much larger diameters than the analytical flow cells. This provides much lower pressure drops in the flow cell and therefore much higher maximum flow rates. They also do not have any internal thermal equilibration system. They are more susceptible to RI effects from flow variations. Because these are preparative flow cells, they are not normally used near the detector noise level.
The main advantage of the dual path flow cell design is ability to use the extended range feature. In normal operation, the reference path is used as a true dual beam reference. This minimizes the noise and drift created by lamp fluctuations. This also reduces the peak height of the chromatographic peaks. Effectively, in the 9x1 flow cell, the flow path is 8 mm when the reference is used. That is because the peak is also going through the reference side.
When the peak reaches a preset absorbance of 0.9 AU, the detector begins to blend the absorbance from the both of the paths together. This provides a smooth transition as the peak increases in absorbance. When the peak reaches an absorbance of 1.1 AU, the shorter path generates the entire signal. When a preparative flow cell is installed in the detector, it will always operate in extended range mode.
Flow rate considerations for flow cellsAll of the flow cells have a pressure limit of 1000 psi and therefore maximum flow rate limitations that vary depending on the diameter of the flow cells and their connections will apply. These are listed in the ProStar 335 data sheet. Practically, the two preparative flow cells also have minimum flow rate limitations. For a dual path flow cell, the mobile phase first goes through the sample side and then through the reference side. There is a small but finite connecting volume between the sample and the reference side. Because spectra are collected on both the sample and reference side and compared, especially through the blend region, the flow rate should be high enough so that the same part of the peak is essentially in both the sample and reference paths. This can be thought of as a concentration offset. This offset is not particularly a problem for pure peaks or for peaks whose absorbances are significantly below the blend region of 0.9 to 1.1 AU. However, for partially resolved peaks or when going though the absorbance blend region, a low flow rate can create a shoulder on a peak. As a recommendation, the 9x1 flow cell should be used at flow rates greater than 10 to 20 mL/min especially when looking at high absorbances.
Detector electronics and optional interfacesA single board computer with surface mount electronics controls the operation of the ProStar 335 detector. This main board controls all of the functions of the detector. It contains Flash RAM allowing the firmware which controls the detector to be updated in one simple process. Features that will be added later to the detector itself will be easily upgraded on all existing detectors in the field.
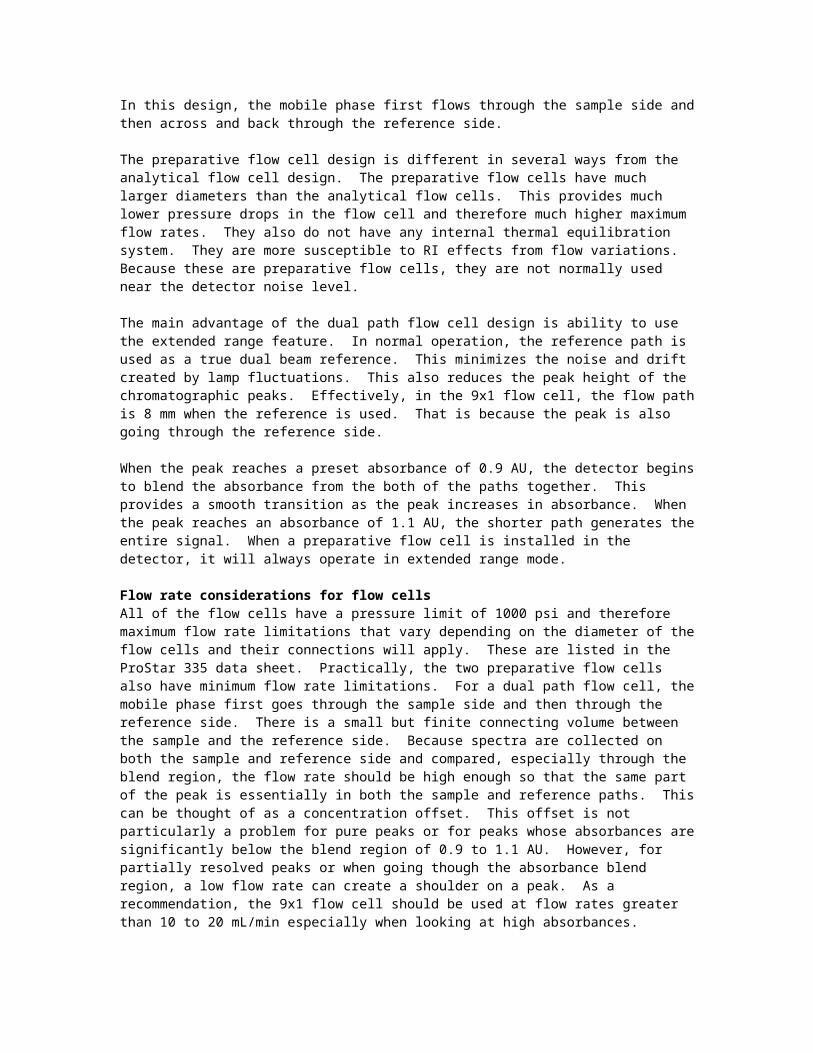
Other electronics in the detector include the power supply, a front-end board which has the two photodiode arrays (for the analytical to prep detector) or a photodiode array and two reference photodiodes (for the microbore to analytical detector) and the board which contains the front status lights.
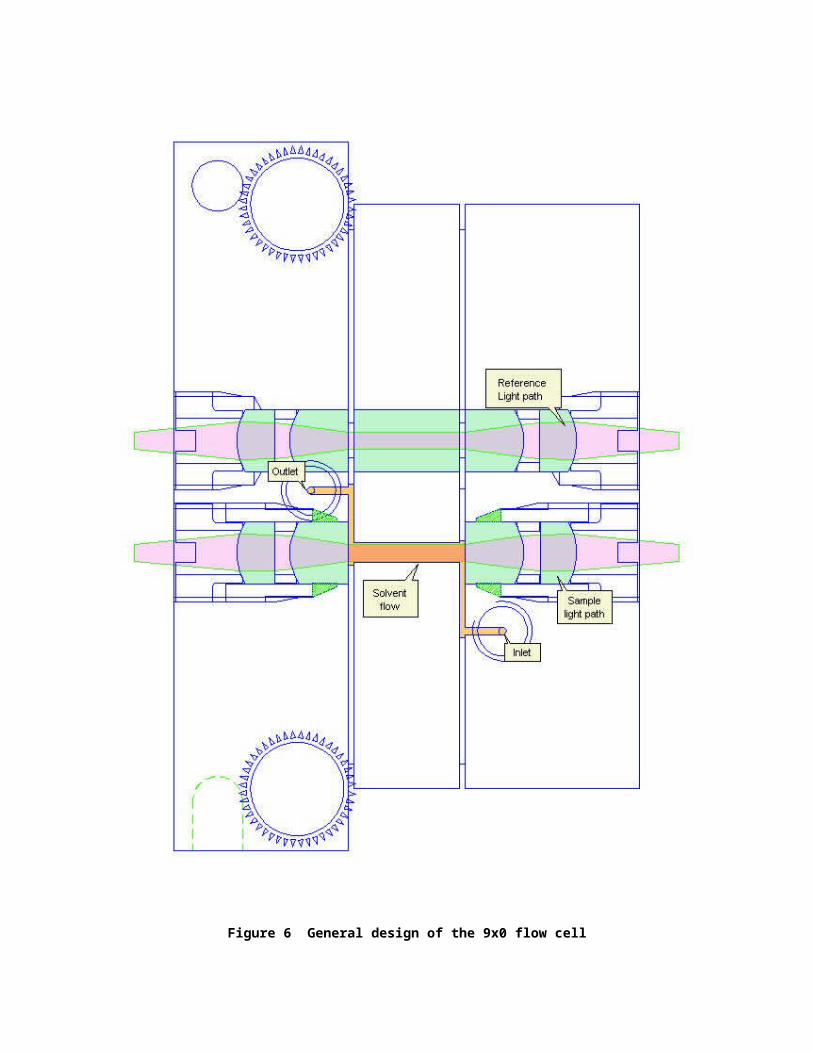
Figure 8 Back panel of the ProStar 325 detector
The interface connectors are located on the rear panel of the detector (see Figure 8). There are five interface connectors as shown in the Figure. Connector J1 is used to connect the ProStar 335 to a computer or to a computer network through an Ethernet cable. If you are connecting the unit to a PC directly, use the cross over cable supplied with the detector. If you are using a computer hub, use a standard patch cable.
The Sync signals on connectors P9 and J10 provide all of the signals associated with the ProStar modules including READY, START and FAULT inputs and outputs. In addition, contact closure inputs for LAMP OFF and AUTOZERO are also found on these connectors. This makes the detector extremely easy to interface to other manufacturers’ HPLC modules.
To make connecting to the sync signals easier for the customer, an I/O adaptor board, (shown in Figure 9) is available. This board provides connectors for connecting bare wires to the ProStar 335. In addition, each of the functions is clearly labeled so that it will be easy for a customer to make the correct connections. If a customer is going to use the sync signals, they must purchase the I/O adaptor board.

Figure 9 I/O adaptor board for the sync signals.
Connector J4 provides 4 time programmed contact closures and one peak sense relay output. The contact closures can be programmed to close and open at any time. This could be used to provide synchronization between the HPLC system and any other modules. The peak sense relay will give pulsed outputs based on time programmable single of multiple pulses. This could be used to drive a simple fraction collector. A relay adaptor board, shown in Figure 10, makes interconnecting the relays easy.
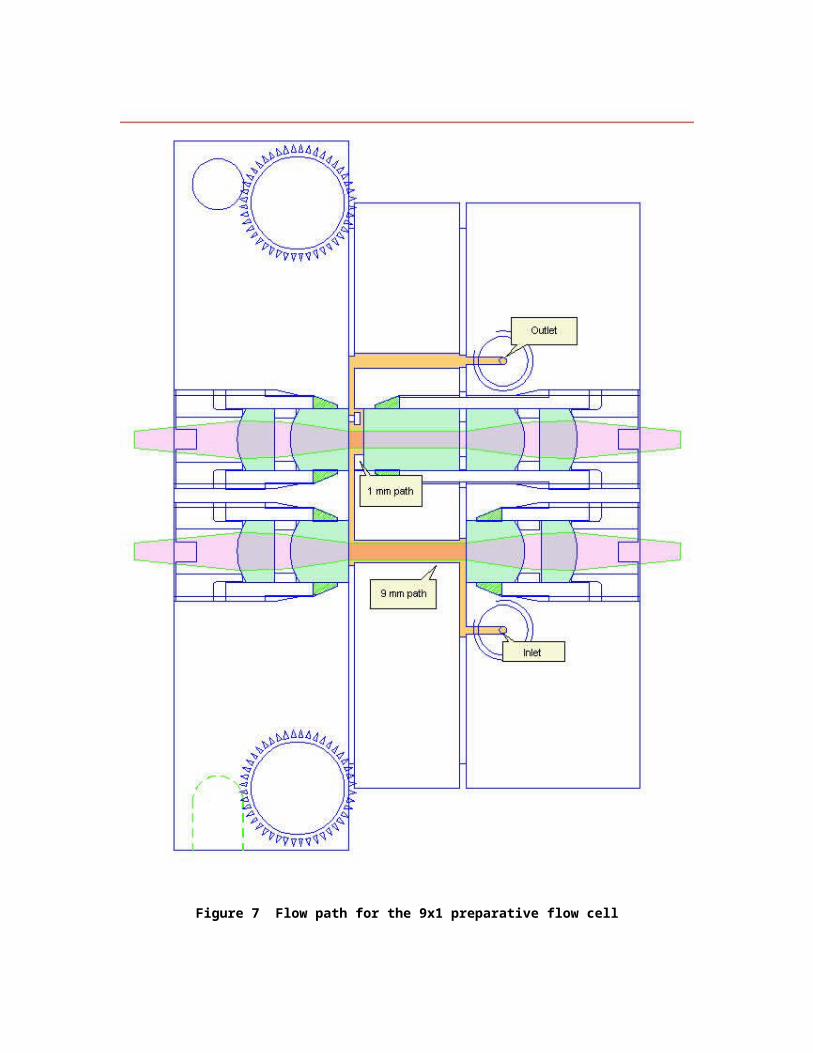
Figure 10 Relay adaptor board
The relay board uses either Molex connectors or silvered wires.
The final connection on the back panel is the Analog Output. This provides signal connections for the two analog channels. An individual cable with labeled silvered wires for both channels is available if the signal has to go to another device that needs the analog signal. This could be a fraction collector or CIM.
Front panel status lights and IR controlStatus lights are located on the front of the ProStar 335. There are three status lights labeled as shown in Table 1.
LED label Status Color Power Initialising
Power OnOrange flashingGreen
Lamp InitialisingLamp OnFault
Green flashingGreenRed
Ready/Run Not ReadyReady/StoppedMethod Running
OffGreenOrange
Table 1 Status lights on the front of the ProStar 325 detector
FirmwareThe firmware in the ProStar 335 has been significantly upgraded from the firmware in the ProStar 325 while keeping the best aspects of the ProStar 325. Many of these changes will be incorporated in the next release of firmware for the ProStar 325.
Similar to the ProStar 325, the firmware in the ProStar 335 can still be downloaded from a computer if an update is needed.
PerformanceThe ProStar 335 specifications are listed in the ProStar 335 data sheet. Here we are going to discuss the parameters that effect the performance specifications.
The most important performance parameter of any HPLC detector is noise. The noise determines the limit of detection and the limit or quantitation. There are three factors that most significantly affect noise in the ProStar 335, the slit width, the filtering and the wavelength.
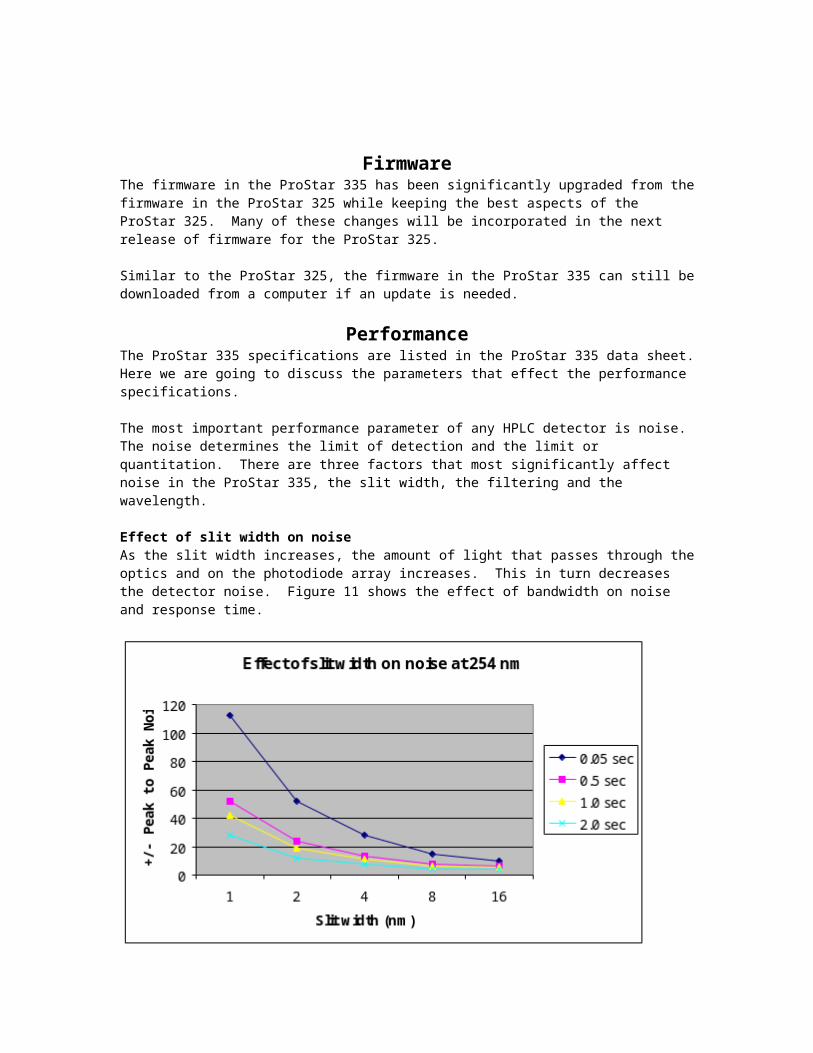
Effect of slit width on noiseAs the slit width increases, the amount of light that passes through the optics and on the photodiode array increases. This in turn decreases the detector noise. Figure 11 shows the effect of bandwidth on noise and response time.
Figure 11 Effect of slit width on noise
Here you can see that increasing the slit width has a significant effect on peak to peak noise. This is especially true when the response time is very low. For a response time of 0.05, there is a 10 fold decrease in noise going from a 1 nm slit width to a 16 nm slit width. For a 2 second response time, the decrease is only a factor of 5. Therefore, whenever possible, use a slit width of 4 nm or greater. Since most compounds have natural bandwidth in the UV of 40 nm or more, you will not be losing any spectral information using a larger slit width. This data was take at 0.25 mL/min water with a 9x0 flow cell and both the UV and visible lamp on.
There is also a significant effect of wavelength on noise. Figure 12 shows the effect of wavelength on noise at different slit widths.
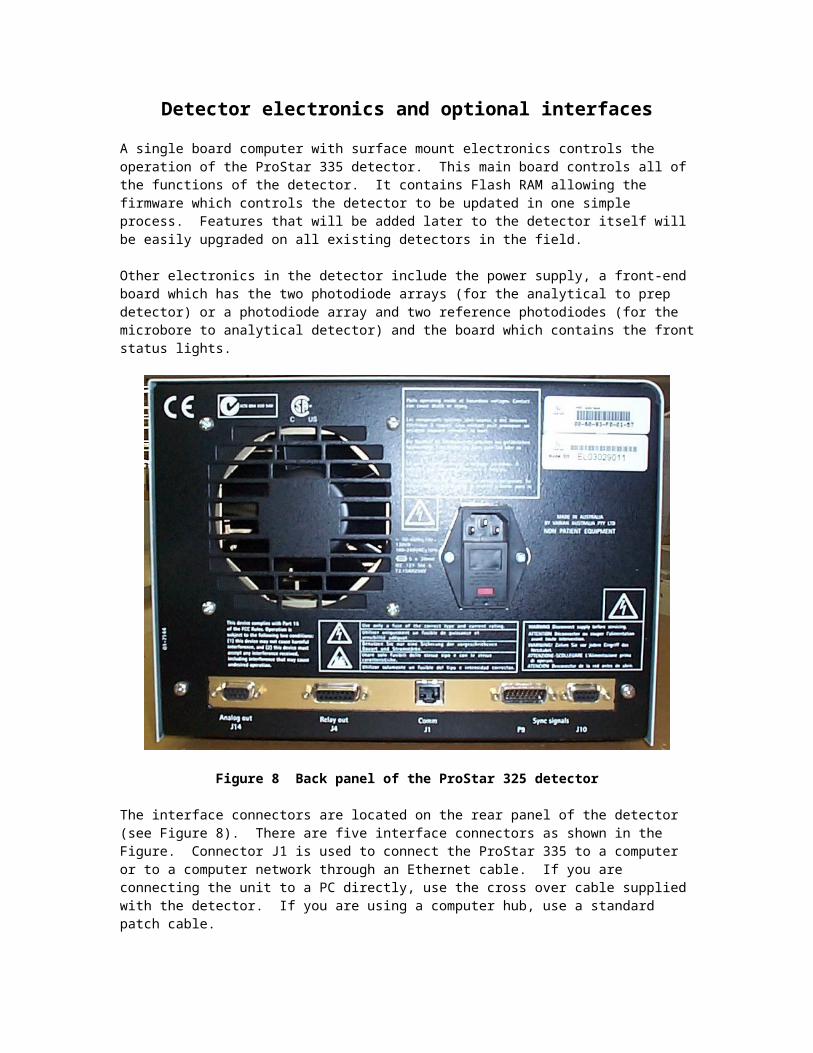
Figure 12 Effect of wavelength on noise
It is clear from this chart that for a slit of 8 and 16 nm, the detector has very low noise even at 195 nm and 950 nm. It is interesting to note that the 8 nm slit is better than the 16 nm slit at the extreme wavelengths. This is probably due to the lack of light below 190 nm and above 950 nm. As the bandwidth widens at the extremes of the detector ranges there is not much of an increase of light. This data was taken at 0.5 mL/min water.
All other factors involved with the noise operate the same as in the ProStar 325.
Optical resolutionOptical resolution is of importance in HPLC only when the compound of interest has narrow bandwidths. Most compounds have a broad natural bandwidth so we recommend that you use a bandwidth of 4 to 8 nm to minimize noise. However, when a compound has a small natural bandwidth a detector with a narrow optical band is important for accurately identifying the compound.
The 335 has a choice of slits. Figure 13 shows a spectrum of benzene in water.
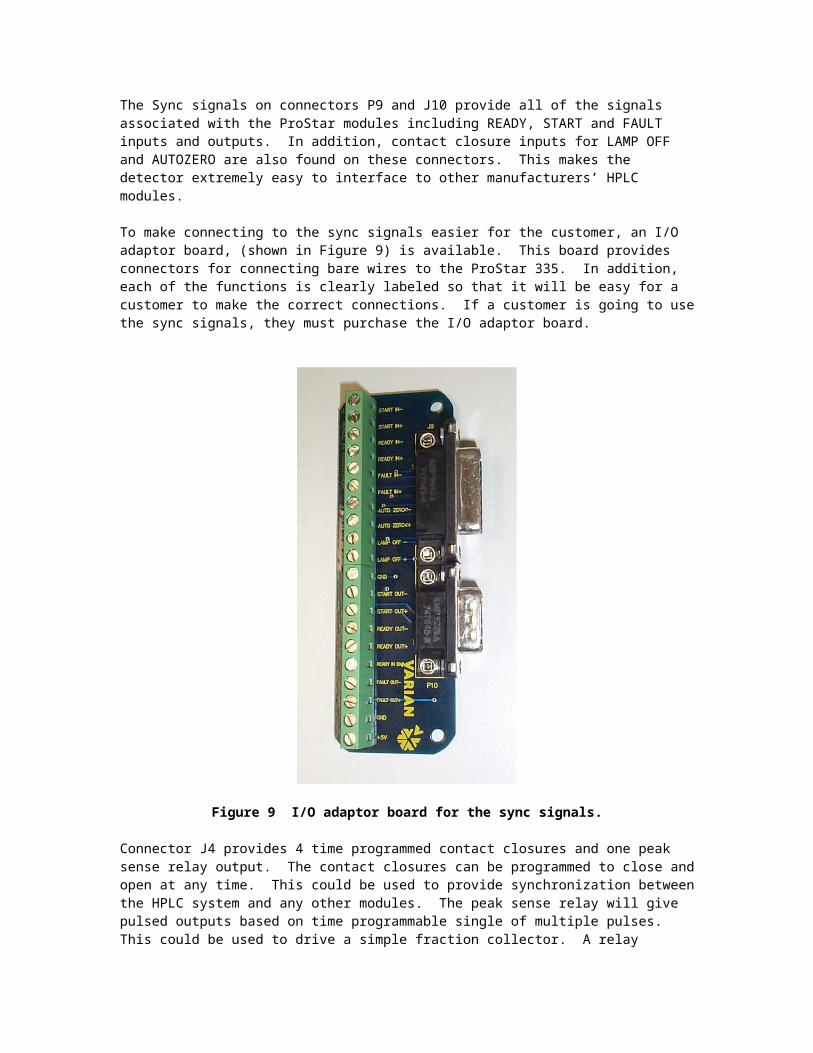
Figure 13 Benzene in water with 1 nm slit
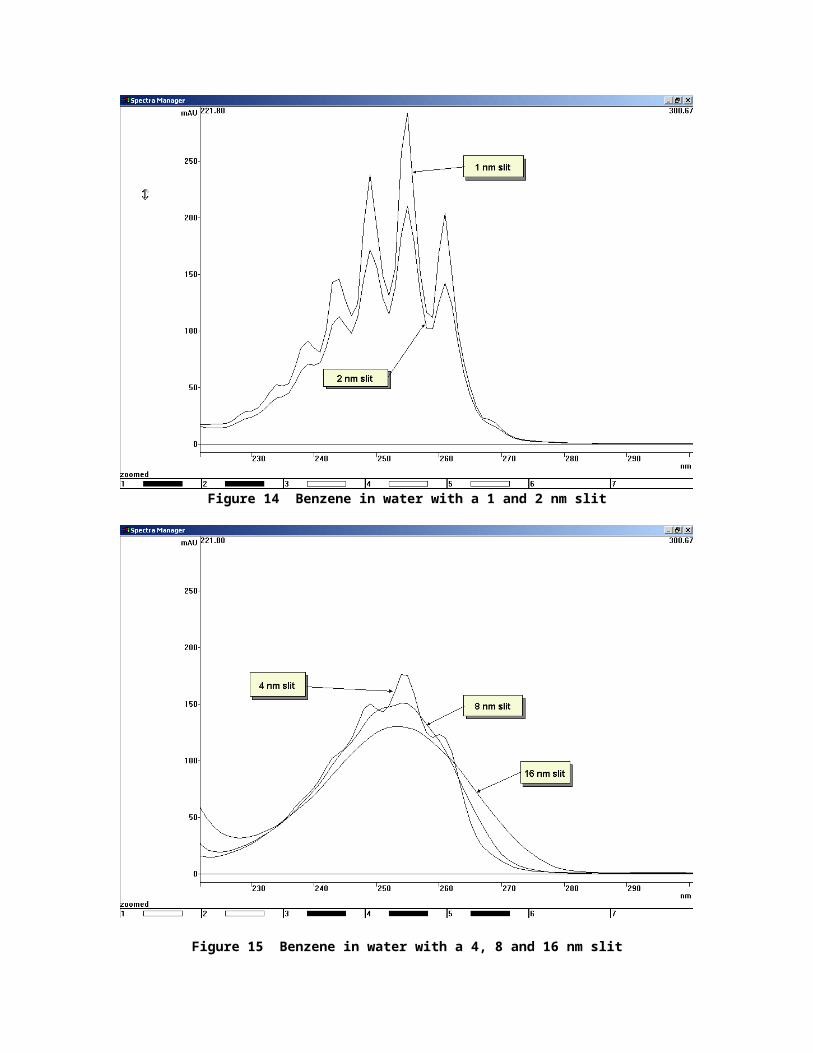
As you increase the slit width the optical resolution will decrease. Figure 14 and 15 shows the gradual decrease of resolution with increasing slit width.
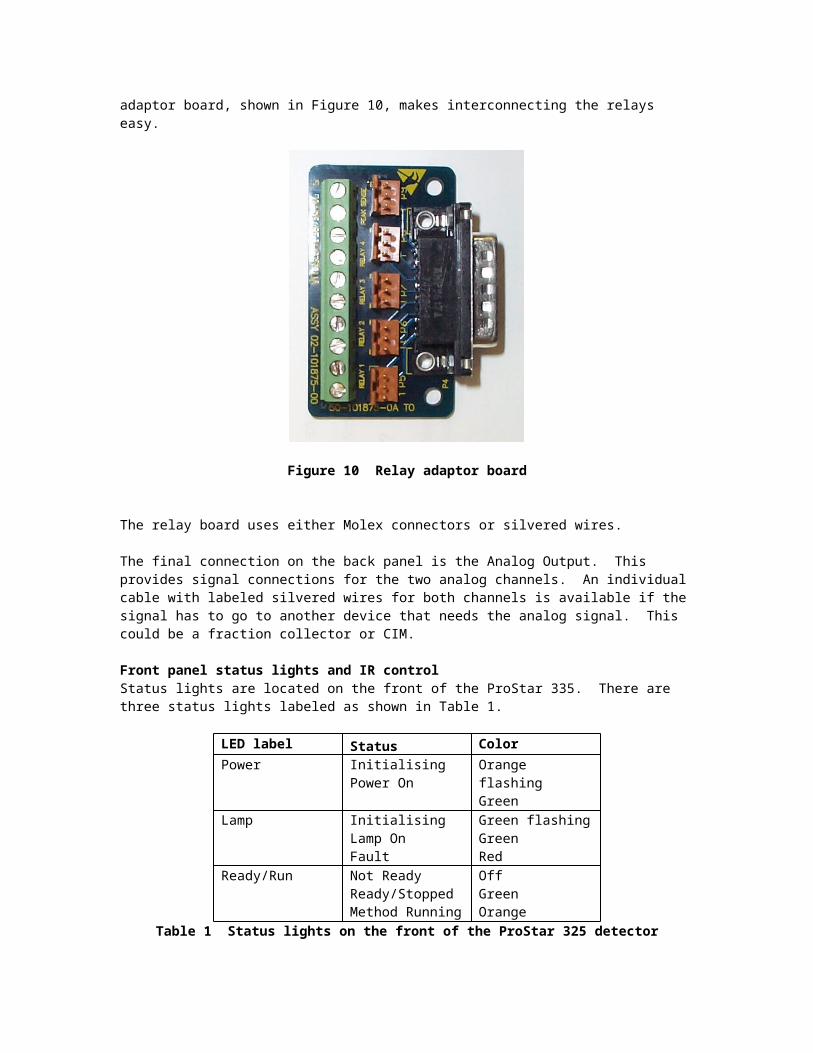
Figure 14 Benzene in water with a 1 and 2 nm slit
Figure 15 Benzene in water with a 4, 8 and 16 nm slit
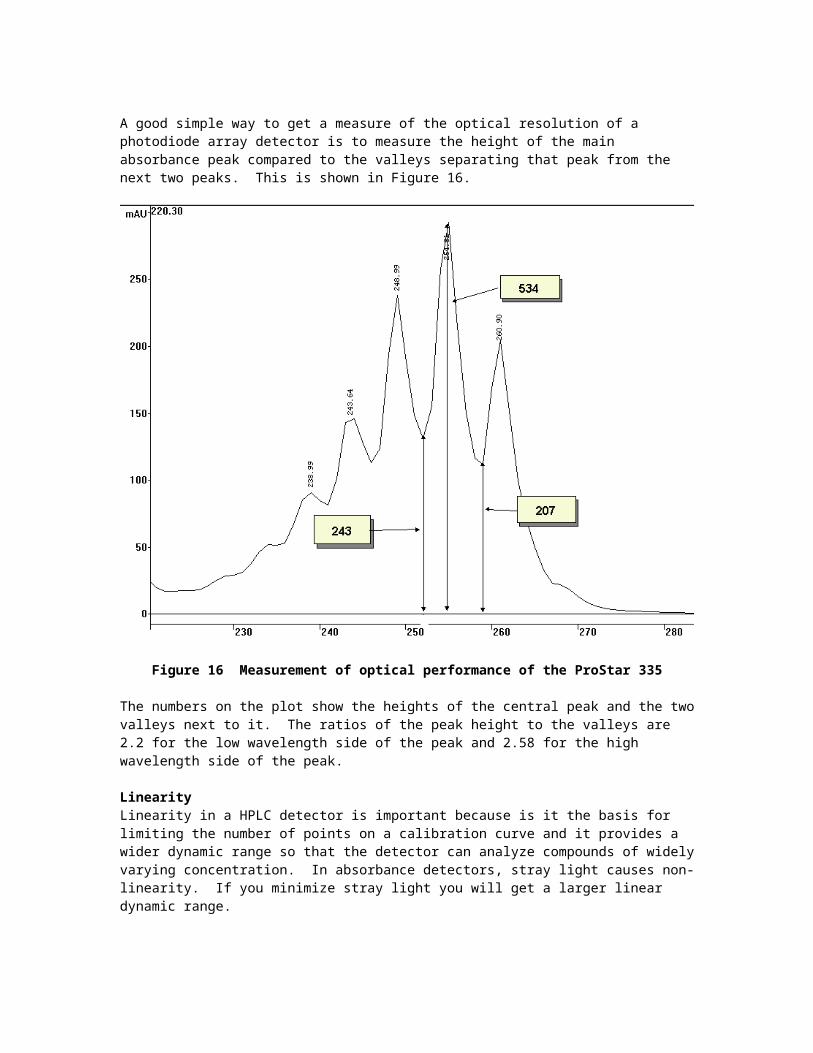
A good simple way to get a measure of the optical resolution of a photodiode array detector is to measure the height of the main absorbance peak compared to the valleys separating that peak from the next two peaks. This is shown in Figure 16.
Figure 16 Measurement of optical performance of the ProStar 335
The numbers on the plot show the heights of the central peak and the two valleys next to it. The ratios of the peak height to the valleys are 2.2 for the low wavelength side of the peak and 2.58 for the high wavelength side of the peak.
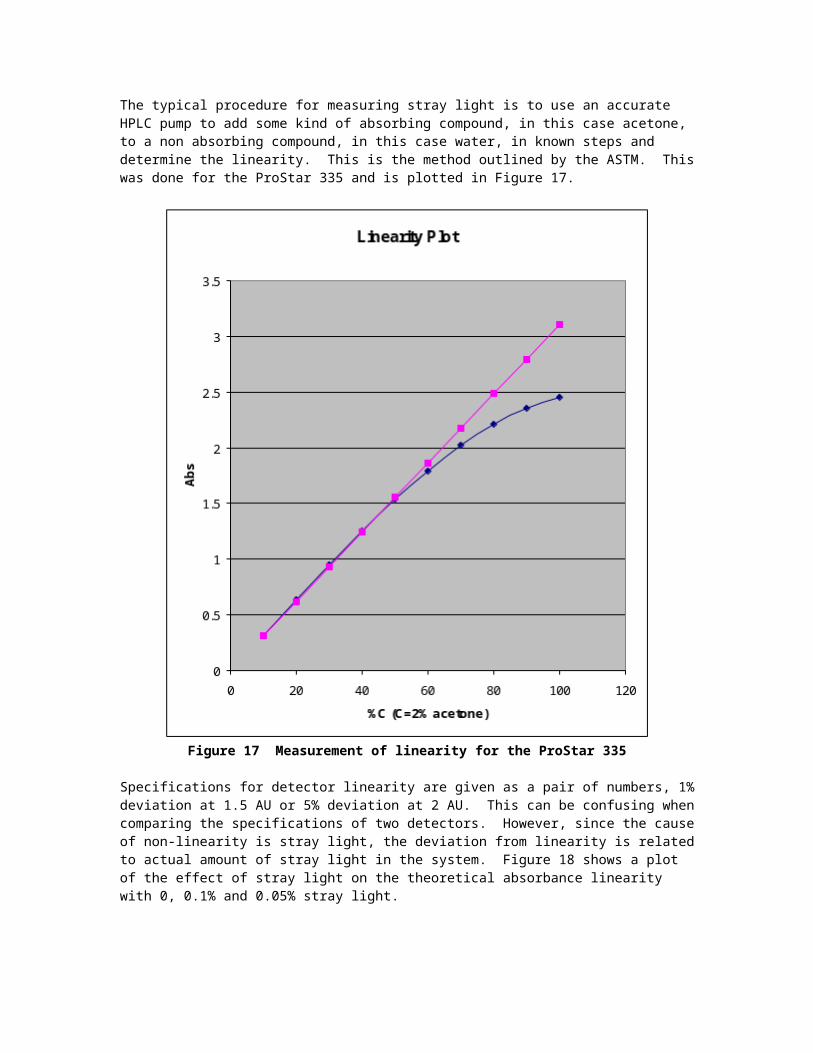
LinearityLinearity in a HPLC detector is important because is it the basis for limiting the number of points on a calibration curve and it provides a wider dynamic range so that the detector can analyze compounds of widely varying concentration. In absorbance detectors, stray light causes non-linearity. If you minimize stray light you will get a larger linear dynamic range.
The typical procedure for measuring stray light is to use an accurate HPLC pump to add some kind of absorbing compound, in this case acetone, to a non absorbing compound, in this case water, in known steps and determine the linearity. This is the method outlined by the ASTM. This was done for the ProStar 335 and is plotted in Figure 17.
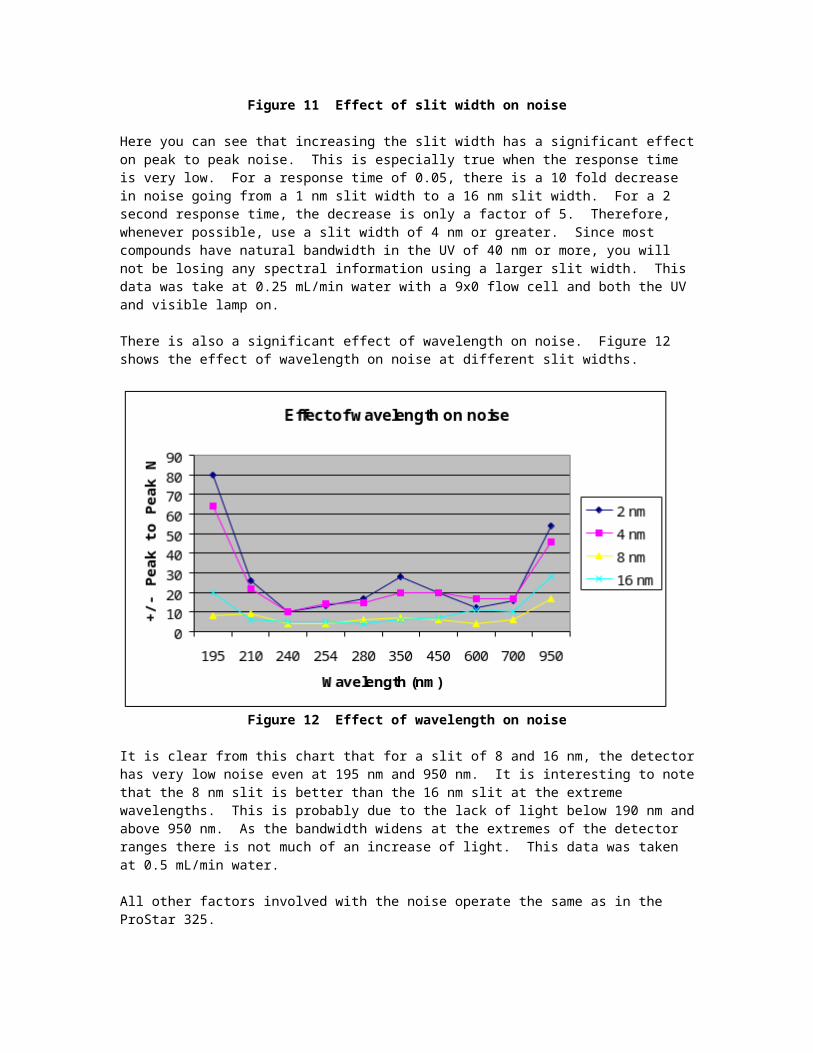
Figure 17 Measurement of linearity for the ProStar 335
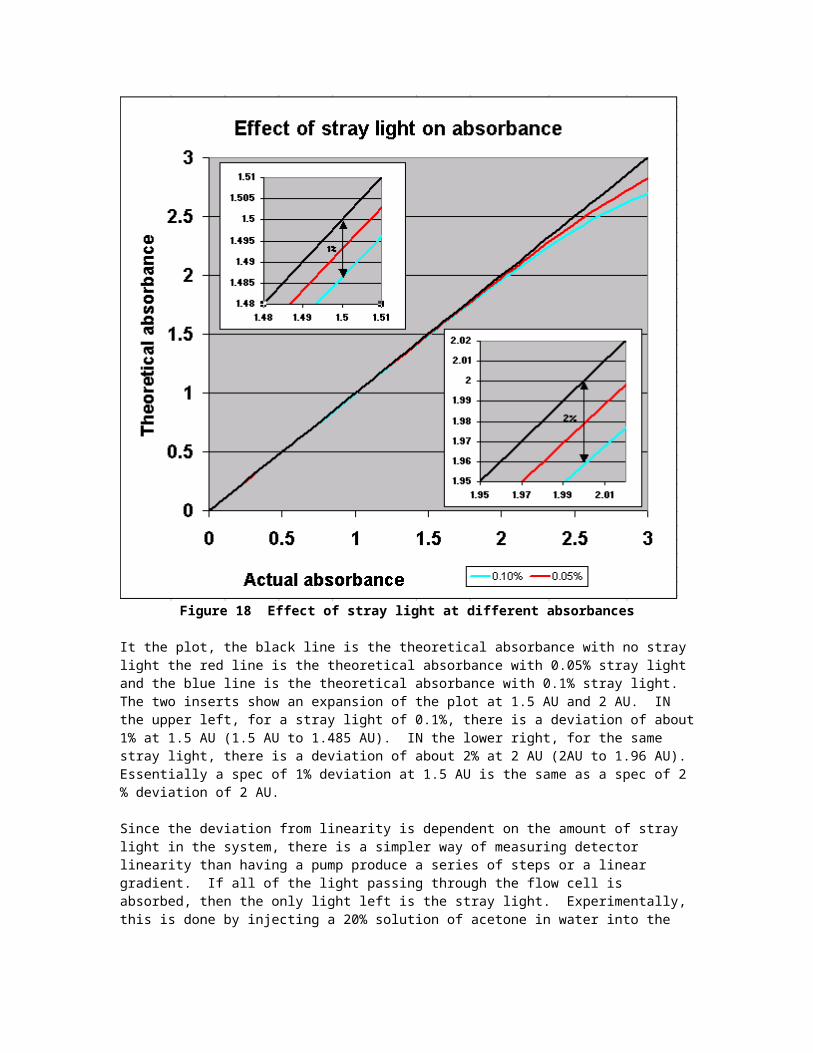
Specifications for detector linearity are given as a pair of numbers, 1% deviation at 1.5 AU or 5% deviation at 2 AU. This can be confusing when comparing the specifications of two detectors. However, since the cause of non-linearity is stray light, the deviation from linearity is related to actual amount of stray light in the system. Figure 18 shows a plot of the effect of stray light on the theoretical absorbance linearity with 0, 0.1% and 0.05% stray light.
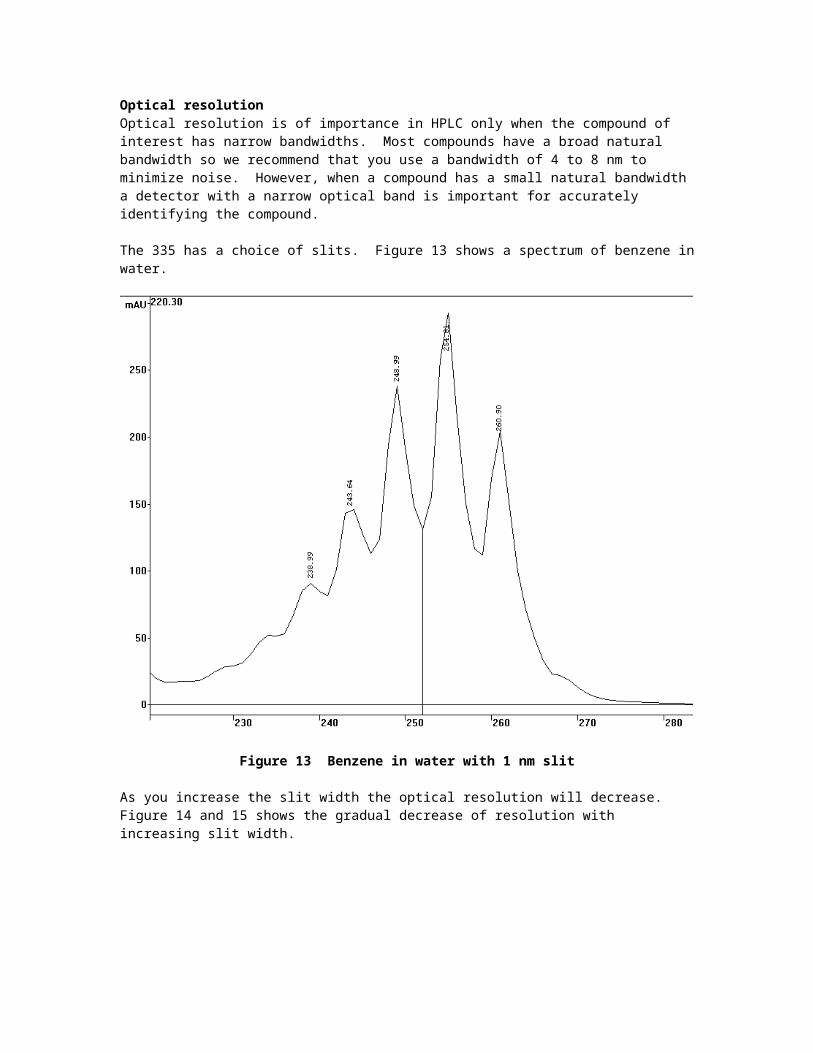
Figure 18 Effect of stray light at different absorbances
It the plot, the black line is the theoretical absorbance with no stray light the red line is the theoretical absorbance with 0.05% stray light and the blue line is the theoretical absorbance with 0.1% stray light. The two inserts show an expansion of the plot at 1.5 AU and 2 AU. IN the upper left, for a stray light of 0.1%, there is a deviation of about 1% at 1.5 AU (1.5 AU to 1.485 AU). IN the lower right, for the same stray light, there is a deviation of about 2% at 2 AU (2AU to 1.96 AU). Essentially a spec of 1% deviation at 1.5 AU is the same as a spec of 2 % deviation of 2 AU.
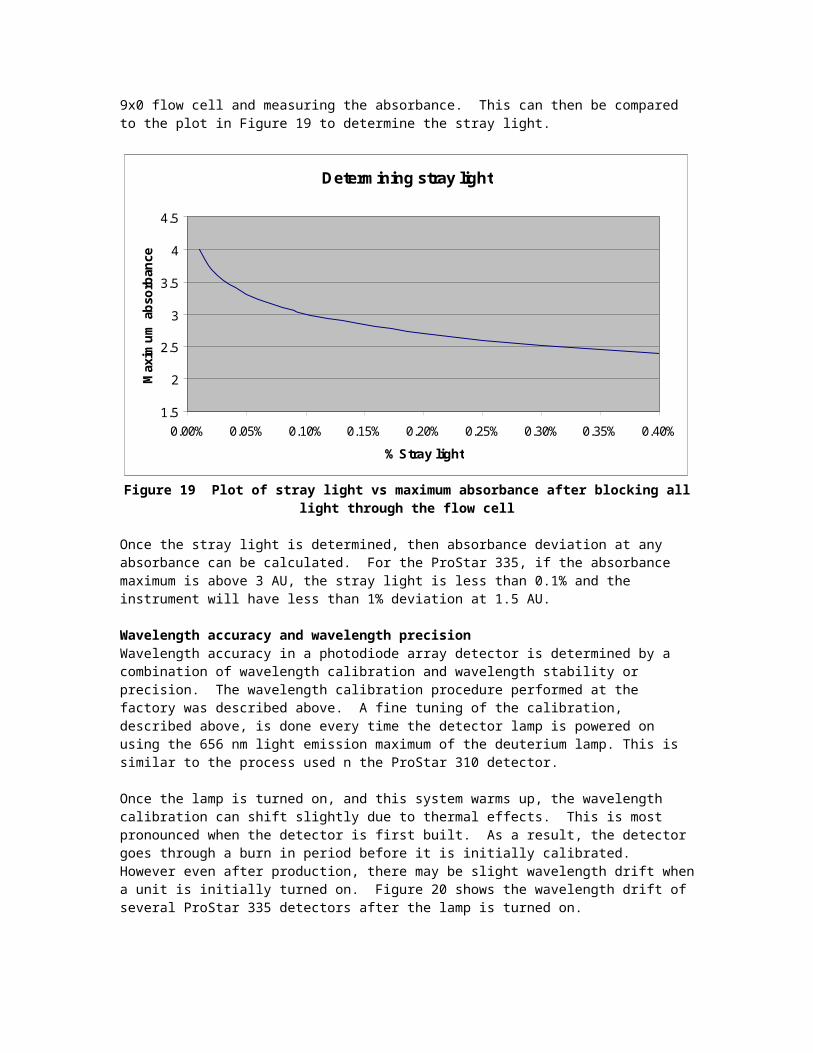
Since the deviation from linearity is dependent on the amount of stray light in the system, there is a simpler way of measuring detector linearity than having a pump produce a series of steps or a linear gradient. If all of the light passing through the flow cell is absorbed, then the only light left is the stray light. Experimentally, this is done by injecting a 20% solution of acetone in water into the 9x0 flow cell and measuring the absorbance. This can then be compared to the plot in Figure 19 to determine the stray light.
Determining stray light
1.5
2
2.5
3
3.5
4
4.5
0.00% 0.05% 0.10% 0.15% 0.20% 0.25% 0.30% 0.35% 0.40%
% Stray light
Max
imum
abs
orba
nce
Figure 19 Plot of stray light vs maximum absorbance after blocking all light through the flow cell
Once the stray light is determined, then absorbance deviation at any absorbance can be calculated. For the ProStar 335, if the absorbance maximum is above 3 AU, the stray light is less than 0.1% and the instrument will have less than 1% deviation at 1.5 AU.
Wavelength accuracy and wavelength precisionWavelength accuracy in a photodiode array detector is determined by a combination of wavelength calibration and wavelength stability or precision. The wavelength calibration procedure performed at the factory was described above. A fine tuning of the calibration, described above, is done every time the detector lamp is powered on using the 656 nm light emission maximum of the deuterium lamp. This is similar to the process used n the ProStar 310 detector.
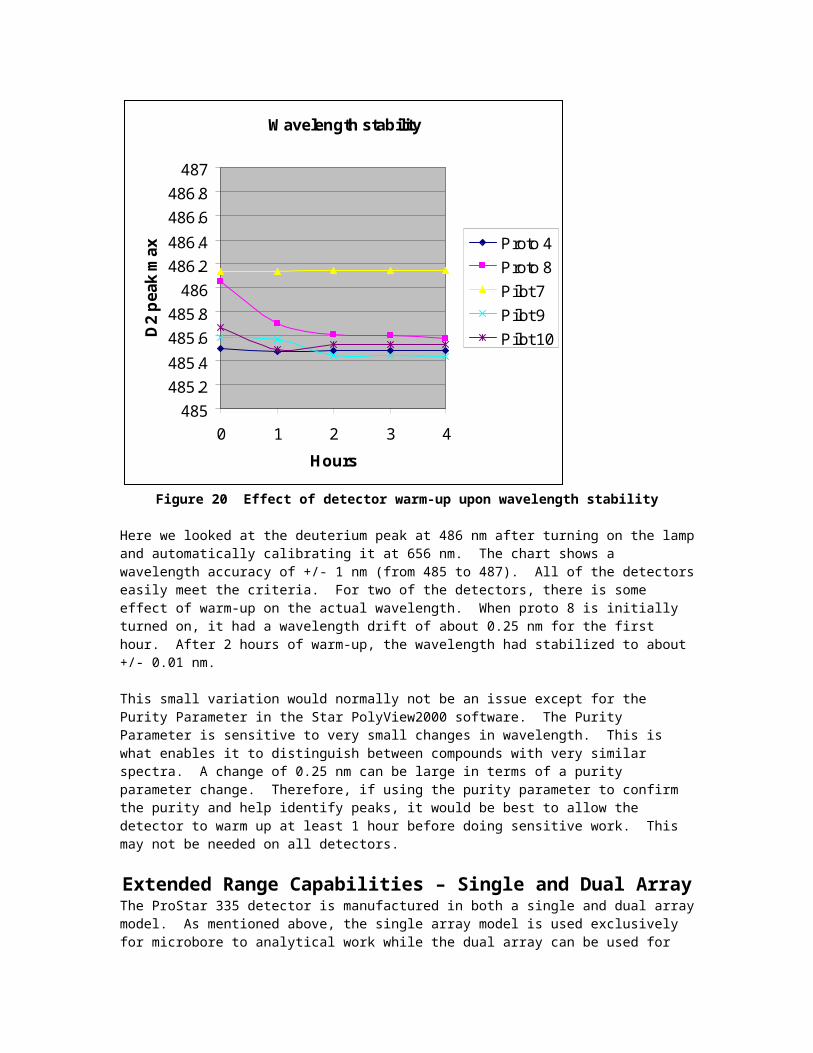
Once the lamp is turned on, and this system warms up, the wavelength calibration can shift slightly due to thermal effects. This is most pronounced when the detector is first built. As a result, the detector goes through a burn in period before it is initially calibrated. However even after production, there may be slight wavelength drift when a unit is initially turned on. Figure 20 shows the wavelength drift of several ProStar 335 detectors after the lamp is turned on.
Wavelength stability
485485.2485.4485.6485.8
486486.2486.4486.6486.8
487
0 1 2 3 4
Hours
D2
peak
max Proto 4
Proto 8Pilot 7Pilot 9Pilot 10
Figure 20 Effect of detector warm-up upon wavelength stability
Here we looked at the deuterium peak at 486 nm after turning on the lamp and automatically calibrating it at 656 nm. The chart shows a wavelength accuracy of +/- 1 nm (from 485 to 487). All of the detectors easily meet the criteria. For two of the detectors, there is some effect of warm-up on the actual wavelength. When proto 8 is initially turned on, it had a wavelength drift of about 0.25 nm for the first hour. After 2 hours of warm-up, the wavelength had stabilized to about +/- 0.01 nm.
This small variation would normally not be an issue except for the Purity Parameter in the Star PolyView2000 software. The Purity Parameter is sensitive to very small changes in wavelength. This is what enables it to distinguish between compounds with very similar spectra. A change of 0.25 nm can be large in terms of a purity parameter change. Therefore, if using the purity parameter to confirm the purity and help identify peaks, it would be best to allow the detector to warm up at least 1 hour before doing sensitive work. This may not be needed on all detectors.
Extended Range Capabilities – Single and Dual ArrayThe ProStar 335 detector is manufactured in both a single and dual array model. As mentioned above, the single array model is used exclusively for microbore to analytical work while the dual array can be used for analytical to preparative work in a scale up mode. The details of the prep capabilities of the dual array detector are described elsewhere. However, it is important to realize that the microbore to analytical detector (single array) cannot be used with either a 9x1 or 4x0.5 detector. Because the reference side of the detector uses only two photodiodes, any kind of extended range operation would not be possible on the single array detector. Therefore customers should only use the 9x0 and 4x0 flow cells in single array detectors. They should NOT use the 9x1 or 4x0.15 flow cells in the single array detectors.
Computer control of the ProStar 335 detectorThe ProStar 335 can be controlled by either The Star Workstation or the Galaxie Workstation or Chromatography Data system. All of the capabilities of the detector are controlled by both systems. For detailed information on operation of the detector from either Star or Galaxie, please refer to the Star or Galaxie driver operator’s manual. Here we will describe only some of the controls and features of control.
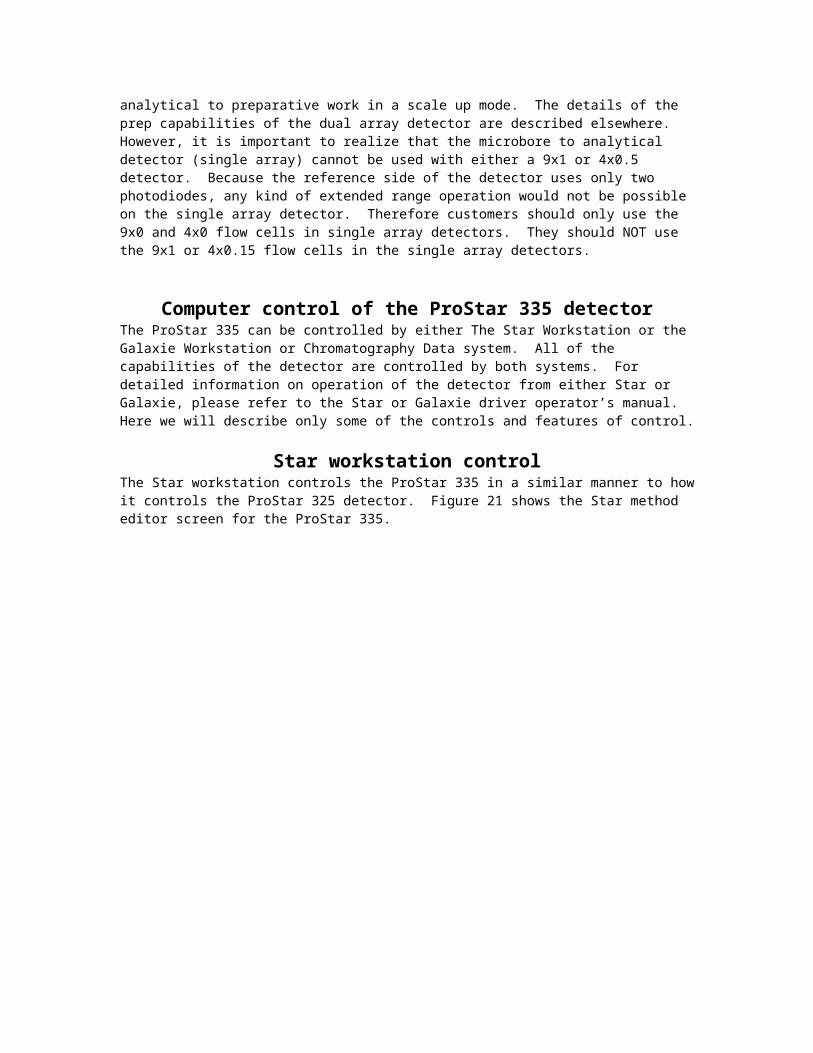
Star workstation controlThe Star workstation controls the ProStar 335 in a similar manner to how it controls the ProStar 325 detector. Figure 21 shows the Star method editor screen for the ProStar 335.
Figure 21 Star Method Editor Screen for the ProStar 335
Photodiode Array Spectra AcquisitionThe right hand side of the screen provides the controls for the acquisition of spectra into the Star workstation software from the ProStar 335. The range of wavelengths being acquired is listed as the Min and Max wavelengths. These can range from 190 to 950 nm with 1 nm increments. Spectra are acquired at a base frequency of 10 Hz or 10 spectra per second. This can lead to very large data files. Two parameters can reduce the size of the data files acquired, the Detector bunch rate and the Sampling Wavelengths. The detector bunch rates controls how many spectra are taken per second. If the chromatographic peaks of interest are broad, the bunch rate can be used to reduce data file size. For example, for good quantitation with the Star workstation data handling algorithms, 15 data points across a peak are sufficient. If the narrowest peak of interest
is 10 seconds wide at half height, then 15 points are needed across the entire peak of about 30 seconds. This would be a point every 2 seconds or a bunching rate of 16. This will reduce the size of the data file by a factor of 16.
A second way of controlling the size of a data file is the sampling wavelengths parameter located in the lower right hand corner of the screen and shown in Figure 22.
Figure 22 Sampling Wavelengths Entry
This allows the chromatographer to select which wavelengths to store. He can choose to store all wavelengths, every 2 nm (e.g. 250, 252, 254, 256 etc), every 4, 8 or 16 nm. This significantly reduces data file size when the chromatographer has limited electronic storage.
Chromatogram AcquisitionThe ProStar 335 can output one or two time programmed chromatograms on the analog channel outputs on the rear of the detector similarly to the ProStar 325 detector. Also like the ProStar 325, the time programmed wavelength table in the method can control the chromatograms that are stored in the .RUN file in the Star workstation. If no entries are made in the Commands Method entry of PolyView 2000, then the chromatogram(s) designated in the time programmed ProStar 335 method will be stored with the .RUN file.
Display ModeThe real time display can be controlled through the method by the display mode entry located on the center left of the screen and shown in Figure 23 below.
Figure 23 Chromatogram Display mode
With the display mode entry, the chromatographer can choose to display either one or two wavelengths and, if required, a real time plot of the purity parameters. The purity parameter is controlled by the entries on the right side of the screen in the Min Purity Wage length and Max Purity Wavelength boxes and the threshold level set in the time programmed part of the method. Whenever the absorbance exceeds the threshold, the purity parameter will be calculated and displayed. In this way, the chromatographer can get information about peak purity as the run is progressing.
No Run FileIf the ProStar 335 is being used for preparative chromatography with the analog signals being used for fraction collector control and as input to the Dynamax Module in the Star workstation, the
Chromatographer can choose to check this box not to save the spectral data. This will save significant room on the hard drive, especially for preparative chromatography.
System controlThe Star system control screen is shown in Figure 24.
Figure 24 Star System control screen for the ProStar 335 detector
This screen is similar to the ProStar 330 system control screen. A real time Isoabsorbance plot is located in the upper right hand part of the screen. Clicking on this will automatically access the Aurora application where various graphical plots can be manipulated in real time.
The bottom of the screen is reserved for chromatographic plots and a spectral display. The content of the chromatographic plots (one or two wavelengths and the purity parameter) is determined by method inputs described above. The layout of the plots are controlled by the display options box located above the center of the display and shown in Figure 25 below.
Figure 25 Plot and Spectral display control
Here the display can be arranged side by side as shown in Figure 24, above or below each other or the real time spectrum display can be completely removed from the display. This gives the chromatographer complete control of what they see on the screen.
Options boxBecause so much room has been taken up by the graphical data displays, many of the functions normally on the control screen have been put under the Options Button (Figure 26).
Figure 26 Options Screen
The Options screen now contains the information which used to be directly on the main screen for turning the lamps on and off, setting the flow cell characteristics, changing the output gain, and controlling the sync signals. In addition, two other functions have been added to the Options screen.
Calibrate LampsWhen the ProStar 335 is first powered up, it automatically goes through a wavelength calibration similar to most other absorbance detectors but it does not go through a gain or lamp calibration as the ProStar 325 does. The gain or lamp calibration is used to set the amount of time that each diode is allowed to collect light before it is scanned. The ProStar 335 tries to use as much time as possible to minimize noise without having any of the diodes saturate and cut off a peak. It therefore needs to have an estimate of current lamp intensity. Since the UV and visible lamp intensities do not decrease rapidly, this calibration is a user option. When a new lamp is put in or when the noise on the detector has significantly increased, the chromatographer can choose to flush the flow cell with a non absorbing solvent and perform a lamp calibration. Our experience has shown that this will probably not have to be done more than once when a new lamp is installed and once or twice during the life of the lamp. If the user in looking at preparative peaks, they may only have to do it upon lamp installation. A detailed procedure for doing lamp calibration is in the ProStar 335 Operation manual.
Ethernet SettingsThe ProStar 335 normally uses a procedure called BootP to assign an IP address on the host workstation for establishing communications protocols with the detector. This means that a different IP address could be assigned every time the ProStar 335 is powered on and in some laboratories that could be contrary to the laboratory protocol. If there is a desire to have a fixed IP address for each ProStar 335, Star Workstation can assign an IP address to a particular ProStar 335. See the ProStar 335 Photodiode Array detector Control Software manual for more details.
Manual ControlTime programmed wavelength outputs and relays can be manually controlled during a run using the Insert Method Line Screen (Figure 27).
Figure 27 Insert Method Line screen
On this screen, the chromatographer can set one or more wavelengths and attenuations and change one or more relay setting and then immediately send this method line to the ProStar 335 detector. The detector will then execute the line immediately, changing the state of the relays and the rear panel analog output. This allows a chromatographer doing preparative work to change wavelengths as needed to more clearly visualize the peaks and to better control the automated fraction collector program by changing wavelength going into the fraction collector.
Galaxie Workstation and CDS ControlAll of the same control features that are present in the Star Workstation driver are also present in the Galaxie driver. Shown in the next five figures are several of the Galaxie screens to illustrate some of the Galaxie driver capabilities.
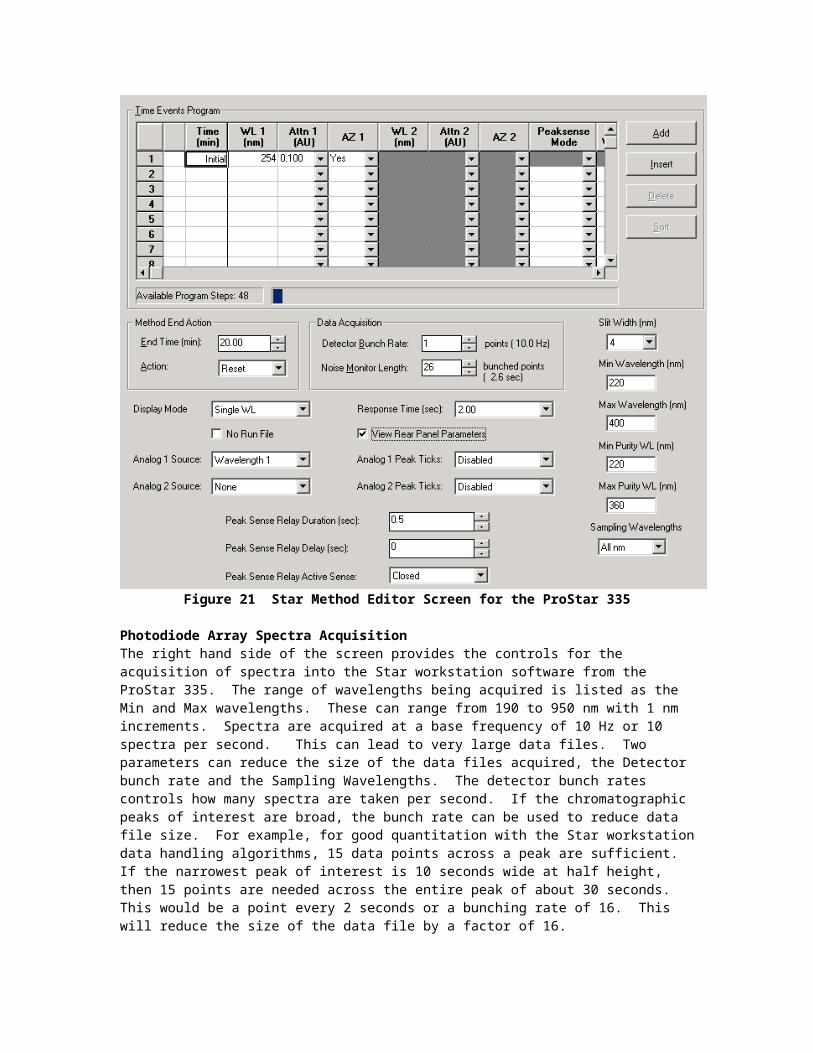
Figure 28 Galaxie method for acquisition of spectral data
Figure 29 Galaxie method for real time purity parameter display
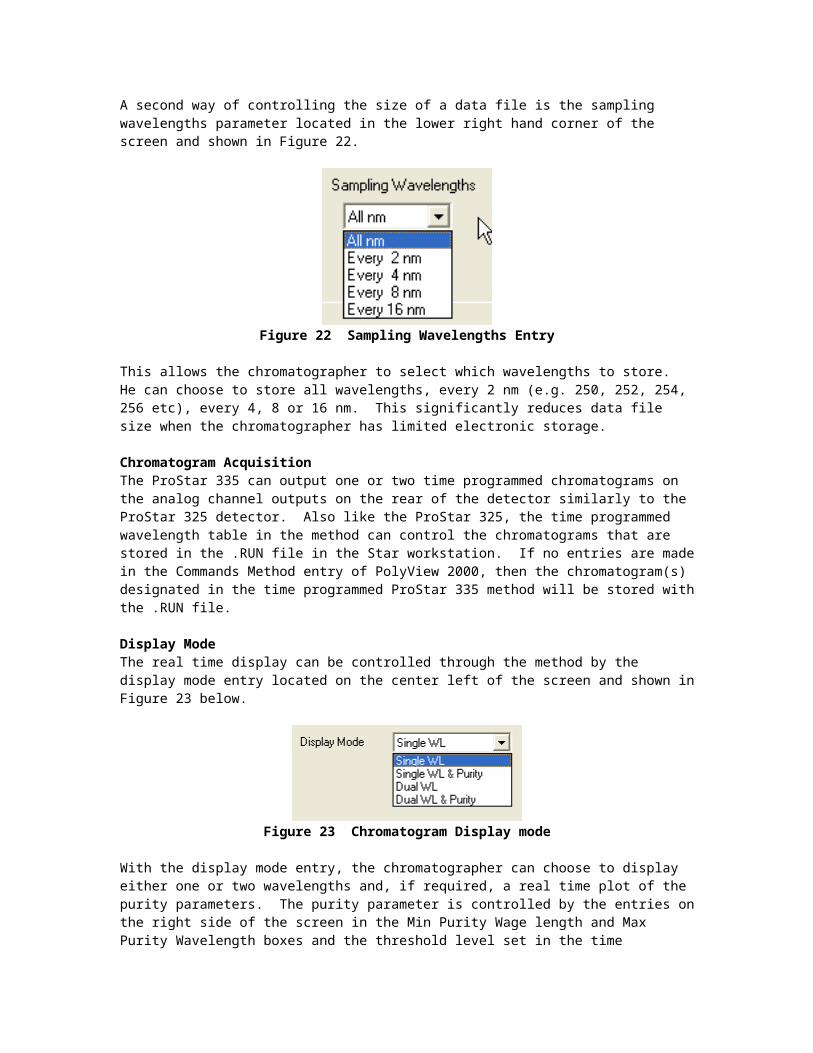
Figure 30 Galaxie Control for real time method line insertion
Figure 31 Galaxie 4 view display of benzene spectra from the ProStar 335