Embed Size (px)
DESCRIPTION
about reliability concept
Citation preview
- 28 -
RELIABILITY OF THE ESTIMATES
The data presented in this publication are estimates for the population as a whole although they are based on a sample survey. As such, they are prone to errors, which may be of two types:
1. Sampling Errors Sampling errors occur because only a sample of the population is investigated. The particular sample used in this survey is one of a large number of possible samples of the same size that could have been selected using the same sampling method. It is clear that estimates based on different samples will differ from one another, and almost all of them will differ from the value obtained had a complete census been taken – “the census value”.
The estimate Χ′ is the value, estimated from the specific sample of this survey, of the corresponding value X that would have been obtained had a complete census been conducted.
The sampling error σ(Χ′) is a measure of the variability between the different values of the estimate that would have been obtained from all possible samples of the same size and derived by the same sampling method and the census value obtained under the same conditions of data collection.
In view of the variability of sample estimates, it may preferable to consider a range of values where the census value is likely to be found, with a given probability (or level of confidence) rather than to rely on the specific value of the estimate obtained from the sample. This can be done using the sampling error.
The confidence interval for an estimate is the range containing the census value X with a given level of confidence. Using both the estimate Χ′ and its estimated sampling error σ′(Χ′), it is possible to construct a confidence interval, that contains the census value X with the given level of confidence.
Confidence intervals are usually given at a 95% level. These may be obtained as the range between Χ′−2σ′(Χ′) and Χ′+2σ′(Χ′). It may be asserted with 95% confidence that the census value lies in this range.
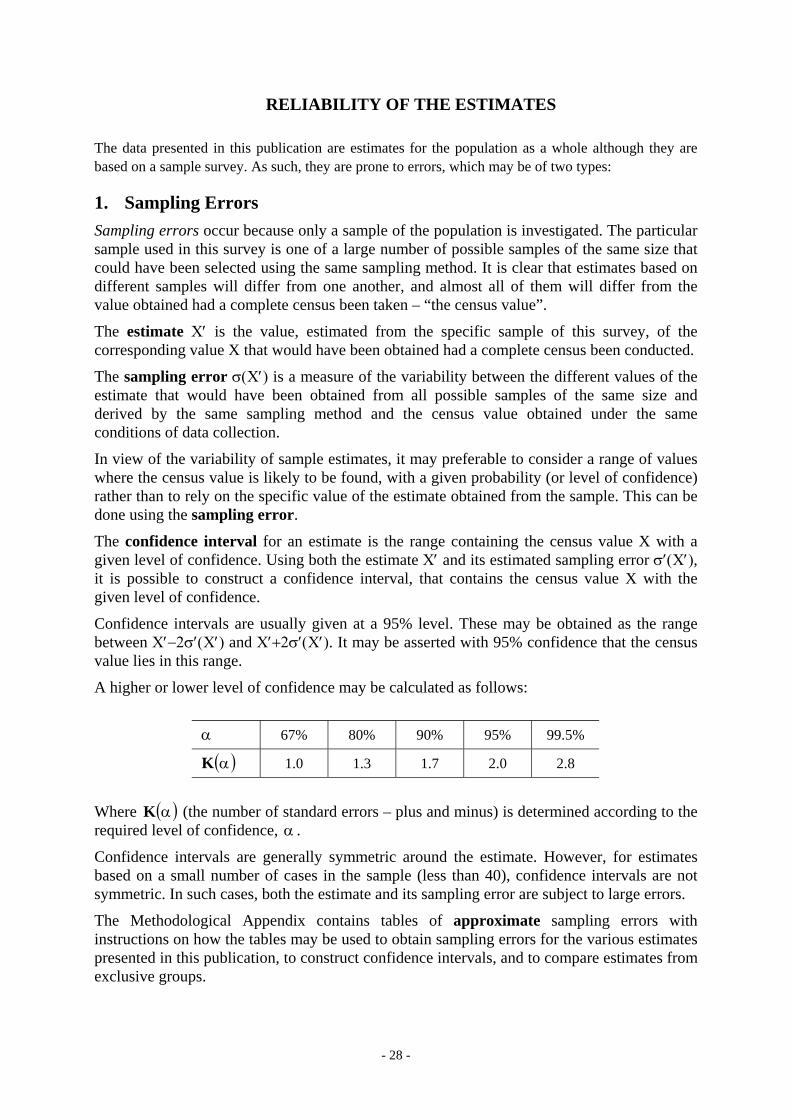
A higher or lower level of confidence may be calculated as follows:
α 67% 80% 90% 95% 99.5%
( )αK 1.0 1.3 1.7 2.0 2.8
Where ( )αK (the number of standard errors – plus and minus) is determined according to the required level of confidence, α .
Confidence intervals are generally symmetric around the estimate. However, for estimates based on a small number of cases in the sample (less than 40), confidence intervals are not symmetric. In such cases, both the estimate and its sampling error are subject to large errors.
The Methodological Appendix contains tables of approximate sampling errors with instructions on how the tables may be used to obtain sampling errors for the various estimates presented in this publication, to construct confidence intervals, and to compare estimates from exclusive groups.
- 29 -
The approximate sampling errors were determined by the design effect of the sample on various groups of the population. The design effect is defined as the ratio of the sampling variance (the square of the sampling errors) of the estimate in a complex sample to the sampling variance obtained had the sample been a simple, random one of the same size.
It should be mentioned that it is sometimes more convenient to measure a sampling error in terms of the relative sampling error, defined as the sampling error divided by the estimated value.
To caution the reader against using estimates prone to high errors, estimates with relative sampling errors exceeding 20% (figures smaller than 2,000) are enclosed in round brackets.
2. Non-Sampling Errors Non-sampling errors may stem from many sources in the various stages of collecting and processing the survey data and may occur equally in a full census.
The main non-sampling errors in this survey are:
a. Errors stemming from non-response: errors caused by the fact that households are not investigated due to absence from home or refusal to participate. This may cause some bias in the estimates, since the characteristics of persons belonging to these households may differ from those of persons who were investigated.
b. Response errors: errors due to misunderstanding the question, unwillingness or inability to answer correctly or incorrect presentation of questions.
c. Errors in processing: errors that occur at the stage of processing the material, such as errors in coding and in the data entry process of the questionnaires. Some of these errors are corrected by means of checks that the material undergoes.
d. Some of the households were interviewed in a week which was not the “determinant week” (as defined in Chapter B, Section 4). This also causes a bias in the estimates.
In contrast to sampling errors, which can be estimated on the basis of the survey data, non-sampling errors are difficult or even impossible to estimate. Thus, emphasis is laid on controlling such errors, rather than on indicating their magnitude in the data.