Embed Size (px)
Citation preview

Intrinsic F0 in Shona Vowels: A Descriptive Study Ashleigh Gonzales
University of British Columbia
1. Introduction Intrinsic fundamental frequency1 (iF0) describes the phenomenon in which there exists a correlation between vowel height and pitch (F0). It is perceived by most researchers as “an automatic consequence of successful vowel production” (Whalen et al., 1999, 2). Of the languages that have been examined for evidence of iF0, all but one have attested this relationship, such that high vowels like /i, u/ produce higher F0 than low vowels like /a/. IF0 is therefore considered to be universal (Whalen & Levitt, 1995), though there has been evidence to argue a neutralisation in some African tone languages (Connell, 2002). In the case of Mambila, for example, iF0 disappears in some high tone, in addition to, low tone environments. Shona is a Bantu language spoken predominantly in Zimbabwe, with over 10 million speakers.2 It has five phonemic vowels, /i, u, e, o, a/, and follows a two-tone system, high and low. This study assumes the theory that all vowels are specified with tone. The main goal of this study is to present a preliminary descriptive instrumental analysis of the monophthong vowels of Shona and determine to what degree, if any, the vowels exhibit a characteristic or robust iF0, and the conditions under which this phenomenon patterns. There is a significant amount of literature on iF0. To a lesser degree, similar studies have been performed for African tone languages. However, typical analyses have been restricted to the corner vowels, /i, u, a/, excluding mid vowels. It is a secondary aim of this study to determine any significance for the exclusion. The following subsections provide a brief overview of two works relevant to this particular study: Whalen & Levitt (1995) and Connell (2002). For investigations of iF0 in other African tone languages, see Snider (2001) for Chumburung, and Shryock, Ladefoged & Williamson (1996/7) for Defaka. 1.1. Whalen & Levitt (1995) Surveying 31 languages in 11 of 29 language families, Whalen & Levitt (1995) report intrinsic pitch exists for the African languages Yoruba (Hombert 1977), Isekiri (Ladefoged 1968), and Hausa (Pilszczikowa-Chodak 1972). More importantly, the survey establishes benchmark characteristics for incidences of iF0: Across all languages, iF0 is gradient; whereby, the pitch of mid vowels like /e, o/ will fall in between those of high and low vowels. Further, comparing front and back vowels of the same vowel height, there is no significant difference in iF0, thus following the claim that iF0 is a function of height. However, it is noted in the survey that /u/ has a tendency to demonstrate higher F0 than /i/. With respect to tone languages, there are additional observations of iF0. One of which is particularly relevant to this current study. It has been found that iF0 becomes neutralized in low tone environments. For example, significant differences in F0 between high and low vowels are exhibited for high tone vowels but not for low tone ones. This also indicates a likelihood that iF0 would also neutralise as a speaker approaches the lower end of his or her speaking range.
1 It is also referred to as intrinsic pitch. 2 Shona is also spoken in parts of Botswana and Zambia. There are five main dialects: Karanga, Zezuru, Korekore, Manyika, and Ndau.
© 2009 Ashleigh Gonzales. Selected Proceedings of the 39th Annual Conference on African Linguistics,ed. Akinloye Ojo and Lioba Moshi, 145-155. Somerville, MA: Cascadilla Proceedings Project.
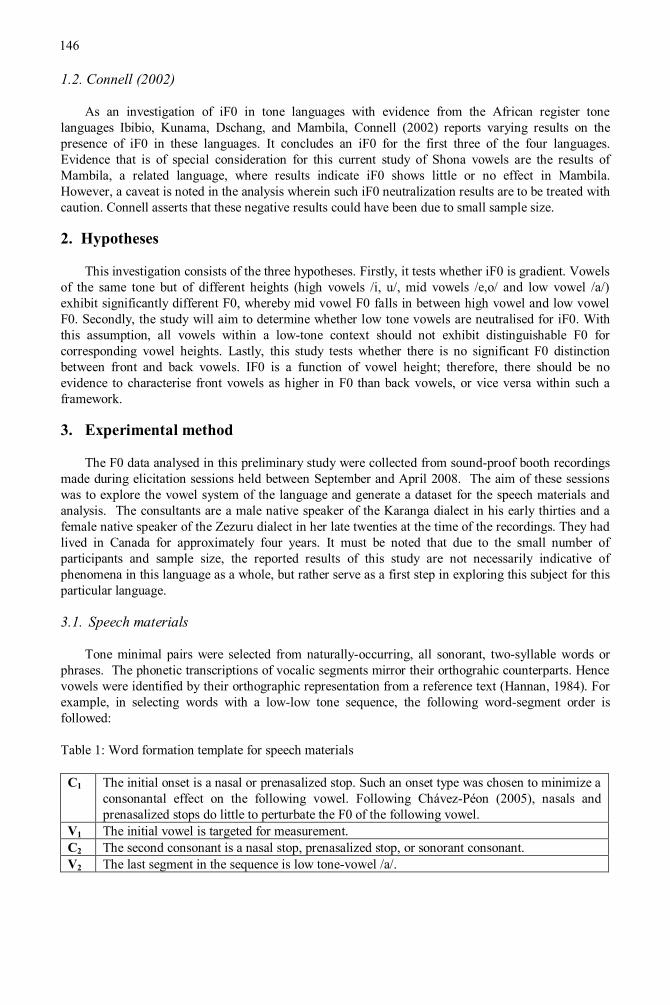
1.2. Connell (2002) As an investigation of iF0 in tone languages with evidence from the African register tone languages Ibibio, Kunama, Dschang, and Mambila, Connell (2002) reports varying results on the presence of iF0 in these languages. It concludes an iF0 for the first three of the four languages. Evidence that is of special consideration for this current study of Shona vowels are the results of Mambila, a related language, where results indicate iF0 shows little or no effect in Mambila. However, a caveat is noted in the analysis wherein such iF0 neutralization results are to be treated with caution. Connell asserts that these negative results could have been due to small sample size. 2. Hypotheses This investigation consists of the three hypotheses. Firstly, it tests whether iF0 is gradient. Vowels of the same tone but of different heights (high vowels /i, u/, mid vowels /e,o/ and low vowel /a/) exhibit significantly different F0, whereby mid vowel F0 falls in between high vowel and low vowel F0. Secondly, the study will aim to determine whether low tone vowels are neutralised for iF0. With this assumption, all vowels within a low-tone context should not exhibit distinguishable F0 for corresponding vowel heights. Lastly, this study tests whether there is no significant F0 distinction between front and back vowels. IF0 is a function of vowel height; therefore, there should be no evidence to characterise front vowels as higher in F0 than back vowels, or vice versa within such a framework. 3. Experimental method The F0 data analysed in this preliminary study were collected from sound-proof booth recordings made during elicitation sessions held between September and April 2008. The aim of these sessions was to explore the vowel system of the language and generate a dataset for the speech materials and analysis. The consultants are a male native speaker of the Karanga dialect in his early thirties and a female native speaker of the Zezuru dialect in her late twenties at the time of the recordings. They had lived in Canada for approximately four years. It must be noted that due to the small number of participants and sample size, the reported results of this study are not necessarily indicative of phenomena in this language as a whole, but rather serve as a first step in exploring this subject for this particular language. 3.1. Speech materials Tone minimal pairs were selected from naturally-occurring, all sonorant, two-syllable words or phrases. The phonetic transcriptions of vocalic segments mirror their orthograhic counterparts. Hence vowels were identified by their orthographic representation from a reference text (Hannan, 1984). For example, in selecting words with a low-low tone sequence, the following word-segment order is followed: Table 1: Word formation template for speech materials
C1 The initial onset is a nasal or prenasalized stop. Such an onset type was chosen to minimize a consonantal effect on the following vowel. Following Chávez-Péon (2005), nasals and prenasalized stops do little to perturbate the F0 of the following vowel.
V1 The initial vowel is targeted for measurement. C2 The second consonant is a nasal stop, prenasalized stop, or sonorant consonant. V2 The last segment in the sequence is low tone-vowel /a/.
146

Tone minimal pairs were then created by altering the initial vowel tone from low to high tone. This was done through noun cleft formation, as illustrated in Figure 1. Figure 1: Noun cleft formation
C1 V1 C2 V2 | | | | m à n à ‘large family unit’ L L cleft formation H m á n à ‘it is a large family unit’
In total, the speech materials consisted of five words (one word per vowel) and their cleft counterparts, for a total of 10 phrases, recorded in isolation. The audio signal was recorded with a digital recorder and external microphone over two elicitation sessions, one session per speaker. A complete list of the speech materials is given in Table 2. Table 2: Tone minimal pairs
Tone Minimal pairs Low High
[ì] vs. [í] ndìrà ‘January’
ndírà ‘it is January’
[ù] vs. [ú] mùndà ‘agricultural land’
múndà ‘it is agricultural land’
[è] vs. [ é] mbèrà ‘a type of fish’
mbéra ‘it is a type of fish’
[ò] vs. [ó] mòwà ‘decumbent perennial weed’
mówà ‘it is a decumbent perennial weed’
[à] vs. [á] mànà ‘large family unit’
mánà ‘it is a large family unit’
Audio recordings were made of each phrase spoken five times each, in isolated succession per speaker.Next, the initial and final tokens were discarded, resulting in a total of 60 tokens for analysis (10phrases x three tokens x two speakers). 3.2. Measurements The audio files were processed and segmented in PRAAT (version 4.6.31) with TextGridannotation. Each initial vowel segment was marked at onset and offset based on waveform and time-aligned wideband spectrogram patterns. Starting at the vowel onset, five F0 measurements were taken every five ms until 20 ms to render a total of 300 measurements (five F0 measurements of 60 tokens). Figure 2 is an example of the first token of the word mànà ‘large family unit’ produced by the male speaker exploited for analysis in PRAAT.
147

Figure 2: Spectrogram and pitch contour of mànà ‘large family unit’.
3.3. Statistical analyses Data were separated for tone, as comparisons were made within parallel tone environments (one group of tests for low tone vowels, another for high tone ones). A number of analysis of variance (ANOVA) tests were performed. The first ANOVA compared overall F0 means of the five vowels. The second set of variance tests compared the five vowels F0 means per interval. The F0 data were then grouped by vowel height, and then by front and back vowels to make further comparisons. These two tests were done by calculating the differences in F0 means. For example, /i/ was compared to /u/, and /e/ to /o/ in order to test for a further correlation between iF0 and vowel frontness. To summarize each tone group section, an evaluation was made of the linear relationship between vowel height and pitch. For all cases, absolute values were measured in mel3 to demonstrate the F0 values of the vowels relative to one another. 4. Results Fundamental frequency measurements successfully substantiate the claim that Shona vowels exhibit a robust and characteristic intrinsic F0.
3Mel scale is a relative perceptual scale of pitches: m = 1127.01048 loge(1 + f / 700), where f is Hertz (Hz).
148

4.1. F0 means overall Table 3: Mean F0 of vowels in mel, with standard deviation (in parentheses).
Speaker Tone /i/ /u/ /e/ /o/ /a/ 1 (Female) H 215.5 (7.3) 214.6 (10.6) 214.0 (9.1) 206.9 (6.6) 198.0 (5.2) 2 (Male) 121.5 (2.7) 129.6 (5.3) 105.7 (3.0) 120.6 (2.8) 105.5 (2.4) 1 (F) L 179.4 (3.6) 172.7 (3.2) 163.7 (4.4) 158.7 (2.6) 155.8 (3.6) 2 (M) 105.5 (0.9) 106.8 (1.6) 105.9 (2.5) 104.0 (2.5) 106.5 (1.2)
Table 4: Pitch range, in mel, determined by the difference between the maximum and minimum mean F0 value per token per speaker.
Speaker Tone Max F0 Min F0 Range 1 (F) H 230.0 187.5 42.4 2 (M) 135.1 101.0 34.1 1 (F) L 186.1 151.2 34.9 2 (M) 110.8 100.9 9.9
The mean F0 values (over the whole vowel) indicate three patterns associated with iF0, of which the latter two will be discussed in the following subsections. High tone values indicate a considerable significance value with Speaker 1 ANOVA being F(4,70) = 11.52, p < 0.0001, and Speaker 2 at F(4,70) = 145.37, p < 0.0001). F0 values within the low tone environment produce similar significant results, with ANOVA for Speaker 1 at F(4,70) = 109.12, p < 0.0001, and Speaker 2 at F(4,70) = 5.07, p < 0.0001. Within the high tone context, Speaker 2 had more significant results than Speaker 1, suggesting characteristic F0 values. Vice versa occurs for the low tone results, with Speaker 2 exhibiting far more characteristic F0 tendencies for each vowel. While assigning causation at this stage is speculatory, these results are expected to be the consequence of the lower pitch range of Speaker 2. These initial observations set the foundation for assessing the roles of vowel height and backness iF0. 4.1.1. Vowel height High vowels /i, u/ have greater F0 means than the low vowel /a/ in all cases except for low tone for Speaker 2. The difference is calculated by deducting the F0 mean of /a/ from that of the combined /i, u/ mean. A positive iF0 value indicates a positive correlation between pitch and vowel height, while a negative value indicates the opposite, suggesting a neutralisation or compression of iF0. The iF0 values in Table 5 show that for Speaker 2, vowels with a low tone context become neutralised for this phenomenon. Table 5: Vowel height comparison in mel and iF0 values.
Speaker Tone /i, u/ /e, o/ /a/ iF0 1 (F) H 214.7 210.5 198.0 16.7 2 (M) 125.6 113.2 105.5 20.1 1 (F) L 176.1 161.2 155.8 20.3 2 (M) 106.1 105.0 106.5 -0.4
The next step compares mid vowels /e, o/ to high /i, u/ and low /a/, to determine if the mid vowels are significantly intermediate in F0 value.
149

For high tone, ANOVA highlight the complementary results between the two speakers. Speaker 1 ANOVA indicate a slight significance between high and mid vowels F(1,58) = 5.02, p < 0.03, with a considerable significance for Speaker 2 at F(1, 58) = 46.13, p < 0.0001. Comparing mid vowels to the low vowel, Speaker 1 ANOVA results are F(1, 43) = 22.91, p < 0.0001 and Speaker 2 results are F(1,43) = 12.87, p < 0.001. The findings illustrate that within the high tone environment, the F0 of mid vowels for Speaker 1 is closer in range to that of the high vowels, while for Speaker 2, the F0 of mid vowels is closer in range to the low vowel. For low tone, it is expected that a pitch-height relation would diminish given the decreased pitch range of the vowels. Comparing high with mid vowels, these vowel heights differ significantly in their F0 values, where Speaker 1 ANOVA is F(1,58) = 149.15, p < 0.0001. However, Speaker 2 results are nonsignificant at F(1,58) = 2.23, n.s. Against low vowel /a/, mid vowel F0 results for Speaker 1 still maintain a contrast with F(1,43) = 17.53, p < 0.0001. It appears that the iF0 gradient has diminished completely for Speaker 2, as comparing mid to low vowels again produce insignificant results (F(1,43) = 0.63, n.s.). 4.1.2. Vowel backness Finally, ANOVA of measurements are conducted to test possible correlations between iF0 and vowel backness. In Table 6, for Speaker 1, the front vowels /i, e/ have higher F0 means than their back counterparts /u, o/, whereas the results for Speaker 2 generally indicate the inverse effect.4 The results of Speaker 2 resemble the claims of Whalen & Levitt in which vowel backness is not a factor in iF0, but that /u/ has a tendency to have a higher F0 than /i/ (1995, 356). Particularly, Speaker 2 [ú] demonstrates a significantly higher F0 than [í]. This trend is further accounted for with the mid vowels in this language as [ó] is significantly higher in pitch than its front counterpart, [é]. Quantification of significance is illustrated in Table 6. Table 6: Vowel backness ANOVA comparison, with higher F0 in bold and insignificant results shaded.
Speaker Tone /i/ /u/ ANOVA /i/ vs. /u/ 1 (F) H 215.5 214.6 F(1,28) = 0.18, n.s. 2 (M) 121.5 129.6 F(1,28) = 27.33, p < 0.0001 1 (F) L 179.4 172.7 F(1,28) = 24.39, p < 0.0001 2 (M) 105.5 106.8 F(1,28) = 7.96, p < 0.01 /e/ /o/ /e/ vs. /o/ 1 (F) H 214.0 206.9 F(1,28) = 3.58, n.s. 2 (M) 105.7 120.6 F(1,28) = 197.52, p < 0.0001 1 (F) L 163.7 158.7 F(1,28) = 14.47, p < 0.001 2 (M) 105.9 104.0 F(1, 28) = 7.24, p < 0.01
Due to the conflicting results between the two speakers, there appears sufficient evidence to warrant rejection of a proposal that vowel backness correlates with iF0. To the smallest degree, F0 values of the back vowels for Speaker 2 are significant enough to be considered, as a whole, higher than those of the front vowels, such that the iF0 gradient exists for vowel backness in a high tone context. 4.2. F0 means per interval To determine if iF0 or other characteristic features are more prominent at certain time points than others, five measurements were taken across the vowel beginning at its onset. Visually, it gives a more
4 Refer to Table 3.
150

comprehensible picture of the average pitch contour of the vowels within the phrases of the word list. It also aids in determing pitch contour interaction between vowels and/or tone. Speaker results are summarized in the following tables and graphs. 4.2.1. Speaker 1 (Female) Table 7.1: High tone vowel F0 means by interval
Time 0 ms 5 ms 10 ms 15 ms 20 ms F0 Mean StDev Mean Stdev Mean StDev Mean StDev Mean StDev [í] 206.3 9.2 211.2 4.4 217.4 2.0 221.5 1.8 220.9 2.1 [ú] 204.2 7.5 214.2 8.4 218.0 5.1 219.1 6.1 217.6 5.3 [é] 199.0 3.4 210.1 6.9 217.7 5.1 223.0 3.9 220.5 4.6 [ó] 192.4 4.3 203.3 4.2 209.6 4.6 214.3 4.3 214.9 4.5 [á] 188.8 1.1 195.0 0.4 200.8 1.2 202.7 0.9 202.9 2.2
Table 7.2: High tone vowel ANOVA results
0 ms 5 ms 10 ms 15 ms 20 ms
[í] vs. [ú] F(1,4) = 1.14 p = 0.346
F(1,4) = 0.04 p = 0.852
F(1,4) = 0.01 p = 0.937
F(1,4) = 0.18 p = 0.689
F(1,4) = 0.02 p = 0.899
[é] vs.[ó] F(1,4) = 11.97 p < 0.026
F(1,4) = 3.06 p = 0.155
F(1,4) = 2.50 p = 189
F(1,4) = 0.61 p = 0.479
F(1,4) = 0.002 p = 0.970
[í/ú] vs. [á] F(1,7) = 7.34 p < 0.030
F(1,7) = 36.78 p < 0.001
F(1,7) = 61.83 p < 0.0001
F(1,7) = 62.42 p < 0.0001
F(1,7) = 59.92 p < 0.0001
[í/ú] vs. [é/ó] F(1,10) = 1.15 p = 0.309
F(1, 10) = 0.76 p = 0.402
F(1,10) = 3.33 p = 0.098
F(1,10) = 8.23 p < 0.017
F(1,10) = 6.55 p < 0.028
[é/ó] vs. [á] F(1,7) = 4.76 p = 0.065
F(1,7) = 9.33 p < 0.018
F(1,7) = 12.73 p < 0.01
F(1,7) = 29.10 p < 0.001
F(1,7) = 21.83 p < 0.002
The high tone vowels of Speaker 1 have two significant features. The data reiterate findings (cf. Table 6) for Speaker 1 where firstly, vowel backness does not play a significant role in the manipulation of vowel F0. Second, as there are more significant ANOVA results comparing [é/ó] versus [á] than [í/ú] versus [é/ó], it illustrates that the F0 range of the mid vowels is closer to the high vowels versus the low vowel. Further, it also indicates that these pitch contours of the mid vowels correlate greater to those of the high vowels produced by the speaker for the wordlist. The per interval F0 results for low tone vowels show that there is a cause and effect relation between lowered pitch range and increased dissimilarity between high and mid vowels. As there is significant outcome of the ANOVA for vowel height, it denotes there is no pitch contour interaction between the vowel heights. Table 8.1: Low tone vowel F0 means by interval
Time 0 ms 5 ms 10 ms 15 ms 20 ms F0 Mean StDev Mean Stdev Mean StDev Mean StDev Mean StDev [ì] 183.2 2.2 181.5 4.0 178.7 3.9 178.1 2.9 175.4 4.9 [ù] 173.7 3.6 175.1 1.3 174.4 0.9 171.9 1.6 168.2 2.1 [è] 167.6 3.1 165.7 3.3 163.7 3.5 162.2 4.5 159.4 4.6 [ò] 162.7 0.9 160.2 0.2 158.2 0.2 156.2 0.5 156.4 0.9 [à] 161.0 1.8 157.3 1.7 154.9 2.1 153.4 1.9 152.3 1.3
151

Table 8.2: Low tone vowel ANOVA results
0 ms 5 ms 10 ms 15 ms 20 ms
[ì] vs. [ù] F(1,4) = 15.54 p < 0.02
F(1,4) = 6.80 p = 0.060
F(1,4) = 3.49 p = 0.135
F(1,4) = 10.53 p < 0.032
F(1,4) = 5.36 p = 0.082
[è] vs.[ò] F(1,4) = 6.90 p = 0.058
F(1,4) = 8.15 p < 0.046
F(1,4) = 7.42 p = 0.052
F(1,4) = 5.29 p = 0.083
F(1,4) = 1.19 p = 0.337
[ì/ù] vs. [à] F(1,7) = 24.19 p < 0.002
F(1,7) = 60.21 p < 0.0001
F(1,7) = 94.58 p < 0.0001
F(1,7) = 74.87 p < 0.0001
F(1,7) = 37.93 p < 0.001
[ì/ù] vs. [è/ò] F(1,10) = 23.62 p < 0.001
F(1,10) = 43.03 p < 0.0001
F(1,10) = 55.96 p < 0.0001
F(1,10) = 42.40 p < 0.0001
F(1,10)=29.71 p < 0.001
[è/ò] vs. [à] F(1,7) = 3.64 p = 0.098
F(1,7) = 6.01 p < 0.044
F(1,7) = 6.48 p < 0.038
F(1,7) = 4.61 p = 0.069
F(1,7) = 7.23 p < 0.031
The following graphs show the previous data of Tables 7 and 8. Figure 3: Speaker 1 (Female) vowel F0 means per interval
4.2.2. Speaker 2 (Male) Table 9.1: High tone vowel means by interval
Time 0 ms 5 ms 10 ms 15 ms 20 ms F0 Mean StDev Mean Stdev Mean StDev Mean StDev Mean StDev [í] 117.4 1.1 122.2 1.8 123.5 2.0 122.8 1.3 121.7 2.1 [ú] 123.1 5.8 128.4 6.3 132.1 4.9 132.5 2.6 131.7 1.1 [é] 108.8 2.7 108.4 1.3 105.8 0.8 103.5 1.1 102.1 0.6 [ó] 116.7 2.8 119.5 1.1 121.1 1.4 123.4 0.7 122.5 1.3 [á] 108.0 0.8 106.6 0.4 106.0 1.1 103.5 1.5 101.8 1.2
152

Table 9.2: High tone vowel ANOVA results
0 ms 5 ms 10 ms 15 ms 20 ms
[í] vs. [ú] F(1,4) = 2.84 p = 0.167
F(1,4) = 2.65 p = 0.179
F(1,4) = 8.02 p < 0.047
F(1,4) = 32.77 p < 0.005
F(1,4) = 52.36 p < 0.002
[é] vs.[ó] F(1,4) = 12.15 p < 0.025
F(1,4) = 121.51 p < 0.001
F(1,4) = 277.61 p < 0.0001
F(1,4) = 677.70 p < 0.0001
F(1,4) = 642.45 p < 0.0001
[í/ú] vs. [á] F(1,7) = 16.13 p < 0.01
F(1,7) = 33.63 p < 0.001
F(1,7) = 38.77 p < 0.001
F(1,7) = 49.02 p < 0.001
F(1,7) = 51.21 p < 0.001
[í/ú] vs. [é/ó] F(1,10) = 6.90 p < 0.025
F(1,10) = 11.61 p < 0.01
F(1,10) = 11.68 p < 0.007
F(1,10) = 8.05 p < 0.018
F(1,10) = 7.96 p < 0.018
[é/ó] vs. [á] F(1,7) = 2.09 p = 0.192
F(1,7) = 3.823 p = 0.091
F(1,7) = 2.150 p = 0.186
F(1,7) = 2.138 p = 0.187
F(1,7) = 2.214 p = 0.180
ANOVA comparing the mid vowels to the high and low ones indicate a complete convergence of pitch contour for the mid vowels with the low vowel. Conversely, results indicate that high vowel pitch contour range is overall completely distinct from that of the mid vowels. There is also some evidence to suggest that in some conditions there could be a connection between F0 and vowel backness for this language. For low tone, Table 10.2 gives the most compelling evidence for a neutralisation of iF0 over the majority of the vowel.5 There is also increased pitch contour interaction in the low tone environment. The graphs in Figure 4 summarises all the results. Table 10.1: Low tone vowel means by interval
Time 0 ms 5 ms 10 ms 15 ms 20 ms F0 Mean StDev Mean Stdev Mean StDev Mean StDev Mean StDev [ì] 105.2 1.8 105.0 0.5 105.5 0.8 105.5 0.4 106.2 0.5 [ù] 107.6 1.6 107.6 1.3 107.7 0.9 106.4 0.2 104.5 0.9 [è] 106.1 1.1 104.6 1.3 105.7 0.8 106.3 1.0 106.6 1.2 [ò] 106.9 2.1 105.1 2.4 103.9 2.0 102.7 1.8 101.5 1.1 [à] 109.7 1.3 108.5 1.2 105.0 1.5 104.1 0.9 105.2 1.0
Table 10.2: Low tone vowel ANOVA results
0 ms 5 ms 10 ms 15 ms 20 ms
[ì] vs. [ù] F(1,4) = 3.10 p = 0.153
F(1,4) = 10.92 p < 0.030
F(1,4) = 9.75 p < 0.035
F(1,4) = 15.55 p < 0.017
F(1,4) = 7.52 p = 0.052
[è] vs.[ò] F(1,4) = 3.79 p = 0.123
F(1,4) = 4.99 p < 0.089
F(1,4) = 0.56 p = 0.500
F(1,4) = 1.44 p = 0.297
F(1,4) = 18.25 p < 0.013
[ì/ù] vs. [à] F(1,7) = 0.05 p = 0.833
F(1,7) = 2.25 p = 0.178
F(1,7) = 1.02 p = 0.347
F(1,7) = 0.47 p = 0.514
F(1,7) = 2.34 p = 0.170
[ì/ù] vs. [è/ò] F(1,10) = 2.48 p = 0.146
F(1,10) = 0.17 p = 0.685
F(1,10) = 5.66 p < 0.039
F(1,10) = 15.27 p < 0.003
F(1,10) = 3.95 p = 0.075
[è/ò] vs. [à] F(1,7) = 2.50 p = 0.158
F(1,7) = 1.89 p = 0.212
F(1,7) = 1.35 p = 0.283
F(1,7) = 8.92 p < 0.020
F(1,17) = 5.38 p = 0.059
5 Measurements only went up to 20 ms along the vowel. Because the vowels were all preceded by sonorant consonant /m/, vowel length was relatively short normally not surpassing 25ms in length.
153

Figure 4: Speaker 2 (Male) vowel F0 means per interval
5. Discussion A number of generalizations can be made by revisiting the original hypotheses: Hypothesis 1: iF0 is gradient. True. High vowels /i, u/ are consistently higher in pitch than low vowel /a/ for both speakers. There is one exception, being the low tone vowels for Speaker 2. This is highly dependent on speaker pitch range. For Speaker 1 who has a significantly higher pitch range than Speaker 2 (cf. Table 4), when vowels are grouped by height, a gradient is apparent for both low and high tone contexts. For Speaker 1, there is no complete characteristic pitch gradient across all five vowels separately for high tone, but it exists for low tone. Further investigation is needed to examine possibility of a ‘ceiling effect’ for upper speech ranges, mirroring iF0 compression or neutralisation for low F0 occurrences. However, vowel height comparisons conclude that the height gradient is completely neutralised in this aspect for Speaker 2 low tone vowels. The results for mid vowels complicate a conclusion on their status. While it is evident mid vowels have characteristic F0, a response is beyond the scope of this current investigation. Hypothesis 2: Low tone vowels are neutralised for iF0. True, for some speakers. The range of F0 means across vowels is compressed significantly in a low tone environment. For Speaker 2, there is a complete neutralisation of iF0, whereas, for Speaker 1, the iF0 gradient remains intact due to her higher speaking range. A broader sample of participants is needed to test this. Hypothesis 3: There is no F0 distinction between front and back vowels. Inconclusive. While it has become apparent that iF0 is a function of vowel height, there is some evidence from Speaker 2 that a correlation could exist. The results of this investigation corroborate those of previous studies wherein the high, back vowel /u/ exhibits a significantly higher F0 than its front counterpart /i/ within the context of a high tone environment. However, the results of Speaker 1 were not reliable enough to consider the F0 means for front versus back vowels to be statistically different from each other. Further, those results concluded an inverse relation of vowel backness to pitch, whereby front vowels were higher than back vowels. Greater participant and sample size is required to better test this hypothesis. Given the findings for Shona vowels in this preliminary study, it would be worthwhile completing a more comprehensive investigation of iF0 in the language in the future.
154

Acknowledgments This study was conducted within the context of a Linguistics Field Methods course at the University of British Columbia. Many thanks to Calisto Mudzingwa and Shingie Makaye for sharing their language with me. Thank you also to Eric Vatikiotis-Bateson and Rose-Marie Déchaine for their guidance. References Chávez-Péon, Mario. (2005). The effect of implosives and prenasalized stops on pitch in Shona. Acoustical
Society of America Journal, 117(4):2461-2461. Connell, Bruce. (2002). Tone languages and the universality of intrinsic F0: evidence from Africa. Journal of
Phonetics, 30:101-129. Fry, Dennis B. (1958). Experiments in the perception of stress. Language and Speech, 1:126-152. Hombert, J. M. (1977). Consonant types, vowel height and tone in Yoruba, Studies in African Linguistics, 8:173-
190. Ladefoged, P. (1968). A phonetic study of West African languages: an auditory-instrumental study. Cambridge:
Cambridge University Press. Hannan, M. (1984). Standard Shona Dictionary. London: Macmillan & Co. Ltd. Myers, Scott. (2004). The effect of boundary tones on the f0 scaling of lexical tones. International Symposium on
Tonal Aspects of Languages: With Emphasis on Tone Languages. Beijing: ISCA. Pilszczikowa-Chodak, N. (1972). Tone-height correlation and tone assignment in the patterns of verb and noun
plurals in Hausa, Studies in African Linguistics, 3:399-421. Sapir, Shimon. (1989). The intrinsic pitch of vowels: Theoretical, physiological and clinical considerations.
Journal of Voice 3:44-51. Shryock, A., Ladefoged, P., & Williamson, K. (1996/7). The phonetic structures of Defaka. Journal of West
African Languages, 26(2):3-27. Snider, K. (2001). Pitch and vowel quality in Chumburung: An instrumental study. Presented at the 32nd Annual
Conference on African Linguistics, Berkeley, CA. Whalen, D.H. & Levitt, A.G. (1995). The universality of intrinsic F0 of vowels. Journal of Phonetics, 23:349-366. Whalen, D.H.; Gick, Bryan & LeSourd, Philip. (1999). Intrinsic F0 in Passamaquoddy vowels. Papers from the
30th Algonquian Conference. Winnipeg: University of Manitoba. Whalen, D.; Gick, Bryan; Kumada, Masanobu & Honda, Kiyoshi. (1998). Cricothyroid activity in high and low
vowels: exploring the automaticity of intrinsic F0. Journal of Phonetics , 125-142.
155

Selected Proceedings of the 39thAnnual Conference on African Linguistics:Linguistic Research and Languages in Africa
edited by Akinloye Ojo and Lioba MoshiCascadilla Proceedings Project Somerville, MA 2009
Copyright information
Selected Proceedings of the 39th Annual Conference on African Linguistics:Linguistic Research and Languages in Africa© 2009 Cascadilla Proceedings Project, Somerville, MA. All rights reserved
ISBN 978-1-57473-431-7 library binding
A copyright notice for each paper is located at the bottom of the first page of the paper.Reprints for course packs can be authorized by Cascadilla Proceedings Project.
Ordering information
Orders for the library binding edition are handled by Cascadilla Press.To place an order, go to www.lingref.com or contact:
Cascadilla Press, P.O. Box 440355, Somerville, MA 02144, USAphone: 1-617-776-2370, fax: 1-617-776-2271, e-mail: [email protected]
Web access and citation information
This entire proceedings can also be viewed on the web at www.lingref.com. Each paper has a unique document #which can be added to citations to facilitate access. The document # should not replace the full citation.
This paper can be cited as:
Gonzales, Ashleigh. 2009. Intrinsic F0 in Shona Vowels: A Descriptive Study. In Selected Proceedings of the 39thAnnual Conference on African Linguistics, ed. Akinloye Ojo and Lioba Moshi, 145-155. Somerville, MA:Cascadilla Proceedings Project.
or:
Gonzales, Ashleigh. 2009. Intrinsic F0 in Shona Vowels: A Descriptive Study. In Selected Proceedings of the 39thAnnual Conference on African Linguistics, ed. Akinloye Ojo and Lioba Moshi, 145-155. Somerville, MA:Cascadilla Proceedings Project. www.lingref.com, document #2194.