Embed Size (px)
Citation preview
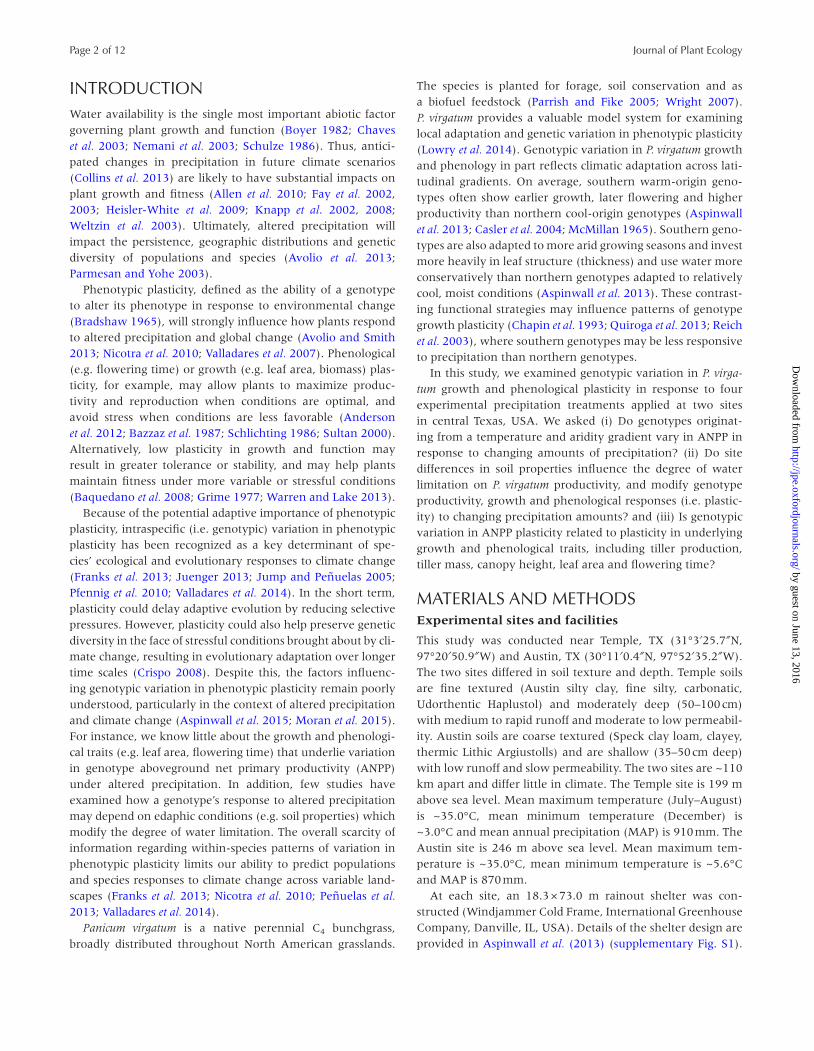
Journal of Plant EcologyPAGES 1–12
doi:10.1093/jpe/rtw040
available online at www.jpe.oxfordjournals.org
© The Author 2016. Published by Oxford University Press on behalf of the Institute of Botany, Chinese Academy of Sciences and the Botanical Society of China.
All rights reserved. For permissions, please email: [email protected]
Intraspecific variation in precipitation responses of a widespread C4 grass depends on site water limitation
Michael J. Aspinwall1,*, Philip A. Fay2, Christine V. Hawkes3,
David B. Lowry4, Albina Khasanova3, Jason Bonnette3,
Briana K. Whitaker3, Nicholas Johnson3 and Thomas E. Juenger3
1 Hawkesbury Institute for the Environment, Western Sydney University, Hawkesbury Campus, Locked Bag 1797, Penrith, New South Wales 2751, Australia
2 USDA-ARS Grassland Soil and Water Research Laboratory, 808 East Blackland Rd, Temple, TX 76502, USA3 Department of Integrative Biology, University of Texas at Austin, 1 University Station, Austin, TX 78712, USA4 Department of Plant Biology, Michigan State University, 612 Wilson Road, East Lansing, MI 48824, USA*Correspondence address. Hawkesbury Institute for the Environment, Western Sydney University, Hawkesbury Campus, Locked Bag 1797, Penrith, New South Wales 2751, Australia. Tel: +61 2 0498 599 747; E-mail: [email protected]
Abstract
AimsVariation in precipitation strongly influences plant growth, species distributions and genetic diversity. Intraspecific variation in pheno-typic plasticity, the ability of a genotype to alter its growth, morphol-ogy or physiology in response to the environment, could influence species responses to changing precipitation and climate change. Despite this, the patterns and mechanisms of intraspecific varia-tion in plasticity to variable precipitation, and the degree to which genotype responses to precipitation are influenced by variation in edaphic conditions, remain poorly understood. Thus, we determined whether genotypes of a widespread C4 grass (Panicum virgatum L., switchgrass) varied in aboveground productivity in response to changes in precipitation, and if site edaphic conditions modified genotype aboveground productivity responses to precipitation. We also determined if genotype productivity responses to precipitation are related to plasticity in underlying growth and phenological traits.
MethodsNine P. virgatum genotypes originating from an aridity gradient were grown under four treatments spanning the 10th to the 90th percentiles of annual precipitation at two sites in central Texas: one site with deep, fine-textured soils and another site with shallow, coarse-textured soils. We measured volumetric soil water content (VWC), aboveground net primary productivity (ANPP), tiller pro-duction (tiller number), average tiller mass, canopy height, leaf area index (LAI) and flowering time on all plants at both sites and examined genotype responses to changes in precipitation.
Important FindingsAcross precipitation treatments, VWC was 39% lower and more variable at the site with shallow, coarse-textured soils compared to the site with deep, fine-textured soils. ANPP averaged across genotypes and precipita-tion treatments was also 103% higher at the site with deep, fine-textured soils relative to the site with shallow, coarse-textured soils, indicating substantial differences in site water limitation. Where site water limi-tation was higher, ANPP of most genotypes increased with increasing precipitation. Where site water limitation was less, genotypes expressed variable plasticity in response to precipitation, from no change to almost a 5-fold increase in ANPP with increasing precipitation. Genotype ANPP increased with greater tiller mass, LAI and later flowering time at both sites, but not with tiller number at either site. Genotype ANPP plasticity increased with genotype tiller mass and LAI plasticity at the site with deep, fine-textured soils, and only with genotype tiller mass plasticity at the site with shallow, coarse-textured soils. Thus, variation in genotype ANPP plasticity was explained primarily by variation in tiller and leaf growth. Genotype ANPP plasticity was not associated with temperature or aridity at the genotype’s origin. Edaphic factors such as soil depth and texture may alter genotype ANPP responses to precipitation, and the underlying growth traits contributing to the ANPP response. Thus, edaphic factors may contribute to spatial variation in genotype perfor-mance and success under altered precipitation.
Keywords: climate change, Panicum virgatum, phenology, phenotypic plasticity, precipitation
Received: 2 July 2015, Revised: 18 January 2016, Accepted: 23 April 2016
Journal of Plant Ecology Advance Access published June 13, 2016 by guest on June 13, 2016
http://jpe.oxfordjournals.org/D
ownloaded from
Page 2 of 12 Journal of Plant Ecology
INTRODUCTIONWater availability is the single most important abiotic factor governing plant growth and function (Boyer 1982; Chaves et al. 2003; Nemani et al. 2003; Schulze 1986). Thus, antici-pated changes in precipitation in future climate scenarios (Collins et al. 2013) are likely to have substantial impacts on plant growth and fitness (Allen et al. 2010; Fay et al. 2002, 2003; Heisler-White et al. 2009; Knapp et al. 2002, 2008; Weltzin et al. 2003). Ultimately, altered precipitation will impact the persistence, geographic distributions and genetic diversity of populations and species (Avolio et al. 2013; Parmesan and Yohe 2003).
Phenotypic plasticity, defined as the ability of a genotype to alter its phenotype in response to environmental change (Bradshaw 1965), will strongly influence how plants respond to altered precipitation and global change (Avolio and Smith 2013; Nicotra et al. 2010; Valladares et al. 2007). Phenological (e.g. flowering time) or growth (e.g. leaf area, biomass) plas-ticity, for example, may allow plants to maximize produc-tivity and reproduction when conditions are optimal, and avoid stress when conditions are less favorable (Anderson et al. 2012; Bazzaz et al. 1987; Schlichting 1986; Sultan 2000). Alternatively, low plasticity in growth and function may result in greater tolerance or stability, and may help plants maintain fitness under more variable or stressful conditions (Baquedano et al. 2008; Grime 1977; Warren and Lake 2013).
Because of the potential adaptive importance of phenotypic plasticity, intraspecific (i.e. genotypic) variation in phenotypic plasticity has been recognized as a key determinant of spe-cies’ ecological and evolutionary responses to climate change (Franks et al. 2013; Juenger 2013; Jump and Peñuelas 2005; Pfennig et al. 2010; Valladares et al. 2014). In the short term, plasticity could delay adaptive evolution by reducing selective pressures. However, plasticity could also help preserve genetic diversity in the face of stressful conditions brought about by cli-mate change, resulting in evolutionary adaptation over longer time scales (Crispo 2008). Despite this, the factors influenc-ing genotypic variation in phenotypic plasticity remain poorly understood, particularly in the context of altered precipitation and climate change (Aspinwall et al. 2015; Moran et al. 2015). For instance, we know little about the growth and phenologi-cal traits (e.g. leaf area, flowering time) that underlie variation in genotype aboveground net primary productivity (ANPP) under altered precipitation. In addition, few studies have examined how a genotype’s response to altered precipitation may depend on edaphic conditions (e.g. soil properties) which modify the degree of water limitation. The overall scarcity of information regarding within-species patterns of variation in phenotypic plasticity limits our ability to predict populations and species responses to climate change across variable land-scapes (Franks et al. 2013; Nicotra et al. 2010; Peñuelas et al. 2013; Valladares et al. 2014).
Panicum virgatum is a native perennial C4 bunchgrass, broadly distributed throughout North American grasslands.
The species is planted for forage, soil conservation and as a biofuel feedstock (Parrish and Fike 2005; Wright 2007). P. virgatum provides a valuable model system for examining local adaptation and genetic variation in phenotypic plasticity (Lowry et al. 2014). Genotypic variation in P. virgatum growth and phenology in part reflects climatic adaptation across lati-tudinal gradients. On average, southern warm-origin geno-types often show earlier growth, later flowering and higher productivity than northern cool-origin genotypes (Aspinwall et al. 2013; Casler et al. 2004; McMillan 1965). Southern geno-types are also adapted to more arid growing seasons and invest more heavily in leaf structure (thickness) and use water more conservatively than northern genotypes adapted to relatively cool, moist conditions (Aspinwall et al. 2013). These contrast-ing functional strategies may influence patterns of genotype growth plasticity (Chapin et al. 1993; Quiroga et al. 2013; Reich et al. 2003), where southern genotypes may be less responsive to precipitation than northern genotypes.
In this study, we examined genotypic variation in P. virga-tum growth and phenological plasticity in response to four experimental precipitation treatments applied at two sites in central Texas, USA. We asked (i) Do genotypes originat-ing from a temperature and aridity gradient vary in ANPP in response to changing amounts of precipitation? (ii) Do site differences in soil properties influence the degree of water limitation on P. virgatum productivity, and modify genotype productivity, growth and phenological responses (i.e. plastic-ity) to changing precipitation amounts? and (iii) Is genotypic variation in ANPP plasticity related to plasticity in underlying growth and phenological traits, including tiller production, tiller mass, canopy height, leaf area and flowering time?
MATERIALS AND METHODSExperimental sites and facilities
This study was conducted near Temple, TX (31°3′25.7″N, 97°20′50.9″W) and Austin, TX (30°11′0.4″N, 97°52′35.2″W). The two sites differed in soil texture and depth. Temple soils are fine textured (Austin silty clay, fine silty, carbonatic, Udorthentic Haplustol) and moderately deep (50–100 cm) with medium to rapid runoff and moderate to low permeabil-ity. Austin soils are coarse textured (Speck clay loam, clayey, thermic Lithic Argiustolls) and are shallow (35–50 cm deep) with low runoff and slow permeability. The two sites are ~110 km apart and differ little in climate. The Temple site is 199 m above sea level. Mean maximum temperature (July–August) is ~35.0°C, mean minimum temperature (December) is ~3.0°C and mean annual precipitation (MAP) is 910 mm. The Austin site is 246 m above sea level. Mean maximum tem-perature is ~35.0°C, mean minimum temperature is ~5.6°C and MAP is 870 mm.
At each site, an 18.3 × 73.0 m rainout shelter was con-structed (Windjammer Cold Frame, International Greenhouse Company, Danville, IL, USA). Details of the shelter design are provided in Aspinwall et al. (2013) (supplementary Fig. S1).
by guest on June 13, 2016http://jpe.oxfordjournals.org/
Dow
nloaded from
Aspinwall et al. | Water limitation and switchgrass rainfall responses Page 3 of 12
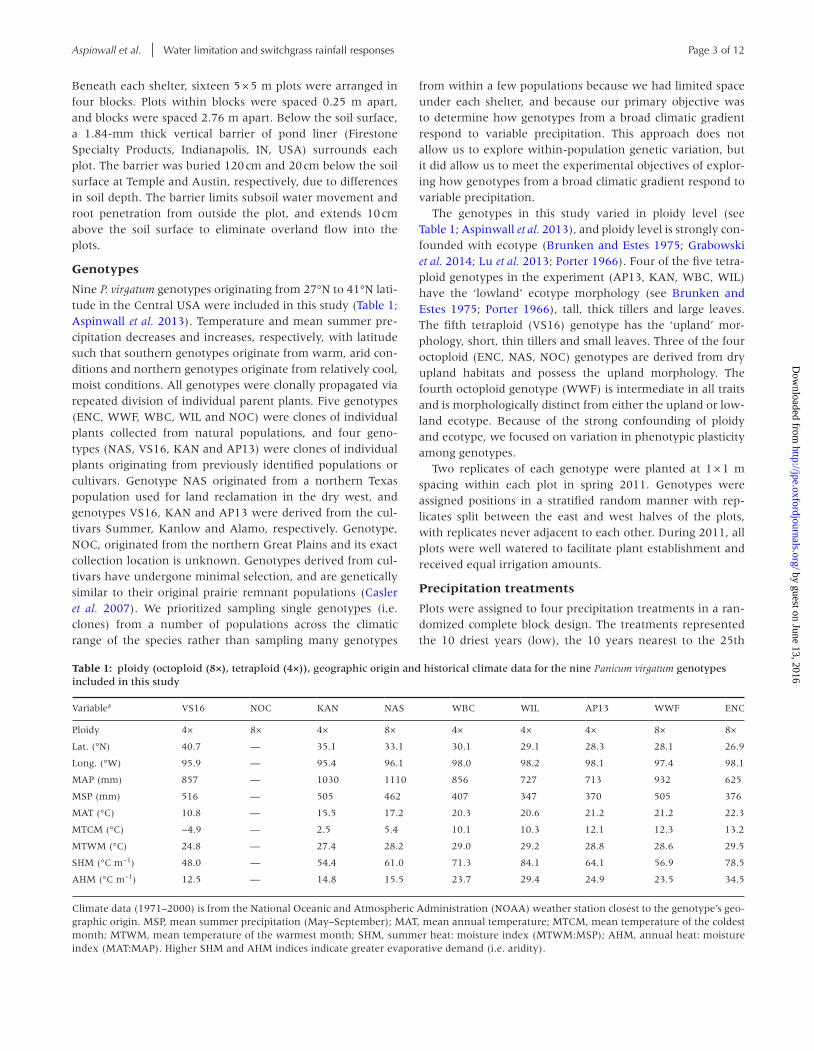
Beneath each shelter, sixteen 5 × 5 m plots were arranged in four blocks. Plots within blocks were spaced 0.25 m apart, and blocks were spaced 2.76 m apart. Below the soil surface, a 1.84-mm thick vertical barrier of pond liner (Firestone Specialty Products, Indianapolis, IN, USA) surrounds each plot. The barrier was buried 120 cm and 20 cm below the soil surface at Temple and Austin, respectively, due to differences in soil depth. The barrier limits subsoil water movement and root penetration from outside the plot, and extends 10 cm above the soil surface to eliminate overland flow into the plots.
Genotypes
Nine P. virgatum genotypes originating from 27°N to 41°N lati-tude in the Central USA were included in this study (Table 1; Aspinwall et al. 2013). Temperature and mean summer pre-cipitation decreases and increases, respectively, with latitude such that southern genotypes originate from warm, arid con-ditions and northern genotypes originate from relatively cool, moist conditions. All genotypes were clonally propagated via repeated division of individual parent plants. Five genotypes (ENC, WWF, WBC, WIL and NOC) were clones of individual plants collected from natural populations, and four geno-types (NAS, VS16, KAN and AP13) were clones of individual plants originating from previously identified populations or cultivars. Genotype NAS originated from a northern Texas population used for land reclamation in the dry west, and genotypes VS16, KAN and AP13 were derived from the cul-tivars Summer, Kanlow and Alamo, respectively. Genotype, NOC, originated from the northern Great Plains and its exact collection location is unknown. Genotypes derived from cul-tivars have undergone minimal selection, and are genetically similar to their original prairie remnant populations (Casler et al. 2007). We prioritized sampling single genotypes (i.e. clones) from a number of populations across the climatic range of the species rather than sampling many genotypes
from within a few populations because we had limited space under each shelter, and because our primary objective was to determine how genotypes from a broad climatic gradient respond to variable precipitation. This approach does not allow us to explore within-population genetic variation, but it did allow us to meet the experimental objectives of explor-ing how genotypes from a broad climatic gradient respond to variable precipitation.
The genotypes in this study varied in ploidy level (see Table 1; Aspinwall et al. 2013), and ploidy level is strongly con-founded with ecotype (Brunken and Estes 1975; Grabowski et al. 2014; Lu et al. 2013; Porter 1966). Four of the five tetra-ploid genotypes in the experiment (AP13, KAN, WBC, WIL) have the ‘lowland’ ecotype morphology (see Brunken and Estes 1975; Porter 1966), tall, thick tillers and large leaves. The fifth tetraploid (VS16) genotype has the ‘upland’ mor-phology, short, thin tillers and small leaves. Three of the four octoploid (ENC, NAS, NOC) genotypes are derived from dry upland habitats and possess the upland morphology. The fourth octoploid genotype (WWF) is intermediate in all traits and is morphologically distinct from either the upland or low-land ecotype. Because of the strong confounding of ploidy and ecotype, we focused on variation in phenotypic plasticity among genotypes.
Two replicates of each genotype were planted at 1 × 1 m spacing within each plot in spring 2011. Genotypes were assigned positions in a stratified random manner with rep-licates split between the east and west halves of the plots, with replicates never adjacent to each other. During 2011, all plots were well watered to facilitate plant establishment and received equal irrigation amounts.
Precipitation treatments
Plots were assigned to four precipitation treatments in a ran-domized complete block design. The treatments represented the 10 driest years (low), the 10 years nearest to the 25th
Table 1: ploidy (octoploid (8×), tetraploid (4×)), geographic origin and historical climate data for the nine Panicum virgatum genotypes included in this study
Variablea VS16 NOC KAN NAS WBC WIL AP13 WWF ENC
Ploidy 4× 8× 4× 8× 4× 4× 4× 8× 8×
Lat. (°N) 40.7 — 35.1 33.1 30.1 29.1 28.3 28.1 26.9
Long. (°W) 95.9 — 95.4 96.1 98.0 98.2 98.1 97.4 98.1
MAP (mm) 857 — 1030 1110 856 727 713 932 625
MSP (mm) 516 — 505 462 407 347 370 505 376
MAT (°C) 10.8 — 15.5 17.2 20.3 20.6 21.2 21.2 22.3
MTCM (°C) −4.9 — 2.5 5.4 10.1 10.3 12.1 12.3 13.2
MTWM (°C) 24.8 — 27.4 28.2 29.0 29.2 28.8 28.6 29.5
SHM (°C m−1) 48.0 — 54.4 61.0 71.3 84.1 64.1 56.9 78.5
AHM (°C m−1) 12.5 — 14.8 15.5 23.7 29.4 24.9 23.5 34.5
Climate data (1971–2000) is from the National Oceanic and Atmospheric Administration (NOAA) weather station closest to the genotype’s geo-graphic origin. MSP, mean summer precipitation (May–September); MAT, mean annual temperature; MTCM, mean temperature of the coldest month; MTWM, mean temperature of the warmest month; SHM, summer heat: moisture index (MTWM:MSP); AHM, annual heat: moisture index (MAT:MAP). Higher SHM and AHM indices indicate greater evaporative demand (i.e. aridity).
by guest on June 13, 2016http://jpe.oxfordjournals.org/
Dow
nloaded from
Page 4 of 12 Journal of Plant Ecology
percentile, the 10 years nearest to 75th percentile, and the 10 wettest years (high) at each site (Table 2). The sequence of experimental rainfall events for each treatment was pro-duced using a stochastic weather generator, LARS-WG 5.5 (Semenov et al. 1998), which was calibrated using an 87-year precipitation record at each site. The rainfall sequences approximated the historic mean amount, seasonality, size distribution and spacing of rainfall events. The treatment amounts were generally 5% higher at Temple, consistent with the long-term difference in MAP between the two sites. By defining the treatments using percentiles, the range of treat-ments spans comparable extremes at each site (Knapp et al. 2015). The treatments also encompass the full range of pre-cipitation amounts likely for these sites under future climate scenarios (Mearns et al. 2009).
Target annual amounts for the precipitation treatment per-centiles at Temple ranged from 390 to 1352 mm (Table 2), and amounts applied between treatment initiation (19 March 2012) and the final harvest (26 October 2012) ranged from 226 to 883 mm. Target annual amounts for the treatment per-centiles at Austin ranged from 345 to 1308 mm. Nominal pre-cipitation amounts applied between treatment initiation and the final harvest ranged from 249 to 910 mm.
Treatments were applied using 90° sprinklers (Hunter HP2000, Hunter Industries Inc., San Marcos, CA, USA) attached to 1 m risers on the corners of each plot. The sprin-klers were operated by a programmable controller (LEIT XRC Series Ambient Powered Irrigation Controller, DIG Corporation, Vista, CA, USA).
Microenvironmental data
Light, temperature and relative humidity conditions under each shelter were continuously monitored. Daily-integrated (total) photosynthetic photon flux density (PPFD) was meas-ured with a quantum sensor (LI-190SL; LI-COR Inc., Lincoln, NE, USA). Air temperature (Ta) and relative humidity (RH) were measured hourly using a Ta − RH sensor (CS215, Campbell Scientific Inc., Logan, UT, USA). Air temperature and RH were used to calculate vapor pressure deficit (D, kPa). Conditions under each shelter were similar; mean and maxi-mum daily Ta at Temple and Austin was ~25°C and ~34°C, respectively. Similarly, mean and maximum daily D at Temple
and Austin was 1.3 and 3.5 kPa, respectively (supplementary Fig. S2).
Volumetric soil water content (VWC, m3 m−3) was meas-ured in each plot by one soil moisture sensor (Decagon Devices 10HS, Decagon Devices Inc., Pullman, WA, USA) inserted to a depth of 20 cm. VWC was measured hourly and averaged for each day. All data were recorded using a datalogger (CR1000, Campbell Scientific Inc., Logan, UT, USA).
Flowering time, growth and aboveground productivity
Flowering time and a series of aboveground growth measures were recorded for each plant in all treatments at both sites (2 sites × 9 genotypes × 4 blocks × 4 treatments × 2 biological replicates = 576 plants). Flowering time was visually indexed as the day of year when 50% of plant tillers had reached full anthesis (F50). Leaf area index (LAI, m2 m−2) was estimated from ceptometer (AccuPAR model LP-80, Decagon Devices, Inc., Pullman, WA, USA) measurements at 10 cm height, taken in two perpendicular directions through the center of each plant. LAI and canopy height (cm) were measured during the middle of the growing season, at peak growth (18 May). On 20 October, tillers were counted and each plant was cut 10 cm above the soil surface, dried at 65°C to a constant mass, and weighed to determine aboveground net primary productiv-ity (ANPP, g m−2). Average tiller mass per plant (g dry mass tiller−1) was calculated as ANPP divided by tiller number.
Data analysis
All statistical analyses were conducted in SAS v9.3 (SAS Institute Inc. 2011). Data were analyzed using linear mixed effect models (PROC MIXED). The effects of site, precipita-tion, and genotype, and their interactions were considered fixed effects and were tested using the model:
Y S P S P G SG PG S PGijk i j i j k i k j k i j k ijk= + + + + + + + + µ ε
(1)
where Yijk represents the response variable (e.g. ANPP, canopy height, LAI, etc.), μ represents the grand mean, Si represents the ith site, Pj represents the jth precipitation treatment and Gk represents the kth genotype. All other terms represent inter-actions and εijk represents the residual. The block within site
Table 2: summary of microclimate data, precipitation amounts applied to each treatment, daily mean (± standard deviation) volumetric water content (VWC) and the coefficient of variation (CV) of daily VWC at Austin (shallow, coarse-textured soil) and Temple (deep, fine-textured soil), TX, USA
Precipitation treatment
Target annual precip (mm) Precip applieda (mm) Mean VWC (m3 m−3) CV of daily VWC (%)
Austin Temple Austin Temple Austin Temple Austin Temple
Low 345 390 249 226 0.13 (0.09) 0.23 (0.10) 65.2 42.7
25th 650 665 438 412 0.18 (0.08) 0.20 (0.09) 34.3 59.4
75th 994 964 698 599 0.19 (0.12) 0.27 (0.10) 62.3 35.5
High 1308 1352 910 883 0.24 (0.14) 0.30 (0.09) 49.2 23.9
Overall mean 0.18 (0.12) 0.25 (0.11) 66.5 46.3
acumulative precipitation applied between treatment initiation (19 March 2012) and the final harvest date (26 October 2012).
by guest on June 13, 2016http://jpe.oxfordjournals.org/
Dow
nloaded from
Aspinwall et al. | Water limitation and switchgrass rainfall responses Page 5 of 12
effect and interactions with block within site were included as random effects.
Response ratios were calculated to quantify genotype growth and flowering time plasticity in response to precipita-tion at both sites. The ratios were calculated by dividing geno-type mean trait (e.g. ANPP) values under high precipitation by genotype mean trait values under low precipitation. The response ratios describe both the direction and magnitude of genotype plasticity in response to changes in precipitation. A response ratio of 1 indicates no response and response ratios greater than and less than 1 indicate positive and negative responses to precipitation, respectively. Associations between genotype growth traits (tiller mass, tiller number, height, LAI), flowering time (F50), ANPP and their respective plastic-ity values were tested using linear regression (PROC REG).
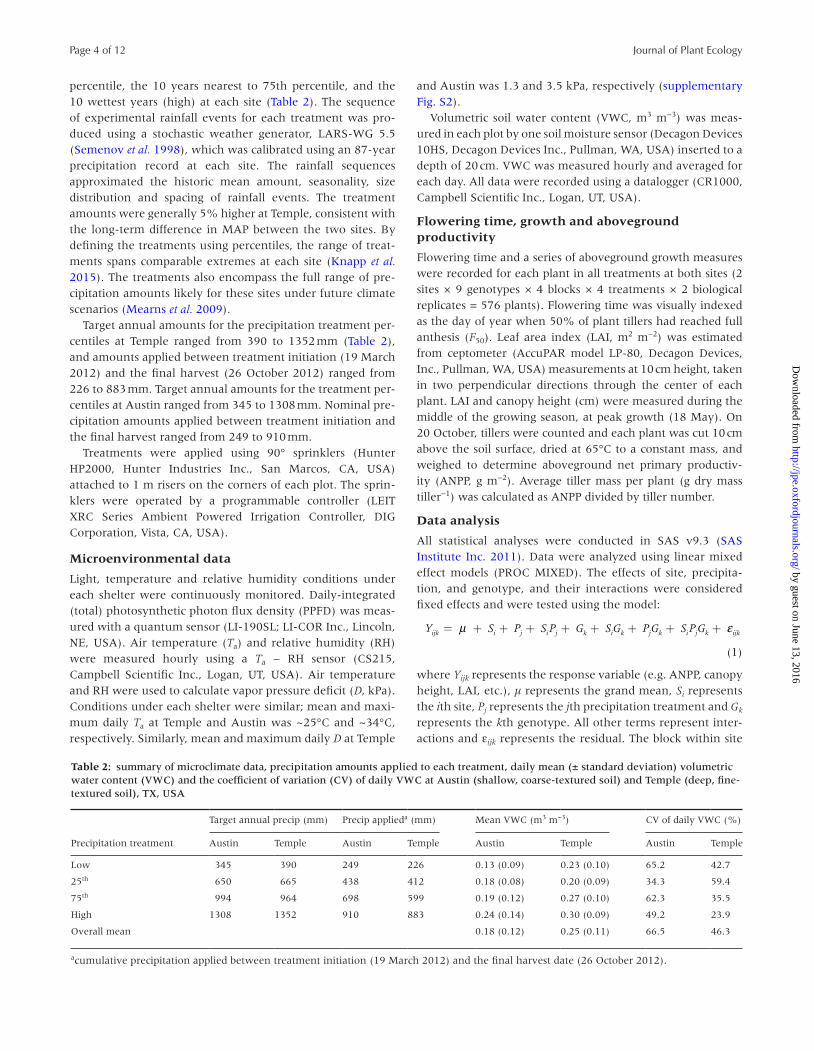
RESULTSSite differences in soil moisture, productivity and phenology
Averaged across precipitation treatments, soil VWC was 39% lower and more variable at the site with shallow, coarse-tex-tured soils (Austin) than at the site with deep, fine-textured soils (Temple; Table 2; supplementary Fig. S3). Site differences in soil moisture were associated with substantial differences in mean productivity averaged across genotypes and precipitation treat-ments (Tables 3 and 4). Mean ANPP was 103% higher; mean LAI, tiller number and tiller mass averaged 42% to 53% higher;
and flowering time was 10 days earlier at the site with deep, fine-textured soils compared to the site with shallow, coarse-textured soils (Table 4). Canopy height did not vary between sites (Table 4). Thus, for these genotypes, water limitation of ANPP was greater at the site with shallow, coarse-textured soils.
Certain genotypes exhibited notable differences in mean trait values between sites (site × genotype; Table 3). All genotypes produced more tillers on the deep, fine-textured soil relative to the shallow, coarse-textured soil, but some genotypes increased tiller production much more than oth-ers; WWF doubled mean tiller production, while VS16 only increased mean tiller production by 10% (supplementary Fig. S4a). Genotypes also varied in flowering time between sites. Later flowering genotypes (WBC, WIL, WWF, ENC) consist-ently showed earlier flowering (15–40 days) on the deep, fine-textured soil. Earlier flowering genotypes showed more variability in flowering time between sites; VS16, KAN and NAS flowered later, AP13 flowered earlier, and NOC flowering time did not change on the deep, fine-textured soil, relative to the shallow, coarse-textured soil (supplementary Fig. S4b). Genotypes showed consistent differences in canopy height across sites and precipitation treatments. Mean canopy height of KAN, WBC and AP13 was roughly double the mean canopy height of VS16, NOC and NAS (supplementary Fig. S4c).
Genotype aboveground responses to precipitation
Genotypes showed considerable variation in ANPP in response to precipitation, but the magnitude (i.e. plasticity) of their
Table 4: least-squared mean values (± standard error) for Panicum virgatum aboveground net primary productivity (ANPP) tiller mass, tiller number, leaf area index (LAI) canopy height, and flowering date (F50) for two sites in central Texas, averaged across precipitation treatments and genotypes
Variable Site = Austin (shallow, coarse-textured soil) Site = Temple (deep, fine-textured soil)
ANPP (g m−2) 622 ± 58 1261 ± 61
Tiller mass (g dry mass tiller−1) 3.85 ± 0.2 5.47 ± 0.3
Tiller number (count) 139 ± 6.0 212 ± 5.9
LAI (m2 m−2) 2.23 ± 0.2 3.39 ± 0.2
Height (cm) 100.0 ± 5.3 102.9 ± 5.3
F50 (day of year) 209 ± 1.5 199 ± 1.2
Table 3: analysis of variance of site, precipitation, and genotype effects on aboveground net primary productivity (ANPP) tiller mass, end of season tiller number, leaf area index (LAI) canopy height, and flowering time (F50), at two sites in central Texas
Effect
ANPP Tiller mass Tiller number LAI Canopy height F50
df F df F df F df F df F df F
Site (S) 1,6 58.4** 1,6 20.7* 1,6 74.2** 1,6 21.1** 1,6 0.1 1,6 31.8**
Precipitation (P) 3,18 13.1*** 3,18 17.5*** 3,18 4.4* 3,18 4.5* 3,18 7.4** 3,18 6.9**
S × P 3,18 0.3 3,18 2.7* 3,18 0.2 3,18 0.9 3,18 1.5** 3,18 6.1**
Genotype (G) 8,411 52.3*** 8,410 119.1*** 8,463 94.3*** 8,480 94.4*** 8,480 99.0*** 8,371 741.0***
S × G 8,411 7.1*** 8,410 9.8*** 8,463 16.1*** 8,480 6.3*** 8,480 1.4 24,371 16.7***
P × G 24,411 3.4*** 24,410 3.1*** 24,463 1.1 24,480 1.8* 24,480 1.1 24,371 1.1
S × P × G 24,411 1.8* 24,410 1.8* 24,463 0.9 24,480 1.3 24,480 0.9 24,371 1.0
F-values with ‘*’, ‘**’, and ‘***’ are significant at P < 0.05, P < 0.01 and P < 0.0001, respectively.
by guest on June 13, 2016http://jpe.oxfordjournals.org/
Dow
nloaded from

Page 6 of 12 Journal of Plant Ecology
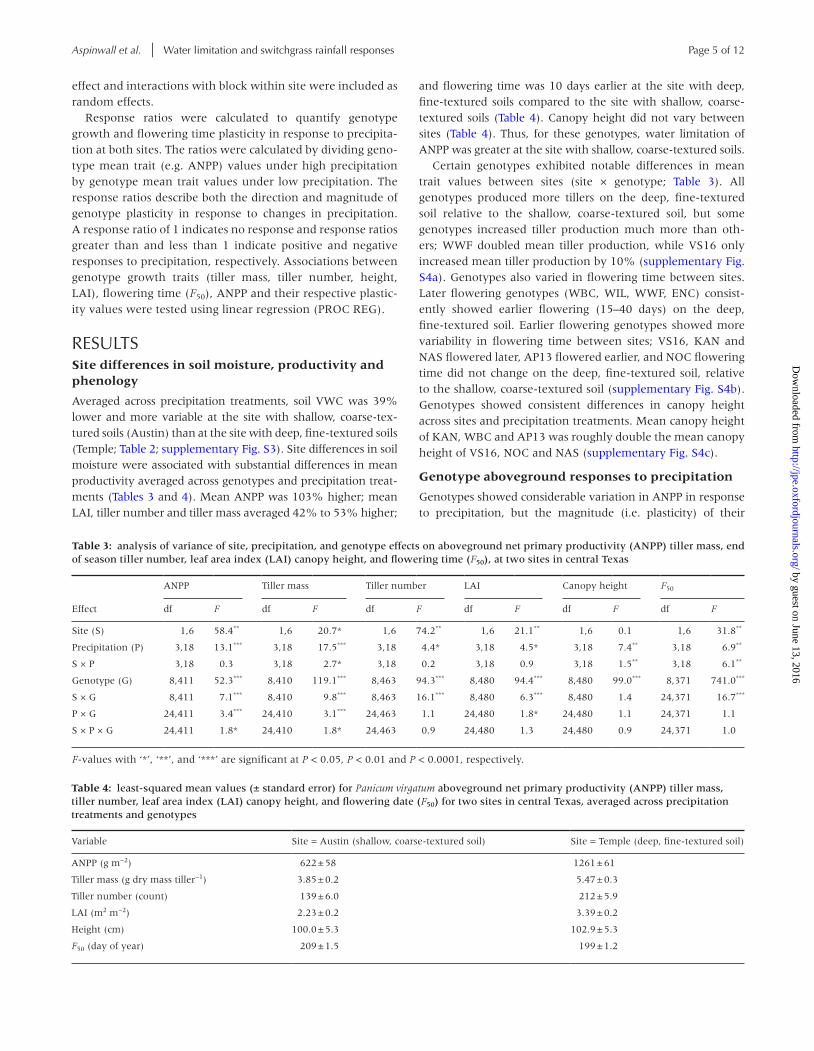
response to precipitation changed between sites (i.e. site × pre-cipitation × genotype interaction, P < 0.01; Table 3). On the deep, fine-textured soils, the two smallest genotypes, NOC and VS16, increased ANPP 200–400% with increased precipita-tion, while the two largest genotypes, WBC and WIL, increased ANPP 137–200% (Figs 1b and 2a). The remaining genotypes, KAN, NAS, AP13, WWF and ENC, showed little change in ANPP with increased precipitation (Figs 1b and 2a). On the shallow,
coarse-textured soils, all genotypes except VS16 increased ANPP with increasing precipitation (65–245%), with genotype NOC increasing ANPP over 500% (Figs 1a and 2a). Thus, the majority of genotypes showed consistent and larger increases in ANPP with increasing precipitation at the site with shallow, coarse-textured soil, where water limitation was greater.
Genotypes showed significant variation in tiller mass in response to precipitation, but the magnitude of their responses
Figure 1: least-squared mean (± standard error) values for aboveground net primary productivity (ANPP) (a,b), average tiller mass (c,d) and leaf area index (LAI) (e,f) of Panicum virgatum genotypes growing under experimental precipitation treatments at two sites in central Texas varying in soil depth and texture. Genotypes with filled symbols and dashed lines are octoploid, and genotypes with open symbols and solid lines are tetraploid genotypes.
by guest on June 13, 2016http://jpe.oxfordjournals.org/
Dow
nloaded from
Aspinwall et al. | Water limitation and switchgrass rainfall responses Page 7 of 12
also changed between sites (i.e. site × precipitation × genotype interaction; P < 0.05; Table 3). Similar to their ANPP responses
to precipitation, genotypes KAN, NAS, AP13, WWF and ENC showed a limited response to precipitation at the site with deep, fine-textured soil, but all five genotypes showed relatively large increases in tiller mass with increasing precipitation (84–198%) at the site with shallow, coarse-textured soil (Figs 1c, d and 2b). In comparison, tiller mass of VS16 and NOC increased 131–208% with increasing precipitation on the deep, fine-textured soils, but only NOC increased tiller mass on the shallow, coarse-textured soils (328%; Figs 1c, d and 2b). WBC and WIL showed similar increases in tiller mass in response to increasing precipi-tation at both sites (89–93%; Figs 1c, d and 2b).
Genotypes varied in LAI in response to precipitation, but this variation was consistent across sites (i.e. precipitation × genotype interaction; P < 0.01; Table 3). Averaged across sites, genotypes AP13, WWF and ENC showed moderate increases (12–23%) in LAI with increasing precipitation, while geno-types NOC, KAN, NAS, WBC and WIL showed larger increases (39–63%) in LAI with increasing precipitation (Figs 1e, f and 2c). The smallest genotype, VS16, showed the largest increase in LAI with increasing precipitation (~93%; Figs 1e, f and 2c).
Genotype plasticity in growth, ANPP and flowering time
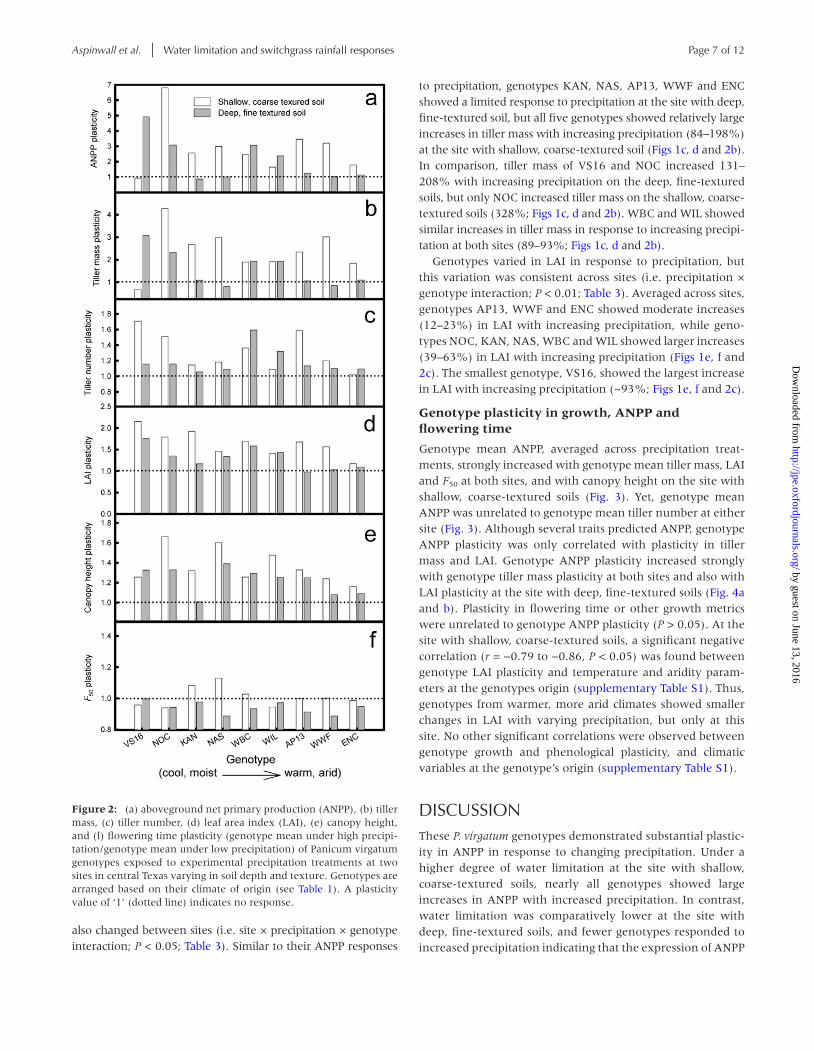
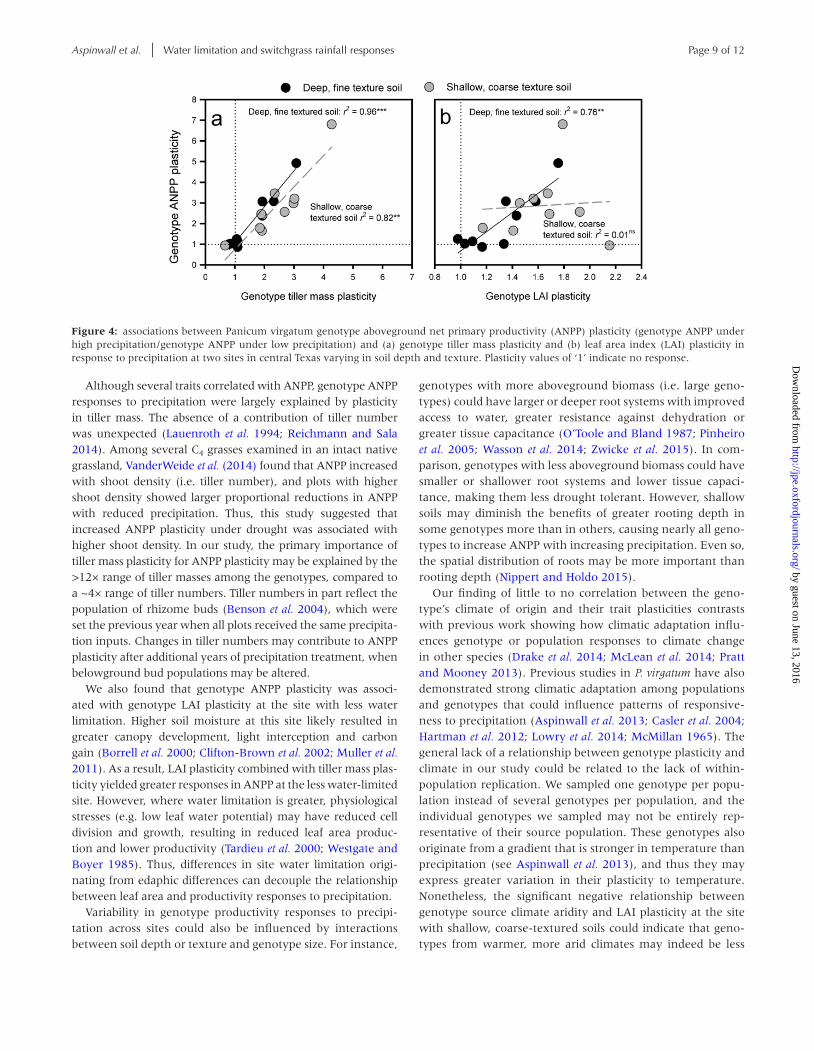
Genotype mean ANPP, averaged across precipitation treat-ments, strongly increased with genotype mean tiller mass, LAI and F50 at both sites, and with canopy height on the site with shallow, coarse-textured soils (Fig. 3). Yet, genotype mean ANPP was unrelated to genotype mean tiller number at either site (Fig. 3). Although several traits predicted ANPP, genotype ANPP plasticity was only correlated with plasticity in tiller mass and LAI. Genotype ANPP plasticity increased strongly with genotype tiller mass plasticity at both sites and also with LAI plasticity at the site with deep, fine-textured soils (Fig. 4a and b). Plasticity in flowering time or other growth metrics were unrelated to genotype ANPP plasticity (P > 0.05). At the site with shallow, coarse-textured soils, a significant negative correlation (r = −0.79 to −0.86, P < 0.05) was found between genotype LAI plasticity and temperature and aridity param-eters at the genotypes origin (supplementary Table S1). Thus, genotypes from warmer, more arid climates showed smaller changes in LAI with varying precipitation, but only at this site. No other significant correlations were observed between genotype growth and phenological plasticity, and climatic variables at the genotype’s origin (supplementary Table S1).
DISCUSSIONThese P. virgatum genotypes demonstrated substantial plastic-ity in ANPP in response to changing precipitation. Under a higher degree of water limitation at the site with shallow, coarse-textured soils, nearly all genotypes showed large increases in ANPP with increased precipitation. In contrast, water limitation was comparatively lower at the site with deep, fine-textured soils, and fewer genotypes responded to increased precipitation indicating that the expression of ANPP
Figure 2: (a) aboveground net primary production (ANPP), (b) tiller mass, (c) tiller number, (d) leaf area index (LAI), (e) canopy height, and (f) flowering time plasticity (genotype mean under high precipi-tation/genotype mean under low precipitation) of Panicum virgatum genotypes exposed to experimental precipitation treatments at two sites in central Texas varying in soil depth and texture. Genotypes are arranged based on their climate of origin (see Table 1). A plasticity value of ‘1’ (dotted line) indicates no response.
by guest on June 13, 2016http://jpe.oxfordjournals.org/
Dow
nloaded from

Page 8 of 12 Journal of Plant Ecology
plasticity differed with the edaphic properties of these sites. Genotype ANPP plasticity was predicted by tiller mass plastic-ity at both sites, and by LAI plasticity at the less water-limited
site, suggesting that mediation of water limitation by site edaphic factors determines which traits contribute to geno-type productivity responses to altered precipitation.
Figure 3: associations between Panicum virgatum genotype least-squared mean ANPP, averaged across precipitation treatments, and genotype mean growth and flowering time variables ((a) tiller mass, (b) tiller number, (c) canopy height, (d) leaf area index (LAI), (e) flowering time)) at two sites in central Texas varying in soil depth and texture. Black symbols indicate the site with deep, fine-textured soils. Gray symbols indicate the site with shallow, coarse-textured soils.
by guest on June 13, 2016http://jpe.oxfordjournals.org/
Dow
nloaded from
Aspinwall et al. | Water limitation and switchgrass rainfall responses Page 9 of 12
Although several traits correlated with ANPP, genotype ANPP responses to precipitation were largely explained by plasticity in tiller mass. The absence of a contribution of tiller number was unexpected (Lauenroth et al. 1994; Reichmann and Sala 2014). Among several C4 grasses examined in an intact native grassland, VanderWeide et al. (2014) found that ANPP increased with shoot density (i.e. tiller number), and plots with higher shoot density showed larger proportional reductions in ANPP with reduced precipitation. Thus, this study suggested that increased ANPP plasticity under drought was associated with higher shoot density. In our study, the primary importance of tiller mass plasticity for ANPP plasticity may be explained by the >12× range of tiller masses among the genotypes, compared to a ~4× range of tiller numbers. Tiller numbers in part reflect the population of rhizome buds (Benson et al. 2004), which were set the previous year when all plots received the same precipita-tion inputs. Changes in tiller numbers may contribute to ANPP plasticity after additional years of precipitation treatment, when belowground bud populations may be altered.
We also found that genotype ANPP plasticity was associ-ated with genotype LAI plasticity at the site with less water limitation. Higher soil moisture at this site likely resulted in greater canopy development, light interception and carbon gain (Borrell et al. 2000; Clifton-Brown et al. 2002; Muller et al. 2011). As a result, LAI plasticity combined with tiller mass plas-ticity yielded greater responses in ANPP at the less water-limited site. However, where water limitation is greater, physiological stresses (e.g. low leaf water potential) may have reduced cell division and growth, resulting in reduced leaf area produc-tion and lower productivity (Tardieu et al. 2000; Westgate and Boyer 1985). Thus, differences in site water limitation origi-nating from edaphic differences can decouple the relationship between leaf area and productivity responses to precipitation.
Variability in genotype productivity responses to precipi-tation across sites could also be influenced by interactions between soil depth or texture and genotype size. For instance,
genotypes with more aboveground biomass (i.e. large geno-types) could have larger or deeper root systems with improved access to water, greater resistance against dehydration or greater tissue capacitance (O’Toole and Bland 1987; Pinheiro et al. 2005; Wasson et al. 2014; Zwicke et al. 2015). In com-parison, genotypes with less aboveground biomass could have smaller or shallower root systems and lower tissue capaci-tance, making them less drought tolerant. However, shallow soils may diminish the benefits of greater rooting depth in some genotypes more than in others, causing nearly all geno-types to increase ANPP with increasing precipitation. Even so, the spatial distribution of roots may be more important than rooting depth (Nippert and Holdo 2015).
Our finding of little to no correlation between the geno-type’s climate of origin and their trait plasticities contrasts with previous work showing how climatic adaptation influ-ences genotype or population responses to climate change in other species (Drake et al. 2014; McLean et al. 2014; Pratt and Mooney 2013). Previous studies in P. virgatum have also demonstrated strong climatic adaptation among populations and genotypes that could influence patterns of responsive-ness to precipitation (Aspinwall et al. 2013; Casler et al. 2004; Hartman et al. 2012; Lowry et al. 2014; McMillan 1965). The general lack of a relationship between genotype plasticity and climate in our study could be related to the lack of within-population replication. We sampled one genotype per popu-lation instead of several genotypes per population, and the individual genotypes we sampled may not be entirely rep-resentative of their source population. These genotypes also originate from a gradient that is stronger in temperature than precipitation (see Aspinwall et al. 2013), and thus they may express greater variation in their plasticity to temperature. Nonetheless, the significant negative relationship between genotype source climate aridity and LAI plasticity at the site with shallow, coarse-textured soils could indicate that geno-types from warmer, more arid climates may indeed be less
Figure 4: associations between Panicum virgatum genotype aboveground net primary productivity (ANPP) plasticity (genotype ANPP under high precipitation/genotype ANPP under low precipitation) and (a) genotype tiller mass plasticity and (b) leaf area index (LAI) plasticity in response to precipitation at two sites in central Texas varying in soil depth and texture. Plasticity values of ‘1’ indicate no response.
by guest on June 13, 2016http://jpe.oxfordjournals.org/
Dow
nloaded from
Page 10 of 12 Journal of Plant Ecology
responsive in leaf production to precipitation than genotypes from less arid environments, particularly under conditions of intense water limitation.
Alternatively, other differences, such as ploidy level or ecotype may explain edaphic effects on genotypic variation in ANPP and trait plasticity. In P. virgatum, ‘lowland’ ecotypes adapted to riparian areas and flood plains are primarily tetra-ploid, and might be expected to exhibit greater trait plastic-ity under altered precipitation on deep-soiled or wetter sites. Conversely, ‘upland’ ecotypes from drier habitats occur pri-marily as octoploids in the central latitudes of the USA, and as both octoploids and tetraploids at higher latitudes (Brunken and Estes 1975; Costich et al. 2010; Lu et al. 2013; Porter 1966), and may have lower trait plasticity under altered pre-cipitation. Results from other studies in P. virgatum are incon-sistent: Cassida et al. (2005) found that lowland ecotypes were more sensitive to changes in soil moisture than upland ecotypes, but many other studies have found no strong or consistent relationship between genome size or ecotype vari-ation and plant growth responses to variable soil moisture (Barney et al. 2009; Hartman et al. 2012; O’Keefe et al. 2013; Wullschleger et al. 2010). In our study, tetraploid genotypes, on average, appeared to show larger increases in ANPP with increasing precipitation than octoploid genotypes at the site with deep, fine-textured soils, but not at the site with shal-low, coarse-textured soils. Alternatively, our results suggest that morphological traits, such as tiller mass or leaf area, may be stronger predictors of ANPP plasticity than genome size or ecotype classification.
We conclude that site edaphic factors that affect the degree of water limitation of plant growth, such as soil depth and tex-ture, can alter genotype productivity responses to changing precipitation, and change how plasticity in underlying traits contributes to plasticity in genotype aboveground productiv-ity. Thus, edaphic factors may contribute to spatial variation in the mechanisms contributing to genotype performance and success under altered precipitation. Understanding these mechanisms will improve predictions of plant population and species responses to climate change. Further work link-ing molecular, physiological and whole-plant responses may provide additional insight into the mechanisms of genotype productivity in responses to precipitation.
SUPPLEMENTARY MATERIALSupplementary material is available at Journal of Plant Ecology online.
ACKNOWLEDGEMENTSWe thank K. Tiner, A. Naranjo and A. Gibson for technical sup-port; several anonymous reviewers for their helpful comments; and K. Behrman for assistance with precipitation projections. USDA is an equal opportunity provider and employer. D.B.L. acknowledges sup-port from USDA-NIFA postdoctoral fellowship (2011-67012-30696). P.A.F. acknowledges support from USDA-NIFA (2010-65615-20632).
Funding. the National Science Foundation Plant Genome Research Program (IOS-0922457) to T.E.J., C.V.H. and P.A.F.Conflict of interest statement. None declared.
REFERENCESAllen CD, Macalady AK, Chenchouni H, et al. (2010) A global over-
view of drought and heat-induced tree mortality reveals emerging
climate change risks for forests. Forest Ecol Manag 259:660–84.
Anderson JT, Inouye DW, McKinney AM, et al. (2012) Phenotypic
plasticity and adaptive evolution contribute to advancing flow-
ering phenology in response to climate change. Proc Biol Sci
279:3843–52.
Aspinwall MJ, Lowry DB, Taylor SH, et al. (2013) Genotypic varia-
tion in traits linked to climate and aboveground productivity in a
widespread C4 grass: evidence for a functional trait syndrome. New
Phytol 199:966–80.
Aspinwall MJ, Loik ME, Resco de Dios V, et al. (2015) Utilizing
intraspecific variation in phenotypic plasticity to bolster agri-
cultural and forest productivity under climate change. Plant Cell
Environ 38:1752–64.
Avolio ML, Beaulieu JM, Smith MD (2013) Genetic diversity of a
dominant C4 grass is altered with increased precipitation variabil-
ity. Oecologia 171:571–81.
Avolio ML, Smith MD (2013) Mechanisms of selection: phenotypic
differences among genotypes explain patterns of selection in a
dominant species. Ecology 94:953–65.
Baquedano FJ, Valladares F, Castillo FJ (2008) Phenotypic plasticity
blurs ecotypic divergence in the response of Quercus coccifera and
Pinus halepensis to water stress. Eur J Forest Res 127:495–506.
Barney JN, Mann JJ, Kyser GB, et al. (2009) Tolerance of switchgrass
to extreme soil moisture stress: ecological implications. Plant Science
177:724–32.
Bazzaz FA, Chiariello NR, Coley PD, et al. (1987) Allocating resources
to reproduction and defense. BioScience 37:58–67.
Benson EJ, Hartnett DC, Mann KH (2004) Belowground bud banks
and meristem limitation in tallgrass prairie plant populations. Am
J Bot 91:416–21.
Bradshaw AD (1965) Evolutionary significance of phenotypic plastic-
ity in plants. Adv Genet 13:115–55.
Borrell AK, Hammer GL, Douglas ACL (2000) Does maintaining
green leaf area in sorghum improve yield under drought? I. Leaf
growth and senescence. Crop Sci 40:1026–37.
Boyer JS (1982) Plant productivity and environment. Science
218:443–8.
Brunken JN, Estes JR (1975) Cytological and morphological variation
in Panicum virgatum L. Southwest Nat 19:379–85.
Casler MD, Vogel KP, Taliaferro CM, et al. (2004) Latitudinal adapta-
tion of switchgrass populations. Crop Sci 44:293–303.
Casler MD, Vogel KP, Taliaferro CM, et al. (2007) Latitudinal and
longitudinal adaptation of switchgrass populations. Crop Sci
47:2249–60.
Cassida KA, Muir JP, Hussey MA, et al. (2005) Biomass yield and
stand characteristics of switchgrass in south central U.S. environ-
ments. Crop Sci 45:673–81.
Chapin FS, Autumn K, Pugnaire F (1993) Evolution of suites of traits
in response to environmental stress. Am Nat 142:578–92.
by guest on June 13, 2016http://jpe.oxfordjournals.org/
Dow
nloaded from
Aspinwall et al. | Water limitation and switchgrass rainfall responses Page 11 of 12
Chaves MM, Maroco JP, Pereira JS (2003) Understanding plant
responses to drought – from genes to the whole plant. Func Plant
Biol 30:239–64.
Clifton-Brown JC, Lewandowski I, Bangerth F, et al. (2002)
Comparative responses to water stress in stay-green, rapid- and
slow senescing genotypes of the biomass crop, Miscanthus. New
Phytol 154:335–45.
Collins M, Knutti R, Arblaster J, et al. (2013) Long-term climate
change: projections, commitments and irreversibility. In Stocker
TF, Qin D, Plattner GK, et al. (eds). Climate Change 2013: The Physical
Science Basis. Contribution of Working Group I of the Fifth Assessment
Report of the Intergovernmental Panel on Climate Change. New York,
NY, USA: Cambridge University Press, 1030–107.
Costich DE, Friebe B, Sheehan MJ, et al. (2010) Genome-size varia-
tion in switchgrass (Panicum virgatum): flow cytometry and cytol-
ogy reveal rampant aneuploidy. Plant Genome 3:130–41.
Crispo E (2008) Modifying effects of phenotypic plasticity on interac-
tions among natural selection, adaptation and gene flow. J Evol
Biol 21:1460–69.
Drake JE, Aspinwall MJ, Pfautsch S, et al. (2014) The capacity to cope
with climate warming declines from temperate to tropical latitudes in
two widely distributed Eucalyptus species. Glob Chang Biol 21:459–72.
Fay PA, Carlisle JD, Danner BT, et al. (2002) Altered rainfall pat-
terns, gas exchange, and growth in grasses and forbs. Int J Plant
Sci 163:549–57.
Fay PA, Carlisle JD, Knapp AK, et al. (2003) Productivity responses
to altered rainfall patterns in a C4-dominated grassland. Oecologia
137:245–51.
Franks SJ, Weber JJ, Aitken SN (2013) Evolutionary and plastic
responses to climate change in terrestrial plant populations. Evol
Appl 7:123–39.
Grabowski PP, Morris GP, Casler MD, et al. (2014) Population genomic
variation reveals roles of history, adaptation and ploidy in switch-
grass. Mol Ecol 23:4059–73.
Grime JP (1977) Evidence for the existence of three primary strate-
gies in plants and its relevance to ecological and evolutionary the-
ory. Am Nat 111:1169–94.
Hartman JC, Nippert JB, Springer CJ (2012) Ecotypic responses of
switchgrass to altered precipitation. Funct Plant Biol 39:126–36.
Heisler-White JL, Blair JM, Kelly EF, et al. (2009) Contingent produc-
tivity responses to more extreme rainfall regimes across a grassland
biome. Global Change Biol 15:2894–904.
Juenger T (2013) Natural variation and genetic constraints on drought
tolerance. Curr Opin Plant Biol 16:274–81.
Jump AS, Peñuelas J (2005) Running to stand still: adaptation and
the response of plants to rapid climate change. Ecol Lett 8:1010–20.
Knapp AK, Fay PA, Blair JM, et al. (2002) Rainfall variability, car-
bon cycling, and plant species diversity in a mesic grassland. Science
298:2202–5.
Knapp AK, Beier C, Briske DD, et al. (2008) Consequences of more
extreme precipitation regimes for terrestrial ecosystems. BioScience
9:811–21.
Knapp AK, Hoover DL, Wilcox KR, et al. (2015) Characterizing dif-
ferences in precipitation regimes of extreme wet and dry years:
implications for climate change experiments. Glob Chang Biol 21:
2624–33.
Lauenroth WK, Sala OE, Coffin DP, et al. (1994) The importance of
soil water in the recruitment of Bouteloua gracilis in the shortgrass
steppe. Ecol Appl 4:741–9.
Lowry DB, Behrman KD, Grabowski P, et al. (2014) Adaptations
between ecotypes and along environmental gradients in Panicum
virgatum. Am Nat 183:682–92.
Lu F, Lipka AE, Glaubitz J, et al. (2013) Switchgrass genomic diversity,
ploidy, and evolution: novel insights from a network-based SNP
discovery protocol. PLoS Genet 9:e1003215.
Mearns LO, Gutkowski WJ, Jones R, et al. (2009) A regional climate
change assessment program for North America. Earth and Space
Science News 90:311–2.
McLean EH, Prober SM, Stock WD, et al. (2014) Plasticity of func-
tional traits varies clinally along a rainfall gradient in Eucalyptus
tricarpa. Plant Cell Environ 37:1440–51.
McMillan C (1965) Ecotypic differentiation within four North
American Prairie Grasses. II. Behavioral variation within trans-
planted community fractions. Am J Bot 52:55–65.
Moran EV, Hartig F, Bell DM (2015) Intraspecific trait variation across
scales: implications for understanding global change responses.
Glob Chang Biol 22:137–50.
Muller B, Pantin F, Génard M, et al. (2011) Water deficits uncouple
growth from photosynthesis, increase C content, and modify the rela-
tionships between C and growth in sink organs. J Exp Bot 62:1715–29.
Nemani R, Keeling CD, Hashimoto H, et al. (2003) Climate-driven
increases in global terrestrial net primary productivity from 1982
to 1999. Science 300:1560–3.
Nicotra AB, Atkin OK, Bonser SP, et al. (2010) Plant phenotypic plas-
ticity in a changing climate. Trends Plant Sci 15:684–92.
Nippert JB, Holdo RM (2015) Challenging the maximum rooting
depth paradigm in grasslands and savannas. Funct Ecol 29:739–45.
O’Keefe K, Tomeo N, Nippert JB, et al. (2013) Population origin
and genome size do not impact Panicum virgatum (switchgrass)
responses to variable precipitation. Ecosphere 4:1–9.
O’Toole JC, Bland WL (1987) Genotypic variation in crop plant root
systems. Adv Agron 41:91–145.
Parmesan C, Yohe G. (2003) A globally coherent fingerprint of cli-
mate change impacts across natural systems. Nature 421:37–42.
Parrish DJ, Fike JH (2005) The biology and agronomy of switchgrass
for biofuels. Crit Rev Plant Sci 24:423–59.
Peñuelas J, Sardans J, Estiarte M, et al. (2013) Evidence of current
impact of climate change on life: a walk from genes to the bio-
sphere. Glob Chang Biol 8:2303–38.
Pfennig DW, Wund MA, Snell-Rood EC, et al. (2010) Phenotypic plas-
ticity’s impacts on diversification and speciation. Trends Ecol Evol
25:459–67.
Pinheiro HA, DaMatta FM, Chaves ARM, et al. (2005) Drought toler-
ance is associated with rooting depth and stomatal control of water
use in clones of Coffea canephora. Ann Bot 96:101–8.
Porter CL (1966) An analysis of variation between upland and low-
land switchgrass, Panicum virgatum L., in central Oklahoma. Ecology
47:980–92.
Pratt JD, Mooney KA (2013) Clinal adaptation and adaptive plas-
ticity in Artemisia californica: implications for the response of a
foundation species to predicted climate change. Glob Chang Biol
19:2454–66.
by guest on June 13, 2016http://jpe.oxfordjournals.org/
Dow
nloaded from
Page 12 of 12 Journal of Plant Ecology
Quiroga RE, Fernández RJ, Golluscio RA, et al. (2013) Differential
water-use strategies and drought resistance in Trichloris
crinita plants from contrasting aridity origins. Plant Ecology
214:1027–35.
Reich PB, Wright IJ, Cavender-Bares J, et al. (2003) The evolution of
plant functional variation: traits, spectra, and strategies. Int J Plant
Sci 164:143–64.
Reichmann LG, Sala OE (2014) Differential sensitivities of grassland
structural components to changes in precipitation mediate produc-
tivity response in a desert ecosystem. Funct Ecol 28:1291–8.
SAS Institute (2011) SAS software version 9.3. Copyright 2002–2010.
Cary, NC: SAS Institute Inc.
Schlichting CD (1986) The evolution of phenotypic plasticity in
plants. Annu Rev Ecol Evol Syst 17:667–93.
Schulze E-D (1986) Whole-plant responses to drought. Funct Plant
Biol 13:127–41.
Semenov MA, Brooks RJ, Barrow EM, et al. (1998) Comparison of the
WGEN and LARS-WG stochastic weather generators for diverse
climates. Climate Res 10:95–107.
Sultan SE (2000) Phenotypic plasticity for plant development, func-
tion and life history. Trends Plant Sci 5:537–42.
Tardieu F, Reymond M, Hamard P, et al. (2000) Spatial distributions
of expansion rate, cell division rate and cell size in maize leaves:
a synthesis of the effects of soil water status, evaporative demand
and temperature. J Exp Bot 51:1505–14.
Valladares F, Gianoli E, Gómez JM (2007) Ecological limits to plant
phenotypic plasticity. New Phytol 176:749–63.
Valladares F, Matesanz S, Guilhaumon F, et al. (2014) The effects of
phenotypic plasticity and local adaptation on forecasts of species
range shifts under climate change. Ecol Lett 17:1351–64.
VanderWeide BL, Hartnett DC, Carter DL (2014) Belowground bud
banks of tallgrass prairie are insensitive to multi-year, growing-
season drought. Ecosphere 5:103.
Warren RJ, Lake JK (2013) Trait plasticity, not values, best corre-
sponds with woodland plant success in novel and manipulated
habitats. J Plant Ecol 6:201–10.
Wasson AP, Rebetzke GJ, Kirkegaard JA, et al. (2014) Soil coring at mul-
tiple field environments can directly quantify variation in deep root
traits to select wheat genotypes for breeding. J Exp Bot 65:6231–49.
Weltzin JF, Loik ME, Schwinning S, et al. (2003) Assessing the
response of terrestrial ecosystems to potential changes in precipita-
tion. BioScience 53:941–52.
Westgate ME, Boyer JS (1985) Osmotic adjustment and the inhibition
of leaf, root, stem and silk growth at low water potentials in maize.
Planta 164:540–9.
Wright L (2007) Historical Perspective on How and Why Switchgrass was
Selected as a “Model” High-potential Energy Crop [ORNL/TM-2007/109].
Knoxville, Tennessee: Oak Ridge National Laboratory, 45.
Wullschleger SD, Davis EB, Borsuk ME, et al. (2010) Biomass produc-
tion in switchgrass across the United States: database description
and determinants of yield. Agron J 102:1158–68.
Zwicke M, Picon-Cochard C, Morvan-Bertrand A, et al. (2015) What
functional strategies drive drought survival and recovery of peren-
nial species from upland grassland? Ann Bot 116:1001–15.
by guest on June 13, 2016http://jpe.oxfordjournals.org/
Dow
nloaded from