Embed Size (px)
Citation preview
Intra- and Inter-Frequency Brain Network Structure inHealth and SchizophreniaFelix Siebenhuhner1,2, Shennan A. Weiss3, Richard Coppola4, Daniel R. Weinberger5,6,
Danielle S. Bassett1,7*
1 Department of Physics, University of California Santa Barbara, Santa Barbara, California, United States of America, 2 Neuroscience Center, University of Helsinki, Helsinki,
Finland, 3 Department of Neurology, Columbia University, New York, New York, United States of America, 4 MEG Core Facility, National Institute of Mental Health,
Bethesda, Maryland, United States of America, 5 Genes, Cognition and Psychosis Program, Clinical Brain Disorders Branch, National Institute of Mental Health, Bethesda,
Maryland, United States of America, 6 Lieber Institute for Brain Development, Johns Hopkins Medical Campus, Baltimore, Maryland, United States of America, 7 Sage
Center for the Study of the Mind, University of California Santa Barbara, Santa Barbara, California, United States of America
Abstract
Empirical studies over the past two decades have provided support for the hypothesis that schizophrenia is characterizedby altered connectivity patterns in functional brain networks. These alterations have been proposed as genetically mediateddiagnostic biomarkers and are thought to underlie altered cognitive functions such as working memory. However, thenature of this dysconnectivity remains far from understood. In this study, we perform an extensive analysis of functionalconnectivity patterns extracted from MEG data in 14 subjects with schizophrenia and 14 healthy controls during a 2-backworking memory task. We investigate uni-, bi- and multivariate properties of sensor time series by computing waveletentropy of and correlation between time series, and by constructing binary networks of functional connectivity both withinand between classical frequency bands (c, b, a, and h). Networks are based on the mutual information between wavelet timeseries, and estimated for each trial window separately, enabling us to consider both network topology and networkdynamics. We observed significant decreases in time series entropy and significant increases in functional connectivity inthe schizophrenia group in comparison to the healthy controls and identified an inverse relationship between thesemeasures across both subjects and sensors that varied over frequency bands and was more pronounced in controls than inpatients. The topological organization of connectivity was altered in schizophrenia specifically in high frequency c and bband networks as well as in the c-b cross-frequency networks. Network topology varied over trials to a greater extent inpatients than in controls, suggesting disease-associated alterations in dynamic network properties of brain function. Ourresults identify signatures of aberrant neurophysiological behavior in schizophrenia across uni-, bi- and multivariate scalesand lay the groundwork for further clinical studies that might lead to the discovery of new intermediate phenotypes.
Citation: Siebenhuhner F, Weiss SA, Coppola R, Weinberger DR, Bassett DS (2013) Intra- and Inter-Frequency Brain Network Structure in Health andSchizophrenia. PLoS ONE 8(8): e72351. doi:10.1371/journal.pone.0072351
Editor: Satoru Hayasaka, Wake Forest School of Medicine, United States of America
Received March 12, 2013; Accepted July 8, 2013; Published August 26, 2013
Copyright: � 2013 Siebenhuhner et al. This is an open-access article distributed under the terms of the Creative Commons Attribution License, which permitsunrestricted use, distribution, and reproduction in any medium, provided the original author and source are credited.
Funding: This work was supported by the Errett Fisher Foundation, the Templeton Foundation, the David and Lucile Packard Foundation, Public Health ServiceGrant NS44393, Sage Center for the Study of the Mind, and the Institute for Collaborative Biotechnologies through contract no. W911NF-09-D-0001 from the U.S.Army Research Oce. The authors acknowledge support from the Center for Scientic Computing at the California NanoSystems Institute and Materials ResearchLaboratory: a National Science Foundation (NSF) MRSEC (DMR- 1121053) and NSF CNS-0960316. The patients and normal controls were studied as part of theClinical Brain Disorders Branch Sibling study (D.R. Weinberger PI), an investigation of the biological components of genetic risk for schizophrenia, with directfunding of the Weinberger Lab and the National Institute of Mental Health Magnetoencephalography core facility (R. Coppola). The content is solely theresponsibility of the authors and does not necessarily represent the official views of any of the funding agencies. The funders had no role in study design, datacollection and analysis, decision to publish, or preparation of the manuscript.
Competing Interests: The authors have declared that no competing interests exist.
* E-mail: [email protected]
Introduction
Synchronous oscillatory neuronal activity is thought to form a
neurophysiological network over which the brain processes
information during cognitive processes [1,2]. Coherent neuronal
communication relies on neurotransmission dynamics dictated by
major neurotransmitters like dopamine, GABA, glutamate and
acetylcholine systems, known to be altered in schizophrenia [3–5].
Indeed, a hallmark of schizophrenia is the complex pattern of
abnormal increases and decreases in resting state and task-based
connectivity evident between large-scale brain regions [6–8]. To
quantify this dysconnectivity [4,9] at the level of the whole brain,
network theoretical tools originally developed in the social sciences
have been applied to neuroimaging data. Results demonstrate
complex dysconnectivity profiles of the brain’s anatomy [10–12]
and function [5,13–20] in people with schizophrenia [21].
Such dysconnectivity profiles, evidenced by altered brain
activity and connectivity in schizophrenia, are accompanied by
altered cognitive behavior. Due to the heterogeneity of the disease,
some symptoms including both positive (hallucinations, delusions
and thought disorder) and negative (e.g. impaired emotional
response and social interaction, avolition, anhedonia) symptoms,
vary strongly among patients. However, cognitive impairments in
executive functions (such as the manipulation of transiently stored
information [22]) and working memory (e.g., the ability to
transiently maintain and manipulate a limited amount of
information in order to guide thought or behavior) are typically
altered to varying degrees in virtually all patients. These cognitive
PLOS ONE | www.plosone.org 1 August 2013 | Volume 8 | Issue 8 | e72351

impairments appear early and change little over time, and are
therefore thought to lie at the core of the disease, contributing to
the development of clinical symptoms [23,24]. Both altered
memory and executive planning have been linked to the
neurochemistry of dopamine, GABA, glutamate and acetylcholine
systems and subsequently to aberrant (NMDAR)–mediated
synaptic plasticity [3–5].
Correlations between brain network organization and cognitive
or behavioral variables in schizophrenia are expected [25] but
quantitative evidence for such a relationship is still rare. Network-
based analyses of task-based functional connectivity could potentially
provide unique insight into the neurophysiological underpinnings
of altered cognitive function. Indeed, such approaches have been
used to link brain network organization in healthy cohorts to a
range of cognitive functions including attention [26,27], memory
[14,28–30], learning [31–34], and emotion [35] and language
processing [36]. Recent studies in schizophrenia cohorts have
further demonstrated that the organization of task-based func-
tional brain networks can be linked both to the efficacy of auditory
rehabilitation efforts [16] and to working memory performance
[5,14,30,37]. These findings suggest that the characterization of
the dynamic network of task-based synchronous brain activity
might be a powerful tool to study cognitive impairments in
schizophrenia, providing insight into the neurobiological mecha-
nisms of the disease. However, many of these studies have several
potential limitations, such as using only a small set of network
diagnostics and constructing a single functional network from a
large array of data.
In this study, we provide an expanded examination of the
functional brain network architecture in people with schizophrenia
estimated from magnetoencephalography (MEG) data acquired
during the performance of a working memory N-back task. We
apply a multiresolution approach [20] which builds on previous
work in the identification of neurophysiological markers of
schizophrenia in resting state fMRI data [19,20,38]. These studies
together hypothesize that neurophysiological alterations in schizo-
phrenia will manifest themselves as a complex hierarchy of
signatures across univariate, bivariate, and multivariate statistical
measurements. By examining these measurements in concert, we
are able identify scale-specific and scale-generic properties of
abnormalities which could have implications for understanding
putative neurobiological mechanisms.
In this multiscale approach, we focus on entropy (univariate),
functional connectivity (bivariate), and network topology (multi-
variate). More specifically, we examine gross measurements of
functional connectivity and explore their link to single time series
variability, a relationship previously identified in resting state
fMRI data [19,20,38]. To quantitatively characterize functional
brain network structure, we examine 12 binary network diagnos-
tics across a wide range of densities and employ a recently
developed statistical technique (functional data analysis) to identify
significant group differences. To detect time-varying network
structure and to increase statistical robustness, we construct an
ensemble of networks for each individual using data extracted
from 66 separate trials.
Finally, in a novel extension of the analysis of functional brain
network structure in the classical frequency bands of brain activity,
we examine functional networks constructed from the interactions
between frequency bands. Inter-frequency networks are particu-
larly interesting in the context of our examination of the N-back
task because cross-frequency interactions are thought to facilitate
memory function [39] by enabling the cross-function integration
of information over spectrally distinct processing streams [40].
Furthermore, evidence suggests that cross-frequency interactions
are altered in schizophrenia, and the strength of these alterations
has been linked to genetic risk factors for the disease [41]. Based
on a prior study showing regional specificity of increased and
decreased cross-frequency coupling in schizophrenia [41], we
expected that patterns of cross-frequency connectivity would be
significantly altered in the disease, supporting the hypothesis that
overall processing and integration of information is impaired in
schizophrenia.
Using these tools, we uncover an extensive pattern of altered
network structure and network dynamics in people with schizo-
phrenia, laying the groundwork for further studies that could
potentially lead to the identification of intermediate phenotypes
[42] and development of diagnostic biomarkers for the disease
[21,43].
Materials and Methods
Participants14 healthy volunteers and 14 people diagnosed with schizo-
phrenia spectrum disorders (according to the Diagnostic and
Statistical Manual of Mental Disorders IV criteria) took part in the
Clinical Brain Disorders Branch/National Institute of Mental
Health Genetic Study of Schizophrenia (National Institutes of
Health Study Grant NCT 00001486, Daniel R. Weinberger,
principal investigator). None of the healthy volunteers had
qualitative structural magnetic resonance imaging abnormalities
or history of psychiatric illness, depression, or loss of consciousness.
All patients were chronic (mean duration of illness 12.7+8:3(SD))outpatients, of which 12 were receiving antipsychotic medication
Figure 1. Group Differences in Activity and Connectivity.Wavelet entropy (A) and intra-frequency strength (B), averaged oversensors, in the c{-, b-, a- and h-bands for healthy controls and peoplewith schizophrenia. Asterisks indicate significant group differences asmeasured by non-parametric permutation tests (pv0:05, corrected formultiple comparisons using the Holm-Bonferroni method).doi:10.1371/journal.pone.0072351.g001
Brain Network Structure in Schizophrenia
PLOS ONE | www.plosone.org 2 August 2013 | Volume 8 | Issue 8 | e72351

at the time of the study (see Table S2 in the supplementary
information (SI)); none of the healthy volunteers were taking
psychoactive medication. Mean(STD) PANSS scores for the
patients were 15.5+4:9 on the positive symptoms scale,
18.3+9:2 on the negative symptoms scale and 34.4+9:1 on the
general psychopathology scale. For a full tabulation of PANSS
scores for participants, see Table S1 in the SI. Subjects were
matched for sex (9 males, 5 females in each group) and did not
differ significantly in age. The mean age of the healthy control
group was 30 years +7:3 (SD), and that of the patient group was
33 years +8:6 (SD).
Ethics statementThe protocol for this experiment was approved by the National
Institute of Mental Health Institutional Review Board. All healthy
participants gave informed consent in writing. We assessed the
capacity of patients to provide consent for participation in studies
on a case-by-case basis. The Human Subjects Protection Unit
(HSPU) at the National Institutes of Health performed the
capacity assessment and provided consent monitoring as needed.
For subjects without the capacity to provide informed consent,
consent was instead obtained from the holder of the Durable
Power of Attorney (DPA). For any patient who did not have legal
status (regardless of capacity) to provide informed consent, the
guardian authorized the research by signing the consent form.
When such surrogate consent was obtained, the patient indicated
assent by also signing the consent form.
Data acquisitionMEG data were acquired at the National Institute of Mental
Health in Bethesda, MD. The experimental paradigm was a visual
2-back working-memory task using numerical stimuli ranging from
1 to 4 as previously described [44]. Earlier studies using the same
task demonstrated abnormal behavioral and neuroimaging asso-
ciations with schizophrenia [45–47]. Visual stimuli (numbers in
the range from 1 to 4) were presented visually, each for 500 msec.
After the presentation of the third stimulus, the subject was asked
to respond within a 1300 ms stimulus-free period by pressing a
button to indicate the identity of the stimulus seen 2 stimuli
previously. After the presentation of the fourth stimulus (which
also comprised 500 ms), the subject was asked to respond within
the same 1300 ms stimulus-free period by pressing a button to
indicate the identity of the stimulus seen 2 stimuli previously. This
combination of presentation (500 ms) and response (1300 ms)
periods continued for the next 7 stimuli, for a total of 11 stimulus-
response periods, each 1800 ms in duration. Each subject
performed 6 blocks, each composed of 11 stimulus-response
periods. During the performance of this task, data were recorded
using a 275-channel CTF system (VSM MedTech) with a
sampling rate of 600 Hz.
Data preprocessingWe used MATLAB [48] and FieldTrip software [49], for
preprocessing of the data. Eye blinks were identified and removed
from the raw data by an automated process using a threshold
detection function, followed by a signal space separation based on
principal components analysis (PCA). Raw data were mean
corrected and filtered to attenuate background low-frequency
noise and line noise at 60 Hz by using a 0.3-Hz-width filter.
We obtained an estimate of head movement during the
recording by calculating the difference (in centimeters) between
the headcoil position prior to and following the recording. We
used a group-level cutoff criteria of an average of 0.5 cm or
smaller deviation in position pre-post. Both groups met the
criteria. Additional corrections for head movement were not
employed for several reasons. As highlighted in [50], head
movement artifact correction methods [51–54] are inherently
unstable to large movements and may also fundamentally alter the
Figure 2. Entropy and Strength: Inter-Subject Level. Scatterplots of strength and complexity of the time series, as measured by waveletentropy, for c{-, b-, a- and h-bands. Single data points represent values for each individual averaged over trials and sensors. Red markers denotesubjects with schizophrenia spectrum diagnosis; blue markers denote healthy subjects. Lines indicate best linear fits for the two groups separately
(red, SZ; and blue, HC) and we provide r2 values as indicators of goodness of fit. Similar scatterplots that code each experimental block separately areprovided in Figure S1 in the SI.doi:10.1371/journal.pone.0072351.g002
Brain Network Structure in Schizophrenia
PLOS ONE | www.plosone.org 3 August 2013 | Volume 8 | Issue 8 | e72351
MEG time series adversely, possibly due at least in part to the
assumptions of time series stationarity. Because we do not perform
source reconstruction, we follow the advice outlined in [50] by
examining the raw data for single trials in sensor space without
head movement correction. This is considered a statistically
conservative approach, prone to Type II (false negative) rather
than Type I (false positive) errors [50].
The axial gradiometers of the CTF machine have source
profiles that include information from a wide spatial range, strictly
limiting the interpretation of the anatomical location of results. To
retain the inherent correlation structure of a network of interacting
brain regions while gaining localization specificity, we transformed
the data into planar space. Using Fieldtrip, the planar transform
was applied to the data by using the function ft_megplanar. This
function represents a transformation from the radial gradient
measured by the CTF system to tangential gradient configuration,
aimed at improving localization specificity [49].
For trial-by-trial analysis, the time series were cut into epochs of
1800 ms, composed of the presentation of the third stimulus in a
set (500 ms in duration) and the stimulus-free response period
(duration 1300 ms). We refer to these 1800 ms epoch as trials
throughout the remainder of the manuscript. Because each subject
performed 6 blocks of 11 sets of stimuli, we investigated a total of
66 trials per subject.
Wavelet decompositionWe focused our investigation on frequency-band-specific
oscillations in the MEG signal by employing a wavelet analysis.
Time series were resampled to 120 Hz to constrain the frequency
bands of the wavelet transform to roughly conform to the classical
frequency bands [14]. Each frequency band of interest was
isolated by applying the maximal overlap discrete wavelet
transform to each time series [55]. In line with previous work,
we used the Daubechies 4 wavelet [14]. Wavelet scale 1 (30–
60 Hz) roughly corresponds to the c band, scale 2 (15–30 Hz) to b,
scale 3 (8–15 Hz) to a, and scale 4 (4–8 Hz) to h. Due to the
relatively short trial length (1.8 s), we did not examine frequencies
below 4 Hz. Due to the sampling frequency (120 Hz), we had
more power to estimate coefficients in the lower frequency range
of wavelet scale 1 than the upper frequency range and we
therefore refer to this scale throughout the remainder of the
manuscript as low c or c{.
Functional connectivity and complexity estimationBefore constructing functional brain networks, we characterized
each sensor’s wavelet time series and the pairwise relationship
between sensor time series. To quantify the complexity of the time
series, we computed the Shannon wavelet entropy [20,56,57],
which we describe in detail in the SI. To investigate functional
connectivity between sensors, we calculated the mutual informa-
tion (MI), which is particularly appropriate for estimating
interactions that encompass a narrow frequency band (e.g., a
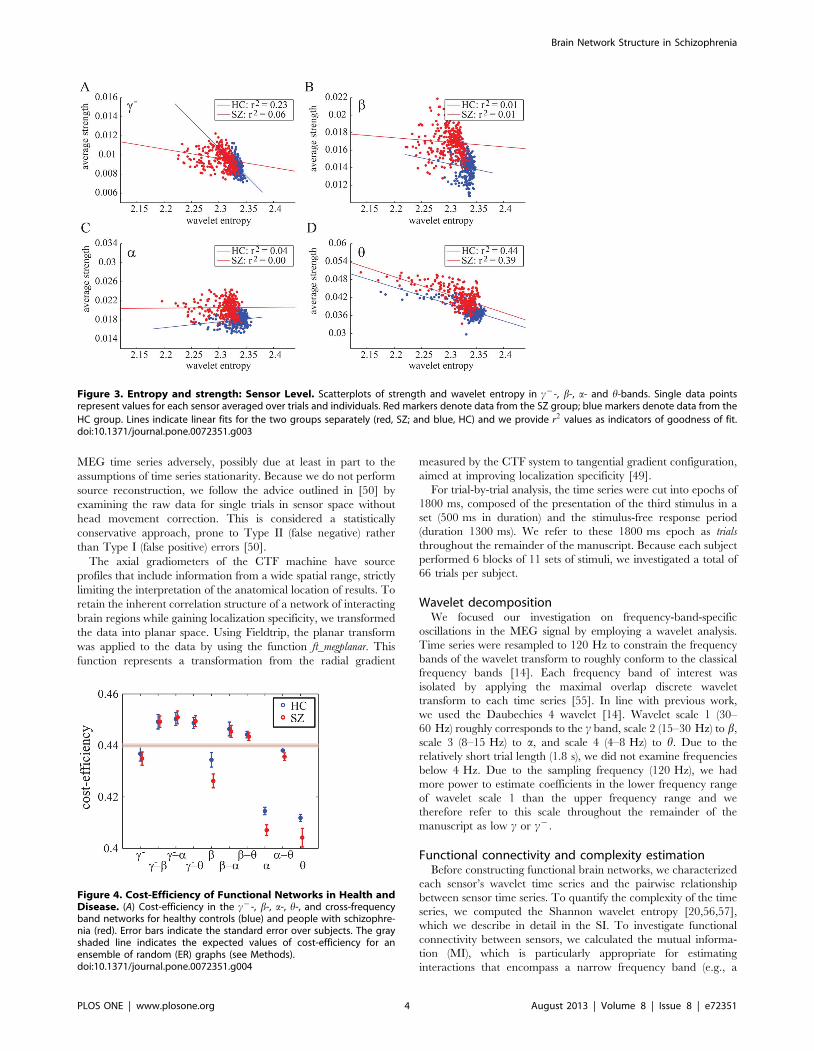
Figure 3. Entropy and strength: Sensor Level. Scatterplots of strength and wavelet entropy in c{-, b-, a- and h-bands. Single data pointsrepresent values for each sensor averaged over trials and individuals. Red markers denote data from the SZ group; blue markers denote data from the
HC group. Lines indicate linear fits for the two groups separately (red, SZ; and blue, HC) and we provide r2 values as indicators of goodness of fit.doi:10.1371/journal.pone.0072351.g003
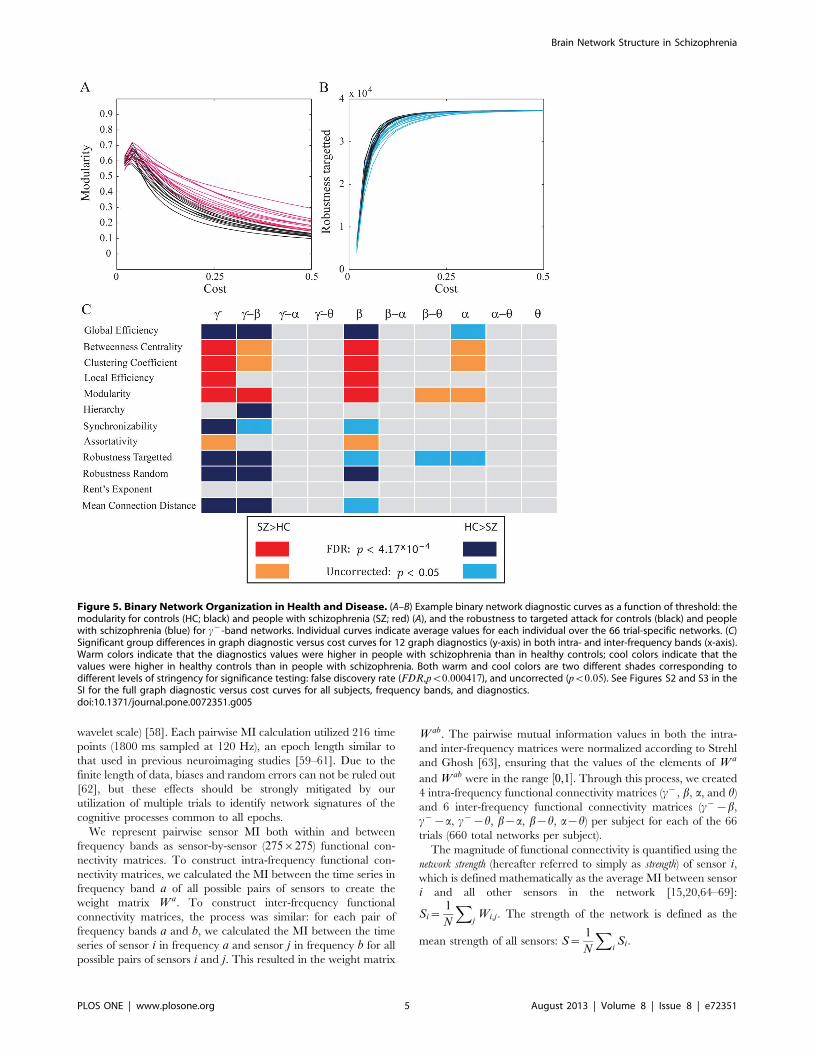
Figure 4. Cost-Efficiency of Functional Networks in Health andDisease. (A) Cost-efficiency in the c{-, b-, a-, h-, and cross-frequencyband networks for healthy controls (blue) and people with schizophre-nia (red). Error bars indicate the standard error over subjects. The grayshaded line indicates the expected values of cost-efficiency for anensemble of random (ER) graphs (see Methods).doi:10.1371/journal.pone.0072351.g004
Brain Network Structure in Schizophrenia
PLOS ONE | www.plosone.org 4 August 2013 | Volume 8 | Issue 8 | e72351
wavelet scale) [58]. Each pairwise MI calculation utilized 216 time
points (1800 ms sampled at 120 Hz), an epoch length similar to
that used in previous neuroimaging studies [59–61]. Due to the
finite length of data, biases and random errors can not be ruled out
[62], but these effects should be strongly mitigated by our
utilization of multiple trials to identify network signatures of the
cognitive processes common to all epochs.
We represent pairwise sensor MI both within and between
frequency bands as sensor-by-sensor (275|275) functional con-
nectivity matrices. To construct intra-frequency functional con-
nectivity matrices, we calculated the MI between the time series in
frequency band a of all possible pairs of sensors to create the
weight matrix W a. To construct inter-frequency functional
connectivity matrices, the process was similar: for each pair of
frequency bands a and b, we calculated the MI between the time
series of sensor i in frequency a and sensor j in frequency b for all
possible pairs of sensors i and j. This resulted in the weight matrix
W ab. The pairwise mutual information values in both the intra-
and inter-frequency matrices were normalized according to Strehl
and Ghosh [63], ensuring that the values of the elements of W a
and W ab were in the range ½0,1�. Through this process, we created
4 intra-frequency functional connectivity matrices (c{, b, a, and h)
and 6 inter-frequency functional connectivity matrices (c{{b,
c{{a, c{{h, b{a, b{h, a{h) per subject for each of the 66
trials (660 total networks per subject).
The magnitude of functional connectivity is quantified using the
network strength (hereafter referred to simply as strength) of sensor i,
which is defined mathematically as the average MI between sensor
i and all other sensors in the network [15,20,64–69]:
Si~1
N
XjWi,j . The strength of the network is defined as the
mean strength of all sensors: S~1
N
XiSi.
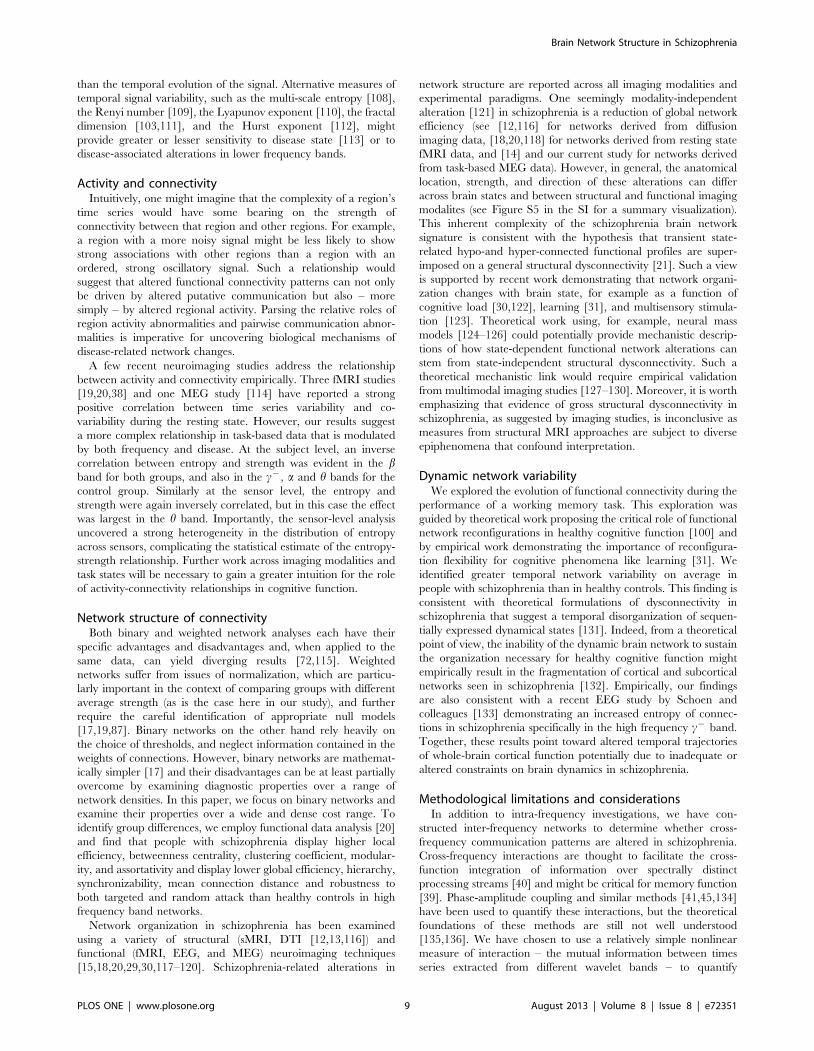
Figure 5. Binary Network Organization in Health and Disease. (A–B) Example binary network diagnostic curves as a function of threshold: themodularity for controls (HC; black) and people with schizophrenia (SZ; red) (A), and the robustness to targeted attack for controls (black) and peoplewith schizophrenia (blue) for c{-band networks. Individual curves indicate average values for each individual over the 66 trial-specific networks. (C)Significant group differences in graph diagnostic versus cost curves for 12 graph diagnostics (y-axis) in both intra- and inter-frequency bands (x-axis).Warm colors indicate that the diagnostics values were higher in people with schizophrenia than in healthy controls; cool colors indicate that thevalues were higher in healthy controls than in people with schizophrenia. Both warm and cool colors are two different shades corresponding todifferent levels of stringency for significance testing: false discovery rate (FDR,pv0:000417), and uncorrected (pv0:05). See Figures S2 and S3 in theSI for the full graph diagnostic versus cost curves for all subjects, frequency bands, and diagnostics.doi:10.1371/journal.pone.0072351.g005
Brain Network Structure in Schizophrenia
PLOS ONE | www.plosone.org 5 August 2013 | Volume 8 | Issue 8 | e72351

Network propertiesTo quantitatively characterize the topology of the intra- and
inter-frequency functional connectivity matrices, we construct sets
of binary networks summarizing the interactions (edges) between
sensors (nodes). A binary network can be represented mathematically
by an adjacency matrix A, whose entries Aij are either 0 or 1,
indicating the absence or presence of an edge respectively. Binary
networks can be obtained by thresholding a given functional
connectivity matrix in several ways [20,70]. Here we employ the
technique of cumulative thresholding, a procedure in which a
threshold is applied to the weighted functional connectivity matrix
W to retain a given percent of strongest connections. Weights
(e.g., MI values) that pass this threshold were set to a value of 1 in
the adjacency matrix A, while those that did not pass this
threshold were set to a value of 0 in the adjacency matrix A.
The percent of nonzero elements of A is also known as the
network density, or network cost K. We can employ a range of
thresholds to probe the topological organization of a network over
a range of network densities. Using a high threshold, we obtain a
sparse matrix representing the topology of the strongest functional
associations between sensors, while using a lower threshold, we
obtain a denser matrix representing the topology of functional
associations over a wider range of strengths. In this study, we
employed a set of thresholds enabling us to examine corresponding
sets of networks with densities ranging from 0 (no connections
present) to 0.5 (half of the possible number of connections present)
in steps of 0.01. We refer to this network density range 0vKv0:5as the cost regime of interest. Our choice to examine network
organization over a large range of network density values is
supported by previous studies [71,72] that have demonstrated that
the choice of threshold can have a large influence on the
topological properties of the binary graph. Moreover, our choice
to employ a variable set of thresholds to obtain a fixed set of
network densities ensures that our results are not be biased by
individual or group differences in mean strength [73].
We quantified the organization of the binary networks using the
path-length and clustering coefficient [74], global and local
efficiency [14,75,76], betweenness centrality [77], modularity
[78,79], hierarchy [13,80], synchronizability [81,82], assortativity
[13,83], and robustness [15,84]. In addition to topological network
properties, we also studied the physical measure of mean
connection distance [13], as well as a combined topophysical
property Rent’s exponent [85] which estimates the efficiency of the
topological embedding of the network into physical space.
Mathematical descriptions of these diagnostics are given in the SI.
Statistical analysesWe tested for group differences in channel power, strength and
entropy using a pairwise non-parametric permutation test
(n = 10000 permutations) and we used the Holm-Bonferroni
method for multiple comparisons correction. We examined the
reliability of network properties over subjects and trials using the
coefficient of variation (CV), which is defined as the standard
deviation s of a given sample normalized by its mean value m:
CV~s
m: ð1Þ
To test for inter-subject temporal variability in functional brain
network organization, we calculated the CV for each network
diagnostic, for each subject in both groups, and for all 10 intra-
and inter-frequency networks. Note that we excluded the
hierarchy and assortativity from this analysis because their values
are close to zero, making the CV less meaningful and more prone
to estimation errors from the division of numbers %1. To test for
group differences in temporal variability of network structure, we
used a repeated measures ANOVA with CV values averaged over
costs, group as a categorical factor, and frequency band and graph
diagnostic as repeated measures.
To identify group differences in network diagnostics, we used
Functional Data Analysis (FDA). FDA enables statistical inference
from sets of functions [86] by extending the principles of statistical
inference from data points to data curves. Here, in keeping with
Table 1. Results for a Repeated Measures ANOVA ofTemporal Variability in Network Topology, measured usingthe CV.
SSE DF MSE F p
Group 0.04 1 0.04 6.24 0.02
Frequency Band 0.41 9 0.05 52.6 0
Diagnostic 6.24 9 0.69 309.74 0
FrequencyBand*Diagnostic
1.63 81 0.02 41.83 0
FrequencyBand*Group
0.04 9 0 4.52 1.68e25
Diagnostic*Group 0.11 9 0.01 5.27 1.52e26
Frequency Band*Diagnostic*Group
0.11 81 0 2.74 4.64e214
doi:10.1371/journal.pone.0072351.t001
Figure 6. Temporal Variability of Network Diagnostics forbinary network diagnostics in the c{ and b intra-frequencynetworks and in the c{{b inter-frequency networks. CV valuesindicate temporal variability over trials for healthy (blue) andschizophrenic subjects (red), averaged over the entire range of costvalues. Error bars indicate the mean squared error over subjects andcosts. Values and error bars for synchronizability are scaled down by afactor of 10 for visualization purposes. Results for other frequencybands can be found in Figure S4 in the SI.doi:10.1371/journal.pone.0072351.g006
Brain Network Structure in Schizophrenia
PLOS ONE | www.plosone.org 6 August 2013 | Volume 8 | Issue 8 | e72351

[20], the values of the graph properties were treated as a function
of network density, and the two groups, (controls and people with
schizophrenia) were compared with a non-parametric permutation
test using twenty thousand permutations of group labels. With a
total of 120 p-values (representing 10 networks – 4 intra- and 6
inter-frequency networks – times 12 graph properties), we chose to
control for Type II errors due to multiple comparisons using a false
discovery rate correction (FDR, pv0:05=N~4:17|10{4 ).
In addition to testing for group differences in network structure,
it is often of interest to determine whether the structure of an
empirical network is different from what one would expect in a
given null model. While the development of potentially useful
network null models is ongoing [19,87], here we employ
benchmark Erdos-Renyi (ER) random graphs to test whether the
network topology identified in intra- and inter-frequency func-
tional brain networks was non-random. We created an ensemble
of 66 ER graphs for each network density and each of the 4 intra-
and 6 inter-frequency networks. Note that the number of networks
in the ensemble was set to be identical to the number of networks
in a single subject.
All computational and statistical operations were implemented
in MATLABH (2007a, The MathWorks Inc., Natick, MA).
Network diagnostics were estimated using a combination of in-
house software, the Brain Connectivity Toolbox [17], and the
MATLAB Boost Graph Library [48]. The repeated measures
ANOVA was performed using freely available code [88].
Results
Working memory performanceWe examined the accuracy of performance in the 2-back
working memory task for both the schizophrenia and control
groups. People with schizophrenia had a significantly lower
accuracy (44:4+25:5 % (STD), the median was 56.1%) than
controls (84:2+16:7 %): two sample t-test t~5:15,
p~2:23|10{5. These results confirm that working memory
function is impaired in our cohort of people with schizophrenia,
supporting an additional investigation into the patterns of brain
function during task performance.
Time series variability and co-variabilityTime series variability and co-variability. We examined
the complexity of the MEG signals in the two groups by measuring
the Shannon wavelet entropy of the sensor time series in four
classical frequency bands (c{-, b-, a- and h; see Methods). On
average, the entropy was lower in people with schizophrenia in 3
of the 4 bands (c{, b, and a); see Figure 1A.
The co-variability of sensor time series is thought to be a
measurement of synchronous oscillatory neuronal activity and
therefore potentially a proxy for large-scale communication
between brain regions. We estimated the mutual information
between sensor time series in the same four frequency bands (c{-,
b-, a- and h; see Methods). The strength of functional connectivity
of a sensor was defined as the average mutual information between
that sensor’s time series and the time series of all other sensors.
Functional connectivity displayed frequency-dependent variation,
being smallest in the highest frequency band (c{) and largest in the
lowest frequency band (h) for both groups; see Figure 1. On
average, functional connectivity was higher in people with
schizophrenia all 4 bands (c{, b, a, and h). To rule out effects
of differences in signal-to-noise ratio, we also estimated raw
channel power for all individuals in this study and found no
significant group difference (non-parametric permutation testing,
p~0:47).
Relationship between entropy and strength. Recent work
has described robust correlations between functional connectivity
and estimates of time series complexity in fMRI activity
measurements [19,20,38], which are present but altered in
schizophrenia [20,38]. Here we examine this potential relationship
in a different imaging modality (MEG) both across frequency
bands and between groups. In Figure 2, we show the strength and
entropy of each individual, averaged over sensors and trials.
Importantly, we find that correlations between the two measure-
ments at the inter-subject level are frequency-dependent. Both
groups display a significant inverse relationship between entropy
and strength in the b-band, suggesting that individuals with high
temporal variability in brain function have lower temporal co-
variability. This relationship also appears to hold for the controls
in the other frequency bands. In Figure 3, we show strength and
entropy for each sensor (rather than each individual), averaged
over trials and over individuals within a group. Again, we identify
a strong inverse relationship between entropy and strength, which
in this case is strongest in the h-band. Of note, the inhomogeneous
distribution of values characterized by a sparse low entropy tail is
consistent with data reported in [20], and potentially indicates
variation in the roles of brain areas in information processing.
Network structureGiven the group differences in connectivity identified in the
previous section, we next asked whether the patterns of
connectivity between sensors are altered in schizophrenia. We
characterize these patterns using binary network diagnostics. See
Methods for details on binary network construction and the SI for
mathematical definitions of network diagnostics.
Cost-efficiency. We constructed binary graph diagnostics as
a function of network density using a cumulative thresholding
technique (see Methods). A simple network diagnostic that
collapses such a curve into a single value is the cost-efficiency,
which is defined as the maximum of the efficiency-minus-cost
curve [14,76,89] (see the SI). In Figure 4A, we show the cost-
efficiency of both intra- and inter-frequency networks for both
groups. As expected from previous work [14], we found that cost-
efficiency values decreased with increasing frequency. Importantly,
intra-frequency networks demonstrated consistently lower cost-
efficiency than inter-frequency networks. Group differences were
only evident in intra-frequency networks (e.g., the b, a and hnetworks), with cost-efficiency being higher in the control group
than in the patient group. Inter-frequency networks, while not
demonstrating a group difference, did show a significantly higher
cost-efficiency than expected in an ensemble of Erdos-Reny
random graphs (see Methods), suggesting the presence of non-
random structure in cross-frequency interactions.
Binary network organization. While cost-efficiency has the
advantage of collapsing a binary-diagnostic versus cost curve into a
single value, it is also of interest to examine the shape of these
curves for the other diagnostics. We examined 12 binary graph
diagnostics as a function of cost for both groups and all 10
frequency bands [66]; see the Methods and the SI. We separated
diagnostics into those that showed higher values in people with
schizophrenia (e.g., see Figure 5A) and those that showed higher
values in healthy controls (e.g., see Figure 5B). We found that the
majority of significant group differences (pv0:05 uncorrected)
were located in the c{ and b intra-frequency networks and in the
c{-b cross-frequency networks; see Figure 5C. The majority of
these differences also pass corrections for multiple comparisons
with the false discovery rate (FDR) method. In the a-band, we also
observed a trend for significant group differences in 5 out of the 12
diagnostics (pv0:05 uncorrected).
Brain Network Structure in Schizophrenia
PLOS ONE | www.plosone.org 7 August 2013 | Volume 8 | Issue 8 | e72351

People with schizophrenia displayed higher global and local
efficiency, betweenness centrality, clustering coefficient, modular-
ity, and assortativity and displayed lower hierarchy, synchroniz-
ability, mean connection distance and robustness to both targeted
and random attack. In intra-frequency networks, these alterations
are consistent with an abnormality in the distributed nature of
healthy putative communication patterns present in adulthood
[90], leading to a more local, more segregated, and less integrated
information processing structure. In the c{-b inter-frequency
network, this pattern of results suggests that the integration of
information over spectrally distinct processing streams [40], likely
occurring between more distant brain areas, is impaired in
schizophrenia, potentially impacting on working memory perfor-
mance. More generally, the identification of group differences in
both topological and physical network properties suggests that
disease-associated changes in brain network organization might be
linked to multiple developmental mechanisms. Indeed, recent
theoretical work has suggested that altered constraints on both
information efficiency (a topological property) and metabolic cost
(a physical property) can lead to schizophrenia-like changes in
network architectures [91].
Variability of binary network structure. Thus far we have
reported results for each individual derived from networks
constructed from 66 trial blocks. Here we ask whether network
organization is variable over trial blocks in the two groups. To
quantify temporal variability in network structure, we computed
the coefficient of variation (CV) for network diagnostics over trial
blocks for each individual in all 10 frequency bands.
In Figure 6, we show the CV for the c{ and b intra-frequency
and the c{{b inter-frequency networks, averaged over costs (for
similar results in other frequency bands, see the SI). We observe
that the CV varies over binary graph diagnostics in a similar way
across frequency bands. We also note that in almost all cases, the
temporal variability appears to be larger for people with
schizophrenia. To quantitatively test this observation, we used a
Repeated Measures ANOVA (see Methods for details and Table 1
for results). The main effect of group (F~6:24, p~0:02)
confirmed that the networks derived from people with schizo-
phrenia varied more over time than did those derived from
healthy controls, suggesting a fundamental alteration in the
dynamics of functional brain networks in schizophrenia.
Discussion
We have examined temporal characteristics of MEG data
acquired from people with schizophrenia and controls during a
working memory task. Our approach spanned several distinct
levels, including that of the individual sensor time series
(univariate), the co-variability between time series (bivariate), and
the patterns of co-variability across sensors using binary network
diagnostics (multivariate). We identified disease-associated changes
in brain function at each level. People with schizophrenia
displayed (1) lower time series entropy, suggestive of decreased
information content of MEG signals and (2) higher strength of co-
variability between time series, suggestive of hyperconnectivity
between brain regions. Together, these results stand in contrast to
the notion of schizophrenia as a disease characterized by reduced
neurophysiological signal to noise ratios and reduced functional
connectivity. We also found that people with schizophrenia
displayed an extensive pattern of altered topological organization
in binary sensor networks. Importantly, network properties of
cross-frequency associations between time series in the c{- and b-
bands differed between groups, uncovering a novel feature of
dysconnectivity. Finally, the temporal variability of brain network
architecture in people with schizophrenia was significantly higher
than that in healthy controls, a phenomenon suggestive of
decreased dynamic constraints on brain function.
0.1. Implications for future studiesThe mechanisms of psychotic symptoms in schizophrenia, their
genetic underpinnings and their brain signatures, are far from
understood. The interpretations of neuroimaging phenomena and
related conclusions regarding neurophysiological mechanisms of
the disease, are greatly hampered by the confounding effects of
medication and disease heterogeneity associated with epiphenom-
ena related to smoking and chronicity, as well as the heterogeneity
of the mental state of ill subjects during these MEG procedures.
Thus, it is impossible to conclude that our findings represent
primary disease phenomena rather than epiphenomena related to
secondary factors that are associated with the state of illness. These
difficulties can be overcome to some degree by leveraging the
genetic similarity between people with schizophrenia and their
unaffected siblings and testing for similar imaging phenomena in
both groups.
An important goal in schizophrenia research is the identification
of intermediate phenotypes – observable characteristics that show
tiered values in patients, their siblings, and controls – which might
represent a powerful tool for the quantification of genetic risk
mechanisms for psychiatric disease [92]. Alterations in brain
functional architecture and temporal variability of brain activity
have been proposed as such phenotypes [42,93,94] and might
directly underlie the behavioral symptoms of psychosis [95].
Indeed, recent evidence suggests that functional connectivity
might be more sensitive to genetics [96,97] and to schizophrenia
[20,98] than the simple activity of brain regions alone.
Our extensive study of multiscale brain function in a small
cohort of patients lays important groundwork for future studies
that seek to uncover novel intermediate phenotypes by employing
patients’ siblings. Our results could serve to narrow the focus of
such analyses to (1) high frequency c{ and b band functional
connectivity, (2) network properties of whole-brain inter-frequency
connectivity and (2) dynamic changes in network configuration
during task performance.
Altered time series variabilitySignal variability or noise is a characteristic feature of the
cortical system [99] and is thought to facilitate the exploration of
functional network configurations necessary for healthy cognitive
function [100]. Increased variability of stimulus-induced prefrontal
electromagnetic activity has been observed in both people with
schizophrenia and their healthy siblings [93,101,102], suggesting
that cortical noise might be a genetic biomarker for the disease.
Indeed, distributed patterns of both increased and decreased signal
variability differentiate people with predominantly positive or
negative symptom profiles [103,104]. Furthermore, signal vari-
ability is behaviorally relevant, having been linked to task accuracy
in both probands and healthy controls [93,102,105]. Increased
high-frequency signal variability in people with schizophrenia has
been observed in steady state evoked potentials [106] and resting
state EEG [107]. Notably, in the latter study, this effect was most
pronounced in frontal areas in drug-naive subjects and reduced by
effective neuroleptic treatment.
Our results support the notion that signal variability is affected
in schizophrenia. By employing the simple measure of time series
entropy, we showed that signal variability was decreased in
probands in high frequency bands (c{ and b). However, it is
important to note that the Shannon entropy characterizes
properties of the distribution of values in the time series rather
Brain Network Structure in Schizophrenia
PLOS ONE | www.plosone.org 8 August 2013 | Volume 8 | Issue 8 | e72351
than the temporal evolution of the signal. Alternative measures of
temporal signal variability, such as the multi-scale entropy [108],
the Renyi number [109], the Lyapunov exponent [110], the fractal
dimension [103,111], and the Hurst exponent [112], might
provide greater or lesser sensitivity to disease state [113] or to
disease-associated alterations in lower frequency bands.
Activity and connectivityIntuitively, one might imagine that the complexity of a region’s
time series would have some bearing on the strength of
connectivity between that region and other regions. For example,
a region with a more noisy signal might be less likely to show
strong associations with other regions than a region with an
ordered, strong oscillatory signal. Such a relationship would
suggest that altered functional connectivity patterns can not only
be driven by altered putative communication but also – more
simply – by altered regional activity. Parsing the relative roles of
region activity abnormalities and pairwise communication abnor-
malities is imperative for uncovering biological mechanisms of
disease-related network changes.
A few recent neuroimaging studies address the relationship
between activity and connectivity empirically. Three fMRI studies
[19,20,38] and one MEG study [114] have reported a strong
positive correlation between time series variability and co-
variability during the resting state. However, our results suggest
a more complex relationship in task-based data that is modulated
by both frequency and disease. At the subject level, an inverse
correlation between entropy and strength was evident in the bband for both groups, and also in the c{, a and h bands for the
control group. Similarly at the sensor level, the entropy and
strength were again inversely correlated, but in this case the effect
was largest in the h band. Importantly, the sensor-level analysis
uncovered a strong heterogeneity in the distribution of entropy
across sensors, complicating the statistical estimate of the entropy-
strength relationship. Further work across imaging modalities and
task states will be necessary to gain a greater intuition for the role
of activity-connectivity relationships in cognitive function.
Network structure of connectivityBoth binary and weighted network analyses each have their
specific advantages and disadvantages and, when applied to the
same data, can yield diverging results [72,115]. Weighted
networks suffer from issues of normalization, which are particu-
larly important in the context of comparing groups with different
average strength (as is the case here in our study), and further
require the careful identification of appropriate null models
[17,19,87]. Binary networks on the other hand rely heavily on
the choice of thresholds, and neglect information contained in the
weights of connections. However, binary networks are mathemat-
ically simpler [17] and their disadvantages can be at least partially
overcome by examining diagnostic properties over a range of
network densities. In this paper, we focus on binary networks and
examine their properties over a wide and dense cost range. To
identify group differences, we employ functional data analysis [20]
and find that people with schizophrenia display higher local
efficiency, betweenness centrality, clustering coefficient, modular-
ity, and assortativity and display lower global efficiency, hierarchy,
synchronizability, mean connection distance and robustness to
both targeted and random attack than healthy controls in high
frequency band networks.
Network organization in schizophrenia has been examined
using a variety of structural (sMRI, DTI [12,13,116]) and
functional (fMRI, EEG, and MEG) neuroimaging techniques
[15,18,20,29,30,117–120]. Schizophrenia-related alterations in
network structure are reported across all imaging modalities and
experimental paradigms. One seemingly modality-independent
alteration [121] in schizophrenia is a reduction of global network
efficiency (see [12,116] for networks derived from diffusion
imaging data, [18,20,118] for networks derived from resting state
fMRI data, and [14] and our current study for networks derived
from task-based MEG data). However, in general, the anatomical
location, strength, and direction of these alterations can differ
across brain states and between structural and functional imaging
modalites (see Figure S5 in the SI for a summary visualization).
This inherent complexity of the schizophrenia brain network
signature is consistent with the hypothesis that transient state-
related hypo-and hyper-connected functional profiles are super-
imposed on a general structural dysconnectivity [21]. Such a view
is supported by recent work demonstrating that network organi-
zation changes with brain state, for example as a function of
cognitive load [30,122], learning [31], and multisensory stimula-
tion [123]. Theoretical work using, for example, neural mass
models [124–126] could potentially provide mechanistic descrip-
tions of how state-dependent functional network alterations can
stem from state-independent structural dysconnectivity. Such a
theoretical mechanistic link would require empirical validation
from multimodal imaging studies [127–130]. Moreover, it is worth
emphasizing that evidence of gross structural dysconnectivity in
schizophrenia, as suggested by imaging studies, is inconclusive as
measures from structural MRI approaches are subject to diverse
epiphenomena that confound interpretation.
Dynamic network variabilityWe explored the evolution of functional connectivity during the
performance of a working memory task. This exploration was
guided by theoretical work proposing the critical role of functional
network reconfigurations in healthy cognitive function [100] and
by empirical work demonstrating the importance of reconfigura-
tion flexibility for cognitive phenomena like learning [31]. We
identified greater temporal network variability on average in
people with schizophrenia than in healthy controls. This finding is
consistent with theoretical formulations of dysconnectivity in
schizophrenia that suggest a temporal disorganization of sequen-
tially expressed dynamical states [131]. Indeed, from a theoretical
point of view, the inability of the dynamic brain network to sustain
the organization necessary for healthy cognitive function might
empirically result in the fragmentation of cortical and subcortical
networks seen in schizophrenia [132]. Empirically, our findings
are also consistent with a recent EEG study by Schoen and
colleagues [133] demonstrating an increased entropy of connec-
tions in schizophrenia specifically in the high frequency c{ band.
Together, these results point toward altered temporal trajectories
of whole-brain cortical function potentially due to inadequate or
altered constraints on brain dynamics in schizophrenia.
Methodological limitations and considerationsIn addition to intra-frequency investigations, we have con-
structed inter-frequency networks to determine whether cross-
frequency communication patterns are altered in schizophrenia.
Cross-frequency interactions are thought to facilitate the cross-
function integration of information over spectrally distinct
processing streams [40] and might be critical for memory function
[39]. Phase-amplitude coupling and similar methods [41,45,134]
have been used to quantify these interactions, but the theoretical
foundations of these methods are still not well understood
[135,136]. We have chosen to use a relatively simple nonlinear
measure of interaction – the mutual information between times
series extracted from different wavelet bands – to quantify
Brain Network Structure in Schizophrenia
PLOS ONE | www.plosone.org 9 August 2013 | Volume 8 | Issue 8 | e72351

statistical associations between frequencies that could be studied
from a network perspective. Although outside of the scope of the
present paper, it would be interesting in future to examine the
effects of alternative estimates of these interactions on network
structure.
The data used for this study was acquired using a CTF
machine, whose axial gradiometers have source profiles that
include information from a wide spatial range, limiting the
potential for anatomical interpretations. Commonly used source
localization techniques allow for greater confidence in anatomical
localization but simultaneously change the correlation structure
between time series. Instead, to retain the inherent network
correlation structure and increase the localization specificity, we
transformed the data into planar space [14,16]. With advanced
setup and analysis techniques [50], source localization is however
becoming a more reliable option and should be considered for
future studies [137]. This however requires that head movements
be both minimized during recording, which poses difficulties with
some schizophrenic subjects especially, and corrected for during
preprocessing. We did not perform such a correction, however, the
effects of head movements on planar space trial-by-trial analysis of
short trials, should be small.
In the present study, we did not observe significant correlations
between the single-valued diagnostics (entropy, connectivity, cost-
efficiency and variability) and the accuracy of task performance,
for which our small sample size might be a factor. A more
extensive examination of the relationship between behavioral
variables and network diagnostics is outside of the scope of this
study, whose focus was primarily to identify alterations in network
structure and dynamics in schizophrenia.
Furthermore, as all of the people with schizophrenia included in
this study were on medication, most of them were smokers, and
their performance on the task was significantly worse than the
performance of the normal subjects, we can not determine
whether our findings are driven by the disease, by associated
epiphenomena, as an effect rather than a cause of the poor task
performance (e.g. altered attention, effort, distraction) or by
medication or a combination of these. To examine the effects of
these various epiphenomena, it would be important to perform a
follow-up study in unaffected siblings, for which our study gives
important guiding information.
Conclusion
Recent advances in physics and mathematics have provided
unique, robust quantitative network methods to examine the
structure and organization of whole-brain functional connectivity.
Mounting evidence from a plethora of imaging modalities,
cognitive states, and diseases underscores the utility of network
theory in capturing previously uninvestigated variations in large-
scale brain function and its alteration in disease states such as
schizophrenia [21,43,121]. In this study, we have introduced
several new methods for studying dynamic properties of brain
networks in schizophrenia, including cross-frequency networks
and temporal variation in network structure. We report a
multiresolution profile of alterations in activity, connectivity,
network topology, and network dynamics that impacts on band-
specific and cross-frequency putative communication patterns.
Our study lays important methodological groundwork for future
efforts in the identification of intermediate phenotypes [42] and in
the development of diagnostic biomarkers [21,43].
Supporting Information
Figure S1 Entropy and Strength. Correlation between the
strength of connectivity and complexity, as measured by wavelet
entropy, in c{-, b-, a- and h-bands. Single data points represent
the mean value pairs from a block of trials, trials from different
subjects are distinguished by different colors and markers. Red,
orange and pink markers denote subjects with schizophrenia
spectrum diagnosis; blue, turquoise and purple markers denote
healthy subjects. Value pairs from single subjects exhibit a
tendency to appear in clusters, which (mostly) are broken up only
at low entropy and/or high connectivity. With some subjects,
value pairs appear outside the main cluster in all bands, with
others, only in some. Also displayed are fitted linear functions for
the two groups (red and blue lines) with r2 values as indicators of
goodness of fit. It should be noted that these were obtained by
fitting to the mean value pairs for subjects, averaged over all 6
blocks of trials. This was done to avoid fitting to values for which
there are two sources of variance (subjects and blocks). These fits
indicate a negative correlation between entropy and strength,
especially for healthy subjects where r2 values are much higher.
(EPS)
Figure S2 Network Diagnostics: Part I. One set of six
network diagnostics (global efficiency, betweenness centrality,
clustering coefficient, local efficiency, modularity, and hierarchy)
is plotted as a function of density in networks within and between
frequency bands. Each curve represents one subject, values
averaged over all 66 trials. Curves for healthy controls are black,
those for SZ patients colored. The two sets of curves were tested
for statistically significant difference with Functional Data Analysis
(FDA), the resulting p-values are given. Where significance
(pv0:05) was calculated, the color of the SZ curves was set to
red, purple otherwise. We see significant differences for most
diagnostics between the groups in the c{, b and a bands, as well as
for the c{{b cross-frequency network.
(EPS)
Figure S3 Network Diagnostics: Part II. A second set of six
network diagnostics (synchronizability, assortativity, robustness to
targeted and random attack, Rent’s exponent, and mean
connection distance) is plotted as a function of density in networks
within and between frequency bands. Each curve represents one
subject, values averaged over all 66 trials. Curves for healthy
controls are black, those for SZ patients colored. The two sets of
curves were tested for statistically significant difference with
Functional Data Analysis (FDA), the resulting p-values are given.
Where significance (pv0:05) was calculated, the color of the SZ
curves was set to red, purple otherwise. In the c{ and b bands, as
well as in the c{{b cross-frequency network, we see again a
majority of diagnostics showing significant (pv0:05) differences,
but not in the a band.
(EPS)
Figure S4 Variability of network diagnostics. Coefficient
of variation for binary network diagnostics in all intra- and inter-
frequency networks. Values indicate variability over trials,
averaged over all healthy (blue) and schizophrenic subjects (blue)
and over the entire range of cost values. Error bars indicate the
square mean of the standard errors over subjects and costs.
(EPS)
Figure S5 Comparison of Whole-Brain Network Met-rics. Results for a variety of network metrics are compared across
different studies. (Top Panel): Resting-state fMRI studies
[15,18,20,118,120,138]. (Middle Panel) Structural studies
Brain Network Structure in Schizophrenia
PLOS ONE | www.plosone.org 10 August 2013 | Volume 8 | Issue 8 | e72351
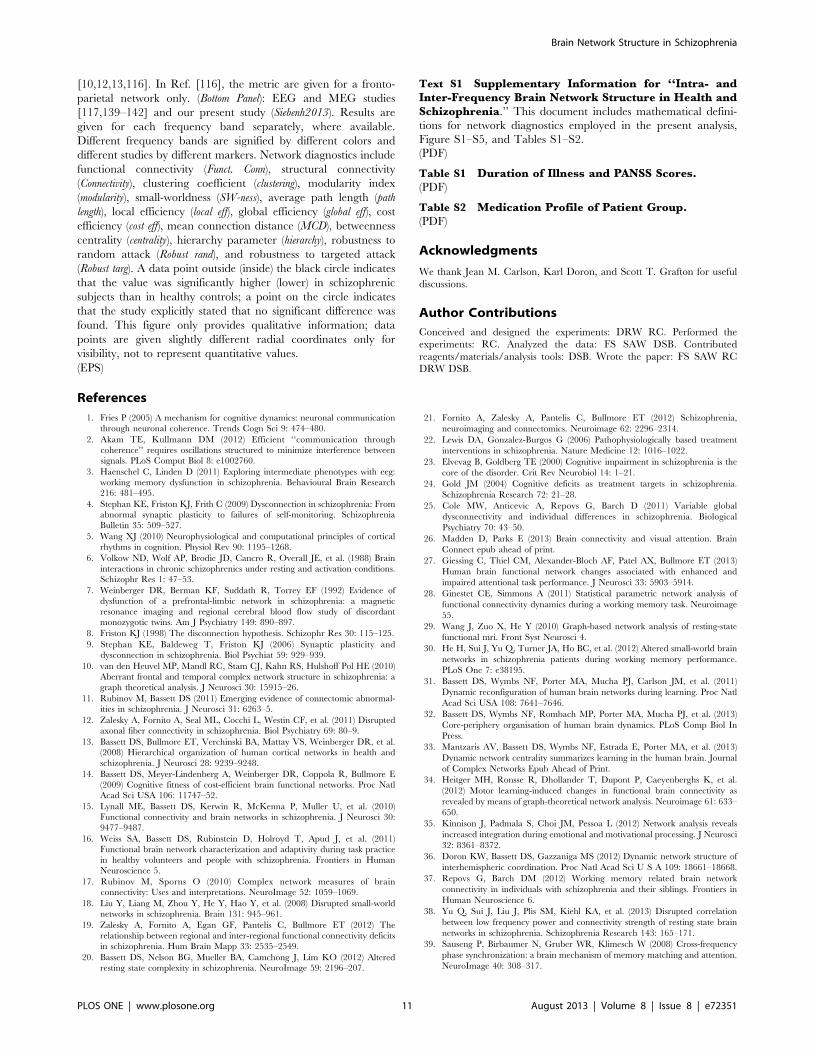
[10,12,13,116]. In Ref. [116], the metric are given for a fronto-
parietal network only. (Bottom Panel): EEG and MEG studies
[117,139–142] and our present study (Siebenh2013). Results are
given for each frequency band separately, where available.
Different frequency bands are signified by different colors and
different studies by different markers. Network diagnostics include
functional connectivity (Funct. Conn), structural connectivity
(Connectivity), clustering coefficient (clustering), modularity index
(modularity), small-worldness (SW-ness), average path length (path
length), local efficiency (local eff), global efficiency (global eff), cost
efficiency (cost eff), mean connection distance (MCD), betweenness
centrality (centrality), hierarchy parameter (hierarchy), robustness to
random attack (Robust rand), and robustness to targeted attack
(Robust targ). A data point outside (inside) the black circle indicates
that the value was significantly higher (lower) in schizophrenic
subjects than in healthy controls; a point on the circle indicates
that the study explicitly stated that no significant difference was
found. This figure only provides qualitative information; data
points are given slightly different radial coordinates only for
visibility, not to represent quantitative values.
(EPS)
Text S1 Supplementary Information for ‘‘Intra- andInter-Frequency Brain Network Structure in Health andSchizophrenia.’’ This document includes mathematical defini-
tions for network diagnostics employed in the present analysis,
Figure S1–S5, and Tables S1–S2.
(PDF)
Table S1 Duration of Illness and PANSS Scores.(PDF)
Table S2 Medication Profile of Patient Group.(PDF)
Acknowledgments
We thank Jean M. Carlson, Karl Doron, and Scott T. Grafton for useful
discussions.
Author Contributions
Conceived and designed the experiments: DRW RC. Performed the
experiments: RC. Analyzed the data: FS SAW DSB. Contributed
reagents/materials/analysis tools: DSB. Wrote the paper: FS SAW RC
DRW DSB.
References
1. Fries P (2005) A mechanism for cognitive dynamics: neuronal communication
through neuronal coherence. Trends Cogn Sci 9: 474–480.
2. Akam TE, Kullmann DM (2012) Efficient ‘‘communication throughcoherence’’ requires oscillations structured to minimize interference between
signals. PLoS Comput Biol 8: e1002760.
3. Haenschel C, Linden D (2011) Exploring intermediate phenotypes with eeg:
working memory dysfunction in schizophrenia. Behavioural Brain Research216: 481–495.
4. Stephan KE, Friston KJ, Frith C (2009) Dysconnection in schizophrenia: Fromabnormal synaptic plasticity to failures of self-monitoring. Schizophrenia
Bulletin 35: 509–527.
5. Wang XJ (2010) Neurophysiological and computational principles of cortical
rhythms in cognition. Physiol Rev 90: 1195–1268.
6. Volkow ND, Wolf AP, Brodie JD, Cancro R, Overall JE, et al. (1988) Brain
interactions in chronic schizophrenics under resting and activation conditions.Schizophr Res 1: 47–53.
7. Weinberger DR, Berman KF, Suddath R, Torrey EF (1992) Evidence of
dysfunction of a prefrontal-limbic network in schizophrenia: a magnetic
resonance imaging and regional cerebral blood flow study of discordantmonozygotic twins. Am J Psychiatry 149: 890–897.
8. Friston KJ (1998) The disconnection hypothesis. Schizophr Res 30: 115–125.
9. Stephan KE, Baldeweg T, Friston KJ (2006) Synaptic plasticity anddysconnection in schizophrenia. Biol Psychiat 59: 929–939.
10. van den Heuvel MP, Mandl RC, Stam CJ, Kahn RS, Hulshoff Pol HE (2010)
Aberrant frontal and temporal complex network structure in schizophrenia: a
graph theoretical analysis. J Neurosci 30: 15915–26.
11. Rubinov M, Bassett DS (2011) Emerging evidence of connectomic abnormal-ities in schizophrenia. J Neurosci 31: 6263–5.
12. Zalesky A, Fornito A, Seal ML, Cocchi L, Westin CF, et al. (2011) Disruptedaxonal fiber connectivity in schizophrenia. Biol Psychiatry 69: 80–9.
13. Bassett DS, Bullmore ET, Verchinski BA, Mattay VS, Weinberger DR, et al.(2008) Hierarchical organization of human cortical networks in health and
schizophrenia. J Neurosci 28: 9239–9248.
14. Bassett DS, Meyer-Lindenberg A, Weinberger DR, Coppola R, Bullmore E
(2009) Cognitive fitness of cost-efficient brain functional networks. Proc NatlAcad Sci USA 106: 11747–52.
15. Lynall ME, Bassett DS, Kerwin R, McKenna P, Muller U, et al. (2010)
Functional connectivity and brain networks in schizophrenia. J Neurosci 30:
9477–9487.
16. Weiss SA, Bassett DS, Rubinstein D, Holroyd T, Apud J, et al. (2011)Functional brain network characterization and adaptivity during task practice
in healthy volunteers and people with schizophrenia. Frontiers in Human
Neuroscience 5.
17. Rubinov M, Sporns O (2010) Complex network measures of brainconnectivity: Uses and interpretations. NeuroImage 52: 1059–1069.
18. Liu Y, Liang M, Zhou Y, He Y, Hao Y, et al. (2008) Disrupted small-worldnetworks in schizophrenia. Brain 131: 945–961.
19. Zalesky A, Fornito A, Egan GF, Pantelis C, Bullmore ET (2012) The
relationship between regional and inter-regional functional connectivity deficits
in schizophrenia. Hum Brain Mapp 33: 2535–2549.
20. Bassett DS, Nelson BG, Mueller BA, Camchong J, Lim KO (2012) Alteredresting state complexity in schizophrenia. NeuroImage 59: 2196–207.
21. Fornito A, Zalesky A, Pantelis C, Bullmore ET (2012) Schizophrenia,
neuroimaging and connectomics. Neuroimage 62: 2296–2314.
22. Lewis DA, Gonzalez-Burgos G (2006) Pathophysiologically based treatment
interventions in schizophrenia. Nature Medicine 12: 1016–1022.
23. Elvevag B, Goldberg TE (2000) Cognitive impairment in schizophrenia is the
core of the disorder. Crit Rev Neurobiol 14: 1–21.
24. Gold JM (2004) Cognitive deficits as treatment targets in schizophrenia.
Schizophrenia Research 72: 21–28.
25. Cole MW, Anticevic A, Repovs G, Barch D (2011) Variable global
dysconnectivity and individual differences in schizophrenia. Biological
Psychiatry 70: 43–50.
26. Madden D, Parks E (2013) Brain connectivity and visual attention. Brain
Connect epub ahead of print.
27. Giessing C, Thiel CM, Alexander-Bloch AF, Patel AX, Bullmore ET (2013)
Human brain functional network changes associated with enhanced and
impaired attentional task performance. J Neurosci 33: 5903–5914.
28. Ginestet CE, Simmons A (2011) Statistical parametric network analysis of
functional connectivity dynamics during a working memory task. Neuroimage
55.
29. Wang J, Zuo X, He Y (2010) Graph-based network analysis of resting-state
functional mri. Front Syst Neurosci 4.
30. He H, Sui J, Yu Q, Turner JA, Ho BC, et al. (2012) Altered small-world brain
networks in schizophrenia patients during working memory performance.
PLoS One 7: e38195.
31. Bassett DS, Wymbs NF, Porter MA, Mucha PJ, Carlson JM, et al. (2011)
Dynamic reconfiguration of human brain networks during learning. Proc Natl
Acad Sci USA 108: 7641–7646.
32. Bassett DS, Wymbs NF, Rombach MP, Porter MA, Mucha PJ, et al. (2013)
Core-periphery organisation of human brain dynamics. PLoS Comp Biol In
Press.
33. Mantzaris AV, Bassett DS, Wymbs NF, Estrada E, Porter MA, et al. (2013)
Dynamic network centrality summarizes learning in the human brain. Journal
of Complex Networks Epub Ahead of Print.
34. Heitger MH, Ronsse R, Dhollander T, Dupont P, Caeyenberghs K, et al.
(2012) Motor learning-induced changes in functional brain connectivity as
revealed by means of graph-theoretical network analysis. Neuroimage 61: 633–
650.
35. Kinnison J, Padmala S, Choi JM, Pessoa L (2012) Network analysis reveals
increased integration during emotional and motivational processing. J Neurosci
32: 8361–8372.
36. Doron KW, Bassett DS, Gazzaniga MS (2012) Dynamic network structure of
interhemispheric coordination. Proc Natl Acad Sci U S A 109: 18661–18668.
37. Repovs G, Barch DM (2012) Working memory related brain network
connectivity in individuals with schizophrenia and their siblings. Frontiers in
Human Neuroscience 6.
38. Yu Q, Sui J, Liu J, Plis SM, Kiehl KA, et al. (2013) Disrupted correlation
between low frequency power and connectivity strength of resting state brain
networks in schizophrenia. Schizophrenia Research 143: 165–171.
39. Sauseng P, Birbaumer N, Gruber WR, Klimesch W (2008) Cross-frequency
phase synchronization: a brain mechanism of memory matching and attention.
NeuroImage 40: 308–317.
Brain Network Structure in Schizophrenia
PLOS ONE | www.plosone.org 11 August 2013 | Volume 8 | Issue 8 | e72351

40. Palva JM, Palva S, Kaila K (2005) Phase synchrony among neuronaloscillations in the human cortex. Journ Neurosc 25: 396272.
41. Allen EA, Liu J, Kiehl KA, Gelernter J, Pearlson GD, et al. (2011) Components
of cross-frequency modulation in health and disease. Front Syst Neurosci 5.
42. Fornito A, Bullmore ET (2012) Connectomic intermediate phenotypes for
psychiatric disorders. Front Psychiatry 3: 32.
43. Bassett DS, Bullmore E (2009) Human brain networks in health and disease.
Curr Opin Neurol 22: 340–347.
44. Callicott JH, Mattay VS, Verchinski BA, Marenco S, Egan MF, et al. (2003)
Complexity of prefrontal cortical dysfunction in schizophrenia: more than upor down. Am J Psychiatry 160: 2209–2215.
45. Axmacher N, Henseler MM, Jensen O, Weinreich I, Elger CE, et al. (2010)Cross-frequency coupling supports multi-item working memory in the human
hippocampus. PNAS 107: 3228–3233.
46. Callicott JH, Egan MF, Mattay VS, Bertolino A, Bone AD, et al. (2003)
Abnormal fmri response of the dorsolateral prefrontal cortex in cognitivelyintact siblings of patients with schizophrenia. Am J Psychiatry 160: 709719.
47. Pesonen M, Hamalainen H, Krause CM (2007) Brain oscillatory 4–30 hz
responses during a visual n-back memory task with varying memory load. Brain
Research 1138: 171–177.
48. MathWorks I (1994–2007) Matlab. Available: http://www.mathworks.com/.
49. Oostenveld R, Fries P, Maris E, Schoffelen JM (2011) Fieldtrip: Open source
software for advanced analysis of meg, eeg, and invasive electrophysiologicaldata. Computational Intelligence and Neuroscience 2011: 9.
50. Gross J, Baillet S, Barnes GR, Henson RN, Hillebrand A, et al. (2013) Goodpractice for conducting and reporting MEG research. Neuroimage 65.
51. Knosche TR (2002) Transformation of whole-head MEG recordings betweendifferent sensor positions. Biomed Tech Biomed Eng 47: 59–62.
52. Medvedovsky M, Taulu S, Bikmullina R, Paetau R (2007) Artifact and head
movement compensation in MEG. Neurol Neurophysiol Neurosci 4.
53. Taulu S, Simola J (2006) Spatiotemporal signal space separation method for
rejecting nearby interference in MEG measurements. Phys Med Biol 51: 1759–1768.
54. Taulu S, Kajola M, Simola J (2004) Suppression of interference and artifacts bythe Signal Space Separation Method. Brain Topogr 16: 269–275.
55. Percival DB, Walden AT (2000) Wavelet Methods for Time Series Analysis.Cambridge University Press.
56. Shannon CE (1948) A mathematical theory of communication. Bell System
Technical Journal 27: 379423.
57. Rosso OA, Blanco S, Yordanova J, Kolev V, Figliola A, et al. (2001) Wavelet
entropy: a new tool for analysis of short duration brain electrical signals.Journal of Neuroscience Methods 105: 65–75.
58. David O, Cosmelli D, Friston KJ (2004) Evaluation of different measures offunctional connectivity using a neural mass model. NeuroImage 21: 659–673.
59. Salvador R, Suckling J, Coleman MR, Pickard JD, Menon D, et al. (2005)Neurophysiological architecture of functional magnetic resonance images of
human brain. Cereb Cortex 15: 1332–1342.
60. Salvador R, Martınez A, Pomarol-Clotet E, Gomar J, Vila F, et al. (2008) A
simple view of the brain through a frequency-specific functional connectivitymeasure. Neuroimage 39: 279–289.
61. Hlavackova-Schindler K, Palus M, Vejmelka M, Bhattacharya J (2007)Causality detection based on information-theoretic approaches in time series
analysis. Physics Reports 441: 1–46.
62. Roulston M (1999) Estimating the errors on measured entropy and mutual
information. Physica D 125: 285–294.
63. Strehl A, Joydeep G (2002) Cluster ensembles – a knowledge reuse frameworkfor combining multiple partitions. Journal of Machine Learning Research 3:
583–617.
64. Mukherjee G, Manna SS (2006) Weighted scale-free networks in Euclidean
space using local selection rule. Phys Rev E 74: 036111.
65. Deuker L, Bullmore ET, Smith M, Christensen S, Nathan PJ, et al. (2009)
Reproducibility of graph metrics of human brain functional networks.Neuroimage 47: 1460-8.
66. Bassett DS, Brown JA, Deshpand V, Carlson JM, Grafton S (2011) Conservedand variable architecture of human white matter connectivity. NeuroImage 54:
1262–1279.
67. Wu K, Taki Y, Sato K, Qi H, Kawashima R, et al. (2013) A longitudinal study
of structural brain network changes with normal aging. Front Hum Neurosci 7:113.
68. Cheng H, Wang Y, Sheng J, Kronenberger WG, Mathews VP, et al. (2012)Characteristics and variability of structural networks derived from diffusion
tensor imaging. Neuroimage 61: 1153–1164.
69. Hsu TW, Wu CW, Cheng YF, Chen HL, Lu CH, et al. (2012) Impaired small-
world network efficiency and dynamic functional distribution in patients withcirrhosis. PLoS One 7: e35266.
70. Schwarz AJ, McGonigle J (2011) Negative edges and soft thresholding in
complex network analysis of resting state functional connectivity data.
Neuroimage 55: 1132–1146.
71. Bullmore E, Sporns O (2009) Complex brain networks: graph theoretical
analysis of structural and functional systems. Nat Rev Neurosci 10: 186–98.
72. Horstmann MT, Bialonski S, Noennig N, Mai H, Prusseit J, et al. (2010) Statedependent properties of epileptic brain networks: Comparative graphtheore-
tical analyses of simultaneously recorded eeg and meg. Clinical Neurophys-
iology 121: 172–185.
73. van Wijk BC, Stam CJ, Daffertshofer A (2010) Comparing brain networks ofdifferent size and connectivity density using graph theory. PLoS One 5:
e13701.
74. Watts DJ, Strogatz SH (1998) Collective dynamics of`small-world’ networks.
Nature 393: 440–442.
75. Latora V, Marchiori M (2001) Efficient behavior of small-world networks. Phys
Rev Lett 87: 198701.
76. Achard S, Bullmore E (2007) Efficiency and cost of economical brain functional
networks. PLoS Comput Biol 3: e17.
77. Freeman LC (1977) A set of measures of centrality based on betweenness.
Sociometry 40: 35–41.
78. Leicht EA, Newman MEJ (2008) Community structure in directed networks.
Phys Rev Lett 100: 118703.
79. Meunier D, Achard S, Morcom A, Bullmore E (2008) Age-related changes in
modular organization of human brain functional networks. NeuroImage InPress.
80. Ravasz E, Barabasi A (2003) Hierarchical organization in complex networks.
Phys Rev E 67: 026112.
81. Barahona M, Pecora L (2002) Synchronization in small world systems. Phys
Rev Lett 89: 054101.
82. Bassett DS, Meyer-Lindenberg A, Achard S, Duke T, Bullmore E (2006)
Adaptive reconfiguration of fractal small-world human brain functional
networks. Proc Natl Acad Sci USA 103: 19518–19523.
83. Newman MEJ (2006) Modularity and community structure in networks. ProcNatl Acad Sci USA 103: 8577–8582.
84. Achard S, Salvador R, Whitcher B, Suckling J, Bullmore E (2006) A resilient,low-frequency, small-world human brain functional network with highly
connected association cortical hubs. J Neurosci 26: 63–72.
85. Bassett DS, Greenfield DL, Meyer-Lindenberg A, Weinberger DR, Moore S,
et al. (2010) Efficient physical embedding of topologically complex information
processing networks in brains and computer circuits. PLoS Comput Biol 6:e1000748.
86. Ramsay JO, Hooker G, Graves S (2009) Functional Data Analysis with R and
Matlab. Springer.
87. Bassett DS, Porter MA, Wymbs NF, Grafton ST, Carlson JM, et al. (2013)
Robust detection of dynamic community structure in networks. Chaos 23.
88. Zheng H (2010) Anova with n repeated and m non-repeated factors. URL
http://www.mathworks.com/matlabcentral/fileexchange/28820.
89. Fornito A, Zalesky A, Bassett D, Meunier D, Ycel M, et al. (2011) Ggenetic
inuences on cost-effcient organization of human cortical functional networks.
J Neurosci 31: 3261-70.
90. Fair DA, Cohen AL, Power JD, Dosenbach NU, Church JA, et al. (2009)Functional brain networks develop from a ‘‘local to distributed’’ organization.
PLoS Comput Biol 5: e1000381.
91. Vertes PE, Alexander-Bloch AF, Gogtay N, Giedd JN, Rapoport JL, et al.
(2012) Simple models of human brain functional networks. Proc Natl Acad
Sci U S A 109: 5868–73.
92. Meyer-Lindenberg A, Weinberger DR (2006) Intermediate phenotypes and
genetic mechanisms of psychiatric disorders. Nature Reviews Neuroscience 7:818–827.
93. Winterer G, Weinberger DR, Sanchez CE, Jones DW, Egan MF, et al. (2004)
Prefrontal broadband noise, working memory, and genetic risk for schizo-
phrenia. The American Journal of Psychiatry 161: 1.
94. Hirvonen J, Hietala J (2011) Dysfunctional brain networks and genetic risk for
schizophrenia: Specific neurotransmitter systems. CNS Neuroscience &Therapeutics 17: 89–96.
95. Tan HY, Chen AG, Chen Q, Browne LB, Verchinski B, et al. (2011) Epistaticinteractions of AKT1 on human medial temporal lobe biology and
pharmacogenetic implications. Mol Psychiatry 17: 1007–1016.
96. Esslinger C, Walter H, Kirsch P, Erk S, Schnell K, et al. (2009) Neural
mechanisms of a genomewide supported psychosis variant. Science 324: 605.
97. Smit D, Boersma M, Beijsterveldt C, Posthuma D, Boomsma D, et al. (2010)
Endophenotypes in a dynamically connected brain. Behavior Genetics 40:167–177.
98. Breakspear M, Terry JR, Friston KJ, Harris AW, Williams LM, et al. (2003) Adisturbance of nonlinear interdependence in scalp eeg of subjects with first
episode schizophrenia. Neuroimage 20: 466–78.
99. Faisal AA, Selen LP, Wolpert DM (2008) Noise in the nervous system. Nat Rev
Neurosci 9: 292–303.
100. Deco G, Jirsa VK, McIntosh AR (2011) Emerging concepts for the dynamical
organization of resting-state activity in the brain. Nat Rev Neurosci 12: 43–56.
101. Winterer G, Ziller M, Dorn H, Frick K, Mulert C, et al. (2000) Schizophrenia:
reduced signal-tonoise ratio and impaired phase-locking during informationprocessing. Clinical Neurophysiology 111: 837–849.
102. Winterer G, Egan MF, Kolachana BS, Goldberg TE, Coppola R, et al. (2006)Prefrontal electrophysiologic ‘‘noise’’ and catechol-o-methyltransferase geno-
type in schizophrenia. Biol Psychiatry 60: 578584.
103. Raghavendra BS, Dutt DN, Halahalli HN, John JP (2009) Complexity analysis
of EEG in patients with schizophrenia using fractal dimension. Physiol Meas30: 795–808.
104. John JP, Rangaswamy M, Thennarasu K, Khanna S, Nagaraj RB, et al. (2009)EEG power spectra differentiate positive and negative subgroups in
neuroleptic-naive schizophrenia patients. J Neuropsychiatry Clin Neurosci21: 160–72.
Brain Network Structure in Schizophrenia
PLOS ONE | www.plosone.org 12 August 2013 | Volume 8 | Issue 8 | e72351
105. Kim D, Pearlson GD, Kiehl KA, Bedrick E, Demirci O, et al. (2008) A method
for multi-group inter-participant correlation: Abnormal synchrony in patientswith schizophrenia during auditory target detection. NeuroImage 39: 1129–
1141.
106. Krishnan GP, Vohs JL, Hetrick WP, Carroll CA, Shekhar A, et al. (2005)Steady state visual evoked potential abnormalities in schizophrenia. Clinical
Neurophysiology 116: 614–624.107. Kikuchi M, Hashimoto T, Nagasawa T, Hirosawa T, Minabe Y, et al. (2011)
Frontal areas contribute to reduced global coordination of resting-state gamma
activities in drug-nave patients with schizophrenia. Schizophrenia Research130: 187–194.
108. Takahashi T, Cho RY, Mizuno T, Kikuchi M, Murata T, et al. (2010)Antipsychotics reverse abnormal eeg complexity in drug-naive schizophrenia: a
multiscale entropy analysis. Neuroimage 51: 173–82.109. Gonzalez Andino SL, Grave de Peralta Menendez R, Thut G, Spinelli L,
Blanke O, et al. (2000) Measuring the complexity of time series: an application
to neurophysiological signals. Hum Brain Mapp 11: 46–57.110. Xie X, Cao Z, Weng X (2008) Spatiotemporal nonlinearity in resting-state
fMRI of the human brain. Neuroimage 40: 1672–1685.111. Rubinov M, Sporns O, van Leeuwen C, Breakspear M (2009) Symbiotic
relationship between brain structure and dynamics. BMC Neurosci 10: 55.
112. Bullmore E, Long C, Suckling J, Fadili J, Calvert G, et al. (2001) Colored noiseand computational inference in neurophysiological (fMRI) time series analysis:
resampling methods in time and wavelet domains. Hum Brain Mapp 12: 61–78.
113. Sabeti M, Katebi S, Boostani R (2009) Entropy and complexity measures forEEG signal classification of schizophrenic and control participants. Artif Intell
Med 47: 263–74.
114. Hillebrand A, Barnes GR, Bosboom JL, Berendse HW, Stam CJ (2012)Frequency-dependent functional connectivity within resting-state networks: an
atlas-based MEG beamformer solution. Neuroimage 59: 3909–3921.115. Cheng H, Wang Y, Sheng J, Kronenberger WG, Mathews VP, et al. (2012)
Characteristics and variability of structural networks derived from diffusion
tensor imaging. NeuroImage 61: 1153–1164.116. Wang Q, Su TP, Zhou Y, Chou KH, Chen IY, et al. (2012) Anatomical
insights into disrupted small-world networks in schizophrenia. NeuroImage 59:1085–1093.
117. Rubinov M, Knock SA, Stam CJ, Micheloyannis S, Harris AW, et al. (2009)Small-world properties of nonlinear brain activity in schizophrenia. Hum Brain
Mapp 30: 403–16.
118. Yu Q, Sui J, Rachakonda S, He H, Gruner W, et al. (2011) Altered topologicalproperties of functional network connectivity in schizophrenia during resting
state: A small-world brain network study. PLoS ONE 6: e25423.119. Alexander-Bloch AF, Gogtay N, Meunier D, Birn R, Clasen L, et al. (2010)
Disrupted modularity and local connectivity of brain functional networks in
childhood-onset schizophrenia. Front Syst Neurosci 4.120. Alexander-Bloch AF, Vertes PE, Stidd R, Lalonde F, Clasen L, et al. (2013)
The anatomical distance of functional connections predicts brain networktopology in health and schizophrenia. Cereb Cortex 23: 127–138.
121. Micheloyannis S (2012) Graph-based network analysis in schizophrenia.World J Psychiatry 2: 1–12.
122. Kitzbichler MG, Henson RN, Smith ML, Nathan PJ, Bullmore ET (2011)
Cognitive effort drives workspace configuration of human brain functionalnetworks. J Neurosci 31: 8259–70.
123. Moussa MN, Vechlekar CD, Burdette JH, Steen MR, Hugenschmidt CE, et al.
(2011) Changes in cognitive state alter human functional brain networks. FrontHum Neurosci 5.
124. David O, Friston KJ (2003) A neural mass model for MEG/EEG: coupling and
neuronal dynamics. Neuroimage 20: 1743–55.125. Moran RJ, Kiebel SJ, Stephan KE, Reilly RB, Daunizeau J, et al. (2007) A
neural mass model of spectral responses in electrophysiology. Neuroimage 37:706–20.
126. Stephan KE, Mattout J, David O, Friston KJ (2006) Models of functional
neuroimaging data. Curr Med Imaging Rev 2: 15–34.127. Jeong B, Wible CG, Hashimoto R, Kubicki M (2009) Functional and
anatomical connectivity abnormalities in left inferior frontal gyrus inschizophrenia. Hum Brain Mapp 30: 4138–4151.
128. Pomarol-Clotet E, Canales-Rodrıguez EJ, Salvador R, Sarro S, Gomar JJ, et al.(2010) Medial prefrontal cortex pathology in schizophrenia as revealed by
convergent findings from multimodal imaging. Mol Psychiatry 15: 823–830.
129. Camchong J, MacDonald AW 3rd, Bell C, Mueller BA, Lim KO (2011)Altered functional and anatomical connectivity in schizophrenia.
130. Sugranyes G, Kyriakopoulos M, Dima D, O’Muircheartaigh J, Corrigall R, etal. (2012) Multimodal analyses identify linked functional and white matter
abnormalities within the working memory network in schizophrenia. Schizophr
Res 138: 136–142.131. Breakspear M, Stam CJ (2005) Dynamics of a neural system with a multiscale
architecture. Philos Trans R Soc Lond B Biol Sci 360: 1051–1074.132. van den Berg D, Gong P, Breakspear M, van Leeuwen C (2012)
Fragmentation: loss of global coherence or breakdown of modularity infunctional brain architecture? Front Syst Neurosci 6: 20.
133. Schoen W, Chang JS, Lee U, Bob P, Mashour GA (2011) The temporal
organization of functional brain connectivity is abnormal in schizophrenia butdoes not correlate with symptomatology. Conscious Cogn 20: 1050–4.
134. Canolty RT, Knigh RT (2010) The functional role of cross-frequency coupling.Trends in Cognitive Sciences 14: 506–515.
135. Vicente R, Aru J, Wibral M, Priessemann V, Pipa G, et al. (2011) Analyzing
possible pitfalls of cross-frequency analysis. Frontiers in Human NeuroscienceConference Abstract: XI International Conference on Cognitive Neuroscience
(ICON XI).136. Muthukumaraswamy SD, Singh KD (2011) A cautionary note on the
interpretation of phaselocking estimates with concurrent changes in power.Clinical Neurophysiology 122: 2324–2325.
137. Palva S, Palva JM (2012) Discovering oscillatory interaction networks with m/
eeg: challenges and breakthroughs. Trends Cogn Sci 16: 219–230.138. Yu Q, Plis SM, Erhardt EB, Allen EA, Sui J, et al. (2012) Modular organization
of functional network connectivity in healthy controls and patients withschizophrenia during the resting state. Frontiers in Systems Neuroscience 5.
139. Micheloyannis S, Pachou E, Stam CJ, Breakspear M, Bitsios P, et al. (2006)
Small-world networks and disturbed functional connectivity in schizophrenia.Schizophrenia Research 87: 60–66.
140. De Vico Fallani F, Maglione A, Babiloni F, Mattia D, Astolfi L, et al. (2010)Cortical network analysis in patients affected by schizophrenia. Brain
Topography 23: 214–220.141. Uhlhaas PJ, Singer W (2006) Neural synchrony in brain disorders: Relevance
for cognitive dysfunctions and pathophysiology. Neuron 52: 155–168.
142. Spencer KM, Nestor PG, Niznikiewicz M, Salisbury D, Shenton M, et al.(2003) Abnormal neural synchrony in schizophrenia. J Neurosc 23: 7407–7411.
Brain Network Structure in Schizophrenia
PLOS ONE | www.plosone.org 13 August 2013 | Volume 8 | Issue 8 | e72351