Embed Size (px)
Citation preview

Effects of Infiltration on Chemical Transportinto Overland Flow
J. K. Snyder, D. A. Woolhiser
ABSTRACT
THE effect of raindrop impact and infiltration on themixingprocessbetween surface runoff and tracer dye
in a saturated porous medium (Ottawa sand) was studiedin the laboratory. Experiments were conducted in atilting plexiglassflume 10 cm wide, 200 cm long, and 30cm deep. Infiltration and rainfall rate and energy couldbe closely controlled, and the mixing process at thesurface was easily observed. Samples of pore fluid wereobtained bywithdrawing fluid through rubber septa witha microsyringe, and concentrations were measured byfluorometry. A complete description of the apparatus ispresented, along with the results of 21 simulatedrainstorm events. The mass of dye removed in overlandflow was positively related to slope of the flume andnegatively related to infiltration rate. The soluteconcentration profiles in the porous media, with zeroslope and no infiltration, were convex upward. Withinfiltration, the profiles assumed a characteristic "s"shape. These observations suggest that the completemixing model may be appropriate when infiltration ratesare high, but an incomplete mixing model, or aconvective dispersion model, would provide betterapproximations at low infiltration rates. Unexpectedpatterns of infiltration and exfiltration were observed atthe surface of the porous medium when the flume wastilted. These patterns were probably due to heterogenietyof sand packing and high permeability of the material.
INTRODUCTION
The mathematical structure of the chemical transportmodel component describing the interaction of achemical in, or on, the soil surface with surface runoff isextremely important. The mathematical structure andthe parameter values assigned controlthe computed rateof removal of a chemical by shallow overland flow. Untilrecently, however, there havebeen very few experimentalinvestigations of the processes involved. Recently, a fewinvestigators have recognized that existing modelstructure is based on convenient assumptions rather thanrigorous analyses verified by experimental data, and
Article was submitted for publication in January, 1985;reviewedandapproved for publication by the Soil and Water Div. of ASAE in June,1985.
The authors are: J. K. SNYDER, Project Engineer, Roy F. Weston,Inc., West Chester, PA; and D. A. WOOLHISER, Research Leader,USDA-ARS, Southwest Rangeland Watershed Research Center,Tucson, AZ.
Acknowledgments: These experiments were carried out at ColoradoState University when the senior author was a Graduate ResearchAssistant and the junior author was Research Hydraulic Engineer,USDA-ARS, Fort Collins, CO. We thank Laj Ahuja for providing thenumericalsolutions for flowin a tilted slab, shownin Figs.7 and 9, andD. McWhorter and John Brookman for providing laboratory facilitiesand helpful advice.
1450
MEMBER
ASAE
have conducted laboratory experiments on the exchangeof chemicals present in the soil water with raindrop-disturbed overland flow (Ingram, 1979; Ingram andWoolhiser, 1980; Ahuja et al., 1981a; Snyder, 1981;Ahuja, 1982; Ahuja and Lehman, 1983). Ingram(Ingram, 1979; Ingram and Woolhiser, 1980) examinedthe removal of CaS04 solution from a saturated sand in asmall laboratory flume with no infiltration. Ahuja et al.(1981a) and Ahuja (1982) measured the removal of P andBr from shallow prewetted soil boxes with nearly steadyinfiltration rates. Both groups of investigators usedsimulated rainfall to generate surface runoff and toprovide a realistic disturbance at the surface. The dataobtained from these experiments were used to estimateparameters and to test simple mixing zone models, andto estimate the depth of interaction of rainfall and runoffwith the soil water.
Because infiltration velocities control not only theamount of surface runoff, but also the downward rate ofremovalof solute within the interaction zone, they shouldexert a significant effect on the chemical exchangeprocess. This effect has been verified by Snyder (1981)and by Ahuja and Lehman (1983).
The objective of this paper is to describe anexperimental apparatus designed to allow visualizationof the mixing process near the soil-water interface with acontrolled infiltration rate, and to present an analyses ofthe comparative effects of infiltration relative to slope,rainfall intensity, and kinetic energy on chemicaltransport into overland flow.
METHODS AND MATERIALS
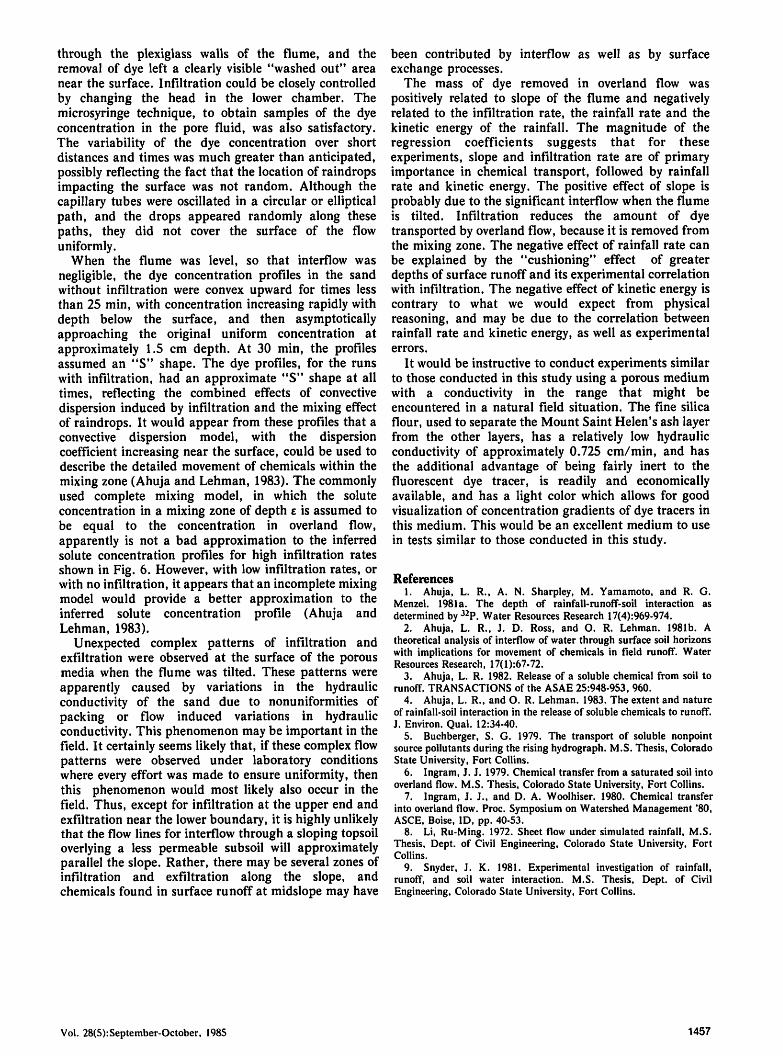
Experimental ApparatusThe experimental apparatus, shown in Fig. 1, was
constructed of clear 1.3-cm plexiglass to allowvisualization of the loss of a dye tracer from the mixingzone. The nominal dimensions of the flume were: width10 cm, length 200 cm, and depth 30 cm. Infiltrationcould be simulated and controlled by adjusting theelevation of a hose connected to a water-filled chamber atthe bottom of the flume. Concentrations of dye tracer inthe saturated porous medium were measured bysampling from five groups of sampling ports locatedalong the length of the flume. In each group, the rubbersepta sampling ports were located at 0.5-, 1.0-, 2.0-,3.0-, 4.0-, and 5.0-cm depths into the porous medium.The soil layer was separated from the chamber at thebottom of the flume by a metal screen and nylon filtercloth. A hydraulic jack was placed under the flume sothat it could be tilted.
Ottawa sand was chosen as the porous medium,because its light color allowed visualization ofconcentration gradients of Pontacyl Brilliant Pink-B dye,and its inert nature virtually eliminated dye adsorption.
TRANSACTIONS of the ASAE
£352. "O
n 50
3 >
O Ws. >*q8,3
do ^a. °
tn >2 m
o o
<W

SAMPLING PORTS
SIDE VIEW
NYLON FILTERCLOTH ~~^
OETAIL
Fig. la—Side view of soil flume showing location and numbering of sampling points.
II V—15.9—| II h- 159 —H // h—15.9—H // h—15.7-— 3I.B-«"| \*—31.8—A r— 31.8—A P— 31.8—A
i.s-Tk-12.7 -
•10.2- -*1 r*-'-5
SANO _,SURFACE^
»; =
[Z3S
[•«— 5.I-*
4. 1-
I /$ Isn:
t TK-THREADED HOLES
NOTE : ALL DIMENSIONS IN cm
ENO VIEW
Fig. lc—End view of soil flume.
Vol. 28(5):September-October, 1985
NOTE : ALL DIMENSIONS tN cm
TOP VIEW
Fig. lb—Top view of soil flume.
Ottawa sand is quite uniform in particle size, havingparticle diameters between 0.2 mm and 0.6 mm. Toensure uniformity, the sand was placed in the flume inthin layers by pouring it from a 260 ML beaker with along, sweeping motion alongthe lengthof the flume. Theporosity of the Ottawa sand, using this placementtechnique, was 35%.
The saturated hydraulic conductivity of the Ottawasand in the flume was 4.33 cm/min, considerably higherthan would be encountered for field soils. The headlossthrough the sand, under normal infiltration rates, isquite small and, under conditions where the flume istilted, the additional elevation head at the upper end ofthe flume will create a greater infiltration rate at theupper end of the flume than at the lower end. Thesensitivity of the infiltration rate to the head differentialbetween the surface of the sand and the bottom chamberwas reduced by adding a layer of low hydraulicconductivity material beneath the Ottawa sand. Wefound that Mount St. Helen's ash, from Pullman,Washington, with a hydraulic conductivity of 4.0 x 10⁻³cm/min, worked quite well for this purpose. To keep thefine ash particles from passing through the screen, andto keep the ash and Ottawa sand layers separate, thinlayers of a fine silica sand were placed between the ashand Ottawa sand layers, and beneath the ash layer. Theporous media characteristics are summarized in Table 1.
Chlorine-free water was used in the rainfall modules toprevent oxidation of the fluorescent dye tracer
1451
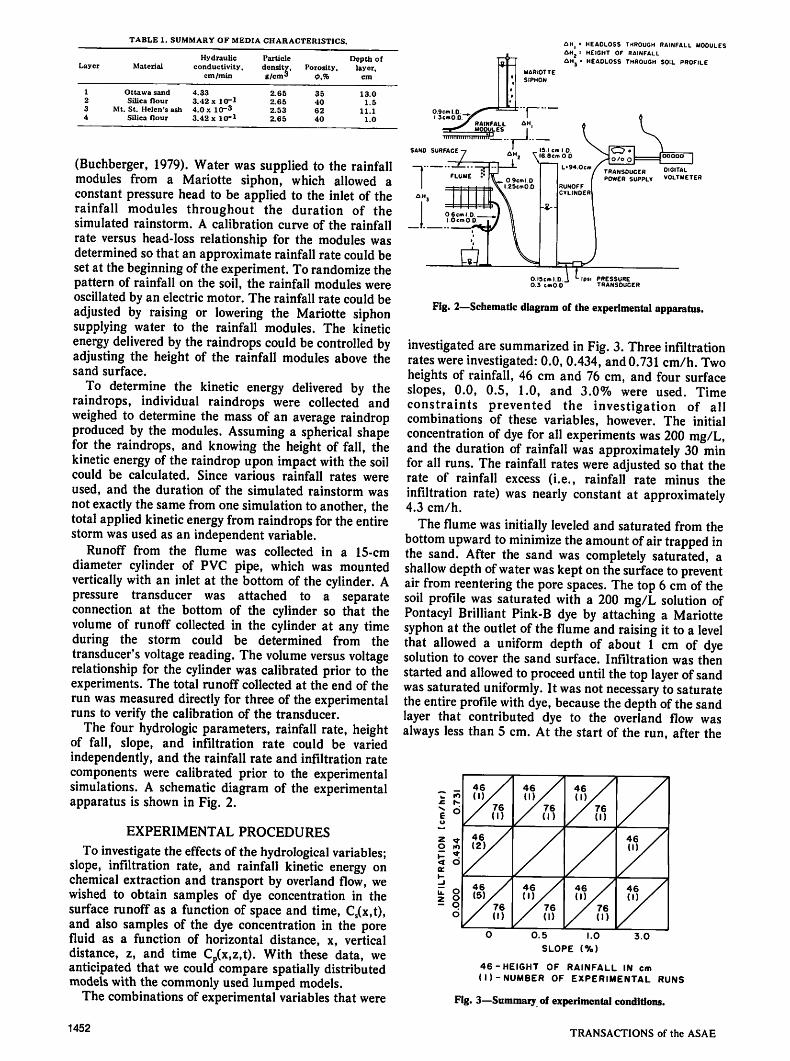
TABLE 1. SUMMARY OF MEDIA CHARACTERISTICS.
Hydraulic Particle Depth ofLayer Material conductivity. density,
g/cm3Porosity, layer.
cm/min 0.% cm
1 Ottawa sand 4.33 2.65 35 13.02 Silica flour 3.42 x 10⁻¹ 2.65 40 1.53 Mt. St. Helen's ash 4.0 x 10⁻³ 2.53 62 11.14 Silica flour 3.42 x 10"1 2.65 40 1.0
an, • HEA0L0SS THROUGH RAINFALL MODULES6H2 ' HEIGHT OF RAINFALLOH > HEA0L0SS THROUGH SOIL PROFILE
TRANSDUCER DIGITALPOWER SUPPLY VOLTMETER
(Buchberger, 1979). Water was supplied to the rainfallmodules from a Mariotte siphon, which allowed aconstant pressure head to be applied to the inlet of therainfall modules throughout the duration of thesimulated rainstorm. A calibration curve of the rainfallrate versus head-loss relationship for the modules wasdetermined so that an approximate rainfall rate could beset at the beginning of the experiment. To randomize thepattern of rainfall on the soil, the rainfall modules wereoscillated by an electric motor. The rainfall rate could beadjusted by raising or lowering the Mariotte siphonsupplying water to the rainfall modules. The kineticenergy delivered bythe raindrops could be controlled byadjusting the height of the rainfall modules above thesand surface.
To determine the kinetic energy delivered by theraindrops, individual raindrops were collected andweighed to determine the mass of an average raindropproduced by the modules. Assuming a spherical shapefor the raindrops, and knowing the height of fall, thekineticenergy of the raindrop upon impact with the soilcould be calculated. Since various rainfall rates wereused, and the duration of the simulated rainstorm wasnot exactly the same from one simulation to another, thetotal applied kineticenergy from raindrops for the entirestorm was used as an independent variable.
Runoff from the flume was collected in a 15-cmdiameter cylinder of PVC pipe, which was mountedvertically with an inlet at the bottom of the cylinder. Apressure transducer was attached to a separateconnection at the bottom of the cylinder so that thevolume of runoff collected in the cylinder at any timeduring the storm could be determined from thetransducer's voltage reading. The volume versus voltagerelationship for the cylinder was calibrated prior to theexperiments. The total runoff collected at the end of therun was measured directly for three of the experimentalruns to verify the calibration of the transducer.
The four hydrologic parameters, rainfall rate, heightof fall, slope, and infiltration rate could be variedindependently, and the rainfall rate and infiltration ratecomponents were calibrated prior to the experimentalsimulations. A schematic diagram of the experimentalapparatus is shown in Fig. 2.
EXPERIMENTAL PROCEDURES
To investigate the effects of the hydrological variables;slope, infiltration rate, and rainfall kinetic energy onchemical extraction and transport by overland flow, wewished to obtain samples of dye concentration in thesurface runoff as a function of space and time, Cs(x,t),and also samples of the dye concentration in the porefluid as a function of horizontal distance, x, verticaldistance, z, and time Cp(x,z,t). With these data, weanticipated that we could compare spatially distributedmodelswith the commonly used lumped models.
The combinations of experimental variables that were
Fig. 2—Schematic diagram of the experimental apparatus.
investigated are summarized in Fig. 3. Three infiltrationrates were investigated: 0.0, 0.434, and 0.731 cm/h. Twoheights of rainfall, 46 cm and 76 cm, and four surfaceslopes, 0.0, 0.5, 1.0, and 3.0% were used. Timeconstraints prevented the investigation of allcombinations of these variables, however. The initialconcentration of dye for all experiments was 200 mg/L,and the duration of rainfall was approximately 30 minfor all runs. The rainfall rates were adjusted so that therate of rainfall excess (i.e., rainfall rate minus theinfiltration rate) was nearly constant at approximately4.3 cm/h.
The flume was initially leveled and saturated from thebottom upward to minimize theamount ofair trapped inthe sand. After the sand was completely saturated, ashallow depth ofwater was keptonthesurface to preventair from reentering the pore spaces. The top 6 cm of thesoil profile was saturated with a 200 mg/L solution ofPontacyl Brilliant Pink-B dye by attaching a Mariottesyphon at the outletof the flume and raising it to a levelthat allowed a uniform depth of about 1 cm of dyesolution to cover the sand surface. Infiltration was thenstartedand allowed to proceed until the top layer ofsandwas saturated uniformly. It was not necessary to saturatethe entireprofile with dye, because the depth of the sandlayer that contributed dye to the overland flow wasalways less than 5 cm. At the start of the run, after the
1452
O lO
< o
46 / 46 46/
<•>/ (1) (1) /X 76 76 76 /
/ (l) (1) (1) /46 / 46 /(2)/ (1) /
46 / 46 46 46 /(5) / (1) (1) (,)// 76 76 76
/ <•> (1) (1)
0.5 1.0
SLOPE (%)
3.0
46-HEIGHT OF RAINFALL IN cm(I)-NUMBER OF EXPERIMENTAL RUNS
Fig. 3—Summary of experimental conditions.
TRANSACTIONS of the ASAE
top layer of sand had been saturated with the dyesolution, the siphon was lowered, and the excess dyesolution on the sand surface was allowed to drain backinto the siphon. When the solution surface was loweredto coincide with the sand surface (i.e., the sand wascompletely saturated, with no water standing on thesurface), the siphon was removed, and the runoffcylinder was attached to the outlet. The flume was thencovered with a plastic sheet, the siphon supplying thewater to the rainfall modules was set at the requiredelevation and, if the run involved infiltration, theelevation of the outlet base was set to create the desiredrate. To start the run, the outlet hose was undamped,the flume was tilted to the appropriate slope, and rainwas applied by removing the plastic sheet.
Because the sand was saturated, surface runoff beganalmost immediately. The removal of the dye solutionfrom the sand could be observed visually, and recordedphotographically as the clear rainfall replaced the dyesolution in the pore fluid. Dye concentrations in theoverland flow and in the pore fluid were measured byremoving 10 to 30 yL of water from the surface film orthrough the rubber septa sampling ports with aHamilton No. 701-RN or No. 705-SN microsyringe. Thesample from the microsyringe was then diluted to aknown volume, and the dye concentration wasdetermined by fluorometry. The microsyringe techniquewas tested in a column study and found to be capable ofdetecting the concentration gradients that weexpected toobserve in the mixing zone.
EXPERIMENTAL OBSERVATIONS
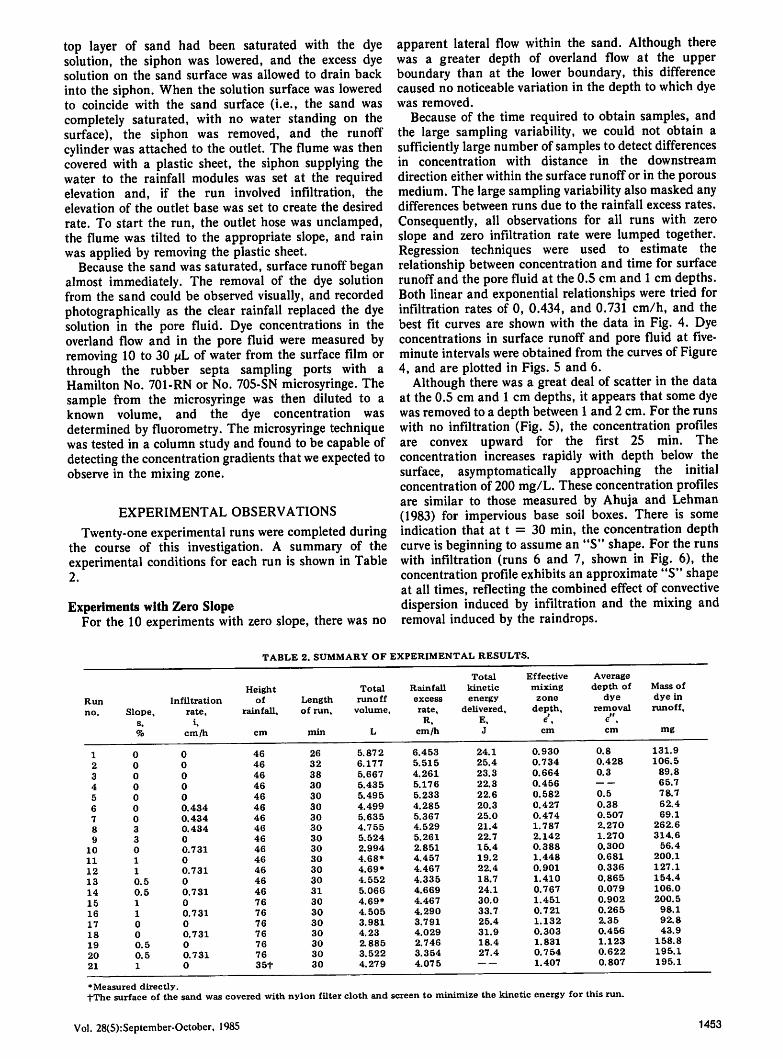
Twenty-oneexperimental runs were completed duringthe course of this investigation. A summary of theexperimental conditions for each run is shown in Table2.
Experiments with Zero SlopeFor the 10 experiments with zero slope, there was no
apparent lateral flow within the sand. Although therewas a greater depth of overland flow at the upperboundary than at the lower boundary, this differencecaused no noticeable variation in the depth to which dyewas removed.
Because of the time required to obtain samples, andthe large sampling variability, we could not obtain asufficiently large number of samples to detect differencesin concentration with distance in the downstreamdirection either within the surface runoff or in the porousmedium. The large sampling variability also masked anydifferences between runs due to the rainfall excess rates.Consequently, all observations for all runs with zeroslope and zero infiltration rate were lumped together.Regression techniques were used to estimate therelationship between concentration and time for surfacerunoff and the pore fluid at the 0.5 cm and 1 cm depths.Both linear and exponential relationships were tried forinfiltration rates of 0, 0.434, and 0.731 cm/h, and thebest fit curves are shown with the data in Fig. 4. Dyeconcentrations in surface runoff and pore fluid at five-minute intervals were obtained from the curves of Figure4, and are plotted in Figs. 5 and 6.
Although there was a great deal of scatter in the dataat the 0.5 cm and 1 cm depths, it appears that some dyewasremoved to a depth between1 and 2 cm. For the runswith no infiltration (Fig. 5), the concentration profilesare convex upward for the first 25 min. Theconcentration increases rapidly with depth below thesurface, asymptomatically approaching the initialconcentration of 200 mg/L. These concentration profilesare similar to those measured by Ahuja and Lehman(1983) for impervious base soil boxes. There is someindication that at t = 30 min, the concentration depthcurveis beginning to assume an "S" shape. For the runswith infiltration (runs 6 and 7, shown in Fig. 6), theconcentration profileexhibits an approximate "S" shapeat all times, reflecting the combined effect of convectivedispersion induced by infiltration and the mixing andremoval induced by the raindrops.
TABLE 2. SUMMARY OF EXPERIMENTAL RESULTS.
Total Effective Average
Height Total Rainfall kinetic mixing depth of Mass of
Run Infiltration of Length runoff excess energy zone dye dye in
no. Slope, rate. rainfall. of run. volume, rate, delivered, depth. removal runoff.
s. i. R, E, e. e",
% cm/h cm min L cm/h J cm cm mg
1 0 0 46 26 5.872 6.453 24.1 0.930 0.8 131.9
2 0 0 46 32 6.177 5.515 25.4 0.734 0.428 106.5
3 0 0 46 38 5.667 4.261 23.3 0.664 0.3 89.8
4 0 0 46 30 5.435 5.176 22.3 0.456 65.7
5 0 0 46 30 5.495 5.233 22.6 0.582 0.5 78.7
6 0 0.434 46 30 4.499 4.285 20.3 0.427 0.38 62.4
7 0 0.434 46 30 5.635 5.367 25.0 0.474 0.507 69.1
8 3 0.434 46 30 4.755 4.529 21.4 1.787 2.270 262.6
9 3 0 46 30 5.524 5.261 22.7 2.142 1.270 314.6
10 O 0.731 46 30 2.994 2.851 15.4 0.388 0.300 56.4
11 1 0 46 30 4.68* 4.457 19.2 1.448 0.681 200.1
12 1 0.731 46 30 4.69* 4.467 22.4 0.901 0.336 127.1
13 0.5 0 46 30 4.552 4.335 18.7 1.410 0.865 154.4
14 0.5 0.731 46 31 5.066 4.669 24.1 0.767 0.079 106.0
15 1 0 76 30 4.69* 4.467 30.0 1.451 0.902 200.5
16 1 0.731 76 30 4.505 4.290 33.7 0.721 0.265 98.1
17 0 0 76 30 3.981 3.791 25.4 1.132 2.35 92.8
18 O 0.731 76 30 4.23 4.029 31.9 0.303 0.456 43.9
19 0.5 0 76 30 2.885 2.746 18.4 1.831 1.123 158.8
20 0.5 0.731 76 30 3.522 3.354 27.4 0.754 0.622 195.1
21 1 0 35f 30 4.279 4.075 1.407 0.807 195.1
* Measured directly.fThe surface of the sand was covered with nylon filter cloth and screen to minimize the kinetic energy for this run.
Vol. 28(5):September-October, 1985 1453

uj 100-
TIME (MINUTES)
Fig. 4a—Concentration vs. time (infiltration = 0).
O DEPTH Ocm
O DEPTH 0.9cm
o OEPTH 1.0cm
10 15 20TIME (MINUTES)
Fig. 4b—Concentration vs. time (infiltration = 0.434 cm/h).
The average concentration deficit at the end of theruns (30 min) was integrated with respect to depth toestimate the average mass of dye removed with andwithout infiltration. For the zero infiltration cases, themass of dye removed for the average profile, assuminglinear concentration-time functions at 0.5 and 1 cmdepths, was 77.6 mg, compared with the averagemeasured mass of dye of 94.2 mg. With infiltration of0.434 cm/h, the calculated amount of dye removed, inaddition to calculated convective displacement, was 42mg, as compared with the average of the measuredremovals of 66 mg. Correcting for convectivedisplacement by using a plug flow assumption shouldresult in an underestimate of the dye removal, so itappears that the 30-minute concentration profiles in Fig.5 are approximately correct. If the exponentialconcentration -time curve at 0.5 cm depth is used toconstruct the profile (the dashed line in Fig. 5), thecalculated dye removal is 88 mg. Thus, it appears thatthe "s" shaped curve at 30 min is the most appropriate.
Insufficient data were taken at the higher infiltrationrate (0.731 cm/h) to prepare concentration versus depthcurves. However, the concentration in the surface runoffdecreased at a faster rate than for 0.434 cm/hr, and an
1454
.x io
2.0
LINEAR CONCENTRATION AT 0.5cm
EXPONENTIAL CONCENTRATION AT 0.5cm
50 100 150
CONCENTRATION (mg/L)
200
Fig. 5—Average concentration profiles (slope = 0;infiltration = 0).
50 100 150
CONCENTRATION (mg/L)
Fig. 6—Average concentration profile (slopeinfiltration = 0.434 cm/h).
200
0;
exponential function provided a reasonably good fit tothe data.
Experiments with Slopes from 0.5 to 3%Because ofthe relatively high hydraulic conductivity of
the porous medium used in this study, it was anticipatedthat some lateral flow, or "interflow," would occur whenthe flume was tilted, with or without infiltration. In atheoretical analyses of saturated flow through a slopinglayered soil, Ahuja et al. (1981b) found that, forimpermeable subsoils, the water enters and leaves thesoil near the upper and lower corners. However, for thecase where the slope length is 10 times the soil thickness,the stream lines are parallel to the slopefor most of theslope length. The ratio of the length of flume to the totaldepth is somewhat less for our apparatus, but flow pathscalculated from the mathematicalexpressions developedby Ahuja, et al. (1981b) led to the same conclusions. Thesoilflume system was represented as a two-layer system,with the ratio of the hydraulic conductivity of the subsoil,K2, to that of the topsoil, K„ of 9.24 x 10"4. Flow linescalculatedfor this conductivity ratio withthe geometry ofour apparatus, a slope of 3% and zero infiltration, areshown in Fig. 7. Experimental run 9 was performed
TRANSACTIONS of the ASAE
TOPSOILSUBSOIL
7^
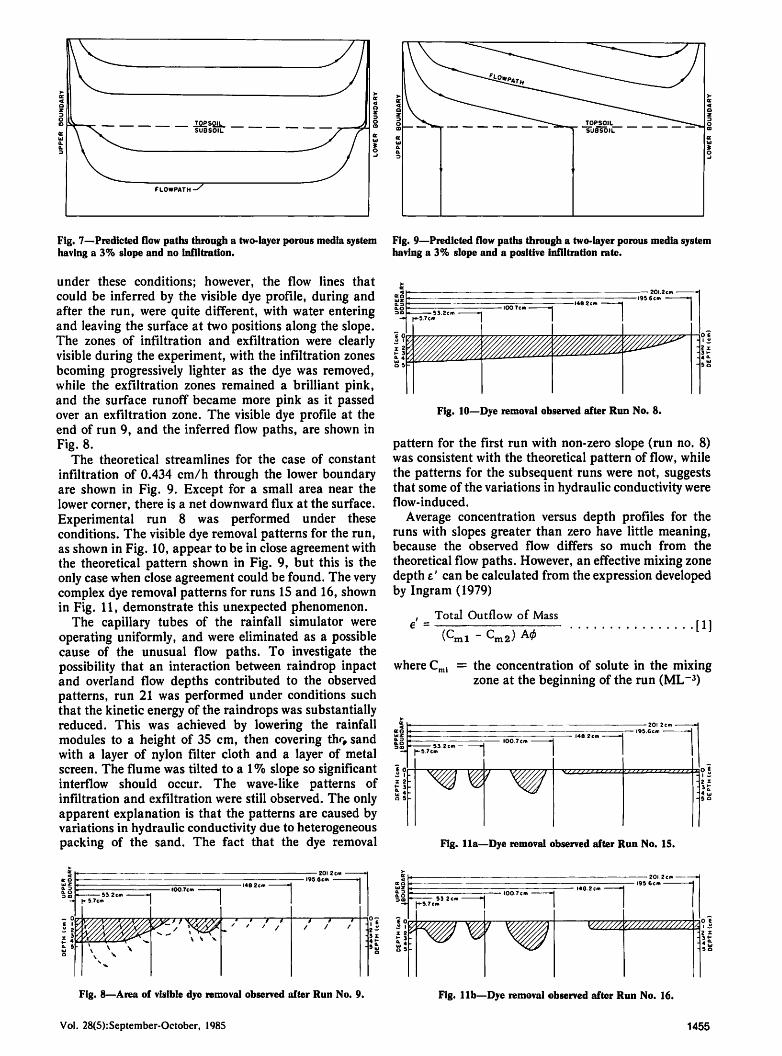
Fig. 7—Predicted flow paths through a two-layer porous media systemhaving a 3% slope and no infiltration.
under these conditions; however, the flow lines thatcould be inferred by the visible dye profile, during andafter the run, were quite different, with water enteringand leaving the surface at two positions along the slope.The zones of infiltration and exfiltration were clearlyvisible during the experiment, with the infiltration zonesbcoming progressively lighter as the dye was removed,while the exfiltration zones remained a brilliant pink,and the surface runoff became more pink as it passedover an exfiltration zone. The visible dye profile at theend of run 9, and the inferred flow paths, are shown inFig. 8.
The theoretical streamlines for the case of constant
infiltration of 0.434 cm/h through the lower boundaryare shown in Fig. 9. Except for a small area near thelower corner, there is a net downward flux at the surface.Experimental run 8 was performed under theseconditions. The visible dye removal patterns for the run,as shown in Fig. 10, appear to be in close agreement withthe theoretical pattern shown in Fig. 9, but this is theonly case when close agreement could be found. The verycomplex dye removal patterns for runs 15 and 16, shownin Fig. 11, demonstrate this unexpected phenomenon.
The capillary tubes of the rainfall simulator wereoperating uniformly, and were eliminated as a possiblecause of the unusual flow paths. To investigate thepossibility that an interaction between raindrop inpactand overland flow depths contributed to the observedpatterns, run 21 was performed under conditions suchthat the kinetic energy of the raindrops was substantiallyreduced. This was achieved by lowering the rainfallmodules to a height of 35 cm, then covering thf> sandwith a layer of nylon filter cloth and a layer of metalscreen. The flume was tilted to a 1% slope so significantinterflow should occur. The wave-like patterns ofinfiltration and exfiltration were still observed. The onlyapparent explanation is that the patterns are caused byvariations in hydraulic conductivity due to heterogeneouspacking of the sand. The fact that the dye removal
^'HW.'' -' '/ —) r/ /
Fig. 8—Area of visible dye removal observed after Run No. 9.
Vol. 28(5):September-October, 1985
^ ^^^ftSSSsri,
TOPSOIL """""""""-^^SUBSOIL
"
Fig. 9—Predicted flow paths through a two-layer porous media systemhaving a 3% slope and a positive infiltration rate.
Fig. 10—Dye removal observed after Run No. 8.
pattern for the first run with non-zero slope (run no. 8)was consistent with the theoretical pattern of flow, whilethe patterns for the subsequent runs were not, suggeststhat some of the variations in hydraulic conductivity wereflow-induced.
Average concentration versus depth profiles for theruns with slopes greater than zero have little meaning,because the observed flow differs so much from the
theoretical flow paths. However, an effective mixing zonedepth e' can be calculated from the expression developedby Ingram (1979)
Total Outflow of Masse =
(Cml " Cm2) A0[I]
where Cm, = the concentration of solute in the mixingzone at the beginning of the run (ML-3)
SJ 2cm-|-S7cm
ii >>>>> i > ii i i i iv / / ' f ' ' ' ' ' ' > '
Fig. lla—Dye removal observed after Run No. IS.
Fig. lib—Dye removal observed after Run No. 16.
1455
Cm2 = the concentration of solute in the mixingzone at the end of the run (ML-3
A = the horizontal area of the flume (L2)<|> = the porosity of the saturated sand (0.35).
In this approach, it is assumed that the dye is removeduniformly to a depth e', and that the concentration inthe mixing zone is a function only of time. Equation [1]will greatly underestimate e' due to chemical removedfrom the mixing zone by infiltration and the effects ofinterflow.
The total mass of dye transported from the flume wascalculated from the measured concentrations andvolumes at the end of each run. In calculating values of£', average measured values of Cm at 0.5 cm depth wereused for Cml and Cm2. An underestimation of the mixingzone depth index, e', results when the concentration ofsolute in the mixingzone at 0.5 cm depth is less than theaverage concentration of solute in the mixing zone. Inmany cases, the mixing zone was shallow, andmeasurement of the vertical concentration gradient wasnot possible. For all of the runs, except run 4, theaverage depth of visible dye removal e", was measuredand compared with the calculated mixing zone depthindex,e'.
The downward flux of pore fluid causedby infiltrationcauses the visible depth of dye removal to increase, eventhough the actual mixing zone depth will remain nearlythe same. In order to compare the values of e" betweenthe simulations, with and without infiltration, the depthdue to infiltration velocity was subtracted from theobserved depth in those runs where infiltration waspresent.
The displacement due to infiltration is:
6[2]
where i is the infiltration rate (cm/hr), t is the durationof the run (hr), and <j> is the porosity of the medium.
The mass of dye removed by runoff, the effectivemixing depth, e' calculated using equation [1], and theaverage depth of visual dye removal, e", corrected by theinfiltration displacement, given by equation [2] areshown in Table 2.
Regression AnalysesThe relationships between the effective mixing depths
t' and e", and their dependence upon the experimentalvariables, slope, infiltration rate, and rainfall rate wereexplored by regression analyses. The effective mixingdepth e' wasrelated to the experimental variables by thefollowing equation:
e = 1.72 + 0.46 s - 0.71i - 0.18 R (r2 = 0.86) [3]
when s is the soil surface slope (%), and R is the rainfallrate. The effect of kinetic energy was too small to besignificant.
The negative coefficient on the infiltration rate can beexplained by the fact that infiltration removes some ofthe dye before it can be transported into the overlandflow by raindrop induced mixing. This reduces the totalmass transported in the overland flow, and fromequation [1], it can be seen that this reduces the value ofthe effective mixing zone depth index, e'.
1456
The negative coefficient on the rainfall term can beexplained in terms of the protective effect of greaterdepths of overland flow associated with greater rainfallrates. Less mixing, or transfer of solute from the mixingzone into the overland flow, would be expected to occurwhen more of the raindrop energy is dissipated in theform of splash, since less energy is transferred into themixing zone. A correlation between rainfall rate andinfiltration rate is a result of the experimental constraintof maintaining a constant rainfall excess rate, and alsocontributes to the negative coefficient on the rainfall rateterm in equation [3].
Although the rainfall excess rate for all of theexperimental runs was nearly constant, this does notmean that the flow depth profiles were the same for agiven slope for different infiltration rates. It has beenshown in laboratory studies (c.f. Li, 1972) that, when theflow Reynolds number is in the laminar range, theDarcy-Weisbach friction factor f can be expressed in theform:
f_K0-fg(R)R„
HI
where Re is the flow Reynolds number, K0 is a constantwhich depends upon the surface roughness, and g(R)indicates some increasing function of rainfall rate. Thus,with a constant flow Reynolds number (constantdischarge per unit width), the friction will increase withthe rainfall rate, resulting in greater flow depths anddecreased average velocities.
The visually observed mixing zone depth e" and thecomputed depth e' were linearly related (r2 = 0.42).However, e' was greater than e", possibly due to thethreshold of visual detection of dye in the sand medium,which results in an underestimation of e".
Because the effective mixing depth e' involves anassumption of uniformity of concentration in thedownslope direction, and is calculated from M, the totalmass of dye removed, we also investigated simple linearrelationships between M and the experimental variables.The regression equation is:
M = 126.1 + 70.4 s - 73.1 i - 0.41 E
- 2.09 R (H = 0.93) [5]
where E is the kinetic energy of the simulated storm, inJoules.
Clearly, the slope and infiltration terms are veryimportant, and their signs are as anticipated becausegreater slopes lead to significant interflow. We hadanticipated that M would be positively related to kineticenergy, as observed by Ingram (1979). However, itappears that the positive correlation between E and R,the positive correlation between R and i, andexperimental errors combine to give a coefficient withsign contrary to what would be predicted from physicalconsiderations.
DISCUSSION AND CONCLUSIONS
The experimental apparatus, designed to visualize themixing process between surface runoff and tracer dyes ina porous medium, was successful in many respects. Themixing process at the surface was easily observed
TRANSACTIONS of the ASAE
through the plexiglass walls of the flume, and theremoval of dye left a clearly visible "washed out" areanear the surface. Infiltration could be closely controlledby changing the head in the lower chamber. Themicrosyringe technique, to obtain samples of the dyeconcentration in the pore fluid, was also satisfactory.The variability of the dye concentration over shortdistances and times was much greater than anticipated,possibly reflecting the fact that the location of raindropsimpacting the surface was not random. Although thecapillary tubes were oscillated in a circular or ellipticalpath, and the drops appeared randomly along thesepaths, they did not cover the surface of the flowuniformly.
When the flume was level, so that interflow wasnegligible, the dye concentration profiles in the sandwithout infiltration were convex upward for times lessthan 25 min, with concentration increasing rapidly withdepth below the surface, and then asymptoticallyapproaching the original uniform concentration atapproximately 1.5 cm depth. At 30 min, the profilesassumed an "S" shape. The dye profiles, for the runswith infiltration, had an approximate "S" shape at alltimes, reflecting the combined effects of convectivedispersion induced by infiltration and the mixing effectof raindrops. It would appear from these profiles that aconvective dispersion model, with the dispersioncoefficient increasing near the surface, could be used todescribe the detailed movement of chemicals within themixing zone (Ahuja and Lehman, 1983). The commonlyused complete mixing model, in which the soluteconcentration in a mixing zone of depth e is assumed tobe equal to the concentration in overland flow,apparently is not a bad approximation to the inferredsolute concentration profiles for high infiltration ratesshown in Fig. 6. However, with low infiltration rates, orwith no infiltration, it appears that an incomplete mixingmodel would provide a better approximation to theinferred solute concentration profile (Ahuja andLehman, 1983).
Unexpected complex patterns of infiltration andexfiltration were observed at the surface of the porousmedia when the flume was tilted. These patterns wereapparently caused by variations in the hydraulicconductivity of the sand due to nonuniformities ofpacking or flow induced variations in hydraulicconductivity. This phenomenon may be important in thefield. It certainly seems likely that, if these complex flowpatterns were observed under laboratory conditionswhere every effort was made to ensure uniformity, thenthis phenomenon would most likely also occur in thefield. Thus, except for infiltration at the upper end andexfiltration near the lower boundary, it is highly unlikelythat the flow lines for interflow through a sloping topsoiloverlying a less permeable subsoil will approximatelyparallel the slope. Rather, there may be several zones ofinfiltration and exfiltration along the slope, andchemicals found in surface runoff at midslope may have
Vol. 28(5):September-October, 1985
been contributed by interflow as well as by surfaceexchange processes.
The mass of dye removed in overland flow waspositively related to slope of the flume and negativelyrelated to the infiltration rate, the rainfall rate and thekinetic energy of the rainfall. The magnitude of theregression coefficients suggests that for theseexperiments, slope and infiltration rate are of primaryimportance in chemical transport, followed by rainfallrate and kinetic energy. The positive effect of slope isprobably due to the significant interflow when the flumeis tilted. Infiltration reduces the amount of dyetransported by overland flow, because it is removed fromthe mixing zone. The negative effect of rainfall rate canbe explained by the "cushioning" effect of greaterdepths of surface runoff and its experimental correlationwith infiltration. The negative effect of kinetic energy iscontrary to what we would expect from physicalreasoning, and may be due to the correlation betweenrainfall rate and kinetic energy, as well as experimentalerrors.
It would be instructive to conduct experiments similarto those conducted in this study using a porous mediumwith a conductivity in the range that might beencountered in a natural field situation. The fine silicaflour, used to separate the Mount Saint Helen's ash layerfrom the other layers, has a relatively low hydraulicconductivity of approximately 0.725 cm/min, and hasthe additional advantage of being fairly inert to thefluorescent dye tracer, is readily and economicallyavailable, and has a light color which allows for goodvisualization of concentration gradients of dye tracers inthis medium. This would be an excellent medium to usein tests similar to those conducted in this study.
References1. Ahuja, L. R., A. N. Sharpley, M. Yamamoto, and R. G.
Menzel. 1981a. The depth of rainfall-runoff-soil interaction asdetermined by 32P. Water Resources Research 17(4):969-974.
2. Ahuja, L. R., J. D. Ross, and O. R. Lehman. 1981b. Atheoretical analysis of interflow of water through surface soil horizonswith implications for movement of chemicals in field runoff. WaterResources Research, 17(l):67-72.
3. Ahuja, L. R. 1982. Release of a soluble chemical from soil torunoff. TRANSACTIONS of the ASAE 25:948-953, 960.
4. Ahuja, L. R., and O. R. Lehman. 1983. The extent and natureof rainfall-soil interaction in the release of soluble chemicals to runoff.
J. Environ. Qual. 12:34-40.5. Buchberger, S. G. 1979. The transport of soluble nonpoint
source pollutants during the rising hydrograph. M.S. Thesis, ColoradoState University, Fort Collins.
6. Ingram, J. J. 1979. Chemical transfer from a saturated soil intooverland flow. M.S. Thesis, Colorado State University, Fort Collins.
7. Ingram, J. J., and D. A. Woolhiser. 1980. Chemical transferinto overland flow. Proc. Symposium on Watershed Management '80,ASCE, Boise, ID, pp. 40-53.
8. Li, Ru-Ming. 1972. Sheet flow under simulated rainfall, M.S.Thesis, Dept. of Civil Engineering, Colorado State University, FortCollins.
9. Snyder, J. K. 1981. Experimental investigation of rainfall,runoff, and soil water interaction. M.S. Thesis, Dept. of CivilEngineering, Colorado State University, Fort Collins.
1457


![[Anthony J Parsons] Overland Flow Hydraulics and (BookZZ.org)](https://img.pdfslide.us/doc/110x75/577c849c1a28abe054b9a0aa/anthony-j-parsons-overland-flow-hydraulics-and-bookzzorg.jpg)