Embed Size (px)
Citation preview
Intervention monitoring of Ruppia tuberosa in the southern
Coorong, summer 2013-14.
David C. Paton & Colin P. Bailey
School of Earth and Environmental Sciences
University of Adelaide
Adelaide
July 2014

2
3
This report may be cited as:
Paton, D.C. & Bailey, C.P. 2014. Intervention monitoring of Ruppia tuberosa in the southern Coorong,
summer 2013-14. (University of Adelaide, Adelaide)
Disclaimer:
© 2014 The University of Adelaide and The Department of Environment, Water and Natural Resources (DEWNR) With the exception of the Commonwealth Coat of Arms, the Murray-Darling Basin Authority logo, all photographs, graphics and trademarks, this publication is provided under a Creative Commons Attribution 3.0 Australia Licence. http://creativecommons.org/licenses/by/3.0/au It is preferred that you attribute this publication (and any material sourced from it) using the following wording: Title: Condition monitoring of Ruppia tuberosa in the southern Coorong, summer 2013-14 Source: Licensed from The University of Adelaide under a Creative Commons Attribution 3.0 Australia Licence. Authors: David C. Paton and Colin P. Bailey. Editors: Adrienne Rumbelow and Claire Sims. This information is provided in good faith but to the extent permitted by law, the (Recipient) and the Commonwealth exclude all liability for adverse consequences arising directly or indirectly from using any information or material contained within this publication. Cover Image: Floral stalks of Ruppia tuberosa entangled in filamentous green algae and washed ashore (photo courtesy of D. Paton). Australian Government Departments and Agencies are required by the Disability Discrimination Act 1992 (Cth) to ensure that information and services can be accessed by people with disabilities. If you encounter accessibility difficulties or the information you require is in a format that you cannot access, please contact us.

4
Summary
The distribution and abundance of Ruppia tuberosa in the southern Coorong has increased over the
last two years since January 2012 with further increases detected in January 2014. The extent of
occurrence of Ruppia tuberosa plants in January 2014 measured as the length of the southern
Coorong over which Ruppia tuberosa is found was 43 km. Although this was the same as January
2013, there was an increase in the number of sites with Ruppia tuberosa plants, and in the
abundance of the plants at sites. In January 2014, 70% of sites sampled had Ruppia tuberosa plants
present with 39% of sites having greater than 30% cover and greater than 10 shoots per 75mm
diameter core. Despite this improvement the distribution and abundance of Ruppia was still well
short of the levels expected if Ruppia tuberosa populations had recovered their health and
resilience. Although flowering was detected at sites in December 2013, the numbers of seeds in the
seed banks did not increase by January 2014 and were typically less than 1 seed/core and well short
of the 8 seeds/core as an initial resilience target to be achieved by 2019 at the local scale. However a
much higher number of the seeds (71%) were intact in January 2014 compared to January 2013
suggesting that there had been some successful reproduction in spring 2013 and that the seed bank
had more capacity. Several factors may have contributed to poor seed outputs, including
interference from filamentous green algae and grazing by waterfowl. The links between lower
salinities, releases of water from Salt Creek and the performance of filamentous green algae require
investigation to allow the ecological character of the southern Coorong to be managed in the future.
The maintenance of higher water levels in the southern Coorong over September and October 2013
is likely to have facilitated flower production but these elevated water levels need to be maintained
for a little longer and at least through November to maximize reproductive success. When the water
levels dropped by about 0.6-0.7m during November 2013 many of the plants that were still
producing flowers were left out of water, disrupting their reproduction. Other factors, not just water
levels and salinities, appear important in securing recovery of Ruppia tuberosa, and wind-induced
dispersal of fragments of plants may have facilitated the recolonisation of some areas of the
southern Coorong over the last year.

5
Introduction
Ruppia tuberosa was once widespread along the length of the South Lagoon of the Coorong.
However during the millennium drought the River Murray did not flow to its mouth for extended
periods and Ruppia tuberosa disappeared from the South Lagoon and its seed bank was severely
eroded (Paton 2010, Paton & Bailey 2012). This loss of Ruppia tuberosa from the southern Coorong
is linked to an absence of flows over the Barrages that resulted in low water levels during spring that
left the plants exposed and unable to complete their reproductive cycle.
Seasonal changes in sea level, changes in evaporation and precipitation, plus flows over the Barrages
all contribute to changes in water levels. Water levels are also influenced on a day-to-day basis by
wind speed and direction, with these wind-induced water level changes approaching 30 cm (Paton
2010). These factors combine to result in water levels in the southern Coorong which vary seasonally
by up to a metre with water levels being lowest in autumn and highest in early spring.
Ruppia tuberosa generally germinates from seeds or resprouts from turions when water levels
increase in winter and re-inundate exposed mudflats around the margins of the southern Coorong.
If these mudflats remain covered with water Ruppia tuberosa grows and reproduces, flowering in
late spring. Historically and in the absence of extraction of water for human uses, flows over the
Barrages peaked in late spring, and maintained water levels into summer. However, with increased
extraction the volumes reaching the Barrages were reduced particularly in late spring and water
levels dropped earlier. This was highlighted further during the millennium drought, when no water
reached the Murray Mouth and water levels in the Coorong dropped in spring exposing the beds of
Ruppia tuberosa to desiccation before the plants had set seeds or produced turions.
Salinity may also play a role. Ruppia tuberosa performs poorly when salinities exceed 100 gL-1 and as
the salinities in the South Lagoon were consistently above 100 gL-1 and at times exceeded 150 gL-1
during the millennium drought high salinity has been implicated in the loss of Ruppia tuberosa.
When salinities are high (>100 gL-1) germination of seeds and growth of seedlings are impeded
(Paton et al. 2011; Paton & Bailey 2010, 2012; Kim et al. 2013). However Ruppia tuberosa declined
and had largely disappeared from much of the South Lagoon by June 2004 before high salinities
were reached, suggesting other influences (Paton 2010). When substantial flows returned to the
River Murray in the latter half of 2010 an emphasis was placed on restoring salinities to more typical
levels with little emphasis placed on water levels. The expectation was that Ruppia tuberosa would,
like other aquatic biota, quickly recover once the salinities returned to more typical levels. This did
not happen.
Since the return of freshwater flows to the region the recovery of Ruppia tuberosa in the South
Lagoon has been slow (Paton & Bailey 2012, 2013a,b) and the extensive beds that had gradually
established in the North Lagoon between 2006 and 2010 were also quickly lost probably due to
interference from filamentous green algae (e.g. Paton & Bailey 2012; unpubl.). The net result was
that Ruppia tuberosa became even less abundant following the return of freshwater flows to the
Murray Mouth, than immediately prior to the end of the drought and there has been no net
improvement since (Paton & Bailey 2013a,b). Two factors have contributed to this poor recovery.
First, the quantities of propagules (seeds) remaining in the sediments are extremely low and on their
own unlikely to facilitate the rapid recovery of Ruppia tuberosa throughout most of the South
Lagoon (Paton & Bailey 2012, 2013a,b). Second, although flows returned to the region in spring 2010

6
during each of the next three years (spring 2011, spring 2012 and spring 2013) flows diminished
dramatically in spring resulting in water levels once again falling at critical times for Ruppia
production.
This intervention monitoring report summarizes the distribution, abundance and resilience of Ruppia
tuberosa in the southern Coorong in January 2014 but includes some observations made in late
October 2013 and December 2013. Two basic questions are asked:
(1) Has there been any improvement in the distribution and abundance of Ruppia tuberosa over the last year?, and
(2) Has Ruppia tuberosa recovered sufficiently to be considered healthy and resilient?
Assessing the second question requires defining some quantitative measures for healthy and
resilient populations of Ruppia tuberosa. In February and March 2014, the Murray Darling Basin
Authority used an expert panel to define some quantitative measures that could be applied at a
regional scale and applied at a local population scale. The following were defined. At a regional scale
a healthy southern Coorong, would have; (a) Ruppia tuberosa with an extent of occurrence
(distribution) along the southern Coorong of 50 km. excluding outliers; and (b) within this
distribution 80% of the sites monitored would have Ruppia tuberosa plants present in winter and
summer. At the local site scale: (a) 80% of sites should have at least 30% cover in winter; (b) with at
least 10 shoots per 75mm diameter core for cores with Ruppia; and (c) with 50 flower heads/m2 for
50% of the area sampled at a site level during the spring flowering season. In addition by 2019 a
target was set for resilience where there needed to be 2000 seeds/m2 (~8 seeds/75 mm diameter
core). A further set of targets was also set for 2029 where 50% of sites would have 60% cover in
winter and there would be 10,000 seeds/m2 (~40 seeds/75 mm diameter core). These targets have
been applied where relevant to the results discussed in this report.
Methods
Reconnaissance surveys in late October and early December 2013
A brief reconnaissance trip was undertaken on the 28 October to determine if there was any
flowering activity for Ruppia tuberosa in the southern Coorong. On the 28 October plants were
observed in early stages of flowering with some plants having commenced flowering and others still
producing floral stalks. Based on this the plants needed to be covered by about 30 cm of water for at
least another month to complete flowering and set seeds. As the plants were growing on sediments
that were approximately -0.1 to 0.3 m AHD, a target water level of 0.2-0.5 m AHD was set for
November. Extra water was secured from The Living Murray program and by dropping lake levels by
10cm to allow additional flows over the Barrages during November.
A second brief reconnaissance trip in early December was undertaken to determine if the water
levels had been maintained long enough to allow plants to complete their reproductive activity at
regular monitoring sites. At the time of this survey many of the Ruppia tuberosa beds had become
recently exposed as the water levels had dropped substantially in the southern Coorong (see Figure
1) despite the provision of extra water. This reconnaissance trip primarily assessed whether plants
had produced flower heads and the extent to which flowering may have been disrupted by either

7
falling water levels or interference from filamentous green algae (Enteromorpha sp.). To assess the
level of cover and numbers of flower heads that had been produced 20m x 1m transects were
established in several areas running parallel to the shoreline and the percent cover of Ruppia
tuberosa, percent cover of filamentous algae and the numbers of flower heads and floral stalks
(without flower heads) recorded for each 1m x 1m quadrat along the transects.
Distribution and abundance of Ruppia tuberosa in the southern Coorong in January 2014
The main assessment of the distribution and abundance of Ruppia tuberosa in the southern Coorong
was conducted in January 2014 in line with the timing of monitoring in previous years.
During January 2014 the abundance and reproductive activity of Ruppia tuberosa was assessed at
eight sites on the eastern side of the South Lagoon in the Coorong, and eight sites on the western
side of the South Lagoon. These sites were spread along the shoreline at 5 km intervals. The western
sites were approximately opposite the eastern sites. These 16 sites coincided with sites that were
originally sampled in 1984-85 as part of an initial monitoring program for the South Lagoon. Ruppia
tuberosa was detected at all sites in 1984-5. In addition, four sites were sampled along the eastern
shoreline of the North Lagoon in January 2013. These were sites where Ruppia tuberosa was
recorded in recent years (i.e. during the latter parts of the millennium drought). The eight sites in
the South Lagoon of the Coorong along the eastern shoreline and the four sites in the North Lagoon
form part of an annual monitoring program that has run since 2000 while the eight sites on the
western side of the South Lagoon were added to the monitoring program in January 2013. A system
for defining sites was adopted that incorporated the lagoon, the distance (km) north or south from
the junction of the North and South Lagoons (respectively), and the eastern or western shoreline,
unless the site also had a well-defined place name. For example, site S06W was in the South Lagoon,
6 km south of the junction and on the western side of the Coorong. In addition to these 20 sites, 3
additional sites in the South Lagoon are included in the assessment in January 2014. One of these
sites (S33E, Gemini Downs Bay) has been assessed in previous years. This site did not experience the
same extent of water level changes as parts of the South Lagoon because a sandbar helps retain
water in that Bay when water levels are low in the rest of the southern Coorong. The population of
Ruppia tuberosa in this Bay remained during the millennium drought (despite high salinities) and has
not experienced the same extent of low water levels as other sites since the return of flows in late
2010. For this reason it presents an interesting comparison to sites which have experienced reduced
water levels.The other two sites were sites used for intensive waterbird observations in January
2014 (e.g. Moore 2014).
At each site 25 core samples (75 mm diam, 4 cm deep) were taken at each of four water depths: dry
mud surface approximately midway between the current waterline and the high water line (and if
known positioned on areas where Ruppia tuberosa was growing in July 2013 (e.g. sites Villa dei
Yumpa (S06E) and S06W)); waterline; 30 cm water depth; and 60 cm water depth. Each core sample
was assessed for presence of Ruppia tuberosa shoots and then sieved through 500 µm Endecott
sieves enabling seeds and turions to be extracted and counted. Since the water levels in Gemini Bay
(S33E) did not exceed 35 cm, no samples were taken in water that was 60 cm deep at this site.
8
Results
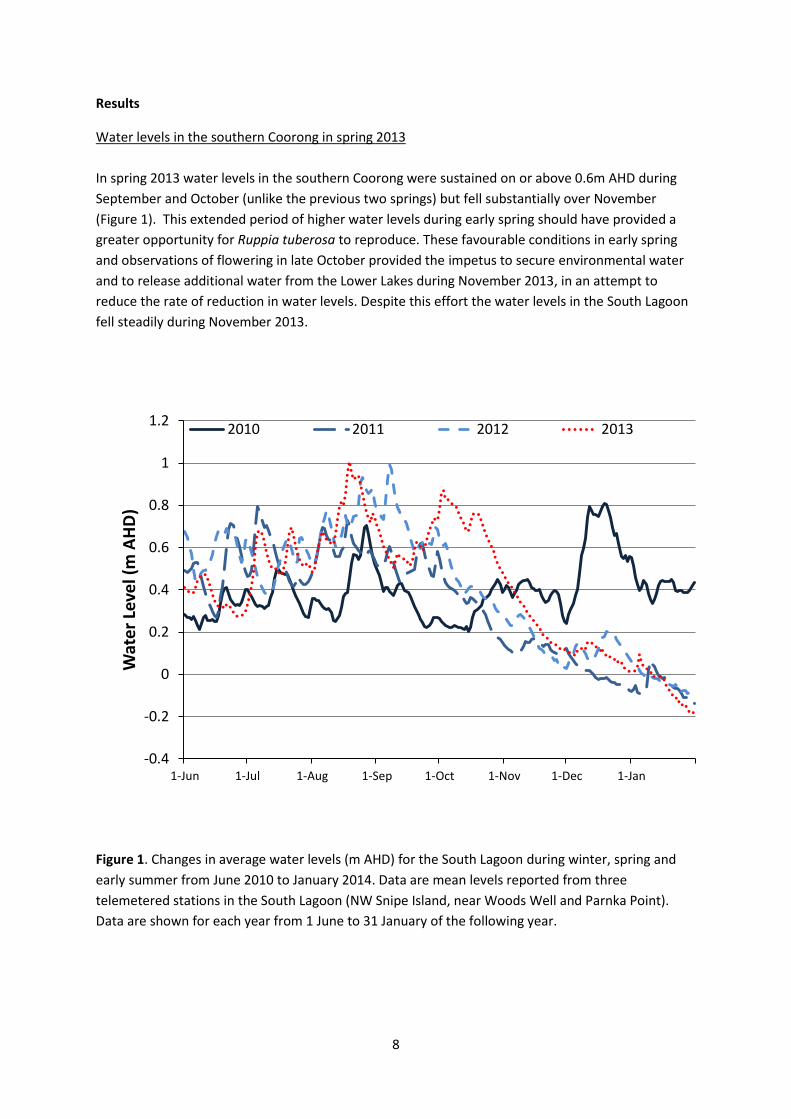
Water levels in the southern Coorong in spring 2013
In spring 2013 water levels in the southern Coorong were sustained on or above 0.6m AHD during
September and October (unlike the previous two springs) but fell substantially over November
(Figure 1). This extended period of higher water levels during early spring should have provided a
greater opportunity for Ruppia tuberosa to reproduce. These favourable conditions in early spring
and observations of flowering in late October provided the impetus to secure environmental water
and to release additional water from the Lower Lakes during November 2013, in an attempt to
reduce the rate of reduction in water levels. Despite this effort the water levels in the South Lagoon
fell steadily during November 2013.
Figure 1. Changes in average water levels (m AHD) for the South Lagoon during winter, spring and
early summer from June 2010 to January 2014. Data are mean levels reported from three
telemetered stations in the South Lagoon (NW Snipe Island, near Woods Well and Parnka Point).
Data are shown for each year from 1 June to 31 January of the following year.
-0.4
-0.2
0
0.2
0.4
0.6
0.8
1
1.2
1-Jun 1-Jul 1-Aug 1-Sep 1-Oct 1-Nov 1-Dec 1-Jan
Wat
er
Leve
l (m
AH
D)
2010 2011 2012 2013

9
Reconnaissance surveys in early December 2013
By early December 2013 most of the higher elevation Ruppia tuberosa beds (0.1 m to 0.3 m AHD)
were exposed and starting to desiccate, and those covered with shallow water (0.2 m or less)
deteriorating. The three areas of exposed mudflats that were examined in the southern Coorong all
had evidence of low levels of flowering (1.5 – 6.0 floral stalks.m-2, Table 1), but none of these floral
stalks had attached flower heads, suggesting that either the flower-heads had been removed (e.g. by
grazing waterfowl or by interference from filamentous algae) or if they had set seeds the seed-heads
had been dropped. At each of the three sites there was evidence of floral stalks and other Ruppia
plant material being washed ashore.
Two other areas in the southern Coorong where Ruppia tuberosa was still covered by around 30 cm
of water were also assessed (Table 1). At Gemini Bay (S33E) there were on average 26 intact floral
stalks.m-2 (i.e. with flower heads) and a further 21 floral stalks.m-2 that lacked flower heads. Many of
the intact floral stalks at this site were still short and growing. At this site there was an 85% cover of
filamentous green algae over the Ruppia beds and evidence of grazing in 25% of the 1m x 1m
quadrats examined. At the second site (S26E) there were just 3 intact stalks.m-2, on average. There
were a further 4 floral stalks.m-2 without flower heads at this site as well (Table 1). 31% of the
Ruppia bed at this site was covered with filamentous green algae, and evidence of grazing was
detected for 75% of the quadrats with Ruppia.
Table 1. Assessment of flowering effort by Ruppia tuberosa at selected sites in early December
2013. Data are means of 20-360 assessments of 1m x 1m quadrats arranged along 20m transects. %
cover of algae was estimated by eye, while evidence of grazing was assessed by taking a plug from
each quadrat and noting if any of the shoots had been grazed. The numbers of floral heads, floral
stalks and floral stalks washed ashore are the mean numbers counted per m2.
SITE # 20m transects
# 20m transects
% Ruppia cover
% algal cover
% quadrats
with grazing
# floral heads
# floral stalks
# floral stalks
washed ashore
Exposed mudflats
S26E 18 37 - - 0 3.5 0.4
S18E 18 18 - - 0 1.5 0
S43E 2 11 - - 0 6.0 7.0
Covered mudflats
S26E (29 cm) 2 - 31 75 3 4 -
S33E (34 cm) 1 - 85 25 26 21 -

10
Distribution and abundance of Ruppia tuberosa in the southern Coorong in January 2014
Summary statistics for the presence of live Ruppia tuberosa plants across the 23 sampling sites are
provided in Tables 2 and 3. Ruppia tuberosa shoots were detected at 16 sites but for one of these
sites the shoots were exposed or present only at the water line where they were unlikely to survive.
Including this site, 70% of the sites examined had Ruppia tuberosa shoots in January 2014. Sites with
Ruppia tuberosa were spread over a linear distance of 60 km, although the three most northern sites
(N07E, N12E and N19E) are considered outlying areas for Ruppia tuberosa under current conditions,
thus the extent of occurrence for Ruppia tuberosa within the main region used in the southern
Coorong was at least 43 km in January 2014.
Nine sites had average densities of shoots that exceeded the targeted 10 shoots per core at one
water depth at least (Table 3). These shoot densities coincided with the sites with high Ruppia cover.
Overall 39% of sites had at least 30% cover and >10 shoots per core at one water depth at least
(Tables 2 & 3).
Table 2. Percent of cores with Ruppia tuberosa plants present at different water depths across 23
sites in the southern Coorong in January 2014. Twenty-five cores were taken at each depth at each
site.
Site km from
East
West
Mouth dry waterline 30cm 60cm dry waterline 30cm 60cm
N19 38 4 20 0 0
N12 45 0 0 4 0
N07 50 0 0 8 0
N02 55 0 0 72 80
S03 59 0 0 96 72
S06 62 36 32 76 20 0 0 4 0
S11 67 0 0 0 0 0 0 60 0
S16 72 0 0 0 0 0 0 100 16
S21 77 0 0 0 0 0 0 16 0
S23 79 8 0 0 12
S26 82 0 0 12 84 0 0 24 96
S31 87 4 0 0 0 0 0 20 12
S33 89 4 0 100
S36 92 0 0 0 0 0 0 0 0
S41 97 0 0 16 16 0 0 96 100

11
There was a marked improvement in the distribution and abundance of Ruppia tuberosa in January
2014 compared to January 2013 (Fig. 2). Sites with and without Ruppia tuberosa were intermingled
along the Coorong. This suggests that factors other than salinity were likely to be affecting the
establishment of Ruppia tuberosa, since the salinity changes gradually along the southern Coorong
(Paton & Bailey 2014). The other factors likely to be involved include the level of exposure to wave
action particularly during storms, the bathymetry of a site and the presence of viable propagules in
the sediments.
Table 3. Mean numbers of Ruppia tuberosa shoots present in cores (75 mm diameter x 4 cm deep)
taken at four water depths at 23 sites spread across the southern Coorong in January 2014. Data are
based on 25 cores taken at each water depth at each site. To express these data as shoots.m-2
multiply by 226.
Site km from
East
West
Mouth Dry waterline 30cm 60cm dry waterline 30cm 60cm
N19 38 0.04 0.68 0 0
N12 45 0 0 0.12 0
N07 50 0 0 0.52 0
N02 55 0 0 25.6 21.1
S03 59 0 0 18.2 10.9
S06 62 0.92 0.56 11.8 1.6 0 0 0.2 0
S11 67 0 0 0 0 0 0 23.3 0
S16 72 0 0 0 0 0 0 78.8 4.0
S21 77 0 0 0 0 0 0 3.12 0
S23 79 0.2 0 0 0.1
S26 82 0 0 2.6 32.4 0 0 2.1 18.4
S31 87 0 0 0 0 0 0 3.5 2.5
S33 89 0.08 0 11.5
S36 92 0 0 0 0 0 0 0 0
S41 97 0 0 1.5 4.6 0 0 29.4 18.2

12
Figure 2. Changes in the distribution and abundance of Ruppia tuberosa along the Coorong in
January 2013 and January 2014. The data show the maximum percent of cores with Ruppia shoots
for cores taken in 30 cm or 60 cm water depths (Table 2). Red spots show areas where there were
no Ruppia shoots at these depths, orange spots where the cover was less than 30% and green spots
where the cover exceeded 30% (i.e. > 30% of cores had shoots). The actual percentages are shown
on the Figure.
The abundances of propagules associated with these plants were generally low. Tables 4 and 5 show
the data for turions. Only type II turions were detected. Type II turions carry much smaller reserves
than type I turions and have limited capacity to survive any extended period of desiccation. Type II
turions were detected in cores at 18 sites and abundances in excess of 10 type II turions per core
were detected at four sites all in water 30 cm deep. Sites with high abundances of shoots tended to
be the sites with large numbers of type II turions and so the turion counts reflect the shoot data.
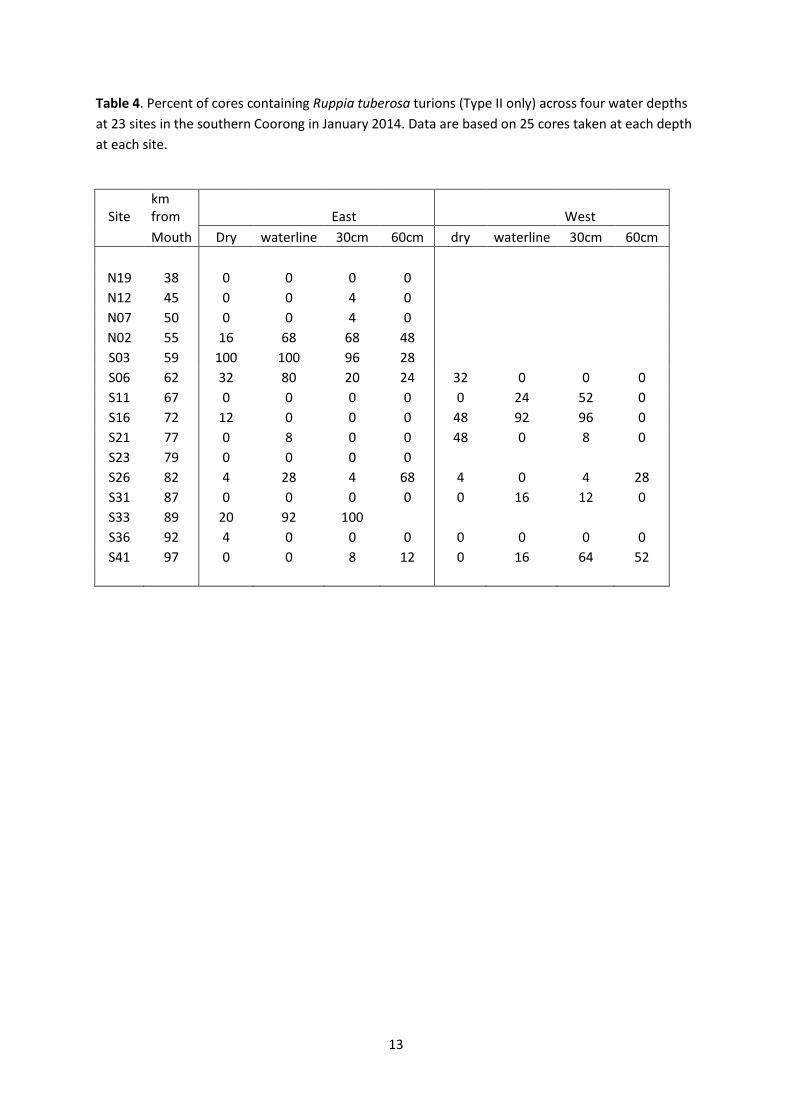
13
Table 4. Percent of cores containing Ruppia tuberosa turions (Type II only) across four water depths
at 23 sites in the southern Coorong in January 2014. Data are based on 25 cores taken at each depth
at each site.
Site km from East West
Mouth Dry waterline 30cm 60cm dry waterline 30cm 60cm
N19 38 0 0 0 0
N12 45 0 0 4 0
N07 50 0 0 4 0
N02 55 16 68 68 48
S03 59 100 100 96 28
S06 62 32 80 20 24 32 0 0 0
S11 67 0 0 0 0 0 24 52 0
S16 72 12 0 0 0 48 92 96 0
S21 77 0 8 0 0 48 0 8 0
S23 79 0 0 0 0
S26 82 4 28 4 68 4 0 4 28
S31 87 0 0 0 0 0 16 12 0
S33 89 20 92 100
S36 92 4 0 0 0 0 0 0 0
S41 97 0 0 8 12 0 16 64 52
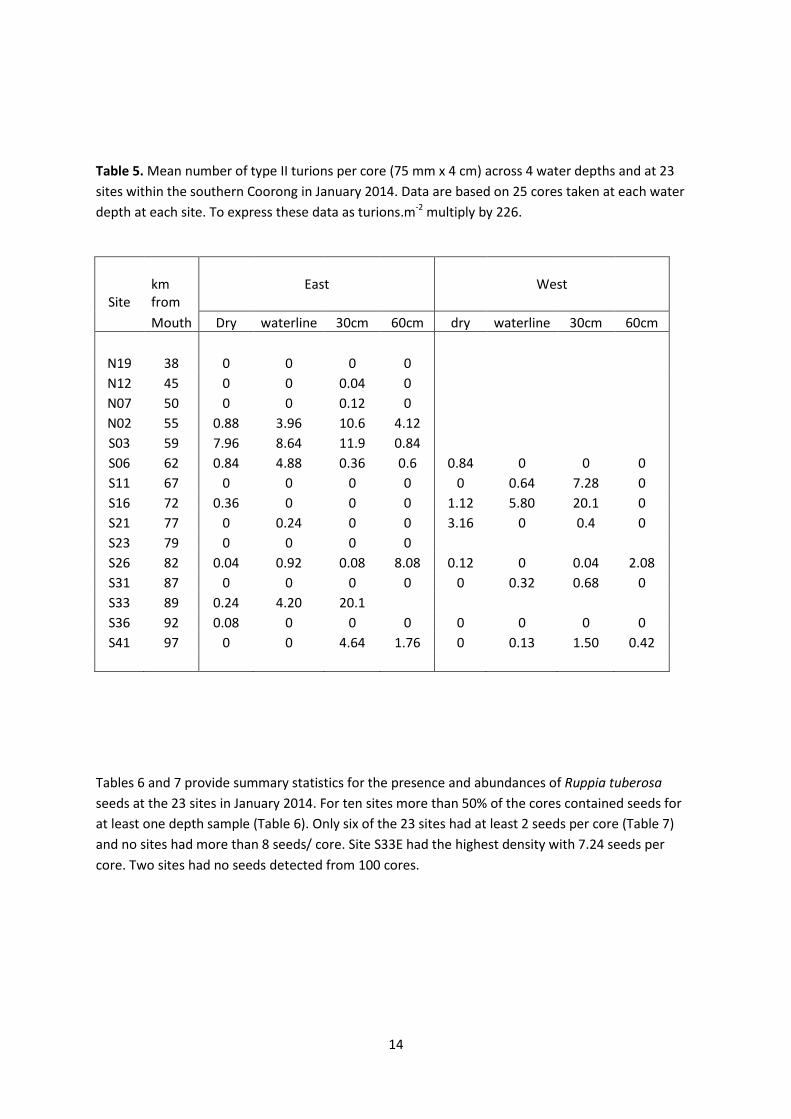
14
Table 5. Mean number of type II turions per core (75 mm x 4 cm) across 4 water depths and at 23
sites within the southern Coorong in January 2014. Data are based on 25 cores taken at each water
depth at each site. To express these data as turions.m-2 multiply by 226.
Site km from
East
West
Mouth Dry waterline 30cm 60cm dry waterline 30cm 60cm
N19 38 0 0 0 0
N12 45 0 0 0.04 0
N07 50 0 0 0.12 0
N02 55 0.88 3.96 10.6 4.12
S03 59 7.96 8.64 11.9 0.84
S06 62 0.84 4.88 0.36 0.6 0.84 0 0 0
S11 67 0 0 0 0 0 0.64 7.28 0
S16 72 0.36 0 0 0 1.12 5.80 20.1 0
S21 77 0 0.24 0 0 3.16 0 0.4 0
S23 79 0 0 0 0
S26 82 0.04 0.92 0.08 8.08 0.12 0 0.04 2.08
S31 87 0 0 0 0 0 0.32 0.68 0
S33 89 0.24 4.20 20.1
S36 92 0.08 0 0 0 0 0 0 0
S41 97 0 0 4.64 1.76 0 0.13 1.50 0.42
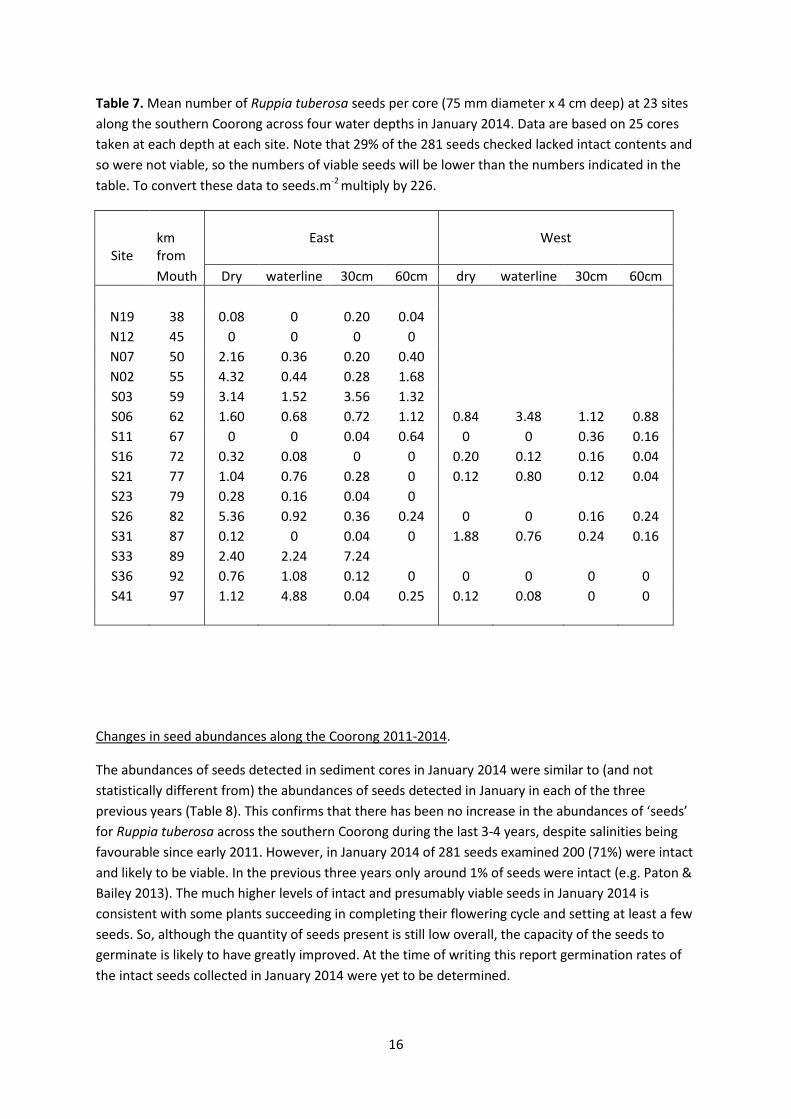
Tables 6 and 7 provide summary statistics for the presence and abundances of Ruppia tuberosa
seeds at the 23 sites in January 2014. For ten sites more than 50% of the cores contained seeds for
at least one depth sample (Table 6). Only six of the 23 sites had at least 2 seeds per core (Table 7)
and no sites had more than 8 seeds/ core. Site S33E had the highest density with 7.24 seeds per
core. Two sites had no seeds detected from 100 cores.

15
Table 6. Percent of cores containing Ruppia tuberosa seeds at 23 locations in the southern Coorong
at four different water depths in January 2014. Data are based on 25 cores taken at each depth at
each site.
Site km from
East
West
Mouth Dry waterline 30cm 60cm dry waterline 30cm 60cm
N19 38 8 0 12 4
N12 45 0 0 0 0
N07 50 68 32 12 36
N02 55 96 68 68 72
S03 59 76 64 84 56
S06 62 44 40 32 56 40 60 24 52
S11 67 0 0 4 32 0 0 12 8
S16 72 12 4 0 0 16 8 12 4
S21 77 32 52 20 0 8 20 8 4
S23 79 12 8 4 0
S26 82 92 40 32 12 0 0 12 16
S31 87 4 0 4 0 56 32 20 16
S33 89 80 92 88
S36 92 36 32 4 0 0 0 0 0
S41 97 40 64 4 12 8 8 0 0
16
Table 7. Mean number of Ruppia tuberosa seeds per core (75 mm diameter x 4 cm deep) at 23 sites
along the southern Coorong across four water depths in January 2014. Data are based on 25 cores
taken at each depth at each site. Note that 29% of the 281 seeds checked lacked intact contents and
so were not viable, so the numbers of viable seeds will be lower than the numbers indicated in the
table. To convert these data to seeds.m-2 multiply by 226.
Site km from
East
West
Mouth Dry waterline 30cm 60cm dry waterline 30cm 60cm
N19 38 0.08 0 0.20 0.04
N12 45 0 0 0 0
N07 50 2.16 0.36 0.20 0.40
N02 55 4.32 0.44 0.28 1.68
S03 59 3.14 1.52 3.56 1.32
S06 62 1.60 0.68 0.72 1.12 0.84 3.48 1.12 0.88
S11 67 0 0 0.04 0.64 0 0 0.36 0.16
S16 72 0.32 0.08 0 0 0.20 0.12 0.16 0.04
S21 77 1.04 0.76 0.28 0 0.12 0.80 0.12 0.04
S23 79 0.28 0.16 0.04 0
S26 82 5.36 0.92 0.36 0.24 0 0 0.16 0.24
S31 87 0.12 0 0.04 0 1.88 0.76 0.24 0.16
S33 89 2.40 2.24 7.24
S36 92 0.76 1.08 0.12 0 0 0 0 0
S41 97 1.12 4.88 0.04 0.25 0.12 0.08 0 0
Changes in seed abundances along the Coorong 2011-2014.
The abundances of seeds detected in sediment cores in January 2014 were similar to (and not
statistically different from) the abundances of seeds detected in January in each of the three
previous years (Table 8). This confirms that there has been no increase in the abundances of ‘seeds’
for Ruppia tuberosa across the southern Coorong during the last 3-4 years, despite salinities being
favourable since early 2011. However, in January 2014 of 281 seeds examined 200 (71%) were intact
and likely to be viable. In the previous three years only around 1% of seeds were intact (e.g. Paton &
Bailey 2013). The much higher levels of intact and presumably viable seeds in January 2014 is
consistent with some plants succeeding in completing their flowering cycle and setting at least a few
seeds. So, although the quantity of seeds present is still low overall, the capacity of the seeds to
germinate is likely to have greatly improved. At the time of writing this report germination rates of
the intact seeds collected in January 2014 were yet to be determined.

17
Table 8. Abundances of Ruppia tuberosa seeds (seeds per core) found in sediments at 12 sites along
the eastern shore of the southern Coorong in January from 2011 to 2014. Data are based on 75-100
cores (75 mm diameter x 4 cm deep) taken at a range of water depths at each site in each year and
are means ± s.e.. In each year over 200 of the seeds were checked for contents. In January 2013 all
but one of these was sand-filled and so not viable. However in January 2014 71% of the seeds were
intact. To convert these data to seeds.m-2 multiply by 226.
Site km January 2011 January 2012 January 2013 January 2014 from
Mouth
N19 38 0.00 ± 0.00 0.19 ± 0.07 0.01 ± 0.01 0.08 ± 0.03 N12 45 0.00 ± 0.00 0.00 ± 0.00 0.01 ± 0.01 0.00 ± 0.00 N07 50 0.17 ± 0.05 0.29 ± 0.20 0.12 ± 0.04 0.78 ± 0.16 N02 55 1.39 ± 0.22 0.27 ± 0.08 0.43 ± 0.10 1.68 ± 0.20 S06 62 3.48 ± 0.68 1.13 ± 0.33 0.60 ± 0.19 1.03 ± 0.20 S11 67 1.09 ± 0.38 0.10 ± 0.04 0.23 ± 0.07 0.17 ± 0.07 S16 72 0.01 ± 0.01 0.03 ± 0.02 0.00 ± 0.00 0.10 ± 0.06 S21 77 0.05 ± 0.04 0.07 ± 0.05 0.02 ± 0.01 0.52 ± 0.11 S26 82 0.12 ± 0.05 1.35 ± 0.47 1.16 ± 0.35 1.72 ± 0.33 S31 87 0.00 ± 0.00 0.00 ± 0.00 0.09 ± 0.04 0.04 ± 0.03 S36 92 008 ± 0.04 0.18 ± 0.07 0.46 ± 0.29 0.49 ± 0.15 S41 97 0.19 ± 0.07 0.57 ± 0.14 0.56 ± 0.11 1.58 ± 0.84
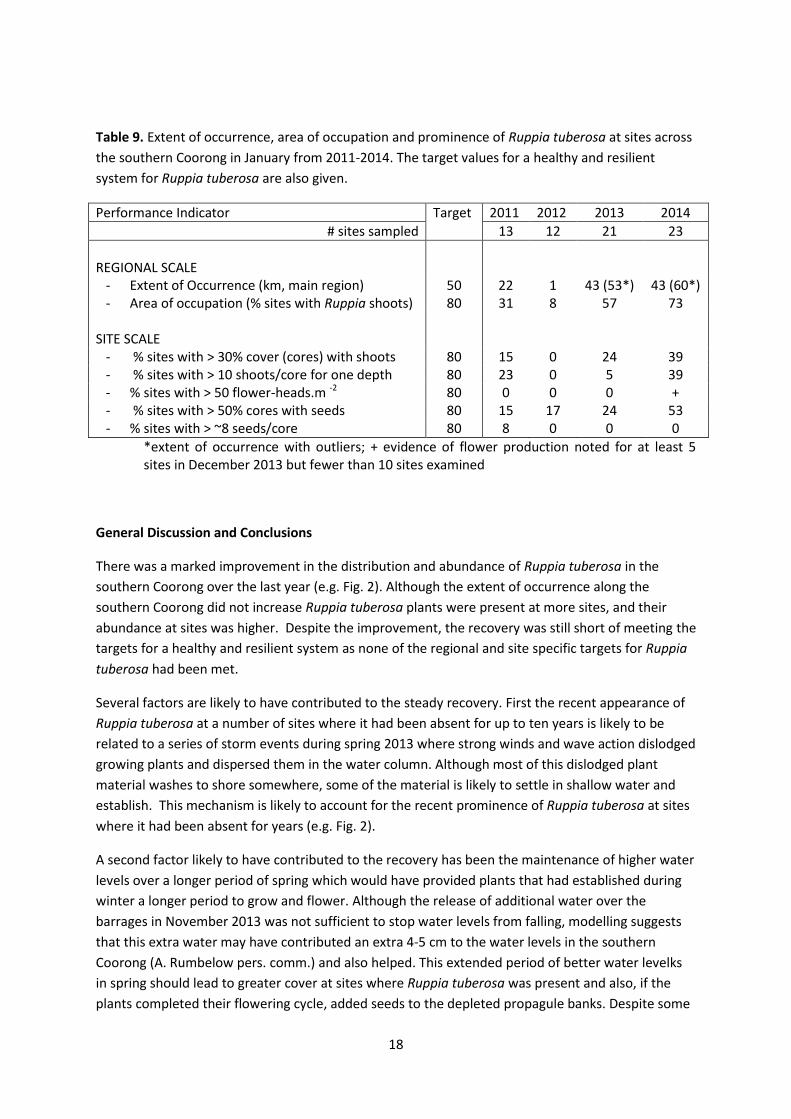
Status of Ruppia tuberosa in the southern Coorong in January 2014
Table 9 provides summary statistics for the status of Ruppia tuberosa in January for the last four
years and against the stated benchmarks for a healthy and resilient Ruppia tuberosa system. Ruppia
tuberosa was least prominent in January 2012 when shoots of Ruppia tuberosa were found at only
one site. Since then there has been an improvement over 2012 and again over 2013 for both
regional scale indicators and for three of the five site scale performance indicators. However none of
the indicators have reached the target levels required for a healthy and resilient Ruppia tuberosa
system. Importantly the abundances of seeds at all sites (and depths, Tables 7, 8 and 9) were low
and well below the levels needed for some level resilience.
18
Table 9. Extent of occurrence, area of occupation and prominence of Ruppia tuberosa at sites across
the southern Coorong in January from 2011-2014. The target values for a healthy and resilient
system for Ruppia tuberosa are also given.
Performance Indicator Target 2011 2012 2013 2014
# sites sampled 13 12 21 23
REGIONAL SCALE
- Extent of Occurrence (km, main region) 50 22 1 43 (53*) 43 (60*) - Area of occupation (% sites with Ruppia shoots) 80 31 8 57 73
SITE SCALE
- % sites with > 30% cover (cores) with shoots 80 15 0 24 39 - % sites with > 10 shoots/core for one depth 80 23 0 5 39 - % sites with > 50 flower-heads.m -2 80 0 0 0 + - % sites with > 50% cores with seeds 80 15 17 24 53 - % sites with > ~8 seeds/core 80 8 0 0 0
*extent of occurrence with outliers; + evidence of flower production noted for at least 5 sites in December 2013 but fewer than 10 sites examined
General Discussion and Conclusions
There was a marked improvement in the distribution and abundance of Ruppia tuberosa in the
southern Coorong over the last year (e.g. Fig. 2). Although the extent of occurrence along the
southern Coorong did not increase Ruppia tuberosa plants were present at more sites, and their
abundance at sites was higher. Despite the improvement, the recovery was still short of meeting the
targets for a healthy and resilient system as none of the regional and site specific targets for Ruppia
tuberosa had been met.
Several factors are likely to have contributed to the steady recovery. First the recent appearance of
Ruppia tuberosa at a number of sites where it had been absent for up to ten years is likely to be
related to a series of storm events during spring 2013 where strong winds and wave action dislodged
growing plants and dispersed them in the water column. Although most of this dislodged plant
material washes to shore somewhere, some of the material is likely to settle in shallow water and
establish. This mechanism is likely to account for the recent prominence of Ruppia tuberosa at sites
where it had been absent for years (e.g. Fig. 2).
A second factor likely to have contributed to the recovery has been the maintenance of higher water
levels over a longer period of spring which would have provided plants that had established during
winter a longer period to grow and flower. Although the release of additional water over the
barrages in November 2013 was not sufficient to stop water levels from falling, modelling suggests
that this extra water may have contributed an extra 4-5 cm to the water levels in the southern
Coorong (A. Rumbelow pers. comm.) and also helped. This extended period of better water levelks
in spring should lead to greater cover at sites where Ruppia tuberosa was present and also, if the
plants completed their flowering cycle, added seeds to the depleted propagule banks. Despite some
19
areas producing over 40 floral heads per m2, the numbers of seeds detected in the seed banks
changed little, although the numbers of intact seeds in the seed bank did. Assuming that each floral
head can produce around 10 seeds, floral densities of 40 floral heads per m2 should add around 400
seeds per m2 or about 1.8 seeds per core. This increase was not detected suggesting that many of
the floral heads failed to set seeds.
Failure to set seeds could be due to water levels dropping prior to all of the floral heads having
completed their flowering cycle and setting seeds. Alternatively poor conversion rates of flowers to
seeds could be due to excessive losses of floral heads due to interference from filamentous green
algae and or grazing by waterfowl. In December 2013 around half of the floral stalks that were still
attached to plants had been snapped (Table 1). These floral stalks were likely to have been snapped
because the added weight of filamentous green algae attached to the flower heads had increased
the likelihood of wave action snapping the stalks. Large numbers of floral stalks were washed ashore
at many sites with filamentous green algae attached to the flower heads (e.g. see image on title
page), particularly during strong winds associated with storm events. This suggests that interference
from filamentous green algae is a key factor reducing reproductive outputs of Ruppia tuberosa and
dampening re-establishment. The lower salinities that established in the southern sections of the
South Lagoon as a consequence of releases of freshwater at Salt Creek may have also contributed.
Lower salinities are likely to favour filamentous green algae and exacerbate this interference. This
interference is not just limited to disrupting reproductive outputs for Ruppia tuberosa. In many areas
mats of filamentous algae established around the plants reducing light and potentially dampening
the growth of the plants as well.
Future management of water in the region should aim to extend the period of high spring water
levels via barrage releases at least through November and also limit the effect of releases of fresh
water at Salt Creek on salinities that could favour the growth of filamentous green algae.
Monitoring programs should also be developed for filamentous green algae and the conditions that
favour this species defined so that these conditions can be avoided in the future.
Water levels in January when the summer monitoring program was conducted were around 0.7 m
lower than they were in winter (Fig. 1). Thus the plants that were detected in January 2014 in water
at sampling depths of 0.3 and 0.6m were likely covered with 1-1.3m of water in winter. Healthy
growth of Ruppia tuberosa is usually limited to water depths below 0.9m in the Coorong (Paton &
Bailey 2010, Paton et al. 2011). Thus the Ruppia tuberosa plants being monitored in summer are
different to those being monitored in winter and will experience different ecological conditions. For
example, they will be continuously inundated with water. Most of the plants detected at least in
0.6m deep water in January 2014 had short shoots (1-3 cm in length) suggesting that they had only
recently started to grow, perhaps only growing for the last 1-2 months once water levels had
dropped sufficiently in mid-November. Whether these plants are permanently present at these
depths or whether plants recolonise these areas each year from plants growing in shallower areas is
not known and deserves study. There is the potential that if the higher spring water levels via
barrage releases cannot be sustained that lower water levels in spring may shift Ruppia tuberosa to
these ‘deeper’ areas or favour the plants growing in these deeper areas.
A series of quantitative measures have been established for assessing the status of Ruppia tuberosa
in the Coorong, and those measures and targets have been applied to the data collected in January
20
2014. There are, however, some refinements needed. In applying them to the data collected in
January 2014, a site was regarded as having met the target if the target was met at just one of the
water depths sampled. This is likely to over-estimate the extent of recovery and the quantitative
measures may need to define a range of water depths over which the targets are to be met and or
determine and report the actual range of water depths and the width of mudflat over which the
target was met. Both may be important where the bathymetry of the site is such that depending on
spring water levels either a narrow or a broad strip of suitable water depths is available. Refining
these quantitative measures is beyond the scope of this report. In addition the assessment of floral
production against the stated target will require assessments in late spring (November) and if that
target is to be monitored then that will require additional investment in monitoring.
In summary, the ecological conditions for Ruppia tuberosa were better in spring 2013 than the
previous two years because water levels in the southern Coorong were maintained at higher levels
for longer. Linked to these better conditions was a measurable increase in the distribution and
abundance of Ruppia tuberosa in the southern Coorong and an improvement in the viability of the
seed bank, indicating that some successful reproduction had taken place. The extent to which
environmental water allocations contributed to these outcomes is difficult to determine.
Importantly, the volumes of water released over the barrages in November 2013 were not sufficient
to fully cover the beds of Ruppia tuberosa before they had fully completed their flowering. Larger
volumes are needed to secure a greater rate of recovery for Ruppia tuberosa. In those springs when
flows of water over the barrages are low, there may be merit in allowing water levels to drop early in
spring to provide a longer growing season for populations of Ruppia tuberosa to establish at lower
elevations within the Coorong. Before this can be considered an understanding of how these
populations establish, and whether they can be maintained is required. These plants are continually
covered by water and may reproduce asexually through turions. This will require additional
monitoring of those populations in autumn before water levels rise in winter.
Acknowledgments
This monitoring program was funded by the Department of Environment, Water and Natural
Resources (DEWNR) through The Living Murray program for the Murray Darling Basin Authority.
Tristan O’Brien, Victoria McCarron, Gareth Oerman, Fiona Paton, Lydia Paton, Tom Bradley, Tom
Hunt, Donna Belder, Lachlan Duncan, Grace Hodder and Hayley Merigot provided able field
assistance. Fiona Paton assisted with figures. Adrienne Rumbelow and Claire Sims provided
comments on a draft of this report. The research was conducted under a DEWNR wildlife research
permit issued to David Paton.

21
References
Kim, D.H., Aldridge, K.T., Brookes, J.D. & Ganf, G.G. 2013. The effect of salinity on the germination of
Ruppia tuberosa and Ruppia megacarpa and implications for the Coorong: A coastal lagoon
of southern Australia. Aquatic Botany 111: 81-88
Moore, L. 2014. The distribution of herbivorous waterfowl and their aquatic food resources in the
Coorong, South Australia. B.Sc. Hons thesis. University of Adelaide.
Paton, D.C. 2010. At the End of the River. The Coorong and Lower Lakes. ATF Press, Hindmarsh.
Paton D.C. & Bailey C.P. 2010. Restoring Ruppia tuberosa to the southern Coorong. Report for the
Department of Environment and Natural Heritage. (University of Adelaide, Adelaide.)
Paton, D.C. & Bailey C. P. 2012. Annual monitoring of Ruppia tuberosa in the Coorong region of
South Australia, July 2011. Report for the Department of Environment, Water and Natural
Resources. (University of Adelaide, Adelaide).
Paton, D.C. & Bailey C. P. 2013a. Annual monitoring of Ruppia tuberosa in the Coorong region of
South Australia, July 2012. Report for the Department of Environment, Water and Natural
Resources. (University of Adelaide, Adelaide).
Paton, D.C. & Bailey, C.P. 2013b. Response of Ruppia tuberosa in the Coorong South Lagoon to environmental water delivery over summer 2012-13. (University of Adelaide, Adelaide
Paton, D.C. & Bailey C.P. 2014. Condition monitoring of the Lower Lakes, Coorong and Murray Mouth Icon Site: Waterbirds 2014. (University of Adelaide, Adelaide)
Paton, D.C., McKillop, T. & Bailey, C. P. 2011. Developing ecological knowledge to inform the re-
establishment of Ruppia tuberosa in the southern Coorong. Report for the Department of Environment and Natural Resources (University of Adelaide, Adelaide).