Embed Size (px)
Citation preview
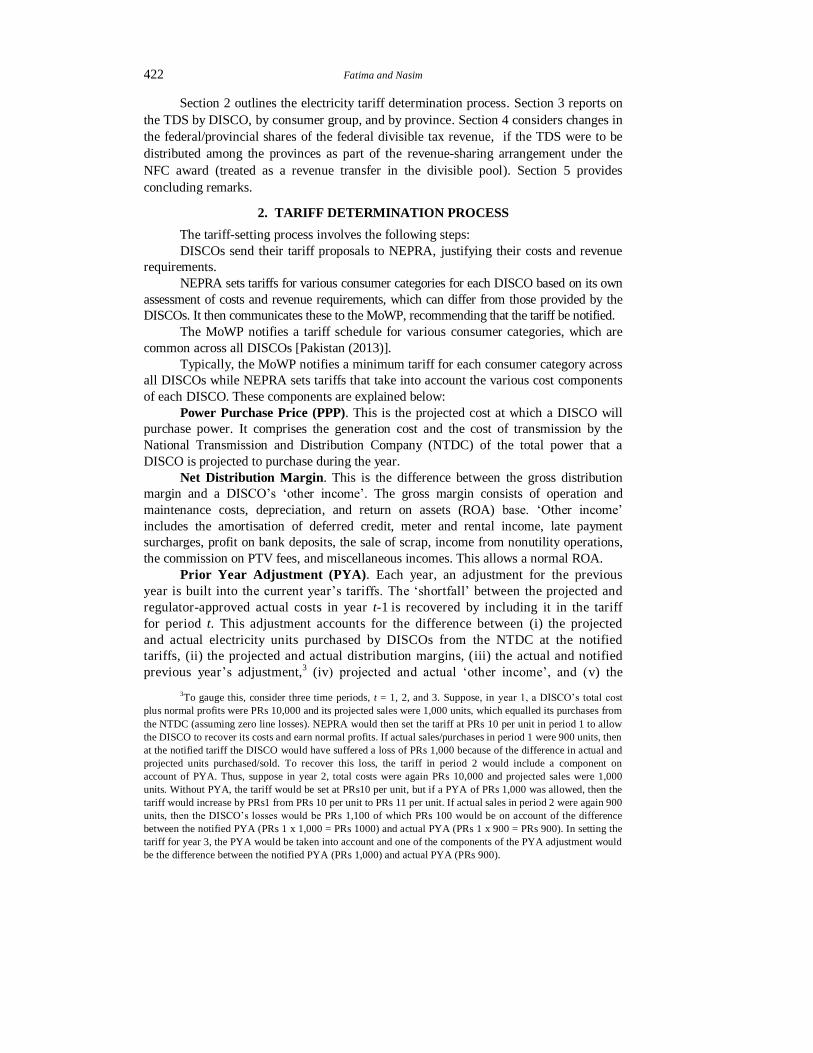
© The Pakistan Development Review
52:4 Part I (Winter 2013) pp. 421–436
Interprovincial Differences in Power Sector Subsidies
and Implications for the NFC Award
UMBREEN FATIMA and ANJUM NASIM
1. INTRODUCTION
Power sector subsidies constituted 83 percent of the federal government’s total
subsidies of PRs 558 billion in 2012. The tariff differential subsidy (TDS) amounted to
PRs 464 billion (including arrears of PRs 312.8 billion from previous years). The TDS is
provided to distribution companies (DISCOs) to cover the difference between the tariff
schedules approved by the National Electric Power Regulatory Authority (NEPRA)
(which can differ across DISCOs) and the uniform tariff schedule (by consumer group)
notified by the Ministry of Water and Power (MoWP) for all regions of the country.
The NEPRA-approved tariff takes account of DISCOs’ revenue requirements and
various elements of cost. In calculating the average tariff, NEPRA also takes into account
companies’ transmission and distribution (T&D) losses. Both revenue requirements and T&D
losses differ across DISCOs, which are duly reflected in NEPRA-approved tariffs.
The fact that NEPRA approves different tariffs across DISCOs while the MoWP
sets uniform tariffs (by consumer group) implies that each DISCO receives a different
TDS from the federal government. This translates into different subsidies for each
province. By aggregating the TDS by consumer group across all DISCOs, we can also
calculate the aggregate subsidy by consumer group.
In this paper, we calculate the subsidies provided to each of the country’s ten
DISCOs,1 to individual consumer groups, and to the provinces. The TDS effectively
reduce the federal government’s share in the divisible pool of taxes compared with the
42.5 percent share approved under the 7th National Finance Commission (NFC) award.
We also calculate the share of the four provinces in the divisible pool by factoring in
provincial TDS shares for the financial year (FY) 2011/12.2
Umbreen Fatima <[email protected]> is Research Associate at the Institute of
Development and Economic Alternatives (IDEAS), Lahore. Anjum Nasim <[email protected]> is
Senior Research Fellow at the Institute of Development and Economic Alternatives (IDEAS), Lahore.
Authors’ Note: The authors would like to thank Mr Adnan Haider, the discussant of this paper at the 29th
Annual General Meeting and Conference of the Pakistan Society of Development Economists. They would also like to
thank Mr Sohaib Jamali at the Research Department of the Business Recorder for his very valuable feedback. 1These include the nine DISCOs, which are government-owned companies, and the Karachi Electric
Supply Company (KESC), which is a privately owned company. Although the Tribal Electric Supply Company
(TESCO) was also created as a DISCO, it has not yet been licensed [see Pakistan (2013)] and is therefore not
included in our calculations. 2The Pakistan government’s financial year starts on 1 July and ends on 30 June of the following year.
422 Fatima and Nasim
Section 2 outlines the electricity tariff determination process. Section 3 reports on
the TDS by DISCO, by consumer group, and by province. Section 4 considers changes in
the federal/provincial shares of the federal divisible tax revenue, if the TDS were to be
distributed among the provinces as part of the revenue-sharing arrangement under the
NFC award (treated as a revenue transfer in the divisible pool). Section 5 provides
concluding remarks.
2. TARIFF DETERMINATION PROCESS
The tariff-setting process involves the following steps:
DISCOs send their tariff proposals to NEPRA, justifying their costs and revenue
requirements.
NEPRA sets tariffs for various consumer categories for each DISCO based on its own
assessment of costs and revenue requirements, which can differ from those provided by the
DISCOs. It then communicates these to the MoWP, recommending that the tariff be notified.
The MoWP notifies a tariff schedule for various consumer categories, which are
common across all DISCOs [Pakistan (2013)].
Typically, the MoWP notifies a minimum tariff for each consumer category across
all DISCOs while NEPRA sets tariffs that take into account the various cost components
of each DISCO. These components are explained below:
Power Purchase Price (PPP). This is the projected cost at which a DISCO will
purchase power. It comprises the generation cost and the cost of transmission by the
National Transmission and Distribution Company (NTDC) of the total power that a
DISCO is projected to purchase during the year.
Net Distribution Margin. This is the difference between the gross distribution
margin and a DISCO’s ‘other income’. The gross margin consists of operation and
maintenance costs, depreciation, and return on assets (ROA) base. ‘Other income’
includes the amortisation of deferred credit, meter and rental income, late payment
surcharges, profit on bank deposits, the sale of scrap, income from nonutility operations,
the commission on PTV fees, and miscellaneous incomes. This allows a normal ROA.
Prior Year Adjustment (PYA). Each year, an adjustment for the previous
year is built into the current year’s tariffs. The ‘shortfall’ between the projected and
regulator-approved actual costs in year t-1 is recovered by including it in the tariff
for period t. This adjustment accounts for the difference between (i) the projected
and actual electricity units purchased by DISCOs from the NTDC at the notified
tariffs, (ii) the projected and actual distribution margins, (iii) the actual and notified
previous year’s adjustment,3 (iv) projected and actual ‘other income’, and (v) the
3To gauge this, consider three time periods, t = 1, 2, and 3. Suppose, in year 1, a DISCO’s total cost
plus normal profits were PRs 10,000 and its projected sales were 1,000 units, which equalled its purchases from
the NTDC (assuming zero line losses). NEPRA would then set the tariff at PRs 10 per unit in period 1 to allow
the DISCO to recover its costs and earn normal profits. If actual sales/purchases in period 1 were 900 units, then
at the notified tariff the DISCO would have suffered a loss of PRs 1,000 because of the difference in actual and
projected units purchased/sold. To recover this loss, the tariff in period 2 would include a component on
account of PYA. Thus, suppose in year 2, total costs were again PRs 10,000 and projected sales were 1,000
units. Without PYA, the tariff would be set at PRs10 per unit, but if a PYA of PRs 1,000 was allowed, then the
tariff would increase by PRs1 from PRs 10 per unit to PRs 11 per unit. If actual sales in period 2 were again 900
units, then the DISCO’s losses would be PRs 1,100 of which PRs 100 would be on account of the difference
between the notified PYA (PRs 1 x 1,000 = PRs 1000) and actual PYA (PRs 1 x 900 = PRs 900). In setting the
tariff for year 3, the PYA would be taken into account and one of the components of the PYA adjustment would
be the difference between the notified PYA (PRs 1,000) and actual PYA (PRs 900).
Interprovincial Differences in Power Sector Subsidies and Implications for the NFC Award 423
projected and actual consumption mix.4
NEPRA determines an average tariff after including all the cost components and
dividing the sum by projected sales. The projected sales figure also takes into account
DISCOs’ T&D losses. Thus, in the case of the Lahore Electric Supply Company
(LESCO), NEPRA projected its power purchase and sales in FY2011/12 to be 17,547
GWh and 15,441 GWh, respectively, allowing 12 percent as T&D losses. The total cost
was estimated at PRs 170,585 million. The average tariff was PRs 11.05/kWh, which was
obtained by dividing PRs 170,585 million by 15,441 GWh. This implies that differences
in line losses translate into differences in NEPRA-determined tariffs across DISCOs. The
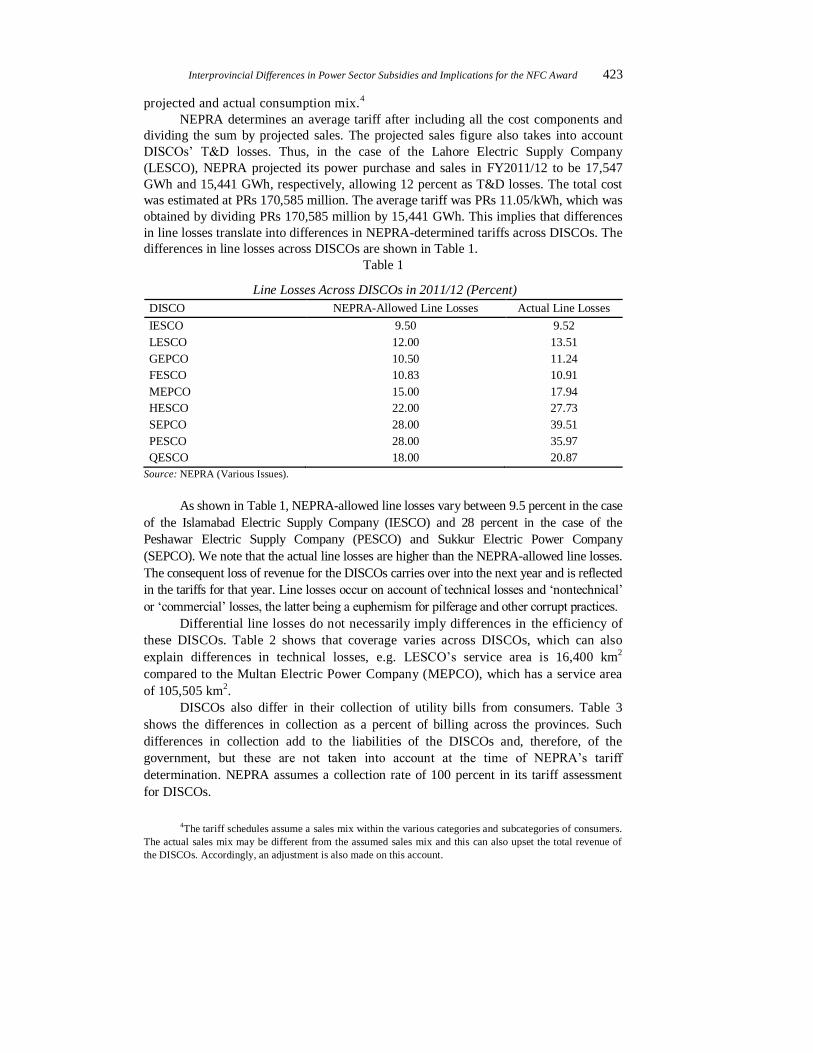
differences in line losses across DISCOs are shown in Table 1.
Table 1
Line Losses Across DISCOs in 2011/12 (Percent)
DISCO NEPRA-Allowed Line Losses Actual Line Losses
IESCO 9.50 9.52
LESCO 12.00 13.51
GEPCO 10.50 11.24
FESCO 10.83 10.91
MEPCO 15.00 17.94
HESCO 22.00 27.73
SEPCO 28.00 39.51
PESCO 28.00 35.97
QESCO 18.00 20.87
Source: NEPRA (Various Issues).
As shown in Table 1, NEPRA-allowed line losses vary between 9.5 percent in the case
of the Islamabad Electric Supply Company (IESCO) and 28 percent in the case of the
Peshawar Electric Supply Company (PESCO) and Sukkur Electric Power Company
(SEPCO). We note that the actual line losses are higher than the NEPRA-allowed line losses.
The consequent loss of revenue for the DISCOs carries over into the next year and is reflected
in the tariffs for that year. Line losses occur on account of technical losses and ‘nontechnical’
or ‘commercial’ losses, the latter being a euphemism for pilferage and other corrupt practices.
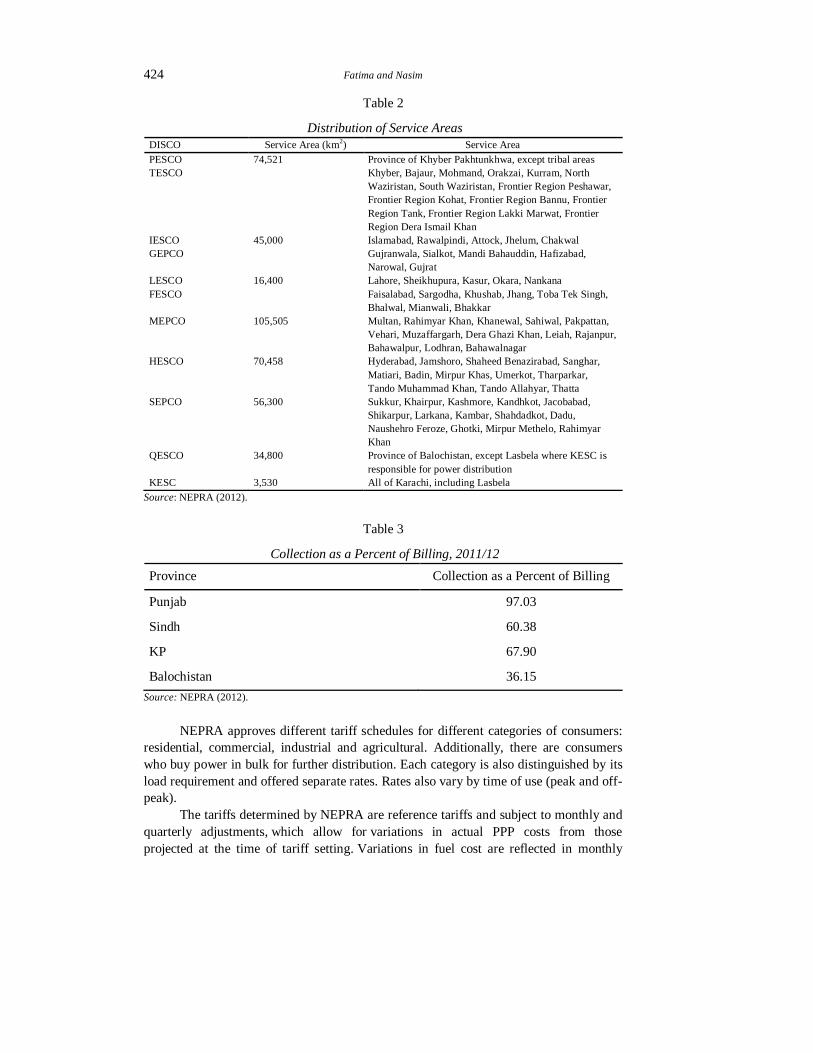
Differential line losses do not necessarily imply differences in the efficiency of
these DISCOs. Table 2 shows that coverage varies across DISCOs, which can also
explain differences in technical losses, e.g. LESCO’s service area is 16,400 km2
compared to the Multan Electric Power Company (MEPCO), which has a service area
of 105,505 km2. DISCOs also differ in their collection of utility bills from consumers. Table 3
shows the differences in collection as a percent of billing across the provinces. Such
differences in collection add to the liabilities of the DISCOs and, therefore, of the
government, but these are not taken into account at the time of NEPRA’s tariff
determination. NEPRA assumes a collection rate of 100 percent in its tariff assessment
for DISCOs.
4The tariff schedules assume a sales mix within the various categories and subcategories of consumers.
The actual sales mix may be different from the assumed sales mix and this can also upset the total revenue of
the DISCOs. Accordingly, an adjustment is also made on this account.
424 Fatima and Nasim
Table 2
Distribution of Service Areas
DISCO Service Area (km2) Service Area
PESCO 74,521 Province of Khyber Pakhtunkhwa, except tribal areas
TESCO
Khyber, Bajaur, Mohmand, Orakzai, Kurram, North
Waziristan, South Waziristan, Frontier Region Peshawar,
Frontier Region Kohat, Frontier Region Bannu, Frontier
Region Tank, Frontier Region Lakki Marwat, Frontier
Region Dera Ismail Khan
IESCO 45,000 Islamabad, Rawalpindi, Attock, Jhelum, Chakwal
GEPCO Gujranwala, Sialkot, Mandi Bahauddin, Hafizabad,
Narowal, Gujrat
LESCO 16,400 Lahore, Sheikhupura, Kasur, Okara, Nankana
FESCO Faisalabad, Sargodha, Khushab, Jhang, Toba Tek Singh,
Bhalwal, Mianwali, Bhakkar
MEPCO 105,505 Multan, Rahimyar Khan, Khanewal, Sahiwal, Pakpattan,
Vehari, Muzaffargarh, Dera Ghazi Khan, Leiah, Rajanpur,
Bahawalpur, Lodhran, Bahawalnagar
HESCO 70,458 Hyderabad, Jamshoro, Shaheed Benazirabad, Sanghar,
Matiari, Badin, Mirpur Khas, Umerkot, Tharparkar,
Tando Muhammad Khan, Tando Allahyar, Thatta
SEPCO 56,300 Sukkur, Khairpur, Kashmore, Kandhkot, Jacobabad,
Shikarpur, Larkana, Kambar, Shahdadkot, Dadu,
Naushehro Feroze, Ghotki, Mirpur Methelo, Rahimyar
Khan
QESCO 34,800 Province of Balochistan, except Lasbela where KESC is
responsible for power distribution
KESC 3,530 All of Karachi, including Lasbela
Source: NEPRA (2012).
Table 3
Collection as a Percent of Billing, 2011/12
Province Collection as a Percent of Billing
Punjab 97.03
Sindh 60.38
KP 67.90
Balochistan 36.15
Source: NEPRA (2012).
NEPRA approves different tariff schedules for different categories of consumers:
residential, commercial, industrial and agricultural. Additionally, there are consumers
who buy power in bulk for further distribution. Each category is also distinguished by its
load requirement and offered separate rates. Rates also vary by time of use (peak and off-
peak).
The tariffs determined by NEPRA are reference tariffs and subject to monthly and
quarterly adjustments, which allow for variations in actual PPP costs from those
projected at the time of tariff setting. Variations in fuel cost are reflected in monthly
Interprovincial Differences in Power Sector Subsidies and Implications for the NFC Award 425
adjustments and a number of other PPP-related costs are reflected in quarterly
adjustments. These adjustments are then passed-on and reflected in consumers’ monthly
bills.5
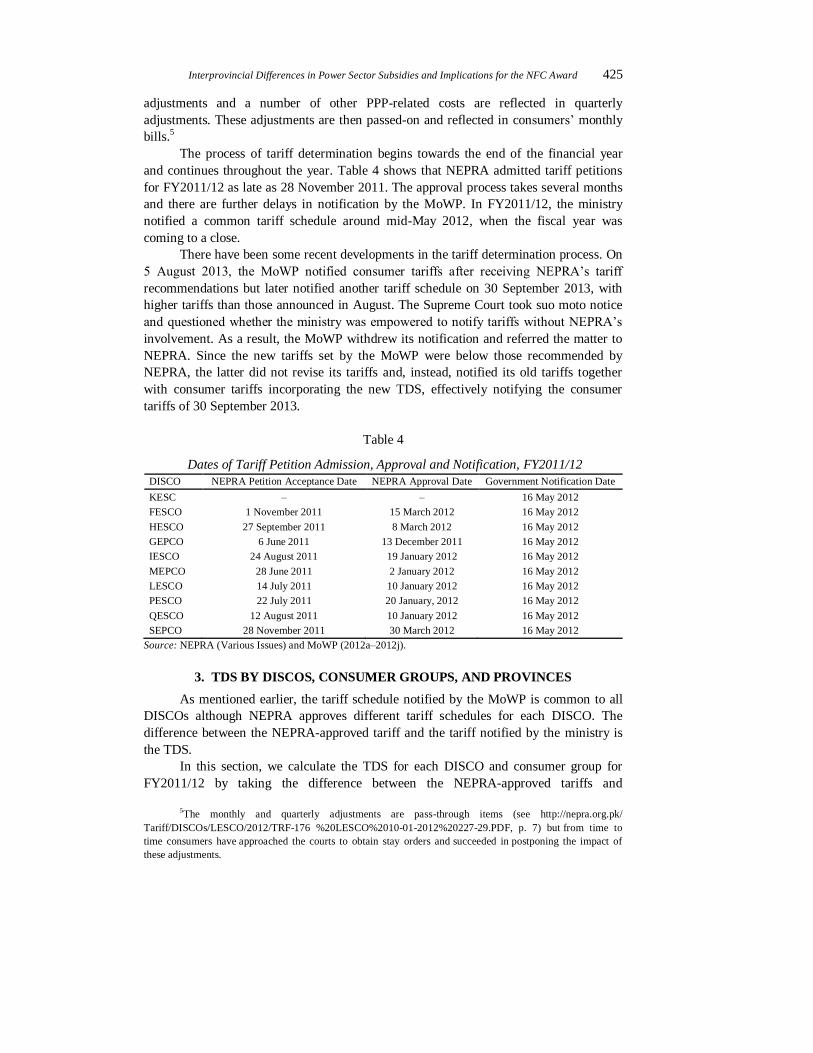
The process of tariff determination begins towards the end of the financial year
and continues throughout the year. Table 4 shows that NEPRA admitted tariff petitions
for FY2011/12 as late as 28 November 2011. The approval process takes several months
and there are further delays in notification by the MoWP. In FY2011/12, the ministry
notified a common tariff schedule around mid-May 2012, when the fiscal year was
coming to a close.
There have been some recent developments in the tariff determination process. On
5 August 2013, the MoWP notified consumer tariffs after receiving NEPRA’s tariff
recommendations but later notified another tariff schedule on 30 September 2013, with
higher tariffs than those announced in August. The Supreme Court took suo moto notice
and questioned whether the ministry was empowered to notify tariffs without NEPRA’s
involvement. As a result, the MoWP withdrew its notification and referred the matter to
NEPRA. Since the new tariffs set by the MoWP were below those recommended by
NEPRA, the latter did not revise its tariffs and, instead, notified its old tariffs together
with consumer tariffs incorporating the new TDS, effectively notifying the consumer
tariffs of 30 September 2013.
Table 4
Dates of Tariff Petition Admission, Approval and Notification, FY2011/12
DISCO NEPRA Petition Acceptance Date NEPRA Approval Date Government Notification Date
KESC – – 16 May 2012
FESCO 1 November 2011 15 March 2012 16 May 2012
HESCO 27 September 2011 8 March 2012 16 May 2012
GEPCO 6 June 2011 13 December 2011 16 May 2012
IESCO 24 August 2011 19 January 2012 16 May 2012
MEPCO 28 June 2011 2 January 2012 16 May 2012
LESCO 14 July 2011 10 January 2012 16 May 2012
PESCO 22 July 2011 20 January, 2012 16 May 2012
QESCO 12 August 2011 10 January 2012 16 May 2012
SEPCO 28 November 2011 30 March 2012 16 May 2012
Source: NEPRA (Various Issues) and MoWP (2012a–2012j).
3. TDS BY DISCOS, CONSUMER GROUPS, AND PROVINCES
As mentioned earlier, the tariff schedule notified by the MoWP is common to all
DISCOs although NEPRA approves different tariff schedules for each DISCO. The
difference between the NEPRA-approved tariff and the tariff notified by the ministry is
the TDS.
In this section, we calculate the TDS for each DISCO and consumer group for
FY2011/12 by taking the difference between the NEPRA-approved tariffs and
5The monthly and quarterly adjustments are pass-through items (see http://nepra.org.pk/
Tariff/DISCOs/LESCO/2012/TRF-176 %20LESCO%2010-01-2012%20227-29.PDF, p. 7) but from time to
time consumers have approached the courts to obtain stay orders and succeeded in postponing the impact of
these adjustments.
426 Fatima and Nasim
corresponding tariffs notified by the MoWP for FY2011/12 and multiplying the
difference by the sales mix projected by NEPRA. Since the MoWP notifies tariffs
towards the end of the financial year (see Table 4), which then remain effective for most
or all of the following financial year, this method involves calculating the TDS as the
difference between the NEPRA-approved tariff for a particular financial year and the
tariff charged by a DISCO the following year. The subsidy so calculated has budgetary
implications for FY2012/13 but we refer to this as TDS for 2011/12.
NEPRA (2012) provides data on the Karachi Electric Supply Company’s
(KESC’s)6 consumer mix for broad categories of consumer groups, but unlike for other
DISCOs, the breakdown of the consumption mix within each consumer group is not
available. We approximate this consumption mix for the KESC by assuming that the
distribution within each consumer group (e.g. industrial consumers) is the same as that of
LESCO.7
3.1. TDS Received by DISCOs
The TDS for each DISCO in FY2011/12 is calculated in three steps: (i) the TDS
per unit for each consumer category is calculated as the difference between the NEPRA-
approved tariff and the government-notified tariff,8 (ii) the difference in the tariffs is
multiplied by the sales mix projected by NEPRA for FY2011/12 to obtain the TDS for
each consumer category, and (iii) the TDS for each consumer category is then aggregated
over all consumer categories.
Residential consumers face electricity tariff slabs that increase with rising
consumption. Since FY2010/11, NEPRA has recommended giving the benefit of lower
tariffs to domestic consumers for only one previous slab, but the government has allowed
them the benefit of lower tariffs on all previous consumption.9 This could have an impact
on TDS calculations for residential consumers because the sales mix projected by
NEPRA (which assumes the benefit of one previous slab) will be different from projected
sales if the benefit of all previous lower slabs is allowed.10 In order to address this issue,
we refer to the sales mix ratios for 2009/10, when there was no difference between the
two assessments. Using these sales mix ratios and the projected total sales to residential
6In January, 2014 the KESC was renamed as K-Electric.
7If, within LESCO, industrial consumption under the B-1(a) tariff was 5.73 percent in FY2011/12, then
we assume that, of the KESC’s total industrial consumption of 3,342 GWh in FY2011/12, the B -1(a) tariff
applies to 5.73 percent of its total industrial consumption. 8We have taken the NEPRA-approved tariff to be its reference tariff. Monthly and quarterly revisions are
passed through to consumers and therefore ignored in our TDS calculations [Pakistan (2013), p. 13]. See also
http://nepra.org.pk/Tariff/DISCOs/LESCO/2012/TRF-176%20LESCO%2010-01-2012%20227-29.PDF, p. 7. 9Thus, for domestic consumers who consume 800 units of electricity and fall in the tariff slab of 700+
units, NEPRA recommends that, for the first 700 units, they be charged the tariff applicable to consumers in the
301–700 unit slab; for the remaining 100 units, they are charged the tariff applicable to consumers in the 700+
unit slab. The government, on the other hand, has allowed progressively higher rates to be charged for
consumption units that fall in the 0–100, 101–300, 301–700 and 700+ slabs, respectively. 10
If NEPRA recommends that the benefit of one previous tariff slab be passed onto domestic
consumers, then a consumer projected to consume 800 units (see footnote 8) would correspond to a consumer
mix of 700 units in the 301–700 slab and 100 units in the 700+ slab. If government policy were followed, then
the consumer mix would be 100 units in the 0–100 slab, 200 units in the 101–300 slab, 400 units in the 301–700
slab and 100 units in the 700+ slab. NEPRA’s projected consumer sales mix for each DISCO is known but that
of the government is not.
Interprovincial Differences in Power Sector Subsidies and Implications for the NFC Award 427
consumers in 2011/12, we calculate the TDS for residential consumers. This substitution
of the 2009/10 sales mix for 2011/12 is necessary only for residential consumers and not
other consumer categories. The decision to give the benefit of only one previous slab was
made by NEPRA in 2010/11.11
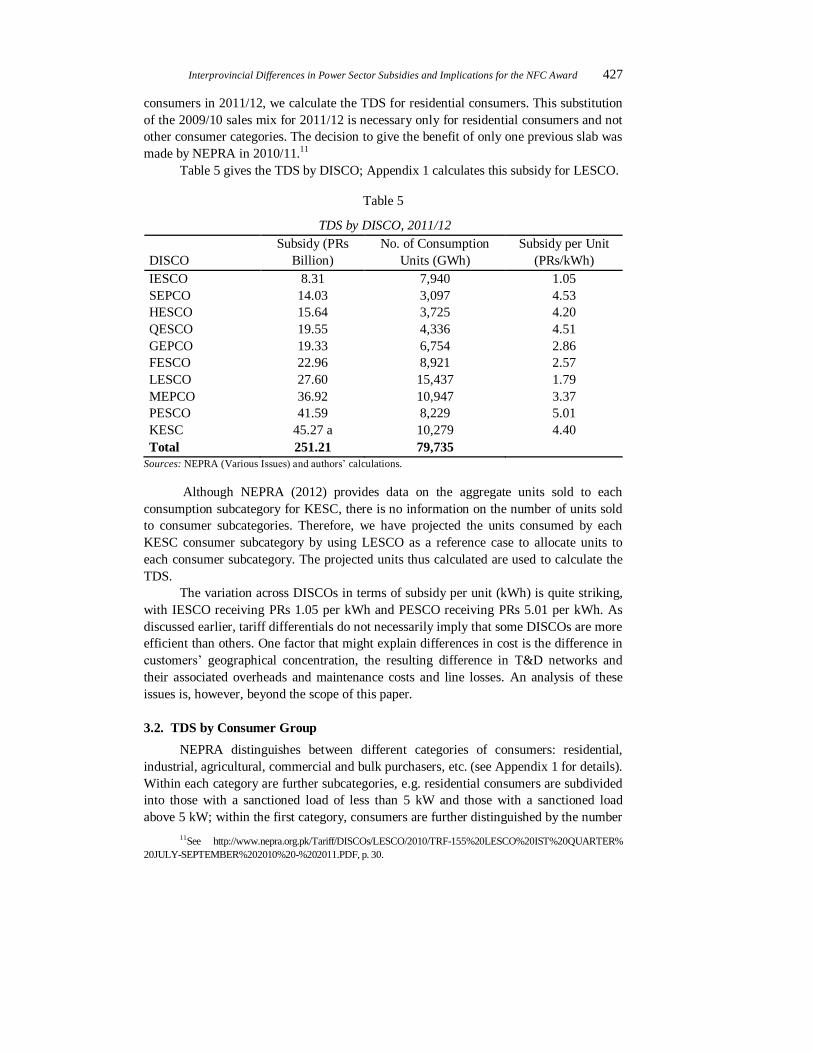
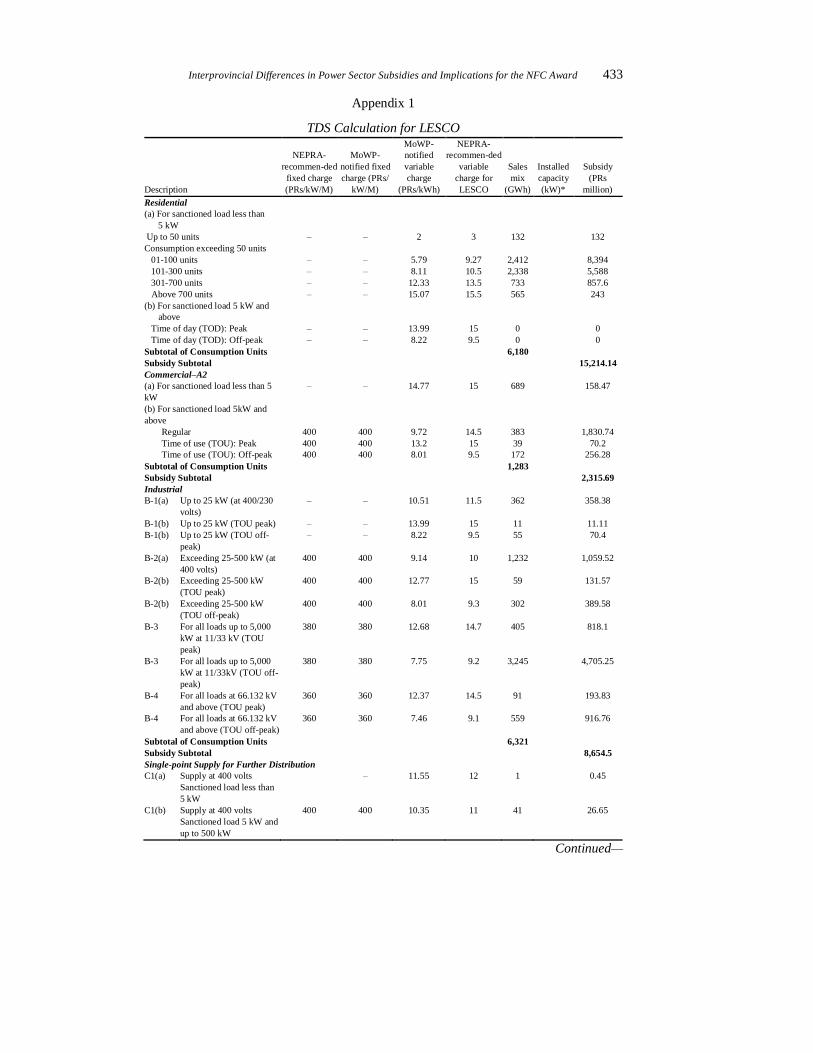
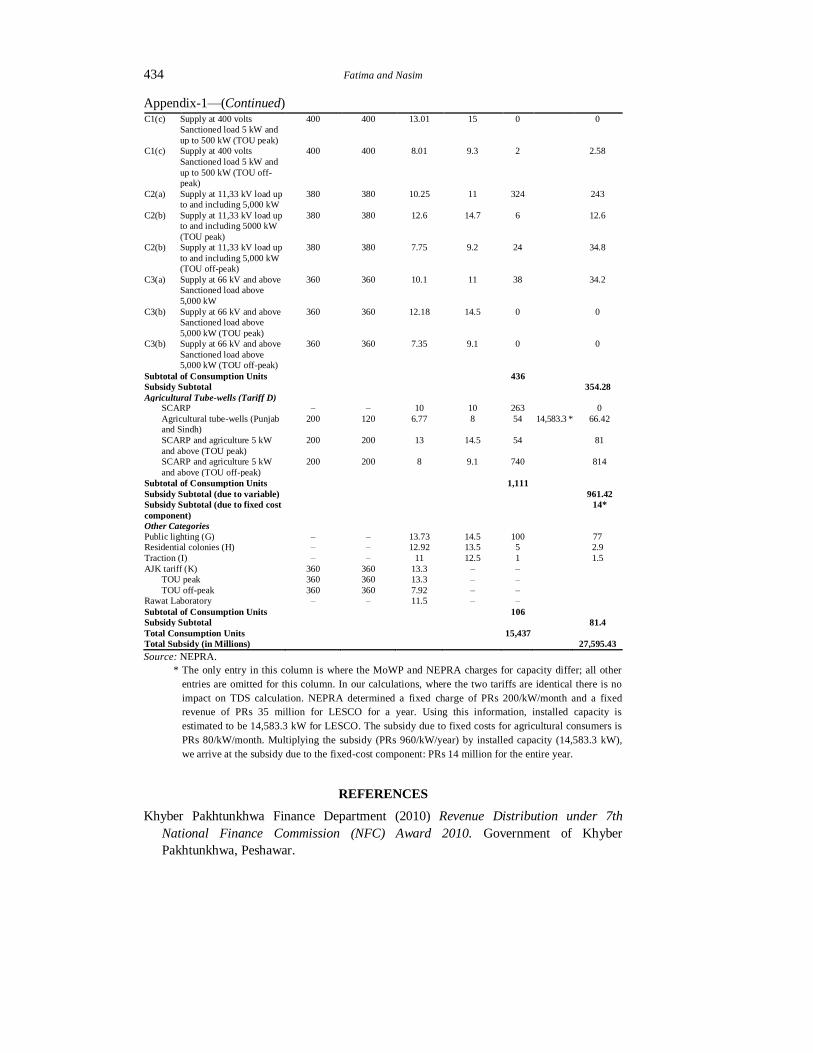
Table 5 gives the TDS by DISCO; Appendix 1 calculates this subsidy for LESCO.
Table 5
TDS by DISCO, 2011/12
DISCO
Subsidy (PRs
Billion)
No. of Consumption
Units (GWh)
Subsidy per Unit
(PRs/kWh)
IESCO 8.31 7,940 1.05
SEPCO 14.03 3,097 4.53
HESCO 15.64 3,725 4.20
QESCO 19.55 4,336 4.51
GEPCO 19.33 6,754 2.86
FESCO 22.96 8,921 2.57
LESCO 27.60 15,437 1.79
MEPCO 36.92 10,947 3.37
PESCO 41.59 8,229 5.01
KESC 45.27 a 10,279 4.40
Total 251.21 79,735
Sources: NEPRA (Various Issues) and authors’ calculations.
Although NEPRA (2012) provides data on the aggregate units sold to each
consumption subcategory for KESC, there is no information on the number of units sold
to consumer subcategories. Therefore, we have projected the units consumed by each
KESC consumer subcategory by using LESCO as a reference case to allocate units to
each consumer subcategory. The projected units thus calculated are used to calculate the
TDS.
The variation across DISCOs in terms of subsidy per unit (kWh) is quite striking,
with IESCO receiving PRs 1.05 per kWh and PESCO receiving PRs 5.01 per kWh. As
discussed earlier, tariff differentials do not necessarily imply that some DISCOs are more
efficient than others. One factor that might explain differences in cost is the difference in
customers’ geographical concentration, the resulting difference in T&D networks and
their associated overheads and maintenance costs and line losses. An analysis of these
issues is, however, beyond the scope of this paper.
3.2. TDS by Consumer Group
NEPRA distinguishes between different categories of consumers: residential,
industrial, agricultural, commercial and bulk purchasers, etc. (see Appendix 1 for details).
Within each category are further subcategories, e.g. residential consumers are subdivided
into those with a sanctioned load of less than 5 kW and those with a sanctioned load
above 5 kW; within the first category, consumers are further distinguished by the number
11See http://www.nepra.org.pk/Tariff/DISCOs/LESCO/2010/TRF-155%20LESCO%20IST%20QUARTER%
20JULY-SEPTEMBER%202010%20-%202011.PDF, p. 30.
428 Fatima and Nasim
of units consumed (up to 50 units, 1–100, 101–300, 301–700 and 700+). For each
subcategory, there is a NEPRA-approved tariff and an MoWP-notified tariff. Aggregating
the TDS for all subcategories within a consumer group and across all DISCOs gives the
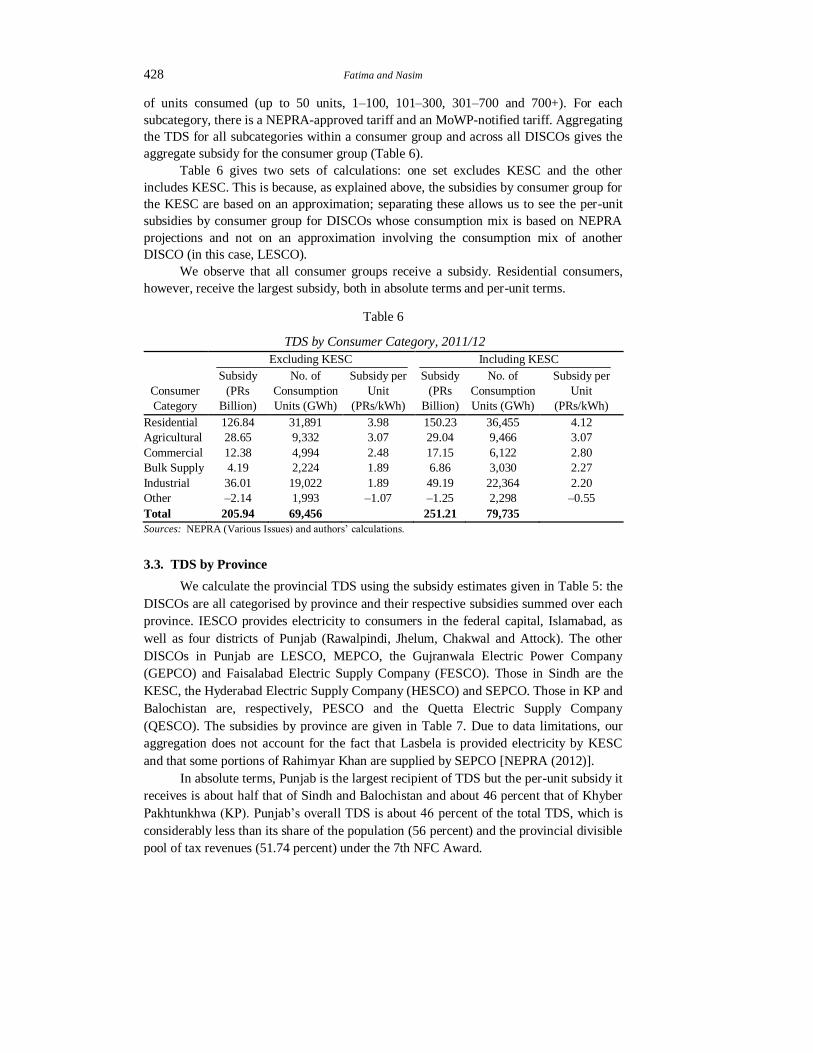
aggregate subsidy for the consumer group (Table 6).
Table 6 gives two sets of calculations: one set excludes KESC and the other
includes KESC. This is because, as explained above, the subsidies by consumer group for
the KESC are based on an approximation; separating these allows us to see the per-unit
subsidies by consumer group for DISCOs whose consumption mix is based on NEPRA
projections and not on an approximation involving the consumption mix of another
DISCO (in this case, LESCO).
We observe that all consumer groups receive a subsidy. Residential consumers,
however, receive the largest subsidy, both in absolute terms and per-unit terms.
Table 6
TDS by Consumer Category, 2011/12
Consumer
Category
Excluding KESC Including KESC
Subsidy
(PRs
Billion)
No. of
Consumption
Units (GWh)
Subsidy per
Unit
(PRs/kWh)
Subsidy
(PRs
Billion)
No. of
Consumption
Units (GWh)
Subsidy per
Unit
(PRs/kWh)
Residential 126.84 31,891 3.98 150.23 36,455 4.12
Agricultural 28.65 9,332 3.07 29.04 9,466 3.07
Commercial 12.38 4,994 2.48 17.15 6,122 2.80
Bulk Supply 4.19 2,224 1.89 6.86 3,030 2.27
Industrial 36.01 19,022 1.89 49.19 22,364 2.20
Other –2.14 1,993 –1.07 –1.25 2,298 –0.55
Total 205.94 69,456 251.21 79,735
Sources: NEPRA (Various Issues) and authors’ calculations.
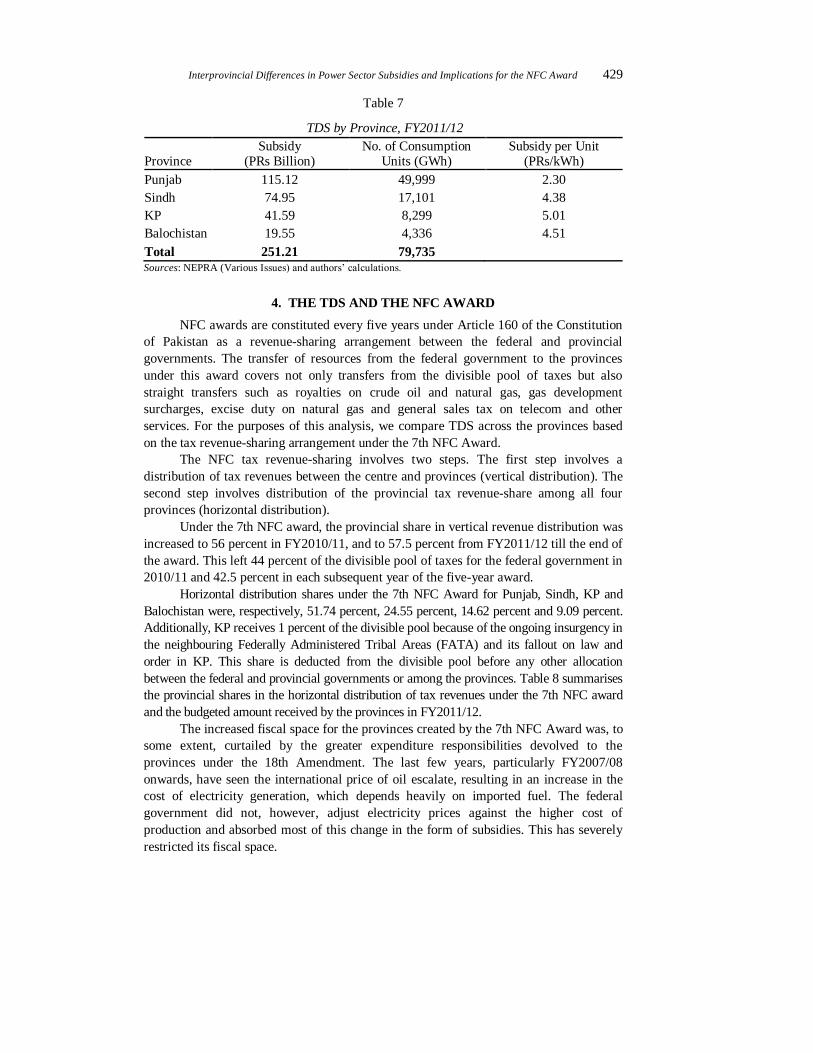
3.3. TDS by Province
We calculate the provincial TDS using the subsidy estimates given in Table 5: the
DISCOs are all categorised by province and their respective subsidies summed over each
province. IESCO provides electricity to consumers in the federal capital, Islamabad, as
well as four districts of Punjab (Rawalpindi, Jhelum, Chakwal and Attock). The other
DISCOs in Punjab are LESCO, MEPCO, the Gujranwala Electric Power Company
(GEPCO) and Faisalabad Electric Supply Company (FESCO). Those in Sindh are the
KESC, the Hyderabad Electric Supply Company (HESCO) and SEPCO. Those in KP and
Balochistan are, respectively, PESCO and the Quetta Electric Supply Company
(QESCO). The subsidies by province are given in Table 7. Due to data limitations, our
aggregation does not account for the fact that Lasbela is provided electricity by KESC
and that some portions of Rahimyar Khan are supplied by SEPCO [NEPRA (2012)].
In absolute terms, Punjab is the largest recipient of TDS but the per-unit subsidy it
receives is about half that of Sindh and Balochistan and about 46 percent that of Khyber
Pakhtunkhwa (KP). Punjab’s overall TDS is about 46 percent of the total TDS, which is
considerably less than its share of the population (56 percent) and the provincial divisible
pool of tax revenues (51.74 percent) under the 7th NFC Award.
Interprovincial Differences in Power Sector Subsidies and Implications for the NFC Award 429
Table 7
TDS by Province, FY2011/12
Province Subsidy
(PRs Billion) No. of Consumption
Units (GWh) Subsidy per Unit
(PRs/kWh)
Punjab 115.12 49,999 2.30
Sindh 74.95 17,101 4.38
KP 41.59 8,299 5.01
Balochistan 19.55 4,336 4.51
Total 251.21 79,735
Sources: NEPRA (Various Issues) and authors’ calculations.
4. THE TDS AND THE NFC AWARD
NFC awards are constituted every five years under Article 160 of the Constitution
of Pakistan as a revenue-sharing arrangement between the federal and provincial
governments. The transfer of resources from the federal government to the provinces
under this award covers not only transfers from the divisible pool of taxes but also
straight transfers such as royalties on crude oil and natural gas, gas development
surcharges, excise duty on natural gas and general sales tax on telecom and other
services. For the purposes of this analysis, we compare TDS across the provinces based
on the tax revenue-sharing arrangement under the 7th NFC Award.
The NFC tax revenue-sharing involves two steps. The first step involves a
distribution of tax revenues between the centre and provinces (vertical distribution). The
second step involves distribution of the provincial tax revenue-share among all four
provinces (horizontal distribution).
Under the 7th NFC award, the provincial share in vertical revenue distribution was
increased to 56 percent in FY2010/11, and to 57.5 percent from FY2011/12 till the end of
the award. This left 44 percent of the divisible pool of taxes for the federal government in
2010/11 and 42.5 percent in each subsequent year of the five-year award.
Horizontal distribution shares under the 7th NFC Award for Punjab, Sindh, KP and
Balochistan were, respectively, 51.74 percent, 24.55 percent, 14.62 percent and 9.09 percent.
Additionally, KP receives 1 percent of the divisible pool because of the ongoing insurgency in
the neighbouring Federally Administered Tribal Areas (FATA) and its fallout on law and
order in KP. This share is deducted from the divisible pool before any other allocation
between the federal and provincial governments or among the provinces. Table 8 summarises
the provincial shares in the horizontal distribution of tax revenues under the 7th NFC award
and the budgeted amount received by the provinces in FY2011/12.
The increased fiscal space for the provinces created by the 7th NFC Award was, to
some extent, curtailed by the greater expenditure responsibilities devolved to the
provinces under the 18th Amendment. The last few years, particularly FY2007/08
onwards, have seen the international price of oil escalate, resulting in an increase in the
cost of electricity generation, which depends heavily on imported fuel. The federal
government did not, however, adjust electricity prices against the higher cost of
production and absorbed most of this change in the form of subsidies. This has severely
restricted its fiscal space.
430 Fatima and Nasim
Table 8
Horizontal Distribution of Divisible Pool of Tax Revenues
Province Share (%) Amount (PRs Billion) in 2011/12
Punjab 51.74 530.81
Sindh 24.55 251.86
KP 14.62 149.99*
Balochistan 9.09 93.26
Total 100.00 1025.91
Source: Government of Khyber Pakhtunkhwa (2010).
* Does not include 1 percent transferred to KP on account of the war on terror.
As we have noted, one of the objectives of the electricity subsidy is to equalise
electricity tariffs by consumer group across all regions of the country, but as our
calculations show, this has resulted in unequal tariff subsidies across the provinces.
The provinces’ TDS shares can be compared with their share of tax revenue in the
horizontal distribution of tax revenues under the 7th NFC award. The award is an
agreement on how major tax revenues should be distributed between the federating units
and the centre. The spirit of this agreement would be violated if the centre were to use its
own share of tax revenues for province-specific expenditures in a manner that departs
consistently (year after year) from the revenue-sharing arrangement under the award.
Although the federal government would be justified in departing from the NFC allocation if
a province were to suffer a temporary shock (such as floods or drought), escalating oil
prices and the consequent rise in electricity generation costs cannot be treated as a
temporary shock. The NFC award is, therefore, a useful yardstick to judge if the federal
government has judiciously allocated its tariff subsidies across the provinces.
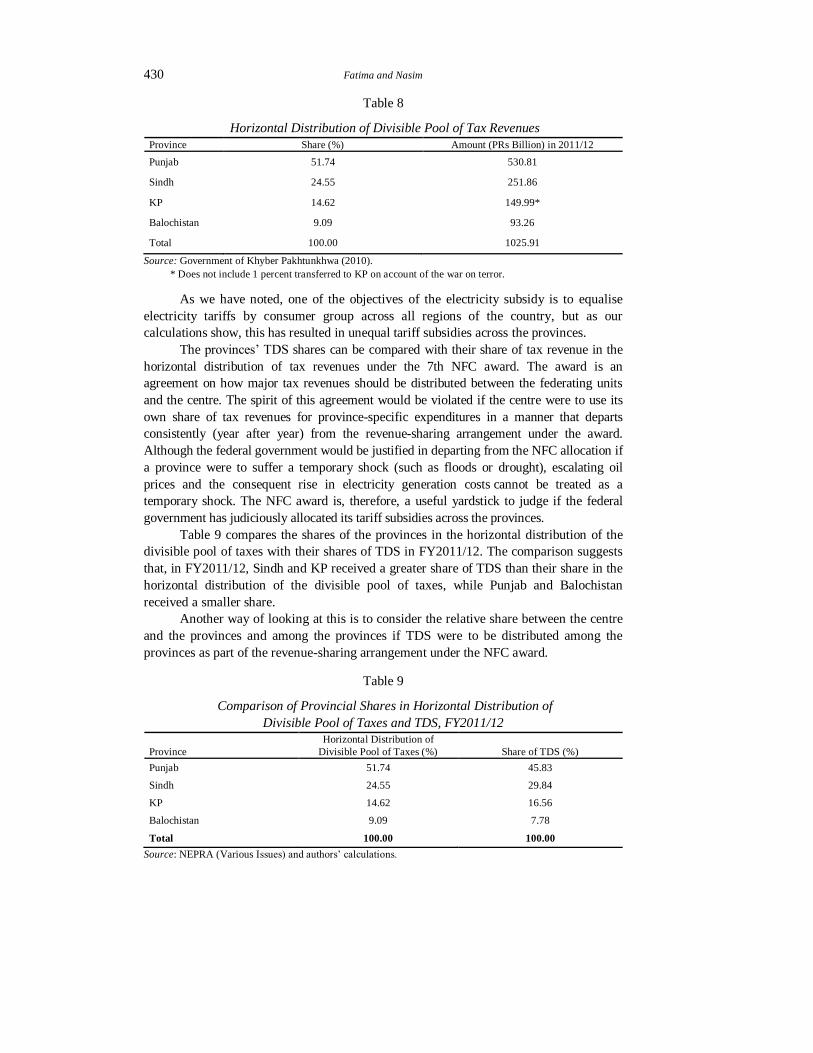
Table 9 compares the shares of the provinces in the horizontal distribution of the
divisible pool of taxes with their shares of TDS in FY2011/12. The comparison suggests
that, in FY2011/12, Sindh and KP received a greater share of TDS than their share in the
horizontal distribution of the divisible pool of taxes, while Punjab and Balochistan
received a smaller share.
Another way of looking at this is to consider the relative share between the centre
and the provinces and among the provinces if TDS were to be distributed among the
provinces as part of the revenue-sharing arrangement under the NFC award.
Table 9
Comparison of Provincial Shares in Horizontal Distribution of
Divisible Pool of Taxes and TDS, FY2011/12
Province
Horizontal Distribution of
Divisible Pool of Taxes (%) Share of TDS (%)
Punjab 51.74 45.83
Sindh 24.55 29.84
KP 14.62 16.56
Balochistan 9.09 7.78
Total 100.00 100.00
Source: NEPRA (Various Issues) and authors’ calculations.
Interprovincial Differences in Power Sector Subsidies and Implications for the NFC Award 431
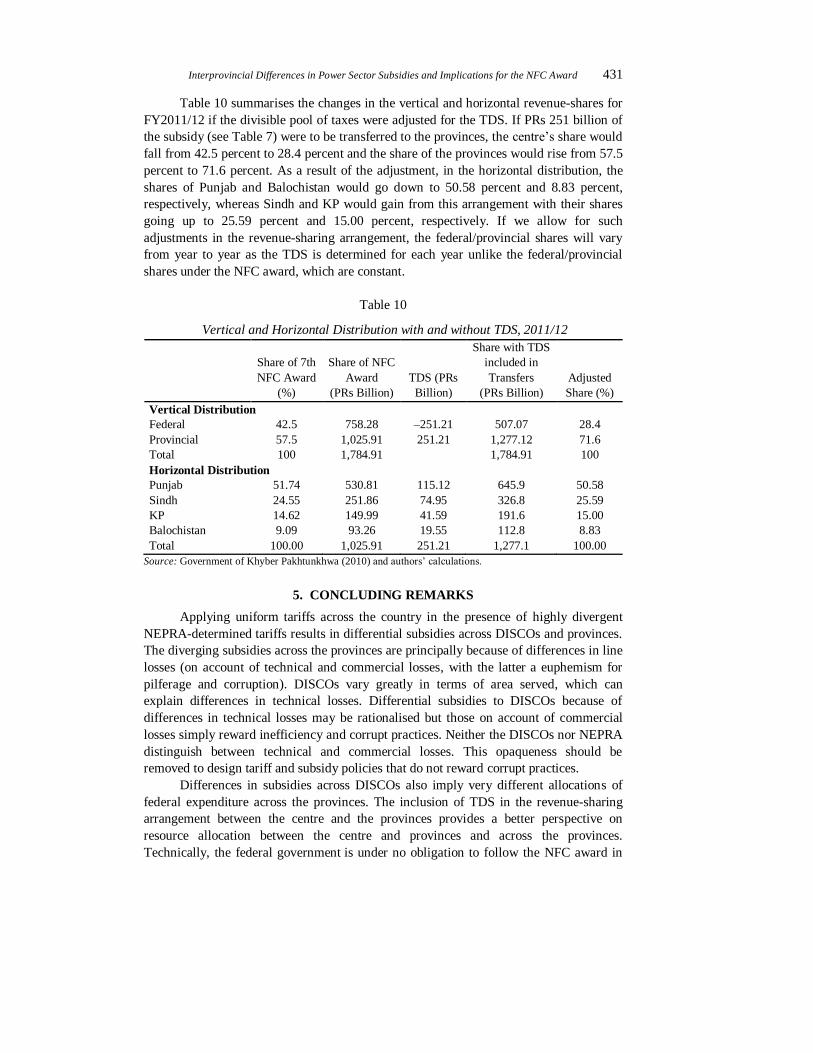
Table 10 summarises the changes in the vertical and horizontal revenue-shares for
FY2011/12 if the divisible pool of taxes were adjusted for the TDS. If PRs 251 billion of
the subsidy (see Table 7) were to be transferred to the provinces, the centre’s share would
fall from 42.5 percent to 28.4 percent and the share of the provinces would rise from 57.5
percent to 71.6 percent. As a result of the adjustment, in the horizontal distribution, the
shares of Punjab and Balochistan would go down to 50.58 percent and 8.83 percent,
respectively, whereas Sindh and KP would gain from this arrangement with their shares
going up to 25.59 percent and 15.00 percent, respectively. If we allow for such
adjustments in the revenue-sharing arrangement, the federal/provincial shares will vary
from year to year as the TDS is determined for each year unlike the federal/provincial
shares under the NFC award, which are constant.
Table 10
Vertical and Horizontal Distribution with and without TDS, 2011/12
Share of 7th
NFC Award
(%)
Share of NFC
Award
(PRs Billion)
TDS (PRs
Billion)
Share with TDS
included in
Transfers
(PRs Billion)
Adjusted
Share (%)
Vertical Distribution
Federal 42.5 758.28 –251.21 507.07 28.4
Provincial 57.5 1,025.91 251.21 1,277.12 71.6
Total 100 1,784.91 1,784.91 100
Horizontal Distribution
Punjab 51.74 530.81 115.12 645.9 50.58
Sindh 24.55 251.86 74.95 326.8 25.59
KP 14.62 149.99 41.59 191.6 15.00
Balochistan 9.09 93.26 19.55 112.8 8.83
Total 100.00 1,025.91 251.21 1,277.1 100.00
Source: Government of Khyber Pakhtunkhwa (2010) and authors’ calculations.
5. CONCLUDING REMARKS
Applying uniform tariffs across the country in the presence of highly divergent
NEPRA-determined tariffs results in differential subsidies across DISCOs and provinces.
The diverging subsidies across the provinces are principally because of differences in line
losses (on account of technical and commercial losses, with the latter a euphemism for
pilferage and corruption). DISCOs vary greatly in terms of area served, which can
explain differences in technical losses. Differential subsidies to DISCOs because of
differences in technical losses may be rationalised but those on account of commercial
losses simply reward inefficiency and corrupt practices. Neither the DISCOs nor NEPRA
distinguish between technical and commercial losses. This opaqueness should be
removed to design tariff and subsidy policies that do not reward corrupt practices.
Differences in subsidies across DISCOs also imply very different allocations of
federal expenditure across the provinces. The inclusion of TDS in the revenue-sharing
arrangement between the centre and the provinces provides a better perspective on
resource allocation between the centre and provinces and across the provinces.
Technically, the federal government is under no obligation to follow the NFC award in
432 Fatima and Nasim
allocating its expenditures, but in a federal structure, there should be some guiding
principles that constrain the federal government’s arbitrariness. In this paper, we have
calculated TDS by consumer group, DISCO and province and used the NFC award as a
yardstick to determine whether tariff subsidies by the federal government depart from the
NFC principle. We find that they do.
Unless there is a clearly stated principle that carries a broad consensus and allows
departures from the NFC award, federal expenditures that are province-specific should be
judged against the benchmark of the award. Our analysis can be generalised to include
not just the TDS but also other federal expenditures that might be similarly allocated to
particular provinces. This would include, for example, subsidies provided to DISCOs for
their losses.
There are other forms of resource transfers that are not fully reflected in the NFC
award. Implicit subsidies on CNG and natural gas are also distributed differentially
across the provinces. A comprehensive view of such subsidies should be reflected in the
next NFC award in addition to incorporating a mechanism that governs federal/provincial
sharing of expenditure shocks and subsidies that do not place an unsustainable fiscal
burden on the centre or the provinces.
Interprovincial Differences in Power Sector Subsidies and Implications for the NFC Award 433
Appendix 1
TDS Calculation for LESCO
Description
NEPRA-
recommen-ded
fixed charge
(PRs/kW/M)
MoWP-
notified fixed
charge (PRs/
kW/M)
MoWP-
notified
variable
charge
(PRs/kWh)
NEPRA-
recommen-ded
variable
charge for
LESCO
Sales
mix
(GWh)
Installed
capacity
(kW)*
Subsidy
(PRs
million)
Residential
(a) For sanctioned load less than
5 kW
Up to 50 units – – 2 3 132 132
Consumption exceeding 50 units
01-100 units – – 5.79 9.27 2,412 8,394
101-300 units – – 8.11 10.5 2,338 5,588
301-700 units – – 12.33 13.5 733 857.6
Above 700 units – – 15.07 15.5 565 243
(b) For sanctioned load 5 kW and
above
Time of day (TOD): Peak – – 13.99 15 0 0
Time of day (TOD): Off-peak – – 8.22 9.5 0 0
Subtotal of Consumption Units 6,180
Subsidy Subtotal 15,214.14
Commercial–A2
(a) For sanctioned load less than 5
kW
– – 14.77 15 689 158.47
(b) For sanctioned load 5kW and
above
Regular 400 400 9.72 14.5 383 1,830.74
Time of use (TOU): Peak 400 400 13.2 15 39 70.2
Time of use (TOU): Off-peak 400 400 8.01 9.5 172 256.28
Subtotal of Consumption Units 1,283
Subsidy Subtotal 2,315.69
Industrial
B-1(a) Up to 25 kW (at 400/230
volts)
– – 10.51 11.5 362 358.38
B-1(b) Up to 25 kW (TOU peak) – – 13.99 15 11 11.11
B-1(b) Up to 25 kW (TOU off-
peak)
– – 8.22 9.5 55 70.4
B-2(a) Exceeding 25-500 kW (at
400 volts)
400 400 9.14 10 1,232 1,059.52
B-2(b) Exceeding 25-500 kW
(TOU peak)
400 400 12.77 15 59 131.57
B-2(b) Exceeding 25-500 kW
(TOU off-peak)
400 400 8.01 9.3 302 389.58
B-3 For all loads up to 5,000
kW at 11/33 kV (TOU
peak)
380 380 12.68 14.7 405 818.1
B-3 For all loads up to 5,000
kW at 11/33kV (TOU off-
peak)
380 380 7.75 9.2 3,245 4,705.25
B-4 For all loads at 66.132 kV
and above (TOU peak)
360 360 12.37 14.5 91 193.83
B-4 For all loads at 66.132 kV
and above (TOU off-peak)
360 360 7.46 9.1 559 916.76
Subtotal of Consumption Units 6,321
Subsidy Subtotal 8,654.5
Single-point Supply for Further Distribution
C1(a) Supply at 400 volts
Sanctioned load less than
5 kW
– 11.55 12 1 0.45
C1(b) Supply at 400 volts
Sanctioned load 5 kW and
up to 500 kW
400 400 10.35 11 41 26.65
Continued—
434 Fatima and Nasim
Appendix-1—(Continued) C1(c) Supply at 400 volts
Sanctioned load 5 kW and
up to 500 kW (TOU peak)
400 400 13.01 15 0 0
C1(c) Supply at 400 volts
Sanctioned load 5 kW and
up to 500 kW (TOU off-
peak)
400 400 8.01 9.3 2 2.58
C2(a) Supply at 11,33 kV load up
to and including 5,000 kW
380 380 10.25 11 324 243
C2(b) Supply at 11,33 kV load up
to and including 5000 kW
(TOU peak)
380 380 12.6 14.7 6 12.6
C2(b) Supply at 11,33 kV load up
to and including 5,000 kW
(TOU off-peak)
380 380 7.75 9.2 24 34.8
C3(a) Supply at 66 kV and above
Sanctioned load above
5,000 kW
360 360 10.1 11 38 34.2
C3(b) Supply at 66 kV and above
Sanctioned load above
5,000 kW (TOU peak)
360 360 12.18 14.5 0 0
C3(b) Supply at 66 kV and above
Sanctioned load above
5,000 kW (TOU off-peak)
360 360 7.35 9.1 0 0
Subtotal of Consumption Units 436
Subsidy Subtotal 354.28
Agricultural Tube-wells (Tariff D) SCARP – – 10 10 263 0
Agricultural tube-wells (Punjab
and Sindh)
200 120 6.77 8 54 14,583.3 * 66.42
SCARP and agriculture 5 kW
and above (TOU peak)
200 200 13 14.5 54 81
SCARP and agriculture 5 kW
and above (TOU off-peak)
200 200 8 9.1 740 814
Subtotal of Consumption Units 1,111
Subsidy Subtotal (due to variable) 961.42
Subsidy Subtotal (due to fixed cost
component)
14*
Other Categories
Public lighting (G) – – 13.73 14.5 100 77
Residential colonies (H) – – 12.92 13.5 5 2.9
Traction (I) – – 11 12.5 1 1.5
AJK tariff (K) 360 360 13.3 – –
TOU peak 360 360 13.3 – –
TOU off-peak 360 360 7.92 – –
Rawat Laboratory – – 11.5 – –
Subtotal of Consumption Units 106
Subsidy Subtotal 81.4
Total Consumption Units 15,437
Total Subsidy (in Millions) 27,595.43
Source: NEPRA.
* The only entry in this column is where the MoWP and NEPRA charges for capacity differ; all other
entries are omitted for this column. In our calculations, where the two tariffs are identical there is no
impact on TDS calculation. NEPRA determined a fixed charge of PRs 200/kW/month and a fixed
revenue of PRs 35 million for LESCO for a year. Using this information, installed capacity is
estimated to be 14,583.3 kW for LESCO. The subsidy due to fixed costs for agricultural consumers is
PRs 80/kW/month. Multiplying the subsidy (PRs 960/kW/year) by installed capacity (14,583.3 kW),
we arrive at the subsidy due to the fixed-cost component: PRs 14 million for the entire year.
REFERENCES
Khyber Pakhtunkhwa Finance Department (2010) Revenue Distribution under 7th
National Finance Commission (NFC) Award 2010. Government of Khyber
Pakhtunkhwa, Peshawar.
Interprovincial Differences in Power Sector Subsidies and Implications for the NFC Award 435
Ministry of Water and Power (2012a) SRO 505 (I)/2012 Schedule-II of Tariff for FESCO.
Government of Pakistan, Islamabad.
Ministry of Water and Power (2012b) SRO 508 (I)/2012 Schedule-II of tariff for GEPCO.
Government of Pakistan, Islamabad.
Ministry of Water and Power (2012c) SRO 504 (I)/2012 Schedule-II of tariff for HESCO.
Government of Pakistan, Islamabad.
Ministry of Water and Power (2012d) SRO 506 (I)/2012 Schedule-II of tariff for IESCO.
Government of Pakistan, Islamabad.
Ministry of Water and Power (2012e) SRO 507 (I)/2012 Schedule-II of tariff for LESCO.
Government of Pakistan, Islamabad.
Ministry of Water and Power (2012f) SRO 509 (I)/2012 Schedule-II of tariff for MEPCO.
Government of Pakistan, Islamabad.
Ministry of Water and Power (2012g) SRO 510 (I)/2012 Schedule-II of tariff for PESCO.
Government of Pakistan, Islamabad.
Ministry of Water and Power (2012h)SRO 503 (I)/2012 Schedule-II of tariff for QESCO.
Government of Pakistan, Islamabad.
Ministry of Water and Power (2012i) SRO 512 (I)/2012 Schedule-II of tariff for SEPCO.
Government of Pakistan, Islamabad.
Ministry of Water and Power (2012j) SRO 502 (I)/2012 Schedule-I of tariff for KESCL.
Government of Pakistan, Islamabad.
National Electric Power Regulatory Authority (Various Issues) Determination of Tariff
for Multan Electric Power Company (MEPCO) Determined under NEPRA Tariff
(Standards and Procedure) Rules – 1998. National Electric Power Regulatory
Authority, Islamabad.
National Electric Power Regulatory Authority (Various Issues) Determination in the
Matter of Tariff Petition Filed by Quetta Electric Supply Company (QESCO) for the
Determination of the Consumer-End Tariff. National Electric Power Regulatory
Authority, Islamabad.
National Electric Power Regulatory Authority (Various Issues) Tariff Determination for
Hyderabad Electric Supply Company (HESCO) Determined under NEPRA Tariff
(Standards and Procedure) Rules – 1998. National Electric Power Regulatory
Authority, Islamabad.
National Electric Power Regulatory Authority (2012) State of Industry Report 2012.
National Electric Power Regulatory Authority, Islamabad.
National Electric Power Regulatory Authority (Various Issues) Tariff Determination for
Lahore Electric Supply Company (LESCO) Determined under NEPRA Tariff
(Standards and Procedure) Rules—1998. National Electric Power Regulatory
Authority, Islamabad.
National Electric Power Regulatory Authority (Various Issues) Tariff Determination for
Faisalabad Electric Supply Company (FESCO) Determined under NEPRA Tariff
(Standards and Procedure) Rules—1998. National Electric Power Regulatory
Authority, Islamabad.
National Electric Power Regulatory Authority (Various Issues) Tariff Determination for
Gujranwala Electric Supply Company (GEPCO) Determined under NEPRA Tariff
(Standards and Procedure) Rules—1998. National Electric Power Regulatory
Authority, Islamabad.
436 Fatima and Nasim
National Electric Power Regulatory Authority (Various Issues) Tariff Determination for
Islamabad Electric Supply Company (IESCO) Determined under NEPRA Tariff
(Standards and Procedure) Rules—1998. National Electric Power Regulatory
Authority, Islamabad.
National Electric Power Regulatory Authority (Various Issues) Tariff Determination for
Sukkur Electric Power Company (SEPCO) Determined under NEPRA Tariff
(Standards and Procedure) Rules—1998. National Electric Power Regulatory
Authority, Islamabad.
National Electric Power Regulatory Authority (Various Issues) Tariff Determination for
Peshawar Electric Supply Company (PESCO) Determined under NEPRA Tariff
(Standards and Procedure) Rules—1998. National Electric Power Regulatory
Authority, Islamabad.
Pakistan, Government of (2013) The Causes and Impacts of Power Sector Circular Debt
in Pakistan. March 2013, Planning Commission of Pakistan and USAID, Islamabad.
Population Welfare Department (Punjab) (2013) retrieved 3 November 2013,
<http://pwd.punjab.gov.pk/>.