Embed Size (px)
Citation preview
TRANS Committee
2007 Interprovincial Roadside Truck Survey
Summary of Results
National Capital Region
February 2011
2007 Interprovincial Roadside Truck Survey Results TRANS Committee
February 2011
TRANS Committee Members: City of Ottawa Ville de Gatineau Société de transport de l‟Outaouais Ministry of Transportation of Ontario Ministère des Transports du Québec National Capital Commission
2007 Interprovincial Roadside Truck Survey Results TRANS Committee
February 2011
Acknowledgements: The Interprovincial Roadside Truck Survey while funded by the TRANS Committee was carried out in 2007 by Earth Tech Canada Inc., under contract to the Ministry of Transportation of Ontario (MTO), for the administration of all the roadside surveys across the province as part of the National Roadside Truck Survey. Special thanks to Mr. Rob Tardif, Coordinator, MTO Commercial Vehicle Survey, who oversaw the survey work on behalf of the TRANS Committee, and to Mr. Doug Smith, Manager (in 2007), Data Management and Analysis office (MTO) for ongoing project support. The 2007 Interprovincial Roadside Truck Survey – Summary of Results report was prepared by the TRANS Committee. The Committee would like to acknowledge the invaluable assistance of Marc Tan – TRANS co-op student for data processing and Mr. Chris Halchuk – City of Ottawa for GIS support. Mr. Ahmad Subhani – City of Ottawa, Mr. Pierre Tremblay – Ministère des Transports du Québec (MTQ), Sundar Damodaran – MTO, Arto Keklikian – NCC, and Carmel Dufour (STO) provided direction and guidance in the production of this report.
2007 Interprovincial Roadside Truck Survey Results TRANS Committee
February 2011 i
Table of Contents
1. INTRODUCTION ................................................................................................................ 1
1.1 Purpose of Report ........................................................................................................ 1
1.2 Organization of Report ................................................................................................. 1
1.3 Glossary ...................................................................................................................... 1
2. ABOUT THE SURVEY ....................................................................................................... 3
2.1 Purpose of Survey ....................................................................................................... 3
2.2 Roadside Intercept Survey ........................................................................................... 4
2.3 Automatic Traffic Recorder (ATR) Counts .................................................................... 7
2.4 Classification and Occupancy (C&O) Counts ............................................................... 7
2.5 Data Processing .......................................................................................................... 8
3 KEY FINDINGS .................................................................................................................11
3.1 Truck Volumes by Types.............................................................................................11
3.2 Trip Time Distributions ................................................................................................11
3.3 Heavy Truck Share of Total Traffic ..............................................................................13
3.4 Travel Breakdown by Origin / Destination ...................................................................14
3.5 Travel Breakdown by TRANS Districts/Zones .............................................................17
3.6 Major Desired Lines ....................................................................................................21
3.7 Analysis of Distance Traveled .....................................................................................24
3.8 Truck Load Analysis ....................................................................................................25
2007 Interprovincial Roadside Truck Survey Results TRANS Committee
February 2011 ii
List of Figures Figure 2-1: National Roadside Survey Sites ............................................................................... 3 Figure 2-2: Sample Survey Site Layout ...................................................................................... 6 Figure 2-3: Study Truck Classifications ...................................................................................... 8 Figure 2-4: TRANS Traffic Zone System .................................................................................... 9 Figure 3-1: Daily Truck volumes by Classification .....................................................................11 Figure 3-2: Hourly trip variations by bridge by direction .............................................................13 Figure 3-3: Origin and Destination for 24-Hour Survey Period ...................................................15 Figure 3-4: Origin-Destination by Truck type .............................................................................15 Figure 3-5: Origin-Destination by Bridge ...................................................................................16 Figure 3-6: Origin-Destination by Time of Day ..........................................................................16 Figure 3-7: TRANS Districts ......................................................................................................18 Figure 3-8: TRANS External Zones ...........................................................................................18 Figure 3-9: Daily Origins by TRANS Districts and External Zones .............................................19 Figure 3-10: Daily Destinations by TRANS Districts and External Zones...................................20 Figure 3-11: Truck Major Desired Lines ..................................................................................22 Figure 3-12: Truck Major Desired Lines ....................................................................................23 Figure 3-13: Local Truck Trips Distance Distribution .................................................................24 Figure 3-14: Inter-regional and Through Truck Trips Distance Distribution ................................25 Figure 3-15: Truck Load by Bridge ............................................................................................25
List of Tables Table 2-1: Valid Data Completion by Survey Site ....................................................................... 8 Table 2-2: Survey Productivity by Site ........................................................................................ 9 Table 3-1: Peak to Off-peak variability by bridge .......................................................................12 Table 3-2: Truck Shares per Bridge per Time of Day ................................................................13 Table 3-3: Internal and External Truck Trips .............................................................................14
Appendix A: Origin-Destination Matrices
Appendix B: Heavy Truck Description
2007 Interprovincial Roadside Truck Survey Results TRANS Committee
February 2011 1
1. INTRODUCTION
1.1 Purpose of Report
This report summarizes the findings of the 2007 Interprovincial Roadside Truck Survey in the National Capital Region (NCR) – a truck travel „origin-destination‟ survey that was conducted in the summer of 2007. The survey was conducted for two of the five interprovincial crossings in the NCR – the Chaudière and MacDonald-Cartier bridge, as the movement of “heavy trucks” is prohibited on the remaining three bridges – the Alexandra, Portage and Champlain bridges. The roadside intercept data collection method was used to gather the information. The findings are presented in tabular and graphical format. The findings include heavy truck characteristics and interprovincial movement patterns in the NCR including origin and destination. Extra precaution should be applied in the use of this survey data. The data represents truck movements using these two interprovincial bridges only and does not cover all regional1 and interprovincial2 truck movements. A region-wide Goods Movement Survey is best tool to analyze truck movements of this nature. This report reflects the expanded survey results. To this end, the survey results were first subjected to rigorous editing, imputation, expansion, and validation process prior to their tabulation and summary.
1.2 Organization of Report
The report is organized into three chapters. The remainder of Chapter 1 presents a glossary of key terms to help understand the findings. Chapter 2 provides some background information on the survey and Chapter 3 presents key findings from the survey.
1.3 Glossary
The following is a glossary of key terms and their meaning as applied to this report: Trip is a one-directional movement of a truck from one point (origin) to a second point (destination), for a single purpose. Trips are classified into three categories based on their point of origin and/or destination.
Local trip which is also known as an “internal/internal” trip and has both an origin and destination within the NCR. For example, a trip from Hull to the west end of Ottawa would be a local trip;
1 For example, trips from Toronto to Ottawa were not captured in this survey because these trips didn‟t cross the
interprovincial bridges. 2
There are bridge crossings which fall outside the NCR boundary and are not part of this survey data.
2007 Interprovincial Roadside Truck Survey Results TRANS Committee
February 2011 2
Inter-regional trip which is also known as either an “internal/external” or an “external/internal” trip and has either origin or destination within the NCR. In the case of “internal/external” trip, an origin is within the NCR and destination is outside the region. In case of “external/internal” trip, an origin is outside the NCR and destination is within the region. For example, a trip from Gatineau to Montreal (crossing the Ottawa River) would be an “internal/external” trip and a trip from Kingston to Gatineau would be an “external/internal trip;
Through trip which is also known as an “external/external” trip and has both an origin and destination outside the NCR. For example, a trip from Montreal to Maniwaki which crosses the Ottawa River would be a through trip.
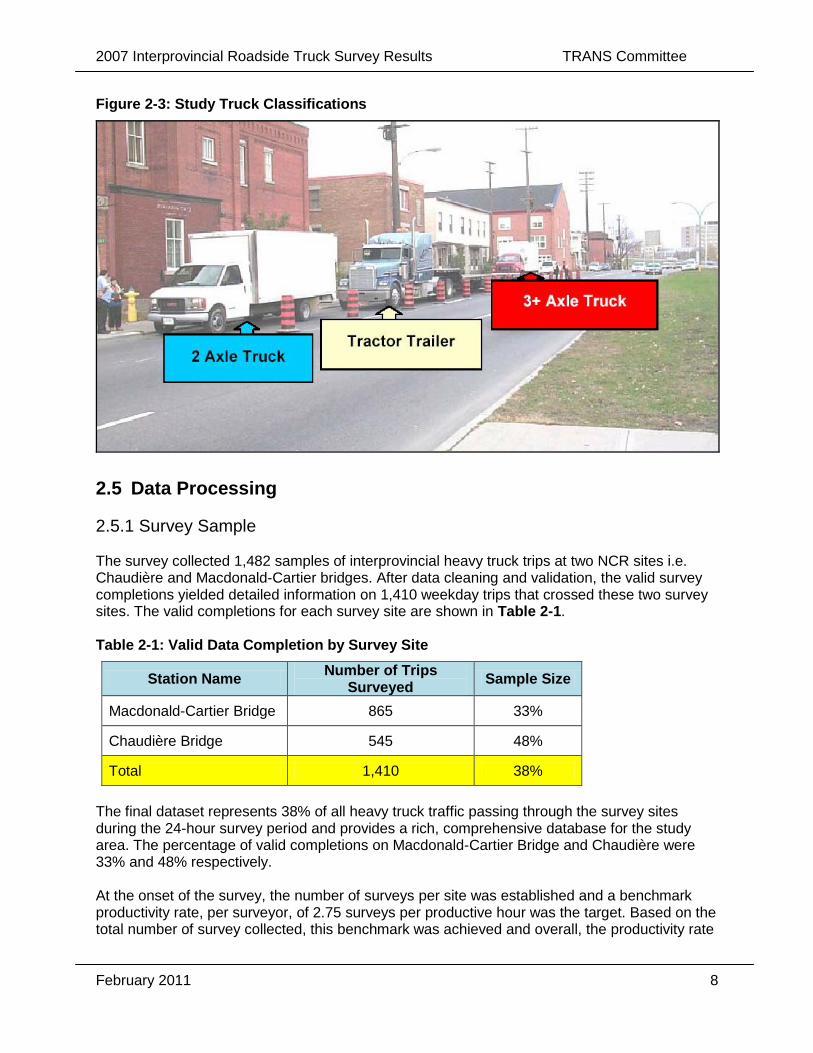
Origin is the location where a trip begins. It is described in terms of a longitude and latitude, a traffic zone, or a district. All survey origins have been geo-coded for precision. Destination is the location where a trip ends. It has similar attributes as the trip origin. Peak periods are the times of the day when transportation system typically carries the maximum number of vehicle trips. They typically correspond to the morning (AM) or evening (PM) commuter peak periods. For the purpose of this report, the AM peak period corresponds to trips intercepted between 6:30 and 08:59. The PM peak period corresponds to trips intercepted between 15:30 and 17:59. Midday off-peak period is the time between AM and PM peak periods and corresponds to trips intercepted between 09:00 and 15:29. Night time period is the time between PM and AM peak periods and corresponds to trips intercepted between 18:00 and 6:29. Heavy Trucks include any vehicle with dual tires on one or more rear axles. For the purpose of this report, heavy trucks are classified into three types:
2 axle straight trucks – which represent trucks with 2 axles and six wheels such as tow trucks, large (3/4 ton, 1 ton) pick up trucks, small vans, small dump trucks, etc.;
3+ (3 or more) axle straight trucks – which represent medium size single unit trucks such as large dump trucks, straight trucks, concrete mix trucks etc.;
Tractor trailer trucks – which represents the largest trucks such as tractor trailer trucks, flat-bed trucks etc.
2007 Interprovincial Roadside Truck Survey Results TRANS Committee
February 2011 3
2. ABOUT THE SURVEY
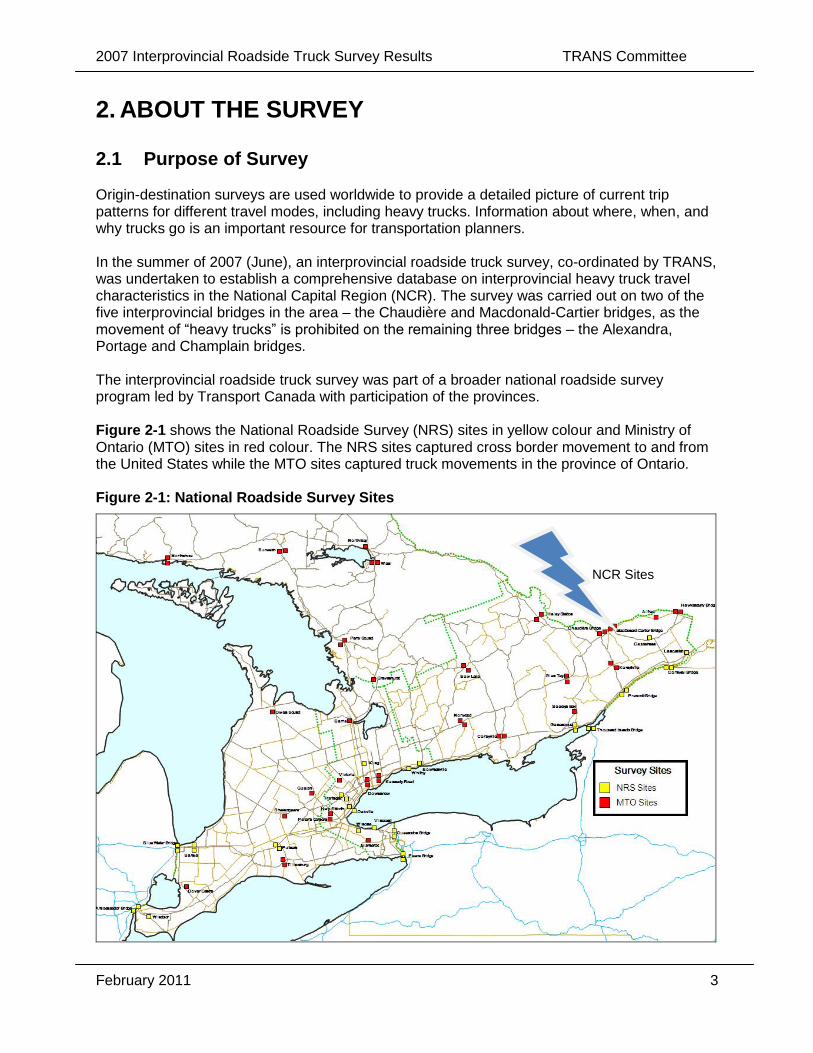
2.1 Purpose of Survey Origin-destination surveys are used worldwide to provide a detailed picture of current trip patterns for different travel modes, including heavy trucks. Information about where, when, and why trucks go is an important resource for transportation planners. In the summer of 2007 (June), an interprovincial roadside truck survey, co-ordinated by TRANS, was undertaken to establish a comprehensive database on interprovincial heavy truck travel characteristics in the National Capital Region (NCR). The survey was carried out on two of the five interprovincial bridges in the area – the Chaudière and Macdonald-Cartier bridges, as the movement of “heavy trucks” is prohibited on the remaining three bridges – the Alexandra, Portage and Champlain bridges. The interprovincial roadside truck survey was part of a broader national roadside survey program led by Transport Canada with participation of the provinces. Figure 2-1 shows the National Roadside Survey (NRS) sites in yellow colour and Ministry of Ontario (MTO) sites in red colour. The NRS sites captured cross border movement to and from the United States while the MTO sites captured truck movements in the province of Ontario. Figure 2-1: National Roadside Survey Sites
NCR Sites
2007 Interprovincial Roadside Truck Survey Results TRANS Committee
February 2011 4
Figure 2-1 also shows two sites in the NCR that captured interprovincial heavy truck movements on Chaudière and Macdonald-Cartier bridges. A previous Interprovincial Roadside Truck Survey was undertaken in 1999-2000. The data from this survey is critical in identifying area-wide transportation infrastructure needs and services, measuring trends, and monitoring progress in implementing transportation policies. In addition to collecting origin-destination information, Classification and Occupancy (C&O) counts and Automated Traffic Recorder (ATR) counts for vehicles travelling on the selected routes were also collected.
2.2 Roadside Intercept Survey The purpose of the roadside intercept survey was to collect high quality data on the characteristics of heavy trucks, the travel patterns, including detailed information on the trip origin/destination, routes used and the commodity/goods carried. The roadside driver interview surveys were carried out by trained surveyors (under contract to the Ministry of Transportation Ontario) familiar with the form of data collection programs of the type applied in this study. Survey crews were stationed on the south side of the Ottawa River – on King Edward Avenue between Rideau Street and Murray Street, and on Booth Street between Ottawa River Parkway and the Chaudière Bridge – interviewed drivers of sampled trucks. For the survey, trucks (weighing at least 4,500 kg with a minimum 2 axles/6 tires) were randomly selected from the stream of traffic by an Enforcement officer and directed to a location for vehicle weighing. The vehicle‟s axles and gross weight were collected and the truck‟s features recorded. At another area a surveyor conducted an interview with the truck driver. A pen-based hand-held tablet computer was used to collect data through a scripted questionnaire program. Along with this was a program which allowed the interviewer to plot the route taken by the driver from his start point to his destination. Trucks with four wheels are considered to be light trucks and were not included in this survey. These include small (1/2 ton) pick-up trucks, such as the Toyota Tacoma/Chevrolet Sonoma, or a Jeep, or any SUV etc. with a commercial logo. Two versions of the questionnaire were available for the survey, an English language version and a French language version. Truck driver had the option of doing the survey in either language. In the survey, the origin and destination of the truck trips were recorded in very precise and specific terms (longitude and latitude) in order to apply the existing “traffic zone” system to yield valid origin-destination information. Driver interviews were conducted on the same days for the two locations but on separate days for northbound and southbound traffic movements. The surveys were undertaken as follows: DIRECTION 2007 SURVEY (12:01 am to 11:59 pm)
NORTHBOUND June 12 to 14 SOUTHBOUND June 19 to 21
2007 Interprovincial Roadside Truck Survey Results TRANS Committee
February 2011 5
2.2.1 Safety Safety training was conducted by Earth Tech (as part of the five day comprehensive survey training program). This consisted of presentations of the following safety sessions.
Field Orientation training
Defensive Driving, and
Traffic Protection
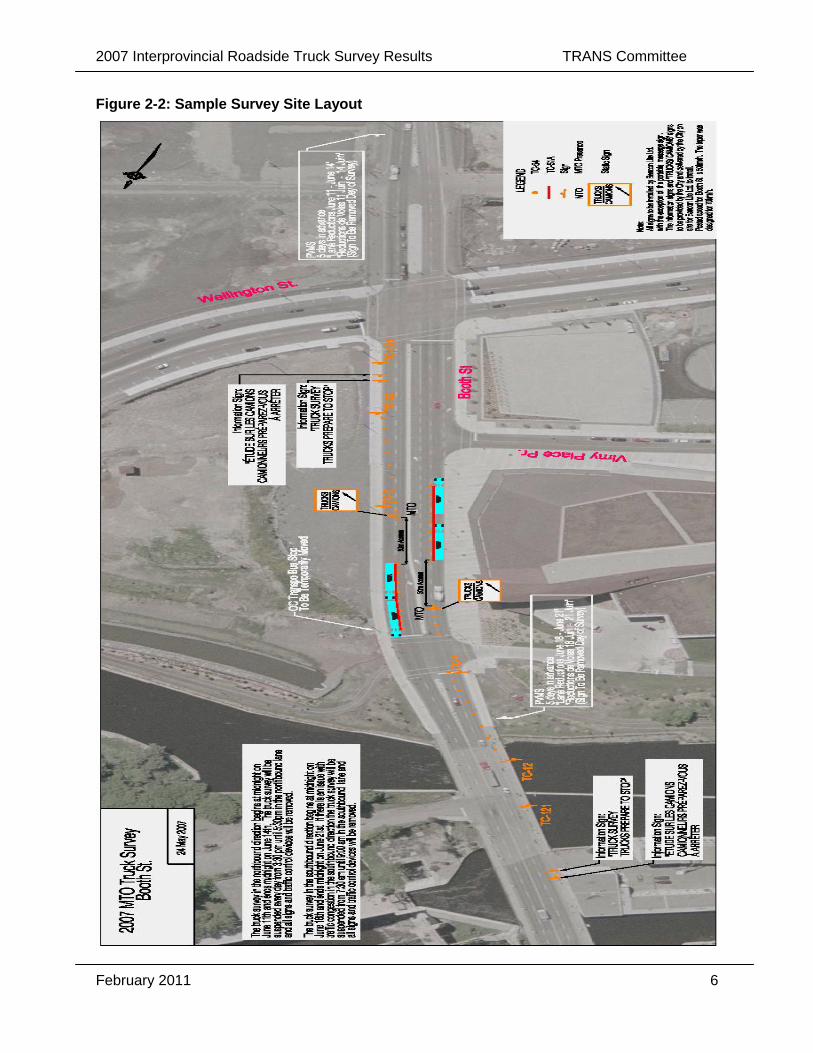
A Health and Safety plan was produced in accordance with the requirements of the Earth Tech Health & Safety Department. Included in the project safety plan were the emergency phone numbers along with a listing of addresses and phone numbers of the hospital nearest to the survey sites. All Operational Safety activities related to the survey were to follow the regulations outlined in The Ministry of Labour “ Occupational Health and Safety Act” and associated regulations, Workers Compensation Act, and The “Traffic Control Manual for Roadway Operations (Field Edition). Prior to the setup at each site, a sketch was developed of the survey station showing the lanes, stop line and interviewers position. Figure 2-2 shows a typical survey site set-up and lane closure layout. Personal safety equipment was worn at all times when on site and while conducting surveys. Both MTO Enforcement and Ottawa City police were on site for traffic control.
2.2.2 Sample Selection
MTO issued following guidelines for sample selection:
At the Survey Stations, the Enforcement Officer will turn on the signal lights indicating that the station is open.
All trucks entering the survey station should be considered candidates for interviews e.g. empty trucks, utility trucks and tractors without trailers.
The Enforcement Officer is responsible for selection of the trucks to be surveyed. The general intent is to have as many surveys conducted as possible. The general guidelines for selection are:
o Select the next available truck when a surveyor is ready to conduct an interview; a survey is trying to collect a representative sample from all trucks through a random selection process
o During periods of high truck volume, avoid selecting two trucks in a row (to avoid convoys);
o During periods of low truck volumes, it is more important to keep the survey position occupied;
o Surveyor should not be involved in the selection; extra long trucks, animal carriers, long distance carriers and non-Ontario are NOT to be avoided
2007 Interprovincial Roadside Truck Survey Results TRANS Committee
February 2011 6
Figure 2-2: Sample Survey Site Layout
2007 Interprovincial Roadside Truck Survey Results TRANS Committee
February 2011 7
2.2.3 Types of Data Collected The following database fields from the interview surveys are relevant to the purpose of this study.
- The bridge used and direction of travel of the truck; - The configuration of the truck (number of tires/axles); - Additional descriptors identifying the configuration/body style of the truck (tractor trailer,
straight truck, van etc.); - Information on characteristics including number of stops, trip origin/destination details,
intercept time etc.; - Information on axle groupings of trucks etc.; - Truck load information.
2.3 Automatic Traffic Recorder (ATR) Counts Automatic Traffic Recorder (ATR) counts were another component of the survey and the information serves as a basis to expand the data collected from the C&O counts – which were collected on May 28th for a 12-hour time period, and to apply major truck type distribution to C&O expanded counts. ATR equipment was installed on both sites for consecutive five weekdays (in each direction) to record 24-hour traffic volumes by vehicle classification by direction. The ATR counts were done concurrently with the surveying. Heavy truck volume information was collected using the following vehicle classifications: Class 5: heavy trucks (2-axle, 6-tire straight trucks) Class 6 and 7: heavy trucks (3 or more axle straight trucks) Class 8 to 13: heavy trucks (single or multi trailer trucks)
2.4 Classification and Occupancy (C&O) Counts The City of Ottawa undertakes annually traffic counts along major travel corridors to establish trends related to vehicle traffic by classification and occupancy. These data are collected for one day for a 12 hour period (07:00 to 19:00) each year. These classification and occupancy data were available for all the interprovincial bridges including Chaudière and Macdonald-Cartier bridges. The C&O counts on these two bridges were conducted on May 28, 2007, a few weeks before this survey. Furthermore, the 12 hour C&O counts were expanded to 24 hour counts using the ATR counts which were undertaken during the survey time period for full five consecutive weekdays in each direction. It should be noted that the C&O counting program use a single global heavy truck classification i.e. any vehicle with dual tires on one or more rear axles. A graphical representation of the various types of vehicles that are classified as “Heavy Trucks” in the C&O program is provided in Appendix B. For the purpose of this report analysis, heavy trucks are grouped into three major types i.e. 2 axle straight trucks, 3+ axle straight trucks and tractor trailer trucks. These three major truck types are shown in Figure 2-3.
2007 Interprovincial Roadside Truck Survey Results TRANS Committee
February 2011 8
Figure 2-3: Study Truck Classifications
2.5 Data Processing
2.5.1 Survey Sample The survey collected 1,482 samples of interprovincial heavy truck trips at two NCR sites i.e. Chaudière and Macdonald-Cartier bridges. After data cleaning and validation, the valid survey completions yielded detailed information on 1,410 weekday trips that crossed these two survey sites. The valid completions for each survey site are shown in Table 2-1. Table 2-1: Valid Data Completion by Survey Site
Station Name Number of Trips
Surveyed Sample Size
Macdonald-Cartier Bridge 865 33%
Chaudière Bridge 545 48%
Total 1,410 38%
The final dataset represents 38% of all heavy truck traffic passing through the survey sites during the 24-hour survey period and provides a rich, comprehensive database for the study area. The percentage of valid completions on Macdonald-Cartier Bridge and Chaudière were 33% and 48% respectively. At the onset of the survey, the number of surveys per site was established and a benchmark productivity rate, per surveyor, of 2.75 surveys per productive hour was the target. Based on the total number of survey collected, this benchmark was achieved and overall, the productivity rate
2007 Interprovincial Roadside Truck Survey Results TRANS Committee
February 2011 9
was equal to 2.96 surveys per productive hour. Table 2-2 summarizes the productivity of the survey by site. Table 2-2: Survey Productivity by Site
Site Name Surveys per
Productive Hour
Macdonald-Cartier Bridge (N/B) 3.48
Macdonald-Cartier Bridge (S/B) 3.27
Chaudière Bridge (N/B) 2.58
Chaudière Bridge (S/B) 2.53
Average 2.96
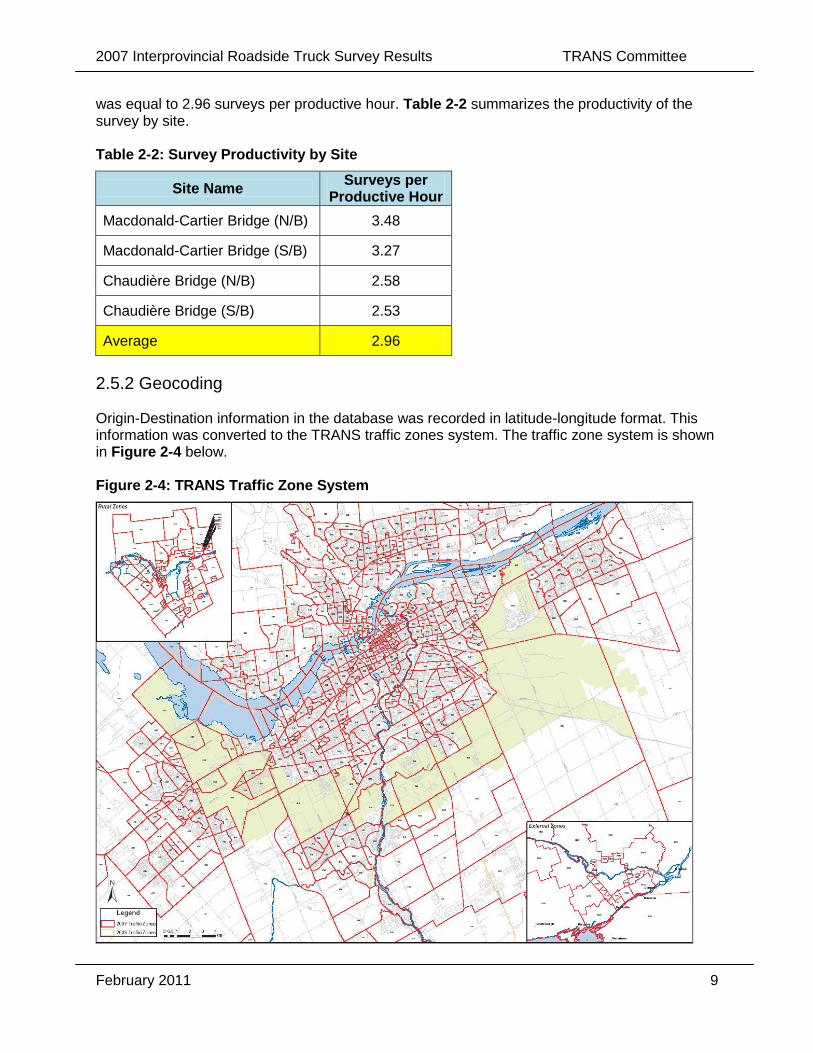
2.5.2 Geocoding
Origin-Destination information in the database was recorded in latitude-longitude format. This information was converted to the TRANS traffic zones system. The traffic zone system is shown in Figure 2-4 below. Figure 2-4: TRANS Traffic Zone System
2007 Interprovincial Roadside Truck Survey Results TRANS Committee
February 2011 10
2.5.3 Data Expansion Methodology The number of surveyed trips passing through each site was expanded to equal number of heavy truck trips along the route during a typical weekday, by direction, by time of day, and by truck type (i.e. three major types), using the following expansion method. 1. Average weekday truck volumes were determined by time period and direction for each site
using C&O and ATR data. C&O data provided typical weekday heavy truck volume distributions by 15 min interval by direction. ATR counts were used to expand 12 hour C&O counts to 24 hour time period by hourly interval.
2. Distribution of truck types were determined by time periods and direction for each site.
C&O counts have single global heavy truck classification. Therefore, ATR counts were used to determine truck type distribution by hour.
3. Number of heavy trucks trips by truck type was determined by time period and direction for each site.
Average weekday truck volumes (step 1) were multiplied by the percentage of truck type trips (step 2) to determine the number of trucks by type passing through each site by time period and direction for a 24 hour survey period. 4. Expansion factor was determined and applied.
The expansion factor was determined by dividing the number of truck trips for each site by truck type, time period, and direction (step 3), by the number of surveyed trips for each group. The expansion factor was then applied to the surveyed trips to expand surveyed trips to match observed heavy truck trips.
Based on hourly traffic volumes from expanded C&O counts, 3,760 heavy trucks crossed the sites during the 24 hour survey period. Out of which, 1,410 valid trips were surveyed and expanded to 3,760 heavy truck trips for two sites over the 24 hour survey period. Expansion was done by site, direction, truck type, and time period.
2007 Interprovincial Roadside Truck Survey Results TRANS Committee
February 2011 11
3 KEY FINDINGS The numbers shown in the figures and tables in this chapter are based on the expanded results of the 2007 Interprovincial Roadside Truck Survey.
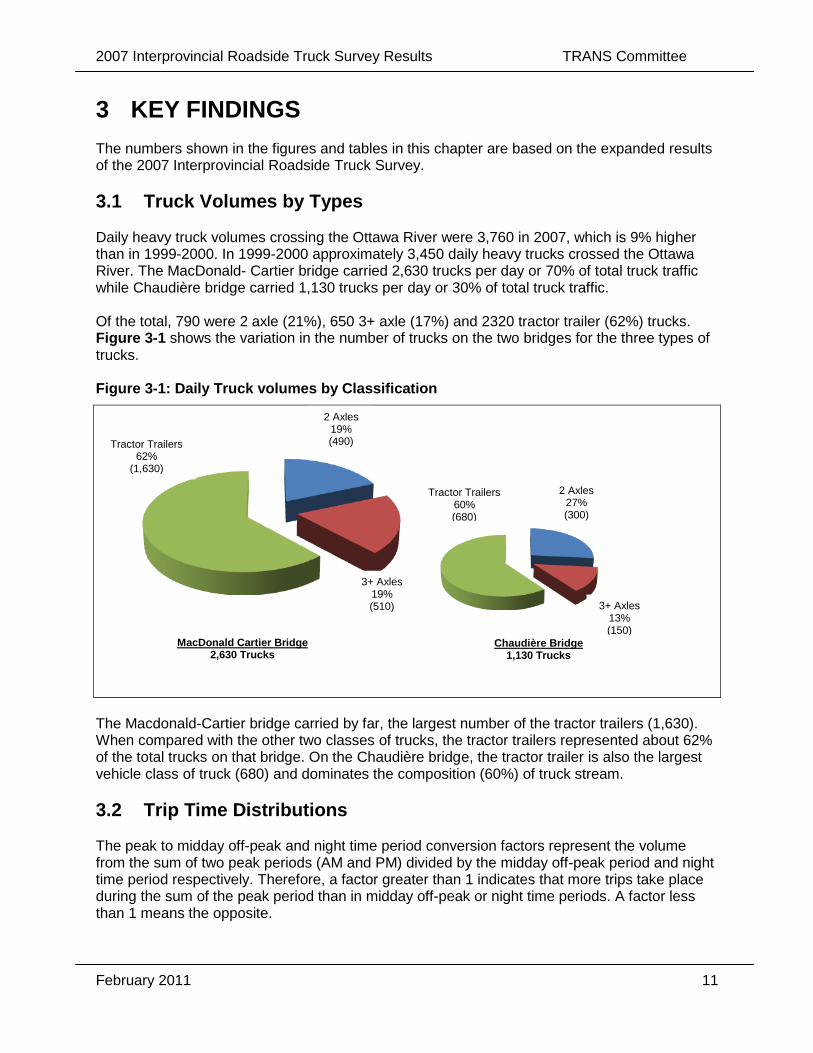
3.1 Truck Volumes by Types Daily heavy truck volumes crossing the Ottawa River were 3,760 in 2007, which is 9% higher than in 1999-2000. In 1999-2000 approximately 3,450 daily heavy trucks crossed the Ottawa River. The MacDonald- Cartier bridge carried 2,630 trucks per day or 70% of total truck traffic while Chaudière bridge carried 1,130 trucks per day or 30% of total truck traffic. Of the total, 790 were 2 axle (21%), 650 3+ axle (17%) and 2320 tractor trailer (62%) trucks. Figure 3-1 shows the variation in the number of trucks on the two bridges for the three types of trucks. Figure 3-1: Daily Truck volumes by Classification
The Macdonald-Cartier bridge carried by far, the largest number of the tractor trailers (1,630). When compared with the other two classes of trucks, the tractor trailers represented about 62% of the total trucks on that bridge. On the Chaudière bridge, the tractor trailer is also the largest vehicle class of truck (680) and dominates the composition (60%) of truck stream.
3.2 Trip Time Distributions The peak to midday off-peak and night time period conversion factors represent the volume from the sum of two peak periods (AM and PM) divided by the midday off-peak period and night time period respectively. Therefore, a factor greater than 1 indicates that more trips take place during the sum of the peak period than in midday off-peak or night time periods. A factor less than 1 means the opposite.
MacDonald Cartier Bridge 2,630 Trucks
Chaudière Bridge 1,130 Trucks
2 Axles 19% (490)
3+ Axles 19% (510)
Tractor Trailers 62%
(1,630)
2 Axles 27% (300)
3+ Axles 13% (150)
Tractor Trailers 60% (680)
2007 Interprovincial Roadside Truck Survey Results TRANS Committee
February 2011 12
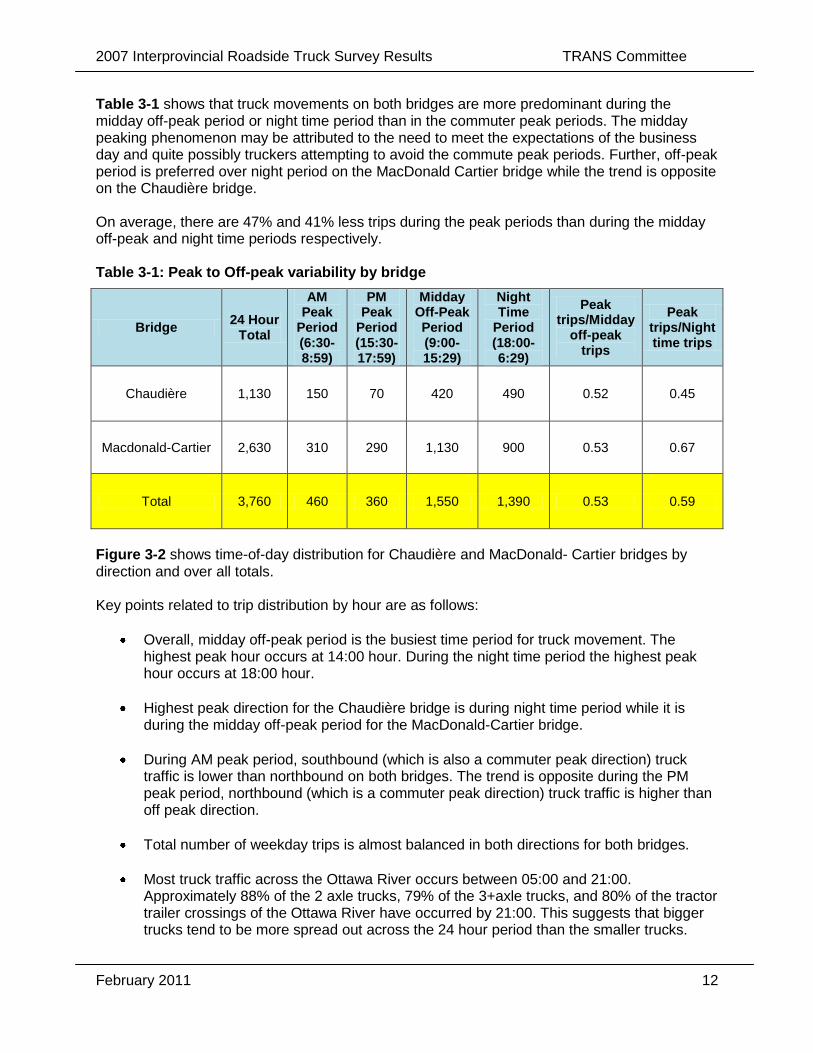
Table 3-1 shows that truck movements on both bridges are more predominant during the midday off-peak period or night time period than in the commuter peak periods. The midday peaking phenomenon may be attributed to the need to meet the expectations of the business day and quite possibly truckers attempting to avoid the commute peak periods. Further, off-peak period is preferred over night period on the MacDonald Cartier bridge while the trend is opposite on the Chaudière bridge. On average, there are 47% and 41% less trips during the peak periods than during the midday off-peak and night time periods respectively. Table 3-1: Peak to Off-peak variability by bridge
Bridge 24 Hour
Total
AM Peak
Period (6:30-8:59)
PM Peak
Period (15:30-17:59)
Midday Off-Peak Period (9:00-15:29)
Night Time
Period (18:00-6:29)
Peak trips/Midday
off-peak trips
Peak trips/Night time trips
Chaudière 1,130 150 70 420 490 0.52 0.45
Macdonald-Cartier 2,630 310 290 1,130 900 0.53 0.67
Total 3,760 460 360 1,550 1,390 0.53 0.59
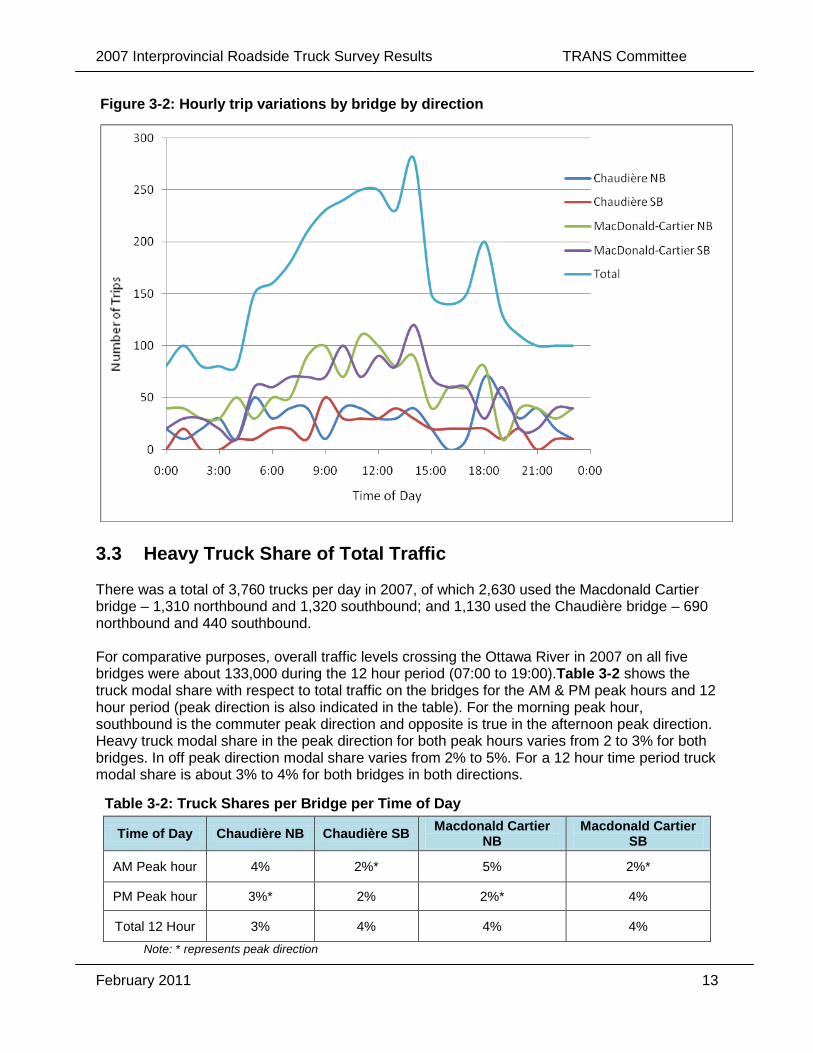
Figure 3-2 shows time-of-day distribution for Chaudière and MacDonald- Cartier bridges by direction and over all totals. Key points related to trip distribution by hour are as follows:
Overall, midday off-peak period is the busiest time period for truck movement. The highest peak hour occurs at 14:00 hour. During the night time period the highest peak hour occurs at 18:00 hour.
Highest peak direction for the Chaudière bridge is during night time period while it is during the midday off-peak period for the MacDonald-Cartier bridge.
During AM peak period, southbound (which is also a commuter peak direction) truck traffic is lower than northbound on both bridges. The trend is opposite during the PM peak period, northbound (which is a commuter peak direction) truck traffic is higher than off peak direction.
Total number of weekday trips is almost balanced in both directions for both bridges.
Most truck traffic across the Ottawa River occurs between 05:00 and 21:00. Approximately 88% of the 2 axle trucks, 79% of the 3+axle trucks, and 80% of the tractor trailer crossings of the Ottawa River have occurred by 21:00. This suggests that bigger trucks tend to be more spread out across the 24 hour period than the smaller trucks.
2007 Interprovincial Roadside Truck Survey Results TRANS Committee
February 2011 13
Figure 3-2: Hourly trip variations by bridge by direction
3.3 Heavy Truck Share of Total Traffic There was a total of 3,760 trucks per day in 2007, of which 2,630 used the Macdonald Cartier bridge – 1,310 northbound and 1,320 southbound; and 1,130 used the Chaudière bridge – 690 northbound and 440 southbound. For comparative purposes, overall traffic levels crossing the Ottawa River in 2007 on all five bridges were about 133,000 during the 12 hour period (07:00 to 19:00).Table 3-2 shows the truck modal share with respect to total traffic on the bridges for the AM & PM peak hours and 12 hour period (peak direction is also indicated in the table). For the morning peak hour, southbound is the commuter peak direction and opposite is true in the afternoon peak direction. Heavy truck modal share in the peak direction for both peak hours varies from 2 to 3% for both bridges. In off peak direction modal share varies from 2% to 5%. For a 12 hour time period truck modal share is about 3% to 4% for both bridges in both directions.
Table 3-2: Truck Shares per Bridge per Time of Day
Time of Day Chaudière NB Chaudière SB Macdonald Cartier
NB Macdonald Cartier
SB
AM Peak hour 4% 2%* 5% 2%*
PM Peak hour 3%* 2% 2%* 4%
Total 12 Hour 3% 4% 4% 4%
Note: * represents peak direction
2007 Interprovincial Roadside Truck Survey Results TRANS Committee
February 2011 14
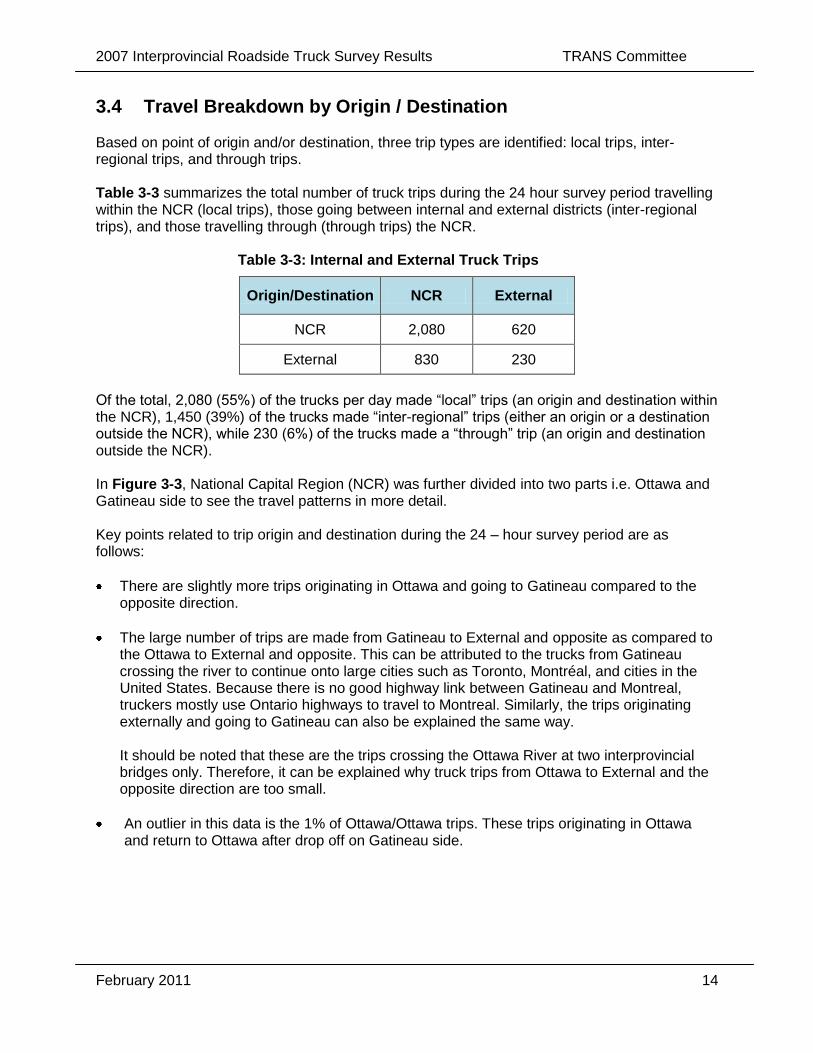
3.4 Travel Breakdown by Origin / Destination Based on point of origin and/or destination, three trip types are identified: local trips, inter-regional trips, and through trips. Table 3-3 summarizes the total number of truck trips during the 24 hour survey period travelling within the NCR (local trips), those going between internal and external districts (inter-regional trips), and those travelling through (through trips) the NCR.
Table 3-3: Internal and External Truck Trips
Origin/Destination NCR External
NCR 2,080 620
External 830 230
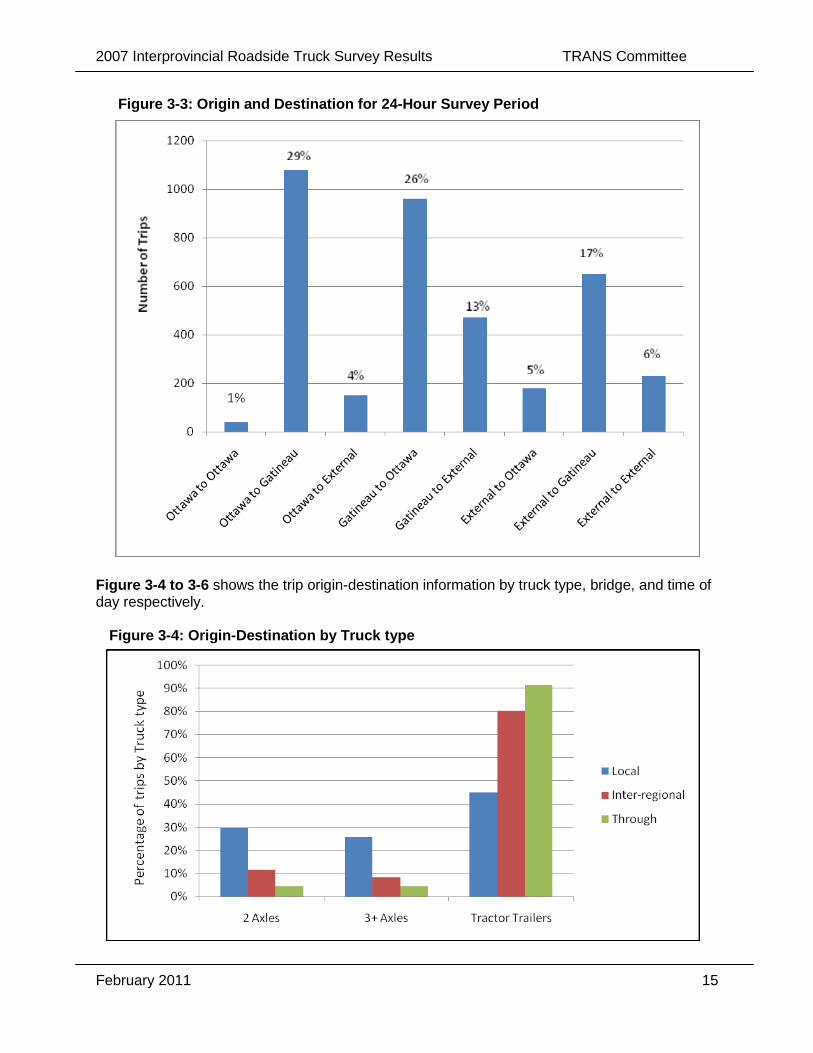
Of the total, 2,080 (55%) of the trucks per day made “local” trips (an origin and destination within the NCR), 1,450 (39%) of the trucks made “inter-regional” trips (either an origin or a destination outside the NCR), while 230 (6%) of the trucks made a “through” trip (an origin and destination outside the NCR). In Figure 3-3, National Capital Region (NCR) was further divided into two parts i.e. Ottawa and Gatineau side to see the travel patterns in more detail. Key points related to trip origin and destination during the 24 – hour survey period are as follows:
There are slightly more trips originating in Ottawa and going to Gatineau compared to the opposite direction.
The large number of trips are made from Gatineau to External and opposite as compared to the Ottawa to External and opposite. This can be attributed to the trucks from Gatineau crossing the river to continue onto large cities such as Toronto, Montréal, and cities in the United States. Because there is no good highway link between Gatineau and Montreal, truckers mostly use Ontario highways to travel to Montreal. Similarly, the trips originating externally and going to Gatineau can also be explained the same way. It should be noted that these are the trips crossing the Ottawa River at two interprovincial bridges only. Therefore, it can be explained why truck trips from Ottawa to External and the opposite direction are too small.
An outlier in this data is the 1% of Ottawa/Ottawa trips. These trips originating in Ottawa and return to Ottawa after drop off on Gatineau side.
2007 Interprovincial Roadside Truck Survey Results TRANS Committee
February 2011 15
Figure 3-3: Origin and Destination for 24-Hour Survey Period
Figure 3-4 to 3-6 shows the trip origin-destination information by truck type, bridge, and time of day respectively. Figure 3-4: Origin-Destination by Truck type
2007 Interprovincial Roadside Truck Survey Results TRANS Committee
February 2011 16
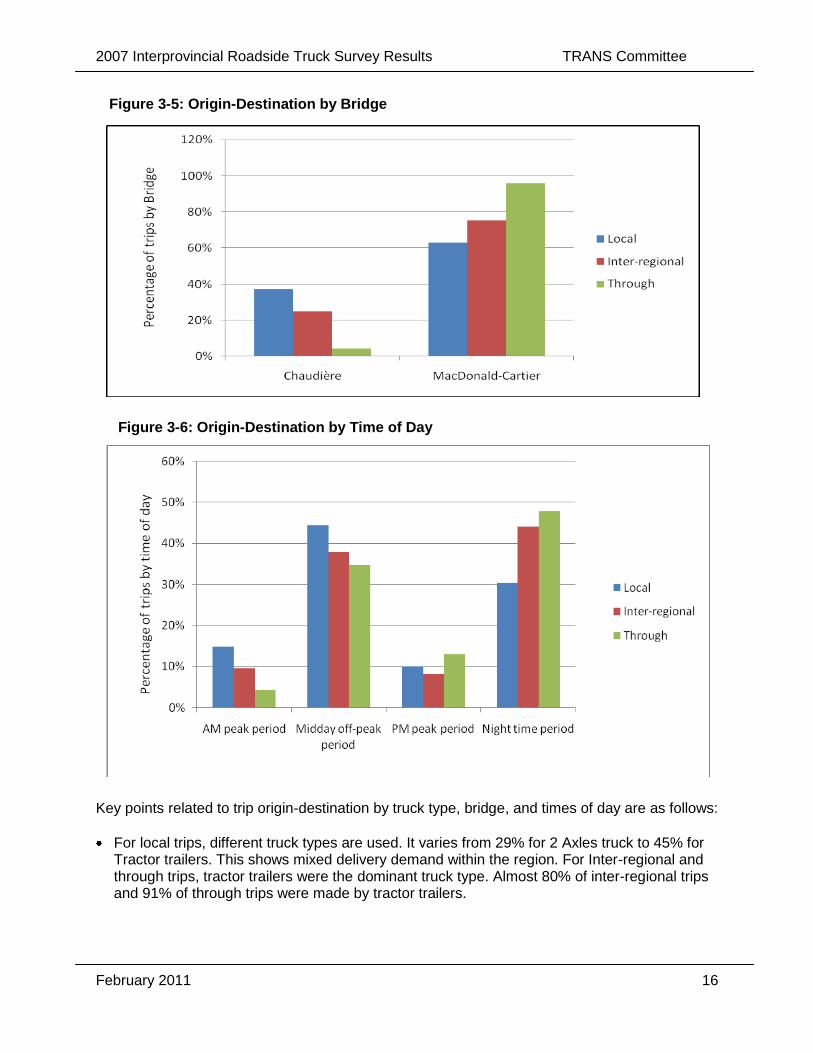
Figure 3-5: Origin-Destination by Bridge
Figure 3-6: Origin-Destination by Time of Day
Key points related to trip origin-destination by truck type, bridge, and times of day are as follows:
For local trips, different truck types are used. It varies from 29% for 2 Axles truck to 45% for Tractor trailers. This shows mixed delivery demand within the region. For Inter-regional and through trips, tractor trailers were the dominant truck type. Almost 80% of inter-regional trips and 91% of through trips were made by tractor trailers.
2007 Interprovincial Roadside Truck Survey Results TRANS Committee
February 2011 17
Almost 63% of local, 75% of inter-regional, and nearly 96% of through trips used the MacDonald-Cartier bridge. A high percentage of inter-regional and through trips using the MacDonald-Cartier bridge indicates better highway access as compare to the Chaudière.
Truckers mostly avoid commuter peak periods i.e. AM and PM peak periods. A majority of the local trips (44%) used midday off-peak period and 30% night time period. Inter-regional and through trips mostly preferred the night time period – almost 44% of inter-regional and 48% of through trips.
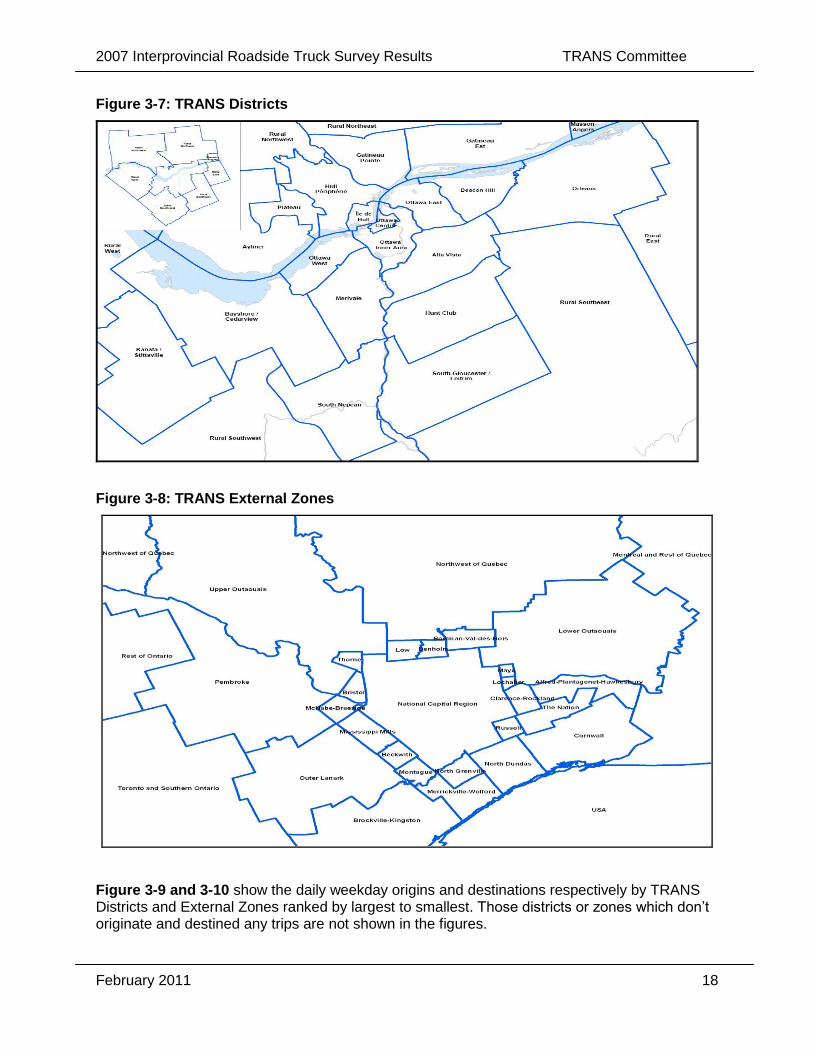
3.5 Travel Breakdown by TRANS Districts/Zones Figure 3-7 represents the 26 TRANS districts within the NCR and Figure 3-8 represents the 29 TRANS external zones outside the NCR boundary.
2007 Interprovincial Roadside Truck Survey Results TRANS Committee
February 2011 18
Figure 3-7: TRANS Districts
Figure 3-8: TRANS External Zones
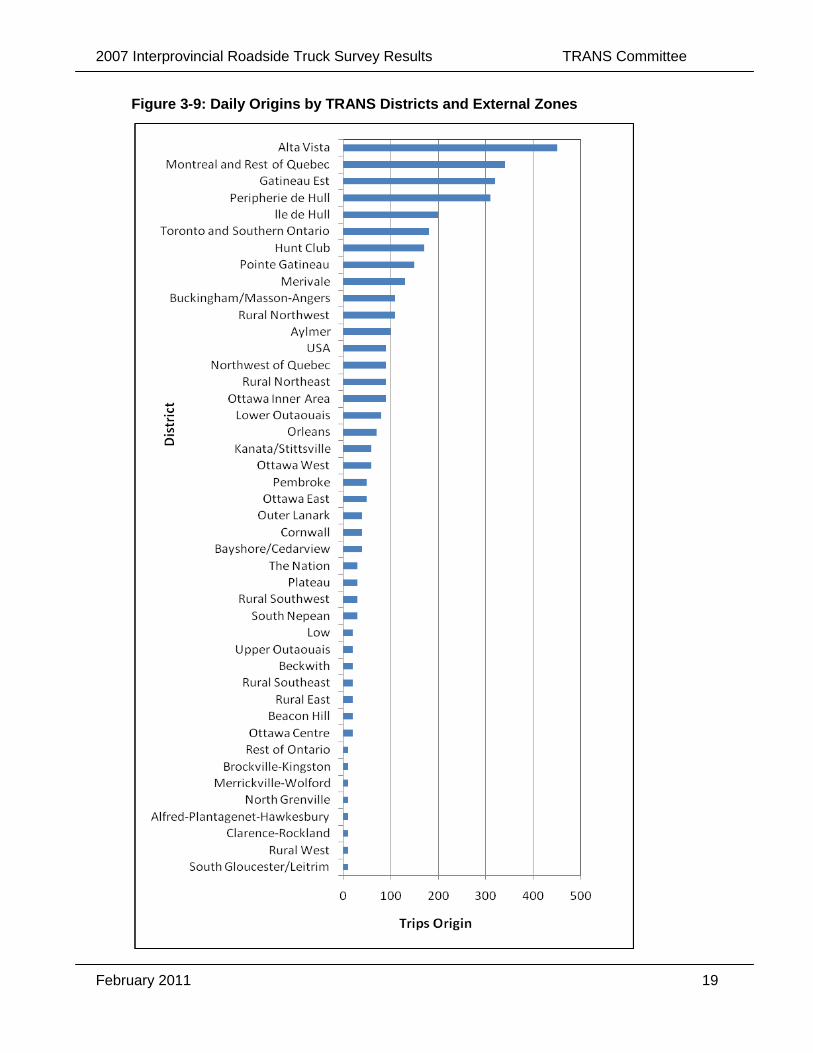
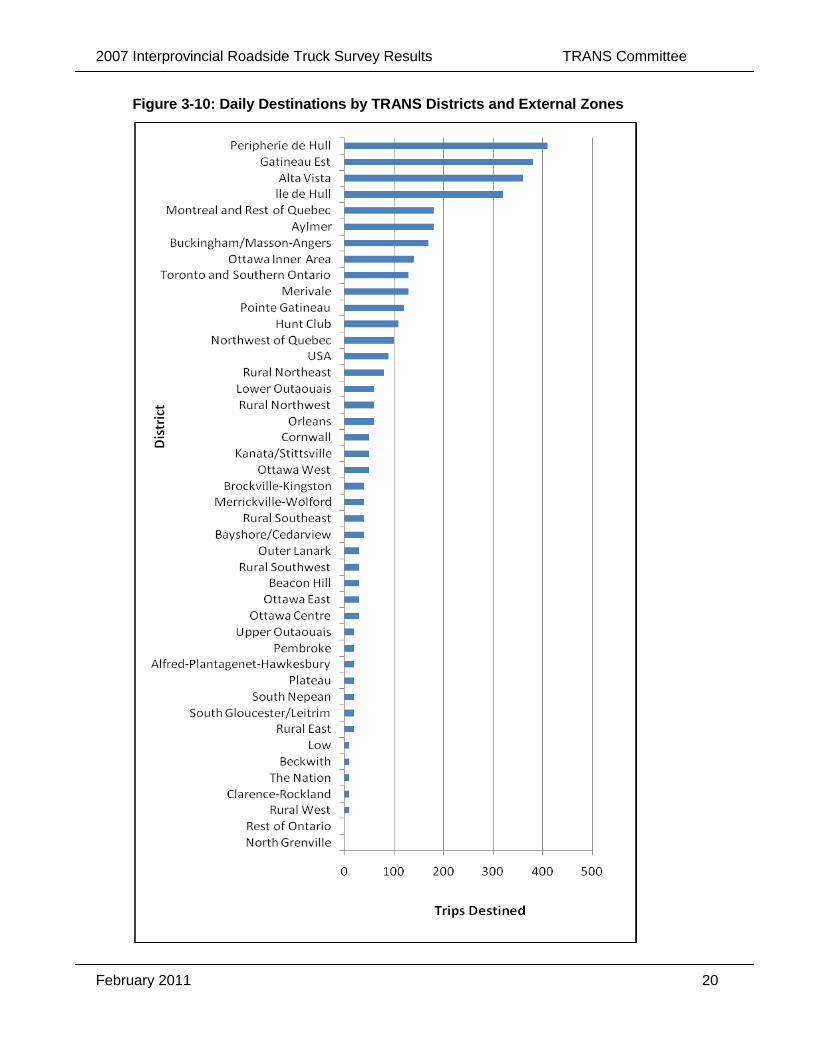
Figure 3-9 and 3-10 show the daily weekday origins and destinations respectively by TRANS Districts and External Zones ranked by largest to smallest. Those districts or zones which don‟t originate and destined any trips are not shown in the figures.
2007 Interprovincial Roadside Truck Survey Results TRANS Committee
February 2011 19
Figure 3-9: Daily Origins by TRANS Districts and External Zones
2007 Interprovincial Roadside Truck Survey Results TRANS Committee
February 2011 20
Figure 3-10: Daily Destinations by TRANS Districts and External Zones
2007 Interprovincial Roadside Truck Survey Results TRANS Committee
February 2011 21
Key points related to the trip origin and destinations of interprovincial trips during the 24-hour survey period are as follows:
The top five origins (with trips and share) during the 24 hour time period are:
o Alta Vista – 450 (12%) o Montreal and Rest of Quebec – 340 (9%) o Gatineau Est – 320 (9%) o Peripherie de Hull – 310 (8%) o lle de Hull – 200 (5%)
The top five destinations (with trips and share) during the 24 hour time period are:
o Peripherie de Hull – 410 (11%) o Gatineau Est – 380 (10%) o Alta Vista – 360 (10%) o lle de Hull – 320 (9%) o Montreal and Rest of Quebec and Aylmer – 180 (5%) each
The majority of interprovincial truck movements occur within the NCR urban area.
o 62% of total trips originate from Ottawa and 60% of total trips that destine to Ottawa are surrounded by the Ottawa Inner Area, Alta Vista, Hunt Club and Merivale districts
o 70% of total trips originate from Gatineau side and 71% of total trips destine to Gatineau are surrounded by lle de Hull, Peripharie de Hull, Pointe Gatineau and Gatineau Est
Destinations outside of the NCR are smaller (26%) than the Origins (28%), especially for Toronto and Montreal. This trend can be explained by numerous factors. As explained earlier, this survey captured trips crossing the two interprovincial bridges only during weekday. Therefore, some trucks may use routes other than these two bridges to travel to these destinations.
Within NCR the trips are well distributed and major generators are mostly major destinations with almost similar magnitude.
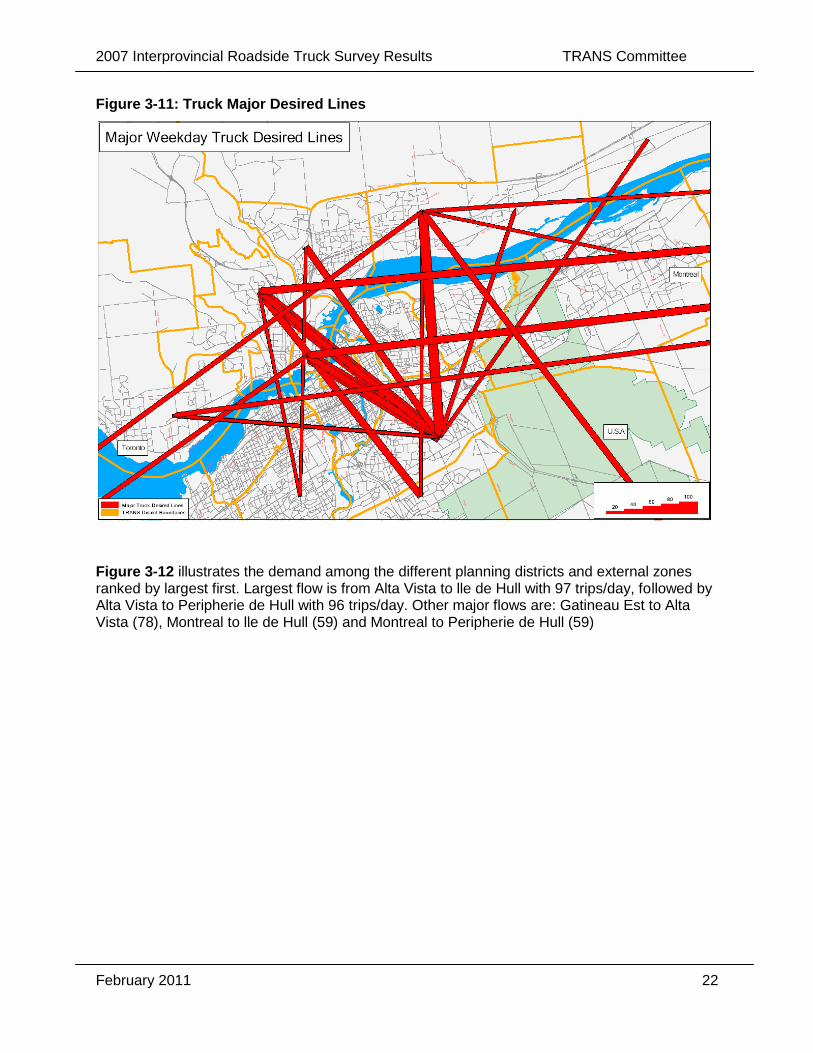
3.6 Major Desired Lines Figure 3-11 graphically illustrates the truck major desire line flow using Chaudière and MacDonald-Cartier bridges during the 2007 weekday. Travel desire lines were established with a threshold of 25 district-to-district trips per day (see Appendix A for detail). The width of the line indicates the magnitude of travel.
2007 Interprovincial Roadside Truck Survey Results TRANS Committee
February 2011 22
Figure 3-11: Truck Major Desired Lines
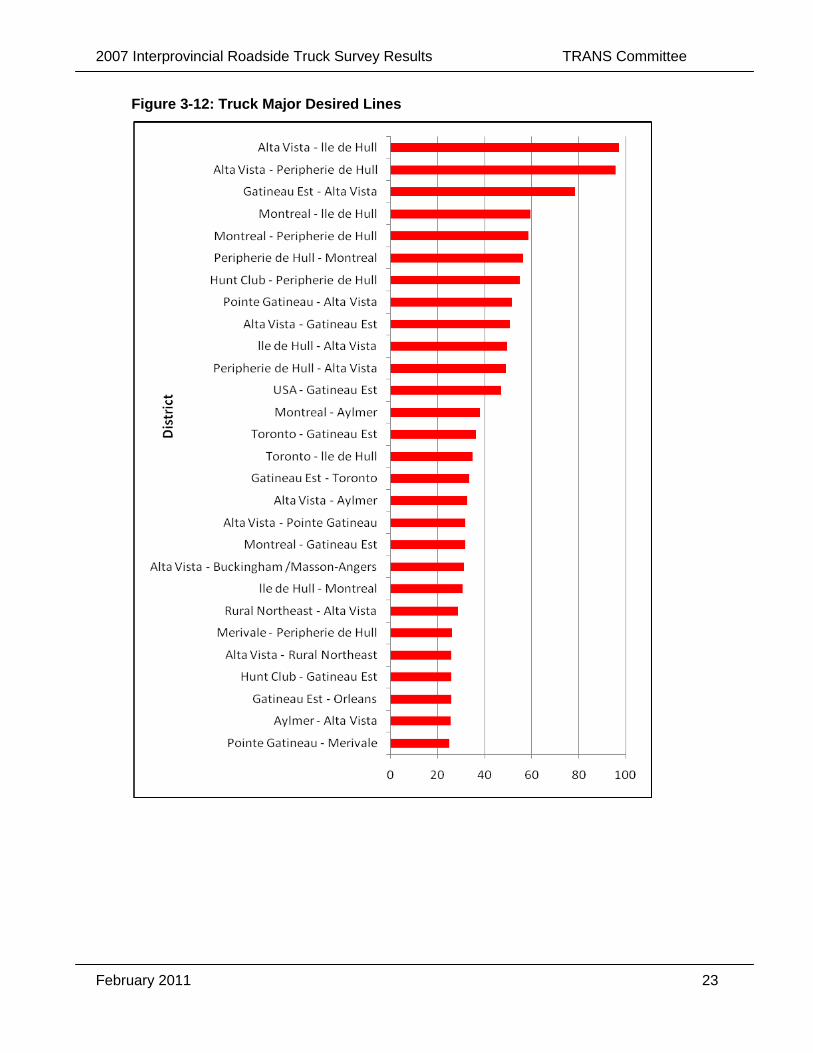
Figure 3-12 illustrates the demand among the different planning districts and external zones ranked by largest first. Largest flow is from Alta Vista to lle de Hull with 97 trips/day, followed by Alta Vista to Peripherie de Hull with 96 trips/day. Other major flows are: Gatineau Est to Alta Vista (78), Montreal to lle de Hull (59) and Montreal to Peripherie de Hull (59)
2007 Interprovincial Roadside Truck Survey Results TRANS Committee
February 2011 23
Figure 3-12: Truck Major Desired Lines
2007 Interprovincial Roadside Truck Survey Results TRANS Committee
February 2011 24
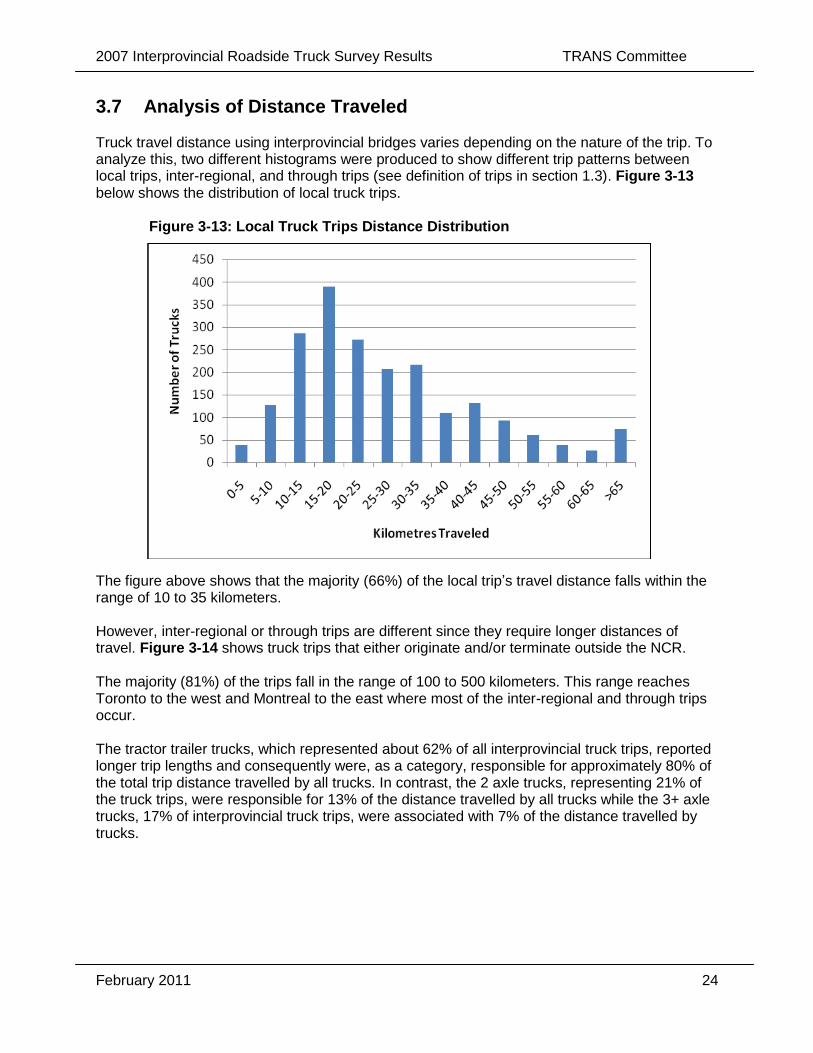
3.7 Analysis of Distance Traveled Truck travel distance using interprovincial bridges varies depending on the nature of the trip. To analyze this, two different histograms were produced to show different trip patterns between local trips, inter-regional, and through trips (see definition of trips in section 1.3). Figure 3-13 below shows the distribution of local truck trips. Figure 3-13: Local Truck Trips Distance Distribution
The figure above shows that the majority (66%) of the local trip‟s travel distance falls within the range of 10 to 35 kilometers. However, inter-regional or through trips are different since they require longer distances of travel. Figure 3-14 shows truck trips that either originate and/or terminate outside the NCR. The majority (81%) of the trips fall in the range of 100 to 500 kilometers. This range reaches Toronto to the west and Montreal to the east where most of the inter-regional and through trips occur. The tractor trailer trucks, which represented about 62% of all interprovincial truck trips, reported longer trip lengths and consequently were, as a category, responsible for approximately 80% of the total trip distance travelled by all trucks. In contrast, the 2 axle trucks, representing 21% of the truck trips, were responsible for 13% of the distance travelled by all trucks while the 3+ axle trucks, 17% of interprovincial truck trips, were associated with 7% of the distance travelled by trucks.
2007 Interprovincial Roadside Truck Survey Results TRANS Committee
February 2011 25
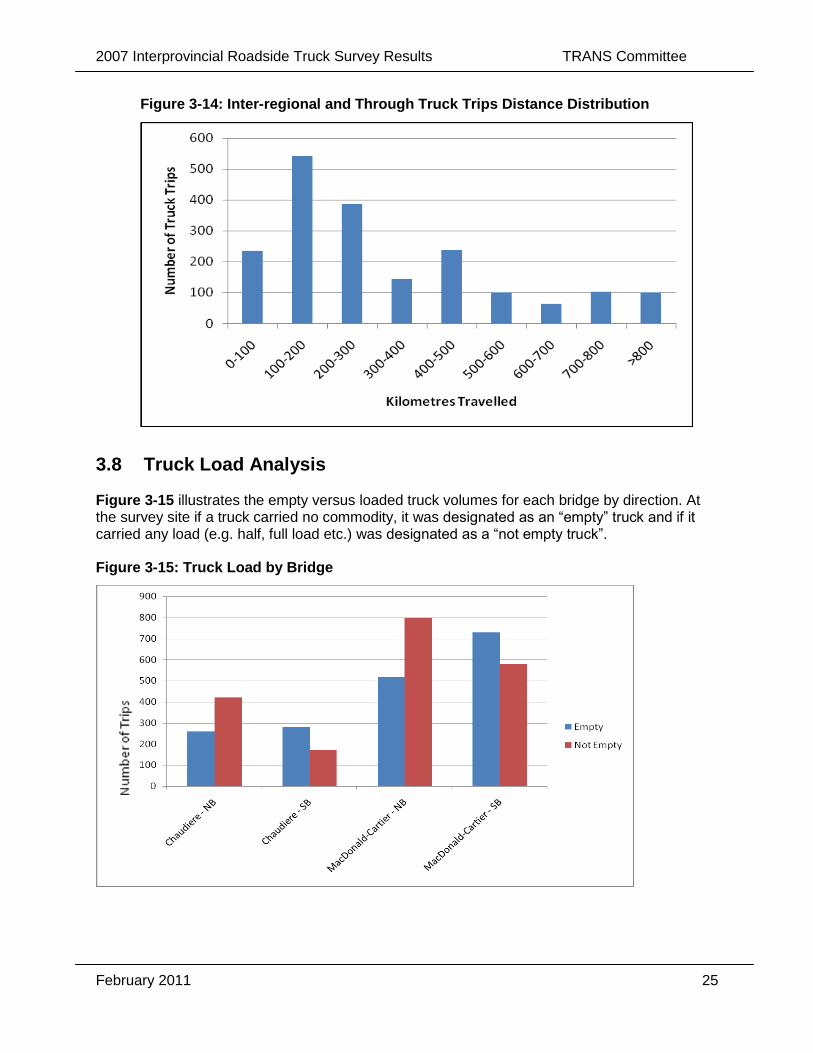
Figure 3-14: Inter-regional and Through Truck Trips Distance Distribution
3.8 Truck Load Analysis
Figure 3-15 illustrates the empty versus loaded truck volumes for each bridge by direction. At the survey site if a truck carried no commodity, it was designated as an “empty” truck and if it carried any load (e.g. half, full load etc.) was designated as a “not empty truck”. Figure 3-15: Truck Load by Bridge
2007 Interprovincial Roadside Truck Survey Results TRANS Committee
February 2011 26
On the Chaudière bridge, northbound direction i.e. from Ontario to Quebec, empty truck volumes are lower (38%) than not empty trucks (62%). The trend is reverse in the opposite direction for empty and not empty trucks with 62% and 38% respectively;
On MacDonald-Cartier bridge, northbound empty trucks were lower (39%) versus not empty trucks (61%). The trend is reverse in the opposite direction for empty and not empty trucks being 56% and 44% respectively.
The above trend can be explained as trucks from Toronto, the United States, and Montreal returned empty after dropping off a load in Gatineau.
Appendix A Origin-Destination Matrices
2007 Interprovincial Roadside Truck Survey Results TRANS Committee
1
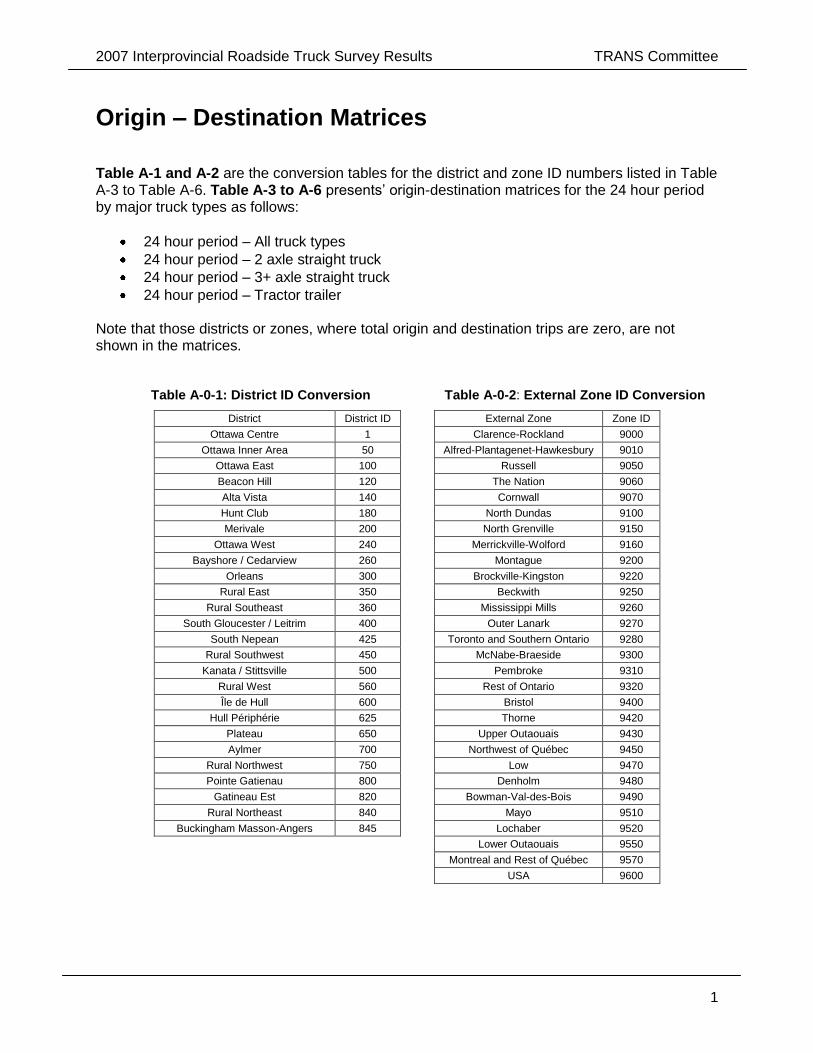
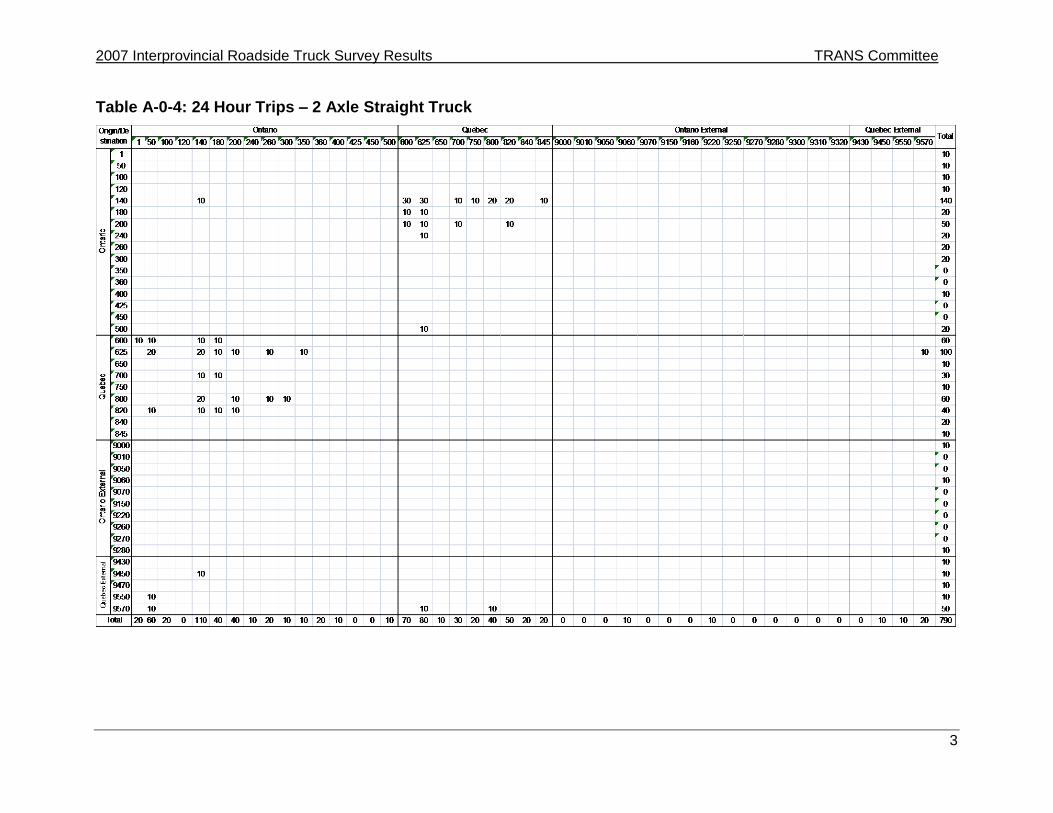
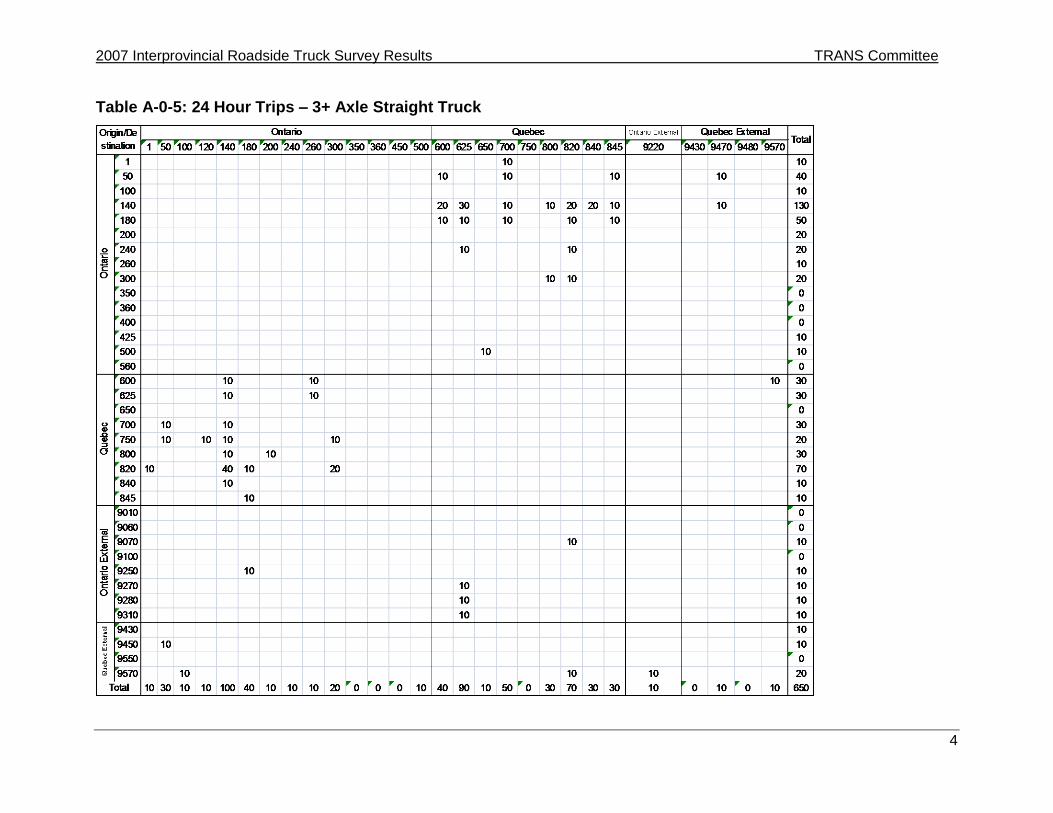
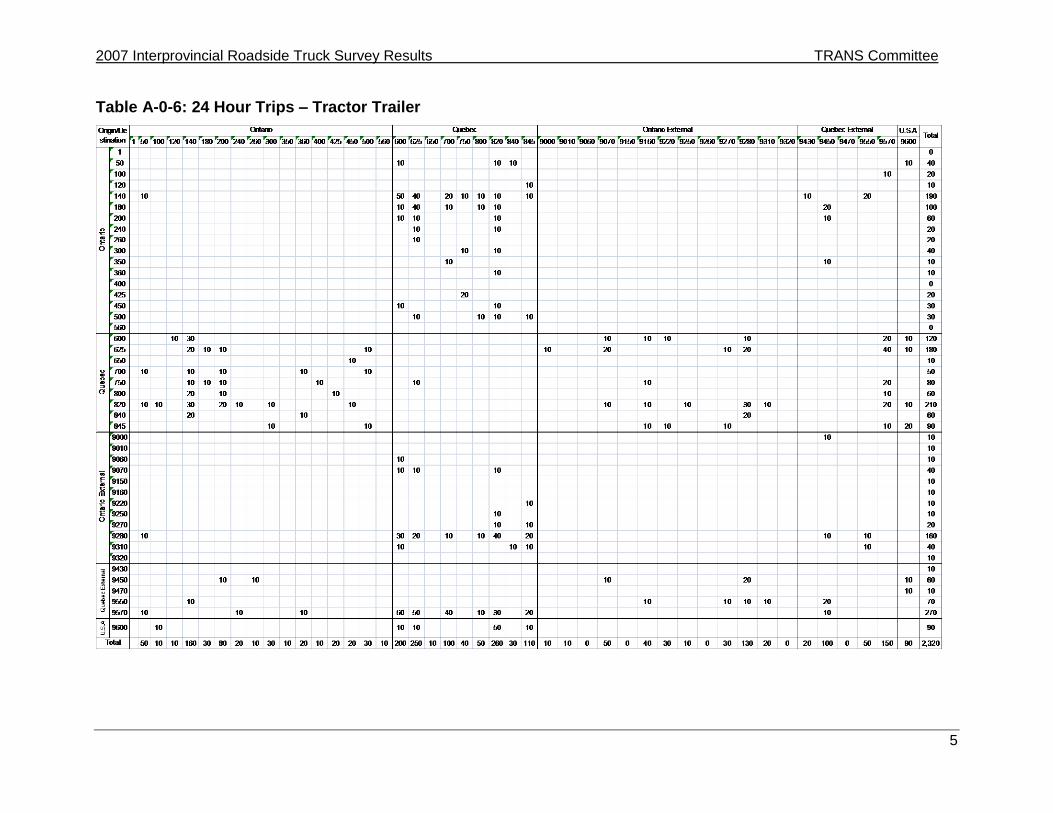
Origin – Destination Matrices Table A-1 and A-2 are the conversion tables for the district and zone ID numbers listed in Table A-3 to Table A-6. Table A-3 to A-6 presents‟ origin-destination matrices for the 24 hour period by major truck types as follows:
24 hour period – All truck types
24 hour period – 2 axle straight truck
24 hour period – 3+ axle straight truck
24 hour period – Tractor trailer Note that those districts or zones, where total origin and destination trips are zero, are not shown in the matrices. Table A-0-1: District ID Conversion Table A-0-2: External Zone ID Conversion
District District ID External Zone Zone ID
Ottawa Centre 1 Clarence-Rockland 9000
Ottawa Inner Area 50 Alfred-Plantagenet-Hawkesbury 9010
Ottawa East 100 Russell 9050
Beacon Hill 120 The Nation 9060
Alta Vista 140 Cornwall 9070
Hunt Club 180 North Dundas 9100
Merivale 200 North Grenville 9150
Ottawa West 240 Merrickville-Wolford 9160
Bayshore / Cedarview 260 Montague 9200
Orleans 300 Brockville-Kingston 9220
Rural East 350 Beckwith 9250
Rural Southeast 360 Mississippi Mills 9260
South Gloucester / Leitrim 400 Outer Lanark 9270
South Nepean 425 Toronto and Southern Ontario 9280
Rural Southwest 450 McNabe-Braeside 9300
Kanata / Stittsville 500 Pembroke 9310
Rural West 560 Rest of Ontario 9320
Île de Hull 600 Bristol 9400
Hull Périphérie 625 Thorne 9420
Plateau 650 Upper Outaouais 9430
Aylmer 700 Northwest of Québec 9450
Rural Northwest 750 Low 9470
Pointe Gatienau 800 Denholm 9480
Gatineau Est 820 Bowman-Val-des-Bois 9490
Rural Northeast 840 Mayo 9510
Buckingham Masson-Angers 845 Lochaber 9520
Lower Outaouais 9550
Montreal and Rest of Québec 9570
USA 9600
2007 Interprovincial Roadside Truck Survey Results TRANS Committee
2
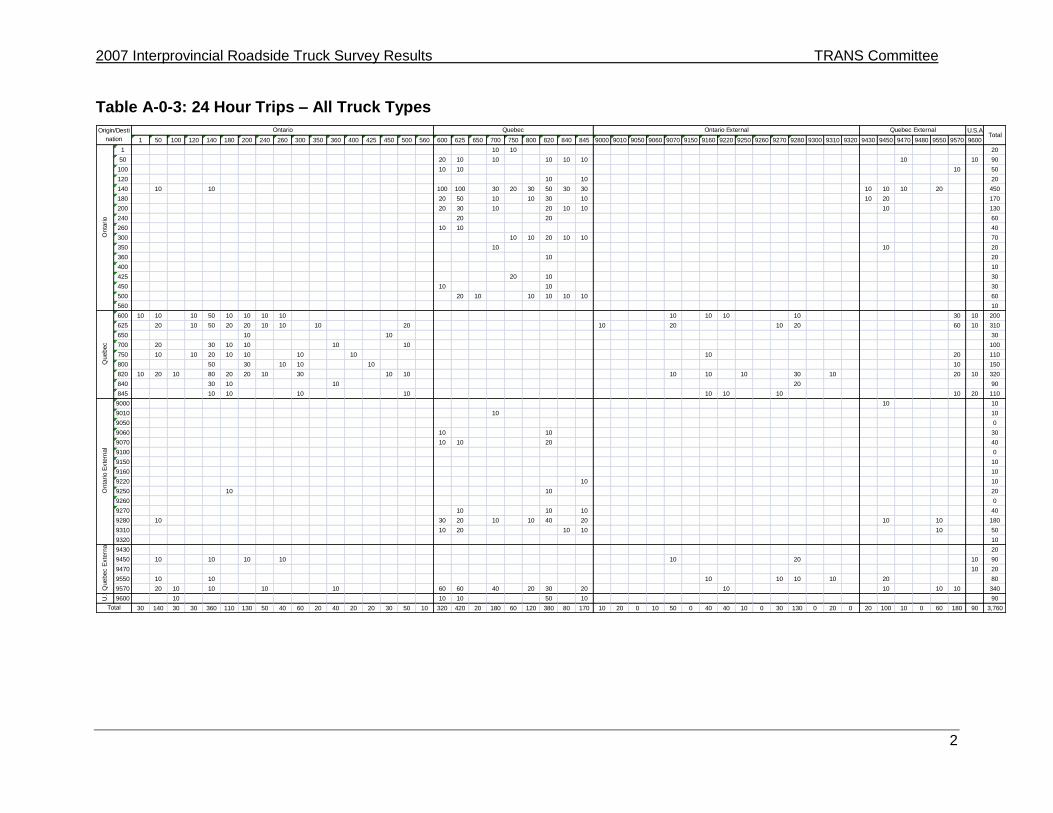
Table A-0-3: 24 Hour Trips – All Truck Types
U.S.A
1 50 100 120 140 180 200 240 260 300 350 360 400 425 450 500 560 600 625 650 700 750 800 820 840 845 9000 9010 9050 9060 9070 9150 9160 9220 9250 9260 9270 9280 9300 9310 9320 9430 9450 9470 9480 9550 9570 9600
1 10 10 20
50 20 10 10 10 10 10 10 10 90
100 10 10 10 50
120 10 10 20
140 10 10 100 100 30 20 30 50 30 30 10 10 10 20 450
180 20 50 10 10 30 10 10 20 170
200 20 30 10 20 10 10 10 130
240 20 20 60
260 10 10 40
300 10 10 20 10 10 70
350 10 10 20
360 10 20
400 10
425 20 10 30
450 10 10 30
500 20 10 10 10 10 10 60
560 10
600 10 10 10 50 10 10 10 10 10 10 10 10 30 10 200
625 20 10 50 20 20 10 10 10 20 10 20 10 20 60 10 310
650 10 10 30
700 20 30 10 10 10 10 100
750 10 10 20 10 10 10 10 10 20 110
800 50 30 10 10 10 10 150
820 10 20 10 80 20 20 10 30 10 10 10 10 10 30 10 20 10 320
840 30 10 10 20 90
845 10 10 10 10 10 10 10 10 20 110
9000 10 10
9010 10 10
9050 0
9060 10 10 30
9070 10 10 20 40
9100 0
9150 10
9160 10
9220 10 10
9250 10 10 20
9260 0
9270 10 10 10 40
9280 10 30 20 10 10 40 20 10 10 180
9310 10 20 10 10 10 50
9320 10
9430 20
9450 10 10 10 10 10 20 10 90
9470 10 20
9550 10 10 10 10 10 10 20 80
9570 20 10 10 10 10 60 60 40 20 30 20 10 10 10 10 340
U.S
.A
9600 10 10 10 50 10 90
30 140 30 30 360 110 130 50 40 60 20 40 20 20 30 50 10 320 420 20 180 60 120 380 80 170 10 20 0 10 50 0 40 40 10 0 30 130 0 20 0 20 100 10 0 60 180 90 3,760Total
Quebec
Onta
rio E
xte
rnal
Quebec E
xte
rnal
TotalOrigin/Desti
nation
Ontario Quebec Ontario External Quebec External
Onta
rio
2007 Interprovincial Roadside Truck Survey Results TRANS Committee
3
Table A-0-4: 24 Hour Trips – 2 Axle Straight Truck
2007 Interprovincial Roadside Truck Survey Results TRANS Committee
4
Table A-0-5: 24 Hour Trips – 3+ Axle Straight Truck
2007 Interprovincial Roadside Truck Survey Results TRANS Committee
5
Table A-0-6: 24 Hour Trips – Tractor Trailer
6
Appendix B Heavy Truck Description
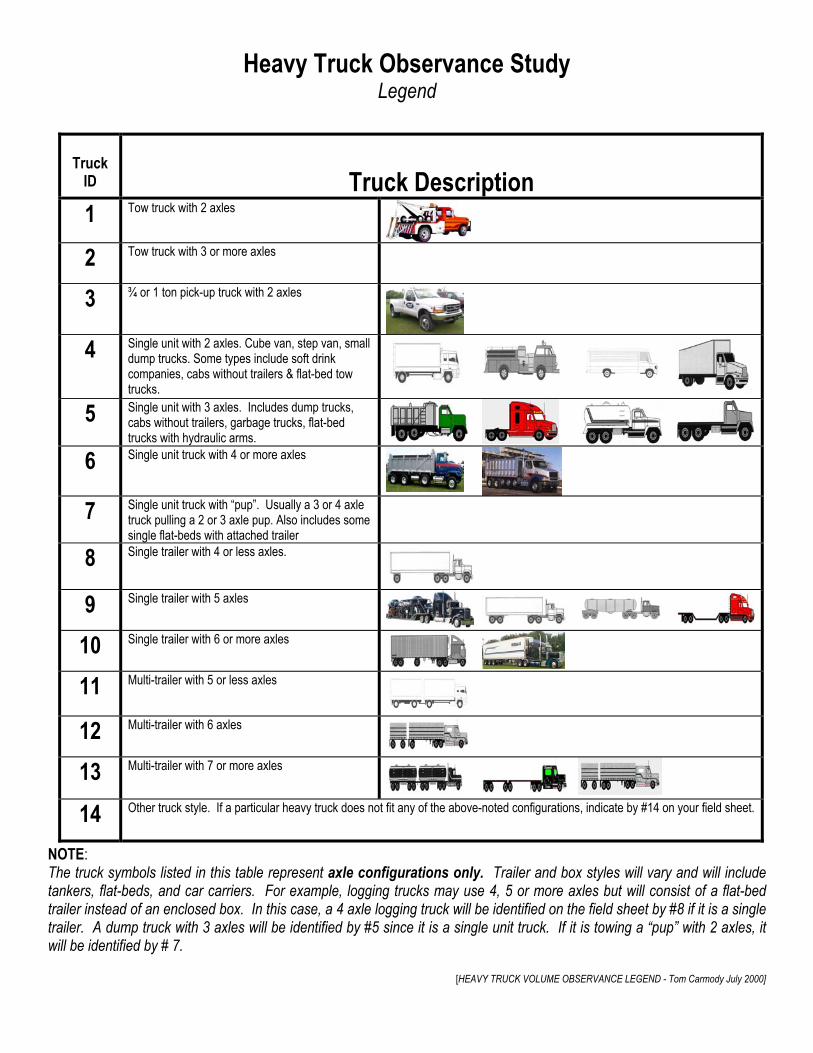
Heavy Truck Observance Study Legend
NOTE: The truck symbols listed in this table represent axle configurations only. Trailer and box styles will vary and will include tankers, flat-beds, and car carriers. For example, logging trucks may use 4, 5 or more axles but will consist of a flat-bed trailer instead of an enclosed box. In this case, a 4 axle logging truck will be identified on the field sheet by #8 if it is a single trailer. A dump truck with 3 axles will be identified by #5 since it is a single unit truck. If it is towing a “pup” with 2 axles, it will be identified by # 7.
[HEAVY TRUCK VOLUME OBSERVANCE LEGEND - Tom Carmody July 2000]
Truck
ID
Truck Description 1 Tow truck with 2 axles
2 Tow truck with 3 or more axles
3 ¾ or 1 ton pick-up truck with 2 axles
4 Single unit with 2 axles. Cube van, step van, small dump trucks. Some types include soft drink companies, cabs without trailers & flat-bed tow trucks.
5 Single unit with 3 axles. Includes dump trucks,
cabs without trailers, garbage trucks, flat-bed trucks with hydraulic arms.
6 Single unit truck with 4 or more axles
7 Single unit truck with “pup”. Usually a 3 or 4 axle truck pulling a 2 or 3 axle pup. Also includes some single flat-beds with attached trailer
8 Single trailer with 4 or less axles.
9 Single trailer with 5 axles
10 Single trailer with 6 or more axles
11 Multi-trailer with 5 or less axles
12 Multi-trailer with 6 axles
13 Multi-trailer with 7 or more axles
14 Other truck style. If a particular heavy truck does not fit any of the above-noted configurations, indicate by #14 on your field sheet.