Embed Size (px)
Citation preview

Munich Personal RePEc Archive
Interpreting sustainable development
goals for 2030: implications for Malawi
Chirwa, Themba
Millennium Challenge Account - Malawi
7 April 2016
Online at https://mpra.ub.uni-muenchen.de/84192/
MPRA Paper No. 84192, posted 29 Jan 2018 07:29 UTC

INTERPRETING SUSTAINABLE DEVELOPMENT GOALS FOR 2030: IMPLICATIONS FOR MALAWI
BY
Dr. Themba G. Chirwa 1 Monitoring, Evaluation and Economics Department
Millennium Challenge Account - Malawi P.O Box 31513
Lilongwe Malawi
Email: [email protected] / [email protected]
APRIL 2016
1The views expressed in this paper are those of the Author and do not reflect the views of MCA-Malawi or its affiliates. The paper is aimed at generating a debate on how the United Nations sustainable development goals can be more effective. The first obviously were not and there is need to critically think about how achievable the next ones will be for poor economies like mine. For any meaningful comments that you may have please send them to my email as this is still work in progress.

1
INTERPRETING SUSTAINABLE DEVELOPMENT GOALS FOR 2030: IMPLICATIONS FOR MALAWI
Abstract
The paper assesses the likelihood of Malawi achieving its post-2015 sustainable development
goals by 2030, especially goal number 1 of eradicating extreme poverty. The results show that for
Malawi to eliminate extreme poverty of less than $1.25 a day from an estimated 74.4% in 2015 to
as low as 1.0% in 2030; real GDP per capita is expected to grow at a rate of 21% p.a. If this is
to be achieved, Malawi will be expected to invest approximately US$136 billion within the post-
2015 period in order for real incomes to increase to levels that eliminate extreme poverty. These
are extreme and very hard growth conditions to be achieved for a low-income economy like
Malawi; especially when the average growth in real GDP per capital during the period 2010-
2014 averaged 1.6% p.a. The study concludes that concerted efforts and significant financial
support from the global community is required and needs to be put in place as quickly as possible
if countries with high poverty incidences like Malawi are to achieve this ambitious goal of
eliminating extreme poverty by 2030.
Keywords: Malawi; Post-2015 Sustainable Development Goals; Extreme Poverty; Economic
Growth
JEL Classification: N17, E17, O11
1. Introduction
In September 2015, member states agreed to a post-2015 development agenda for sustainable
development at a United Nations Summit held in New York. In this agenda, seventeen sustainable
development goals were adopted through consensus and generally focus on eliminating poverty,
promoting peace and shared prosperity and environmental sustainability. Development agencies
are quickly adapting to this new agenda by changing their development strategies to align to the

2
post-2015 sustainable development goals. In particular, the World Bank aligned this new thinking
in 2013 by focusing on twin development goals: to end extreme poverty; and shared prosperity2.
Goal 1 of the post-2015 sustainable development goals (SDGs) aims at ending extreme poverty
in all its forms by 2030 (The President of the General Assembly, 2015). According to the UN
definition, extreme poverty comprise of people living on less than US$1.25 a day at the ruling
power purchasing parity (PPP). The World Bank, on the other hand, defines extreme poverty as
those living on less than US$1.90 a day (World Bank, 2015a, 2015b). This is a daunting challenge
especially bearing in mind that in the current decade poverty levels based on the new definition
especially in poor countries has more than doubled.
Figure 1 illustrates income and poverty levels for selected low, middle and high income
economies in the world. The results reveal that there is an inverse correlation between real GDP
per capita and poverty headcount ratios where high (low) poverty levels are associated with low
(high) income levels. The results also show that countries that experience poverty headcount ratios
of more than 25% are in the low-income to low-middle income category. According to the Poverty
and Equity Database (World Bank, 2015a), the top five poorest countries in the world with a
poverty headcount ratio of less than $1.90 a day of the total population included Madagascar
(82%); Malawi (71%); Mozambique (69%), Zambia (64%); and Rwanda (60%). For the SDGs
not to be ephemeral, it is important for countries to know each year’s projected levels of poverty
and what efforts are required in order to eliminate those poverty levels. In order to end extreme
poverty, it is, therefore, very important that countries know what they are up against as well as
know what key areas they need to invest in order to achieve this goal by 2030.
2 See http://blogs.worldbank.org/futuredevelopment/twin-goals

3
Figure 1: World Income and Poverty Headcount Levels
Source: World Bank, 2015a, 2015b
MDG
MWI
NER
ETH
UGA
MOZ
RWA
BFA
TZA
KEN
BGD
GHA
LSO
ZMB
NGA
IND
GEO
SWZ
AGO
THA
CHN
NAM
BRA
ZAF
ROM
BWA
MUS
MYS
ARGMEX
TUR
CHLHRV
POLSYCSAU PRTGRC
BRNFRA JPN
AUS BEL
SGP
CAN
FIN
DEU
GBR
AUTNLD
SWE
USA
DNKCHEISL NOR LUX
-
10
20
30
40
50
60
70
80
90
$0 $10,000 $20,000 $30,000 $40,000 $50,000 $60,000 $70,000 $80,000 $90,000
Po
ver
ty H
ead
cou
nt
Ra
tio
-%
Real GDP per capita (constant 2005 US$)
Poverty Headcount Ratio (US$1.90)

4
In order to tackle this development challenge, development practitioners have called for inclusive
growth strategies to be adopted. This entails the need to ensure that economic performance at the
macroeconomic level should trickle down to the microeconomic level. This includes ensuring that
individuals at all levels benefit from economic growth performance and not only a few
individuals. Thus, development effectiveness calls for prudent planning of programs/projects to
ensure that sustainable benefits accrue to all poverty levels especially those below $1.25 a day.
Establishing linkages between macroeconomic and microeconomic levels requires adopting a
prudent approach that is country-specific. In this study, we use Malawi as a case study where we
first discuss the key macroeconomic determinants of growth; and then use their estimated
elasticities to make forecasts on poverty headcount ratios for the post-2015 SDGs period using
household-level data. The paper suggests a two-pronged approach. First, country-level
macroeconomic determinants of growth and their elasticities should be determined. This involves
running growth equations that are robust with long-run level relationships established between
the dependent variable (real GDP per capita) and its set of regressors. Second, the elasticities from
the growth equations are used to make annual growth projections on household-level real
expenditure aggregates obtained from household surveys to determine future levels of poverty.
The rest of the paper is divided as follows. Section 2 discusses the methodological approach used
to measure inclusive growth and forecast poverty ratios. Section 3 discuss poverty headcount
projections and forecasts covering the period 2015-2043 to quantify what Malawi is up against in
order to achieve the SDGs by 2030; that is, at what rate of real GDP per capita growth is needed
for Malawi to eliminate extreme poverty. Section 4 provides some policy implications for Malawi
and the role that the global development community is expected to play during the SDG period.
Section 5 discuss some challenges that Malawi faces based on the requirements to eliminate
extreme poverty. Lastly, Section 6 present concluding remarks.
5
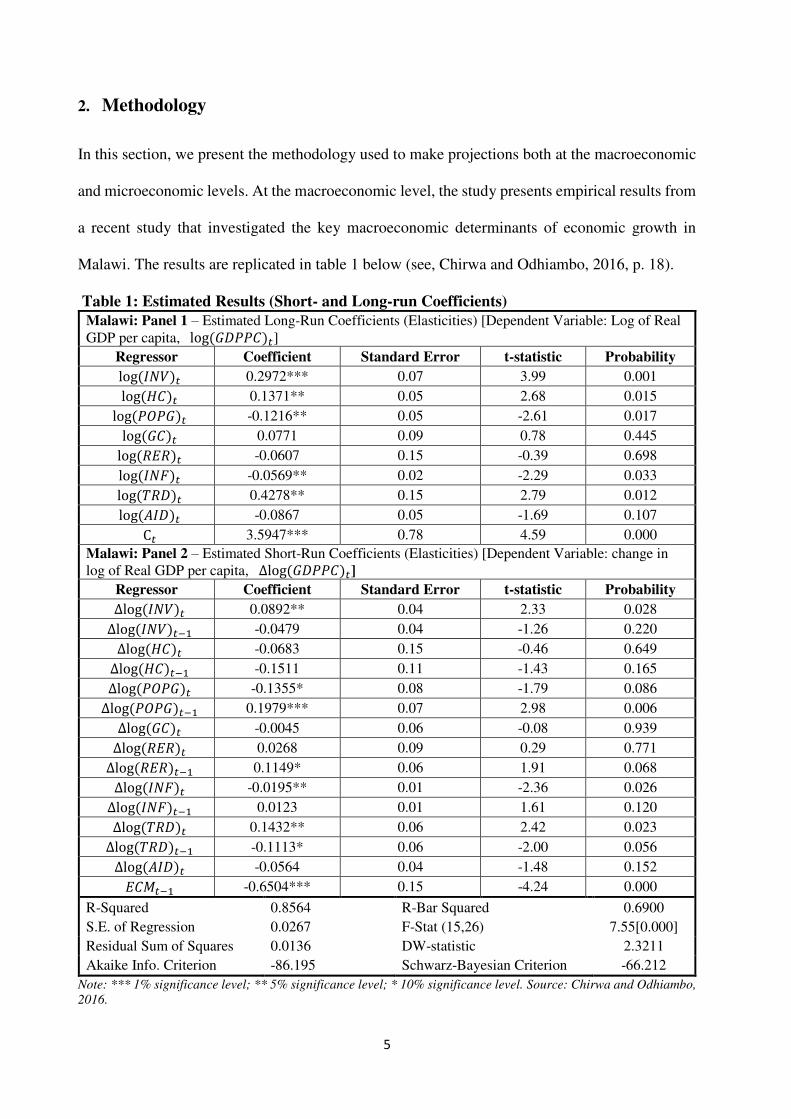
2. Methodology
In this section, we present the methodology used to make projections both at the macroeconomic
and microeconomic levels. At the macroeconomic level, the study presents empirical results from
a recent study that investigated the key macroeconomic determinants of economic growth in
Malawi. The results are replicated in table 1 below (see, Chirwa and Odhiambo, 2016, p. 18).
Table 1: Estimated Results (Short- and Long-run Coefficients) Malawi: Panel 1 – Estimated Long-Run Coefficients (Elasticities) [Dependent Variable: Log of Real GDP per capita, log (𝐺𝐷𝑃𝑃𝐶)𝑡]
Regressor Coefficient Standard Error t-statistic Probability log (𝐼𝑁𝑉)𝑡 0.2972*** 0.07 3.99 0.001 log (𝐻𝐶)𝑡 0.1371** 0.05 2.68 0.015 log (𝑃𝑂𝑃𝐺)𝑡 -0.1216** 0.05 -2.61 0.017 log (𝐺𝐶)𝑡 0.0771 0.09 0.78 0.445 log (𝑅𝐸𝑅)𝑡 -0.0607 0.15 -0.39 0.698 log (𝐼𝑁𝐹)𝑡 -0.0569** 0.02 -2.29 0.033 log (𝑇𝑅𝐷)𝑡 0.4278** 0.15 2.79 0.012 log (𝐴𝐼𝐷)𝑡 -0.0867 0.05 -1.69 0.107 C𝑡 3.5947*** 0.78 4.59 0.000
Malawi: Panel 2 – Estimated Short-Run Coefficients (Elasticities) [Dependent Variable: change in log of Real GDP per capita, ∆log (𝐺𝐷𝑃𝑃𝐶)𝑡]
Regressor Coefficient Standard Error t-statistic Probability ∆log (𝐼𝑁𝑉)𝑡 0.0892** 0.04 2.33 0.028 ∆log (𝐼𝑁𝑉)𝑡−1 -0.0479 0.04 -1.26 0.220 ∆log (𝐻𝐶)𝑡 -0.0683 0.15 -0.46 0.649 ∆log (𝐻𝐶)𝑡−1 -0.1511 0.11 -1.43 0.165 ∆log (𝑃𝑂𝑃𝐺)𝑡 -0.1355* 0.08 -1.79 0.086 ∆log (𝑃𝑂𝑃𝐺)𝑡−1 0.1979*** 0.07 2.98 0.006 ∆log (𝐺𝐶)𝑡 -0.0045 0.06 -0.08 0.939 ∆log (𝑅𝐸𝑅)𝑡 0.0268 0.09 0.29 0.771 ∆log (𝑅𝐸𝑅)𝑡−1 0.1149* 0.06 1.91 0.068 ∆log (𝐼𝑁𝐹)𝑡 -0.0195** 0.01 -2.36 0.026 ∆log (𝐼𝑁𝐹)𝑡−1 0.0123 0.01 1.61 0.120 ∆log (𝑇𝑅𝐷)𝑡 0.1432** 0.06 2.42 0.023 ∆log (𝑇𝑅𝐷)𝑡−1 -0.1113* 0.06 -2.00 0.056 ∆log (𝐴𝐼𝐷)𝑡 -0.0564 0.04 -1.48 0.152 𝐸𝐶𝑀𝑡−1 -0.6504*** 0.15 -4.24 0.000
R-Squared 0.8564 R-Bar Squared 0.6900
S.E. of Regression 0.0267 F-Stat (15,26) 7.55[0.000]
Residual Sum of Squares 0.0136 DW-statistic 2.3211
Akaike Info. Criterion -86.195 Schwarz-Bayesian Criterion -66.212
Note: *** 1% significance level; ** 5% significance level; * 10% significance level. Source: Chirwa and Odhiambo, 2016.

6
In this study, the impact of eight key macroeconomic determinants on economic growth were
investigated during the period 1970-2013 using the recently developed Autoregressive Distributed
Lag (ARDL) bounds testing approach to cointegration suggested by Pesaran et al. (2001). The
key macroeconomic determinants investigated in this study include the accumulation of physical
capital (investment); human capital development; population growth; real exchange rate
depreciation; inflation; foreign aid; and international trade. Panel 1 of table 1 presents the long-
run growth elasticity estimates on the responsiveness of a 1% change in key macroeconomic
determinants to the responsiveness of the long-run level of real GDP per capita; while panel 2
presents the respective short-run elasticities.
In general, the results show that the key macroeconomic determinants that were positively
associated with the growth of real GDP per capita in the short-run include the accumulation of
physical capital, population growth, real exchange rate depreciation, and international trade; while
inflation had a significant negative impact on real per capita GDP growth. In the long-run, the
results revealed a significant positive association between the accumulation of physical capital,
human capital development, and international trade; and a significant negative relationship
between population growth, inflation, and the long-run level of real GDP per capita. The study
results, however, revealed no significant impact between human capital development, government
consumption, foreign aid and the growth of real GDP per capita in the short-run; and no significant
impact between government consumption, real exchange rate depreciation, foreign aid and the
real GDP per capita in the long-run (Chirwa and Odhiambo, 2016).
The parameter estimates, both in the short- and long-run are of particular importance in the
measurement of inclusive growth. For instance, holding other things constant, the accumulation
of physical capital is positively associated with economic growth both in the short- and long-run.
The results show that a 1% increase in the growth of investment leads to a 0.09% increase in the

7
growth of real GDP per capita in the short-run, and the results are statistically significant at the
5% significance level. This implies that, holding other factors constant, doubling the growth of
gross fixed capital formation (100% increase) in the short-run would result in a real GDP growth
rate of 9% p.a. Similarly, a 1% increase in the accumulation of physical capital in the long-run
leads to a 0.30% increase in the level of real GDP per capita and the results are statistically
significant at the 1% significance level. This implies that, ceteris paribus, doubling gross fixed
capital formation (100% increase) in the long-run would lead to an increase in the level of real
GDP per capita by an estimated 30%. Similarly, the impact of human capital development has
long-run effects where a 1% increase in human capital development leads to a 0.14% increase in
the long-run level of real GDP per capita at the 5% significance level.
Another key determinant that is important for the Malawian economy is international trade that
exhibits a high elasticity both in the short- and long- run. In the short-run, the impact of trade
affects economic growth in the current and one-period lag, whose results are statistically
significant at the 5% and 10% significance levels, respectively. The study results show that a 1%
increase in international trade (trade ratio) increases the growth of real GDP per capita in the
current period by an estimated 0.14%, and decreases the growth of real GDP per capita by -0.11%
in the previous period. Overall, the impact of international trade on the growth of real GDP per
capita in the short-run is positive. Similarly, in the long-run, a 1% increase in international trade
leads to a 0.43% increase in the long-run level of real GDP per capita. This implies that if Malawi
has the ability to double its export base this would increase the long-run level of real GDP per
capita by approximately 43%.
Based on these empirical findings, the coefficient estimates, both short- and long-run elasticities,
can be used to make projections on poverty headcount ratios assuming inclusive growth and

8
shared prosperity. The methodology adopted for estimating the annual poverty headcount ratio
for Malawi based on US$1.25 a day is based on the following formulas:
𝑃𝑜𝑣𝑒𝑟𝑡𝑦 𝐻𝑒𝑎𝑑𝑐𝑜𝑢𝑛𝑡: 𝑝ℎ𝑐2010 = 𝑓(𝑟𝑒𝑥𝑝2010|𝑝𝑝𝑝2010 × 365𝑑𝑎𝑦𝑠, ℎℎ𝑠𝑖𝑧𝑒) (1) 𝑃𝑜𝑣𝑒𝑟𝑡𝑦 𝐻𝑒𝑎𝑑𝑐𝑜𝑢𝑛𝑡 𝐹𝑜𝑟𝑒𝑐𝑎𝑠𝑡: 𝑝ℎ𝑐𝑡 = 𝑝ℎ𝑐2010 × ∑ ∆𝑟𝑔𝑑𝑝𝑝𝑐𝑖,𝑡43
𝑖=1 (2)
In equations (1-2), 𝑝ℎ𝑐2010 represents poverty headcount in the year 2010 as the base year; 𝑟𝑒𝑥𝑝2010 represents the household-level real aggregate expenditure in the year 2010; 𝑝𝑝𝑝2010
represents the implied annual purchasing power parity conversion factor; ∆𝑟𝑔𝑑𝑝𝑝𝑐 represents the
actual/projected real GDP per capita growth rate; and ℎℎ𝑠𝑖𝑧𝑒 represents household size. Annual
poverty headcounts are projected using annual real GDP per capita growth rates required to
eliminate extreme poverty by 2030. Four the purposes of this study, the forecast period is up to
the year 2043.
The study uses data obtained from two sources, namely: The International Monetary Fund (IMF,
2015); and the Malawi Third Integrated Household Survey (IHS3) conducted in 2010-2011
(Government of Malawi, 2012). Poverty Headcount Ratios are estimated using STATA 13.1.
3. Poverty Headcount Ratio Forecasts
To illustrate how this methodology works, annual projections are made in STATA based on the
estimated growth projections of real GDP per capita obtained from the World Economic Outlook
database from the base year 2016 to 2020. The same real income growth projection is assumed to
apply for the period 2021-2043. The projected poverty headcount at less than $1.25 a day for the
study period uses the recently published implied PPP conversion factors and formulas described
in equation (1) and (2) above. According to the IMF (2015), the growth in implied PPP conversion
factors is assumed to grow at a rate of 4% p.a. during the study period.

9
There are six scenarios that are considered. The first is the base case. According to the World
Economic Outlook of October 2015, real GDP per capita growth rate is estimated to grow at an
average rate of 3% p.a. during the period 2015-2020 (International Monetary Fund, 2015). This
growth rate is further assumed to be the same during the period 2021-2043. The second case
considered is an assessment on the contribution that one of the big programs Malawi is
implementing will have on real GDP per capita. The Millennium Challenge Corporation Compact
with Malawi is expected to increase physical capital by an estimated US$257.1 million through
its infrastructure development project, representing an increase of approximately 27% in gross
fixed capital formation (Chirwa, 2016). Based on this estimate, and estimated elasticities
presented in table 1 above, real GDP per capita growth is expected to increase in the short-run by
2.41%; while in the long-run, real GDP per capita will increase by an estimated 8.03% during its
beneficiary period.
The third and fourth cases consider the impact of either doubling or tripling real GDP per capita,
respectively. The modelling assumes that these projects are expected to come online within the
study period given the nature of any investment requirements. Finally, the fifth and six cases
assume increasing real GDP per capita by 20 times (fifth case) and 40 times (sixth case) by 2043.
The last two extreme cases are aimed to examine by how much the poverty headcount ratio can
be reduced by 2030. Figures 2-7, below presents the modelled results for each scenario. The
primary vertical axis on the left represent the percentage change in the poverty headcount ratio
for households that spend less than US$1.25 a day, while the secondary vertical axis on the right
represents percentage changes of the poverty headcount ratio for household categories that spend
more than US$1.25 a day.
In figure 2, in the base case scenario, real incomes are projected to grow at a rate of 3.0% p.a. and
by 2030 real income is estimated to rise to US$522 per capita, representing an overall growth rate

10
of 2.3% during the period 2019-2043. However, based on the same growth rate of real incomes,
the poverty headcount ratio for households living on less than US$1.25 a day is expected to
worsen from an estimated 74.4% in 2015 to 87% by 2030.
Figure 2: Projected Poverty Headcount Ratios – Base Case Scenario
Source: Author Generated in STATA 13.1
For the population within the middle class (US$1.25-US$4.00) their population is expected to
decline by almost half from an estimated 23.1% in 2015 to 12.0% in the year 2030. Those who
are in the category of more than US$4.00 are also expected to decline from an average of 2.6% in
2015 to only 1.1% of the population by 2030. The analysis reveals that a projected real GDP per
capita growth rate of 3.0% p.a. is not adequate for Malawi to effectively reduce extreme poverty
by 2030, especially when the implied PPP conversion factor grows at a higher rate of 4% p.a.
during the study period.
Scenario 2 considers an increase in investment through the MCC Malawi program that is expected
to increase gross fixed capital formation by 27% in 2019. Figure 3 illustrates how the poverty
headcount ratio will be affected.
74.4%
93.9%23.1%
5.6%
2.6%
0.5%0%
5%
10%
15%
20%
25%
0%
20%
40%
60%
80%
100%
2015 2020 2025 2030 2035
<$1.25 >$1.25-4.00 >$4.00

11
Figure 3: Projected Poverty Headcount Ratios – 27% increase in Investment
Source: Author Generated in STATA 13.1
Based on the modelled results, the expected increase in gross fixed capital formation in 2019 is
expected to increase real GDP per capita by 8.03%, which represents an increase to US$539 per
capita by 2030, holding other things constant. However, this additional growth slightly increases
the annual per capita growth rate from 2.3% (base case) to 2.5% during the study period. As
illustrated in figure 3, this will result in a slight improvement on the poverty headcount ratio in all
categories. The poverty headcount ratio for extreme poverty is expected to reduce by 1% in 2030
to 86% compared to the base case.
Figure 4 illustrates poverty headcount projections based on the premise that real incomes will
double by the year 2043. Real incomes per capita are expected to increase from US$446 per capita
in 2023 to US$892 per capita by 2043, representing an annual growth rate of 3.5% p.a. This
implies that by 2030, real incomes are expected to increase to US$602 per capita.
74.4%
93.6%
23.1%
5.9%
2.6%
0.6%
0%
5%
10%
15%
20%
25%
0%
20%
40%
60%
80%
100%
2015 2020 2025 2030 2035
<$1.25 >$1.25-4.00 >$4.00

12
Figure 4: Projected Poverty Headcount Ratios – Double Real Incomes per Capita by 2043
Source: Author Generated in STATA 13.1
As illustrated in figure 4, doubling real incomes by 2043 does not lead to a significant
improvement in the poverty headcount ratio though it declines to 84.3% compared to the base
case. As such, the assumed increase in real incomes does not address the aspirations of the United
Nations post-2015 Sustainable Development Goals of eliminating extreme poverty by 2030.
In the fourth scenario (figure 5), real incomes are assumed to triple from US$446 in 2023 to
US$1,337 by 2043. In this scenario, the annual increase in real incomes is projected to grow at a
rate of 5.3% p.a. At this assumed growth rate, extreme poverty can be reduced further to 77.5%
in 2030 compared to the base case and slightly above the projected value of 74.4% in 2015. The
figure also illustrates that the middle class benefits more if real incomes would triple during the
study period.
74.4%
92.4%
23.1%
7.0%
2.6%
0.6%
0%
5%
10%
15%
20%
25%
0%
20%
40%
60%
80%
100%
2015 2020 2025 2030 2035
<$1.25 >$1.25-4.00 >$4.00

13
Figure 5: Projected Poverty Headcount Ratios – Triple Real Income per Capita by 2043
Source: Author Generated in STATA 13.1
Figures 6 and 7 below the expected growth projections that would effectively eliminate extreme
poverty in Malawi. In figure 6, real incomes are assumed to increase twentyfold from US$446 in
2023 to US$9,360 per capita by 2043.
Figure 6: Projected Poverty Headcount Ratios – 20x Real Income per Capita by 2043
Source: Author Generated in STATA 13.1
74.4%
88.3%
23.1%
10.7%
2.6%
1.0% 0%
5%
10%
15%
20%
25%
0%
20%
40%
60%
80%
100%
2015 2020 2025 2030 2035
<$1.25 >$1.25-4.00 >$4.00
74.4%
23.1%
23.1%
58.8%
2.6%
18.1%
0%
10%
20%
30%
40%
50%
60%
70%
0%
20%
40%
60%
80%
100%
2015 2020 2025 2030 2035
<$1.25 >$1.25-4.00 >$4.00

14
As illustrated in figure 6, significant increases in real income per capita are expected to effectively
reduce extreme poverty. The results reveal that such an increase in real incomes can reduce
extreme poverty to as low as 10.1% by 2030. The results also show that the middle class increases
significantly from an estimated 23.1% in 2015 to an estimated 57% in 2030. The population that
lives on more than US$4.00 a day also improves significantly from an estimated 2.6% in 2015 to
as high as 33% by 2030.
Finally, figure 7 illustrates by how much real incomes are expected to increase in order to meet
the UN SDG goal of eliminating extreme poverty by 2030. The expected increase in real incomes
of fortyfold by 2043 assumes an increase in real incomes from an average US$446 in 2023 to
US$18,275 per capita by the year 2043. This implies an assumed real income growth rate of 21.2%
p.a. during the study period.
Figure 7: Projected Poverty Headcount Ratios – 40x Real GDP per Capita by 2043
Source: Author Generated in STATA 13.1
As illustrated in figure 7, extreme poverty reduces to approximately 1% of the population by 2030,
meeting the aspirations of the UN SGDs. The projections also show that with a 40 times increase
74.4%
4.5%
23.1%
49.4%
2.6%
46.2%
0%
10%
20%
30%
40%
50%
60%
70%
0%
20%
40%
60%
80%
100%
2015 2020 2025 2030 2035
<$1.25 >$1.25-4.00 >$4.00

15
in real GDP per capita, there will be more middle and high income households by 2030 estimated
as 33% and 66%, respectively. The main conclusion from the analysis in this section reveals that
Malawi needs to first move swiftly from a low income/developing economy to a high
income/developed economy if extreme poverty is to be eliminated effectively. In the next section,
the financial implications of such a mammoth task are estimated at the macroeconomic level.
4. Implications for Malawi and the Global Community
The previous section has illustrated that the base and sustainable strategy for Malawi to eliminate
extreme poverty is by raising real incomes of Malawians by fortyfold. However, for real incomes
to increase sustainably some key drivers that contribute significantly to economic growth have to
be promoted during the study period. The empirical growth results presented in table 1 highlight
the possible solutions that Malawi can take. In 2013, Malawi recorded a gross fixed capital
formation estimated as US$951.6 million, representing 22% investment share in real GDP per
capita at 2005 constant US dollar prices. At the same time, exports of goods and services recorded
in 2013 were estimated at US$2.0 billion, representing 46.3% of real GDP (World Bank, 2015b).
Table 2 highlights the possible estimated financial projections required for Malawi to eliminate
extreme poverty. The forecasts for the possible growth scenarios that can be adopted in Malawi
uses the estimated elasticities of investment and trade given in table 1. The emphasis is on the key
macroeconomic determinants that are positively associated with real GDP per capita and exhibit
a high return, which include investment and international trade.

16
Table 2: Projected Real GDP per capita growth rates
Investment
Contribution (%)
Investment Elasticities
Description Required
Investments in Physical Capital
Trade Contribution (%) Trade
Elasticities
Required Investments in
Trade (Exports)
Total Contribution
Scenario 2 27% 0.09 short-run 2.41 0.03 - 2.41 0.30 long-run 8.03 0.43 - 8.03
Accumulated increase in Investment $1,208,706,889 Accumulated increase in Exports $2,003,373,224 Net increase in Investment $257,100,000 Net Increase in Exports - $257,100,000
Scenario 3 189% 0.09 short-run 16.87 103% 0.03 3.29 20.16
0.30 long-run 56.21 0.43 44.08 100.28
Accumulated increase in Investment $2,751,306,889 Accumulated increase in Exports $3,597,393,224
Net increase in Investment $1,799,700,000 Net Increase in Exports $1,594,020,000 $3,393,720,000
Scenario 4 405% 0.09 short-run 36.15 186% 0.03 5.94 42.09
0.30 long-run 120.44 0.43 79.62 200.06
Accumulated increase in Investment $4,808,106,889 Accumulated increase in Exports $4,882,893,224
Net increase in Investment $3,856,500,000 Net Increase in Exports $2,879,520,000 $6,736,020,000
Scenario 5 3570% 0.09 short-run 318.48 2195% 0.03 70.03 388.50
0.30 long-run 1,061.11 0.43 939.09 2,000.20
Accumulated increase in Investment $34,927,371,889 Accumulated increase in Exports $35,966,283,224
Net increase in Investment $33,975,765,000 Net Increase in Exports $33,962,910,000 $67,938,675,000
Scenario 6 7146% 0.09 short-run 637.43 4387% 0.03 139.95 777.38
0.30 long-run 2,123.83 0.43 1,876.76 4,000.59
Accumulated increase in Investment $68,954,556,889 Accumulated increase in Exports $69,877,773,224
Net increase in Investment $68,002,950,000 Net Increase in Exports $67,874,400,000 $135,877,350,000
Source: Author calculations based on investment and trade elasticities from table 1.

17
As illustrated in table 2, scenario 2 reveals the impact of the Millennium Challenge Compact with
Malawi that aims to add US$257.1 million of gross fixed capital in 2019. This is estimated to add
to gross fixed capital investment approximately 27%. From table 1, given that a 1% increase in
investment is expected to raise real GDP growth in the short-run by an estimated 0.09%, the
overall contribution of a 27% increase in gross fixed capital formation is expected to increase real
GDP per capita growth in the short-run by an estimated 2.41%. Similarly, in the long-run, a 1%
increase in investment will increase real GDP per capita by an estimated 0.30%. Thus, a 27%
increase in investment through the implementation of the MCC program with Malawi is expected
to increase real GDP per capita by 8.03%. As illustrated in figure 3 above, such an investment
alone is expected to have a minimal impact on reducing the poverty headcount ratio, unless more
programs of this magnitude are implemented. Given the simulation in figure 2, a 27% increase in
gross fixed capital formation will only reduce extreme poverty from 87% (base case) to 86% by
2030.
Scenarios 3 to 6 provide financial projections for cases discussed in figures 4-7. Since these are
programs that are simulated, for Malawi to meet the 2030 UN Sustainable Development Goals,
these programs should be implemented at the earliest by 2024. As illustrated in table 2, for Malawi
to double real GDP per capita from US$446 to US$892 by 2043, Malawi needs to invest a total
of US$3.4 billion by 2024. This includes increasing gross fixed capital formation by an estimated
189% of real GDP and approximately 103% increase in exports. As illustrated in figure 4,
doubling real GDP per capita will reduce extreme poverty from 87% (base case) to 84.3% by
2030. This implies an annual growth in real GDP per capita of 3.6% p.a. during the period 2019-
2043. However, this is short of the assumed growth rate in implied PPP conversion factor of 4%
p.a., implying that even if real incomes were to double, extreme poverty in Malawi will still
increase from an average of 74.4% in 2015 to 84.3% by 2030.

18
On the other hand, for real GDP per capita to be tripled from an estimated US$446 in 2023 to
US$1,337 by 2043, representing an annual real GDP growth rate of 5.3% p.a., Malawi needs to
invest approximately US$6.74 billion by 2024. If Malawi can invest approximately US$3.9 billion
in increasing gross fixed capital formation and increase exports by an estimated US$2.9 billion,
extreme poverty can be reduced from 87% (base case) to 77.5% by 2030. This implies that Malawi
should increase its gross fixed capital formation by an estimated 405% of the estimated share in
2013 and approximately 186% increase in exports by 2024. What is also important to note at this
level is that given an assumed implied PPP conversion factor growth rate of 4% p.a., meaningful
increases in real incomes per annum should not be less than 5.5% p.a. to effectively reduce
extreme poverty.
The previous analysis clearly indicates that significant financial resources are required for Malawi
to eliminate extreme poverty by 2030. In scenarios 5 and 6, financial projections are made for
cases where Malawi is expected to eliminate extreme poverty by 2030. In scenario 5, a case is
assumed where real GDP per capita increases twentyfold moving from US$446 in 2023 to
US$9,360 by 2043. This represents an annual real GDP growth rate of 15.5% p.a. during the study
period. As illustrated in figure 6 above, such a development is expected to reduce extreme poverty
from an estimated 87% to 10.1% in 2030. However, this implies that Malawi needs to invest
approximately US$67.94 billion during the study period, which may include increasing gross
fixed capital formation by an estimated 3570% and approximately 2195% increase in exports
during the study period.
Finally, if Malawi is to eliminate extreme poverty by 2030, scenario 6 shows that this is only
possible if real GDP per capita increases fortyfold from US$446 in 2023 to US$18,275 by 2043.
This represents an annual increase in real GDP per capita at a rate of 21.2% p.a. during the study
period. As illustrated in figure 7, the estimated extreme poverty in 2030 reduces to 1% of the total

19
population. The implications of such as drastic reduction in extreme poverty entails that Malawi
needs to invest an estimated US$135.9 billion by 2024. This entails increasing gross fixed capital
formation by 7146% and an increase in exports by 4387% during the study period.
5. Challenges Facing Malawi
It is apparent from the previous discussion that Malawi cannot eliminate extreme poverty by 2030,
unless significant investments are made to increase real GDP per capita in the long-run. The
analysis also reveals that the threshold for the growth of real GDP per capita in Malawi is expected
to be not less than 6.0% p.a. if meaningful reduction in extreme poverty is to be achieved. In fact,
the results reveal that for Malawi to eliminate extreme poverty by 2030, real GDP per capita in
the long-run is expected to grow at an annual average rate of 21.2% p.a. during the study period.
We identify three challenges that need to be address for Malawi to achieve the post-2015 SDGs
of eliminating extreme poverty.
The first challenge that Malawi is expected to face is how and where to find significant resources
for investing in gross fixed capital formation and export promotion. As illustrated in this paper,
Malawi will need to increase significantly its gross fixed capital formation and export base if
extreme poverty is to be eliminated during the study period and especially by 2030. However,
Malawi cannot on its own meet these requirements and the likelihood of achieving this during the
post-2015 SDG period is highly unlikely; unless the assistance of the global community comes in
strongly especially bilateral relations with developed countries and multilateral institutions such
as the World Bank and the International Monetary Fund are made in order to inject a considerable
amount of the financial resources required.
Second, while the accumulation of gross fixed capital formation and export base is critical to
achieve the desired objective of eliminating extreme poverty by 2030, factors that affect the
efficiency of investment should also be considered by policymakers in Malawi at the

20
macroeconomic level. The evidence from Chirwa and Odhiambo (2016) suggest the need for
policymakers to ensure macroeconomic stability (low inflation), checking population growth, and
ensuring quality-based human capital development. These factors were found to have a negative
impact on real GDP per capita growth during the period, 1970-2013 in Malawi.
The third challenge that we envisage is for policymakers in Malawi to ensure inclusive growth
and shared prosperity. The simulations used to make projections on the poverty headcount
assumed these properties. The results show that if growth can be inclusive, the likelihood of
moving the population out of extreme poverty from low- to middle- or high-income levels is
possible. Furthermore, inclusive growth requires that a strong focus on investing in productive
investment and labour-intensive technologies should be at the centre of the Malawi government’s
economic strategy and the accumulation of labour-intensive gross fixed capital formation is
crucial for poor countries like Malawi. However, the means of implementation promulgated in
the 2030 agenda for SDGs does not provide concrete strategies on how this can be achieved by
poor economies that fail to attract the needed capital for their economies to grow during the post-
2015 Sustainable Development Goals (SDGs) period. It is, therefore, recommended that this
should be reviewed and discussed how this can be achieved.
6. Conclusion
In this paper, we have examined the financial implications for Malawi if extreme poverty is to be
eradicated by 2030 as stipulated by the post-2015 Sustainable Development Goals agenda. The
study employed a two-pronged approach where first, the key macroeconomic determinants that
are positively and significantly associated with economic growth are identified; and then their
coefficient estimates used to forecast financial projections required to reduce extreme poverty by
2030 using household-level data.

21
The results show that in order for Malawi to eliminate extreme poverty levels of less than $1.25
a day by 2030, real GDP per capita is expected to grow at an annual rate of at least 21.2% p.a.
within the SDG period. Based on the key determinants of growth, this will require Malawi to
significantly increase financial investments in accumulating physical capital and increasing
exports during the post-2015 SDGs period. These resources cannot be generated internally and
Malawi will need to create economic incentives that attract significant financial support from the
global community. This might mean significantly changing its development agenda towards more
of private sector development as the only key source that can generate meaningful employment
to get most of its citizens out of poverty.
References
Chirwa, T. G., and N. M. Odhiambo. 2016. “The Drivers of Real Sector Growth in Malawi: An
empirical investigation.” Journal of Applied Economic Sciences, Vol. 11, No. 6(44), pp.
1157-1169.
Chirwa, T. G. 2016. “Electricity Revenue and Tariff Growth in Malawi.” International Journal
of Energy Economics and Policy, Vol. 6, No. 2, pp. 183-194, April
Government of Malawi. 2012. Integrated Household Survey 2010-2011: Household socio-
economic characteristics report. National Statistics Office: Zomba, September.
International Monetary Fund. 2015. World Economic Outlook Database, Retrieved from
www.imf.org on January 1, 2016
Pesaran, M. H., Y. Shin and R. J. Smith. 2001. “Bounds Testing Approaches to the Analysis of
Level Relationships”. Journal of Applied Econometrics, Vol. 16, No. 3, pp. 289-326.

22
The President of the General Assembly. 2015. Transforming our World: The 2030 agenda for
sustainable development. Retrieved from www.un.org on January 1, 2016.
World Bank. 2015a. Poverty and Equity Database 2015. Retrieved from www.worldbank.org on
January 1, 2016.
World Bank. 2015b. World Development Indicators 2015. Retrieved from www.worldbank.org
on May 5, 2015.

23
Annex 1: Country Statistics – Per Capita Income and Poverty Headcount
Country Code Real GDP per capita (2014)
Poverty Headcount Ratio - % (US$1.90)
Madagascar MDG $271 82
Malawi MWI $274 71
Niger NER $293 50
Ethiopia ETH $315 34
Uganda UGA $434 13
Mozambique MOZ $439 69
Rwanda RWA $446 60
Burkina Faso BFA $526 55
Tanzania TZA $601 47
Kenya KEN $659 34
Bangladesh BGD $748 44
Ghana GHA $765 25
Lesotho LSO $974 60
Zambia ZMB $1,033 64
Nigeria NGA $1,098 53
India IND $1,235 21
Georgia GEO $2,254 11
Swaziland SWZ $2,519 42
Angola AGO $2,521 30
Thailand THA $3,426 0
China CHN $3,866 11
Namibia NAM $4,571 23
Brazil BRA $5,853 5
South Africa ZAF $6,086 17
Romania ROM $6,196 -
Botswana BWA $7,096 18
Mauritius MUS $7,117 1
Malaysia MYS $7,374 0
Argentina ARG $7,738 2
Mexico MEX $8,517 3
Turkey TUR $8,861 1
Chile CHL $9,854 1
Croatia HRV $10,561 1
Poland POL $11,305 0
Seychelles SYC $15,592 0
Saudi Arabia SAU $16,944 -
Portugal PRT $18,300 -
Greece GRC $18,377 -
Brunei Darussalam BRN $25,490 -
France FRA $35,667 -
Japan JPN $37,595 -

24
Country Code Real GDP per capita (2014)
Poverty Headcount Ratio - % (US$1.90)
Australia AUS $37,828 -
Belgium BEL $37,857 -
Singapore SGP $38,088 -
Canada CAN $38,293 -
Finland FIN $38,837 -
Germany DEU $39,718 -
United Kingdom GBR $40,968 -
Austria AUT $41,077 -
Netherlands NLD $43,141 -
Sweden SWE $46,061 -
United States USA $46,405 -
Denmark DNK $47,547 -
Switzerland CHE $58,997 -
Iceland ISL $59,693 -
Norway NOR $67,246 -
Luxembourg LUX $79,511 -
Source: World Bank, 2015a, 2015b


![SUSTAINABLE DEVELOPMENT GOALS - Dhyeya IAS...Sustainable Development Goals | 1 | SUSTAINABLE DEVELOPMENT GOALS SDG-1 2030 rd y{; 1 ds fy, oSf'od y{; fuEukuqlkj gSa& 1-1 2030 rd] gj](https://img.pdfslide.us/doc/110x75/5f2bab4a456b3b39b125c022/sustainable-development-goals-dhyeya-ias-sustainable-development-goals-1.jpg)