Embed Size (px)
Citation preview
Results from Baseline Household survey
1. Socio-demographic profile
The vulnerability status of the population at the V2R project areas was assessed during generic
assessment to identify the target audience. The project area targets the poor more vulnerable
population in terms of natural disaster and health risks. 500 sample households were assessed for the
baseline assessment from the targeted project areas on age and sex distribution, education and
employment level to understand their socio-demographic characteristics.
In the survey, 96% of the head of the household were male and only 4% of the head of the household
were female. Majority (44%) of the head of household were over 45 years of age. 28% of the
household were between 25-35 years of age, 27% of the household were between 35-45% of age and
only 1% of the household were under 25 years old in age.
98% of the sample household had been living in the area for over 5 years. Less than 1% of the
household have resided in the area for under 1 year period. Majority of the household (74%) have 2 to
5 family members. Less than 25% of the sample had 5-10 members in the family. 58% of the
household did not have any under 5 years old children. 39% of the sample had one child under 5 of
age and 2.8% of them had two children under 5 years of age in the household.
All sample households (100%) were found to be in a village area and majority (84.6%) of the
household had a clean environment. House and land ownership were taken into account for asset
assessment. 39% of the household were found to own a house as well as a land. About 25% of
household owned a house and had a land to farm on, and 21% of household had only a house as an
asset.
Majority (50.4%) of the head of the household had primary school level education. About 17% of
them had secondary school level education. Only 4% of them had higher education, compared to
27.4% who had no education at all.
Majority of the household (26%) were daily wage earner. About 24% of them were fisherman and
14% were farmers. 16% of them were self-employed. Only 6.8% of them were full time paid workers.
Rest were seasonal workers and contractual workers.

4. Hygiene status
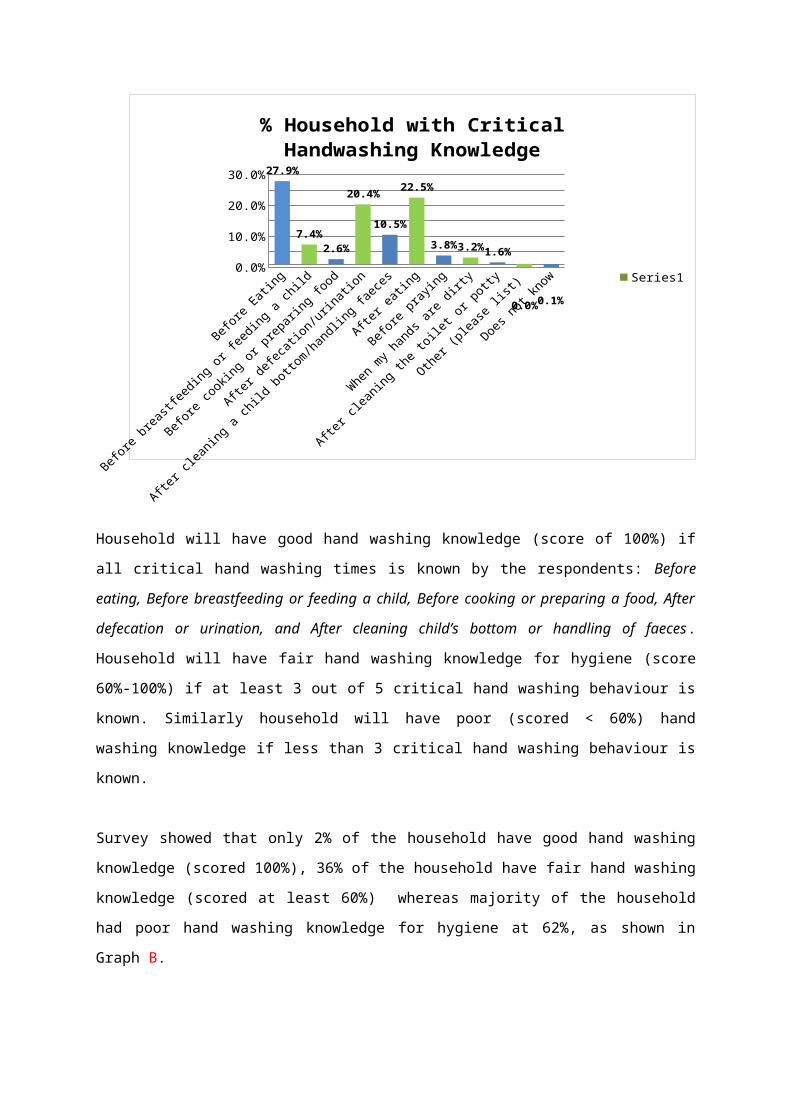
Personal hygiene practices among the women respondents in the survey were found to be very poor.
Minority of respondents perceived most important hand washing practices as critical, as shown in
Graph A. Hand washing before eating (27.9%), after eating (22.5%) and after defecation or urination
(20.4%) was the most common perceived critical hand washing practices among the respondents. In
contrast, only 7.4% respondents perceived hand washing was to be critical before breast feeding or
feeding a child. Similarly hand washing was perceived to be critical before cooking or preparing a
food; and after cleaning a child bottom or handling faeces by 2.6% and 10.5% of the respondents
respectively.
Graph A
Before
Eating
Before
breastf
eeding o
r feed
ing a ch
ild
Before
cooking o
r prep
aring f
ood
After defe
cation/u
rinati
on
After cle
aning a
child
bottom/handlin
g fae
ces
After eati
ng
Before
praying
When m
y han
ds are
dirty
After cle
aning t
he toilet
or potty
Other (plea
se list
)
Does not k
now0.0%
5.0%
10.0%
15.0%
20.0%
25.0%
30.0% 27.9%
7.4%
2.6%
20.4%
10.5%
22.5%
3.8% 3.2%1.6%
0.0% 0.1%
% Household with Critical Handwashing Knowledge
Series1
Household will have good hand washing knowledge (score of 100%) if all critical hand washing times
is known by the respondents: Before eating, Before breastfeeding or feeding a child, Before cooking
or preparing a food, After defecation or urination, and After cleaning child’s bottom or handling of
faeces. Household will have fair hand washing knowledge for hygiene (score 60%-100%) if at least 3

out of 5 critical hand washing behaviour is known. Similarly household will have poor (scored <
60%) hand washing knowledge if less than 3 critical hand washing behaviour is known.
Survey showed that only 2% of the household have good hand washing knowledge (scored 100%),
36% of the household have fair hand washing knowledge (scored at least 60%) whereas majority of
the household had poor hand washing knowledge for hygiene at 62%, as shown in Graph B.
Graph B
% HH with good HW knowledge (score
100%)
%HH with fair HW knowledge (score at
least 60%)
%HH with poor HW knowledge (score
<60%)
0%5%
10%15%20%25%30%35%40%45%50%55%60%65%70%
2%
36%
62%
% Household by Level of Critical Handwashing Knowledge
Knowledge level of critical handwashing
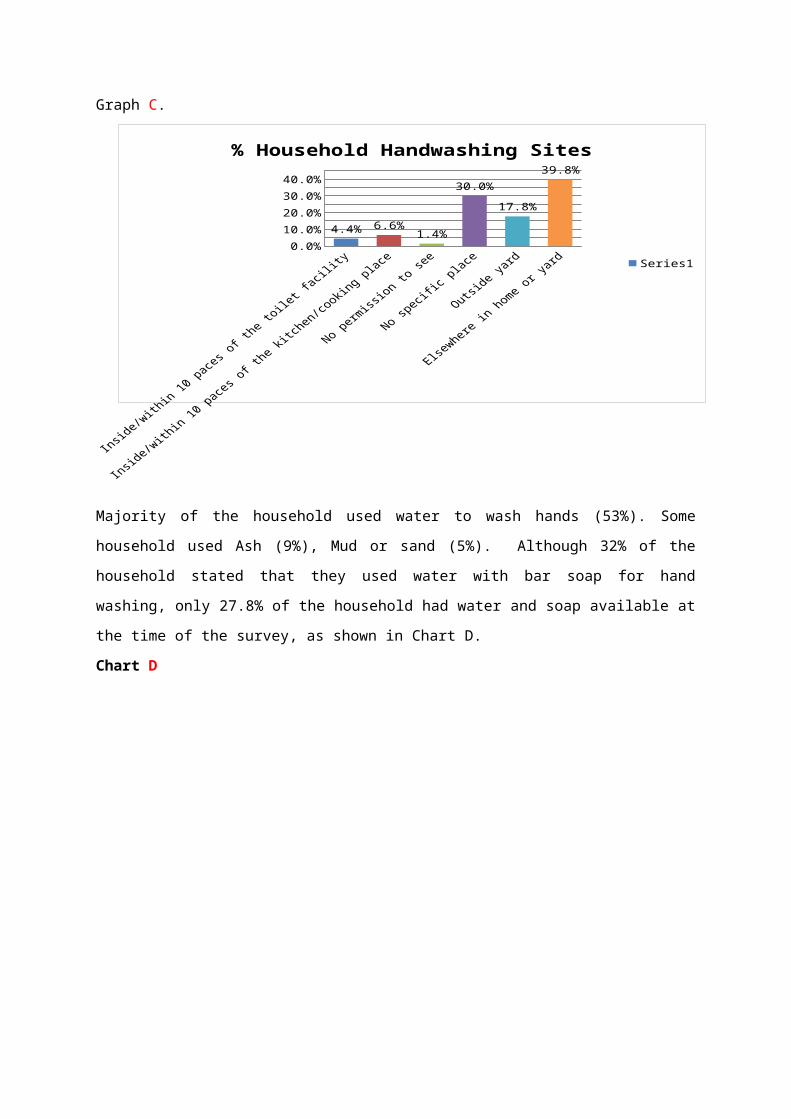
It was found that only 11% of the sampled household washed hands near their latrine or kitchen: 4.4%
of household washed hand inside or within 10 paces of the toilet facility and 6.6% of the household
washed hands inside or within 10 paces of the kitchen and cooking place. 39.8% of household washed
hands elsewhere in house or yard. Most of the household (30%) had no specific hand washing site
while 17.8% of them had to go outside the yard to wash hands, as shown in Graph C.
Graph C.
Inside/w
ithin 10 pace
s of th
e toile
t facili
ty
Inside/w
ithin 10 pace
s of th
e kitc
hen/co
oking p
lace
No permiss
ion to se
e
No speci
fic plac
e
Outside y
ard
Elsew
here in
home or y
ard0.0%
10.0%
20.0%
30.0%
40.0%
4.4% 6.6%1.4%
30.0%
17.8%
39.8%
% Household Handwashing Sites
Series1
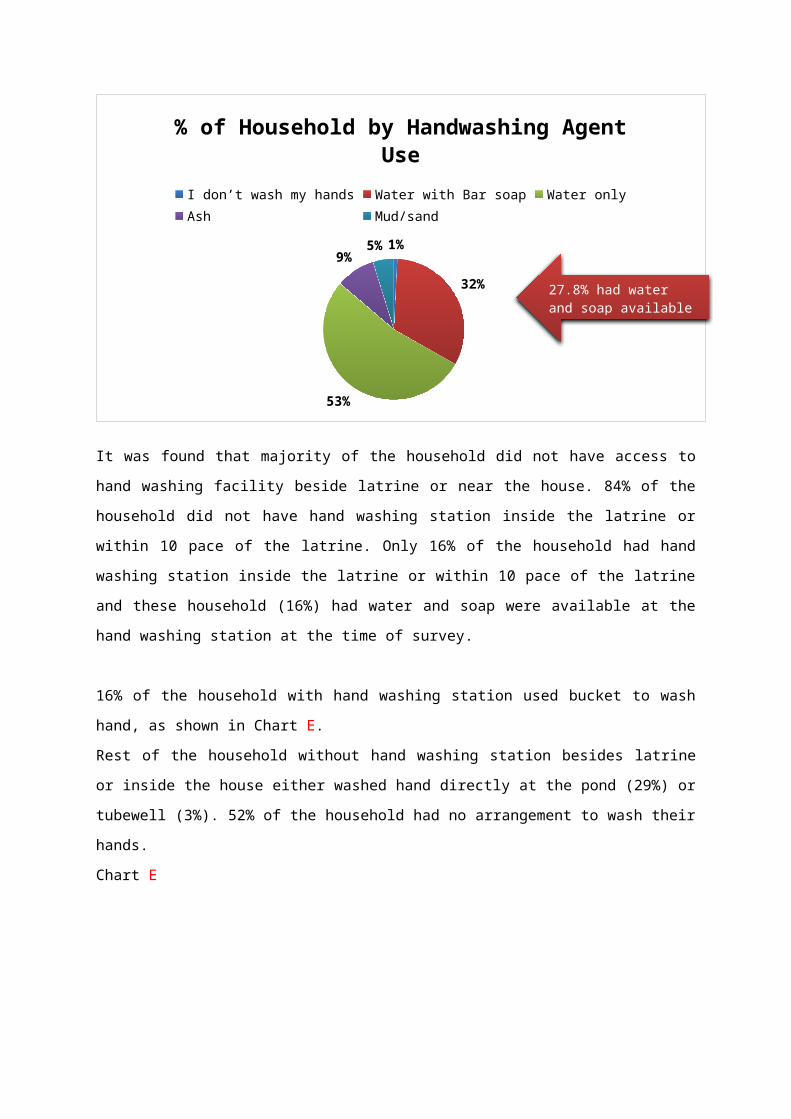
Majority of the household used water to wash hands (53%). Some household used Ash (9%), Mud or
sand (5%). Although 32% of the household stated that they used water with bar soap for hand
washing, only 27.8% of the household had water and soap available at the time of the survey, as
shown in Chart D.
Chart D
1%
32%
53%
9%5%
% of Household by Handwashing Agent UseI don’t wash my hands Water with Bar soap Water onlyAsh Mud/sand
27.8% had water and soap available

It was found that majority of the household did not have access to hand washing facility beside latrine
or near the house. 84% of the household did not have hand washing station inside the latrine or within
10 pace of the latrine. Only 16% of the household had hand washing station inside the latrine or
within 10 pace of the latrine and these household (16%) had water and soap were available at the hand
washing station at the time of survey.
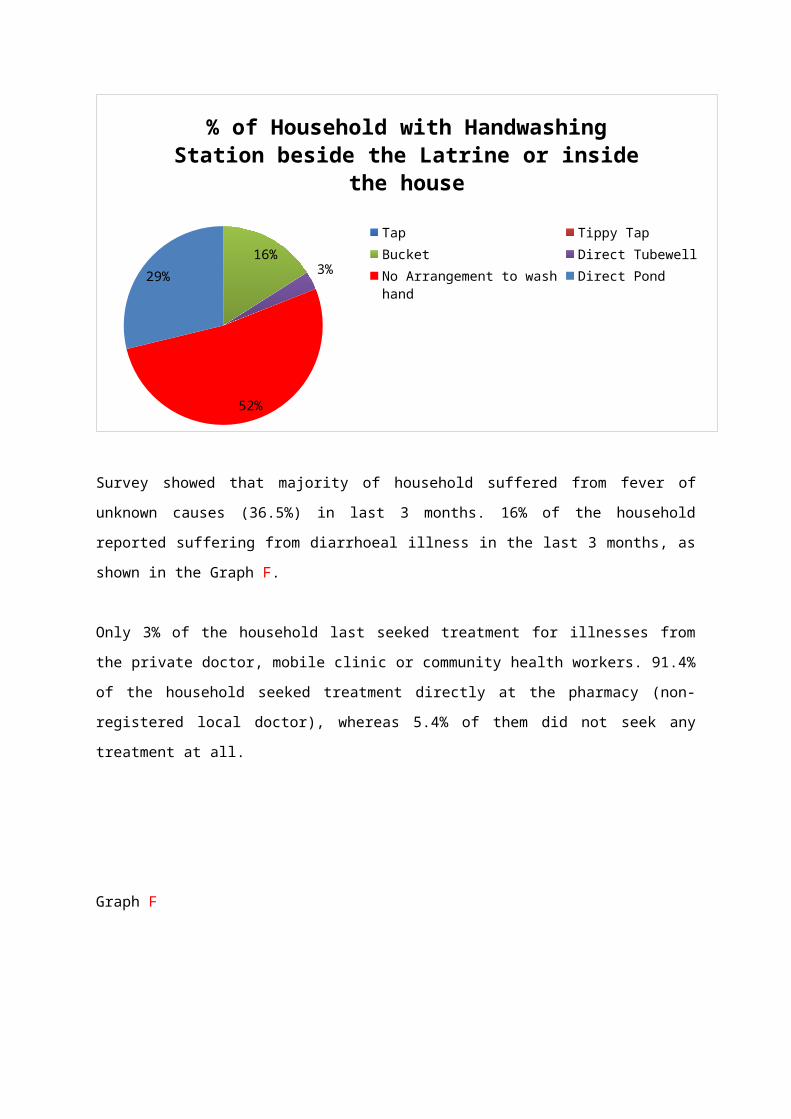
16% of the household with hand washing station used bucket to wash hand, as shown in Chart E.
Rest of the household without hand washing station besides latrine or inside the house either washed
hand directly at the pond (29%) or tubewell (3%). 52% of the household had no arrangement to wash
their hands.
Chart E
16%
3%
52%
29%
% of Household with Handwashing Station beside the Latrine or inside the house
TapTippy TapBucketDirect Tubewell No Arrangement to wash handDirect Pond
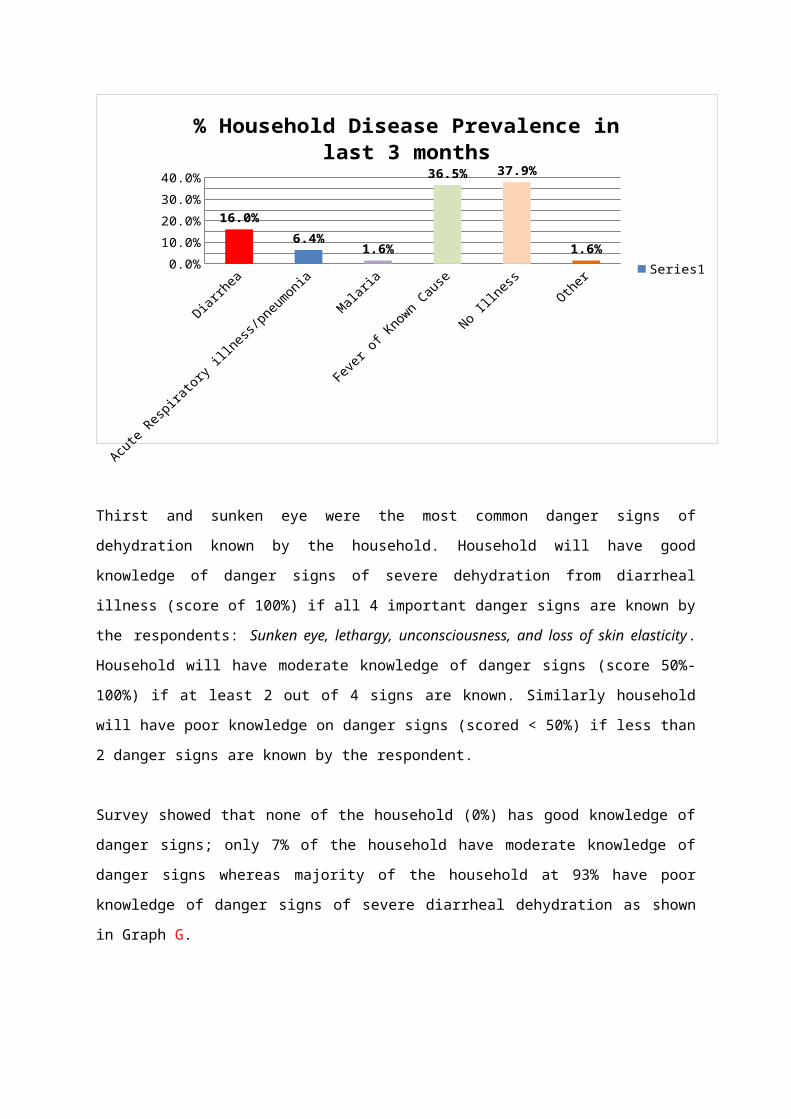
Survey showed that majority of household suffered from fever of unknown causes (36.5%) in last 3
months. 16% of the household reported suffering from diarrhoeal illness in the last 3 months, as
shown in the Graph F.
Only 3% of the household last seeked treatment for illnesses from the private doctor, mobile clinic or
community health workers. 91.4% of the household seeked treatment directly at the pharmacy (non-
registered local doctor), whereas 5.4% of them did not seek any treatment at all.
Graph F
Diarrh
ea
Acute Resp
iratory
illness
/pneu
monia
Malaria
Fever
of Known Cau
se
No Illness
Other0.0%5.0%
10.0%15.0%20.0%25.0%30.0%35.0%40.0%
16.0%
6.4%1.6%
36.5% 37.9%
1.6%
% Household Disease Prevalence in last 3 months
Series1
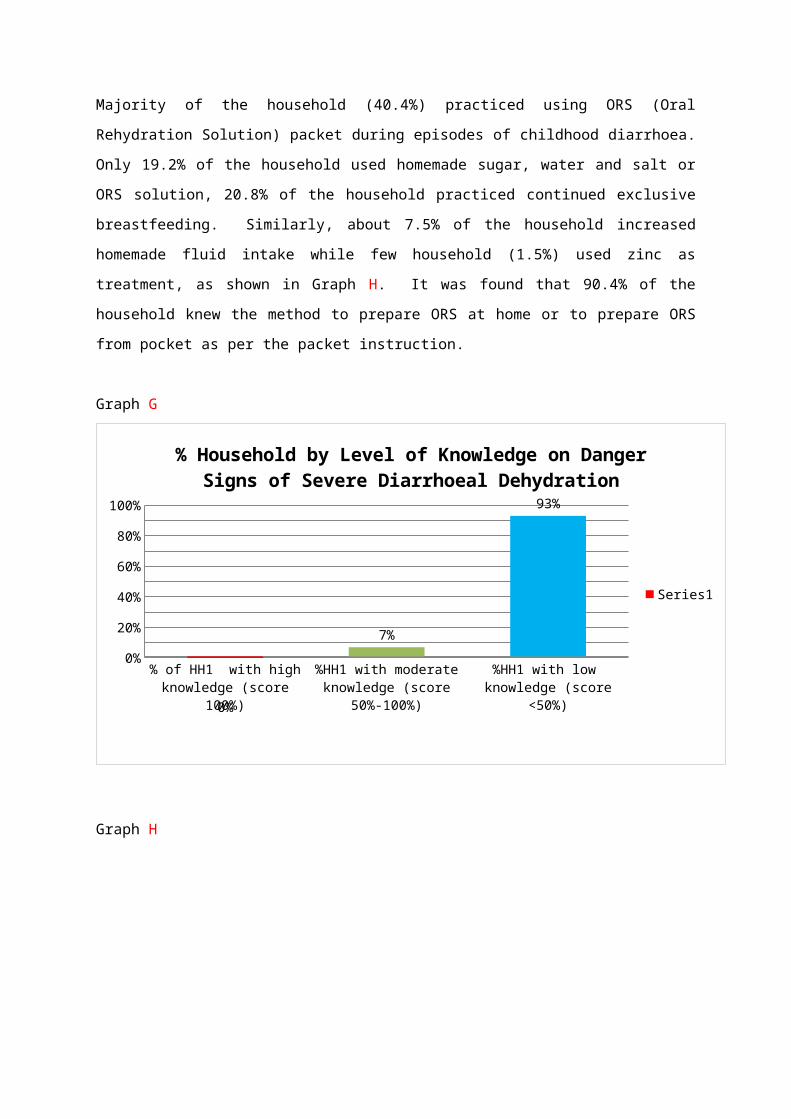
Thirst and sunken eye were the most common danger signs of dehydration known by the household.
Household will have good knowledge of danger signs of severe dehydration from diarrheal illness
(score of 100%) if all 4 important danger signs are known by the respondents: Sunken eye, lethargy,
unconsciousness, and loss of skin elasticity. Household will have moderate knowledge of danger signs
(score 50%-100%) if at least 2 out of 4 signs are known. Similarly household will have poor
knowledge on danger signs (scored < 50%) if less than 2 danger signs are known by the respondent.
Survey showed that none of the household (0%) has good knowledge of danger signs; only 7% of the
household have moderate knowledge of danger signs whereas majority of the household at 93% have
poor knowledge of danger signs of severe diarrheal dehydration as shown in Graph G.
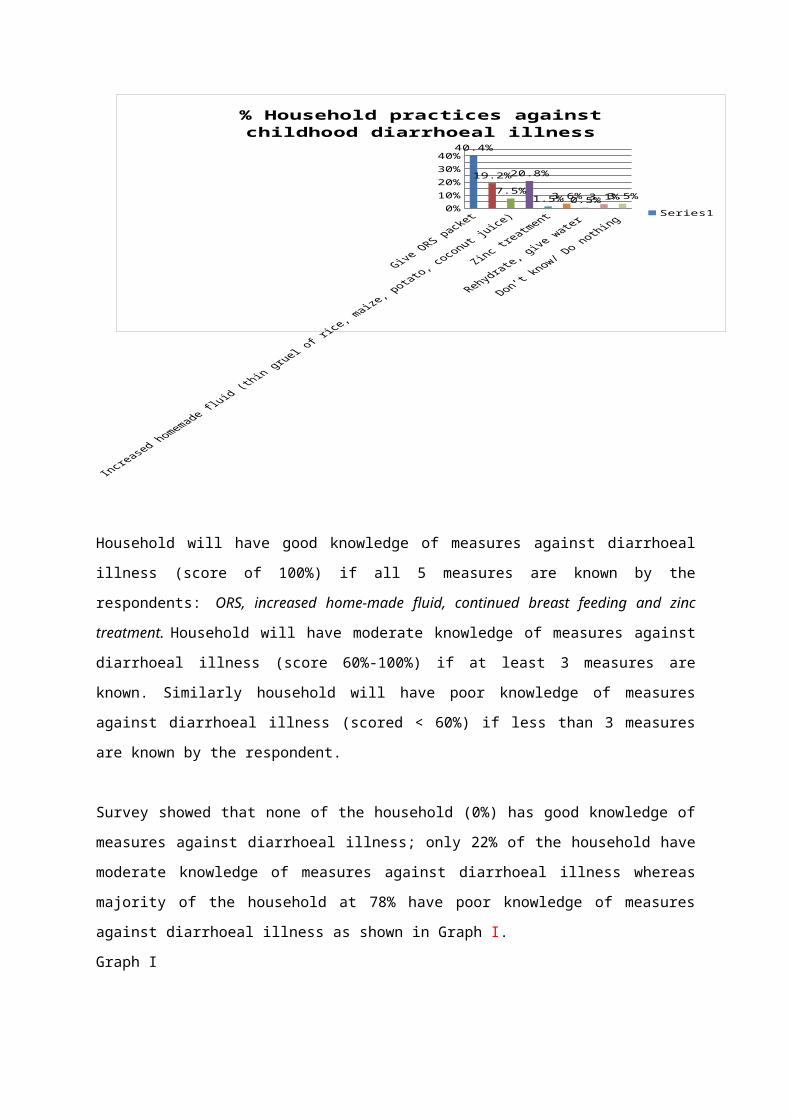
Majority of the household (40.4%) practiced using ORS (Oral Rehydration Solution) packet during
episodes of childhood diarrhoea. Only 19.2% of the household used homemade sugar, water and salt
or ORS solution, 20.8% of the household practiced continued exclusive breastfeeding. Similarly,
about 7.5% of the household increased homemade fluid intake while few household (1.5%) used zinc
as treatment, as shown in Graph H. It was found that 90.4% of the household knew the method to
prepare ORS at home or to prepare ORS from pocket as per the packet instruction.
Graph G
% of HH1 with high knowledge (score 100%)
%HH1 with moderate knowledge (score 50%-
100%)
%HH1 with low knowledge (score <50%)
0%
10%
20%
30%
40%
50%
60%
70%
80%
90%
100%
0%
7%
93%
% Household by Level of Knowledge on Danger Signs of Severe Diarrhoeal Dehydration
Series1
Graph H
0%
10%
20%
30%
40%40.4%
19.2%
7.5%
20.8%
1.5% 3.6% 0.5% 3.1% 3.5%
% Household practices against childhood diarrhoeal illness
Series1
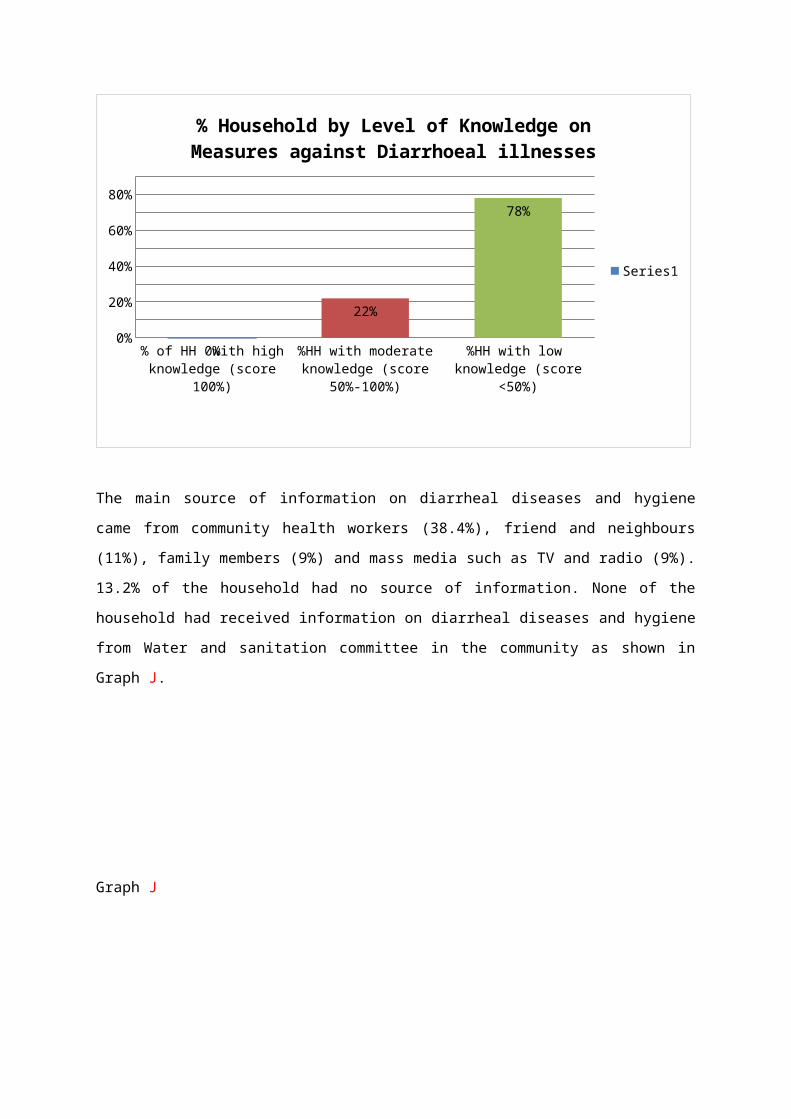
Household will have good knowledge of measures against diarrhoeal illness (score of 100%) if all 5
measures are known by the respondents: ORS, increased home-made fluid, continued breast feeding
and zinc treatment. Household will have moderate knowledge of measures against diarrhoeal illness
(score 60%-100%) if at least 3 measures are known. Similarly household will have poor knowledge of
measures against diarrhoeal illness (scored < 60%) if less than 3 measures are known by the
respondent.
Survey showed that none of the household (0%) has good knowledge of measures against diarrhoeal
illness; only 22% of the household have moderate knowledge of measures against diarrhoeal illness
whereas majority of the household at 78% have poor knowledge of measures against diarrhoeal illness
as shown in Graph I.
Graph I
% of HH with high knowledge (score 100%)
%HH with moderate knowledge (score 50%-
100%)
%HH with low knowledge (score <50%)
0%
10%
20%
30%
40%
50%
60%
70%
80%
90%
0%
22%
78%
% Household by Level of Knowledge on Measures against Diarrhoeal illnesses
Series1
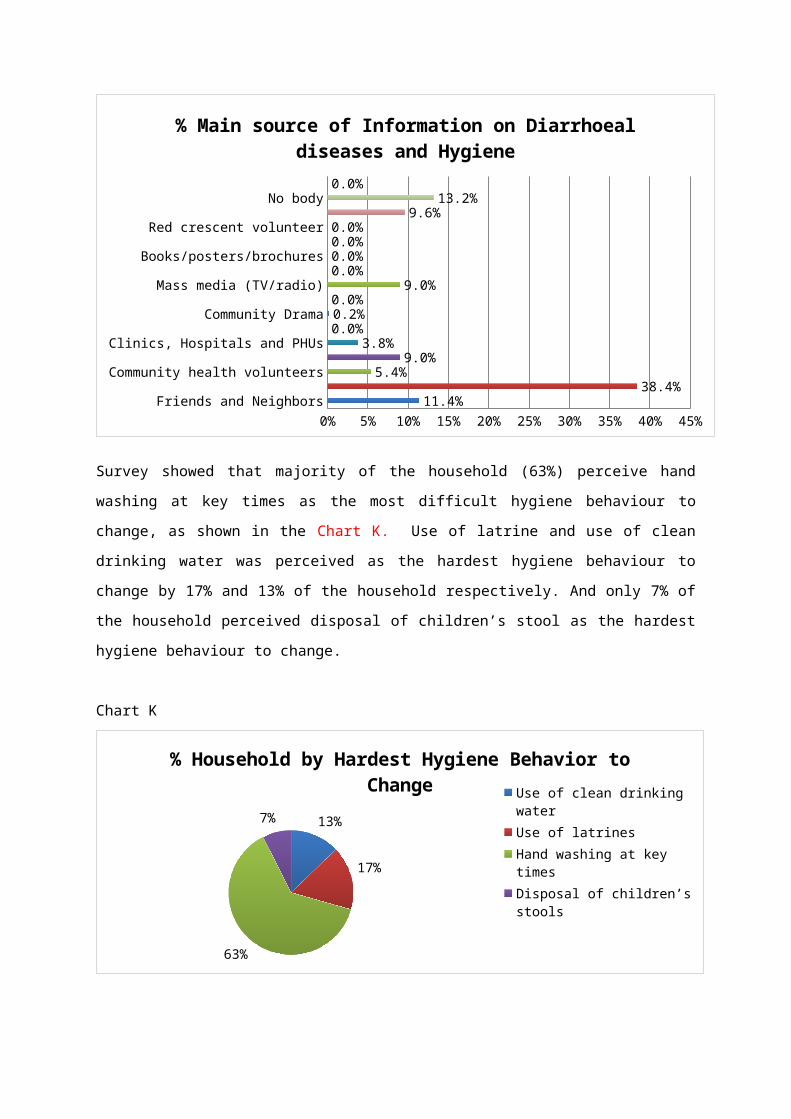
The main source of information on diarrheal diseases and hygiene came from community health
workers (38.4%), friend and neighbours (11%), family members (9%) and mass media such as TV
and radio (9%). 13.2% of the household had no source of information. None of the household had
received information on diarrheal diseases and hygiene from Water and sanitation committee in the
community as shown in Graph J.
Graph J
Friends and NeighborsCommunity Health Worker/ outreach workers
Community health volunteersFamily member/ mother in law
Clinics, Hospitals and PHUsSchool teacher or children
Community DramaReligious leaders
Mass media (TV/radio)Newspaper
Books/posters/brochuresWater and sanitation committee
Red crescent volunteerWord of mouth
No bodyOthers
0% 5% 10% 15% 20% 25% 30% 35% 40% 45%11.4%
38.4%5.4%
9.0%3.8%
0.0%0.2%0.0%
9.0%0.0%0.0%0.0%0.0%
9.6%13.2%
0.0%
% Main source of Information on Diarrhoeal diseases and Hygiene
Survey showed that majority of the household (63%) perceive hand washing at key times as the most
difficult hygiene behaviour to change, as shown in the Chart K. Use of latrine and use of clean
drinking water was perceived as the hardest hygiene behaviour to change by 17% and 13% of the
household respectively. And only 7% of the household perceived disposal of children’s stool as the
hardest hygiene behaviour to change.
Chart K
13%
17%
63%
7%
% Household by Hardest Hygiene Behavior to Change
Use of clean drinking waterUse of latrinesHand washing at key timesDisposal of children’s stools
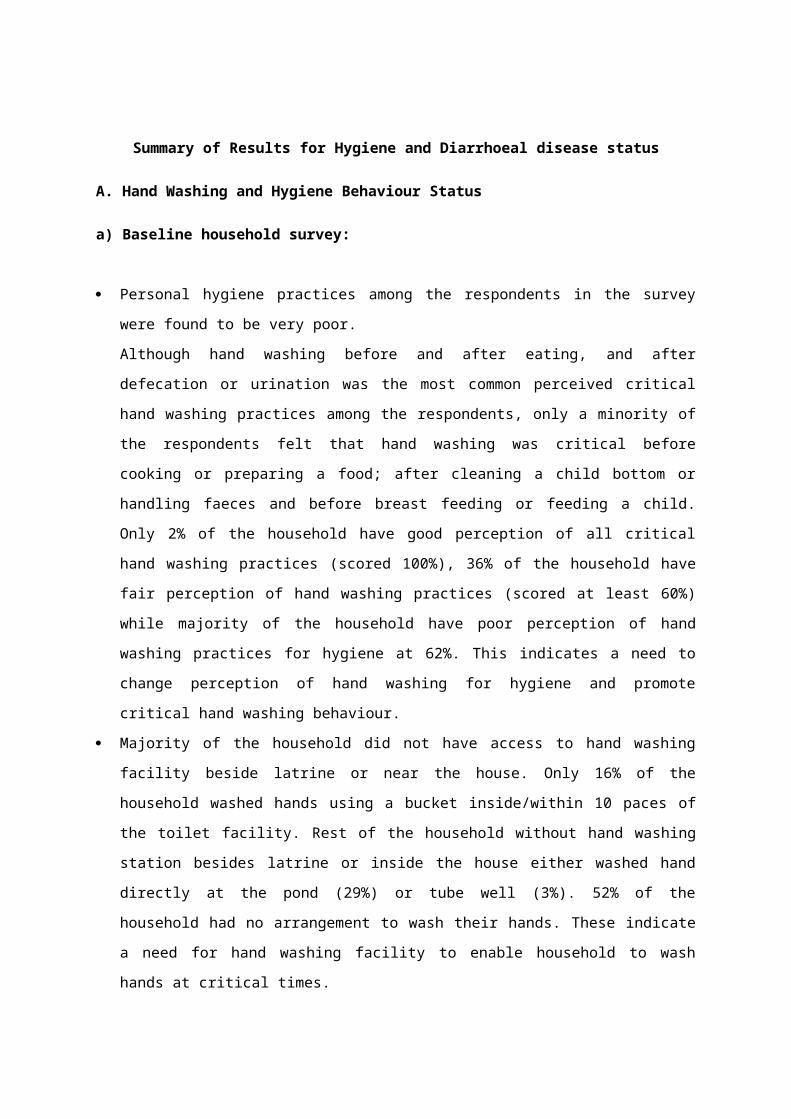
Summary of Results for Hygiene and Diarrhoeal disease status
A. Hand Washing and Hygiene Behaviour Status
a) Baseline household survey:
Personal hygiene practices among the respondents in the survey were found to be very poor.
Although hand washing before and after eating, and after defecation or urination was the most
common perceived critical hand washing practices among the respondents, only a minority of the
respondents felt that hand washing was critical before cooking or preparing a food; after cleaning
a child bottom or handling faeces and before breast feeding or feeding a child. Only 2% of the
household have good perception of all critical hand washing practices (scored 100%), 36% of the
household have fair perception of hand washing practices (scored at least 60%) while majority of
the household have poor perception of hand washing practices for hygiene at 62%. This indicates
a need to change perception of hand washing for hygiene and promote critical hand washing
behaviour.
Majority of the household did not have access to hand washing facility beside latrine or near the
house. Only 16% of the household washed hands using a bucket inside/within 10 paces of the
toilet facility. Rest of the household without hand washing station besides latrine or inside the
house either washed hand directly at the pond (29%) or tube well (3%). 52% of the household had
no arrangement to wash their hands. These indicate a need for hand washing facility to enable
household to wash hands at critical times.
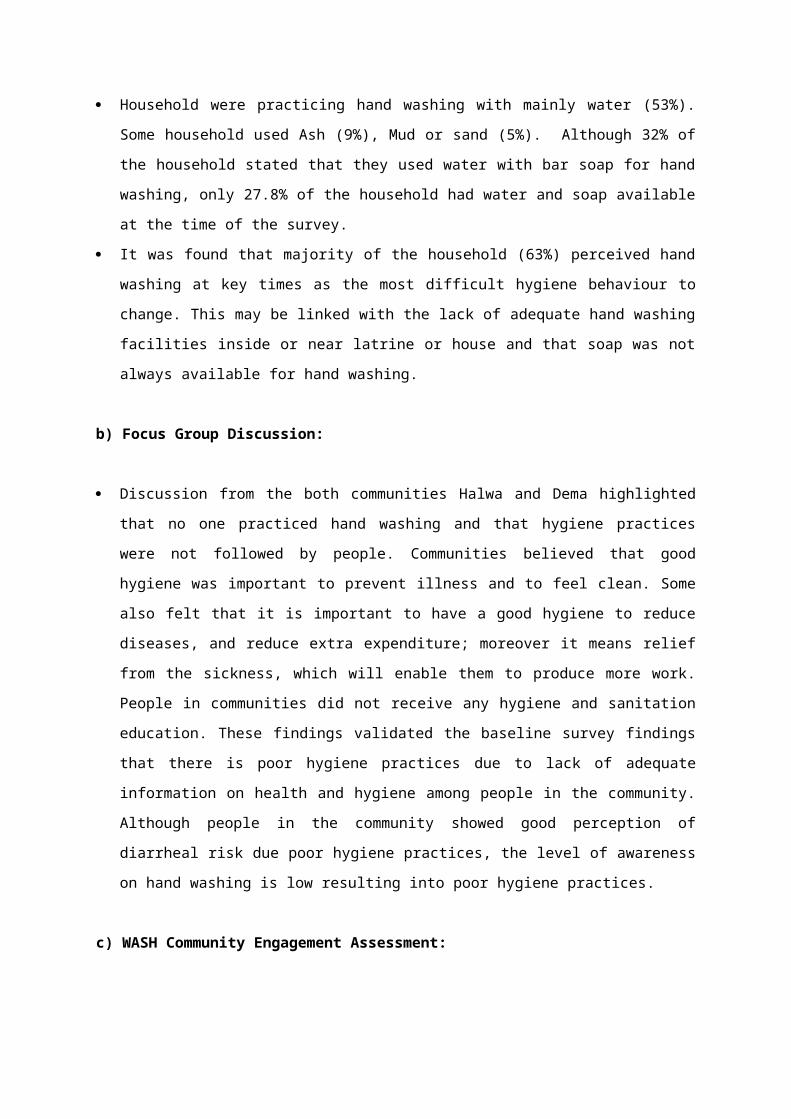
Household were practicing hand washing with mainly water (53%). Some household used Ash
(9%), Mud or sand (5%). Although 32% of the household stated that they used water with bar
soap for hand washing, only 27.8% of the household had water and soap available at the time of
the survey.
It was found that majority of the household (63%) perceived hand washing at key times as the
most difficult hygiene behaviour to change. This may be linked with the lack of adequate hand
washing facilities inside or near latrine or house and that soap was not always available for hand
washing.
b) Focus Group Discussion:
Discussion from the both communities Halwa and Dema highlighted that no one practiced hand
washing and that hygiene practices were not followed by people. Communities believed that good
hygiene was important to prevent illness and to feel clean. Some also felt that it is important to
have a good hygiene to reduce diseases, and reduce extra expenditure; moreover it means relief
from the sickness, which will enable them to produce more work. People in communities did not
receive any hygiene and sanitation education. These findings validated the baseline survey
findings that there is poor hygiene practices due to lack of adequate information on health and
hygiene among people in the community. Although people in the community showed good
perception of diarrheal risk due poor hygiene practices, the level of awareness on hand washing is
low resulting into poor hygiene practices.
c) WASH Community Engagement Assessment:
WASH community assessment exercises showed that majority of the people in the community did
not wash hands or practiced covering their food. Although community identified hand washing
and covering food as effective barriers to disease transmission route, community also stated that
hand wash behaviour was not very easy to practice mainly due to lack of money to purchase soap
for washing hand.
Other barrier for changing poor hygiene behaviour was to develop a habit which takes time.
However if both male and female motivates each other to use soap then the community agreed
that it is possible to reduce diarrhoea.
Other poor hygiene practices identified by the community participants were open field defecation,
eating dirty food. Awareness on hand washing and clean latrine were identified as important
hygiene practices that should be promoted in the communities.
It was found that men could contribute more in maintaining hygiene by washing hand after
returning from the field and also support by providing women with regular supply of soap.
B. Diarrhoeal Disease Knowledge, Perception and Practices
a) Baseline household survey:
Survey showed that 16% of the household reported suffering from diarrhoeal illness in the last 3
months but only 3% of the household last seeked treatment for illnesses from the private doctor,
mobile clinic or community health workers. 91.4% of the household seeked treatment directly at
the pharmacy (non-registered local doctor), whereas 5.4% of them did not seek any treatment at
all. This shows that there is a high diarrheal prevalence in the community though people did not
seek appropriate treatment.
It was found that none of the household (0%) had good knowledge of danger signs of severe
dehydration resulting from diarrhoea. Only 7% of the household had moderate knowledge of
danger signs whereas majority of the household at 93% had poor knowledge of danger signs of
severe diarrheal dehydration. This indicates the need of knowledge in the community on danger
signs of severe diarrheal dehydration to detect the signs immediately and seek treatment as early
as possible.
Although most of the household practiced using ORS (Oral Rehydration Solution) packet during
episodes of childhood diarrhoea, only 19.2% of the household used homemade sugar, water and
salt or ORS solution, 20.8% of the household practiced continued exclusive breastfeeding.
Similarly, about 7.5% of the household increased homemade fluid intake while few household
(1.5%) used zinc as treatment. This indicates the need of knowledge in the community on
appropriate home based measures against diarrheal illnesses.
The main source of information on diarrheal diseases and hygiene came from community health
workers, friend, neighbours and family members. None of the household had received
information on diarrheal diseases and hygiene from Water and sanitation committee in the
community. This indicates that local level community awareness event; peer and family
education approach etc be appropriate methods to promote hygiene and health in the community.
b) Focus Group Discussion:
Discussion from the both communities Halwa and Dema highlighted similar issue with access to
treatment. There were no registered doctors or health practitioners in village hence people seeked
treatment from local healers or nonregistered doctor at the pharmacy. Outreach worker from the
Government Family Planning Programme visited the community once a month to promote family
planning but sometimes provided with free ORS. Community also received services from the
Government Immunisation Programme. In case of severe illness, people travelled to District
Hospital by boat which was very costly.
Most vulnerable groups are pregnant women and elderly who need treatment. The community
depended on guardian or took loan in case of illnesses, as there are a few coping mechanisms
during such health crisis. It was stated that there is no known active case reporting to the Health
Unit in case of diarrheal illness in the community, hence it would not be determined that active
surveillance system was in place in the communities.
Recommendation
A. Monitoring Indicators for WASH behaviour outcome, diarrhoea and dehydration
Indicators for WASH behaviour outcome are broadly covered under 3 domains: Water, Sanitation and Hygiene. This indicator will measure impact resulting in reduction of diarrheal illnesses.
Indicators for home based care and preventive measures against diarrhoea will contribute in control of diarrheal diseases and prevent complications and death.
WASH behaviour change indicators are more appropriate for use than prevalence of diarrheal disease because reduction in diarrhoea prevalence can be due to multiple factors and rate of reduction in the project area cannot be ascertained without a reliable disease surveillance system in place.
Hygiene Content Area Indicator
Indicators
Use of Clean Water 1. % of households practicing correct use of recommended household water treatment technologies
2. % of households storing treated water in clean storage containers
Hand Washing with Soap
at Critical Moments
3. % of respondents who know at least 3 critical moments for hand washing.
4. % of households who know all critical moments for hand washing.
5. % of households with soap and water at a hand washing station inside or within 10 paces of latrines.
6. % of households with soap or locally available cleansing agent and water anywhere in the house.
Use of Sanitary
Facilities for the Disposal of
Human Excreta
7. % of household with children < 5 years old whose faeces were disposed of safely.
Use of prevention measures against diarrhoeal illness
8. % of household who know all danger signs of severe dehydration during diarrheal illness.
9. % of household who know all measures against diarrheal illness.
B. Hygiene Promotional Activities
It is recommended to use community engagement approach as the main approach for Hygiene promotion. Strong community participation and appropriateness of hygiene promotion messages are known to be the key factors to enable hygiene behaviour changes.
Hygiene promotion activities could be conducted with facilitation through community organizers who are first trained in community engagement approach for WASH. Community members once oriented can become volunteer facilitators or community hygiene promoters, whilst they are monitored by community organizer and UPOs. WATSAN committee should be oriented on good hygiene practices and should be involved in hygiene promotion activities in the community.
Cultural group formation to perform street drama at the community on hygiene promotion; School hygiene club formation to promote interactive hygiene sessions in school; women or caretakers group formation to conduct courtyard hygiene promotion meeting etc are recommended as key activities for hygiene promotion.
Appropriate hygiene promotion materials and training material should be developed to target community level participants. All IEC materials should be more pictorial and adapted to local contexts. Flipchart should be developed and distributed to community organizer and community volunteer trainers.
Table below shows recommended activities to achieve outcome 3 of resilience indicator:
Outcome 3:
% of HHs in target community that can demonstrate good hygiene and sanitation practices, including in event of disaster (cyclone or flood)
Activities:
3.1.1.1 WASH community engagement training for trainers (community organizers, volunteers and branch staffs) by BDRCS/BRC technical staffs.
3.1.1.2 WASH community engagement workshop with participants from the community
3.1.1.3 Development of community level WASH awareness/training materials: Flipcharts, Brochure and Pamphlets.
3.1.1.4 Workshop with union and Upazilla WATSAN Committee and concern stakeholders on water, sanitation and hygiene practices and measures against diarrheal illnesses.
3.1.1.5 Form and conduct mothers and caretakers groups courtyard awareness sessions on water, sanitation and hygiene practices and measures against diarrheal illness
3.1.1.6 School sanitation and hygiene educational and interactive session by community organizer to create awareness on WASH practices.
3.1.1.7 Create school hygiene clubs and facilitate hygiene promotion session in the school using peer to peer approach, through facilitation by community organizers.
3.1.1.8 Form a cultural group among community volunteers and organize street drama to create awareness on WASH practices to stop open field defecation, to demonstrate and promote hand
washing.
3.1.1.9 Organize WASH awareness events on key dates such as World Water Day and Global Hand washing Day etc
3.1.1.10 Distribute IEC material and hygiene kit during community workshops, school and caretakers group sessions and key events.
Key messages for hygiene promotion:
Critical Hand washing
Use of clean water
Use of clean water storage
Stop open defecation- waste disposal in safe places
Danger signs of severe dehydration
Appropriate measures against diarrheal illness
C. Linking WASH with livelihood
One of the major issues identified in this assessment is that the poorest household in the community
cannot afford to purchase soap every month. In order to have sustained hygienic behaviour change
such as hand washing with water and soap, households must have soap and water at all times. This
may be possible if poorest households are provided with some financial support. Hence a detailed
livelihood assessment of these communities would help to link WASH/ hygiene behaviour with
livelihood and an appropriate process could be recommended for the poorest households in the
community, to enable them to practices good hygiene.
D. Monitoring and Evaluation plan outline
Baseline assessment of hygiene practices along with water and sanitation to be conducted in all 26
communities to finalize baseline indicators for the programme.
Project management plan with activities, yearly targets based on baseline assessment findings
from all the communities.
Strengthening of WATSAN committee to increase their involvement and support in monitoring of
WATSAN and hygiene promotion activities in the communities.
Quarterly narrative report submission to update on activities as per project log frame.
Mid- term review of the programme to assess progress against the programme objectives.
Final programme review to measure the impact of all interventions.