Embed Size (px)
Citation preview
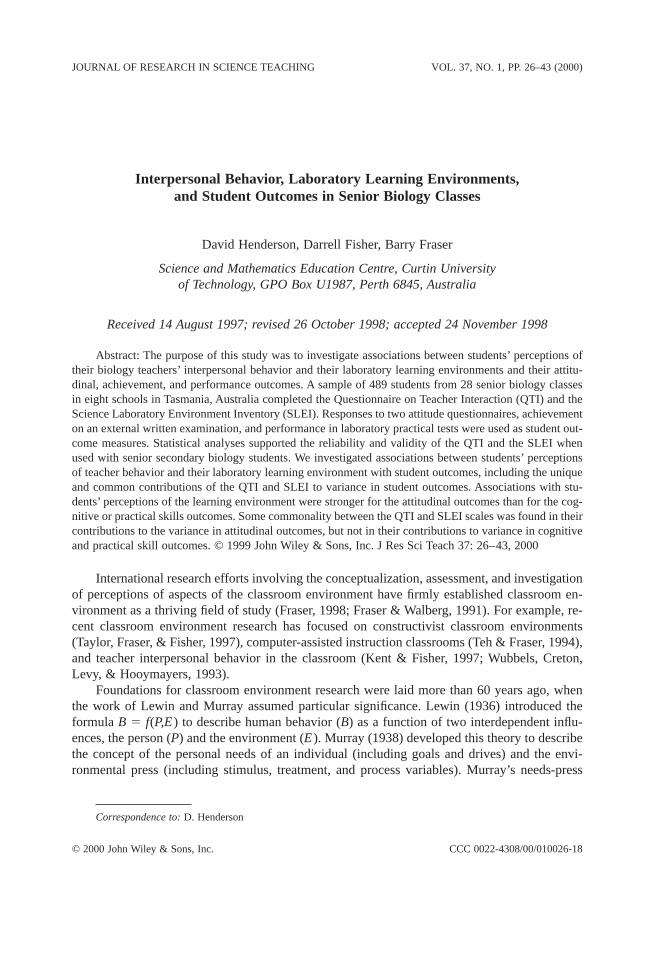
Interpersonal Behavior, Laboratory Learning Environments, and Student Outcomes in Senior Biology Classes
David Henderson, Darrell Fisher, Barry Fraser
Science and Mathematics Education Centre, Curtin University of Technology, GPO Box U1987, Perth 6845, Australia
Received 14 August 1997; revised 26 October 1998; accepted 24 November 1998
Abstract: The purpose of this study was to investigate associations between students’ perceptions oftheir biology teachers’ interpersonal behavior and their laboratory learning environments and their attitu-dinal, achievement, and performance outcomes. A sample of 489 students from 28 senior biology classesin eight schools in Tasmania, Australia completed the Questionnaire on Teacher Interaction (QTI) and theScience Laboratory Environment Inventory (SLEI). Responses to two attitude questionnaires, achievementon an external written examination, and performance in laboratory practical tests were used as student out-come measures. Statistical analyses supported the reliability and validity of the QTI and the SLEI whenused with senior secondary biology students. We investigated associations between students’ perceptionsof teacher behavior and their laboratory learning environment with student outcomes, including the uniqueand common contributions of the QTI and SLEI to variance in student outcomes. Associations with stu-dents’ perceptions of the learning environment were stronger for the attitudinal outcomes than for the cog-nitive or practical skills outcomes. Some commonality between the QTI and SLEI scales was found in theircontributions to the variance in attitudinal outcomes, but not in their contributions to variance in cognitiveand practical skill outcomes. © 1999 John Wiley & Sons, Inc. J Res Sci Teach 37: 26–43, 2000
International research efforts involving the conceptualization, assessment, and investigationof perceptions of aspects of the classroom environment have firmly established classroom en-vironment as a thriving field of study (Fraser, 1998; Fraser & Walberg, 1991). For example, re-cent classroom environment research has focused on constructivist classroom environments(Taylor, Fraser, & Fisher, 1997), computer-assisted instruction classrooms (Teh & Fraser, 1994),and teacher interpersonal behavior in the classroom (Kent & Fisher, 1997; Wubbels, Creton,Levy, & Hooymayers, 1993).
Foundations for classroom environment research were laid more than 60 years ago, whenthe work of Lewin and Murray assumed particular significance. Lewin (1936) introduced theformula B 5 f(P,E ) to describe human behavior (B) as a function of two interdependent influ-ences, the person (P) and the environment (E ). Murray (1938) developed this theory to describethe concept of the personal needs of an individual (including goals and drives) and the envi-ronmental press (including stimulus, treatment, and process variables). Murray’s needs-press
JOURNAL OF RESEARCH IN SCIENCE TEACHING VOL. 37, NO. 1, PP. 26–43 (2000)
© 2000 John Wiley & Sons, Inc. CCC 0022-4308/00/010026-18
Correspondence to: D. Henderson
theory led to the development of various measures of personality, but environmental measuresrarely were considered in early studies.
In the past 25 years, much attention has been given to the development and use of instru-ments to assess the qualities of the science classroom learning environment from the perspec-tive of the student (Fraser, 1986, 1994; Fraser & Walberg, 1991), and the association betweenlearning environment variables and student outcomes has provided a particular rationale and fo-cus for the use of learning environment instruments. In a meta-analysis which examined 823classes in eight subject areas and representing the perceptions of 17,805 students in four nations,Haertel, Walberg, & Haertel (1981) found enhanced student achievement in classes which stu-dents felt had greater cohesiveness, satisfaction, and goal direction, and less disorganization andfriction. Other literature reviews since then have supported the existence of associations betweenclassroom environment variables and student outcomes (Fraser, 1994).
Walberg’s theory of educational productivity (Walberg, 1981, 1984) holds that there arenine factors which contribute to variance in students’ cognitive and affective outcomes: studentability, age, and motivation; the quality and quantity of instruction; and the psychological cli-mate of the home, the classroom social group, the peer group outside the classroom, and themass media (especially television viewing). Testing of the model using data collected as part ofnational studies has confirmed its validity in showing that student achievement and attitudes areinfluenced jointly by a number of factors rather than by one dominant factor (Walberg, 1986;Walberg, Fraser, & Welch, 1986). Classroom and school environment factors were found to beparticularly important influences on student outcomes, even when a number of other factorswere controlled. These findings are consistent with the theoretical model of Getzels and Thelen(1960), which describes the school class as a social system and suggests that group behaviorcan be predicted from personality needs, role expectations, and classroom environment.
The association between student perceptions of learning environment variables and studentoutcomes has provided a particular rationale for the use of learning environment instruments.Studies consistently have shown evidence of associations between student perceptions of theirclassroom learning environment and student outcomes, even when other variables such as stu-dent ability were controlled (Fraser, 1994; Fraser, Walberg, Welch, & Hattie, 1987; Haertel etal., 1981).
Many classroom environment instruments, including the two used in this study, have twoversions: namely, an actual version and an ideal or preferred version. In responding to the ac-tual version, students give information about aspects of the environment of the class which theycurrently attend, whereas, in responding to the ideal or preferred version, students give infor-mation about the classroom environment ideally liked or preferred. An advantage of comparingstudents’ perceptions of their actual environment with their preferred environment is that it givesteachers the opportunity to modify the classroom environment to match more closely actual andpreferred environments. Person–environment fit studies have suggested that a closer congruencebetween students’ actual and preferred environments could enhance student outcomes (Fraser,1994; Fraser & Fisher, 1983a, 1983b).
Previous research has indicated differences between students’ perceptions of their actual en-vironment and their ideal or preferred environment (e.g., Fraser, 1991; Levy, Creton, & Wubbels,1993; Wong & Fraser, 1996). Therefore, in keeping with this line of research, differences be-tween biology students’ actual and preferred learning environments were explored in this study.
Although past studies have examined associations between student outcomes and studentperceptions of the learning environment in science classes (Fraser, 1986, 1994), the presentstudy is distinctive in that, first, it assessed student perceptions of two distinct aspects of learn-ing environments (namely, interpersonal teacher behavior and the laboratory classroom envi-
LEARNING ENVIRONMENTS IN BIOLOGY CLASSES 27
28 HENDERSON, FISHER, AND FRASER
ronment), and second, it examined student outcomes in three distinct areas—student attitudes,achievement in a written examination, and performance on practical tests. The present study pro-vides one of the very few studies in which practical performance has been used as an outcomein learning environment research.
This study centered on students in senior secondary biology classes and aimed to comparestudents’ perceptions of their learning environment with the environment ideally liked or pre-ferred, investigate associations between students’ perceptions of their learning environment andstudents’ attitudinal and achievement outcomes, and determine the unique and common contri-butions of two learning environment instruments to the variance in student outcomes.
Assessment of Interpersonal Teacher Behavior
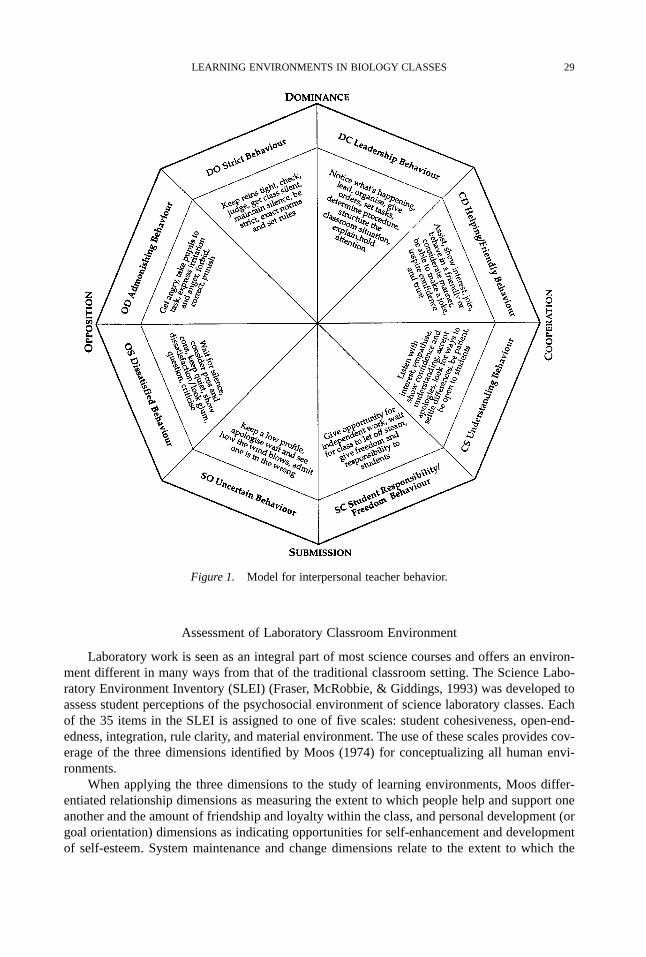
Interpersonal teacher behavior was measured using the Questionnaire on Teacher Interac-tion (QTI) (Wubbels, Brekelmans, & Hooymayers, 1991). A two-dimensional model proposedby Leary (1957) formed the basis for the development of the QTI. Teacher behavior is mappedusing a proximity dimension [cooperation (C), opposition (O)] and an influence dimension(dominance (D), submission (S)]. Each of the items of the QTI is assigned to one of eight scales:leadership, helping/friendly, understanding, student responsibility/freedom, uncertain, dissatis-fied, admonishing, and strict behavior. Typical behaviors for each scale are described in Figure1. A more detailed description of the model is given in Wubbels et al. (1993) and Wubbels andLevy (1993).
One use of the QTI in The Netherlands involved investigation of relationships between per-ceptions on QTI scales and student outcomes (Wubbels et al., 1991). Regarding students’ cog-nitive outcomes, the more that teachers demonstrated strict, leadership, and helping/friendly behavior, the higher were their students’ cognitive outcome scores. Conversely, student respon-sibility and freedom, uncertain, and dissatisfied behavior were negatively related to achievement.
In another study, variations in the students’ appreciation of the subject and their classescould be characterized on the basis of the proximity dimension: The more cooperative the be-havior displayed, the higher were the effective outcome scores (Wubbels et al., 1991). That is,student responsibility and freedom, understanding, helping/friendly, and leadership behaviorswere related positively to student attitudes. Uncertain, dissatisfied, admonishing, and strict be-haviors were related negatively to attitudes.
Goh and Fraser (1996) adapted the QTI for use in elementary schools in Singapore and in-vestigated gender differences in students’ perceptions of their teachers’ interpersonal behavior.The results of this study indicated that in relation to boys, girls consistently rated their teach-ers’ interpersonal behavior in a more positive way. For example, girls rated more highly theirteachers’ understanding and helping/friendly behavior and less highly their uncertain, dissatis-fied, and admonishing behavior.
In an Australian study involving secondary science teachers and students, Fisher, Rickards,and Fraser (1996) found that after having completed the QTI and having read a report suppliedto them, teachers reported that the results had stimulated them to reflect on their own teachingpractices. The results based on the QTI led one teacher to conclude that she had become moreaware of the students’ need for clear communication, and this subsequently became a focus forher in improving her classroom environment.
Overall, previous studies have indicated that interpersonal teacher behavior is an importantaspect of the learning environment which is related consistently to student outcomes. In addition,most previous studies involving the QTI have centered on students in physics or general scienceclassrooms, further justifying the use of this questionnaire with students in biology classes.
LEARNING ENVIRONMENTS IN BIOLOGY CLASSES 29
Assessment of Laboratory Classroom Environment
Laboratory work is seen as an integral part of most science courses and offers an environ-ment different in many ways from that of the traditional classroom setting. The Science Labo-ratory Environment Inventory (SLEI) (Fraser, McRobbie, & Giddings, 1993) was developed toassess student perceptions of the psychosocial environment of science laboratory classes. Eachof the 35 items in the SLEI is assigned to one of five scales: student cohesiveness, open-end-edness, integration, rule clarity, and material environment. The use of these scales provides cov-erage of the three dimensions identified by Moos (1974) for conceptualizing all human envi-ronments.
When applying the three dimensions to the study of learning environments, Moos differ-entiated relationship dimensions as measuring the extent to which people help and support oneanother and the amount of friendship and loyalty within the class, and personal development (orgoal orientation) dimensions as indicating opportunities for self-enhancement and developmentof self-esteem. System maintenance and change dimensions relate to the extent to which the
Figure 1. Model for interpersonal teacher behavior.
30 HENDERSON, FISHER, AND FRASER
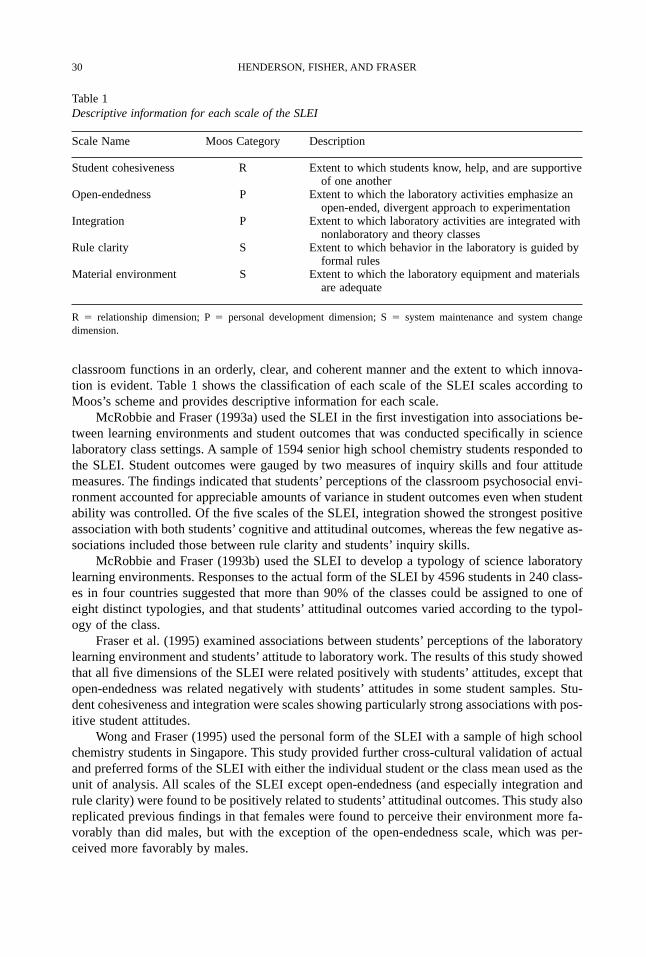
classroom functions in an orderly, clear, and coherent manner and the extent to which innova-tion is evident. Table 1 shows the classification of each scale of the SLEI scales according toMoos’s scheme and provides descriptive information for each scale.
McRobbie and Fraser (1993a) used the SLEI in the first investigation into associations be-tween learning environments and student outcomes that was conducted specifically in sciencelaboratory class settings. A sample of 1594 senior high school chemistry students responded tothe SLEI. Student outcomes were gauged by two measures of inquiry skills and four attitudemeasures. The findings indicated that students’ perceptions of the classroom psychosocial envi-ronment accounted for appreciable amounts of variance in student outcomes even when studentability was controlled. Of the five scales of the SLEI, integration showed the strongest positiveassociation with both students’ cognitive and attitudinal outcomes, whereas the few negative as-sociations included those between rule clarity and students’ inquiry skills.
McRobbie and Fraser (1993b) used the SLEI to develop a typology of science laboratorylearning environments. Responses to the actual form of the SLEI by 4596 students in 240 class-es in four countries suggested that more than 90% of the classes could be assigned to one ofeight distinct typologies, and that students’ attitudinal outcomes varied according to the typol-ogy of the class.
Fraser et al. (1995) examined associations between students’ perceptions of the laboratorylearning environment and students’ attitude to laboratory work. The results of this study showedthat all five dimensions of the SLEI were related positively with students’ attitudes, except thatopen-endedness was related negatively with students’ attitudes in some student samples. Stu-dent cohesiveness and integration were scales showing particularly strong associations with pos-itive student attitudes.
Wong and Fraser (1995) used the personal form of the SLEI with a sample of high schoolchemistry students in Singapore. This study provided further cross-cultural validation of actualand preferred forms of the SLEI with either the individual student or the class mean used as theunit of analysis. All scales of the SLEI except open-endedness (and especially integration andrule clarity) were found to be positively related to students’ attitudinal outcomes. This study alsoreplicated previous findings in that females were found to perceive their environment more fa-vorably than did males, but with the exception of the open-endedness scale, which was per-ceived more favorably by males.
Table 1Descriptive information for each scale of the SLEI
Scale Name Moos Category Description
Student cohesiveness R Extent to which students know, help, and are supportiveof one another
Open-endedness P Extent to which the laboratory activities emphasize an open-ended, divergent approach to experimentation
Integration P Extent to which laboratory activities are integrated withnonlaboratory and theory classes
Rule clarity S Extent to which behavior in the laboratory is guided byformal rules
Material environment S Extent to which the laboratory equipment and materialsare adequate
R 5 relationship dimension; P 5 personal development dimension; S 5 system maintenance and system change dimension.
Fraser et al. (1995) described the initial development of the SLEI and its evolution throughextensive field testing. Whereas a number of applications of the instrument to the science labo-ratory environment are evident, the present study is distinctive in that it investigated associa-tions between students’ perceptions of their laboratory learning environment and four separateoutcomes: namely, attitude to the class, attitude to laboratory work, achievement on a writtenexamination, and performance on laboratory practical tests. Furthermore, this study centered onstudents in biology classes, whereas many of the previous studies involving the SLEI involvedchemistry classes.
Research Questions
As previously indicated, actual and preferred or ideal versions of two learning environmentinstruments, the QTI and the SLEI were used in this study. Because previous research has in-dicated that student outcomes can be related to the congruence between actual and preferredlearning environments, comparison between biology students’ actual and preferred perceptionsof the learning environment formed the focus for Research Question 1: How do senior biologystudents’ perceptions of their actual classroom and laboratory learning environments differ fromtheir ideal or preferred situations?
In view of the fundamental importance of student outcomes to students and educators alike,assessment of students’ attitudinal and achievement outcomes formed an integral part of thisstudy. Prior research indicating evidence of associations between student perceptions of theirlearning environment and student outcomes provided the rationale for Research Question 2:What associations exist between students’ attitudinal, cognitive, and practical performance out-comes and their perceptions of the classroom and laboratory learning environments in seniorsecondary biology classes in Tasmania?
Because this study used both the QTI and the SLEI with the same sample of students, itwas considered pertinent to ascertain whether each instrument made a unique contribution tothe variance in student outcomes. Because the existence of unique contributions would justifythe use of both instruments together in future research studies, the contributions of each instru-ment to the variance in student outcomes formed the basis for Research Question 3: What arethe unique and common contributions made by the QTI and the SLEI to the variance in stu-dents’ attitudinal, cognitive, and practical performance outcomes?
Data Source
The sample was composed of students from six of the eight secondary colleges (which en-compass Grades 11 and 12 only) in Tasmania and two of the independent schools which offersenior biology courses. A total of 489 students in 28 biology classes were involved, represent-ing nearly half of all the students taking biology in Tasmania. Of the 489 students in the sam-ple, 313 were female, 172 were male, and 4 did not indicate their gender.
Method
The QTI was used to gauge students’ perceptions of interpersonal teacher behavior, and theSLEI to gauge students’ perception of the laboratory environment. Students completed twoforms of the QTI. The first (actual or perceived) form gauged students’ perceptions of the teacherwhose class the students actually were attending while responding to the questionnaire. The sec-ond (preferred or ideal) form asked students to rate the best teacher who had ever taught them.
LEARNING ENVIRONMENTS IN BIOLOGY CLASSES 31
In completing actual and preferred forms of the SLEI, students rated their current laboratory en-vironment and their preferred laboratory environment.
Student attitudes were assessed with an eight-item Attitude to Science Laboratory Workscale, adapted from the Test of Science-Related Attitudes (TOSRA) (Fraser, 1981), and a sev-en-item Attitude to This Class scale, which also was based on the TOSRA.
In Tasmania, senior secondary biology students are assessed on their performance in a 3-hexternal written examination at the end of the course. The students’ examination responses areassessed by a team of markers, each of whom has responsibility for one question, and eachmarking examiner is provided with a prescriptive marking scheme devised by the setting ex-aminers. The marking schemes may undergo moderation following marking of a sample of ex-amination scripts. In this study, each student’s performance on the end-of-year examination wasused as a measure of cognitive achievement and, because students completed one of two com-mon external examinations, Human Biology or Biology, standardized z scores (i.e., scores ex-pressed in terms of the number of standard deviations above or below the group mean) werecalculated to enable more meaningful comparison.
In view of the amount of time devoted to practical work in senior biology classes in Tas-mania (about one third of the total course time), and the fact that practical work is seen as a dis-tinct mode of instruction involving skills at least in some ways different from those used in non-practical work (e.g., Kelly & Lister, 1969; Tamir, 1991), assessment of students’ practicalperformance was used to provide a third distinctive outcome measure in this study. A subsam-ple of students attempted one or more of a battery of four practical tests based on the PracticalTest Assessment Inventory (PTAI) (Tamir, Nussinovitz, & Friedler, 1980, 1982), and standard-ized z scores on these tests were used as a measure of students’ practical skills.
Using the scales of the QTI and the SLEI as independent variables, associations were in-vestigated with (a) achievement on the external examinations, (b) performance on practical tests,(c) attitude to the class, and (d) attitude to laboratory work. Both simple and multiple correla-tion analyses were employed, and analyses were performed for both the individual student andthe class mean as the unit of analysis.
Commonality analysis (Cooley & Lohnes, 1976; Pedhazur, 1982) was used to determinethe degree of common variance shared by the QTI and the SLEI in their contributions to stu-dent outcomes, as well as the unique contribution to variance made by each instrument. Thepurpose of these analyses was to ascertain whether the QTI and the SLEI each made a uniquecontribution to outcome variance over and above that accounted for by the other instrument.The importance of this aspect of the investigation was to shed light on whether there is anyadvantage of including both the QTI and the SLEI together in the same study in future re-search.
Reliability and Validity of the Instruments
QTI
The reliability and validity of the QTI has been confirmed in prior Dutch, American, Aus-tralian, and Singaporean studies (e.g., Brekelmans, Wubbels & Creton, 1990; Fisher, Fraser, &Wubbels, 1993; Wubbels & Levy, 1991; Goh & Fraser, 1996). The use of Cronbach’s alpha re-liability coefficient in past research has shown that the QTI has an acceptable internal consis-tency, with figures for student responses ranging from .74 to .90 (Fisher et al., 1993) with theindividual as the unit of analysis.
32 HENDERSON, FISHER, AND FRASER
LEARNING ENVIRONMENTS IN BIOLOGY CLASSES 33
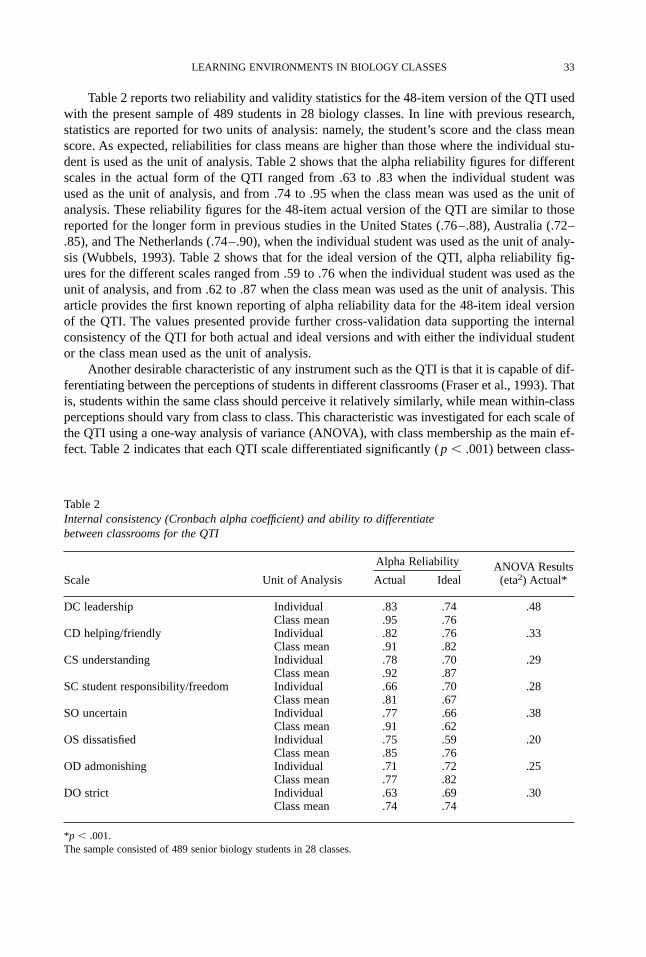
Table 2 reports two reliability and validity statistics for the 48-item version of the QTI usedwith the present sample of 489 students in 28 biology classes. In line with previous research,statistics are reported for two units of analysis: namely, the student’s score and the class meanscore. As expected, reliabilities for class means are higher than those where the individual stu-dent is used as the unit of analysis. Table 2 shows that the alpha reliability figures for differentscales in the actual form of the QTI ranged from .63 to .83 when the individual student wasused as the unit of analysis, and from .74 to .95 when the class mean was used as the unit ofanalysis. These reliability figures for the 48-item actual version of the QTI are similar to thosereported for the longer form in previous studies in the United States (.76–.88), Australia (.72–.85), and The Netherlands (.74–.90), when the individual student was used as the unit of analy-sis (Wubbels, 1993). Table 2 shows that for the ideal version of the QTI, alpha reliability fig-ures for the different scales ranged from .59 to .76 when the individual student was used as theunit of analysis, and from .62 to .87 when the class mean was used as the unit of analysis. Thisarticle provides the first known reporting of alpha reliability data for the 48-item ideal versionof the QTI. The values presented provide further cross-validation data supporting the internalconsistency of the QTI for both actual and ideal versions and with either the individual studentor the class mean used as the unit of analysis.
Another desirable characteristic of any instrument such as the QTI is that it is capable of dif-ferentiating between the perceptions of students in different classrooms (Fraser et al., 1993). Thatis, students within the same class should perceive it relatively similarly, while mean within-classperceptions should vary from class to class. This characteristic was investigated for each scale ofthe QTI using a one-way analysis of variance (ANOVA), with class membership as the main ef-fect. Table 2 indicates that each QTI scale differentiated significantly (p , .001) between class-
Table 2Internal consistency (Cronbach alpha coefficient) and ability to differentiate between classrooms for the QTI
Alpha Reliability ANOVA ResultsScale Unit of Analysis Actual Ideal (eta2) Actual*
DC leadership Individual .83 .74 .48Class mean .95 .76
CD helping/friendly Individual .82 .76 .33Class mean .91 .82
CS understanding Individual .78 .70 .29Class mean .92 .87
SC student responsibility/freedom Individual .66 .70 .28Class mean .81 .67
SO uncertain Individual .77 .66 .38Class mean .91 .62
OS dissatisfied Individual .75 .59 .20Class mean .85 .76
OD admonishing Individual .71 .72 .25Class mean .77 .82
DO strict Individual .63 .69 .30Class mean .74 .74
*p , .001.The sample consisted of 489 senior biology students in 28 classes.
34 HENDERSON, FISHER, AND FRASER
es and that the eta-squared statistic, representing the proportion of variance explained by classmembership, ranged from .20 to .48 for different scales. These figures are generally similar tothose reported by Wubbels and Levy (1991) for a sample of schools in the United States.
SLEI
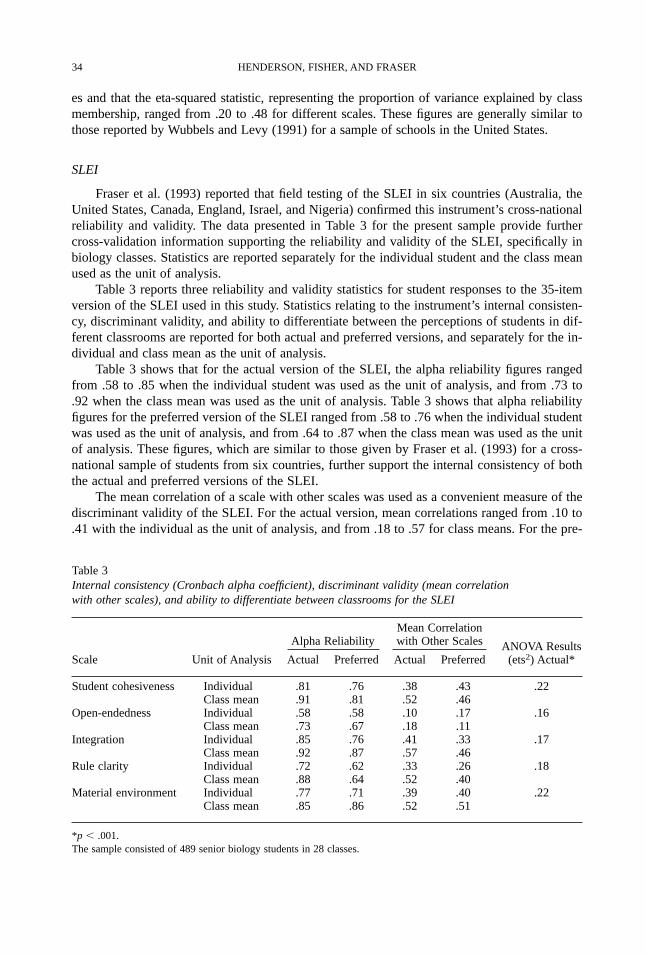
Fraser et al. (1993) reported that field testing of the SLEI in six countries (Australia, theUnited States, Canada, England, Israel, and Nigeria) confirmed this instrument’s cross-nationalreliability and validity. The data presented in Table 3 for the present sample provide furthercross-validation information supporting the reliability and validity of the SLEI, specifically inbiology classes. Statistics are reported separately for the individual student and the class meanused as the unit of analysis.
Table 3 reports three reliability and validity statistics for student responses to the 35-itemversion of the SLEI used in this study. Statistics relating to the instrument’s internal consisten-cy, discriminant validity, and ability to differentiate between the perceptions of students in dif-ferent classrooms are reported for both actual and preferred versions, and separately for the in-dividual and class mean as the unit of analysis.
Table 3 shows that for the actual version of the SLEI, the alpha reliability figures rangedfrom .58 to .85 when the individual student was used as the unit of analysis, and from .73 to.92 when the class mean was used as the unit of analysis. Table 3 shows that alpha reliabilityfigures for the preferred version of the SLEI ranged from .58 to .76 when the individual studentwas used as the unit of analysis, and from .64 to .87 when the class mean was used as the unitof analysis. These figures, which are similar to those given by Fraser et al. (1993) for a cross-national sample of students from six countries, further support the internal consistency of boththe actual and preferred versions of the SLEI.
The mean correlation of a scale with other scales was used as a convenient measure of thediscriminant validity of the SLEI. For the actual version, mean correlations ranged from .10 to.41 with the individual as the unit of analysis, and from .18 to .57 for class means. For the pre-
Table 3Internal consistency (Cronbach alpha coefficient), discriminant validity (mean correlation with other scales), and ability to differentiate between classrooms for the SLEI
Mean Correlation Alpha Reliability with Other Scales ANOVA Results
Scale Unit of Analysis Actual Preferred Actual Preferred (ets2) Actual*
Student cohesiveness Individual .81 .76 .38 .43 .22Class mean .91 .81 .52 .46
Open-endedness Individual .58 .58 .10 .17 .16Class mean .73 .67 .18 .11
Integration Individual .85 .76 .41 .33 .17Class mean .92 .87 .57 .46
Rule clarity Individual .72 .62 .33 .26 .18Class mean .88 .64 .52 .40
Material environment Individual .77 .71 .39 .40 .22Class mean .85 .86 .52 .51
*p , .001.The sample consisted of 489 senior biology students in 28 classes.
LEARNING ENVIRONMENTS IN BIOLOGY CLASSES 35
ferred version, figures ranged from .17 to .43 with the student as the unit of analysis, and from.11 to .51 when class means were used. These discriminant validity figures are similar to thosereported by Fraser et al. (1993) and indicate that the SLEI measures distinct (although some-what overlapping) aspects of the laboratory learning environment.
The ANOVA results in Table 3 also show that the eta-squared values for the actual form ofSLEI scales ranged from .16 to .22, and that each scale differentiated significantly (p , .001)between the perceptions of students in different classes.
Attitude Questionnaires
For the present sample, the seven-item Attitude to This Class scale was found to have analpha reliability of .68 with the individual student as the unit of analysis and .74 when classmeans were used. Reliability coefficients for the eight-item Attitude to Science Laboratory Workwere .70 and .77, respectively, for the two units of analysis.
Students’ Perceptions of Their Actual and Preferred Learning Environments
Interpersonal Teacher Behavior
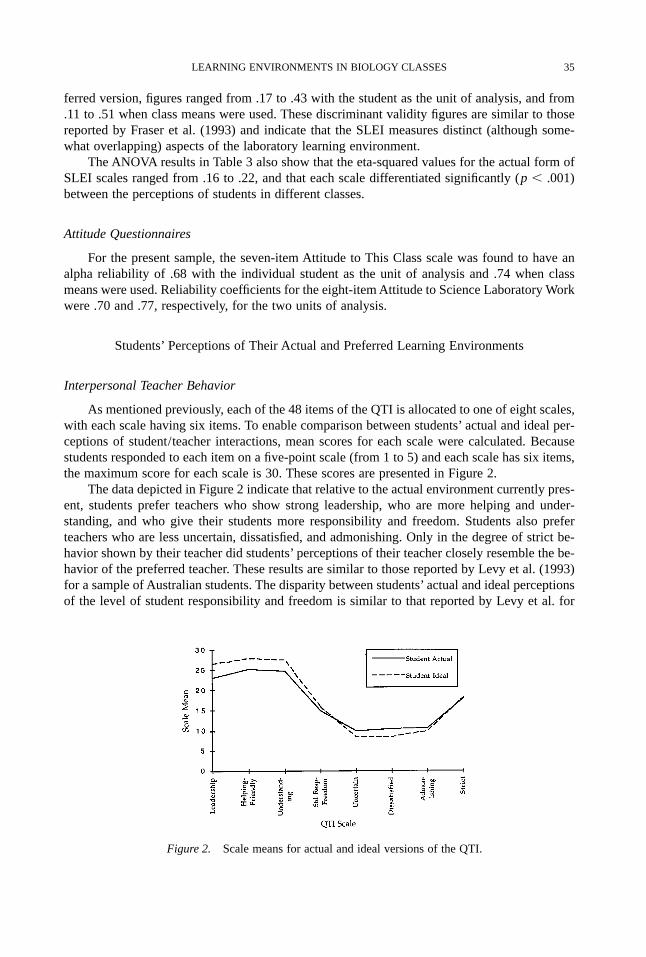
As mentioned previously, each of the 48 items of the QTI is allocated to one of eight scales,with each scale having six items. To enable comparison between students’ actual and ideal per-ceptions of student/teacher interactions, mean scores for each scale were calculated. Becausestudents responded to each item on a five-point scale (from 1 to 5) and each scale has six items,the maximum score for each scale is 30. These scores are presented in Figure 2.
The data depicted in Figure 2 indicate that relative to the actual environment currently pres-ent, students prefer teachers who show strong leadership, who are more helping and under-standing, and who give their students more responsibility and freedom. Students also preferteachers who are less uncertain, dissatisfied, and admonishing. Only in the degree of strict be-havior shown by their teacher did students’ perceptions of their teacher closely resemble the be-havior of the preferred teacher. These results are similar to those reported by Levy et al. (1993)for a sample of Australian students. The disparity between students’ actual and ideal perceptionsof the level of student responsibility and freedom is similar to that reported by Levy et al. for
Figure 2. Scale means for actual and ideal versions of the QTI.
36 HENDERSON, FISHER, AND FRASER
the Australian sample, but greater than that reported (in the same study) for Dutch and Ameri-can students, suggesting that Australian secondary students prefer more independence than dotheir Dutch and American counterparts.
The Laboratory Learning Environment
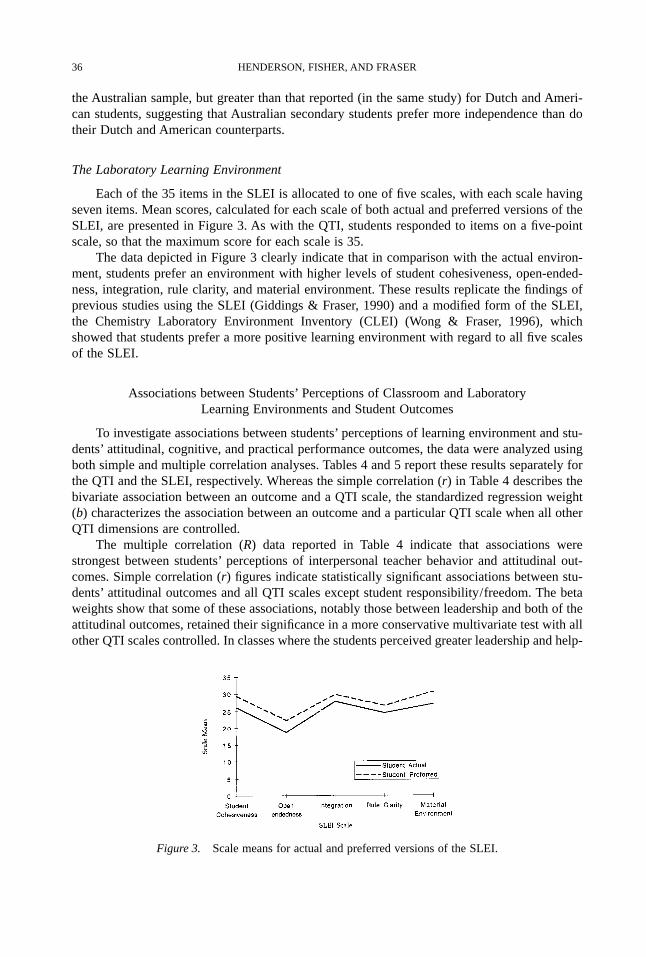
Each of the 35 items in the SLEI is allocated to one of five scales, with each scale havingseven items. Mean scores, calculated for each scale of both actual and preferred versions of theSLEI, are presented in Figure 3. As with the QTI, students responded to items on a five-pointscale, so that the maximum score for each scale is 35.
The data depicted in Figure 3 clearly indicate that in comparison with the actual environ-ment, students prefer an environment with higher levels of student cohesiveness, open-ended-ness, integration, rule clarity, and material environment. These results replicate the findings ofprevious studies using the SLEI (Giddings & Fraser, 1990) and a modified form of the SLEI,the Chemistry Laboratory Environment Inventory (CLEI) (Wong & Fraser, 1996), whichshowed that students prefer a more positive learning environment with regard to all five scalesof the SLEI.
Associations between Students’ Perceptions of Classroom and Laboratory Learning Environments and Student Outcomes
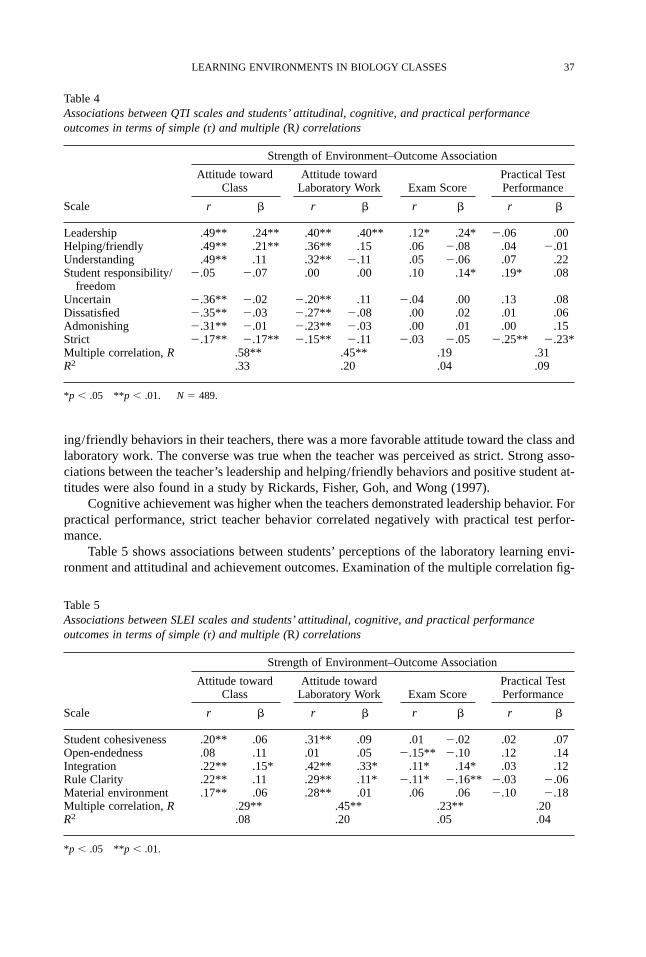
To investigate associations between students’ perceptions of learning environment and stu-dents’ attitudinal, cognitive, and practical performance outcomes, the data were analyzed usingboth simple and multiple correlation analyses. Tables 4 and 5 report these results separately forthe QTI and the SLEI, respectively. Whereas the simple correlation (r) in Table 4 describes thebivariate association between an outcome and a QTI scale, the standardized regression weight(b) characterizes the association between an outcome and a particular QTI scale when all otherQTI dimensions are controlled.
The multiple correlation (R) data reported in Table 4 indicate that associations werestrongest between students’ perceptions of interpersonal teacher behavior and attitudinal out-comes. Simple correlation (r) figures indicate statistically significant associations between stu-dents’ attitudinal outcomes and all QTI scales except student responsibility/freedom. The betaweights show that some of these associations, notably those between leadership and both of theattitudinal outcomes, retained their significance in a more conservative multivariate test with allother QTI scales controlled. In classes where the students perceived greater leadership and help-
Figure 3. Scale means for actual and preferred versions of the SLEI.
LEARNING ENVIRONMENTS IN BIOLOGY CLASSES 37
ing/friendly behaviors in their teachers, there was a more favorable attitude toward the class andlaboratory work. The converse was true when the teacher was perceived as strict. Strong asso-ciations between the teacher’s leadership and helping/friendly behaviors and positive student at-titudes were also found in a study by Rickards, Fisher, Goh, and Wong (1997).
Cognitive achievement was higher when the teachers demonstrated leadership behavior. Forpractical performance, strict teacher behavior correlated negatively with practical test perfor-mance.
Table 5 shows associations between students’ perceptions of the laboratory learning envi-ronment and attitudinal and achievement outcomes. Examination of the multiple correlation fig-
Table 4Associations between QTI scales and students’ attitudinal, cognitive, and practical performance outcomes in terms of simple (r) and multiple (R) correlations
Strength of Environment–Outcome Association
Attitude toward Attitude toward Practical TestClass Laboratory Work Exam Score Performance
Scale r b r b r b r b
Leadership .49** .24** .40** .40** .12* .24* 2.06 .00Helping/friendly .49** .21** .36** .15 .06 2.08 .04 2.01Understanding .49** .11 .32** 2.11 .05 2.06 .07 .22Student responsibility/ 2.05 2.07 .00 .00 .10 .14* .19* .08
freedomUncertain 2.36** 2.02 2.20** .11 2.04 .00 .13 .08Dissatisfied 2.35** 2.03 2.27** 2.08 .00 .02 .01 .06Admonishing 2.31** 2.01 2.23** 2.03 .00 .01 .00 .15Strict 2.17** 2.17** 2.15** 2.11 2.03 2.05 2.25** 2.23*Multiple correlation, R .58** .45** .19 .31R2 .33 .20 .04 .09
*p , .05 **p , .01. N 5 489.
Table 5Associations between SLEI scales and students’ attitudinal, cognitive, and practical performance outcomes in terms of simple (r) and multiple (R) correlations
Strength of Environment–Outcome Association
Attitude toward Attitude toward Practical TestClass Laboratory Work Exam Score Performance
Scale r b r b r b r b
Student cohesiveness .20** .06 .31** .09 .01 2.02 .02 .07Open-endedness .08 .11 .01 .05 2.15** 2.10 .12 .14Integration .22** .15* .42** .33* .11* .14* .03 .12Rule Clarity .22** .11 .29** .11* 2.11* 2.16** 2.03 2.06Material environment .17** .06 .28** .01 .06 .06 2.10 2.18Multiple correlation, R .29** .45** .23** .20R2 .08 .20 .05 .04
*p , .05 **p , .01.
38 HENDERSON, FISHER, AND FRASER
ures reveals a similar pattern to those in Table 4 for the QTI, with associations being strongestwith attitudinal outcomes, particularly for students’ attitude to laboratory work. Simple correla-tion figures indicate statistically significant associations between attitudinal outcomes and allSLEI scales except open-endedness. This finding for open-endedness replicates that for previ-ous studies (e.g., Fraser et al., 1995; Waldrip & Wong, 1996), lending further weight to the suggestion that increasing the level of open-endedness in laboratory activities can lead to in-creasingly negative science-related attitudes in students. Open-endedness would appear to be adesirable feature of a senior science learning environment, but it may well be that when facedwith an externally assessed examination at the end of the course, students do not wish to di-verge from the perceived curriculum and look unfavorably on such activities. The multiple re-gression analysis indicates that Integration was the scale most strongly associated with attitudi-nal outcomes when other SLEI scales were mutually controlled.
In this study, multiple linear regression was used at the student level to identify which learn-ing environment scales contributed to the variance in student outcomes. Hierarchical linear mod-el (HLM) analysis provides an alternative to multiple linear regression for research into associ-ations between learning environments and student outcomes and can be used to analyse data attwo levels of analysis together (namely, the student and the class levels), but a study by Goh,Young, and Fraser (1995) showed that multiple regression analysis and HLM analysis did pro-duce broadly similar results when used with the same set of data. Moreover, the number of class-es used in the present study was only 28 (reflecting the small size of the enrolment in seniorsecondary biology in Tasmania), and therefore it was not possible to conduct either meaningfulHLM analyses or meaningful multiple regression analyses at the class level.
Unique and Common Contributions of QTI and SLEI to Variance in Outcomes
As previously mentioned, this study appears to be the first to use both the QTI and the SLEIwith the same sample of students. The use of both instruments would be justified in future re-search if each were found to make unique contributions to the variance in student outcomes.Therefore, commonality analysis was used to determine the common and unique contributionsof each instrument to variance in student outcomes.
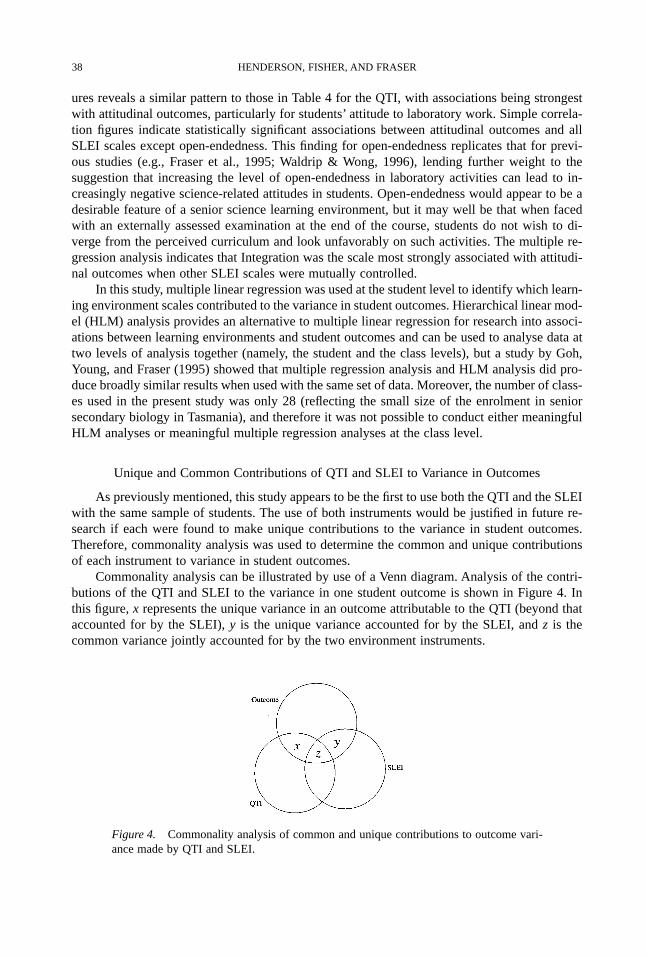
Commonality analysis can be illustrated by use of a Venn diagram. Analysis of the contri-butions of the QTI and SLEI to the variance in one student outcome is shown in Figure 4. Inthis figure, x represents the unique variance in an outcome attributable to the QTI (beyond thataccounted for by the SLEI), y is the unique variance accounted for by the SLEI, and z is thecommon variance jointly accounted for by the two environment instruments.
Figure 4. Commonality analysis of common and unique contributions to outcome vari-ance made by QTI and SLEI.
LEARNING ENVIRONMENTS IN BIOLOGY CLASSES 39
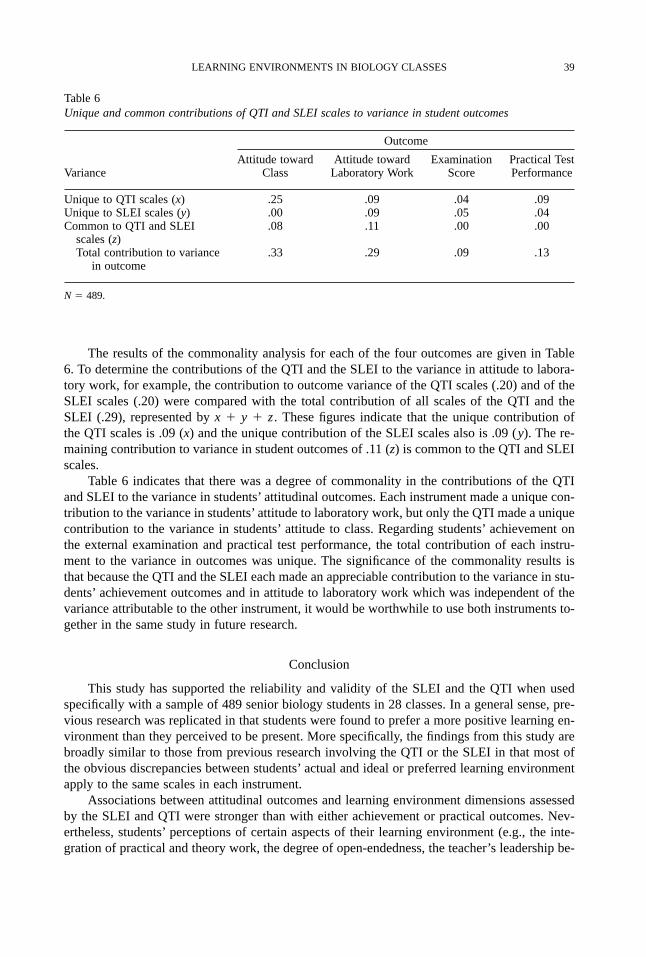
The results of the commonality analysis for each of the four outcomes are given in Table6. To determine the contributions of the QTI and the SLEI to the variance in attitude to labora-tory work, for example, the contribution to outcome variance of the QTI scales (.20) and of theSLEI scales (.20) were compared with the total contribution of all scales of the QTI and theSLEI (.29), represented by x 1 y 1 z . These figures indicate that the unique contribution of the QTI scales is .09 (x) and the unique contribution of the SLEI scales also is .09 (y). The re-maining contribution to variance in student outcomes of .11 (z) is common to the QTI and SLEIscales.
Table 6 indicates that there was a degree of commonality in the contributions of the QTIand SLEI to the variance in students’ attitudinal outcomes. Each instrument made a unique con-tribution to the variance in students’ attitude to laboratory work, but only the QTI made a uniquecontribution to the variance in students’ attitude to class. Regarding students’ achievement onthe external examination and practical test performance, the total contribution of each instru-ment to the variance in outcomes was unique. The significance of the commonality results isthat because the QTI and the SLEI each made an appreciable contribution to the variance in stu-dents’ achievement outcomes and in attitude to laboratory work which was independent of thevariance attributable to the other instrument, it would be worthwhile to use both instruments to-gether in the same study in future research.
Conclusion
This study has supported the reliability and validity of the SLEI and the QTI when usedspecifically with a sample of 489 senior biology students in 28 classes. In a general sense, pre-vious research was replicated in that students were found to prefer a more positive learning en-vironment than they perceived to be present. More specifically, the findings from this study arebroadly similar to those from previous research involving the QTI or the SLEI in that most ofthe obvious discrepancies between students’ actual and ideal or preferred learning environmentapply to the same scales in each instrument.
Associations between attitudinal outcomes and learning environment dimensions assessedby the SLEI and QTI were stronger than with either achievement or practical outcomes. Nev-ertheless, students’ perceptions of certain aspects of their learning environment (e.g., the inte-gration of practical and theory work, the degree of open-endedness, the teacher’s leadership be-
Table 6Unique and common contributions of QTI and SLEI scales to variance in student outcomes
Outcome
Attitude toward Attitude toward Examination Practical TestVariance Class Laboratory Work Score Performance
Unique to QTI scales (x) .25 .09 .04 .09Unique to SLEI scales (y) .00 .09 .05 .04Common to QTI and SLEI .08 .11 .00 .00
scales (z)Total contribution to variance .33 .29 .09 .13
in outcome
N 5 489.
40 HENDERSON, FISHER, AND FRASER
havior, and the level of student responsibility and freedom) were associated with cognitive andpractical performance outcomes.
Unique contributions of the SLEI and QTI to variance in achievement were found, althoughsome commonality was found in their contributions to the variance in attitudinal outcomes. Be-cause the QTI and the SLEI each made an appreciable contribution to the variance in achieve-ment outcomes, which was independent of the variance attributable to the other instrument, theuse of both instruments together in future research studies can be justified.
This study is distinctive in that it included student perceptions of interpersonal teacher be-havior and student perceptions of the laboratory environment in the one study, and because itinvestigated outcome–environment associations with three categories of student outcomes (at-titudes, achievement, and practical performance).
This study provides evidence of substantial differences between senior biology students’perceptions of their actual learning environment and the learning environment ideally liked orpreferred. Because previous research has indicated that achieving a closer match between stu-dents’ actual and ideal or preferred learning environments is likely to lead to more favorablestudent outcomes (Fraser & Fisher, 1983a, 1983b; Fraser, 1994), this study provides biologyteachers with information about aspects of the learning environment that, if altered, could leadto increases in students’ attitudinal and achievement gains.
This study has indicated that many aspects of teacher interpersonal behavior and the labo-ratory learning environment are associated with students’ attitudinal outcomes. For example, favorable student attitudes were found to be associated with a student’s perceptions of theteacher’s strong leadership, a greater degree of integration of practical and theory work, andmore rule clarity.
Associations between students’ perceptions of the learning environment and achievementoutcomes reported in this study suggest that the teacher’s strong leadership, provision of a de-gree of student responsibility and freedom, and integration of practical and theory componentsof the course are likely to promote achievement, whereas a greater degree of strict behavior bythe teacher, emphasis on rule clarity and an open-ended approach to the course are negativelyassociated with student achievement.
The results of this study indicate that teacher interpersonal behavior, as measured by theQTI, and the laboratory learning environment, as measured by the SLEI, are complementaryrather than overlapping aspects of the learning environment in terms of their associations withstudent outcomes. Teachers or researchers using both instruments with their classes thereforewill obtain a more complete picture of those aspects of the learning environment likely to pro-mote student attitude and achievement.
References
Brekelmans, M., Wubbels, T., & Creton, H.A. (1990). A study of student perceptions ofphysics teacher behavior. Journal of Research in Science Teaching, 27, 335–350.
Cooley, W.W., & Lohnes, P.R. (1976). Evaluation research in education. New York: Irv-ington.
Fisher, D.L., Fraser, B.J., & Wubbels, T. (1993). Interpersonal teacher behavior and schoolclimate. In T. Wubbels & J. Levy (Eds.), Do you know what you look like? Interpersonal rela-tionships in education (pp. 103–122). London: Falmer Press.
Fisher, D.L., Rickards, T.W., & Fraser, B.J. (1996). Assessing teacher–student interperson-al relationships in science classes. Australian Science Teachers Journal, 42, 28–33.
Fraser, B.J. (1981). Test of Science-Related Attitudes (TOSRA). Melbourne: AustralianCouncil for Educational Research.
Fraser, B.J. (1986). Classroom environment. London: Croom Helm.Fraser, B.J. (1991). Two decades of classroom environment research. In B.J. Fraser & H.J.
Walberg (Eds.), Educational environments: Evaluation, antecedents and consequences (pp. 3–27). Oxford, England: Pergamon Press.
Fraser, B.J. (1994). Research on classroom and school climate. In D. Gabel (Ed.), Hand-book of research on science teaching and learning (pp. 493–541). New York: Macmillan.
Fraser, B.J. (1998). Science learning environments: Assessment, effects and determinants.In B.J. Fraser & K.G. Tobin (Eds.), The international handbook of science education (pp. 527–564). Dordrecht, The Netherlands: Kluwer.
Fraser, B.J., & Fisher, D.L. (1983a). Use of actual and preferred classroom environmentscales in person–environment fit research. Journal of Educational Psychology, 75, 303–313.
Fraser, B.J., & Fisher, D.L. (1983b). Student achievement as a function of person–envi-ronment fit: A regression surface analysis. British Journal of Educational Psychology, 53, 89–99.
Fraser, B.J., Giddings, G.J., & McRobbie, C.J. (1995). Evolution and validation of a per-sonal form of an instrument for assessing science laboratory classroom environments. Journalof Research in Science Teaching, 32, 399–422.
Fraser, B.J., McRobbie, C.J., & Giddings, G.J. (1993). Development and cross-national val-idation of a laboratory classroom environment instrument for senior high school science. Sci-ence Education, 77, 1–24.
Fraser, B.J., & Walberg, H.J. (Eds.), (1991). Educational environments: Evaluation, an-tecedents and consequences. Oxford, England: Pergamon Press.
Fraser, B.J., Walberg, H.J., Welch, W.W., & Hattie, J.A. (1987). Synthesis of educationalproductivity research. International Journal of Educational Research, 11, 145–252.
Getzels, J.W., & Thelen, H.A. (1960). The classroom as a unique social system. In N.B.Henry (Ed.), The dynamics of instructional groups: Sociopsychological aspects of teaching andlearning (59th yearbook of the National Society for the Study of Education, Part 2) (pp. 53–81). Chicago: University of Chicago Press.
Giddings, G.J., & Fraser, B.J. (1990, April). Cross-national development, validation and useof an instrument for assessing the environment of science laboratory classes. Paper presented atthe Annual Meeting of the American Educational Research Association (AERA), Boston, MA.
Goh, S.C., & Fraser, B.J. (1996). Validation of an elementary school version of the ques-tionnaire on teacher interaction. Psychological Reports, 79, 515–522.
Goh, S.C., Young, D.J., & Fraser, B.J. (1995). Psychosocial climate and student outcomesin elementary mathematics classrooms: A multilevel analysis. Journal of Experimental Educa-tion, 64, 29–40.
Haertel, G.D., Walberg, H.J., & Haertel, E.H. (1981). Socio-psychological environmentsand learning: A quantitative synthesis. British Educational Research Journal, 7, 27–36.
Kelly, P.J., & Lister, R. (1969). Assessing practical ability in Nuffield A-level biology. InJ.F. Eggleston & J.F. Kerr (Eds.), Studies of assessment (pp. 129–142). London: English Uni-versities Press.
Kent, H.A., & Fisher, D.L. (1997, March). Associations between teacher personality andclassroom environment. Paper presented at the annual meeting of the American Educational Re-search Association, Chicago, IL.
Leary, T. (1957). An interpersonal diagnosis of personality. New York: Ronald Press.Levy, J., Creton, H., & Wubbels, T. (1993). Perceptions of interpersonal teacher behavior.
LEARNING ENVIRONMENTS IN BIOLOGY CLASSES 41
In T. Wubbels & J. Levy (Eds.), Do you know what you look like? Interpersonal relationshipsin education (pp. 29–45). London, England: Falmer Press.
Lewin, K. (1936). Principles of topological psychology. New York: McGraw.McRobbie, C.J., & Fraser, B.J. (1993a). Associations between student outcomes and psy-
chosocial science environment. Journal of Educational Research, 87, 78–85.McRobbie, C.J., & Fraser, B.J. (1993b, November). A typology for university and school
science laboratory classes. Paper presented at the annual conference of the Australian Associa-tion for Research in Education, Perth, W.A.
Moos, R.H. (1974). The social climate scales: An overview. Palo Alto, CA: Consulting Psy-chologists Press.
Murray, H.A. (1938). Explorations in personality. New York: Oxford University Press.Pedhazur, E.J. (1982). Multiple regression in behavioral research: Explanation and predic-
tion. New York: Holt, Rinehart, & Winston.Rickards, T.W., Fisher, D.L., Goh, S.C., & Wong, A.F.L. (1997, January). Perceptions of in-
terpersonal behaviour in secondary science classes. Paper presented at the International Con-ference on Science, Mathematics and Technology Education, Hanoi, Vietnam.
Schools Board of Tasmania (1990). Higher school certificate manual for 1990 and 1991.Hobart, Australia: Schools Board of Tasmania.
Tamir, P. (1991). Practical work in school science: An analysis of current practice. In B.E.Woolnough (Ed.), Practical science: The role and reality of practical work in school science(pp. 13–20). Milton Keynes: Open University Press.
Tamir, P., Nussinovitz, R., & Friedler, Y. (1980). Practical tests assessment inventory (PTAI)(Tech. Rep. No. 80-15). Jerusalem: Israel Science Teaching Center, Hebrew University.
Tamir, P., Nussinovitz, R., & Friedler, Y. (1982). The design and use of a practical tests as-sessment inventory. Journal of Biological Education, 16, 42–50.
Taylor, P.C., Fraser, B.J., & Fisher, D.L. (1997). Monitoring constructivist classroom learn-ing environments. International Journal of Educational Research, 27, 293–302.
Teh, G., & Fraser, B.J. (1994). An evaluation of computer-assisted learning in terms ofachievement, attitudes and classroom environment. Evaluation and Research in Education, 8,147–161.
Walberg, H.J. (1981). A psychological theory of educational productivity. In F. Farley andN. Gordon (Eds.), Psychology and education: The state of the union (pp. 81–108). Berkeley,CA: McCutchan.
Walberg, H.J. (1984). Improving the productivity of America’s schools. Educational Lead-ership, 41, 19–27.
Walberg, H.J. (1986). Syntheses of research on teaching. In M.C. Wittrock (Ed.), Handbookof research on teaching (3rd. ed.) (pp. 214–229). Washington, DC: American Educational Re-search Association.
Walberg, H.J., Fraser, B.J., & Welch, W.W. (1986). A test of a model of educational pro-ductivity among senior high school students. Journal of Educational Research, 79, 133–139.
Waldrip, B.G., & Wong, A.F.L. (1996). Association of attitudes with science laboratory en-vironments in Singapore and Papua New Guinea. Journal of Science and Mathematics in South-east Asia, 19, 26–37.
Wong, A.F.L., & Fraser, B.J. (1995). Cross-validation in Singapore of the science labora-tory environment inventory. Psychological Reports, 76, 907–911.
Wong, A.F.L., & Fraser, B.J. (1996). Environment-attitude associations in the chemistry lab-oratory classroom. Research in Science and Technological Education, 14, 91–102.
Wubbels, T. (1993). Teacher-student relationships in science and mathematics classes. In
42 HENDERSON, FISHER, AND FRASER
B.J. Fraser (Ed.), Research implications for science and mathematics teachers (Vol. 1). Perth:National Key Centre for School Science and Mathematics, Curtin University.
Wubbels, T., Brekelmans, M., & Hooymayers, H.P. (1991). Interpersonal teacher behaviorin the classroom. In B.J. Fraser & H.J. Walberg (Eds.), Educational environments: Antecedents,consequences and evaluation (pp. 141–160). Oxford: Pergamon Press.
Wubbels, T., Creton, H., Levy, J., & Hooymayers, H. (1993). The model for interpersonalteacher behavior. In T. Wubbels & J. Levy (Eds.), Do you know what you look like? Interper-sonal relationships in education (pp. 13–28). London: Falmer Press.
Wubbels, T., & Levy, J. (1991). A comparison of interpersonal behavior of Dutch and Amer-ican teachers. International Journal of Intercultural Relationships, 15, 1–18.
Wubbels, T., & Levy, J. (Eds.). (1993). Do you know what you look like? Interpersonal re-lationships in education. London: Falmer Press.
LEARNING ENVIRONMENTS IN BIOLOGY CLASSES 43