Embed Size (px)
DESCRIPTION
Internship ReportFinancial Statement AnalysisFirst Security Islami Bank Ltd.by Moez Ansary
Citation preview
Financial Statements Analysis of an
Islami Bank in Bangladesh
A Study on First Security Islami
Bank Limited, Bangladesh
Internship Report
on
“Financial Statements Analysis of an Islami Bank in Bangladesh:
A Study on First Security Islami Bank Limited, Bangladesh”
Supervised By:
Mr. Iehit Sharma
Senior Lecturer
Department of Business Administration
Leading University, Sylhet
Submitted By:
Moez Al Azim Ansary
ID: 1101010183
Major in Accounting & Information Systems
BBA Program
27th Batch
Department of Business Administration
Leading University, Sylhet
Submitted To:
Department of Business Administration
For the partial fulfillment of the requirements for the
Degree of Bachelor of Business Administration (BBA)
Major in Accounting & Information Systems (AIS)
at
Leading University
Sylhet, Bangladesh
Date of Submission: February 28, 2015

:v.r6FrRgRFffi<rt<eft:ritd d,ii s.)t-l ulllr$y,. .. r[i rt nst sEcu RlrY ts LAM I BAN K trD.
FSIBL/AMBI2O|5I25
Date 05.01 .2015
To whom it may Concern
This is to certify that Mr. Moez Al Azim Ansary S/o Abdul Hannan Ansary of 68 Payra
Jhamarpar, Dargah Moholla, Sylhet, an intern from Leading University, Sylhet has
completed his internship program at our Branch with adequate dedication sincerity &responsibility. During the three months period Mr. Moez Al Azim Ansary rotatedhimself to various working desk at the branch and has learned many primary level and
useful practical banking functions.
We wish him every success in life.
2-al{Md. Sohrab Uddin MollaAsstt Vice President & Manager
AMBARKHANABRANCH: ;
MWenCornplex,Holding#&f0,641,WalrebsBSS,WestAmbarkhana,Sylhet-3100
; www.fsiblbd.com
iv
Letter of Transmittal
February 28, 2015
Mr. Iehit Sharma
Senior Lecturer
Department of Business Administration
Leading University, Sylhet
Subject: Submission of Internship Report
Dear Sir,
With the passage of time, I am now standing on the verge of Bachelors of
Business Administration program, hence am finalized with my Internship Report
named “Financial Statements Analysis of an Islami Bank in Bangladesh: A
Study on First Security Islami Bank Limited, Bangladesh”. Vividly enough, my
research comprises adequate endeavors. But no doubt, my contribution will be
best evaluated on your sharp scale of acceptance and remarks.
Consequently, I am transmitting my Internship Report to your very concern.
Hopefully you will discover my well-researched, informative and innovative
approach as a hallmark of exploration. Rather, in case of any further clarification
or elaboration as to my research work, I would welcome the opportunity to
consult with you to explore how my findings could best meet your needs.
Thanking you.
Yours Sincerely,
___________________________ Moez Al Azim Ansary
ID No: 1101010183
Major: Accounting & Information Systems
BBA Program (27th Batch)
Department of Business Administration
Leading University, Sylhet
v
Letter of Acceptance
February 28, 2015
This is to certify that Internship Report titled “Financial Statements Analysis
of an Islami Bank in Bangladesh: A Study on First Security Islami Bank
Limited, Bangladesh” is submitted in partial fulfillment of the requirements for
the award of the degree in Bachelor of Business Administration from Leading
University, Sylhet is a record of the analysis carried out by Moez Al Azim Ansary,
ID No-1101010183 under my active supervision and guidance as the partial
fulfillment for the award of BBA degree.
I wish his success in the future.
Supervisor
___________________________________
Mr. Iehit Sharma
Senior Lecturer
Department of Business Administration
Leading University, Sylhet
vi
Declaration
I, Moez Al Azim Ansary, a student of BBA program at Leading University, Sylhet,
solemnly affirm and hereby declare that the Internship report titled “Financial
Statements Analysis of an Islami Bank in Bangladesh: A Study on First
Security Islami Bank Limited, Bangladesh” submitted in partial fulfillment of
the requirements for completion of the degree in Bachelor of Business
Administration at Leading University, Sylhet.
I also declare that this report is prepared after completing my three months
Internship period in First Security Islami Bank Limited, Amborkhana Branch,
Sylhet. This is my original work and not submitted for the award of any other
Degree, Diploma Fellowship or other similar title or prizes. It is prepared under
the extensive supervision and guidance of Mr. Iehit Sharma, Senior Lecturer,
Department of Business Administration, Leading University, Sylhet.
Declared by
___________________________ Moez Al Azim Ansary
ID No: 1101010183
Major: Accounting & Information Systems
BBA Program (27th Batch)
Department of Business Administration
Leading University, Sylhet

vii
Acknowledgement
First, I would like to express my gratitude to almighty ALLAH to give me the
strength to complete the study within the stipulated time.
I deeply thank to my honorable internship supervisor Mr. Iehit Sharma, Senior
Lecturer, Department of Business Administration, Leading University for
assigning me the project and for all his kind support to accomplish it. His
valuable suggestions and guidance helped me a lot to prepare the report in a
well-organized manner. I would like to thank our whole Department of Business
Administration specially Head of the Department Dr. Tofayel Ahmed, for
facilitating me to do internship and preparing this report.
I also wish to thank and give the due respect to my family and friends for their
cordial support and help they offered throughout the process of performing the
whole report.
Finally, my heartfelt gratitude goes to Mr. Md. Sohrab Uddin Molla (Branch
Manager and AVP), Mr. Md. Maksud Ibn Mustafa (SPO and Operation Manager),
Mr. Salahuddin Shamim (Probationary Officer), Mr. Md. Ishtiaque Uddin
(Probationary Officer), Mr. Anwar Hossain Misba (Senior Cash Officer), Mr. Ariful
Islam Nayeem (Assistant Officer), Mrs. Rabea Binte Shiraj (Principal Officer) and
all the co-workers of First Security Islami Bank Limited, Amborkhana Branch,
Sylhet for their keenness in giving me training and valuable information, which
was very helpful to complete my internship report.
viii
Executive Summary
Banks are the most important financial institutions in modern economy. They
are an integral part of modern economic activities. In a developing country like
Bangladesh, the Islamic banking system as a whole has a vital role play in the
process of economic development. First Security Islami Bank Limited (FSIBL) has
started its journey on 29th August 1999 with the said principles in mind and
conduct banking system according to Shariah based policy. This report mainly
deals with the financial statements analysis of an Islami bank in Bangladesh: a
study on First Security Islami Bank Limited. The horizontal analysis, vertical
analysis and ratio analysis are essential technique for financial statements
analysis. Different users such as investors, management, bankers and creditors
use the financial statements analysis of a company for their decision making
purpose. In this report, the financial statements of First Security Islami Bank
Limited have been studied for five years from 2009 to 2013 and also different
types of financial ratios of the bank are calculated. The clear concept on bank,
Islamic banking and different types of financial analysis are given in the report.
The liquidity, profitability, financial position and the financial trend of First
Security Islami Bank Limited are the main focus of this report which have been
analyzed and used for comparing different years. By analyzing the financial
statements of the bank, it has been traced the financial strengths and weakness
of the bank. Finally some comments are shown regarding the changes of this
bank’s financial performance for the last five years. By analyzing the horizontal,
vertical and different ratios like liquidity ratios, efficiency ratios, profitability
ratios, solvency ratios and market prospect ratios, and cash flow analysis, it can
be said that FSIBL has been improving and doing well in the last five years except
in few years. So the bank should be concern about the types of financial analysis
especially the types of ratios. However, FSIBL’s overall earnings performance
was satisfactory, but it should be improved.
ix
Table of Contents
Chapter Title Page No. One Introduction 1-6
1.1
1.2
1.3
1.4
1.5
1.6
1.7
Origin of the Report
Significance of the Study
Objective of the Study
Scope of the Study
Methodology of the Study
Sources of Data
Limitation of the Study
2
2
3
3
4
5
6
Two Theoretical Overview 7-45
2.1
2.2
2.3
2.4
2.5
2.6
2.7
2.8
2.9
2.10
2.11
Bank
Functions of Bank
Islamic Banking
2.3.1: Principles of Islamic Banking
2.3.2: Riba or Interest
Difference between Riba and Profit
Difference between Conventional Banking and Islamic
Banking
Financial Statements
Components of Financial Statements
Components of Bank’s Financial Statements
Financial Statements Analysis
Techniques to Financial Statements Analysis
Literature Review
2.11.1: Classification of Assets and Liabilities
2.11.2: Limitations of Financial Statements
2.11.3: Building Blocks of Financial Statement
.................Analysis
2.11.4: Horizontal Analysis
2.11.5: Vertical Analysis
8
9
14
15
15
16
17
18
19
19
20
20
21
22
24
25
25
28
x
2.12
2.11.6: Ratio Analysis
Relationships between Financial Statements
30
44
Three Organizational Overview 46-63
3.1
3.2
3.3
3.4
3.5
3.6
3.7
3.8
3.9
Corporate Profile of FSIBL
Historical Background of FSIBL
Vision, Mission, Objective and Strategies of FSIBL
Organizational Structure of FSIBL
Branches of FSIBL
Functions of FSIBL
Features of FSIBL
Principal Products & Services of FSIBL
Society for Worldwide Interbank Financial
47
49
50
52
55
59
60
61
63
Four Core Part : Financial Statements Analysis of FSIBL 64-100
4.1
4.2
4.3
4.4
4.5
4.6
Introduction
Reconstruction of Financial Statements of FSIBL
Horizontal Analysis
4.3.1: Comparative Balance Sheet Analysis
4.3.2: Comparative Income Statement Analysis
4.3.3: Trend Analysis
Vertical Analysis
4.4.1: Common-size Balance Sheets Analysis
4.4.2: Common-size Income Statements Analysis
Ratio Analysis
4.5.1: Liquidity and Efficiency Ratio
4.5.2: Solvency Ratio
4.5.3: Profitability Ratio
4.5.4: Market Prospects Ratio
Analysis of Cash Flow Statement
65
65
68
68
70
73
76
79
82
83
83
89
93
96
98
Five Findings, Recommendation and Conclusion 101-106
5.1
5.2
5.3
Findings
Recommendations
Conclusion
102
105
106

xi
References
Appendix
107
109

1
Introduction
Chapter One
Introduction
F i r s t S e c u r i t y I s l a m i B a n k L i m i t e d . . .
F i n a n c i a l S t a t e m e n t s A n a l y s i s | 2Financial statement analysis is the process of reviewing and analyzing acompany's financial statements to make better economic decisions. Thesestatements include the income statement, balance sheet, statement of cashflows, and statement of retained earnings. Financial statement analysis isrequired for evaluating risks, performance, financial health, and futureprospects of an organization. In this report, the financial statements of FirstSecurity Islami Bank Limited (FSIBL) are analyzed. FSIBL is one of the reputedbanks in Bangladesh. It conducts its banking activities according to IslamiShariah.1.1: Origin of the ReportThis report on “Financial Statements Analysis of an Islami Bank inBangladesh: A Study on First Security Islami Bank Limited, Bangladesh” hasbeen prepared as a partial requirement for the completion of the internshipprogram for the Bachelor of Business Administration (BBA) program ofLeading University, Sylhet. For internship purpose, I chose First SecurityIslami bank Ltd. (FSIBL), Ambarkhana Branch, Sylhet. The preparation ofthis report was supervised by Mr. Iehit Sharma, Senior Lecturer, LeadingUniversity, Sylhet.1.2: Significance of the StudyFirst Security Islami Bank Ltd. is one of the leading private banks inBangladesh. It provides highest benefits to its clients among the IslamiBanks in Bangladesh. There are few private banks those provide profits orinterest to their clients as high as FSIBL. FSIBL’s banking system is aiming toattain the goal of Islamic Economy through setting well designed IslamicMonitory System. Islam has clear-cut guidelines to avoid interest (Riba)regarding use of money. So, Islamic Banking System strongly follows theIslamic Shariah in its business. Islamic Shariah appreciates risk and profitsharing. As an Islami bank FSIBL has to take risk when doing banking
F i r s t S e c u r i t y I s l a m i B a n k L i m i t e d . . .
F i n a n c i a l S t a t e m e n t s A n a l y s i s | 3business and share profit to its stakeholders and customers. So, to knowabout the ability of the bank to take risk and making profits, its financialstrength and performance should be understood. Therefore, the financialstatements of the bank should be analyzed for understanding the financialstrength and performance of the bank.1.3: Objective of the Study
General Objective:
To analyze the financial statements of First Security Islami Bank Ltd.with the key focus of its overall financial performance.Specific Objectives:
To know the current financial position of First Security Islami BankLtd. To know the five years financial performance of FSIBL by calculatingand analyzing different types of ratio. To know the financial trend of FSIBL focusing the five years’ financialperformance. To get the practical experience on banking activities. To give some recommendation for the development of First SecurityIslami Bank Ltd.
1.4: Scope of the StudyThis report is based on my observation and studies during my internshipperiod in First Security Islami Bank Limited, at Amborkhana Branch. Theprime focus was on financial statement analysis of First Security Islami BankLimited for giving some concepts about the financial position and financialperformance of the bank over at least five years. The scope of my study islimited to the First Security Islami Bank Limited. During the three monthsinternship program almost all sections I have been observed. However, inthis report the financial statements of FSIBL are analyzed from differentviewpoint including ratio analysis. This repost may help those people who
F i r s t S e c u r i t y I s l a m i B a n k L i m i t e d . . .
F i n a n c i a l S t a t e m e n t s A n a l y s i s | 4want to know about the financial performance of First Security Islami BankLimited.1.5: Methodology of the StudySeveral types of research methods are used in studies depending on the fieldor research. As this research is on financial statement analysis, certainmethods were followed to fulfill the objectives of the report, making themaximum utilization of the scopes and to avoid the limitations as much aspossible to prepare the final outcome of the report. There are four types ofresearch methods were used to complete this report. These methods are -
Qualitative Method: Qualitative method is concerned with the quality orkind and describing meaning. In this report I have used qualitativeresearch method to provide a clear concept about my research topic andto maintain the standards of my research I have analyzed the financialstatements from different viewpoint. Quantitative Method: Quantitative research is based on the quantitativemeasurements of some characters. It is applicable to phenomena that canbe expressed in terms of quantities. I have used the quantitativeapproaches in this report for some statistical content analysis and todetermine the significance of findings. Analytical Method: In analytical research, the researcher has to use factsor information those already available, and analyze these to make acritical evaluation of the material. In this report, I have used analyticalmethod for ratio analysis and to evaluate the financial performance ofFSIBL. Descriptive Method: Descriptive research includes surveys and fact-finding enquiries of different kinds. The major purpose of descriptiveresearch is description of the state of affairs as it exists at present. In thisrepost, I have used the descriptive approach to explain the financialstatements, graphs, ratios, financial trend, financial performance andcurrent financial condition of FSIBL.
F i r s t S e c u r i t y I s l a m i B a n k L i m i t e d . . .
F i n a n c i a l S t a t e m e n t s A n a l y s i s | 5Financial statement analysis needs the combination of mathematicalequations, graphical presentation and explanation. So, I have used abovefour types of research methods to get proper and successful outcome frommy research.1.6: Sources of DataData have been collected from two sources such as primary sources of dataand secondary sources of data. Primary sources of data are those sourcesfrom which the researcher collects data directly by field work. Andsecondary sources of data are those sources which provide data that arealready collected by another researcher. From this point of view data aretwo types among them one is primary data and another is secondary data.The data directly collected by the researchers are called primary data. Thedata that has been already collected by another researcher or person forhis/her work purpose are called secondary data. I have collected the bothtypes of data from primary and secondary sources.
Primary Sources of Data:
Face to face conversation with the employees,senior officers, SPO and the Manager. Studying different relevant files like register books,statement of affairs, financial statements etc. Practical work at FSIBL during my internshipprogram to increase my knowledge.
Secondary Sources of Data:
Annual Reports including financial reports of FSIBL. Website of FSIBL. Journals and prospectus of FSIBL. Different books, magazines and journals related tothe finance and banking. Different websites and blogs.
F i r s t S e c u r i t y I s l a m i B a n k L i m i t e d . . .
F i n a n c i a l S t a t e m e n t s A n a l y s i s | 6
1.7: Limitation of the StudyI did my best and there has no dearth of sincerity on my part to make thereport. But there are some limitations which I have faced while reaching theobjectives of this report, because it is very difficult to analyze the financialstatements over five years of a Bank. Some of these following limitations areapparent in this study: The time limit of the internship is only 3 months which is very shortperiod of time to learn about whole banking activities. As annual reports need 3-4 months to be published after end of theperiod, I cannot collect the recent annual financial report (2014) ofFSIBL. As final financial statements are prepared in head office, it becomesdifficult to understand the elements of the statements from branchoffice. When I have prepared the classified financial statement fromunclassified one then I faced problem to replacement of the items ofthe statement, because the duration of all items are not properlymentioned. There were lack of proper secondary information about FirstSecurity Islami Bank Limited and its products. Annual reports,policy guidelines, website and other related documents do not coverfull and sufficient information. As the bank officials are so much busy that it was difficult for themto co-operate with me, which is also a constraint for this report.

F i r s t S e c u r i t y I s l a m i B a n k L i m i t e d . . .
F i n a n c i a l S t a t e m e n t s A n a l y s i s | 7
Chapter Two
Theoretical Overview
2
Theoretical Overview
F i r s t S e c u r i t y I s l a m i B a n k L i m i t e d . . .
F i n a n c i a l S t a t e m e n t s A n a l y s i s | 8
2.1: BankBank is a financial institution that collects money from people as depositcommitting to pay interest or profit at a fixed or probable percentage rateto the depositors for their deposited money and lends or invests it to thebusinesses requiring interest or profit as return at a fixed or probablepercentage rate which is higher than the rate at which it pays interest orprofit to the depositors against the loan or investment and gains profitfrom the difference between the interest or profit against loan orinvestment and interest or profit against deposits. In broadly, anyfinancial institution that receives, collects, transfers, pays, exchanges,lends, invests or safeguards money for its customers is called bank.Generally we indicate the commercial bank when using the term “Bank”.Commercial banks are those institutions which conduct the businesspurely on profit motive. Commercial banks receive surplus money fromthe people who are not using it and lend to those who need it forproductive purpose.A commercial bank is a dealer in short and medium-term credit. Itborrows money from a group of people at a lower rate of interest andlends to the other group of people at some higher rate of interest. Thedifference between the two rates of interest is the profit of the bank.
F i r s t S e c u r i t y I s l a m i B a n k L i m i t e d . . .
F i n a n c i a l S t a t e m e n t s A n a l y s i s | 9
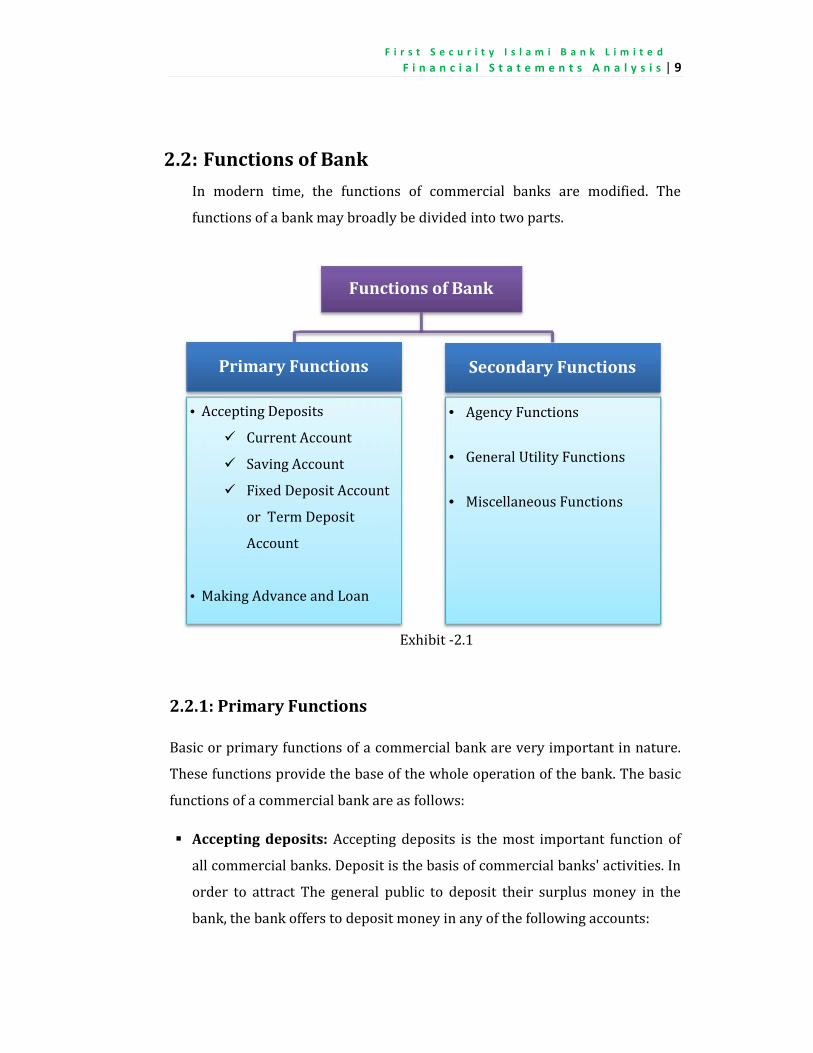
2.2: Functions of BankIn modern time, the functions of commercial banks are modified. Thefunctions of a bank may broadly be divided into two parts.
Exhibit -2.12.2.1: Primary FunctionsBasic or primary functions of a commercial bank are very important in nature.These functions provide the base of the whole operation of the bank. The basicfunctions of a commercial bank are as follows: Accepting deposits: Accepting deposits is the most important function ofall commercial banks. Deposit is the basis of commercial banks' activities. Inorder to attract The general public to deposit their surplus money in thebank, the bank offers to deposit money in any of the following accounts:
Functions of Bank
Secondary FunctionsPrimary Functions
Accepting Deposits Current Account Saving Account Fixed Deposit Accountor Term DepositAccount
Making Advance and Loan
Agency Functions General Utility Functions Miscellaneous Functions

F i r s t S e c u r i t y I s l a m i B a n k L i m i t e d . . .
F i n a n c i a l S t a t e m e n t s A n a l y s i s | 10
Current Account: Current or demand account is one where theamount can be withdrawn at any time by the depositor. Such depositaccounts are generally maintained by businessmen or organizations.They can be drawn upon by a cheque without any restriction. Banksdo not pay any interest on these accounts. Rather, banks imposeservice charges for running these accounts. Saving Account: Saving account is suitable for non-trading and smallincome earners. Saving account helps in mobilization of the saving oflow income people. The commercial banks pay interest on this typeof deposits. But, the interest rate is very poor. Fixed Deposit Account or Term Deposit Account: Fixed depositaccount is the account in which amounts are deposited for a certainfixed period of time. The deposits cannot be withdrawn before theexpiry of this fixed period. The longer the period of deposits, thehigher is the rate of profit or interest. Deposit Scheme Account: These types of deposit accounts are newlyadded by the commercial banks in the banking systems forencouraging the fixed-income and low-income people to deposit. Inthis system people have to pay monthly installment at a fixed amountfor a certain period of time to his/her deposit account, and aftermaturity date he/she will get a large sum of money including theprincipal and profit.
Making Advance and Loan: The deposits received by banks are notallowed to remain idle. So, after keeping certain cash reserves, thebalance is given to needy borrowers and interest is charged from them,which is the main source of income for the banks. Different types ofloans and advances made by Commercial banks are: Overdraft: Overdraft is a short-term loan granted by commercialbanks to their account holders. Under this type of loan, thecustomers are allowed to draw more than what they have intheir current account up to a certain limit. The excess amountoverdrawn is called overdraft.
F i r s t S e c u r i t y I s l a m i B a n k L i m i t e d . . .
F i n a n c i a l S t a t e m e n t s A n a l y s i s | 11
Cash Credit: Cash credit refers to a loan given to the borroweragainst his current assets like shares, stocks, bonds, etc. A creditlimit is sanctioned and the amount is credited in his account. Theborrower may withdraw any amount within his credit limit andinterest is charged on the amount actually withdrawn. Demand Loans: Demand loans refer to those loans which can berecalled on demand by the bank at any time. The entire sum ofdemand loan is credited to the account and interest is payable onthe entire sum. Loans: Commercial banks grant loans for short and medium-term to individuals and traders against the security of movableand immovable property. The amount of loan is credited to theborrower's account. Interest is charged on the entire loansanctioned.
2.2.2: Secondary FunctionsThe secondary functions of commercial bank can be classified in threeheads. They are described below: Agency Functions: The banks render important services as agent onbehalf of their customers in return for a small commission. When banksact as agent, law of agency applies. The agency functions or services ofbank are as follows: Collection of Cheques: Commercial banks collect the cheques, billsof exchange, etc. on behalf of their customers. Banks collect local andoutstation cheques and bills of exchange through clearing housefacilities provided by the central bank. Collection of Income: The commercial banks collect dividends,interest on investment, pension and rent of property due to thecustomers. When any income is collected by the bank, a creditvoucher is sent to the customer for information. Payment of Expenses: The banks make payment of insurancepremiums, rent, trade subscription, school fee and other obligation of
F i r s t S e c u r i t y I s l a m i B a n k L i m i t e d . . .
F i n a n c i a l S t a t e m e n t s A n a l y s i s | 12the customers. When any expense is paid by the bank, a debit voucheris sent to the customer for information. Dealer in Securities: The banks carry out purchase and sale ofsecurities on behalf of their customers. Banks do it well because theyare aware of the market conditions. Acts as Trustee: The banks act as trustee to manage trust propertyas per instructions of property owners. Banks are required to followthe terms and conditions of trust deed. Acts as Agent: Commercial bank sometimes acts as an agent on behalfof its customers at home or abroad in dealing with other banks orfinancial institutions. Obeys Standing Instructions: Sometimes, customer may order hisbank to do something on his behalf regarding the conduct of hisaccount. This written order is called standing instruction. The bankbeing the agent of its customer obeys the standing instructions. Acts as Tax Consultant: Commercial bank acts as tax consultant to itsclient. The commercial bank prepares general sales tax return, incometax return, etc. Tiles the same with tax authorities. Collection of Utility Bills: Commercial banks provide facilities for thecollection of utility bills from general public on behalf of governmentbodies. This facilitates the public to pay utility bills in time.
General Utility Functions: Commercial bank performs different utilityfunctions for their customers. When bank performs utility functions, itdoes not act as an agent of the customers. The general utility functionsare as follows: Provides Lockers Facilities: Commercial banks provide lockersfacilities to its customers for safe custody of Jewelery, shares,securities and other valuables. This has minimized the risk of losingdue to theft.

F i r s t S e c u r i t y I s l a m i B a n k L i m i t e d . . .
F i n a n c i a l S t a t e m e n t s A n a l y s i s | 13
Issue of Travelers Cheque: Commercial banks preserve the wills oftheir customers as trustees and execute them after their death asexecutors. ATM Facilities: An ATM is also known as cash point. The banksnowadays provide ATM facilities through issuing debit card and creditcard. The customers can withdraw money easily and quickly 24 hoursa day. Foreign Exchange: Commercial banks deal in foreign exchange. Thisenables the individuals and businessmen to obtain foreign currency inexchange of their home currency. For dealing in foreign exchange,commercial banks have to obtain permission from the central bank. Transfer of Money: Commercial banks provide facilities for thetransfer of money to any place within and outside the country. Thefunds are transferred by means of draft, telephonic transfer,electronic transfer etc. Finance Foreign Trade: A commercial bank finances foreign trade byaccepting foreign bills of exchange. Bank also issues letter of credit onbehalf of its customers to facilitate foreign trade. Trade Information: Commercial banks collect and provide tradeinformation and tender advice to its customers about financialmatters. Issuing Credit Cards: Banks issue credit cards to their trustworthyand valued customers. This facilitates the customers to pay for theirnecessities of life.
Miscellaneous Functions: Commercial banks perform the followingmiscellaneous functions: Zakat Collection: Commercial banks collect Zakat from their accountholders and deposit the same into Central Zakat Fund, according toZakat and Usher ordinance - 1980. Hajj Services: The commercial banks provide free Hajj sendees to theintending pilgrims. Banks receive Hajj applications. Banks also
F i r s t S e c u r i t y I s l a m i B a n k L i m i t e d . . .
F i n a n c i a l S t a t e m e n t s A n a l y s i s | 14facilitate to form Hajj groups. Banks make necessary arrangements forthe training of intending pilgrims. Qarz-e-Hasna: The commercial banks provide Qarz-e-Hasna todeserving patients for medical treatment and to students for higherstudies within the country and abroad. The Qarz-e-Hasna is refund Alein easy installments.
2.3: Islamic BankingIslamic banking has been defined in a number of ways. The definition ofIslamic bank, as approved by the General Secretariat of the OIC, is stated inthe following manner. "An Islamic bank is a financial institution whosestatus, rules and procedures expressly state its commitment to theprinciple of Islamic Shariah and to the banning of the receipt and paymentof interest on any of its operations"(Ali & Sarkar 1995, pp.20-25). Ajaz A.Khan viewing the concept from the perspective of an Islamic economy andthe prospective role to be played by an Islamic bank therein opines:“Islamic banking is banking or banking activity that is consistent with theprinciples of sharia and its practical application through the developmentof Islamic economics. As such, a more correct term for 'Islamic banking' is'Sharia compliant finance.”It appears from the above definitions that Islamic banking is systems offinancial intermediation that avoids receipt and payment of interest in itstransactions and conducts its operations in a way that helps achieve theobjectives of an Islamic economy. Alternatively, this is a banking systemwhose operation is based on Islamic principles of transactions of whichprofit and loss sharing (PLS) is a major feature, ensuring justice and equityin the economy. That is why Islamic banks are often known as PLS-banks.In single sentence Islamic Bank can be defined as a financial intermediarythat conducts its banking activities according to Islamic Shariah byavoiding receipt and payment of interest/riba in its transactions andconducts its activities based on profit or loss sharing motive for achievingthe objectives of Islamic economy.
F i r s t S e c u r i t y I s l a m i B a n k L i m i t e d . . .
F i n a n c i a l S t a t e m e n t s A n a l y s i s | 15
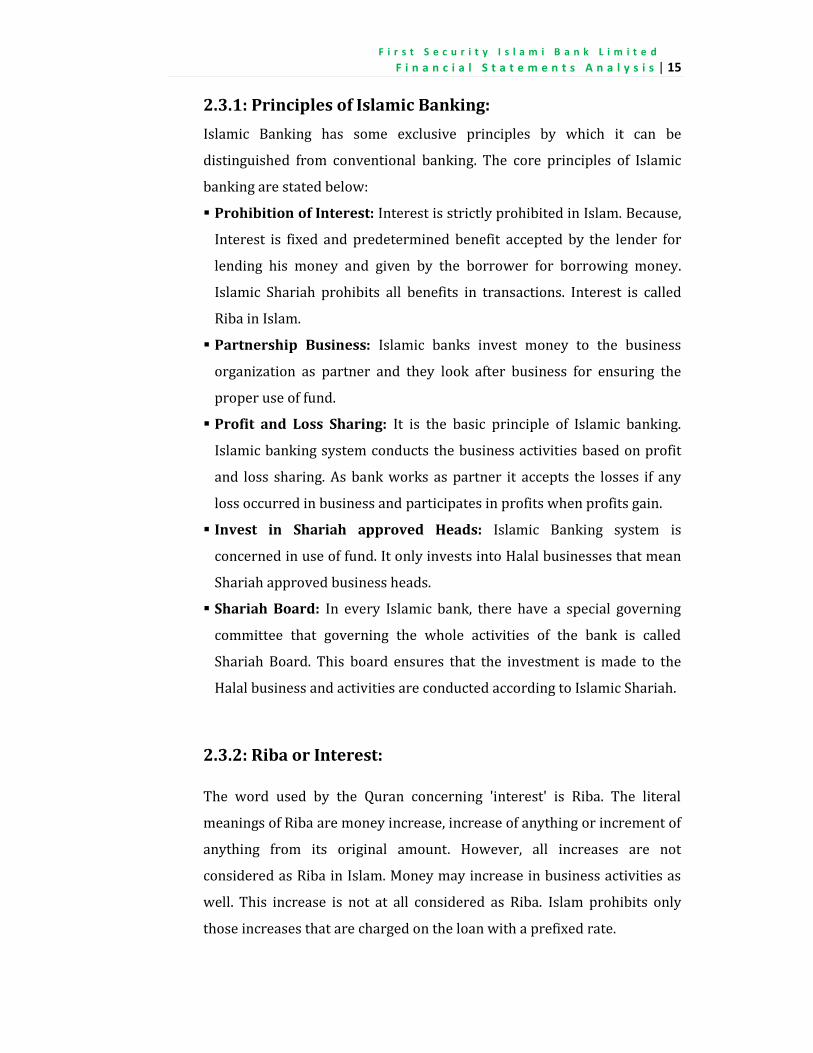
2.3.1: Principles of Islamic Banking:Islamic Banking has some exclusive principles by which it can bedistinguished from conventional banking. The core principles of Islamicbanking are stated below: Prohibition of Interest: Interest is strictly prohibited in Islam. Because,Interest is fixed and predetermined benefit accepted by the lender forlending his money and given by the borrower for borrowing money.Islamic Shariah prohibits all benefits in transactions. Interest is calledRiba in Islam. Partnership Business: Islamic banks invest money to the businessorganization as partner and they look after business for ensuring theproper use of fund. Profit and Loss Sharing: It is the basic principle of Islamic banking.Islamic banking system conducts the business activities based on profitand loss sharing. As bank works as partner it accepts the losses if anyloss occurred in business and participates in profits when profits gain. Invest in Shariah approved Heads: Islamic Banking system isconcerned in use of fund. It only invests into Halal businesses that meanShariah approved business heads. Shariah Board: In every Islamic bank, there have a special governingcommittee that governing the whole activities of the bank is calledShariah Board. This board ensures that the investment is made to theHalal business and activities are conducted according to Islamic Shariah.2.3.2: Riba or Interest:The word used by the Quran concerning 'interest' is Riba. The literalmeanings of Riba are money increase, increase of anything or increment ofanything from its original amount. However, all increases are notconsidered as Riba in Islam. Money may increase in business activities aswell. This increase is not at all considered as Riba. Islam prohibits onlythose increases that are charged on the loan with a prefixed rate.
F i r s t S e c u r i t y I s l a m i B a n k L i m i t e d . . .
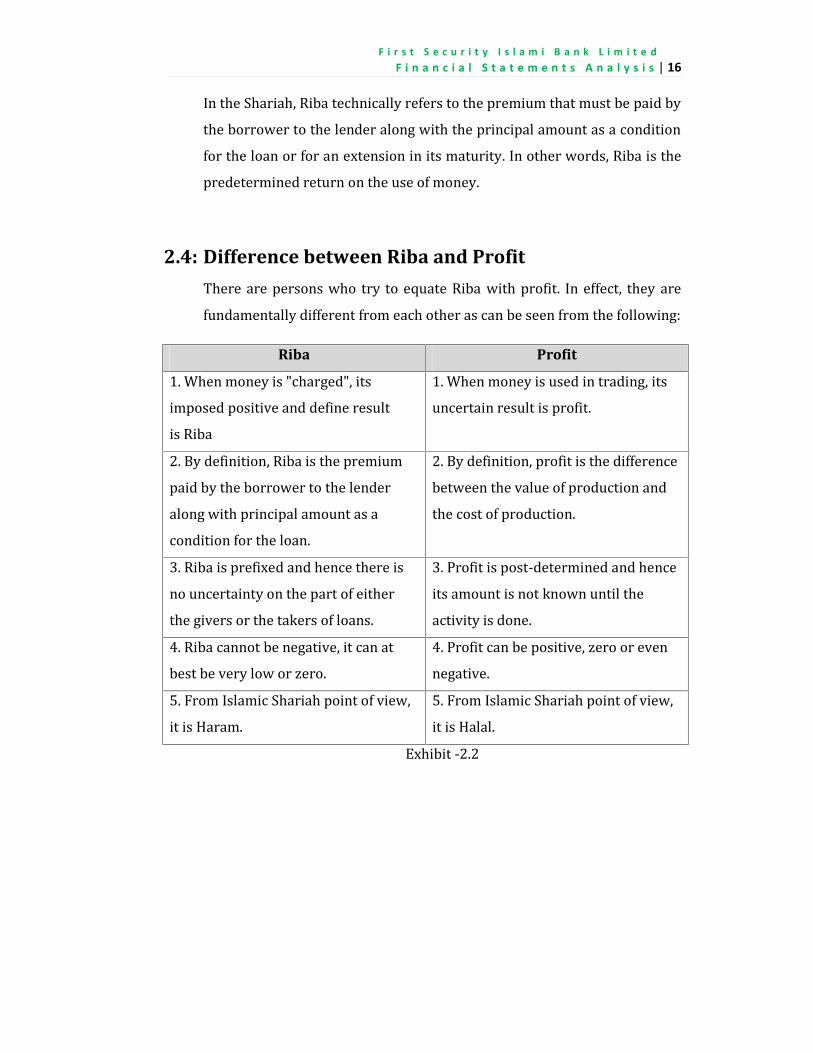
F i n a n c i a l S t a t e m e n t s A n a l y s i s | 16In the Shariah, Riba technically refers to the premium that must be paid bythe borrower to the lender along with the principal amount as a conditionfor the loan or for an extension in its maturity. In other words, Riba is thepredetermined return on the use of money.2.4: Difference between Riba and ProfitThere are persons who try to equate Riba with profit. In effect, they arefundamentally different from each other as can be seen from the following:
Riba Profit1. When money is "charged", itsimposed positive and define resultis Riba1. When money is used in trading, itsuncertain result is profit.
2. By definition, Riba is the premiumpaid by the borrower to the lenderalong with principal amount as acondition for the loan.2. By definition, profit is the differencebetween the value of production andthe cost of production.
3. Riba is prefixed and hence there isno uncertainty on the part of eitherthe givers or the takers of loans.3. Profit is post-determined and henceits amount is not known until theactivity is done.4. Riba cannot be negative, it can atbest be very low or zero. 4. Profit can be positive, zero or evennegative.5. From Islamic Shariah point of view,it is Haram. 5. From Islamic Shariah point of view,it is Halal.Exhibit -2.2
F i r s t S e c u r i t y I s l a m i B a n k L i m i t e d . . .
F i n a n c i a l S t a t e m e n t s A n a l y s i s | 17
2.5: Difference between Conventional Banking and
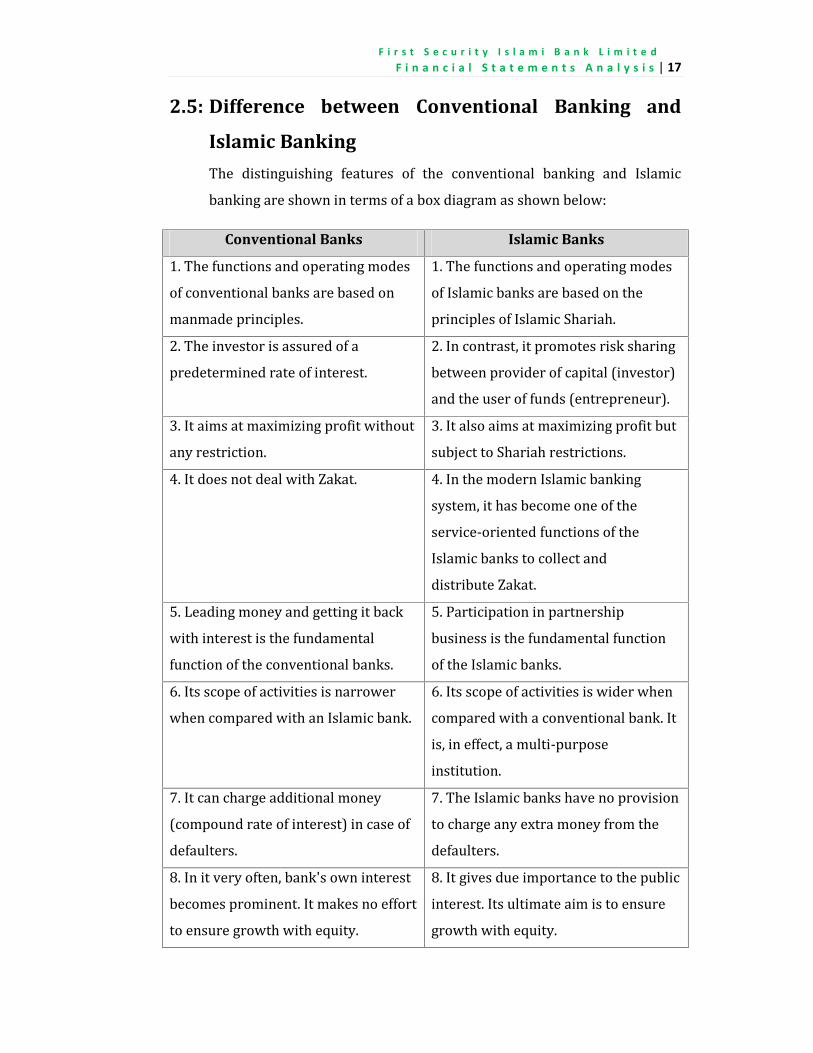
Islamic BankingThe distinguishing features of the conventional banking and Islamicbanking are shown in terms of a box diagram as shown below:Conventional Banks Islamic Banks1. The functions and operating modesof conventional banks are based onmanmade principles.
1. The functions and operating modesof Islamic banks are based on theprinciples of Islamic Shariah.2. The investor is assured of apredetermined rate of interest. 2. In contrast, it promotes risk sharingbetween provider of capital (investor)and the user of funds (entrepreneur).3. It aims at maximizing profit withoutany restriction. 3. It also aims at maximizing profit butsubject to Shariah restrictions.4. It does not deal with Zakat. 4. In the modern Islamic bankingsystem, it has become one of theservice-oriented functions of theIslamic banks to collect anddistribute Zakat.5. Leading money and getting it backwith interest is the fundamentalfunction of the conventional banks.5. Participation in partnershipbusiness is the fundamental functionof the Islamic banks.6. Its scope of activities is narrowerwhen compared with an Islamic bank. 6. Its scope of activities is wider whencompared with a conventional bank. Itis, in effect, a multi-purposeinstitution.7. It can charge additional money(compound rate of interest) in case ofdefaulters.7. The Islamic banks have no provisionto charge any extra money from thedefaulters.8. In it very often, bank's own interestbecomes prominent. It makes no effortto ensure growth with equity.8. It gives due importance to the publicinterest. Its ultimate aim is to ensuregrowth with equity.
F i r s t S e c u r i t y I s l a m i B a n k L i m i t e d . . .
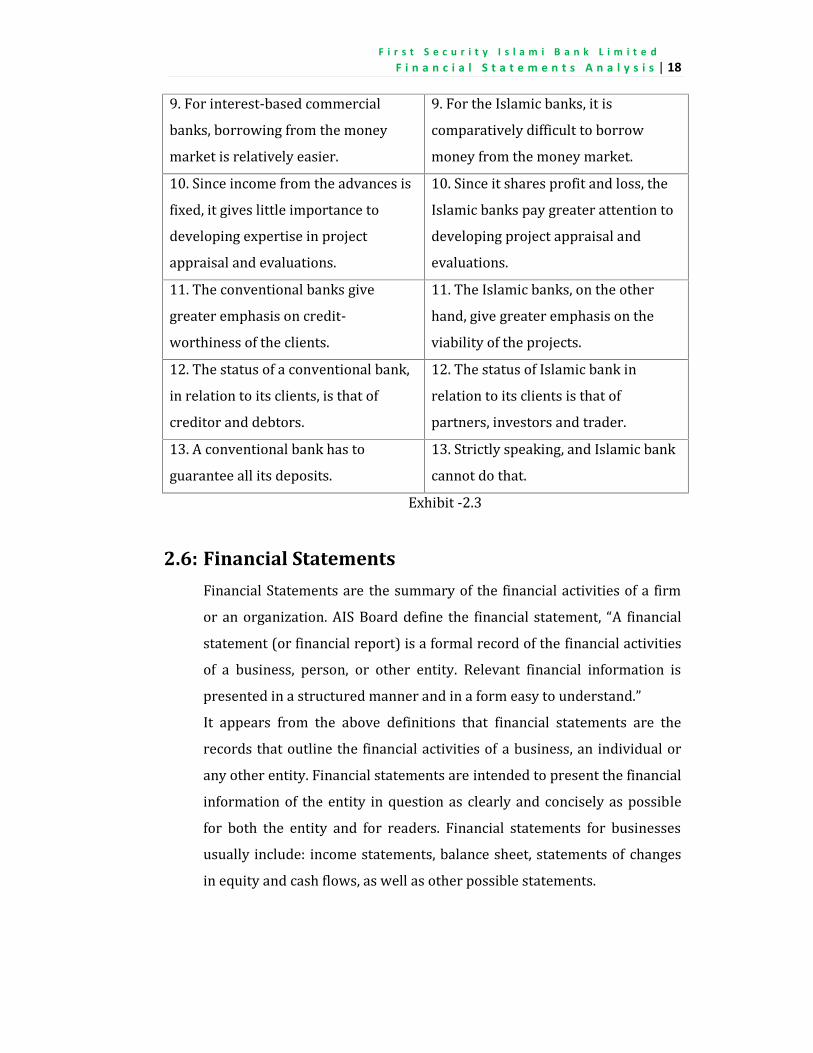
F i n a n c i a l S t a t e m e n t s A n a l y s i s | 189. For interest-based commercialbanks, borrowing from the moneymarket is relatively easier.9. For the Islamic banks, it iscomparatively difficult to borrowmoney from the money market.10. Since income from the advances isfixed, it gives little importance todeveloping expertise in projectappraisal and evaluations.10. Since it shares profit and loss, theIslamic banks pay greater attention todeveloping project appraisal andevaluations.11. The conventional banks givegreater emphasis on credit-worthiness of the clients.11. The Islamic banks, on the otherhand, give greater emphasis on theviability of the projects.12. The status of a conventional bank,in relation to its clients, is that ofcreditor and debtors.12. The status of Islamic bank inrelation to its clients is that ofpartners, investors and trader.13. A conventional bank has toguarantee all its deposits. 13. Strictly speaking, and Islamic bankcannot do that.Exhibit -2.3
2.6: Financial StatementsFinancial Statements are the summary of the financial activities of a firmor an organization. AIS Board define the financial statement, “A financialstatement (or financial report) is a formal record of the financial activitiesof a business, person, or other entity. Relevant financial information ispresented in a structured manner and in a form easy to understand.”It appears from the above definitions that financial statements are therecords that outline the financial activities of a business, an individual orany other entity. Financial statements are intended to present the financialinformation of the entity in question as clearly and concisely as possiblefor both the entity and for readers. Financial statements for businessesusually include: income statements, balance sheet, statements of changesin equity and cash flows, as well as other possible statements.
F i r s t S e c u r i t y I s l a m i B a n k L i m i t e d . . .
F i n a n c i a l S t a t e m e n t s A n a l y s i s | 19
2.7: Components of Financial StatementsAccording to International Accounting Standards (IAS) a complete set offinancial statements includes the flowing components. Statement of Financial Position / Balance Sheet Income Statement / Statement of Profit and Loss Account Statement of Cash Flow Statement of Changes in Equity Notes to these statements
2.8: Components of Bank’s Financial StatementsSince a bank is a financial institution, its financial statements are differentfrom other organization. Bank’s Financial Statements include an additionalcomponent which is called Liquidity Statement. The basic components ofbank’s financial statements are given below. Balance Sheet Statement of Profit and Loss Account / Income Statement Cash Flow Statement Statement of Changes in Equity Liquidity Statement Notes to these statements2.8.1:Balance Sheet: Balance sheet is a financial statement thatsummarizes a company's assets, liabilities and shareholders' equityat a specific point in time of a business' calendar year. These threebalance sheet segments give investors an idea as to what thecompany owns and owes, as well as the amount invested by theshareholders.2.8.2:Statement of Profit and Loss Account / Income Statement:Income statement is a financial report that shows an entity's resultsof financial performance over a specific time period. The timeperiod usually covers for a month, quarter, half year or year.
F i r s t S e c u r i t y I s l a m i B a n k L i m i t e d . . .
F i n a n c i a l S t a t e m e n t s A n a l y s i s | 20
2.8.3:Cash Flow Statement: A cash flow statement is the financialstatement that measures the cash generated or used by a companyin a given period.2.8.4:Statement of Changes in Equity: Statement of changes in equityis a financial statement that presents a summary of the changes inshareholders’ equity accounts in a company over an accountingperiod. It reconciles the opening balances of equity accounts withthe closing balances.2.8.5:Liquidity Statement: Liquidity Statement is a financial statementthat shows a company’s remaining liquid assets to meet the shortterm obligations over a certain period of time. Liquid assetsmainly cover cash and cash equivalent assets. Liquidity statementis necessary for banking companies and other financialinstitutions.2.8.6:Notes: Notes are not core financial statement, but they arenecessary understand other financial statements. Notes are thedetails of summary statements like balance sheet, incomestatement. Notes present process of calculation and particularsincluded of significant items in core financial statements.
2.9: Financial Statements AnalysisFinancial Statements Analysis is the process of reviewing and evaluating acompany's financial statements (such as the balance sheet or profit and lossaccount statement), thereby gaining an understanding of the financial healthof the company and enabling to make more effective policies.2.10: Techniques to Financial Statements AnalysisFinancial statement analysis is an evaluative method of determining thepast, current and projected performance of a company. Several techniquesare commonly used as part of financial statement analysis. Widely used aresated below.
F i r s t S e c u r i t y I s l a m i B a n k L i m i t e d . . .
F i n a n c i a l S t a t e m e n t s A n a l y s i s | 21
Horizontal Analysis: It compares the financial data of two or moreyears in both money and percentage form. Vertical Analysis: In vertical analysis each category of accounts onthe balance sheet is shown as a percentage of the total account. Ratio Analysis: Ratio analysis is a fundamental means of examiningthe health of a company by studying the relationships of key financialvariables. It calculates statistical relationships between data.A bank’s financial statements are always different from general companies. So,banks’ financial statements analysis is critical. Among the stated techniques theratio analysis is mostly used for analysis of any organization’s financialstatements.
2.11: Literature ReviewFinancial statement analysis applies analytical tools to general-purposefinancial statements and related data for making business decisions. Itinvolves transforming accounting data into more useful information.Financial statement analysis reduces our reliance on hunches, guesses, andinformation as well as our uncertainty in decision making. It does not lessenthe need for expert judgment; instead, it provides us an effective andsystematic basis for making business decisions.It is a standard practice for businesses to present financial statements thatadhere to generally accepted accounting principles (GAAP), to maintaincontinuity of information and presentation across international borders. Aswell, financial statements are often audited by government agencies,accountants, firms, etc. to ensure accuracy and for tax, financing or investingpurposes. Financial statements are integral to ensuring accurate and honestaccounting for businesses and individuals alike. So, some basic requirementmust be fulfilled by a person when he/she prepares financial statements.Balance sheet, income statement, statement of cash flow, statement ofequity and liquidity statement are the core financial statements of a bankingcompany. When one goes to analysis the financial statements he/she first
F i r s t S e c u r i t y I s l a m i B a n k L i m i t e d . . .
F i n a n c i a l S t a t e m e n t s A n a l y s i s | 22concentrate to the balance sheet. Because balance sheet is required forevery type of financial analysis including ratio analysis. The balance sheetdepicts the assets and the liabilities at a stated point of time, for example31st December. The figures of the assets and liabilities are given in thebalance sheet from the basis of financial appraisal and duration. In fact,there are two stages in the evaluation of balance sheet: The analysis of balance sheet, refers examination of individual itemsof assets and liabilities and their classification into well-definedcategories, and Interpretation of the balance sheet through the Ratio Analysis.
2.11.1: Classification of Assets and LiabilitiesThe first step in the analysis of balance sheet is the scrutiny andexamination of different items of assets and liabilities and they are classifiedinto various categories. Assets:In the Balance sheet the assets are divided into three majorcategories in general when organizations prepare the balance sheets.These are as follows:
Current Assets Fixed/Long-Term Assets Other Assets
Current Assets: Current assets are those assets, which changestheir form in a short period and are exchanged for cash. In otherwords, current assets are meant to be liquidated for cash in the nearfuture. Generally the duration of these assets is within one year. Fixed/Long-Term Assets: The assets which are not consumed orsold during the normal course of business and they are used forcarrying on the business, such as land, building, machinery,furniture and fixtures etc. are fixed assets. Other Assets: Other assets are a grouping of accounts that are listedas a separate line item in the assets section of the balance sheet and
F i r s t S e c u r i t y I s l a m i B a n k L i m i t e d . . .
F i n a n c i a l S t a t e m e n t s A n a l y s i s | 23which contain minor assets that do not naturally fit into any of themain asset categories. “These assets do not represent any property;rather they represent certain deferred revenue expenses or losseswhich are being written-off over the years” (S. A. Ali & R. A.Howlader, pp.345). But, some of the writers include the other assetsinto fixed assets, some writers include them into current assets andsome of the writers include the other assets into both fixed assetsand current assets according to their duration and type.It appears from the above definitions that other assets are themiscellaneous assets that cannot be classified as current assets orfixed assets. Examples of other assets include deferred tax assets,bond issue costs, advances to officers, prepaid pension costs, andlong-term prepayments. But, other assets can be included into majorcategories, if we have proper information or notes about their timeduration. Most of the case other assets include negligible accounts,so it can be included in current assets. In the case of FSIBL, thenotes about other assets indicate that it should be included incurrent assets when I have prepared the classified balance sheetaccording maturity for the purpose of ratio analysis. Liabilities:In the Balance sheet the liabilities are broadly divided into twocategories when organizations prepare the balance sheets. These areas follows:
Current Liabilities Long-Term Liabilities
Current Liabilities: Current liabilities are the obligations thoseare payable within one accounting year. Common examples areaccounts payable, wages payable, bank loan payable, interestpayable and tax payable. For a banking company placement fromBanks and other Financial Institutions, all deposit accounts, billspayable, current portion of ling-term liabilities and otherliabilities are elements of current liabilities.
F i r s t S e c u r i t y I s l a m i B a n k L i m i t e d . . .
F i n a n c i a l S t a t e m e n t s A n a l y s i s | 24
Long-Term Liabilities: Long-term liabilities are the obligationsthat a company expects to pay after one accounting year.Liabilities in this category include subordinated bonds, bondspayable, and mortgages payable, loan payable, long-term notespayable, lease liabilities, pension liabilities and other long-termliabilities.For the need of my research work I have prepared a comparative balancesheet by classifying items of the balance sheets according to their durationand character. Comparative Balance Sheets consist of balance sheetamounts from two or more balance sheet dates arranged side by side. Itsusefulness is often improved by showing each item’s money amountchange and percentage change to highlight large changes.Analysis of comparative financial statements begins by focusing on itemsthat shows large dollar and percent changes. We then try to identify thereason for these changes and, if possible, determine whether they arefavorable or unfavorable. We also follow up on items with small changeswhen we expected the changes to be large.2.11.2: Limitations of Financial StatementsThough Balance Sheet and Profit and Loss Account of a company areimportant sources for the analysis, the financial data contained therein havecertain limitations. The financial data depict the state of affairs or theoperating results in numerical terms. Sometimes wrong or illogicalconclusion may be derived from them if attention is not given to otherfactors that are not evident from the financial statements. For example, theproduction of a manufacturing company may fall due to labor strike or non-availability of raw materials due to transport bottlenecks, but it should notbe interpreted as decline in the efficiency or profitability of the concern. It is,therefore, essential that the investor should look beyond the financial dataand make future enquiries regarding the causes for any variation orabnormal trend noted in analyzing the data. Besides, the financial
F i r s t S e c u r i t y I s l a m i B a n k L i m i t e d . . .
F i n a n c i a l S t a t e m e n t s A n a l y s i s | 25statements represent the performance of the business concern. Anymeaningful analysis of these statements will depend upon the projections ofthe future trend. Past events are just guides as to what may reasonably beexpected to occur in future.2.11.3: Building Blocks of Financial Statement AnalysisFinancial statements analysis focuses on one or more elements of acompany’s financial condition or performance. Our analysis emphasizes fourareas of inquiry with varying degrees of importance. These four areas aredescribed and illustrated in this chapter and considered the building blocksof financial statements analysis: Liquidity and Efficiency: It refers the ability of a company to meetshort-term obligations and to efficiently generate revenues. Solvency: It refers the ability to generate future revenue and meetlong-term obligations by a company. Profitability: It is the ability to provide financial rewards sufficientto attract and retain financing. Market prospects: It refers a company’s ability to generate positivemarket expectation.
2.11.4: Horizontal AnalysisAnalysis of any single financial number is of limited value. Instead, much offinancial statement analysis involves identifying and describing relationsbetween numbers, groups of numbers and changes in those numbers.Horizontal analysis refers to examination of financial statement data acrosstime. The term “horizontal analyses” arises from the left-to-right movementof our eyes as we review comparative statements across time.2.11.4.1: Comparative StatementsComparing amounts for two of more successive periods often helps inanalyzing financial statements. Comparative financial statements facilitatethis comparison by showing financial amount in side-by-side columns on a
F i r s t S e c u r i t y I s l a m i B a n k L i m i t e d . . .
F i n a n c i a l S t a t e m e n t s A n a l y s i s | 26single statement, called comparative format. By using comparative financialstatements financial changes can be expressed in both dollar amount andpercentage. Computation of Dollar Change and Percent Change: Computingfinancial statements over time periods generally two-to-five years is oftendone by analyzing changes in line items. A change analysis usuallyincludes analyzing absolute dollar amount changes and percent changes.Both analyses are relevant because dollar changes can yield largepercentage changes inconsistent their importance. Dollar amount isnecessary to retain a proper perspective and to assess the importance ofchanges. The computation of dollar change for a financial statement itemas follows:
Dollar change = Analysis period amount - Base period amountAnalysis period is the point or period of time for the financial statementsunder analysis, and base period is the point or period of time for financialstatements used for comparison purposes. The prior year is commonlyused as a base period. We compute percent change by dividing the dollarchange by the base period amount and then multiplying this quantity by100 as follows: (%) = − ×We can always compute a dollar change, but we must be aware of a fewrules in working with percent changes. These rules are as follows: When a negative amount appears in the base period and a positiveamount appears in the analysis period then we cannot compute ameaningful percent change. When a positive amount appears in the base period and a negativeamount appears in the analysis period then we cannot compute ameaningful percent change. When no value is in the base period then no percent is computable. When an item has a value in the base period and zero in theanalysis period, the decrease is 100 percent.
F i r s t S e c u r i t y I s l a m i B a n k L i m i t e d . . .
F i n a n c i a l S t a t e m e n t s A n a l y s i s | 27
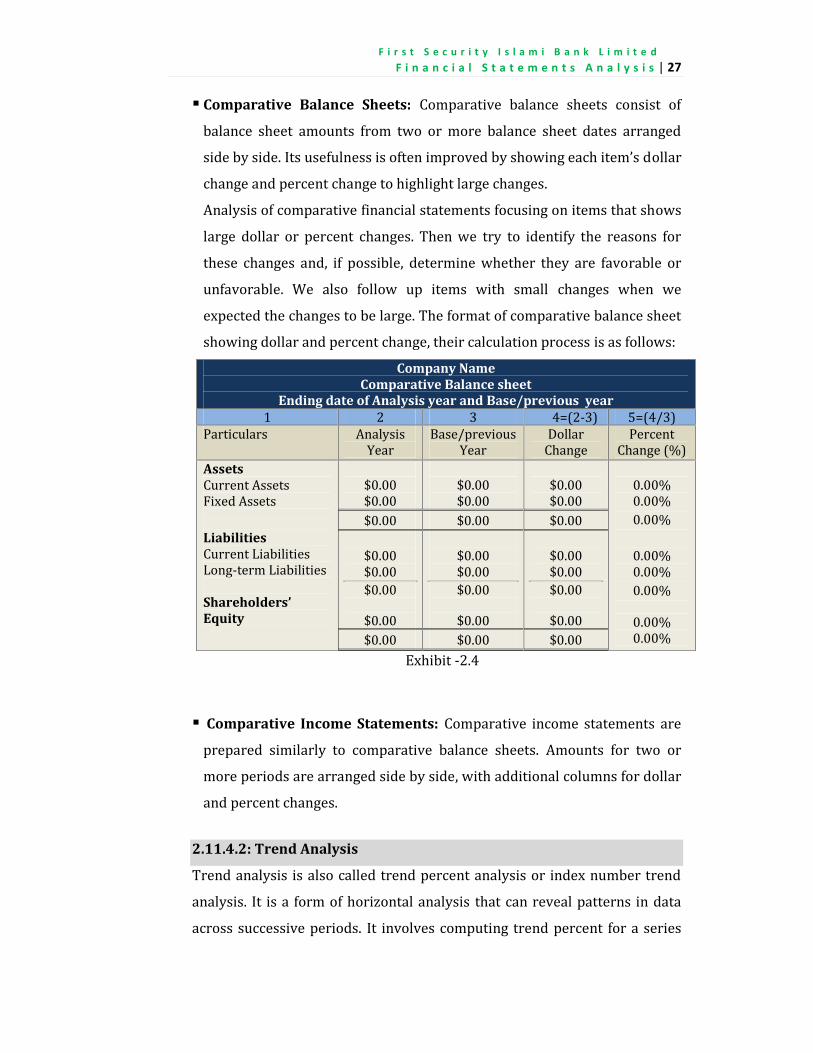
Comparative Balance Sheets: Comparative balance sheets consist ofbalance sheet amounts from two or more balance sheet dates arrangedside by side. Its usefulness is often improved by showing each item’s dollarchange and percent change to highlight large changes.Analysis of comparative financial statements focusing on items that showslarge dollar or percent changes. Then we try to identify the reasons forthese changes and, if possible, determine whether they are favorable orunfavorable. We also follow up items with small changes when weexpected the changes to be large. The format of comparative balance sheetshowing dollar and percent change, their calculation process is as follows:Company Name
Comparative Balance sheetEnding date of Analysis year and Base/previous year1 2 3 4=(2-3) 5=(4/3)Particulars AnalysisYear Base/previousYear DollarChange PercentChange (%)
AssetsCurrent AssetsFixed AssetsLiabilitiesCurrent LiabilitiesLong-term LiabilitiesShareholders’Equity
$0.00$0.00$0.00$0.00$0.00$0.00$0.00$0.00
$0.00$0.00$0.00$0.00$0.00$0.00$0.00$0.00
$0.00$0.00$0.00$0.00$0.00$0.00$0.00$0.00
0.00%0.00%0.00%0.00%0.00%0.00%0.00%0.00%Exhibit -2.4 Comparative Income Statements: Comparative income statements areprepared similarly to comparative balance sheets. Amounts for two ormore periods are arranged side by side, with additional columns for dollarand percent changes.2.11.4.2: Trend AnalysisTrend analysis is also called trend percent analysis or index number trendanalysis. It is a form of horizontal analysis that can reveal patterns in dataacross successive periods. It involves computing trend percent for a series
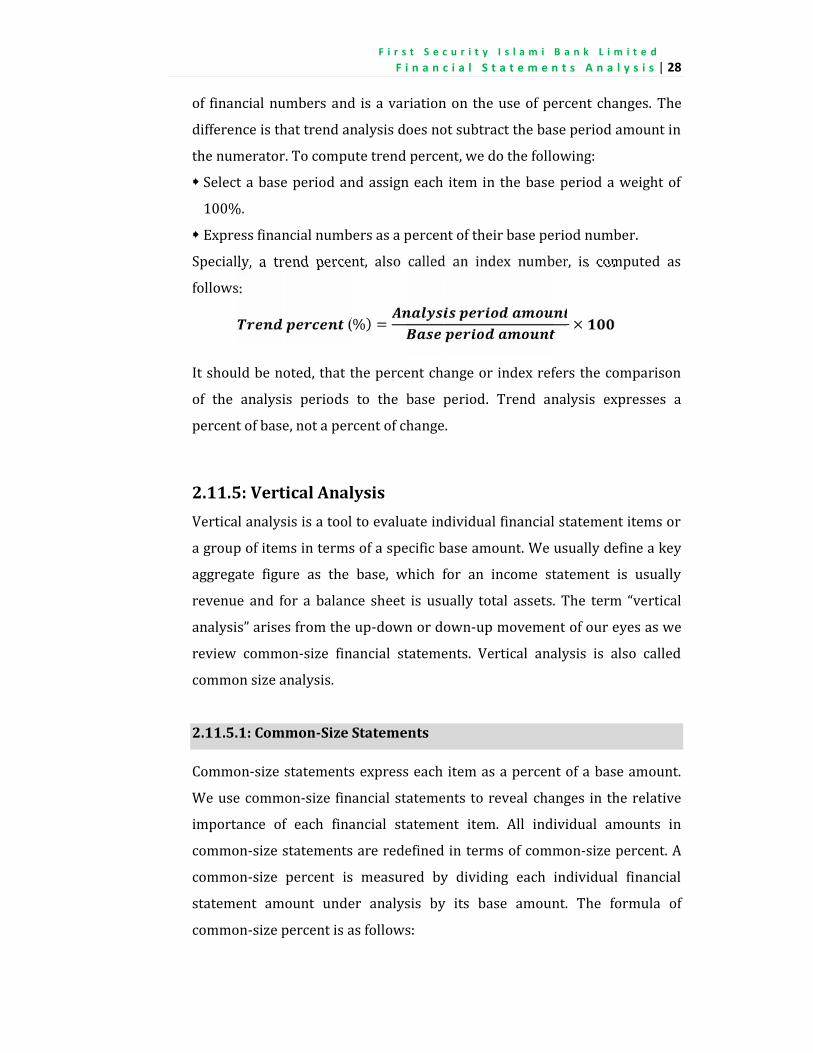
F i r s t S e c u r i t y I s l a m i B a n k L i m i t e d . . .
F i n a n c i a l S t a t e m e n t s A n a l y s i s | 28of financial numbers and is a variation on the use of percent changes. Thedifference is that trend analysis does not subtract the base period amount inthe numerator. To compute trend percent, we do the following: Select a base period and assign each item in the base period a weight of100%. Express financial numbers as a percent of their base period number.Specially, a trend percent, also called an index number, is computed asfollows: (%) = ×It should be noted, that the percent change or index refers the comparisonof the analysis periods to the base period. Trend analysis expresses apercent of base, not a percent of change.2.11.5: Vertical AnalysisVertical analysis is a tool to evaluate individual financial statement items ora group of items in terms of a specific base amount. We usually define a keyaggregate figure as the base, which for an income statement is usuallyrevenue and for a balance sheet is usually total assets. The term “verticalanalysis” arises from the up-down or down-up movement of our eyes as wereview common-size financial statements. Vertical analysis is also calledcommon size analysis.2.11.5.1: Common-Size StatementsCommon-size statements express each item as a percent of a base amount.We use common-size financial statements to reveal changes in the relativeimportance of each financial statement item. All individual amounts incommon-size statements are redefined in terms of common-size percent. Acommon-size percent is measured by dividing each individual financialstatement amount under analysis by its base amount. The formula ofcommon-size percent is as follows:
F i r s t S e c u r i t y I s l a m i B a n k L i m i t e d . . .
F i n a n c i a l S t a t e m e n t s A n a l y s i s | 29
- (%) = × Common-Size Balance Sheet: Common-size balance sheets express eachitem of balance sheets as a percent of a base amount, which is a usuallytotal asset. The base amount is assigned a value of 100%. This impliesthat the total amount of liabilities plus equity equals 100% since thisamount equals total asset. We compute a common-size percent for eachasset, liability and equity items using total asset as base amount. Whenwe present a company’s successive balance sheets in this way, thechanges in the mixture of assets, liabilities and equity are apparent. Common-Size Income Statements: Analysis also benefited from using acommon-size income statement. Revenue is usually the base amount,which is assigned a value of 100%. Each common-size income statementitems appears as a percent of revenue. If we think of the 100% revenuesamount as representing one sales dollar, the remaining items show howeach revenue dollar is distributed among costs, expenses and income.2.11.5.2: Common-Size GraphicsTwo of the most common tools of common-size analysis are trend analysisof common-size statements and graphical analysis. The trend analysis ofcommon-size statements is similar to that of comparative statementsdiscussed under horizontal analysis. It is not illustrated here because theonly difference is the substitution of common-size percent for trend percent.Instead, this section discusses graphical analysis of common-sizestatements. Pie charts and bars are commonly sued for common-sizegraphics analysis of common-size statement analysis. For common-sizeincome statement analysis, the revenue is considered as the base of the piechart because revenue affects nearby every item of an income statement.
F i r s t S e c u r i t y I s l a m i B a n k L i m i t e d . . .
F i n a n c i a l S t a t e m e n t s A n a l y s i s | 30
2.11.6: Ratio AnalysisRatios are among the more widely used tools of financial statement analysisbecause they provide clues to and symptoms of underlying conditions. Aratio can help us uncover conditions and trends difficult to detect byinspecting individual components making up the ratio. Ratios, like otheranalysis tools, are usually future oriented. They are often adjusted for theirprobable future trend and magnitude, and their usefulness depends on theskillful interpretation. A ratio expresses a mathematical relation betweentwo quantities. It can be expressed as a percent, rate, or proportion.Computation of ratio is a simple arithmetic operation, but its interpretationis not. To be meaningful, a ratio must refer to an economically importantrelation.In this section an important set of financial ratios and its applications aredescribed. The selected ratios are organized into the four building blocks offinancial statement analysis. These are as follows:(i) Liquidity and Efficiency Ratios(ii) Solvency Ratios(iii) Profitability Ratios(iv)Market Prospects Ratios
2.11.6.1: Liquidity and Efficiency RatiosLiquidity refers to the availability of resources of a company to meet short-term cash requirements. It is affected by the timing of cash inflows andoutflows along with prospects for future performance. Analysis of liquidityis aimed at a company’s funding requirements.Efficiency refers to how productive a company in using its assets. Efficiencyis usually measured relative to how much revenue is generated from acertain level of assets.Both liquidity and efficiency are important and complementary. If acompany fails to meet its current obligations, its continued existence isdoubtful. From this view point, all other measures of analysis are insecondary importance. Although accounting measurements assume thecompany’s continued existence, our analysis must always assess the validity
F i r s t S e c u r i t y I s l a m i B a n k L i m i t e d . . .
F i n a n c i a l S t a t e m e n t s A n a l y s i s | 31of this assumption using liquidity measures. Moreover inefficient use ofassets can cause liquidity problems. A lack of liquidity often precedes lowerprofitability and fewer opportunities. A company’s customers and suppliersare also affected by short-term liquidity problems, and it is keener, when itis a banking company. This section describes the key ratios relevant toassessing liquidity and efficiency. Current Ratio: Current ratio is widely used to show the ability of acompany to meet its current liabilities with its current assets. This ratiois computed by dividing current assets by current liabilities. Its formulais given below: =
A high current ratio suggests a strong liquidity position and an ability tomeet current obligations by current assets. An excessively high currentratio means that a company has invested too much in current assetscompared to its current liabilities. An excessive investment in currentassets is not an efficient use of fund, because current assets normallygenerate a low return on investment. On the other hand, lower currentratio indicates that a company may be failed to meet current obligationsby its current assets. Many users apply a guideline about composition ofcurrent assets and current liabilities of 2:1, which means the result ofcurrent ratio is 2. But, such a guideline or any analysis of the currentratio must recognize at some additional factors such as, type of business,composition of current assets, and Turnover of current assets. A servicecompany like bank that having no inventory can probably operate on acurrent ratio of 1:1 or less than 1:1. The composition of a company’scurrent assets is important to an evaluation of short-term liquidity. Forinstance, cash, cash equivalents, and short-term investments are moreliquid then account and notes receivable. Cash, of course, can be used toimmediately pay current liabilities. But, for a banking company,retaining excessive cash and cash equivalent as liquid assets decreasesprofitability.
F i r s t S e c u r i t y I s l a m i B a n k L i m i t e d . . .
F i n a n c i a l S t a t e m e n t s A n a l y s i s | 32A banking company may maintain current ratio of less than 1:1according to its banking principle for efficient investment of its collecteddeposits. Acid-Test (Quick) Ratio: The measurement used by business toanalysis their ability to pay their current liabilities with current assetsexcluding less liquid assets is acid-test ratio. It is also called quick ratio.Quick assets are cash, short-term investments and current receivables.These are the most liquid types of assets. Acid-test ratio is differs fromcurrent ratio by excluding less liquid assets such as inventory andprepaid expenses, because they take longer time to be converted intocash. The acid-test test or quick ratio is defined as quick assets (cash,short-term investment and current receivable) divided by currentliabilities. Its formula is given below:
- = ( )The common guideline for an acceptable acid-test ratio is 1:1. Similar toanalysis of current ratio, we need to consider other factors. For instance,the frequency with which a company converts its current assets intocash affects its working capital requirements. Acid-test ratio is the mostimportant measurement for banking companies as financial institutions. Accounts Receivable Turnover: We can measure how frequently acompany converts its receivables into cash by computing accountreceivable turnover. Account receivable turnover is a measure of boththe quality and liquidity of account receivables. Quality of receivablesrefers to the likelihood of collection without loss. Liquidity of receivablerefers to the speed of collection. Accounts receivable turnover iscomputed by dividing net sales by average account receivable. Itsformula is given below: =
F i r s t S e c u r i t y I s l a m i B a n k L i m i t e d . . .
F i n a n c i a l S t a t e m e n t s A n a l y s i s | 33Average accounts receivable is computed as follows:= +2Accounts receivable turnover is more precise if net credit sales are usedfor the numerator because net sales include cash sales, but externalusers generally use net sales (or net revenue) because information aboutnet credit sales is typically not reported in financial reports. Some usersuse net receivable as denominator when use net credit sales asnumerator, but using the average account receivable as denominator ismore perfect for computing accounts receivable turnover. A highturnover is favorable because it means a company need not commitslarge amount of funds to account receivable. A high turnover indicatesthat a company is too efficient to collect receivables. Inventory Turnover: Inventory turnover shows how long a companyholds inventory before selling it affects working capital requirements.Inventory turnover is also called merchandise turnover or merchandiseinventory turnover. It is computed as follows:=The average inventory is computed as follows:= +2If the beginning and ending inventory for the year do not represent theusual inventory amount, an average of quarterly or monthly inventoriescan be used. A generally agreed minimum value for inventory turnoverratio is about 2:1 (from a secured creditor perspective), but the rationeeds careful interpretation because it is based on the book value ofpledged assets. Inventory turnover is important for merchandisers, butnot for service providing company because service providing companyhave a little or no inventory. So as service company banks and financialinstitutions’ do not need analysis of the inventory turnover ratio fortheir operations.
F i r s t S e c u r i t y I s l a m i B a n k L i m i t e d . . .
F i n a n c i a l S t a t e m e n t s A n a l y s i s | 34
Days’ Sales Uncollected: Accounts receivable turnover provides insightabout how frequently a company converts its accounts receivable intocash. This is important for evaluating a company’s liquidity. Onemeasure of the receivables’ nearness to cash is the days’ salesuncollected. It is computed as follows:= ×A rough guideline states that days’ sales uncollectable should not exceed1 times the days in its credit period, if discounts are not offered; ordiscount period, if favorable discounts are offered. Days’ Sales in Inventory: Days’ sales in inventory, also called day’sstock on hand, is a ratio that reveals how much inventory is available interms of the number of days’ sales. It can be interpreted as the numberof days one can sell from inventory if no new items are purchased. Thisratio is often viewed as a measure of the buffer against out-of-stockinventory and is useful in evaluating liquidity of inventory. It iscomputed as follows: = ×Days’ sales in inventory focuses on ending inventory and it estimateshow many days it will take to convert at the end of a period intoaccounts receivable of cash. Notice that, days’ sales in inventory focuseson ending inventory whereas inventory turnover focuses on averageinventory. Total Asset Turnover: Total asset turnover is a measure of a company’sability to use its assets to generate sales and is an important indicator ofoperating efficiency. A company’s assets are important in determiningits ability to generate sales and earn income. Total asset turnover iscomputed as follows: =
F i r s t S e c u r i t y I s l a m i B a n k L i m i t e d . . .
F i n a n c i a l S t a t e m e n t s A n a l y s i s | 35
Average total assets is computed as follows:= +2Companies desire higher total asset turnover from their operations.Interpreting the total asset turnover also requires an understanding ofthe company’s operations. Some operations are capital intensive,meaning that a relatively large amount is invested in assets to generatesales. This suggests a relatively lower total asset turnover. Othercompanies’ having labor intensive operations, meaning that generatesales more by the efforts of people than using assets.2.11.6.2: Solvency RatiosSolvency refers to a company’s long-run financial viability and its ability tocover long-term obligations. All of a company’s business activities likefinancing, investing and operating activities affect its solvency. Analysis ofsolvency is long term and uses less precise but more encompassingmeasures than liquidity. One of the most important components of solvencyanalysis is the composition of a company’s capital structure. Capitalstructure refers to a company’s financing sources. It ranges from relativelypermanent equity financing to riskier or more temporary short-termfinancing. This analysis focuses on a company’s ability to meet itsobligations and provide security to its creditors over long run. Indicators ofthis ability include debt and equity ratios, the relation between pledgedassets and secured liabilities, and the company’s capacity to earn sufficientincome to pay fixed interest charges. Debt and Equity Ratios: One element of solvency analysis is to assessthe portion of a company’s assets contributed by creditors and theportion contributed by its owners is called debt and equity ratio. Acompany that finances a relatively large portion of its assets withliabilities is said to have a high degree of financial leverage. Higherfinancial leverage involves greater risk because liabilities must be repaid
F i r s t S e c u r i t y I s l a m i B a n k L i m i t e d . . .
F i n a n c i a l S t a t e m e n t s A n a l y s i s | 36and often require regular interest payments. The risk that a companymight not be able to meet such required payments is higher if it has moreliabilities. One way to assess the risk associated with a company’s use ofliabilities is to compute the debt ratio. Debt ratio is computed as follows:= ×The equity ratio provides complementary information by expressing totalequity as a percent of total assets. A company is considered less risky if itscapital structure contains more equity. Equity ratio is computed asfollows: = × Pledged Assets to Secured Liabilities: A company’s ability to borrowmoney with or without collateral agreements depends on its credit rating.In some cases, debt financing is unavailable unless the borrower canprovide security to creditors with a collateral agreement. To borrowfunds at a favorable rate, many bonds and notes are secured by collateralagreements in the form of mortgages. Investors of a company’s secureddebt obligations need to determine whether the debtor’s pledged assetsprovide adequate security. One method to evaluate this is pledged assetsto secured liabilities ratio. This ratio also is relevant to unsecuredcreditors because of what it implies about the remaining assets available.This ratio is computed as follows: =
A generally agreed minimum value for this ratio is about 2:1 (from asecured creditor perspective), but the ratio needs careful interpretationbecause it is based on the book value of pledged assets. Book values arenot necessarily intended to reflect amounts to be received from assets inevent of liquidation. Also, a company’s long-run earning ability is equallyimportant.
F i r s t S e c u r i t y I s l a m i B a n k L i m i t e d . . .
F i n a n c i a l S t a t e m e n t s A n a l y s i s | 37
Times Interest Earned: The amount of income before deductions forinterest expense and income taxes is the amount available to pay interestexpense. A company incurs expenses on many of its current and long-term liabilities. Interest expense is often viewed as a fixed expensebecause the amount of these liabilities is likely to remain in one form oranother for a substantial period of time. This means that the amount ofinterest is unlikely to vary due to change in sales or other operatingactivities. While fixed expenses can be advantageous when a company isgrowing, they create risk. This risk stems from the possibility that acompany might be unable to pay fixed expenses if sales decline. Onemethod that measures a company’s ability to pay interest expenses istimes interest earned ratio. This ratio is computed as follows:=The larger this ratio, the less risky is the company for creditors. Oneguideline says that the creditors are reasonably safe if the company earnsits fixed interest expense two or more times each year.2.11.6.3: Profitability RatiosWe are especially interested in a company’s ability to use its assetsefficiently to produce profits and positive cash flows. Profitability refers to acompany’s ability to generate an adequate return on invested capital. Returnis judged by assessing earnings relative to the level and source of financing.Profitability is also relevant to solvency. This section describes keyprofitability measures and their importance to financial statement analysis. Profit Margin: A useful measure of a company’s operating results is theratio of its net income to net sales. This ratio is called profit margin. Itreflects a company’s ability to earn net income from sales. Profit margin iscomputed as follows: = ×100
F i r s t S e c u r i t y I s l a m i B a n k L i m i t e d . . .
F i n a n c i a l S t a t e m e n t s A n a l y s i s | 38To evaluate profit margin, we should consider the industry median ifpossible. For instance, companies including banks might require a profitmargin between 10% and 15%. Return on Total Assets: Return on total assets is a profitability ratio thatmeasures the net income produced by total assets during a period bycomparing net income to the average total assets. In other words, thereturn on assets ratio or ROA measures how efficiently a company canmanage its assets to produce profits during a period. Return on totalassets is computed as follows: = × 100
An average total asset is computed as follows:= +2Since companies’ assets' sole purpose is to generate revenues and produceprofits, this ratio helps both management and investors to see how wellthe company can convert its investments in assets into profits. In short,this ratio measures how profitable a company's assets are. Generallycompanies expect higher return on total assets because that indicates acompany’s assets provide more returns. Return on Common Stockholders’ Equity: Perhaps the most importantgoal in operating a company is to earn net income for its owner(s). Thereturn on common stockholders’ equity measures a company’s success inreaching this goal and is defined as follows:= − ×
Average common stockholders’ equity is computed as follows:ℎ= Beginning shareholders′ + shareholders′2
F i r s t S e c u r i t y I s l a m i B a n k L i m i t e d . . .
F i n a n c i a l S t a t e m e n t s A n a l y s i s | 39The denominator in this computation is the book value of common equityincluding any minority interest. In the numerator, the dividends oncumulative preferred stock are subtracted whether they are declared orare in arrears. If preferred stock is noncumulative, its dividends aresubtracted only if declared.2.11.6.4: Market Prospects RatiosMarket measures are useful for analyzing corporations with publicly tradedstock. These market measures use stock price, which reflects the market’s(public’s) expectations for the company. This includes expectations of bothcompany’s return and risk as market perceives it. Price-Earnings Ratio: A stock’s market value is determined by itsexpected future cash flows. A comparison of a company’s EPS and itsmarket value per share reveals information about market expectations.This comparison is traditionally made using a price-earnings ratio. Price-earnings ratio can be viewed as an indicator of the market’s expectedgrowth and risk for a stock. Some analysts interpret this ratio as whatprice the market is willing to pay for a company’s current earningsstream. Price-earnings ratios can differ across companies that havesimilar earnings because of either higher or lower expectations of futureearnings. A high level of expected risk suggests a low PE ratio. A highgrowth rate suggests a high PE ratio. The price-earnings ratio is definedas follows:
− = ( )This ratio is often computed using EPS from the most recent period.However, many users compute this ratio using expected EPS for nextperiod. Some analysis view stocks with high PE ratios as more likely to beoverpriced and stocks with low PE ratios as more likely to beunderpriced. These investors prefer to sell or avoid buying stock withhigh PE ratios and to buy or hold stocks with low PE ratios. However,
F i r s t S e c u r i t y I s l a m i B a n k L i m i t e d . . .
F i n a n c i a l S t a t e m e n t s A n a l y s i s | 40investment decision making is rarely so simple as to rely on a single ratio.For instance, a stock with a high PE ratio can prove to be a goodinvestment if its earnings continue to increase beyond currentexpectations. Similarly, a stock with a low PE ratio can prove to be a poorinvestment if its earnings decline below expectations. Dividend Yield: Investors buy shares of a company’s stock inanticipation of receiving a return from either or both cash dividends andstock price increases. Stocks that pay large dividends on a regular basiscalled income stock are attractive to investors who want recurring cashflows from their investments. In contrast, some stocks pay little or nodividends but are still attractive to investors because of their expectedstock price increases. The stocks of companies that distribute little or nocash but use their cash to finance expansion are called growth stocks. Oneway to help identify whether a stock is an income stock or a growth stockis to analyze its dividend yield. It is used to compare the dividend-payingperformance of different investment alternatives. Dividend yield iscomputed as follows:
= ×Dividend yield can be computed for current and prior periods usingactual dividends and stock prices and for future periods using expectedvalues.
2.11.6.5: Summary of RatiosExhibit -2.5 summarizes the major financial statement analysis ratiosdescribed in this chapter. This summary includes each ratio’s title, itsformulas, and the purpose for which it is commonly used.
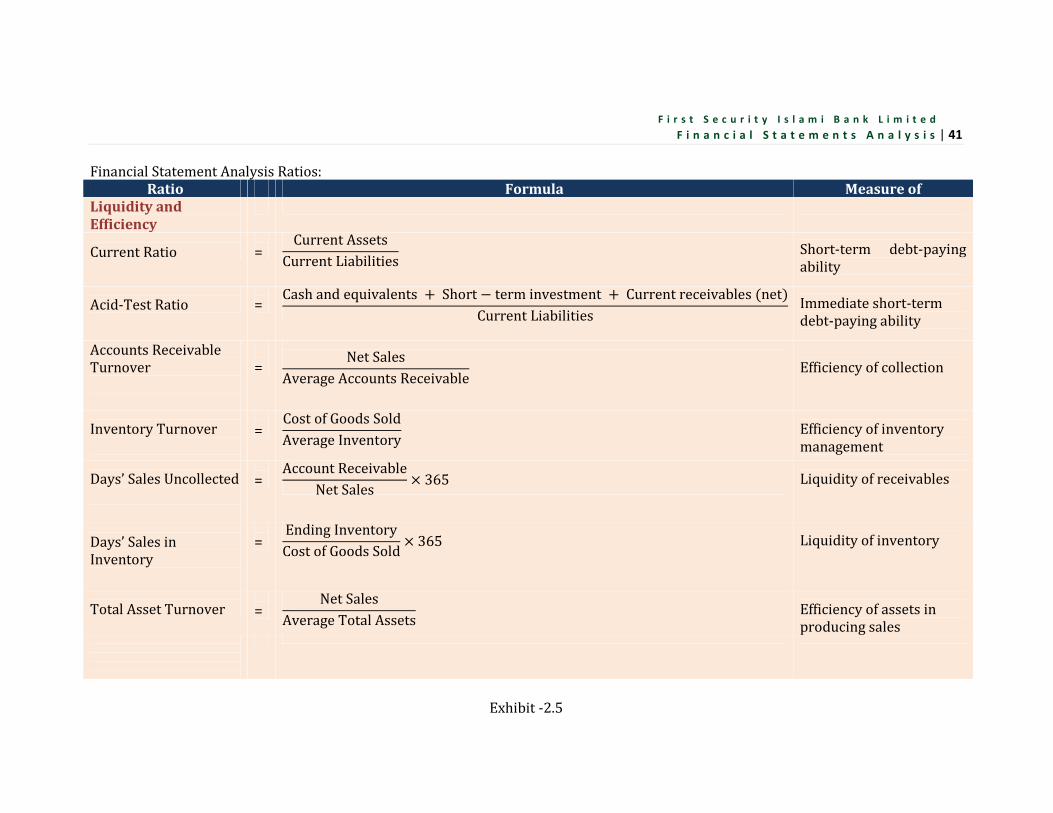
. . .F i r s t S e c u r i t y I s l a m i B a n k L i m i t e d| 41F i n a n c i a l S t a t e m e n t s A n a l y s i s
Exhibit -2.5
Financial Statement Analysis Ratios:Ratio Formula Measure of
Liquidity andEfficiencyCurrent Ratio = Current AssetsCurrent Liabilities Short-term debt-payingabilityAcid-Test Ratio = Cash and equivalents + Short − term investment + Current receivables (net)Current Liabilities Immediate short-termdebt-paying abilityAccounts ReceivableTurnover = Net SalesAverage Accounts Receivable Efficiency of collectionInventory Turnover = Cost of Goods SoldAverage Inventory Efficiency of inventorymanagementDays’ Sales Uncollected = Account ReceivableNet Sales × 365 Liquidity of receivablesDays’ Sales inInventory = Ending InventoryCost of Goods Sold × 365 Liquidity of inventoryTotal Asset Turnover = Net SalesAverage Total Assets Efficiency of assets inproducing sales
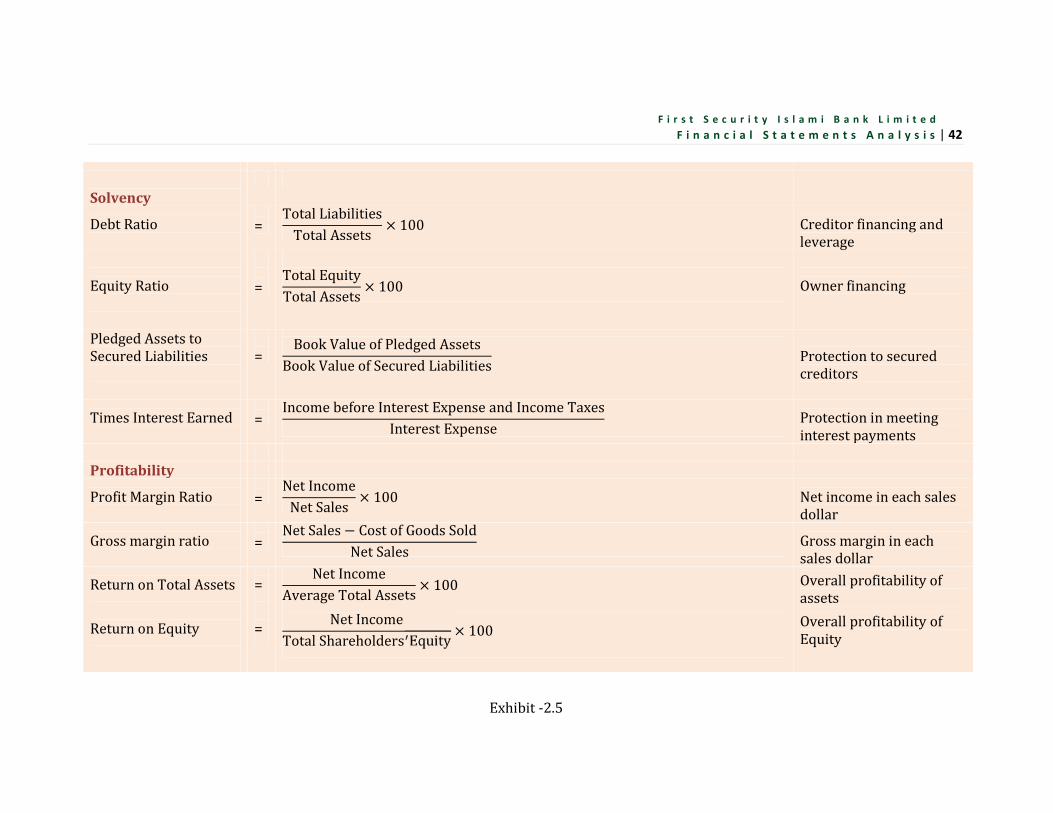
. . .F i r s t S e c u r i t y I s l a m i B a n k L i m i t e d| 42F i n a n c i a l S t a t e m e n t s A n a l y s i s
Exhibit -2.5
SolvencyDebt Ratio = Total LiabilitiesTotal Assets × 100 Creditor financing andleverageEquity Ratio = Total EquityTotal Assets × 100 Owner financingPledged Assets toSecured Liabilities = Book Value of Pledged AssetsBook Value of Secured Liabilities Protection to securedcreditorsTimes Interest Earned = Income before Interest Expense and Income TaxesInterest Expense Protection in meetinginterest paymentsProfitabilityProfit Margin Ratio = Net IncomeNet Sales × 100 Net income in each salesdollarGross margin ratio = Net Sales − Cost of Goods SoldNet Sales Gross margin in eachsales dollarReturn on Total AssetsReturn on Equity
==
Net IncomeAverage Total Assets × 100Net IncomeTotal Shareholders Equity × 100Overall profitability ofassetsOverall profitability ofEquity
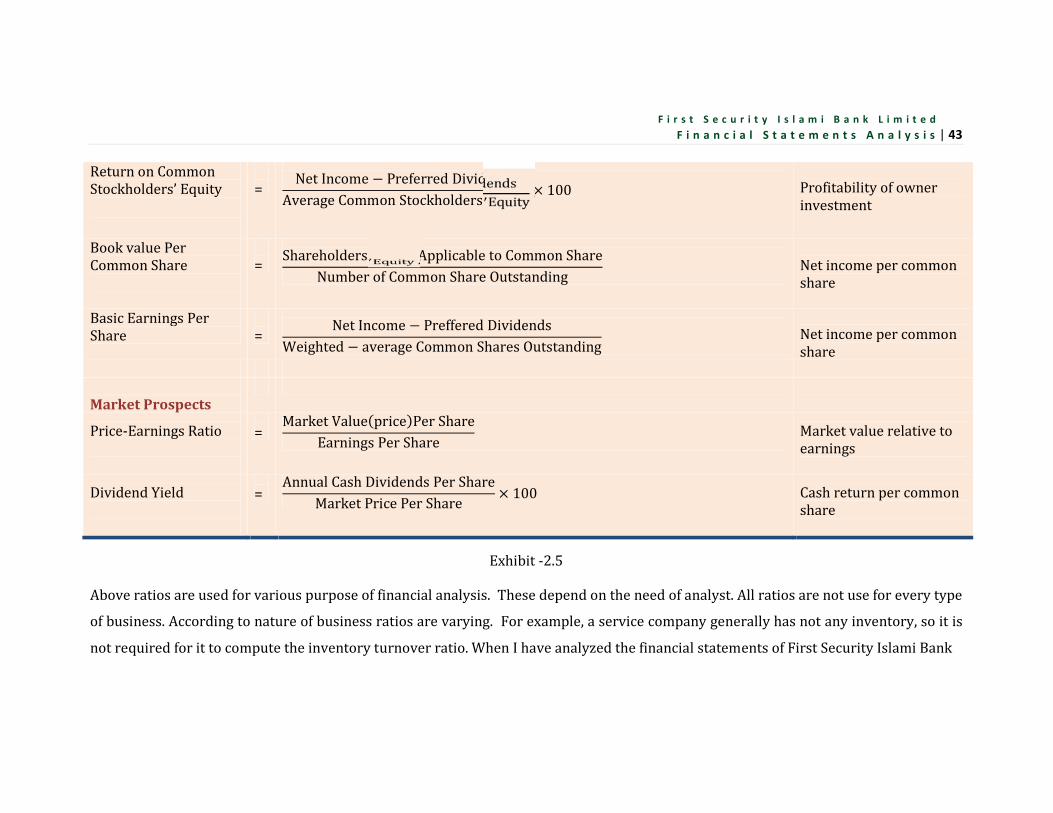
. . .F i r s t S e c u r i t y I s l a m i B a n k L i m i t e d| 43F i n a n c i a l S t a t e m e n t s A n a l y s i s
Exhibit -2.5
Return on CommonStockholders’ Equity = Net Income − Preferred DividendsAverage Common Stockholders Equity × 100 Profitability of ownerinvestmentBook value PerCommon Share = Shareholders Equity Applicable to Common ShareNumber of Common Share Outstanding Net income per commonshareBasic Earnings PerShare = Net Income − Preffered DividendsWeighted − average Common Shares Outstanding Net income per commonshareMarket ProspectsPrice-Earnings Ratio = Market Value(price)Per ShareEarnings Per Share Market value relative toearningsDividend Yield = Annual Cash Dividends Per ShareMarket Price Per Share × 100 Cash return per commonshare
Exhibit -2.5Above ratios are used for various purpose of financial analysis. These depend on the need of analyst. All ratios are not use for every typeof business. According to nature of business ratios are varying. For example, a service company generally has not any inventory, so it isnot required for it to compute the inventory turnover ratio. When I have analyzed the financial statements of First Security Islami Bank
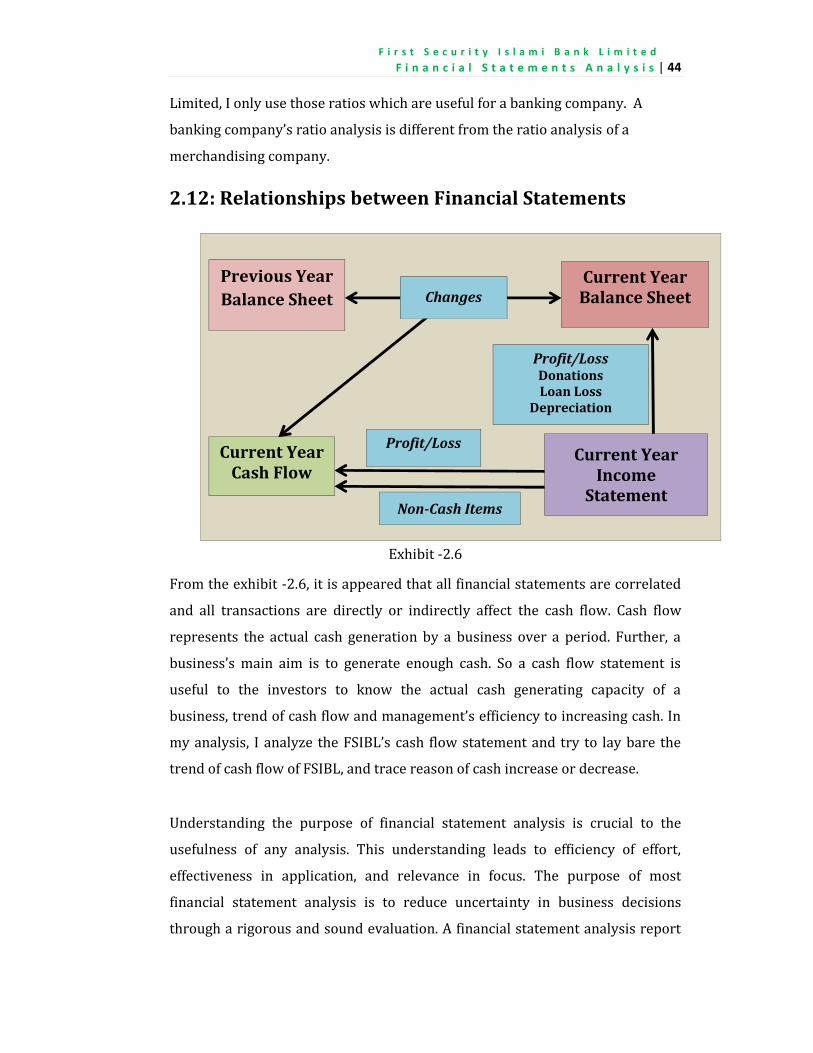
F i r s t S e c u r i t y I s l a m i B a n k L i m i t e d . . .
F i n a n c i a l S t a t e m e n t s A n a l y s i s | 44Limited, I only use those ratios which are useful for a banking company. Abanking company’s ratio analysis is different from the ratio analysis of amerchandising company.2.12: Relationships between Financial Statements
Exhibit -2.6From the exhibit -2.6, it is appeared that all financial statements are correlatedand all transactions are directly or indirectly affect the cash flow. Cash flowrepresents the actual cash generation by a business over a period. Further, abusiness’s main aim is to generate enough cash. So a cash flow statement isuseful to the investors to know the actual cash generating capacity of abusiness, trend of cash flow and management’s efficiency to increasing cash. Inmy analysis, I analyze the FSIBL’s cash flow statement and try to lay bare thetrend of cash flow of FSIBL, and trace reason of cash increase or decrease.Understanding the purpose of financial statement analysis is crucial to theusefulness of any analysis. This understanding leads to efficiency of effort,effectiveness in application, and relevance in focus. The purpose of mostfinancial statement analysis is to reduce uncertainty in business decisionsthrough a rigorous and sound evaluation. A financial statement analysis report
Previous YearBalance Sheet
Current YearBalance Sheet
Current YearIncome
Statement
Current YearCash Flow
Profit/LossDonationsLoan Loss
Depreciation
Profit/Loss
Non-Cash Items
Changes

F i r s t S e c u r i t y I s l a m i B a n k L i m i t e d . . .
F i n a n c i a l S t a t e m e n t s A n a l y s i s | 45helps by directly addressing the building blocks of analysis and by identifyingweakness in inference by requiring explanation. If forces us to organize ourreasoning and to verify its flow and logic. A report also serves as acommunication link with readers, and the writing process reinforces ourjudgments and vice versa.

F i r s t S e c u r i t y I s l a m i B a n k L i m i t e d . . .
F i n a n c i a l S t a t e m e n t s A n a l y s i s | 46
Chapter Three
Organizational Overview
3
OrganizationalOverview
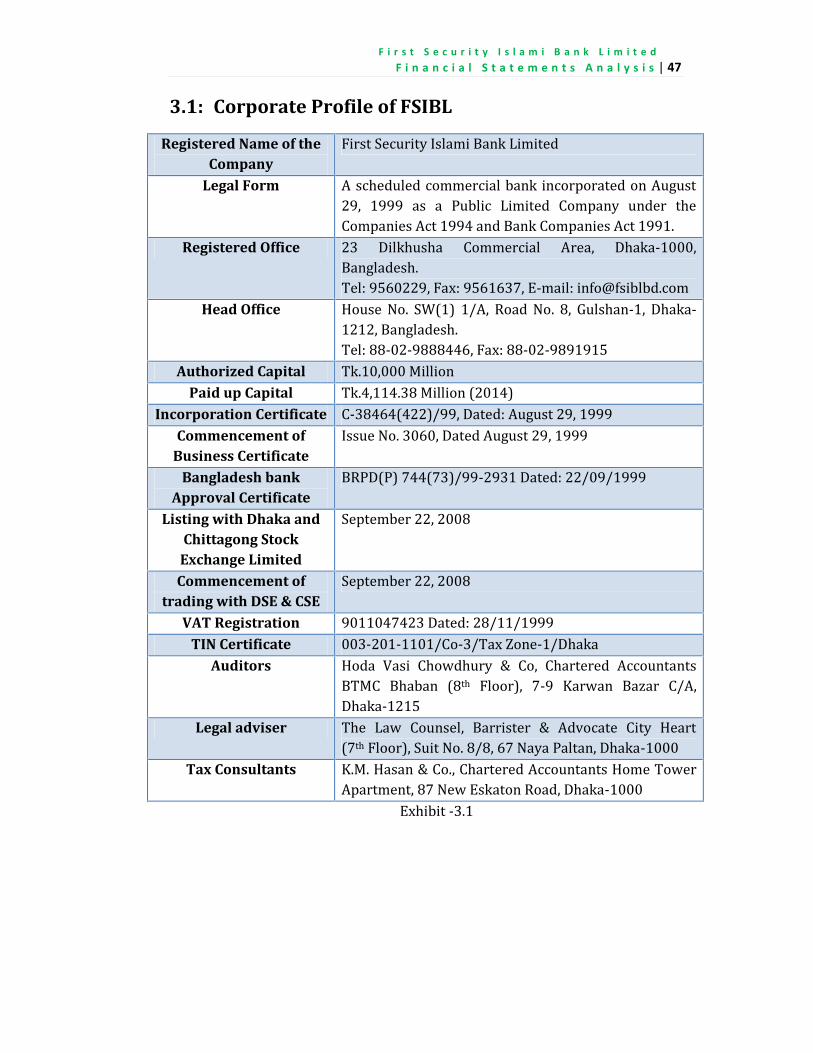
F i r s t S e c u r i t y I s l a m i B a n k L i m i t e d . . .
F i n a n c i a l S t a t e m e n t s A n a l y s i s | 47
3.1: Corporate Profile of FSIBL
Registered Name of theCompany
First Security Islami Bank LimitedLegal Form A scheduled commercial bank incorporated on August29, 1999 as a Public Limited Company under theCompanies Act 1994 and Bank Companies Act 1991.
Registered Office 23 Dilkhusha Commercial Area, Dhaka-1000,Bangladesh.Tel: 9560229, Fax: 9561637, E-mail: [email protected] Office House No. SW(1) 1/A, Road No. 8, Gulshan-1, Dhaka-1212, Bangladesh.Tel: 88-02-9888446, Fax: 88-02-9891915
Authorized Capital Tk.10,000 MillionPaid up Capital Tk.4,114.38 Million (2014)
Incorporation Certificate C-38464(422)/99, Dated: August 29, 1999Commencement of
Business CertificateIssue No. 3060, Dated August 29, 1999
Bangladesh bankApproval Certificate
BRPD(P) 744(73)/99-2931 Dated: 22/09/1999Listing with Dhaka and
Chittagong StockExchange Limited
September 22, 2008Commencement of
trading with DSE & CSESeptember 22, 2008
VAT Registration 9011047423 Dated: 28/11/1999TIN Certificate 003-201-1101/Co-3/Tax Zone-1/Dhaka
Auditors Hoda Vasi Chowdhury & Co, Chartered AccountantsBTMC Bhaban (8th Floor), 7-9 Karwan Bazar C/A,Dhaka-1215Legal adviser The Law Counsel, Barrister & Advocate City Heart(7th Floor), Suit No. 8/8, 67 Naya Paltan, Dhaka-1000
Tax Consultants K.M. Hasan & Co., Chartered Accountants Home TowerApartment, 87 New Eskaton Road, Dhaka-1000Exhibit -3.1
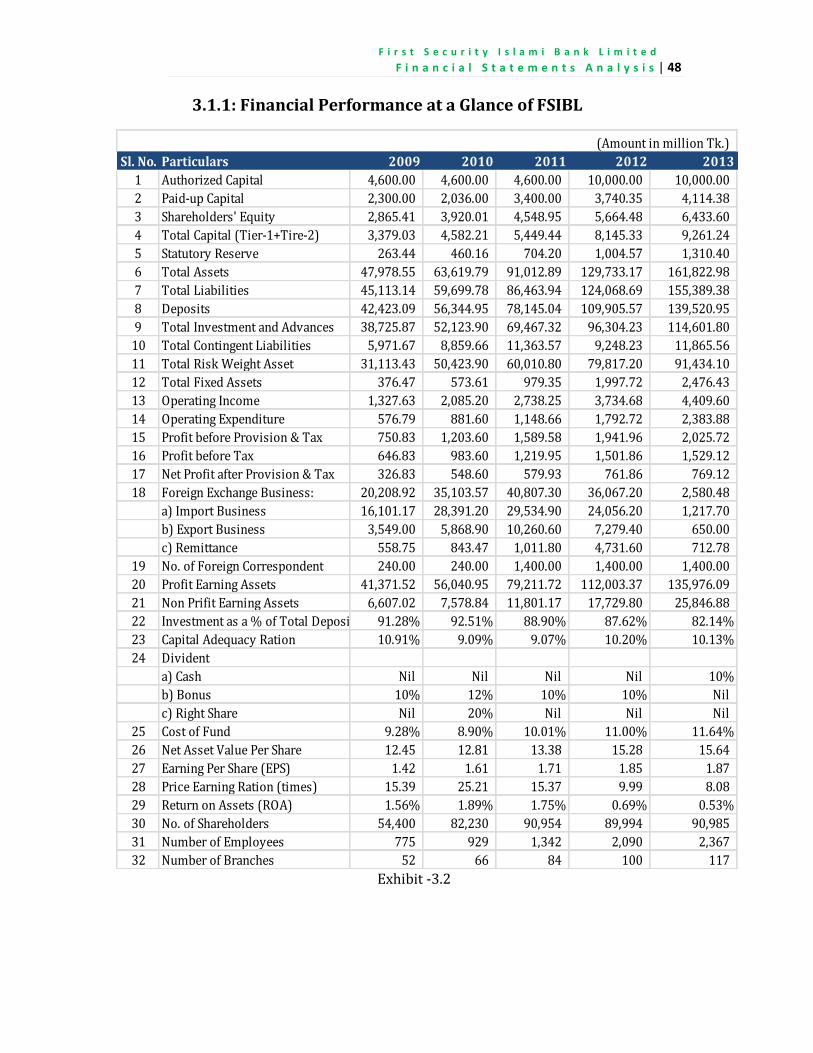
F i r s t S e c u r i t y I s l a m i B a n k L i m i t e d . . .
F i n a n c i a l S t a t e m e n t s A n a l y s i s | 48
3.1.1: Financial Performance at a Glance of FSIBL
Exhibit -3.2
Sl. No. Particulars 2009 2010 2011 2012 20131 Authorized Capital 4,600.00 4,600.00 4,600.00 10,000.00 10,000.002 Paid-up Capital 2,300.00 2,036.00 3,400.00 3,740.35 4,114.383 Shareholders' Equity 2,865.41 3,920.01 4,548.95 5,664.48 6,433.604 Total Capital (Tier-1+Tire-2) 3,379.03 4,582.21 5,449.44 8,145.33 9,261.245 Statutory Reserve 263.44 460.16 704.20 1,004.57 1,310.406 Total Assets 47,978.55 63,619.79 91,012.89 129,733.17 161,822.987 Total Liabilities 45,113.14 59,699.78 86,463.94 124,068.69 155,389.388 Deposits 42,423.09 56,344.95 78,145.04 109,905.57 139,520.959 Total Investment and Advances 38,725.87 52,123.90 69,467.32 96,304.23 114,601.8010 Total Contingent Liabilities 5,971.67 8,859.66 11,363.57 9,248.23 11,865.5611 Total Risk Weight Asset 31,113.43 50,423.90 60,010.80 79,817.20 91,434.1012 Total Fixed Assets 376.47 573.61 979.35 1,997.72 2,476.4313 Operating Income 1,327.63 2,085.20 2,738.25 3,734.68 4,409.6014 Operating Expenditure 576.79 881.60 1,148.66 1,792.72 2,383.8815 Profit before Provision & Tax 750.83 1,203.60 1,589.58 1,941.96 2,025.7216 Profit before Tax 646.83 983.60 1,219.95 1,501.86 1,529.1217 Net Profit after Provision & Tax 326.83 548.60 579.93 761.86 769.1218 Foreign Exchange Business: 20,208.92 35,103.57 40,807.30 36,067.20 2,580.48a) Import Business 16,101.17 28,391.20 29,534.90 24,056.20 1,217.70b) Export Business 3,549.00 5,868.90 10,260.60 7,279.40 650.00c) Remittance 558.75 843.47 1,011.80 4,731.60 712.7819 No. of Foreign Correspondent 240.00 240.00 1,400.00 1,400.00 1,400.0020 Profit Earning Assets 41,371.52 56,040.95 79,211.72 112,003.37 135,976.0921 Non Prifit Earning Assets 6,607.02 7,578.84 11,801.17 17,729.80 25,846.8822 Investment as a % of Total Deposit 91.28% 92.51% 88.90% 87.62% 82.14%23 Capital Adequacy Ration 10.91% 9.09% 9.07% 10.20% 10.13%24 Dividenta) Cash Nil Nil Nil Nil 10%b) Bonus 10% 12% 10% 10% Nilc) Right Share Nil 20% Nil Nil Nil25 Cost of Fund 9.28% 8.90% 10.01% 11.00% 11.64%26 Net Asset Value Per Share 12.45 12.81 13.38 15.28 15.6427 Earning Per Share (EPS) 1.42 1.61 1.71 1.85 1.8728 Price Earning Ration (times) 15.39 25.21 15.37 9.99 8.0829 Return on Assets (ROA) 1.56% 1.89% 1.75% 0.69% 0.53%30 No. of Shareholders 54,400 82,230 90,954 89,994 90,98531 Number of Employees 775 929 1,342 2,090 2,36732 Number of Branches 52 66 84 100 117
(Amount in million Tk.)
F i r s t S e c u r i t y I s l a m i B a n k L i m i t e d . . .
F i n a n c i a l S t a t e m e n t s A n a l y s i s | 49
3.2: Historical Background of FSIBL
First Security Islami Bank Limited (FSIBL) was formed in Bangladesh on29th August 1999 under Companies Act 1994 to start banking business. Itobtained permission from Bangladesh Bank on 22 September 1999 to beginits business. The Bank carries banking activities through its 136 branches inthe country. Their commercial banking activities include a wide range ofservices including accepting deposits, discounting bills, conducting moneytransfer and foreign exchange transactions, and performing other relatedservices such as safe keeping, collections and issuing guarantees,acceptances and letter of credit. FSIBL started their business withtraditional commercial banking services as First Security Bank Ltd.However, from January 01, 2009 they converted their business to IslamicBanking with Islamic Shariah Act and the bank changed its name and modeof business and incorporated as First Security Islami Bank Ltd. It startedwith 14 branches in 1999 but now has 134 branches in Bangladesh whichshows the impact they have had in the economy. The bank maintains afriendly relationship with the top ranking banks. They have online, SMS andATM banking facilities for their clients.The company philosophy “A step ahead in time” has been exactly the spiritfor Asian success; the bank has been operating with talented and brilliantpersonnel, equipment with modern technology so as to make it mostefficient to meet the challenges of 21st century and to fulfill the needs andwants of its customers.
F i r s t S e c u r i t y I s l a m i B a n k L i m i t e d . . .
F i n a n c i a l S t a t e m e n t s A n a l y s i s | 50
3.3: Vision, Mission, Objective and Strategies of FSIBL
3.3.1: VisionTo be the premier financial institution in the country by providing high qualityproducts and services backed by latest technology and a team of highlymotivated personnel to deliver excellence in Banking.3.3.2: Mission
To be the most caring and customer friendly and service oriented bank. To create a technology based most efficient banking environment for itscustomers. To contribute to the socio-economic development of the country. To attain the highest level of satisfaction through the extension ofservices by dedicated and motivated professionals. To maintain continuous growth of market share by ensuring quality. To ensure ethics and transparency in all levels. To ensure sustainable growth and establish full value of the honorableshareholders and Above all, to contribute effectively to the national economy.
3.3.3: Objective
To conduct banking service according to Islamic Shariah To provide efficient computerized banking system. To ensure foreign exchange operations. To accept deposit on profit-loss sharing basis. To establish a welfare-oriented banking system. To play a vital role in human development and employment generation. To contribute toward balanced growth and development of the countrythrough investment operations particularly in the less developed areas.
F i r s t S e c u r i t y I s l a m i B a n k L i m i t e d . . .
F i n a n c i a l S t a t e m e n t s A n a l y s i s | 51
3.3.4: Strategies
To achieve our customer’s best satisfaction & win their confidence. To manage & operate the bank in the most effective manner. To identify customer’s need & monitor their perception towards meetingthose requirements. To review & update policies, procedures & practices to enhance theability to extend better customer services. To train & develop all employees & provide them adequate resources sothat customers’ needs can reasonably addressed. To promote organizational efficiency by disclosing company’s plans,policies & procedures openly to the employees in a timely fashion. To ensure a congenial working environment. To diversify portfolio in both retail & wholesale market.
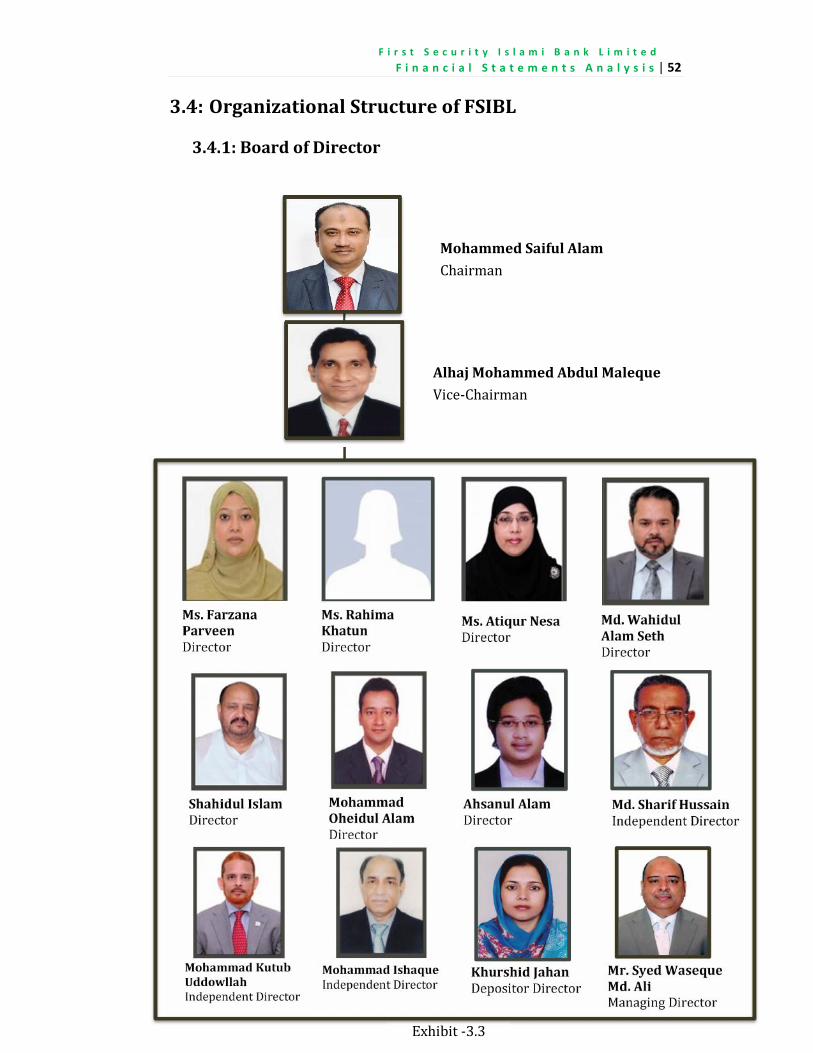
F i r s t S e c u r i t y I s l a m i B a n k L i m i t e d . . .
F i n a n c i a l S t a t e m e n t s A n a l y s i s | 52
3.4: Organizational Structure of FSIBL
3.4.1: Board of Director
Mohammed Saiful AlamChairmanAlhaj Mohammed Abdul MalequeVice-Chairman
Ms. FarzanaParveenDirector Ms. Rahima
KhatunDirector Ms. Atiqur NesaDirector Md. WahidulAlam SethDirector
Shahidul IslamDirector MohammadOheidul AlamDirector Ahsanul AlamDirector Md. Sharif HussainIndependent Director
Mohammad KutubUddowllahIndependent Director Mohammad IshaqueIndependent Director Khurshid JahanDepositor Director Mr. Syed Waseque
Md. AliManaging DirectorExhibit -3.3
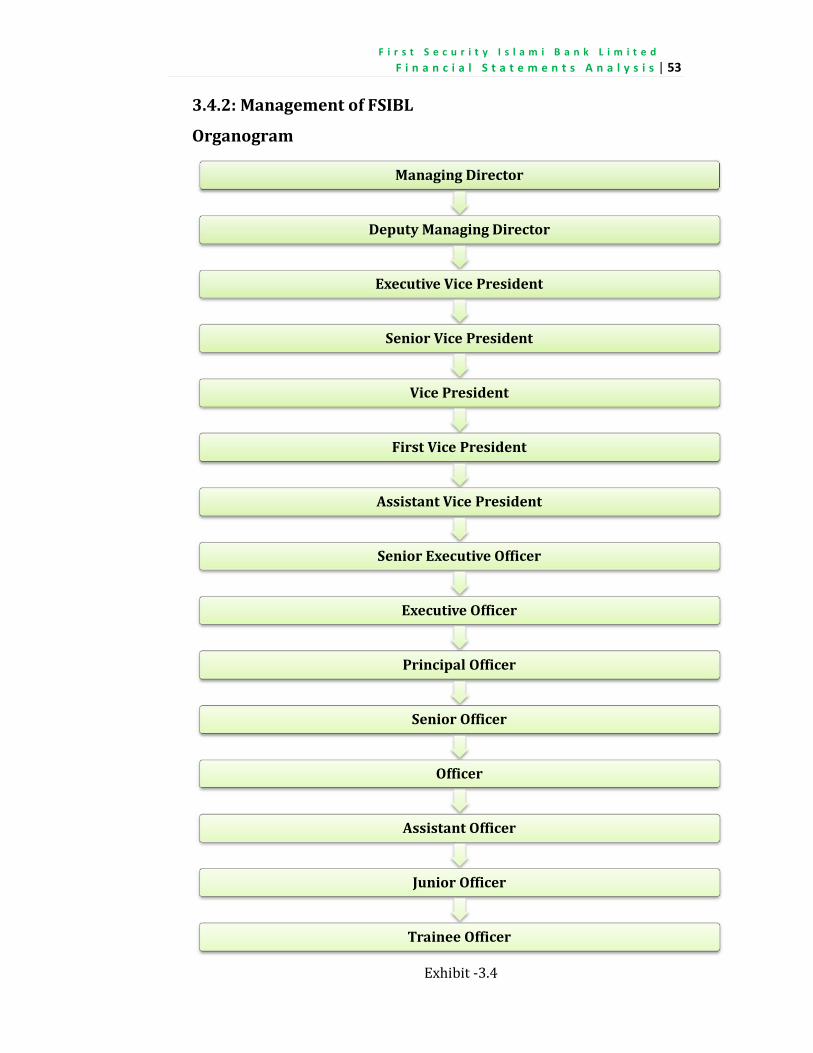
F i r s t S e c u r i t y I s l a m i B a n k L i m i t e d . . .
F i n a n c i a l S t a t e m e n t s A n a l y s i s | 53
3.4.2: Management of FSIBL
Organogram
Managing Director
Deputy Managing Director
Executive Vice President
Senior Vice President
Vice President
First Vice President
Assistant Vice President
Senior Executive Officer
Executive Officer
Principal Officer
Senior Officer
Officer
Assistant Officer
Junior Officer
Trainee OfficerExhibit -3.4
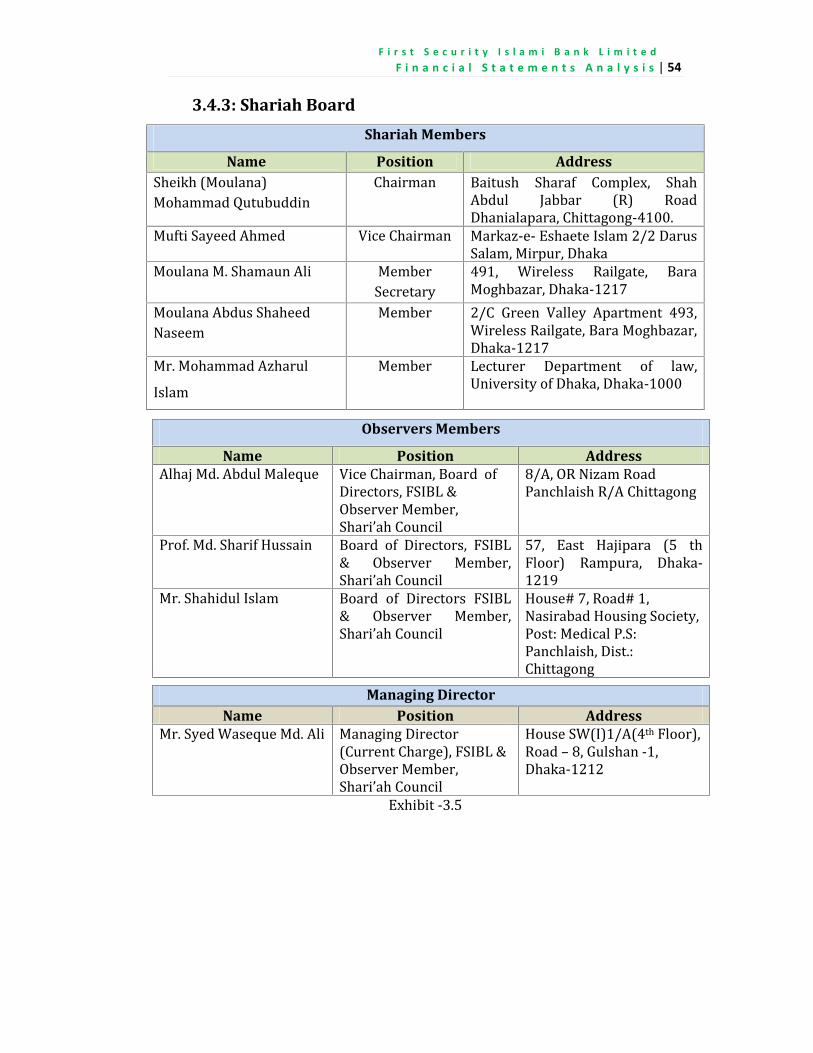
F i r s t S e c u r i t y I s l a m i B a n k L i m i t e d . . .
F i n a n c i a l S t a t e m e n t s A n a l y s i s | 54
3.4.3: Shariah BoardShariah Members
Name Position AddressSheikh (Moulana)Mohammad Qutubuddin Chairman Baitush Sharaf Complex, ShahAbdul Jabbar (R) RoadDhanialapara, Chittagong-4100.Mufti Sayeed Ahmed Vice Chairman Markaz-e- Eshaete Islam 2/2 DarusSalam, Mirpur, DhakaMoulana M. Shamaun Ali MemberSecretary 491, Wireless Railgate, BaraMoghbazar, Dhaka-1217Moulana Abdus ShaheedNaseem Member 2/C Green Valley Apartment 493,Wireless Railgate, Bara Moghbazar,Dhaka-1217Mr. Mohammad AzharulIslam Member Lecturer Department of law,University of Dhaka, Dhaka-1000Observers Members
Name Position AddressAlhaj Md. Abdul Maleque Vice Chairman, Board ofDirectors, FSIBL &Observer Member,Shari’ah Council8/A, OR Nizam RoadPanchlaish R/A Chittagong
Prof. Md. Sharif Hussain Board of Directors, FSIBL& Observer Member,Shari’ah Council 57, East Hajipara (5 thFloor) Rampura, Dhaka-1219Mr. Shahidul Islam Board of Directors FSIBL& Observer Member,Shari’ah Council House# 7, Road# 1,Nasirabad Housing Society,Post: Medical P.S:Panchlaish, Dist.:ChittagongManaging Director
Name Position AddressMr. Syed Waseque Md. Ali Managing Director(Current Charge), FSIBL &Observer Member,Shari’ah CouncilHouse SW(I)1/A(4th Floor),Road – 8, Gulshan -1,Dhaka-1212Exhibit -3.5
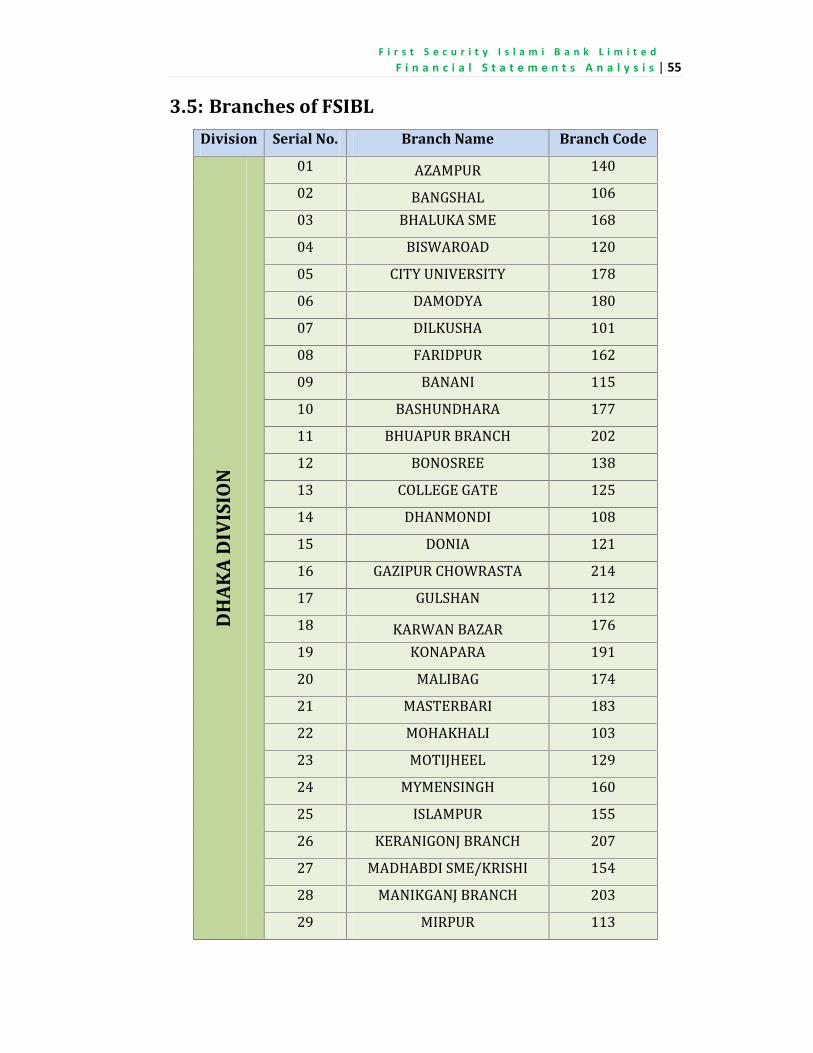
F i r s t S e c u r i t y I s l a m i B a n k L i m i t e d . . .
F i n a n c i a l S t a t e m e n t s A n a l y s i s | 55
3.5: Branches of FSIBLDivision Serial No. Branch Name Branch Code
DH
AKA
DIV
ISIO
N
01 AZAMPUR 14002 BANGSHAL 10603 BHALUKA SME 16804 BISWAROAD 12005 CITY UNIVERSITY 17806 DAMODYA 18007 DILKUSHA 10108 FARIDPUR 16209 BANANI 11510 BASHUNDHARA 17711 BHUAPUR BRANCH 20212 BONOSREE 13813 COLLEGE GATE 12514 DHANMONDI 10815 DONIA 12116 GAZIPUR CHOWRASTA 21417 GULSHAN 11218 KARWAN BAZAR 17619 KONAPARA 19120 MALIBAG 17421 MASTERBARI 18322 MOHAKHALI 10323 MOTIJHEEL 12924 MYMENSINGH 16025 ISLAMPUR 15526 KERANIGONJ BRANCH 20727 MADHABDI SME/KRISHI 15428 MANIKGANJ BRANCH 20329 MIRPUR 113
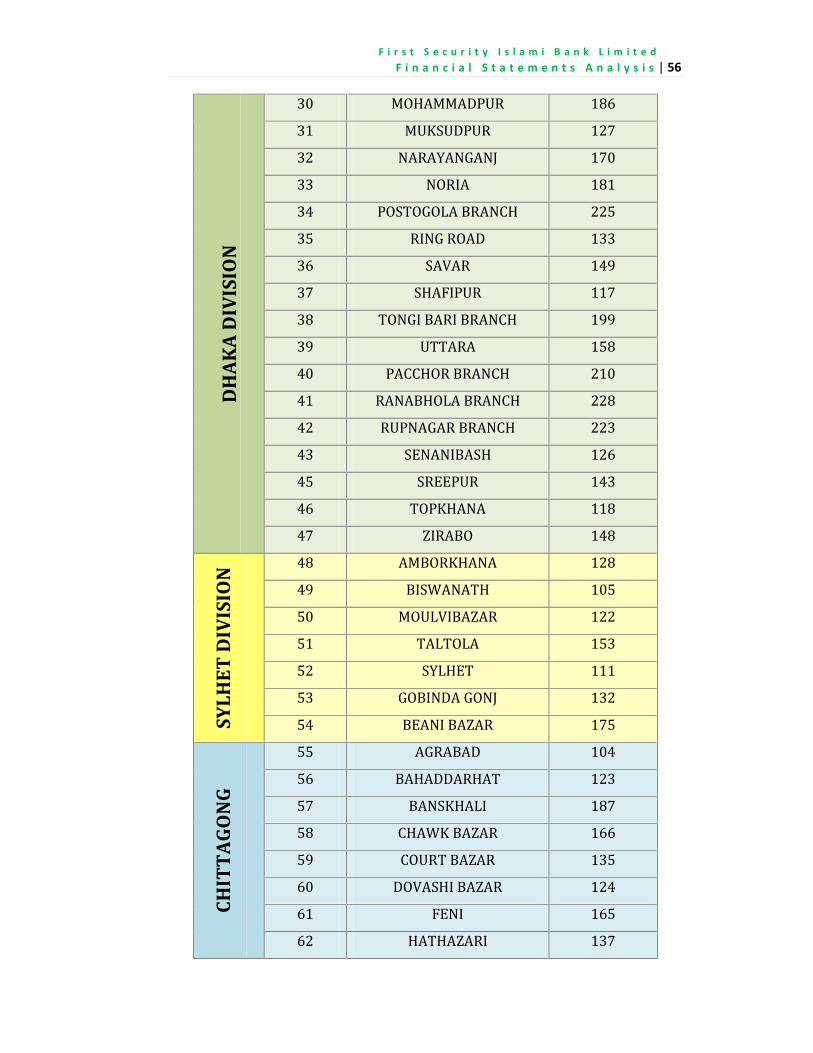
F i r s t S e c u r i t y I s l a m i B a n k L i m i t e d . . .
F i n a n c i a l S t a t e m e n t s A n a l y s i s | 56
DH
AKA
DIV
ISIO
N
30 MOHAMMADPUR 18631 MUKSUDPUR 12732 NARAYANGANJ 17033 NORIA 18134 POSTOGOLA BRANCH 22535 RING ROAD 13336 SAVAR 14937 SHAFIPUR 11738 TONGI BARI BRANCH 19939 UTTARA 15840 PACCHOR BRANCH 21041 RANABHOLA BRANCH 22842 RUPNAGAR BRANCH 22343 SENANIBASH 12645 SREEPUR 14346 TOPKHANA 11847 ZIRABO 148
SYLH
ET D
IVIS
ION 48 AMBORKHANA 12849 BISWANATH 10550 MOULVIBAZAR 12251 TALTOLA 15352 SYLHET 11153 GOBINDA GONJ 13254 BEANI BAZAR 175
CHIT
TAGO
NG
55 AGRABAD 10456 BAHADDARHAT 12357 BANSKHALI 18758 CHAWK BAZAR 16659 COURT BAZAR 13560 DOVASHI BAZAR 12461 FENI 16562 HATHAZARI 137
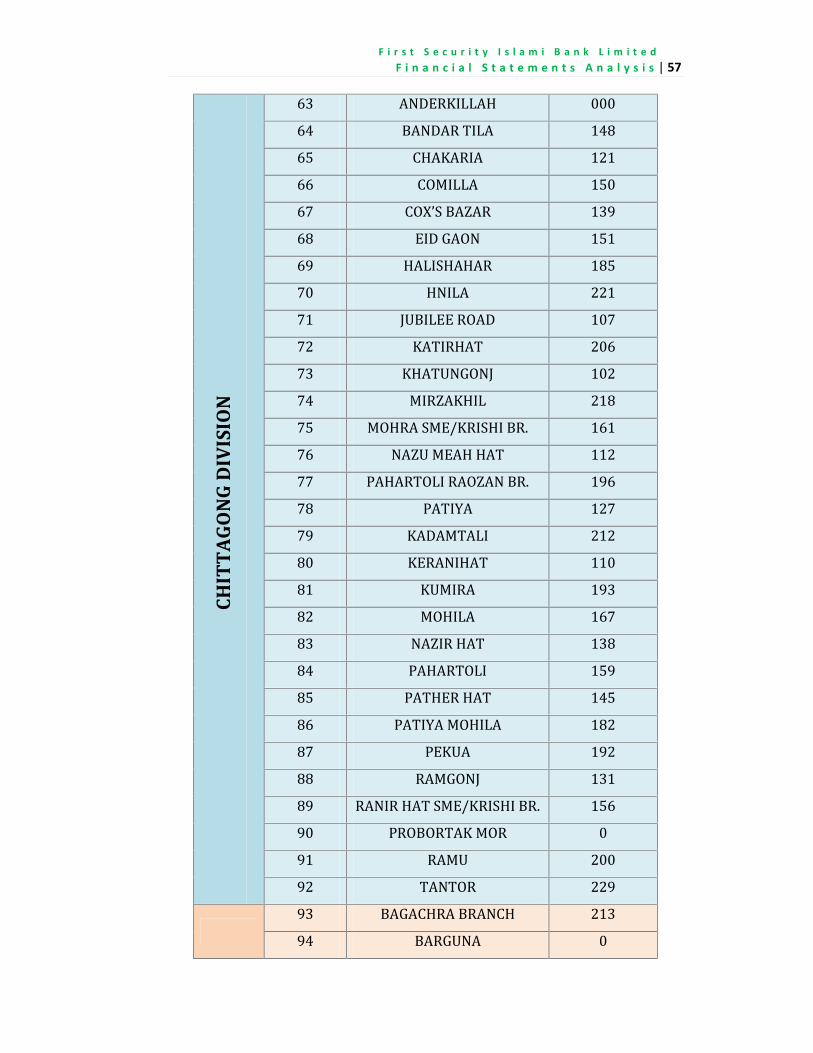
F i r s t S e c u r i t y I s l a m i B a n k L i m i t e d . . .
F i n a n c i a l S t a t e m e n t s A n a l y s i s | 57
CHIT
TAGO
NG
DIV
ISIO
N
63 ANDERKILLAH 00064 BANDAR TILA 14865 CHAKARIA 12166 COMILLA 15067 COX’S BAZAR 13968 EID GAON 15169 HALISHAHAR 18570 HNILA 22171 JUBILEE ROAD 10772 KATIRHAT 20673 KHATUNGONJ 10274 MIRZAKHIL 21875 MOHRA SME/KRISHI BR. 16176 NAZU MEAH HAT 11277 PAHARTOLI RAOZAN BR. 19678 PATIYA 12779 KADAMTALI 21280 KERANIHAT 11081 KUMIRA 19382 MOHILA 16783 NAZIR HAT 13884 PAHARTOLI 15985 PATHER HAT 14586 PATIYA MOHILA 18287 PEKUA 19288 RAMGONJ 13189 RANIR HAT SME/KRISHI BR. 15690 PROBORTAK MOR 091 RAMU 20092 TANTOR 22993 BAGACHRA BRANCH 21394 BARGUNA 0
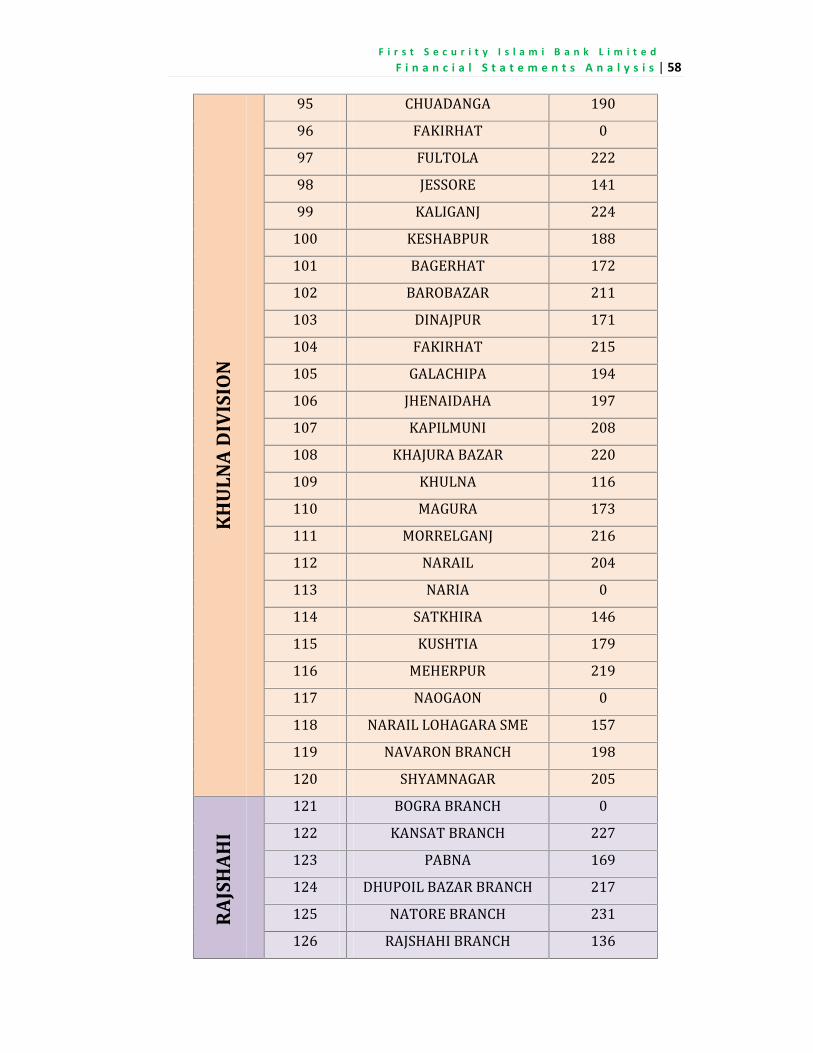
F i r s t S e c u r i t y I s l a m i B a n k L i m i t e d . . .
F i n a n c i a l S t a t e m e n t s A n a l y s i s | 58
KH
ULN
A D
IVIS
ION
95 CHUADANGA 19096 FAKIRHAT 097 FULTOLA 22298 JESSORE 14199 KALIGANJ 224100 KESHABPUR 188101 BAGERHAT 172102 BAROBAZAR 211103 DINAJPUR 171104 FAKIRHAT 215105 GALACHIPA 194106 JHENAIDAHA 197107 KAPILMUNI 208108 KHAJURA BAZAR 220109 KHULNA 116110 MAGURA 173111 MORRELGANJ 216112 NARAIL 204113 NARIA 0114 SATKHIRA 146115 KUSHTIA 179116 MEHERPUR 219117 NAOGAON 0118 NARAIL LOHAGARA SME 157119 NAVARON BRANCH 198120 SHYAMNAGAR 205
RAJS
HAH
I
121 BOGRA BRANCH 0122 KANSAT BRANCH 227123 PABNA 169124 DHUPOIL BAZAR BRANCH 217125 NATORE BRANCH 231126 RAJSHAHI BRANCH 136
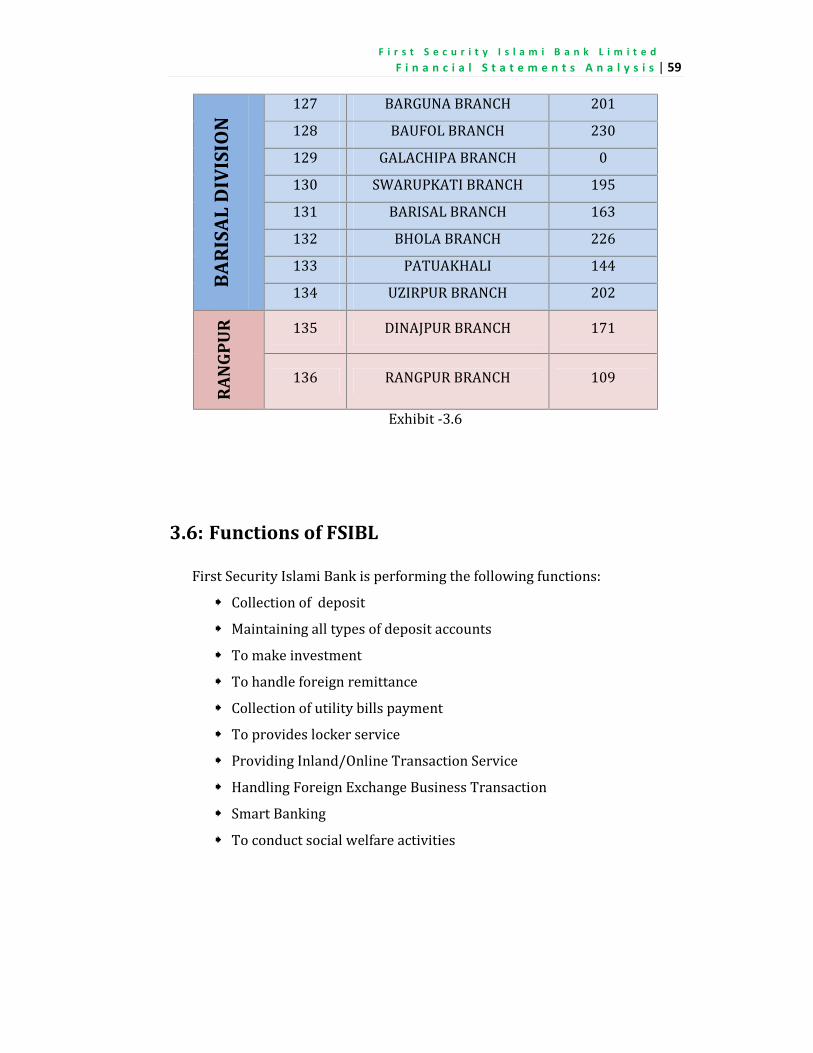
F i r s t S e c u r i t y I s l a m i B a n k L i m i t e d . . .
F i n a n c i a l S t a t e m e n t s A n a l y s i s | 59
BARI
SAL
DIV
ISIO
N
127 BARGUNA BRANCH 201128 BAUFOL BRANCH 230129 GALACHIPA BRANCH 0130 SWARUPKATI BRANCH 195131 BARISAL BRANCH 163132 BHOLA BRANCH 226133 PATUAKHALI 144134 UZIRPUR BRANCH 202RA
NGP
UR 135 DINAJPUR BRANCH 171
136 RANGPUR BRANCH 109Exhibit -3.6
3.6: Functions of FSIBL
First Security Islami Bank is performing the following functions: Collection of deposit Maintaining all types of deposit accounts To make investment To handle foreign remittance Collection of utility bills payment To provides locker service Providing Inland/Online Transaction Service Handling Foreign Exchange Business Transaction Smart Banking To conduct social welfare activities
F i r s t S e c u r i t y I s l a m i B a n k L i m i t e d . . .
F i n a n c i a l S t a t e m e n t s A n a l y s i s | 60
3.7: Features of FSIBLThe bank is committed to run all its activities as per Islami Shariah. FSIBLachieves the customers’ satisfactions through its fast and excellent service.The distinguishing features of FSIBL are as follows: All its activities are conducted on interest-free banking systemaccording to Ialami Shariah. Establishment of participatory banking system instead of banking ondebtor-creditor relationship. Investment is made in different modes permitted by Islami Shariah. Investment income of the Bank is shared to the MudarabahDepositors according to a ratio to ensure a fair rate of return on theirdeposits. The bank ensures life insurance of Tk.100000 to its clients againsttheir MMPS and MMDS accounts without taking additionalinstallment from the clients for the insurance. Its aims are to introduce a welfare-oriented banking system and alsoto establish equity and justice in the field of all economic activities. It extends Socio-economic and financial services to the poor, helplessand low-income group of people. The bank provides scholarship to the talent students as a part ofCorporate Social Responsibility. According to the needs and demands of society and the country as awhole the Bank invests money to different Halal business. The bankparticipates in different activities aiming at creating jobs,implementing development projects taken by the Government anddeveloping infrastructure.
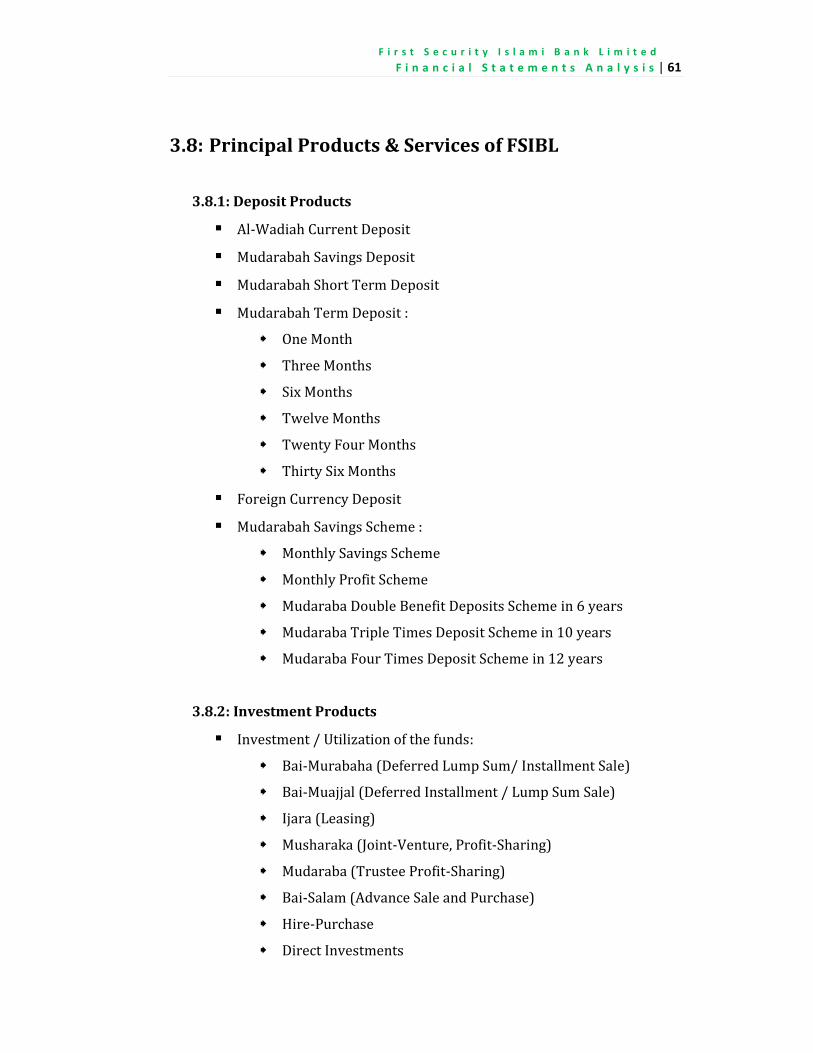
F i r s t S e c u r i t y I s l a m i B a n k L i m i t e d . . .
F i n a n c i a l S t a t e m e n t s A n a l y s i s | 61
3.8: Principal Products & Services of FSIBL
3.8.1: Deposit Products
Al-Wadiah Current Deposit Mudarabah Savings Deposit Mudarabah Short Term Deposit Mudarabah Term Deposit :
One Month Three Months Six Months Twelve Months Twenty Four Months Thirty Six Months
Foreign Currency Deposit Mudarabah Savings Scheme :
Monthly Savings Scheme Monthly Profit Scheme Mudaraba Double Benefit Deposits Scheme in 6 years Mudaraba Triple Times Deposit Scheme in 10 years Mudaraba Four Times Deposit Scheme in 12 years
3.8.2: Investment Products
Investment / Utilization of the funds: Bai-Murabaha (Deferred Lump Sum/ Installment Sale) Bai-Muajjal (Deferred Installment / Lump Sum Sale) Ijara (Leasing) Musharaka (Joint-Venture, Profit-Sharing) Mudaraba (Trustee Profit-Sharing) Bai-Salam (Advance Sale and Purchase) Hire-Purchase Direct Investments
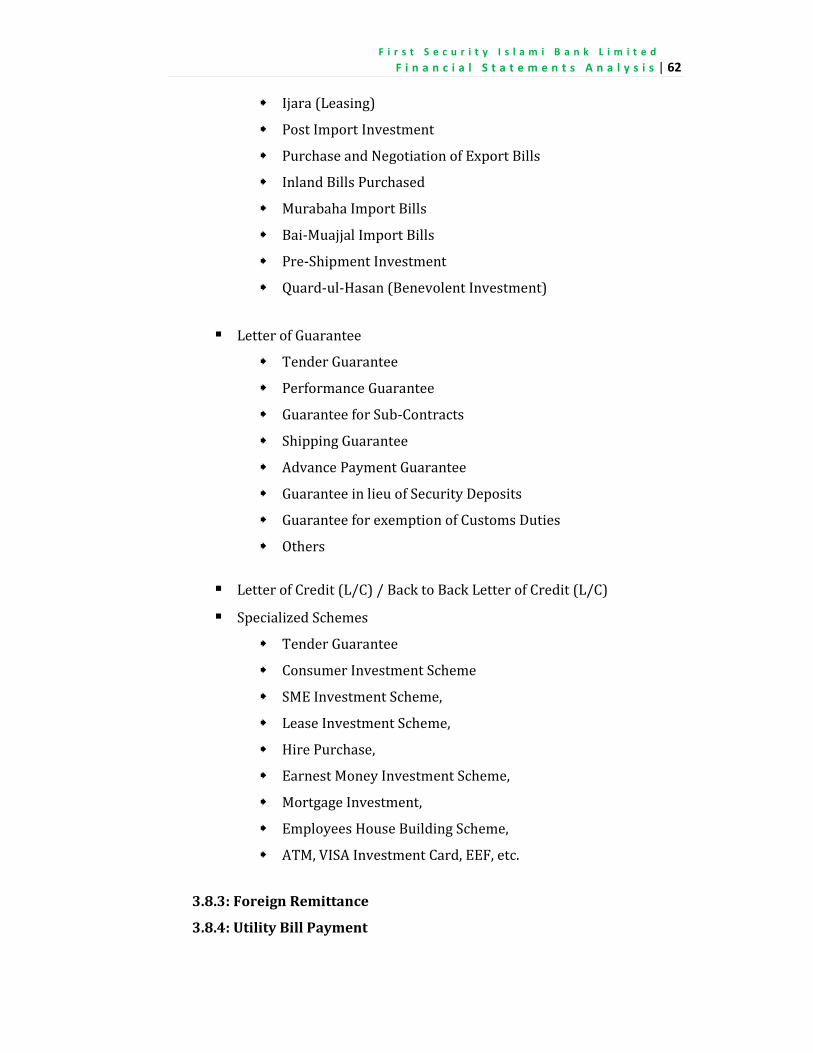
F i r s t S e c u r i t y I s l a m i B a n k L i m i t e d . . .
F i n a n c i a l S t a t e m e n t s A n a l y s i s | 62
Ijara (Leasing) Post Import Investment Purchase and Negotiation of Export Bills Inland Bills Purchased Murabaha Import Bills Bai-Muajjal Import Bills Pre-Shipment Investment Quard-ul-Hasan (Benevolent Investment)
Letter of Guarantee Tender Guarantee Performance Guarantee Guarantee for Sub-Contracts Shipping Guarantee Advance Payment Guarantee Guarantee in lieu of Security Deposits Guarantee for exemption of Customs Duties Others
Letter of Credit (L/C) / Back to Back Letter of Credit (L/C) Specialized Schemes
Tender Guarantee Consumer Investment Scheme SME Investment Scheme, Lease Investment Scheme, Hire Purchase, Earnest Money Investment Scheme, Mortgage Investment, Employees House Building Scheme, ATM, VISA Investment Card, EEF, etc.
3.8.3: Foreign Remittance
3.8.4: Utility Bill Payment
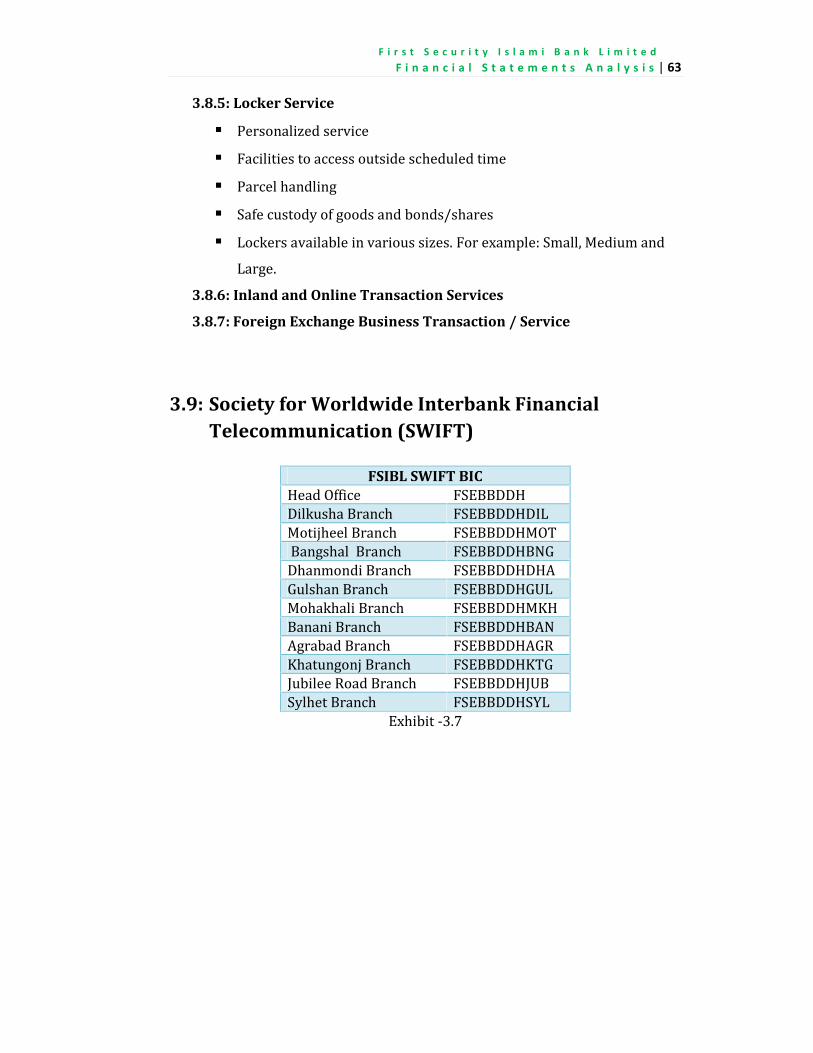
F i r s t S e c u r i t y I s l a m i B a n k L i m i t e d . . .
F i n a n c i a l S t a t e m e n t s A n a l y s i s | 63
3.8.5: Locker Service
Personalized service Facilities to access outside scheduled time Parcel handling Safe custody of goods and bonds/shares Lockers available in various sizes. For example: Small, Medium andLarge.
3.8.6: Inland and Online Transaction Services
3.8.7: Foreign Exchange Business Transaction / Service
3.9: Society for Worldwide Interbank FinancialTelecommunication (SWIFT)
FSIBL SWIFT BICHead Office FSEBBDDHDilkusha Branch FSEBBDDHDILMotijheel Branch FSEBBDDHMOTBangshal Branch FSEBBDDHBNGDhanmondi Branch FSEBBDDHDHAGulshan Branch FSEBBDDHGULMohakhali Branch FSEBBDDHMKHBanani Branch FSEBBDDHBANAgrabad Branch FSEBBDDHAGRKhatungonj Branch FSEBBDDHKTGJubilee Road Branch FSEBBDDHJUBSylhet Branch FSEBBDDHSYLExhibit -3.7
F i r s t S e c u r i t y I s l a m i B a n k L i m i t e d . . .
F i n a n c i a l S t a t e m e n t s A n a l y s i s | 64
Chapter Four
Core PartFinancial Statements Analysis of First
Security Islami Bank Limited (FSIBL)
4
Core PartFinancial Statements
Analysis of First SecurityIslami Bank Limited (FSIBL)
F i r s t S e c u r i t y I s l a m i B a n k L i m i t e d . . .
F i n a n c i a l S t a t e m e n t s A n a l y s i s | 65
4.1: IntroductionA bank is a financial institution whose main job is to collect fund fromsurplus units and invest in deficit units and making profits. Owners,depositors and shareholders of a bank invest to a bank to get profit orinterest as a reward in return. But their profit is depends on the bank’sfinancial performance. It depends on how a bank operates itself, howefficiently management operates the operations of a bank. To understandthe financial performance of a bank, the investor should analyze thefinancial statements of that bank. They may use different financial ratios toanalyze the financial performance of a bank. By analyzing the financialperformance of a bank investors and management can know the strengthsand weakness of the bank, and can take proper policy making decisions forfuture. To analyze the financial performance of First Security Islami BankLimited (FSIBL), different financial ratios are used to determine thestrengths and weakness of FSIBL. Actually, to understand the overallfinancial position and performance of FSIBL is the main aim of this chapter.4.2: Reconstruction of Financial Statements of FSIBLThe all core financial statements of FSIBL are obtained. These statementsinclude Balance Sheet, Income Statement, Statement of Cash Flows,Statement of Equity, Statement of Liquidity and their notes for five years.But, these are not in the format which is required for different financial ratioanalysis. So, some of these financial statements are reconstructed in variousformat for the interest of the analysis. The renovated statements are mainlyconcerned based on the duration of the accounts which is very important forratio analysis. For preparing these financial statements no fictional data areused, only the real financial data from notes of statements are usedaccording their duration and types.

2013 2012 2011 2010 2009 2008 2013 2012 2011 2010 2009 2013 2012 2011 2010 2009BDT BDT BDT BDT BDT BDT BDT BDT BDT BDT BDT % % % % %
PROPERTY AND ASSETSCurrent Assets 40,473,177,156 29,705,058,836 18,151,650,528 8,587,867,603 7,202,722,793 5,364,366,909 10,768,118,320 11,553,408,308 9,563,782,925 1,385,144,810 1,838,355,884 36% 64% 111% 19% 34%Cash 11,549,381,969 10,528,144,967 7145564652 4857542203 5033532439 1394671407 1,021,237,002 3,382,580,315 2,288,022,449 (175,990,236) 3,638,861,032 10% 47% 47% -3% 261%Balance With Bank and Financial Institutions 14,379,093,084 10,785,716,061 5699804595 1036199077 731150321 2101436244 3,593,377,023 5,085,911,466 4,663,605,518 305,048,756 (1,370,285,923) 33% 89% 450% 42% -65%Investments in Shares & Securities 2,723,632,786 3,187,223,270 1630019092 524937861 241026032 736969100 (463,590,484) 1,557,204,178 1,105,081,231 283,911,829 (495,943,068) -15% 96% 211% 118% -67%Other Assets 11,821,069,317 5,203,974,538 3676262189 2169188462 1197014001 1131290158 6,617,094,779 1,527,712,349 1,507,073,727 972,174,461 65,723,843 127% 42% 69% 81% 6%- -Fixed Assets 121,349,799,689 100,028,114,252 72,861,248,561 55,031,930,196 40,775,830,159 25,875,026,509 21,321,685,437 27,166,865,691 17,829,318,365 14,256,100,037 14,900,803,650 21% 37% 32% 35% 58%Investments in Shares & Securities 4,271,569,450 1,726,169,450 2414569450 2334416700 1673477998 596000000 2,545,400,000 (688,400,000) 80,152,750 660,938,702 1,077,477,998 147% -29% 3% 39% 181%Investments 114,601,798,177 96,304,228,588 69467328284 52123903164 38725874774 25094658077 18,297,569,589 26,836,900,304 17,343,425,120 13,398,028,390 13,631,216,697 19% 39% 33% 35% 54%Fixed Assets Including Premises, Furniture & Fixtures 2,476,432,062 1,997,716,214 979350827 573610332 376477387 184368432 478,715,848 1,018,365,387 405,740,495 197,132,945 192,108,955 24% 104% 71% 52% 104%-Total Assets 161,822,976,845 129,733,173,088 91,012,899,089 63,619,797,799 47,978,552,952 31,239,393,418 32,089,803,757 38,720,273,999 27,393,101,290 15,641,244,847 16,739,159,534 25% 43% 43% 33% 54%
LIABILITIES AND CAPITALLiabilities:Current Liabilities 152,709,588,439 121,650,118,339 86,432,834,521 59,699,786,313 45,113,142,197 28,700,820,412 31,059,470,100 35,217,283,818 26,733,048,208 14,586,644,116 16,412,321,785 26% 41% 45% 32% 57%Placement from Banks & Other Financial Institutions 3,950,000,000 4,400,000,000 3200000000 - - 630000000 (450,000,000) 1,200,000,000 3,200,000,000 - (630,000,000) -10% 38% - - -Deposits and Other Accounts 139,520,955,783 109,905,568,871 78145045008 56344959167 42423092722 25854541500 29,615,386,912 31,760,523,863 21,800,085,841 13,921,866,445 16,568,551,222 27% 41% 39% 33% 64%Other Liabilities 9,238,632,656 7,344,549,468 5087789513 3354827146 2690049475 2216278912 1,894,083,188 2,256,759,955 1,732,962,367 664,777,671 473,770,563 26% 44% 52% 25% 21%- -Long-Term Liabilities 2,679,788,842 2,418,574,967 31,114,000 - - - 261,213,875 2,387,460,967 31,114,000 - - 11% 7673% - - -Placement from Banks & Other Financial Institutions 179,788,842 198,574,967 31114000 - - - (18,786,125) 167,460,967 31,114,000 - - -9% 538% - - -Mudaraba Subordinated Bond 2,500,000,000 2,220,000,000 - - - - 280,000,000 2220000000 - - - 13% - - - -- -Total Liabilities 155,389,377,281 124,068,693,306 86,463,948,521 59,699,786,313 45,113,142,197 28,700,820,412 31,320,683,975 37,604,744,785 26,764,162,208 14,586,644,116 16,412,321,785 25% 43% 45% 32% 57%-Capital/ Shareholders' Equity -Paid-up Capital 4,114,387,200 3,740,352,000 3400320000 3036000000 2300000000 2300000000 374,035,200 340,032,000 364,320,000 736,000,000 - 10% 10% 12% 32% 0%Statutory Reserve 1,310,398,870 1,004,574,914 704202214 460169845 263449699 134082149 305,823,956 300,372,700 244,032,369 196,720,146 129,367,550 30% 43% 53% 75% 96%Other Reserve 114,061,074 84,000,000 24000000 24000000 24000000 24000000 30,061,074 60,000,000 - - - 36% 250% 0% 0% 0%Assets Revaluation Reserves 392,381,876 402,442,950 371537509 - - - (10,061,074) 30,905,441 371,537,509 - - -3% 8% - - -Retained Earnings 502,370,544 433,109,918 48890845 399841641 277961056 80490857 69,260,626 384,219,073 (350,950,796) 121,880,585 197,470,199 16% 786% -88% 44% 245%Total Shareholders' Equity 6,433,599,564 5,664,479,782 4,548,950,568 3,920,011,486 2,865,410,755 2,538,573,006 769,119,782 1,115,529,214 628,939,082 1,054,600,731 326,837,749 14% 25% 16% 37% 13%- - -Total Liabilities and Equity 161,822,976,845 129,733,173,088 91,012,899,089 63,619,797,799 47,978,552,952 31,239,393,418 32,089,803,757 38,720,273,999 27,393,101,290 15,641,244,847 16,739,159,534 25% 43% 43% 33% 54%
Changes in Percentage
Exhibit -4.1
FIRST SECURITY ISLAMI BANK LIMITEDCOMPARATIVE BALANCE SHEET
FOR THE YEARS- 2013, 2012, 2011, 2010, 2009 and 2008
Particulars
Changes in BDT

2013 2012 2011 2010 2009 2008 2013 2012 2011 2010 2009 2013 2012 2011 2010 2009BDT BDT BDT BDT BDT BDT BDT BDT BDT BDT BDT % % % % %Investments Income 18,277,686,531 13,339,668,730 8,747,763,443 5,547,047,795 4,348,674,553 3,141,799,470 4,938,017,801 4,591,905,287 3,200,715,648 1,198,373,242 1,206,875,083 37.02% 52.49% 57.70% 27.56% 38.41%Prefit Paid on deposits (14,597,553,390) (10,309,755,493) (6,670,951,220) (4,125,826,500) (3,333,800,367) (2,939,155,779) (4,287,797,897) (3,638,804,273) (2,545,124,720) (792,026,133) (394,644,588) 41.59% 54.55% 61.69% 23.76% 13.43%
Net Investment Income 3,680,133,141 3,029,913,237 2,076,812,223 1,421,221,295 1,014,874,186 202,643,691 650,219,904 953,101,014 655,590,928 406,347,109 812,230,495 21.46% 45.89% 46.13% 40.04% 400.8%Income from Investment in shares and securities 235,670,968 98,997,129 81,967,646 264,208,027 53,510,527 202,345,834 136,673,839 17,029,483 (182,240,381) 210,697,500 (148,835,307) 138.06% 20.78% -68.98% 393.75% -73.55%Commussion, Exchange and Brokerage 326,776,987 404,240,245 403,310,160 282,561,956 194,631,419 133,384,184 (77,463,258) 930,085 120,748,204 87,930,537 61,247,235 -19.16% 0.23% 42.73% 45.18% 45.92%Other Operating Income 167,015,629 201,533,344 173,662,888 117,216,660 64,617,576 34,409,250 (34,517,715) 27,870,456 56,446,228 52,599,084 30,208,326 -17.13% 16.05% 48.16% 81.40% 87.79%729,463,584 704,770,718 658,940,694 663,986,643 312,759,522 370,139,268 24,692,866 45,830,024 (5,045,949) 351,227,121 (57,379,746) 3.50% 6.96% -0.76% 112.30% -15.50%
Total Operating Income 4,409,596,725 3,734,683,955 2,735,752,917 2,085,207,938 1,327,633,708 572,782,959 674,912,770 998,931,038 650,544,979 757,574,230 754,850,749 18.07% 36.51% 31.20% 57.06% 131.8%Less: Total Operating Expenses (2,383,876,943) (1,792,725,352) (1,146,191,070) (881,607,207) (576,795,959) (383,179,206) (591,151,591) (646,534,282) (264,583,863) (304,811,248) (193,616,753) 32.98% 56.41% 30.01% 52.85% 50.53%Profit before Provision and Tax 2,025,719,782 1,941,958,603 1,589,561,847 1,203,600,731 750,837,749 189,603,753 83,761,179 352,396,756 385,961,116 452,762,982 561,233,996 4.31% 22.17% 32.07% 60.30% 296.0%Less: Total Provisions (496,600,000) (440,095,104) (369,400,000) (220,000,000) (104,000,000) - (56,504,896) (70,695,104) (149,400,000) (116,000,000) (104,000,000) 12.84% 19.14% 67.91% 111.54% -Profit before Tax 1,529,119,782 1,501,863,499 1,220,161,847 983,600,731 646,837,749 189,603,753 27,256,283 281,701,652 236,561,116 336,762,982 457,233,996 1.81% 23.09% 24.05% 52.06% 241.2%Less: Total Tax (760,000,000) (740,000,000) (640,000,000) (435,000,000) (320,000,000) (85,321,689) (20,000,000) (100,000,000) (205,000,000) (115,000,000) (234,678,311) 2.70% 15.63% 47.13% 35.94% 275.05%Net Profit after Tax 769,119,782 761,863,499 580,161,847 548,600,731 326,837,749 104,282,064 7,256,283 181,701,652 31,561,116 221,762,982 222,555,685 0.95% 31.32% 5.75% 67.85% 213.4%Retained Earning Brought Forward from Previous Year 433,109,918 371,651,119 399,840,641 277,961,056 80,490,857 14,129,544 61,458,799 (28,189,522) 121,879,585 197,470,199 66,361,313 16.54% -7.05% 43.85% 245.3% 469.7%
1,202,229,700 1,133,514,618 980,002,488 826,561,787 407,328,606 118,411,608 68,715,082 153,512,130 153,440,701 419,233,181 288,916,998 6.06% 15.66% 18.56% 102.9% 244.0%Appropriations:Statutory Reserve 305,823,956 300,372,700 244,032,369 196,720,146 129,367,550 37,920,751 5,451,256 56,340,331 47,312,223 67,352,596 91,446,799 1.81% 23.09% 24.05% 52.06% 241.2%Other Reserve 20,000,000 60,000,000 - - - - (40,000,000) 60,000,000 - - - -66.67% - - - -Bonus Share Issued 374,035,200 340,032,000 364,320,000 230,000,000 - - 34,003,200 (24,288,000) 134,320,000 230,000,000 - 10.00% -6.67% 58.40% - -Total Appropriations 699,859,156 700,404,700 608,352,369 426,720,146 129,367,550 37,920,751 (545,544) 92,052,331 181,632,223 297,352,596 91,446,799 -0.08% 15.13% 42.56% 229.9% 241.2%Retained Earnings Carried Forward 502,370,544 433,109,918 371,650,119 399,841,641 277,961,056 80,490,857 69,260,626 61,459,799 (28,191,522) 121,880,585 197,470,199 15.99% 16.54% -7.05% 43.85% 245.3%
Earnings Per Share (EPS) 1.87 1.85 1.71 2.33 1.42 7.35 0.02 0.15 (0.62) 0.90 (5.93) 0.95% 8.53% -26.64% 63.66% -80.67%
Changes in Percentage
Exhibit -4.2
FIRST SECURITY ISLAMI BANK LIMITEDCOMPARATIVE INCOME STATEMENT
FOR THE YEARS- 2013, 2012, 2011, 2010, 2009 and 2008
Particulars
Changes in BDT
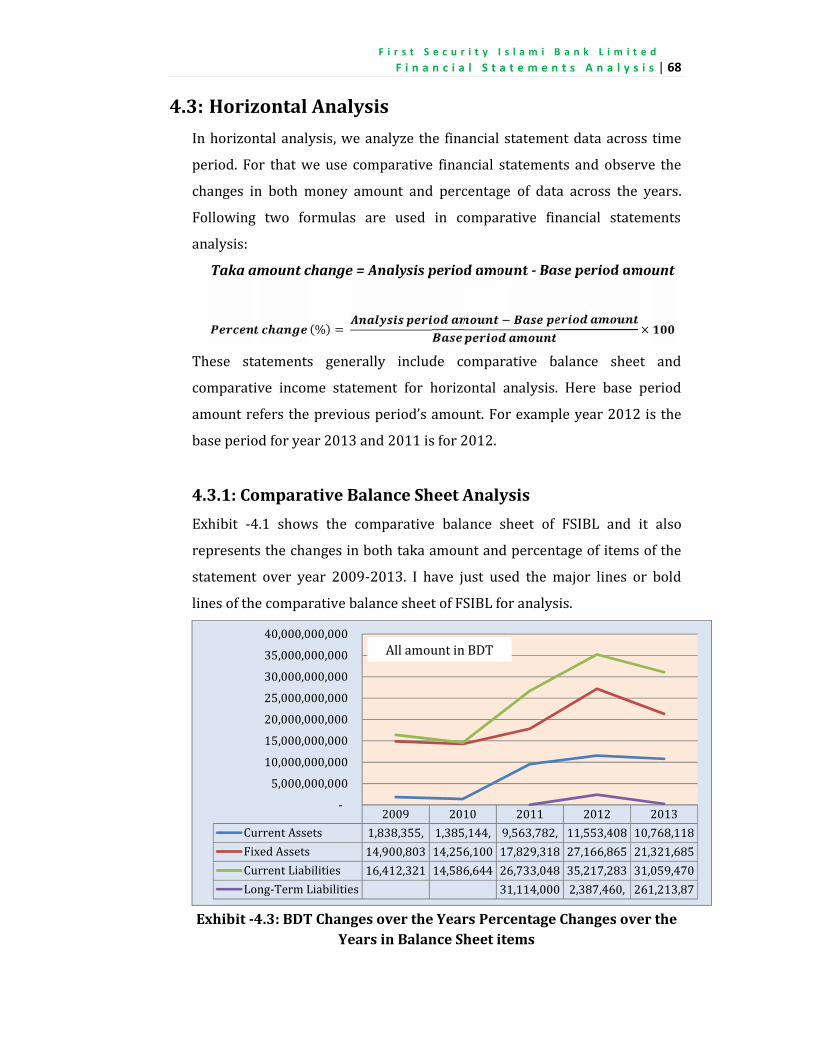
F i r s t S e c u r i t y I s l a m i B a n k L i m i t e d . . .
F i n a n c i a l S t a t e m e n t s A n a l y s i s | 68
4.3: Horizontal AnalysisIn horizontal analysis, we analyze the financial statement data across timeperiod. For that we use comparative financial statements and observe thechanges in both money amount and percentage of data across the years.Following two formulas are used in comparative financial statementsanalysis:Taka amount change = Analysis period amount - Base period amount
(%) = − ×These statements generally include comparative balance sheet andcomparative income statement for horizontal analysis. Here base periodamount refers the previous period’s amount. For example year 2012 is thebase period for year 2013 and 2011 is for 2012.4.3.1: Comparative Balance Sheet AnalysisExhibit -4.1 shows the comparative balance sheet of FSIBL and it alsorepresents the changes in both taka amount and percentage of items of thestatement over year 2009-2013. I have just used the major lines or boldlines of the comparative balance sheet of FSIBL for analysis.
Exhibit -4.3: BDT Changes over the Years Percentage Changes over theYears in Balance Sheet items
2009 2010 2011 2012 2013Current Assets 1,838,355, 1,385,144, 9,563,782, 11,553,408 10,768,118Fixed Assets 14,900,803 14,256,100 17,829,318 27,166,865 21,321,685Current Liabilities 16,412,321 14,586,644 26,733,048 35,217,283 31,059,470Long-Term Liabilities 31,114,000 2,387,460, 261,213,87 - 5,000,000,000 10,000,000,000 15,000,000,000 20,000,000,000 25,000,000,000 30,000,000,000 35,000,000,000 40,000,000,000 All amount in BDT
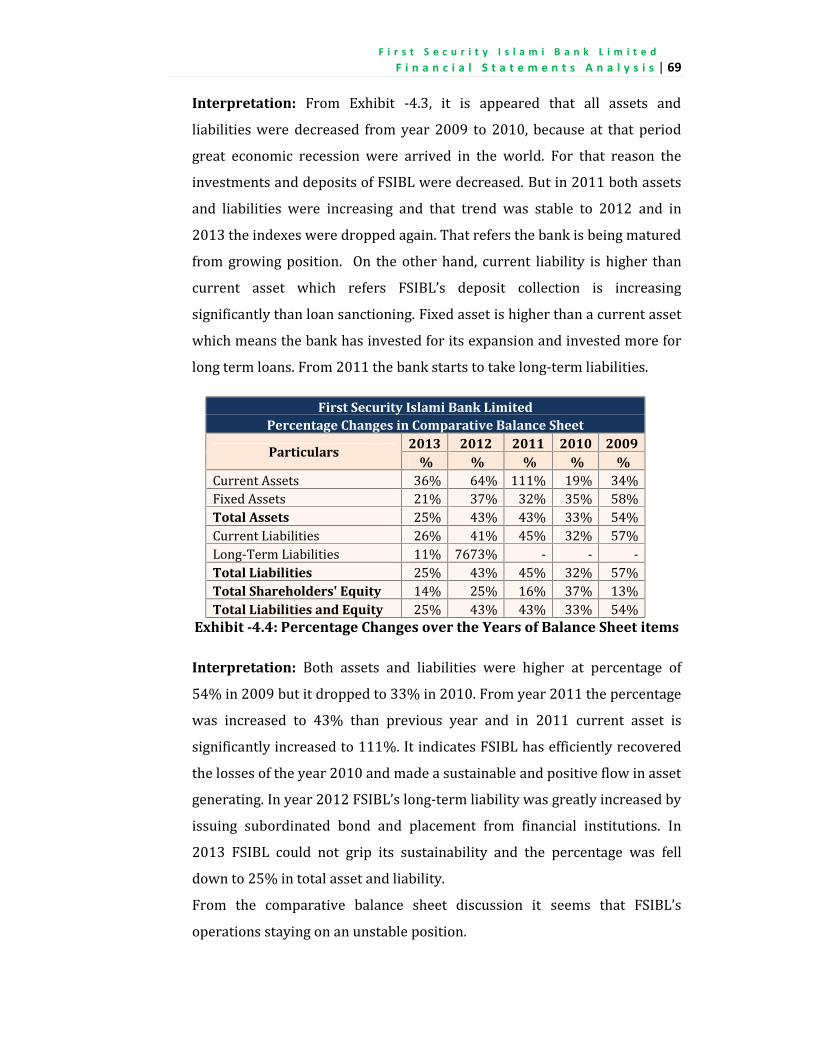
F i r s t S e c u r i t y I s l a m i B a n k L i m i t e d . . .
F i n a n c i a l S t a t e m e n t s A n a l y s i s | 69
Interpretation: From Exhibit -4.3, it is appeared that all assets andliabilities were decreased from year 2009 to 2010, because at that periodgreat economic recession were arrived in the world. For that reason theinvestments and deposits of FSIBL were decreased. But in 2011 both assetsand liabilities were increasing and that trend was stable to 2012 and in2013 the indexes were dropped again. That refers the bank is being maturedfrom growing position. On the other hand, current liability is higher thancurrent asset which refers FSIBL’s deposit collection is increasingsignificantly than loan sanctioning. Fixed asset is higher than a current assetwhich means the bank has invested for its expansion and invested more forlong term loans. From 2011 the bank starts to take long-term liabilities.First Security Islami Bank Limited
Percentage Changes in Comparative Balance Sheet
Particulars 2013 2012 2011 2010 2009% % % % %Current Assets 36% 64% 111% 19% 34%Fixed Assets 21% 37% 32% 35% 58%
Total Assets 25% 43% 43% 33% 54%Current Liabilities 26% 41% 45% 32% 57%Long-Term Liabilities 11% 7673% - - -Total Liabilities 25% 43% 45% 32% 57%Total Shareholders' Equity 14% 25% 16% 37% 13%Total Liabilities and Equity 25% 43% 43% 33% 54%
Exhibit -4.4: Percentage Changes over the Years of Balance Sheet items
Interpretation: Both assets and liabilities were higher at percentage of54% in 2009 but it dropped to 33% in 2010. From year 2011 the percentagewas increased to 43% than previous year and in 2011 current asset issignificantly increased to 111%. It indicates FSIBL has efficiently recoveredthe losses of the year 2010 and made a sustainable and positive flow in assetgenerating. In year 2012 FSIBL’s long-term liability was greatly increased byissuing subordinated bond and placement from financial institutions. In2013 FSIBL could not grip its sustainability and the percentage was felldown to 25% in total asset and liability.From the comparative balance sheet discussion it seems that FSIBL’soperations staying on an unstable position.
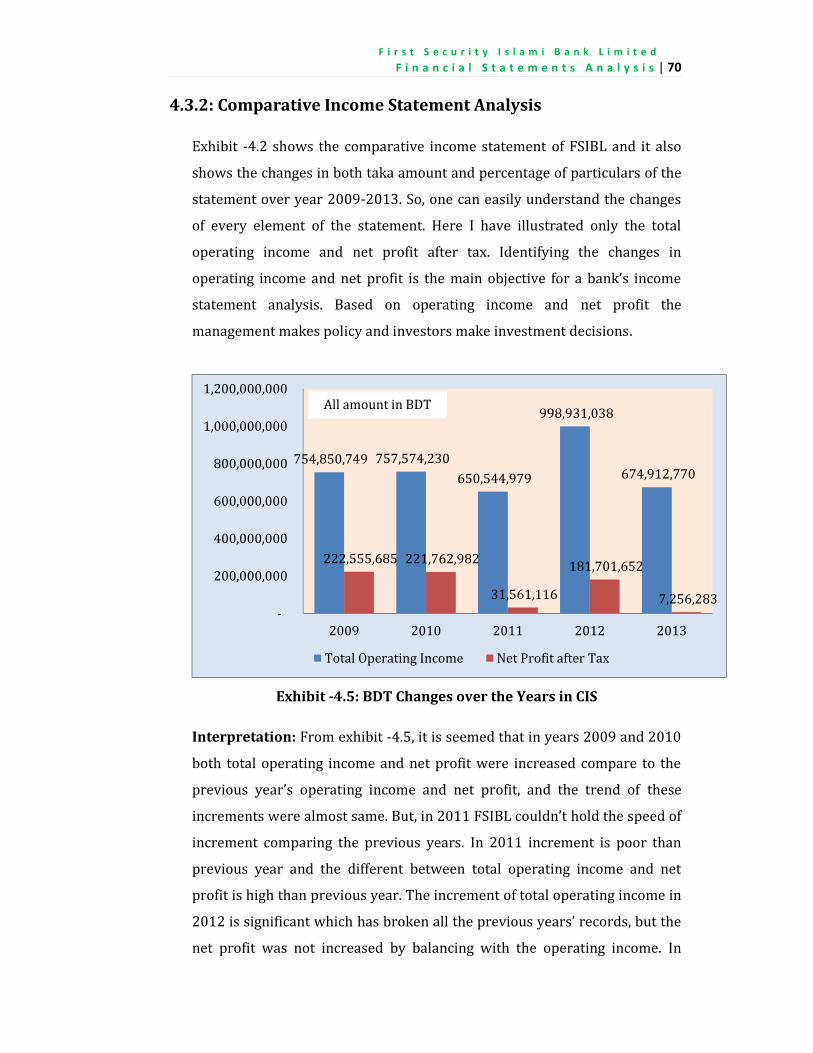
F i r s t S e c u r i t y I s l a m i B a n k L i m i t e d . . .
F i n a n c i a l S t a t e m e n t s A n a l y s i s | 70
4.3.2: Comparative Income Statement AnalysisExhibit -4.2 shows the comparative income statement of FSIBL and it alsoshows the changes in both taka amount and percentage of particulars of thestatement over year 2009-2013. So, one can easily understand the changesof every element of the statement. Here I have illustrated only the totaloperating income and net profit after tax. Identifying the changes inoperating income and net profit is the main objective for a bank’s incomestatement analysis. Based on operating income and net profit themanagement makes policy and investors make investment decisions.
Exhibit -4.5: BDT Changes over the Years in CIS
Interpretation: From exhibit -4.5, it is seemed that in years 2009 and 2010both total operating income and net profit were increased compare to theprevious year’s operating income and net profit, and the trend of theseincrements were almost same. But, in 2011 FSIBL couldn’t hold the speed ofincrement comparing the previous years. In 2011 increment is poor thanprevious year and the different between total operating income and netprofit is high than previous year. The increment of total operating income in2012 is significant which has broken all the previous years’ records, but thenet profit was not increased by balancing with the operating income. In
754,850,749 757,574,230 650,544,979998,931,038
674,912,770222,555,685 221,762,982 31,561,116 181,701,652 7,256,283 - 200,000,000 400,000,000 600,000,000 800,000,000 1,000,000,000 1,200,000,000
2009 2010 2011 2012 2013Total Operating Income Net Profit after Tax
All amount in BDT
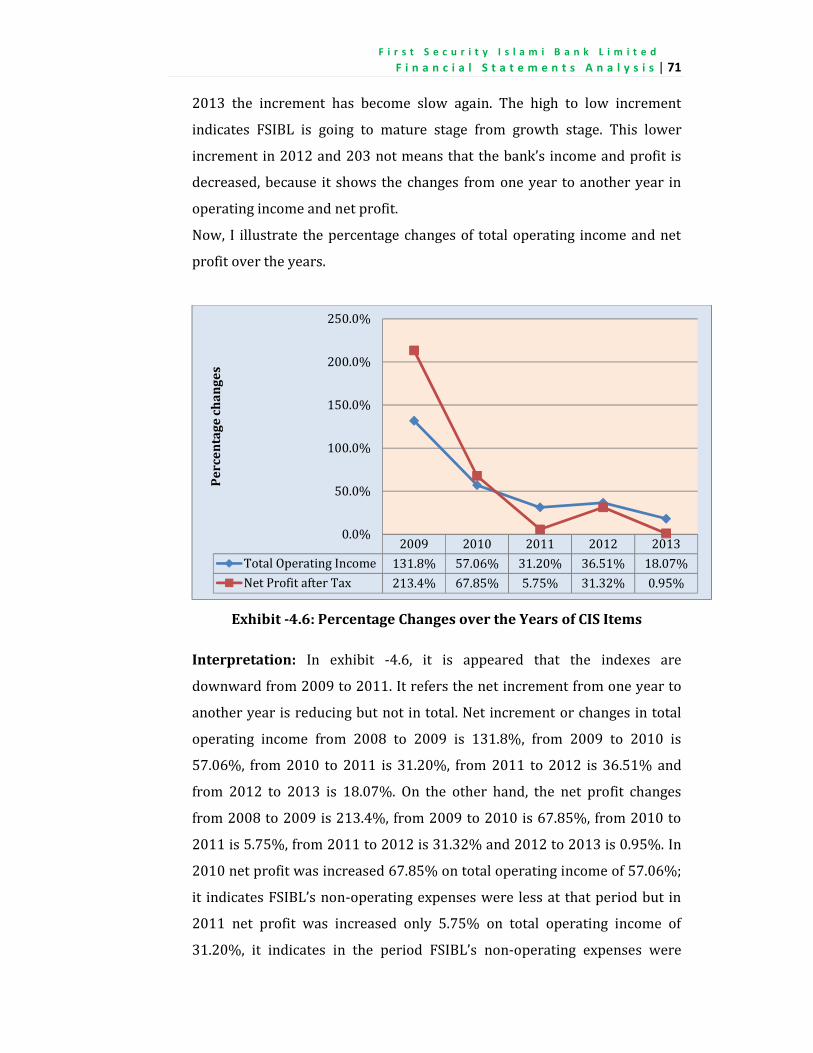
F i r s t S e c u r i t y I s l a m i B a n k L i m i t e d . . .
F i n a n c i a l S t a t e m e n t s A n a l y s i s | 712013 the increment has become slow again. The high to low incrementindicates FSIBL is going to mature stage from growth stage. This lowerincrement in 2012 and 203 not means that the bank’s income and profit isdecreased, because it shows the changes from one year to another year inoperating income and net profit.Now, I illustrate the percentage changes of total operating income and netprofit over the years.
Exhibit -4.6: Percentage Changes over the Years of CIS Items
Interpretation: In exhibit -4.6, it is appeared that the indexes aredownward from 2009 to 2011. It refers the net increment from one year toanother year is reducing but not in total. Net increment or changes in totaloperating income from 2008 to 2009 is 131.8%, from 2009 to 2010 is57.06%, from 2010 to 2011 is 31.20%, from 2011 to 2012 is 36.51% andfrom 2012 to 2013 is 18.07%. On the other hand, the net profit changesfrom 2008 to 2009 is 213.4%, from 2009 to 2010 is 67.85%, from 2010 to2011 is 5.75%, from 2011 to 2012 is 31.32% and 2012 to 2013 is 0.95%. In2010 net profit was increased 67.85% on total operating income of 57.06%;it indicates FSIBL’s non-operating expenses were less at that period but in2011 net profit was increased only 5.75% on total operating income of31.20%, it indicates in the period FSIBL’s non-operating expenses were
2009 2010 2011 2012 2013Total Operating Income 131.8% 57.06% 31.20% 36.51% 18.07%Net Profit after Tax 213.4% 67.85% 5.75% 31.32% 0.95%0.0%
50.0%100.0%150.0%200.0%250.0%
Perc
enta
ge ch
ange
s
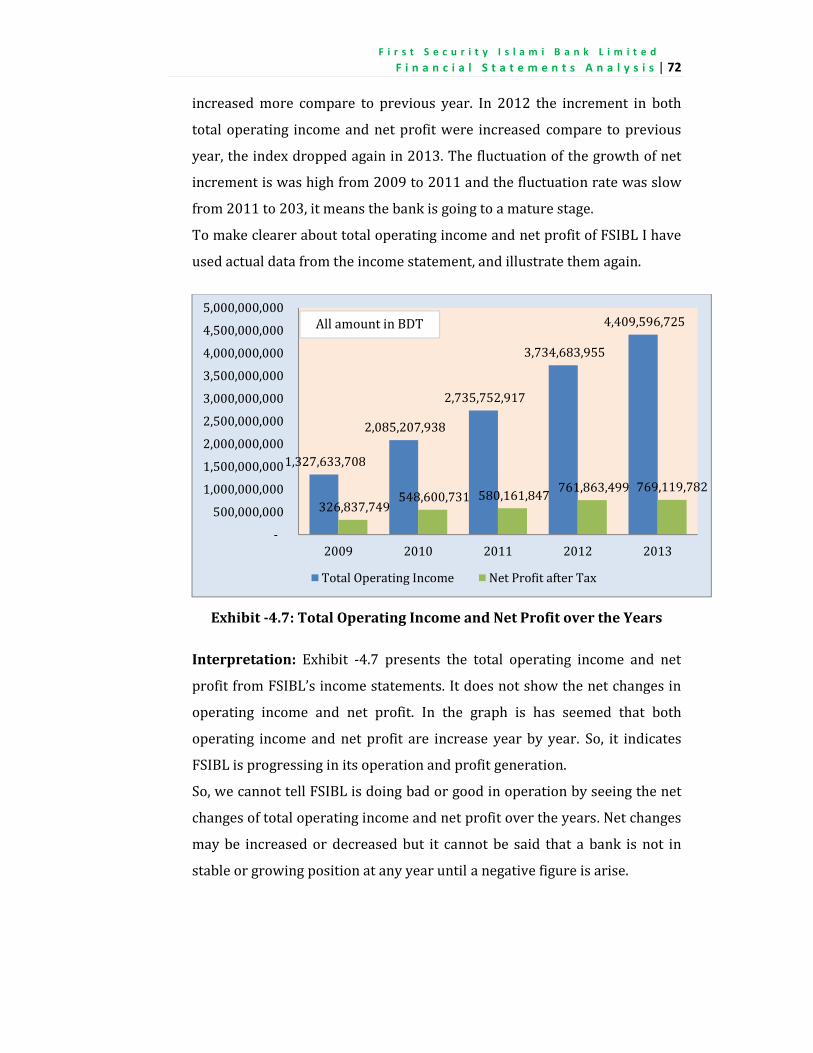
F i r s t S e c u r i t y I s l a m i B a n k L i m i t e d . . .
F i n a n c i a l S t a t e m e n t s A n a l y s i s | 72increased more compare to previous year. In 2012 the increment in bothtotal operating income and net profit were increased compare to previousyear, the index dropped again in 2013. The fluctuation of the growth of netincrement is was high from 2009 to 2011 and the fluctuation rate was slowfrom 2011 to 203, it means the bank is going to a mature stage.To make clearer about total operating income and net profit of FSIBL I haveused actual data from the income statement, and illustrate them again.
Exhibit -4.7: Total Operating Income and Net Profit over the Years
Interpretation: Exhibit -4.7 presents the total operating income and netprofit from FSIBL’s income statements. It does not show the net changes inoperating income and net profit. In the graph is has seemed that bothoperating income and net profit are increase year by year. So, it indicatesFSIBL is progressing in its operation and profit generation.So, we cannot tell FSIBL is doing bad or good in operation by seeing the netchanges of total operating income and net profit over the years. Net changesmay be increased or decreased but it cannot be said that a bank is not instable or growing position at any year until a negative figure is arise.
1,327,633,7082,085,207,9382,735,752,9173,734,683,9554,409,596,725
326,837,749 548,600,731 580,161,847 761,863,499 769,119,782 - 500,000,000 1,000,000,000 1,500,000,000 2,000,000,000 2,500,000,000 3,000,000,000 3,500,000,000 4,000,000,000 4,500,000,000 5,000,000,000
2009 2010 2011 2012 2013Total Operating Income Net Profit after Tax
All amount in BDT

F i r s t S e c u r i t y I s l a m i B a n k L i m i t e d . . .
F i n a n c i a l S t a t e m e n t s A n a l y s i s | 73
4.3.3: Trend AnalysisTrend analysis is a form of horizontal analysis. In involves computing trendpercent for a series of financial numbers and is a variation on the use ofpercentage changes. In trend analysis, base period refers only onesuccessive period, not the previous period of analysis period. Trend analysisis generally used for income statements analysis. Following formula is usedfor trend analysis: (%) = ×Here I have analyzed the trend of FSIBL’s income and expenses. So I haveused the bank’s income statements. I have used 2008 as base period (year)for the following five years. Exhibit -4.8 is used for trend analysis.
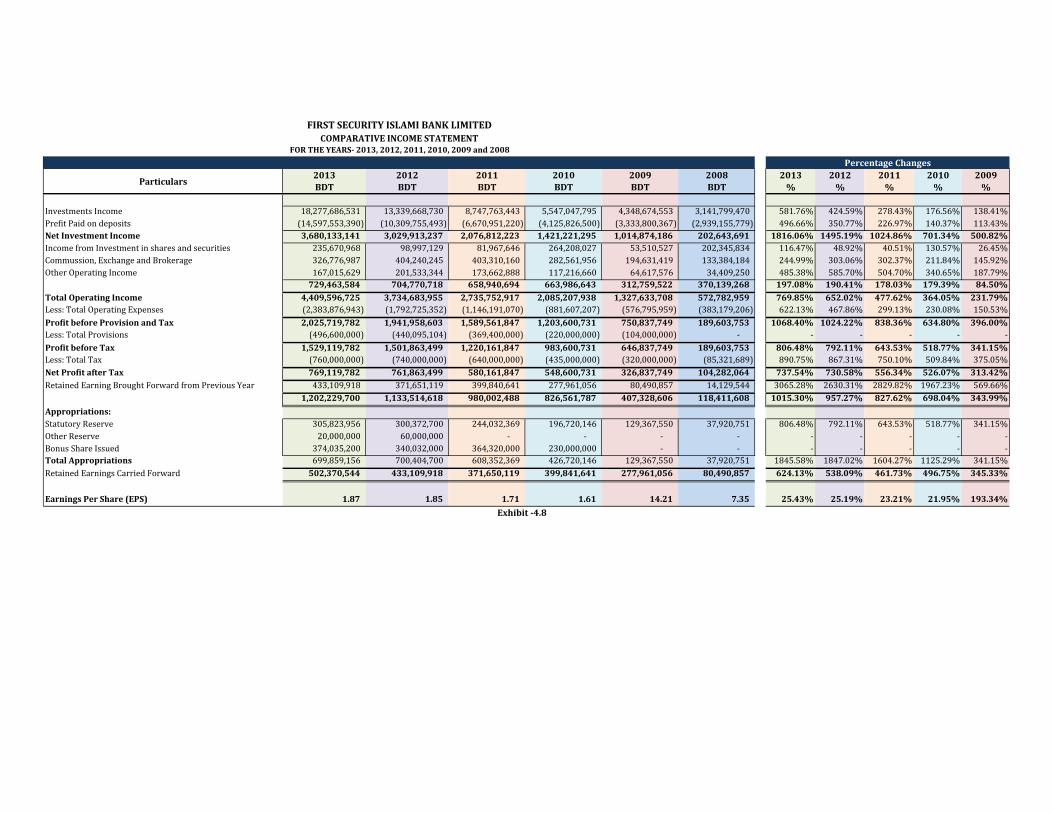
2013 2012 2011 2010 2009 2008 2013 2012 2011 2010 2009BDT BDT BDT BDT BDT BDT % % % % %Investments Income 18,277,686,531 13,339,668,730 8,747,763,443 5,547,047,795 4,348,674,553 3,141,799,470 581.76% 424.59% 278.43% 176.56% 138.41%Prefit Paid on deposits (14,597,553,390) (10,309,755,493) (6,670,951,220) (4,125,826,500) (3,333,800,367) (2,939,155,779) 496.66% 350.77% 226.97% 140.37% 113.43%
Net Investment Income 3,680,133,141 3,029,913,237 2,076,812,223 1,421,221,295 1,014,874,186 202,643,691 1816.06% 1495.19% 1024.86% 701.34% 500.82%Income from Investment in shares and securities 235,670,968 98,997,129 81,967,646 264,208,027 53,510,527 202,345,834 116.47% 48.92% 40.51% 130.57% 26.45%Commussion, Exchange and Brokerage 326,776,987 404,240,245 403,310,160 282,561,956 194,631,419 133,384,184 244.99% 303.06% 302.37% 211.84% 145.92%Other Operating Income 167,015,629 201,533,344 173,662,888 117,216,660 64,617,576 34,409,250 485.38% 585.70% 504.70% 340.65% 187.79%729,463,584 704,770,718 658,940,694 663,986,643 312,759,522 370,139,268 197.08% 190.41% 178.03% 179.39% 84.50%
Total Operating Income 4,409,596,725 3,734,683,955 2,735,752,917 2,085,207,938 1,327,633,708 572,782,959 769.85% 652.02% 477.62% 364.05% 231.79%Less: Total Operating Expenses (2,383,876,943) (1,792,725,352) (1,146,191,070) (881,607,207) (576,795,959) (383,179,206) 622.13% 467.86% 299.13% 230.08% 150.53%Profit before Provision and Tax 2,025,719,782 1,941,958,603 1,589,561,847 1,203,600,731 750,837,749 189,603,753 1068.40% 1024.22% 838.36% 634.80% 396.00%Less: Total Provisions (496,600,000) (440,095,104) (369,400,000) (220,000,000) (104,000,000) - - - - - -Profit before Tax 1,529,119,782 1,501,863,499 1,220,161,847 983,600,731 646,837,749 189,603,753 806.48% 792.11% 643.53% 518.77% 341.15%Less: Total Tax (760,000,000) (740,000,000) (640,000,000) (435,000,000) (320,000,000) (85,321,689) 890.75% 867.31% 750.10% 509.84% 375.05%Net Profit after Tax 769,119,782 761,863,499 580,161,847 548,600,731 326,837,749 104,282,064 737.54% 730.58% 556.34% 526.07% 313.42%Retained Earning Brought Forward from Previous Year 433,109,918 371,651,119 399,840,641 277,961,056 80,490,857 14,129,544 3065.28% 2630.31% 2829.82% 1967.23% 569.66%
1,202,229,700 1,133,514,618 980,002,488 826,561,787 407,328,606 118,411,608 1015.30% 957.27% 827.62% 698.04% 343.99%Appropriations:Statutory Reserve 305,823,956 300,372,700 244,032,369 196,720,146 129,367,550 37,920,751 806.48% 792.11% 643.53% 518.77% 341.15%Other Reserve 20,000,000 60,000,000 - - - - - - - - -Bonus Share Issued 374,035,200 340,032,000 364,320,000 230,000,000 - - - - - - -Total Appropriations 699,859,156 700,404,700 608,352,369 426,720,146 129,367,550 37,920,751 1845.58% 1847.02% 1604.27% 1125.29% 341.15%Retained Earnings Carried Forward 502,370,544 433,109,918 371,650,119 399,841,641 277,961,056 80,490,857 624.13% 538.09% 461.73% 496.75% 345.33%
Earnings Per Share (EPS) 1.87 1.85 1.71 1.61 14.21 7.35 25.43% 25.19% 23.21% 21.95% 193.34%
Percentage Changes
Exhibit -4.8
FIRST SECURITY ISLAMI BANK LIMITEDCOMPARATIVE INCOME STATEMENT
FOR THE YEARS- 2013, 2012, 2011, 2010, 2009 and 2008
Particulars
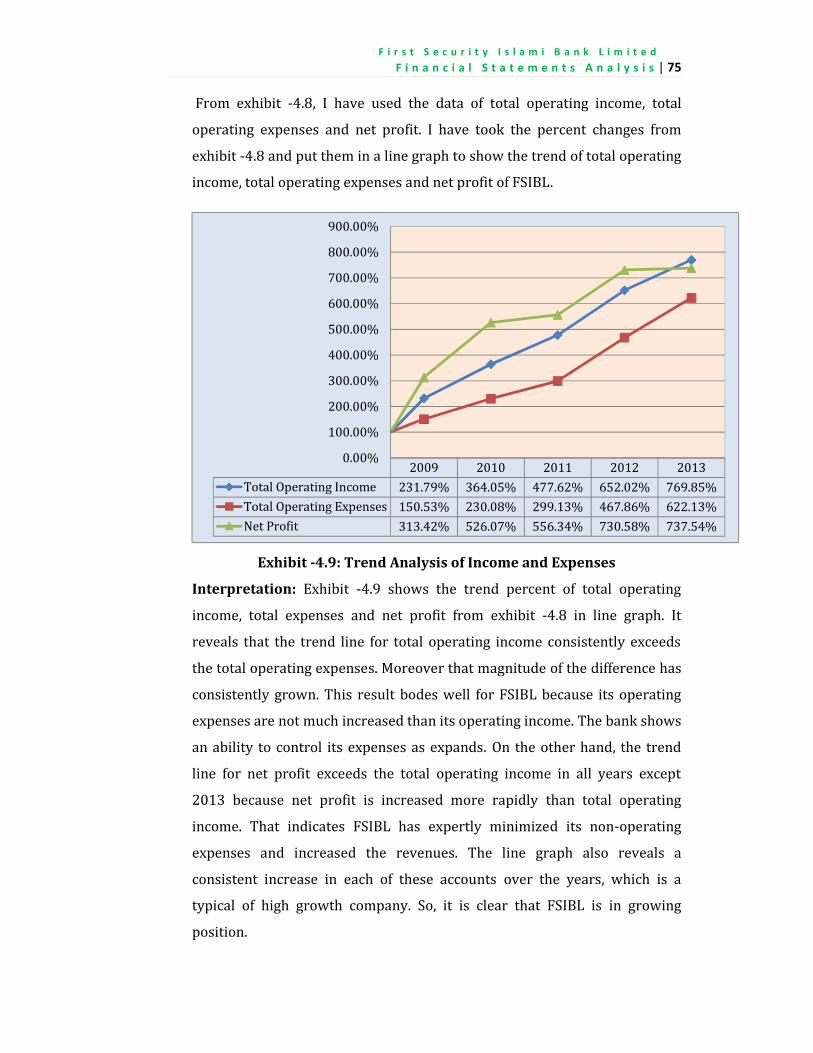
F i r s t S e c u r i t y I s l a m i B a n k L i m i t e d . . .
F i n a n c i a l S t a t e m e n t s A n a l y s i s | 75From exhibit -4.8, I have used the data of total operating income, totaloperating expenses and net profit. I have took the percent changes fromexhibit -4.8 and put them in a line graph to show the trend of total operatingincome, total operating expenses and net profit of FSIBL.
Exhibit -4.9: Trend Analysis of Income and Expenses
Interpretation: Exhibit -4.9 shows the trend percent of total operatingincome, total expenses and net profit from exhibit -4.8 in line graph. Itreveals that the trend line for total operating income consistently exceedsthe total operating expenses. Moreover that magnitude of the difference hasconsistently grown. This result bodes well for FSIBL because its operatingexpenses are not much increased than its operating income. The bank showsan ability to control its expenses as expands. On the other hand, the trendline for net profit exceeds the total operating income in all years except2013 because net profit is increased more rapidly than total operatingincome. That indicates FSIBL has expertly minimized its non-operatingexpenses and increased the revenues. The line graph also reveals aconsistent increase in each of these accounts over the years, which is atypical of high growth company. So, it is clear that FSIBL is in growingposition.
2009 2010 2011 2012 2013Total Operating Income 231.79% 364.05% 477.62% 652.02% 769.85%Total Operating Expenses 150.53% 230.08% 299.13% 467.86% 622.13%Net Profit 313.42% 526.07% 556.34% 730.58% 737.54%0.00%100.00%200.00%300.00%400.00%500.00%600.00%700.00%800.00%900.00%
F i r s t S e c u r i t y I s l a m i B a n k L i m i t e d . . .
F i n a n c i a l S t a t e m e n t s A n a l y s i s | 76
4.4: Vertical AnalysisVertical analysis is a tool to evaluate individual financial statement items ora group of items on term of specific based amount. We usually define a keyaggregate figure as the base, which for a bank’s income statement is totalincome or revenue income and for a balance sheet is usually total assets.Vertical analysis is required common-size statements. So, for verticalanalysis of FSIBL’s financial statements I have prepared its common-sizeincome statements and common-size balance sheets for five years. Thecommon-size statements of FSIBL are prepared by using the followingformula.- (%) = ×
I use common-size statements of FSIBL to reveal the changes in the relativeimportance of each financial statement items. All individual amounts incommon-size statements are redefined in terms of common-sizepercentages. The common-size balance sheets and income statements areshown comparatively from 2009 to 2013 in exhibit -4.10 and exhibit -4.11accordingly.
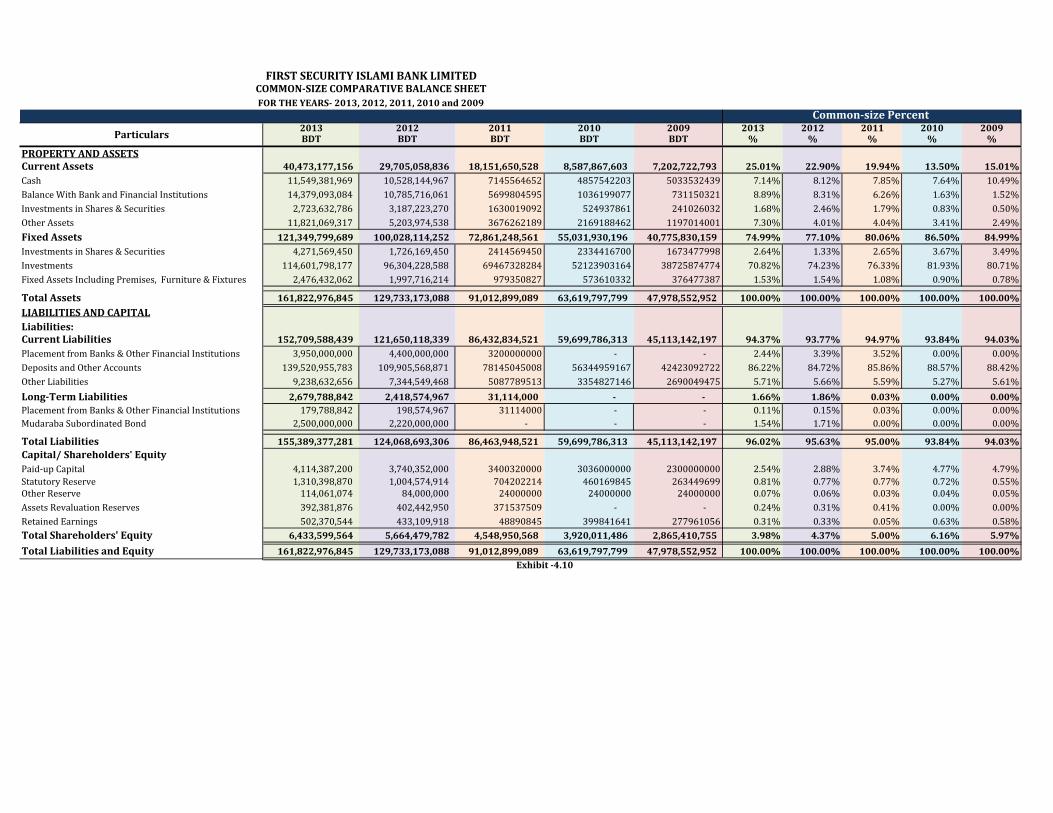
2013 2012 2011 2010 2009 2013 2012 2011 2010 2009BDT BDT BDT BDT BDT % % % % %
PROPERTY AND ASSETSCurrent Assets 40,473,177,156 29,705,058,836 18,151,650,528 8,587,867,603 7,202,722,793 25.01% 22.90% 19.94% 13.50% 15.01%Cash 11,549,381,969 10,528,144,967 7145564652 4857542203 5033532439 7.14% 8.12% 7.85% 7.64% 10.49%Balance With Bank and Financial Institutions 14,379,093,084 10,785,716,061 5699804595 1036199077 731150321 8.89% 8.31% 6.26% 1.63% 1.52%Investments in Shares & Securities 2,723,632,786 3,187,223,270 1630019092 524937861 241026032 1.68% 2.46% 1.79% 0.83% 0.50%Other Assets 11,821,069,317 5,203,974,538 3676262189 2169188462 1197014001 7.30% 4.01% 4.04% 3.41% 2.49%Fixed Assets 121,349,799,689 100,028,114,252 72,861,248,561 55,031,930,196 40,775,830,159 74.99% 77.10% 80.06% 86.50% 84.99%Investments in Shares & Securities 4,271,569,450 1,726,169,450 2414569450 2334416700 1673477998 2.64% 1.33% 2.65% 3.67% 3.49%Investments 114,601,798,177 96,304,228,588 69467328284 52123903164 38725874774 70.82% 74.23% 76.33% 81.93% 80.71%Fixed Assets Including Premises, Furniture & Fixtures 2,476,432,062 1,997,716,214 979350827 573610332 376477387 1.53% 1.54% 1.08% 0.90% 0.78%Total Assets 161,822,976,845 129,733,173,088 91,012,899,089 63,619,797,799 47,978,552,952 100.00% 100.00% 100.00% 100.00% 100.00%LIABILITIES AND CAPITALLiabilities:Current Liabilities 152,709,588,439 121,650,118,339 86,432,834,521 59,699,786,313 45,113,142,197 94.37% 93.77% 94.97% 93.84% 94.03%Placement from Banks & Other Financial Institutions 3,950,000,000 4,400,000,000 3200000000 - - 2.44% 3.39% 3.52% 0.00% 0.00%Deposits and Other Accounts 139,520,955,783 109,905,568,871 78145045008 56344959167 42423092722 86.22% 84.72% 85.86% 88.57% 88.42%Other Liabilities 9,238,632,656 7,344,549,468 5087789513 3354827146 2690049475 5.71% 5.66% 5.59% 5.27% 5.61%Long-Term Liabilities 2,679,788,842 2,418,574,967 31,114,000 - - 1.66% 1.86% 0.03% 0.00% 0.00%Placement from Banks & Other Financial Institutions 179,788,842 198,574,967 31114000 - - 0.11% 0.15% 0.03% 0.00% 0.00%Mudaraba Subordinated Bond 2,500,000,000 2,220,000,000 - - - 1.54% 1.71% 0.00% 0.00% 0.00%Total Liabilities 155,389,377,281 124,068,693,306 86,463,948,521 59,699,786,313 45,113,142,197 96.02% 95.63% 95.00% 93.84% 94.03%Capital/ Shareholders' EquityPaid-up Capital 4,114,387,200 3,740,352,000 3400320000 3036000000 2300000000 2.54% 2.88% 3.74% 4.77% 4.79%Statutory Reserve 1,310,398,870 1,004,574,914 704202214 460169845 263449699 0.81% 0.77% 0.77% 0.72% 0.55%Other Reserve 114,061,074 84,000,000 24000000 24000000 24000000 0.07% 0.06% 0.03% 0.04% 0.05%Assets Revaluation Reserves 392,381,876 402,442,950 371537509 - - 0.24% 0.31% 0.41% 0.00% 0.00%Retained Earnings 502,370,544 433,109,918 48890845 399841641 277961056 0.31% 0.33% 0.05% 0.63% 0.58%Total Shareholders' Equity 6,433,599,564 5,664,479,782 4,548,950,568 3,920,011,486 2,865,410,755 3.98% 4.37% 5.00% 6.16% 5.97%Total Liabilities and Equity 161,822,976,845 129,733,173,088 91,012,899,089 63,619,797,799 47,978,552,952 100.00% 100.00% 100.00% 100.00% 100.00%
Exhibit -4.10
Common-size Percent
FIRST SECURITY ISLAMI BANK LIMITEDCOMMON-SIZE COMPARATIVE BALANCE SHEETFOR THE YEARS- 2013, 2012, 2011, 2010 and 2009
Particulars
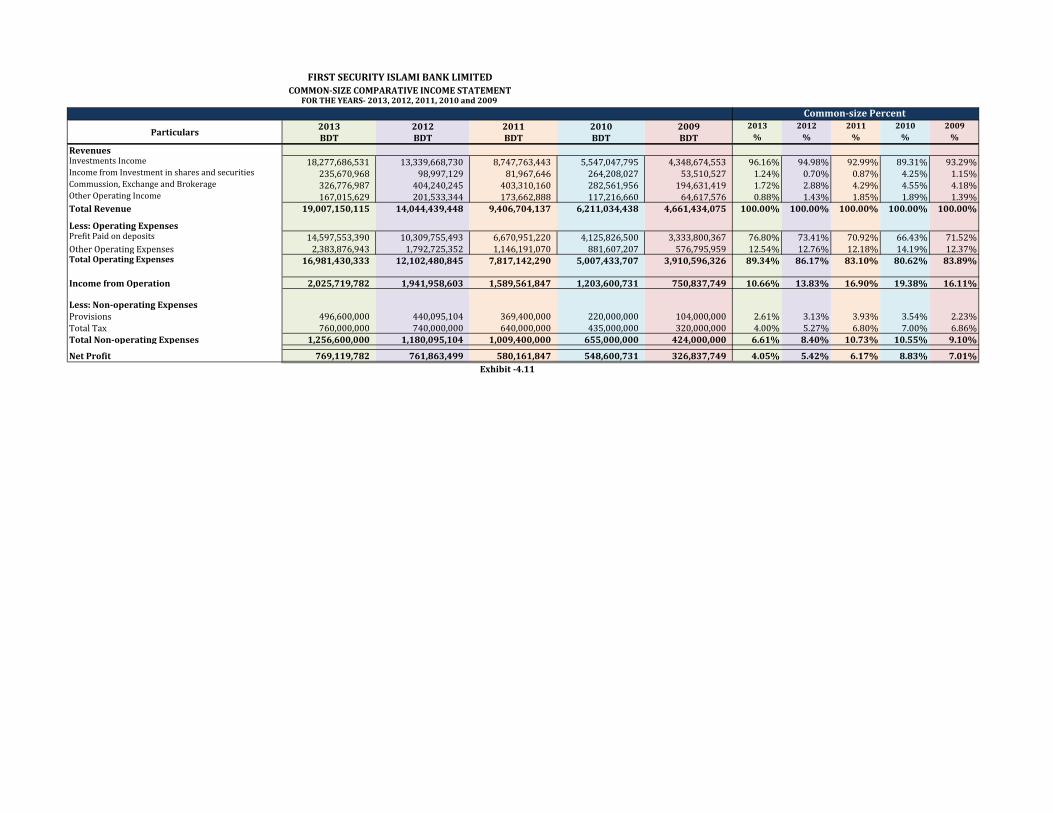
2013 2012 2011 2010 2009 2013 2012 2011 2010 2009BDT BDT BDT BDT BDT % % % % %
RevenuesInvestments Income 18,277,686,531 13,339,668,730 8,747,763,443 5,547,047,795 4,348,674,553 96.16% 94.98% 92.99% 89.31% 93.29%Income from Investment in shares and securities 235,670,968 98,997,129 81,967,646 264,208,027 53,510,527 1.24% 0.70% 0.87% 4.25% 1.15%Commussion, Exchange and Brokerage 326,776,987 404,240,245 403,310,160 282,561,956 194,631,419 1.72% 2.88% 4.29% 4.55% 4.18%Other Operating Income 167,015,629 201,533,344 173,662,888 117,216,660 64,617,576 0.88% 1.43% 1.85% 1.89% 1.39%Total Revenue 19,007,150,115 14,044,439,448 9,406,704,137 6,211,034,438 4,661,434,075 100.00% 100.00% 100.00% 100.00% 100.00%
Less: Operating ExpensesPrefit Paid on deposits 14,597,553,390 10,309,755,493 6,670,951,220 4,125,826,500 3,333,800,367 76.80% 73.41% 70.92% 66.43% 71.52%Other Operating Expenses 2,383,876,943 1,792,725,352 1,146,191,070 881,607,207 576,795,959 12.54% 12.76% 12.18% 14.19% 12.37%Total Operating Expenses 16,981,430,333 12,102,480,845 7,817,142,290 5,007,433,707 3,910,596,326 89.34% 86.17% 83.10% 80.62% 83.89%
Income from Operation 2,025,719,782 1,941,958,603 1,589,561,847 1,203,600,731 750,837,749 10.66% 13.83% 16.90% 19.38% 16.11%
Less: Non-operating ExpensesProvisions 496,600,000 440,095,104 369,400,000 220,000,000 104,000,000 2.61% 3.13% 3.93% 3.54% 2.23%Total Tax 760,000,000 740,000,000 640,000,000 435,000,000 320,000,000 4.00% 5.27% 6.80% 7.00% 6.86%Total Non-operating Expenses 1,256,600,000 1,180,095,104 1,009,400,000 655,000,000 424,000,000 6.61% 8.40% 10.73% 10.55% 9.10%
Net Profit 769,119,782 761,863,499 580,161,847 548,600,731 326,837,749 4.05% 5.42% 6.17% 8.83% 7.01%
Common-size Percent
Exhibit -4.11
FIRST SECURITY ISLAMI BANK LIMITEDCOMMON-SIZE COMPARATIVE INCOME STATEMENT
FOR THE YEARS- 2013, 2012, 2011, 2010 and 2009
Particulars
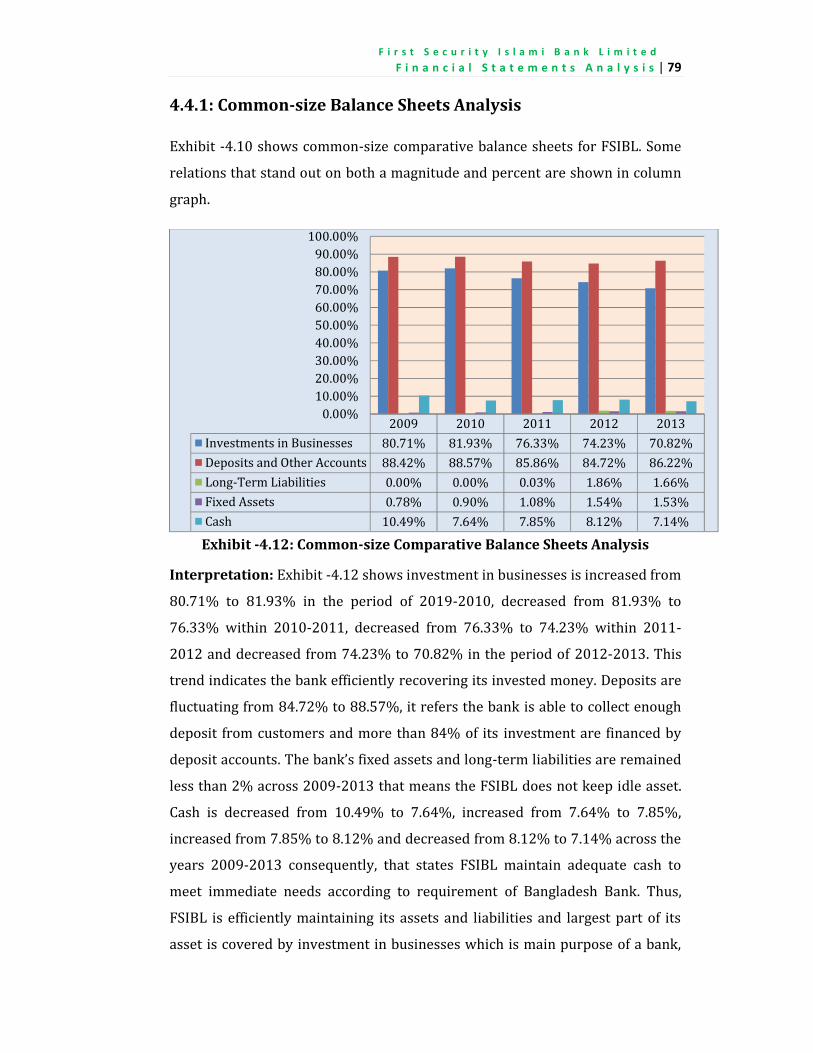
F i r s t S e c u r i t y I s l a m i B a n k L i m i t e d . . .
F i n a n c i a l S t a t e m e n t s A n a l y s i s | 79
4.4.1: Common-size Balance Sheets AnalysisExhibit -4.10 shows common-size comparative balance sheets for FSIBL. Somerelations that stand out on both a magnitude and percent are shown in columngraph.
Exhibit -4.12: Common-size Comparative Balance Sheets Analysis
Interpretation: Exhibit -4.12 shows investment in businesses is increased from80.71% to 81.93% in the period of 2019-2010, decreased from 81.93% to76.33% within 2010-2011, decreased from 76.33% to 74.23% within 2011-2012 and decreased from 74.23% to 70.82% in the period of 2012-2013. Thistrend indicates the bank efficiently recovering its invested money. Deposits arefluctuating from 84.72% to 88.57%, it refers the bank is able to collect enoughdeposit from customers and more than 84% of its investment are financed bydeposit accounts. The bank’s fixed assets and long-term liabilities are remainedless than 2% across 2009-2013 that means the FSIBL does not keep idle asset.Cash is decreased from 10.49% to 7.64%, increased from 7.64% to 7.85%,increased from 7.85% to 8.12% and decreased from 8.12% to 7.14% across theyears 2009-2013 consequently, that states FSIBL maintain adequate cash tomeet immediate needs according to requirement of Bangladesh Bank. Thus,FSIBL is efficiently maintaining its assets and liabilities and largest part of itsasset is covered by investment in businesses which is main purpose of a bank,
2009 2010 2011 2012 2013Investments in Businesses 80.71% 81.93% 76.33% 74.23% 70.82%Deposits and Other Accounts 88.42% 88.57% 85.86% 84.72% 86.22%Long-Term Liabilities 0.00% 0.00% 0.03% 1.86% 1.66%Fixed Assets 0.78% 0.90% 1.08% 1.54% 1.53%Cash 10.49% 7.64% 7.85% 8.12% 7.14%
0.00%10.00%20.00%30.00%40.00%50.00%60.00%70.00%80.00%90.00%100.00%
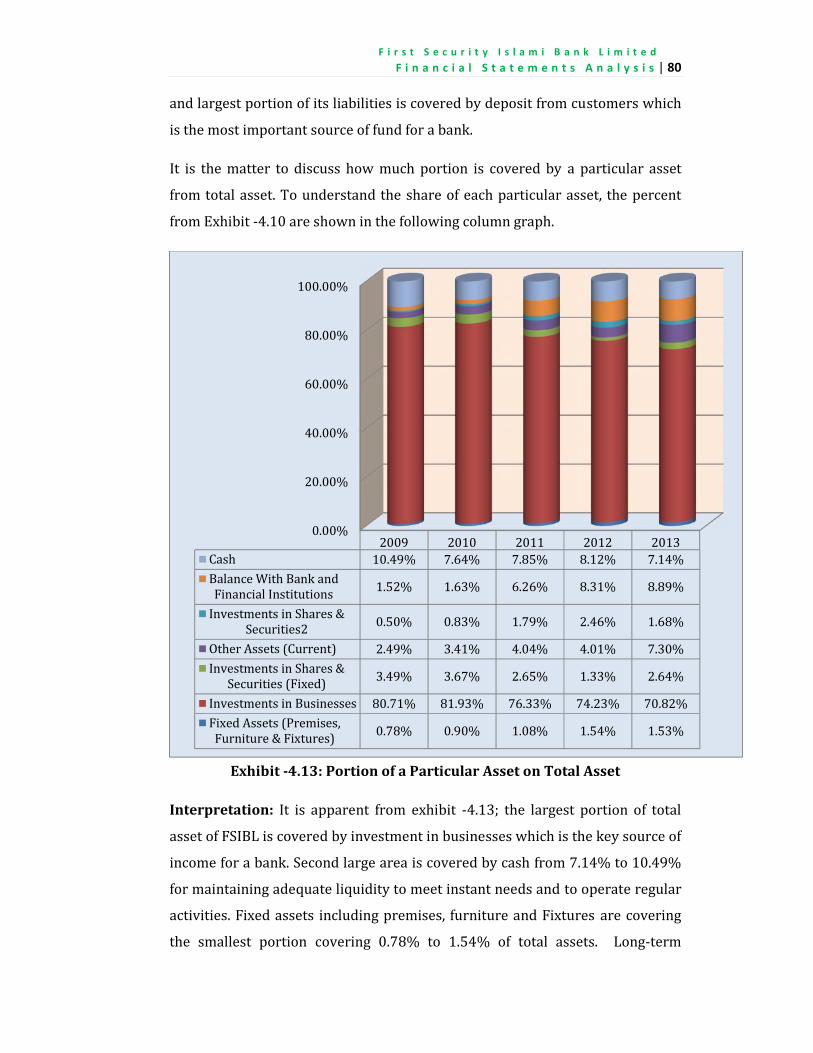
F i r s t S e c u r i t y I s l a m i B a n k L i m i t e d . . .
F i n a n c i a l S t a t e m e n t s A n a l y s i s | 80and largest portion of its liabilities is covered by deposit from customers whichis the most important source of fund for a bank.It is the matter to discuss how much portion is covered by a particular assetfrom total asset. To understand the share of each particular asset, the percentfrom Exhibit -4.10 are shown in the following column graph.
Exhibit -4.13: Portion of a Particular Asset on Total Asset
Interpretation: It is apparent from exhibit -4.13; the largest portion of totalasset of FSIBL is covered by investment in businesses which is the key source ofincome for a bank. Second large area is covered by cash from 7.14% to 10.49%for maintaining adequate liquidity to meet instant needs and to operate regularactivities. Fixed assets including premises, furniture and Fixtures are coveringthe smallest portion covering 0.78% to 1.54% of total assets. Long-term
0.00%20.00%40.00%60.00%80.00%
100.00%
2009 2010 2011 2012 2013Cash 10.49% 7.64% 7.85% 8.12% 7.14%Balance With Bank andFinancial Institutions 1.52% 1.63% 6.26% 8.31% 8.89%Investments in Shares &Securities2 0.50% 0.83% 1.79% 2.46% 1.68%Other Assets (Current) 2.49% 3.41% 4.04% 4.01% 7.30%Investments in Shares &Securities (Fixed) 3.49% 3.67% 2.65% 1.33% 2.64%Investments in Businesses 80.71% 81.93% 76.33% 74.23% 70.82%Fixed Assets (Premises,Furniture & Fixtures) 0.78% 0.90% 1.08% 1.54% 1.53%
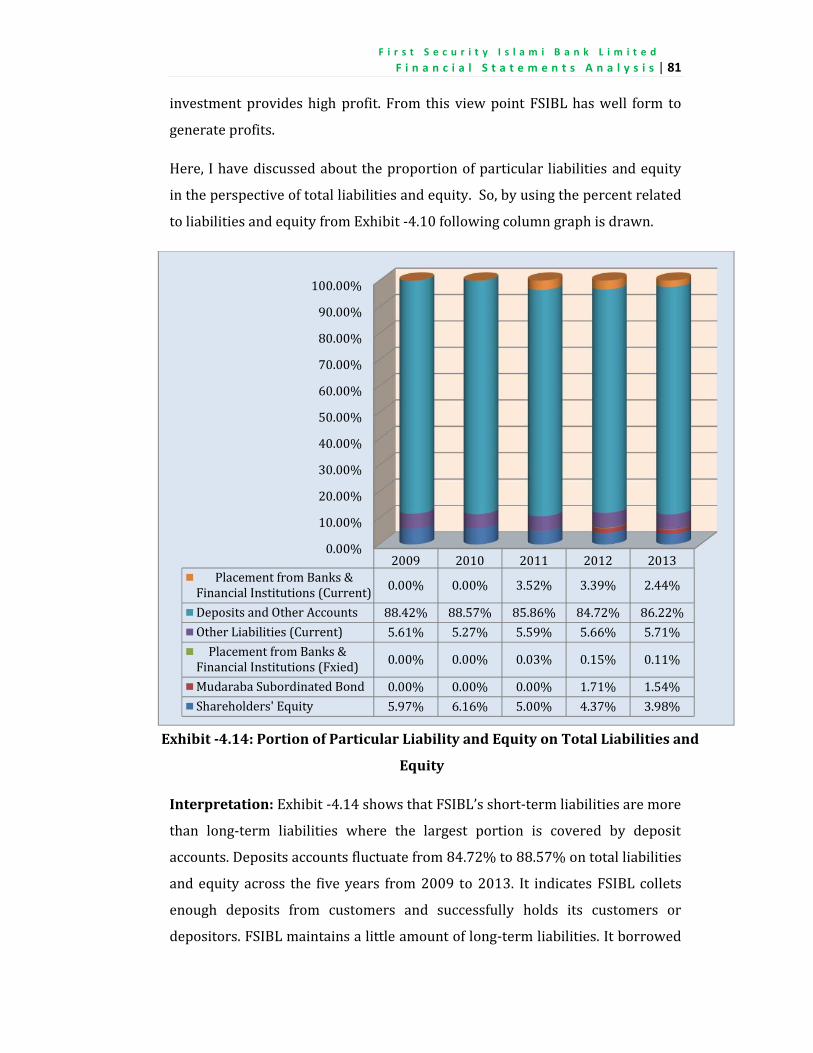
F i r s t S e c u r i t y I s l a m i B a n k L i m i t e d . . .
F i n a n c i a l S t a t e m e n t s A n a l y s i s | 81investment provides high profit. From this view point FSIBL has well form togenerate profits.Here, I have discussed about the proportion of particular liabilities and equityin the perspective of total liabilities and equity. So, by using the percent relatedto liabilities and equity from Exhibit -4.10 following column graph is drawn.
Exhibit -4.14: Portion of Particular Liability and Equity on Total Liabilities and
Equity
Interpretation: Exhibit -4.14 shows that FSIBL’s short-term liabilities are morethan long-term liabilities where the largest portion is covered by depositaccounts. Deposits accounts fluctuate from 84.72% to 88.57% on total liabilitiesand equity across the five years from 2009 to 2013. It indicates FSIBL colletsenough deposits from customers and successfully holds its customers ordepositors. FSIBL maintains a little amount of long-term liabilities. It borrowed
0.00%10.00%20.00%30.00%40.00%50.00%60.00%70.00%80.00%90.00%100.00%
2009 2010 2011 2012 2013Placement from Banks &Financial Institutions (Current) 0.00% 0.00% 3.52% 3.39% 2.44%Deposits and Other Accounts 88.42% 88.57% 85.86% 84.72% 86.22%Other Liabilities (Current) 5.61% 5.27% 5.59% 5.66% 5.71%Placement from Banks &Financial Institutions (Fxied) 0.00% 0.00% 0.03% 0.15% 0.11%Mudaraba Subordinated Bond 0.00% 0.00% 0.00% 1.71% 1.54%Shareholders' Equity 5.97% 6.16% 5.00% 4.37% 3.98%
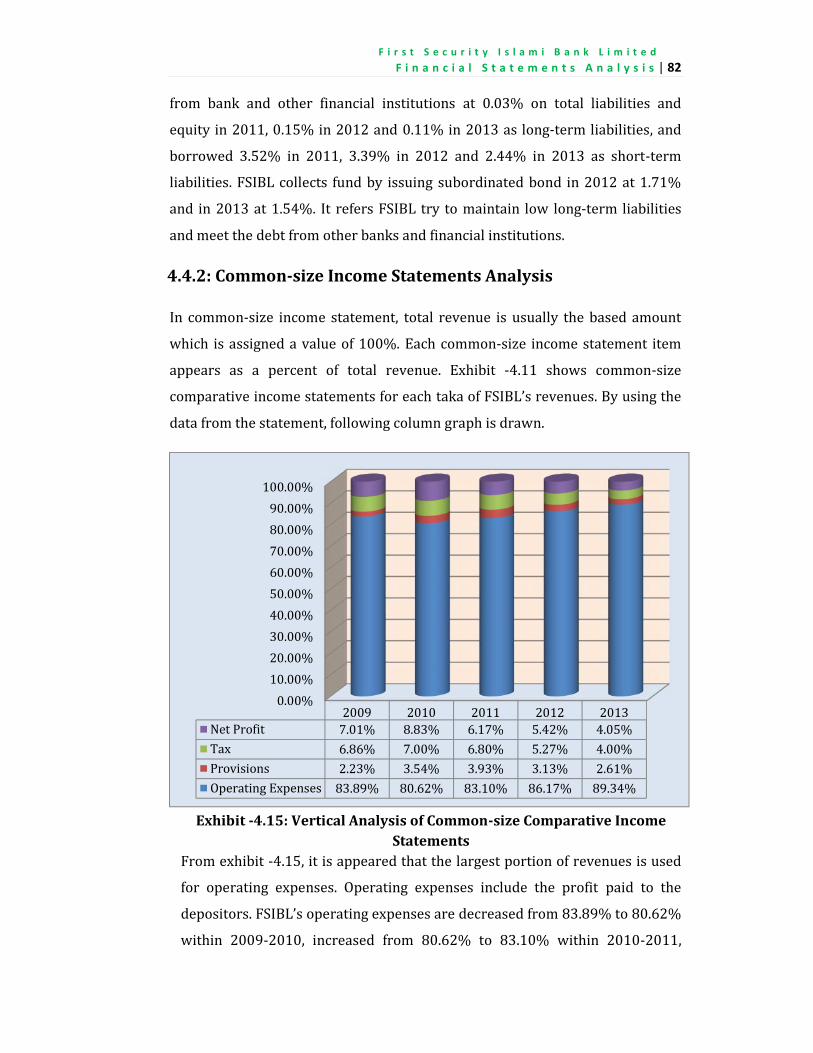
F i r s t S e c u r i t y I s l a m i B a n k L i m i t e d . . .
F i n a n c i a l S t a t e m e n t s A n a l y s i s | 82from bank and other financial institutions at 0.03% on total liabilities andequity in 2011, 0.15% in 2012 and 0.11% in 2013 as long-term liabilities, andborrowed 3.52% in 2011, 3.39% in 2012 and 2.44% in 2013 as short-termliabilities. FSIBL collects fund by issuing subordinated bond in 2012 at 1.71%and in 2013 at 1.54%. It refers FSIBL try to maintain low long-term liabilitiesand meet the debt from other banks and financial institutions.4.4.2: Common-size Income Statements AnalysisIn common-size income statement, total revenue is usually the based amountwhich is assigned a value of 100%. Each common-size income statement itemappears as a percent of total revenue. Exhibit -4.11 shows common-sizecomparative income statements for each taka of FSIBL’s revenues. By using thedata from the statement, following column graph is drawn.
Exhibit -4.15: Vertical Analysis of Common-size Comparative IncomeStatementsFrom exhibit -4.15, it is appeared that the largest portion of revenues is usedfor operating expenses. Operating expenses include the profit paid to thedepositors. FSIBL’s operating expenses are decreased from 83.89% to 80.62%within 2009-2010, increased from 80.62% to 83.10% within 2010-2011,
0.00%10.00%20.00%30.00%40.00%50.00%60.00%70.00%80.00%90.00%100.00%
2009 2010 2011 2012 2013Net Profit 7.01% 8.83% 6.17% 5.42% 4.05%Tax 6.86% 7.00% 6.80% 5.27% 4.00%Provisions 2.23% 3.54% 3.93% 3.13% 2.61%Operating Expenses 83.89% 80.62% 83.10% 86.17% 89.34%
F i r s t S e c u r i t y I s l a m i B a n k L i m i t e d . . .
F i n a n c i a l S t a t e m e n t s A n a l y s i s | 83increased from 83.10% to 86.17% within 2011-2012 and increased from86.17% to 89.34% within 2012-2013. It is revealed that from 2010 FSIBL’soperating expenses are increasing year by year. On the other hand, its netprofit starts to decrease from 2010. So, FSIBL should control the operatingcosts excluding the depositors’ profits. Thus, the bank should properly applythe green banking and make maximum utilization of technology andresources to control the operating cost and for increase the net profit.4.5: Ratio AnalysisRatio analysis is a study of the relationships between financial variables. It isused to evaluate various aspects of a company’s operating and financialperformance such as its efficiency, liquidity, profitability and solvency. Thetrend of these ratios over time is studied to check whether they are improvingor deteriorating. Ratios can be expressed as a percent, rate or proportion. Theratio analysis is an essential technique for financial statements analysis.Different users such as investors, management, bankers and creditors use theratio to analyze the financial situation of a company for their decision makingpurpose. Here, this report contains the most common ratios and analyze toevaluate the operating and financial performance of First Security Islami BankLimited (FSIBL) over the years 2009, 2010, 2011, 2012 and 2013.
4.5.1: Liquidity and Efficiency RatioAs First Security Islami Bank Limited is a financial institution the liquidityratios and the efficiency ratios are the most important ratios to evaluate itsliquidity to pay its short-term debt and deposits, and efficiency of the bank touse its assets and manage its operations to quickly convert its assets into cash.These ratios show how quick FSIBL is able to convert its assets into cash.Here, the current ratio, acid-test ratio, accounts receivable turnover ratio anddays’ sales uncollectable ratio are shown below respectively for knowing theliquidity and efficiency of First Security Islami Bank Limited.
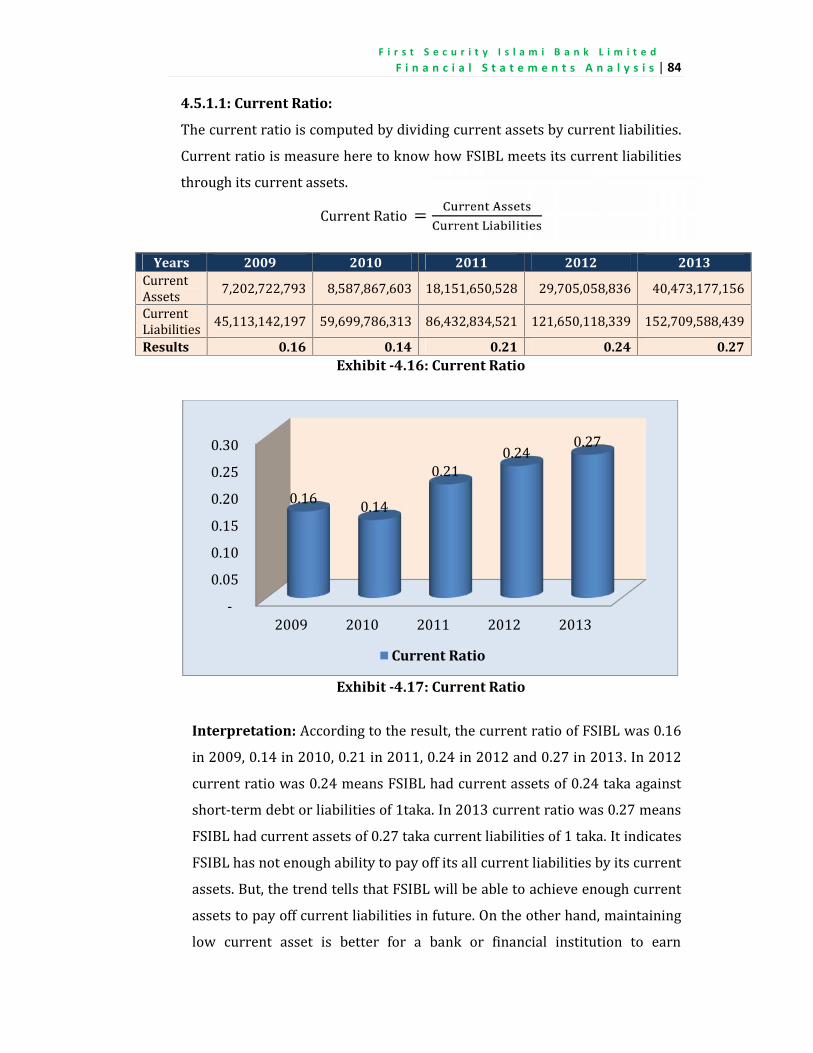
F i r s t S e c u r i t y I s l a m i B a n k L i m i t e d . . .
F i n a n c i a l S t a t e m e n t s A n a l y s i s | 84
4.5.1.1: Current Ratio:The current ratio is computed by dividing current assets by current liabilities.Current ratio is measure here to know how FSIBL meets its current liabilitiesthrough its current assets.Current Ratio =Years 2009 2010 2011 2012 2013CurrentAssets 7,202,722,793 8,587,867,603 18,151,650,528 29,705,058,836 40,473,177,156CurrentLiabilities 45,113,142,197 59,699,786,313 86,432,834,521 121,650,118,339 152,709,588,439
Results 0.16 0.14 0.21 0.24 0.27Exhibit -4.16: Current Ratio
Exhibit -4.17: Current Ratio
Interpretation: According to the result, the current ratio of FSIBL was 0.16in 2009, 0.14 in 2010, 0.21 in 2011, 0.24 in 2012 and 0.27 in 2013. In 2012current ratio was 0.24 means FSIBL had current assets of 0.24 taka againstshort-term debt or liabilities of 1taka. In 2013 current ratio was 0.27 meansFSIBL had current assets of 0.27 taka current liabilities of 1 taka. It indicatesFSIBL has not enough ability to pay off its all current liabilities by its currentassets. But, the trend tells that FSIBL will be able to achieve enough currentassets to pay off current liabilities in future. On the other hand, maintaininglow current asset is better for a bank or financial institution to earn
- 0.05 0.10 0.15 0.20 0.25 0.30
2009 2010 2011 2012 2013
0.16 0.14 0.21 0.24 0.27
Current Ratio
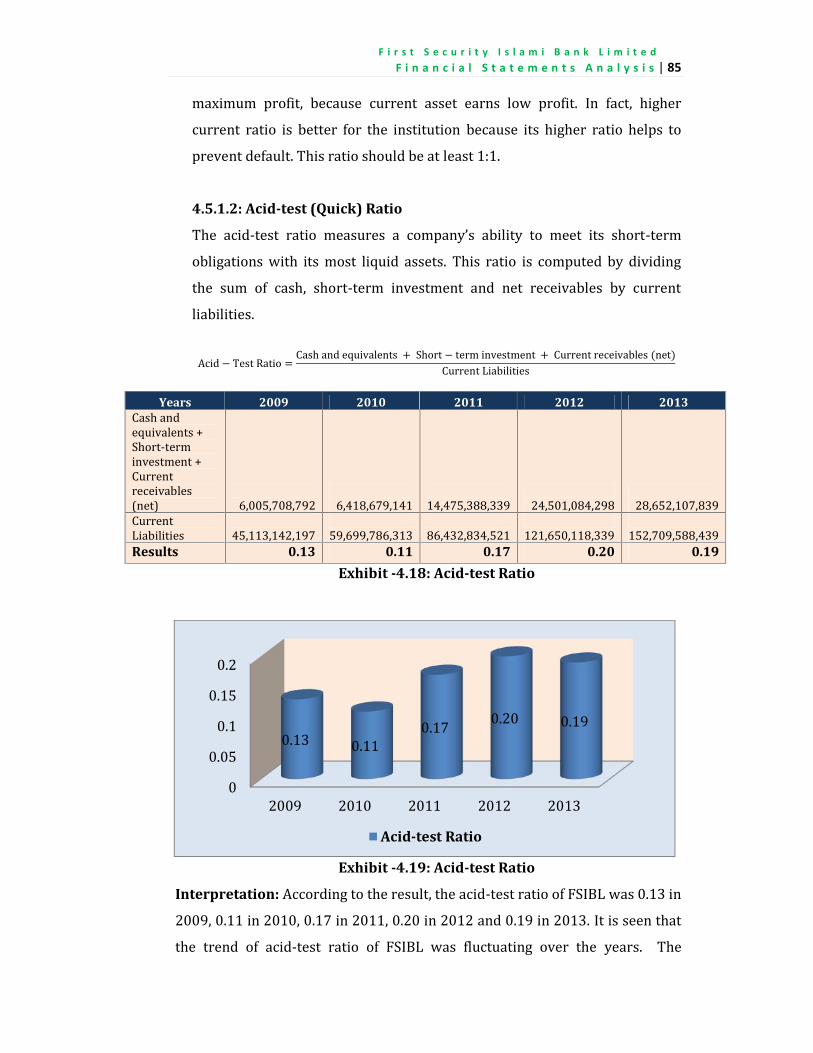
F i r s t S e c u r i t y I s l a m i B a n k L i m i t e d . . .
F i n a n c i a l S t a t e m e n t s A n a l y s i s | 85maximum profit, because current asset earns low profit. In fact, highercurrent ratio is better for the institution because its higher ratio helps toprevent default. This ratio should be at least 1:1.4.5.1.2: Acid-test (Quick) RatioThe acid-test ratio measures a company’s ability to meet its short-termobligations with its most liquid assets. This ratio is computed by dividingthe sum of cash, short-term investment and net receivables by currentliabilities.Acid − Test Ratio = Cash and equivalents + Short − term investment + Current receivables (net)Current Liabilities
Exhibit -4.18: Acid-test Ratio
Exhibit -4.19: Acid-test Ratio
Interpretation: According to the result, the acid-test ratio of FSIBL was 0.13 in2009, 0.11 in 2010, 0.17 in 2011, 0.20 in 2012 and 0.19 in 2013. It is seen thatthe trend of acid-test ratio of FSIBL was fluctuating over the years. The
00.050.10.150.2
2009 2010 2011 2012 20130.13 0.11 0.17 0.20 0.19
Acid-test Ratio
Years 2009 2010 2011 2012 2013Cash andequivalents +Short-terminvestment +Currentreceivables(net) 6,005,708,792 6,418,679,141 14,475,388,339 24,501,084,298 28,652,107,839CurrentLiabilities 45,113,142,197 59,699,786,313 86,432,834,521 121,650,118,339 152,709,588,439Results 0.13 0.11 0.17 0.20 0.19
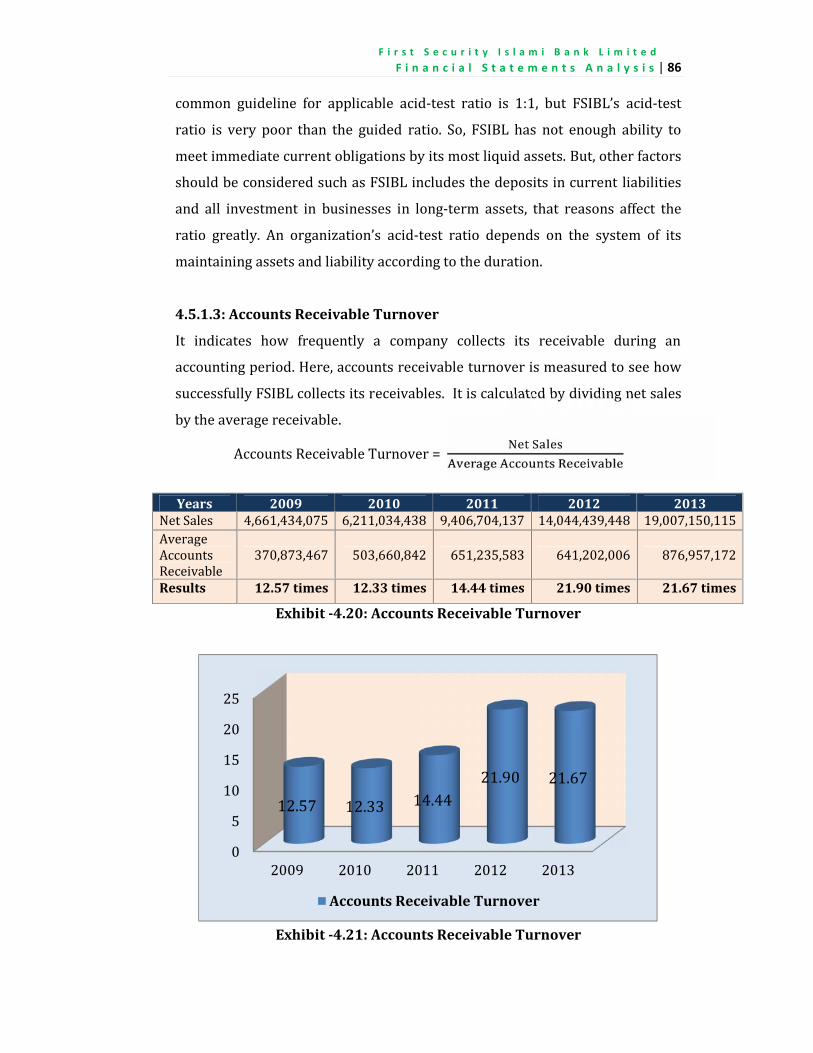
F i r s t S e c u r i t y I s l a m i B a n k L i m i t e d . . .
F i n a n c i a l S t a t e m e n t s A n a l y s i s | 86common guideline for applicable acid-test ratio is 1:1, but FSIBL’s acid-testratio is very poor than the guided ratio. So, FSIBL has not enough ability tomeet immediate current obligations by its most liquid assets. But, other factorsshould be considered such as FSIBL includes the deposits in current liabilitiesand all investment in businesses in long-term assets, that reasons affect theratio greatly. An organization’s acid-test ratio depends on the system of itsmaintaining assets and liability according to the duration.4.5.1.3: Accounts Receivable TurnoverIt indicates how frequently a company collects its receivable during anaccounting period. Here, accounts receivable turnover is measured to see howsuccessfully FSIBL collects its receivables. It is calculated by dividing net salesby the average receivable.Accounts Receivable Turnover =Years 2009 2010 2011 2012 2013Net Sales 4,661,434,075 6,211,034,438 9,406,704,137 14,044,439,448 19,007,150,115AverageAccountsReceivable 370,873,467 503,660,842 651,235,583 641,202,006 876,957,172
Results 12.57 times 12.33 times 14.44 times 21.90 times 21.67 times
Exhibit -4.20: Accounts Receivable Turnover
Exhibit -4.21: Accounts Receivable Turnover
0510152025
2009 2010 2011 2012 201312.57 12.33 14.44 21.90 21.67
Accounts Receivable Turnover
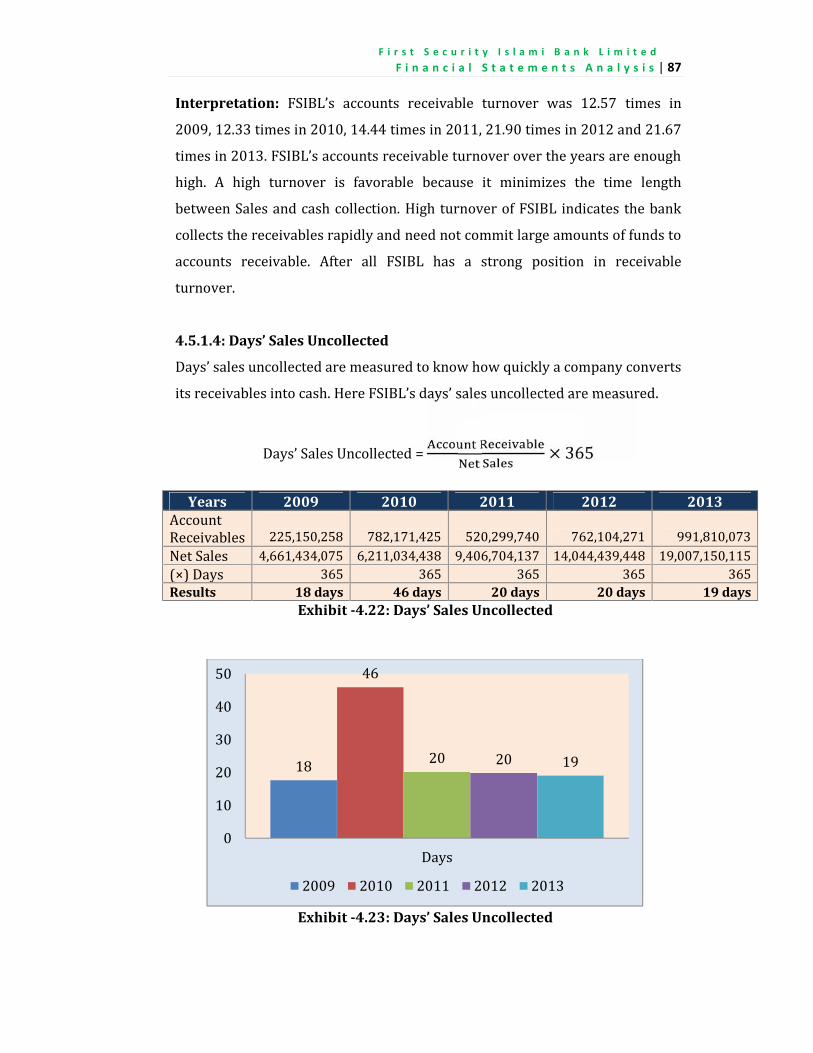
F i r s t S e c u r i t y I s l a m i B a n k L i m i t e d . . .
F i n a n c i a l S t a t e m e n t s A n a l y s i s | 87
Interpretation: FSIBL’s accounts receivable turnover was 12.57 times in2009, 12.33 times in 2010, 14.44 times in 2011, 21.90 times in 2012 and 21.67times in 2013. FSIBL’s accounts receivable turnover over the years are enoughhigh. A high turnover is favorable because it minimizes the time lengthbetween Sales and cash collection. High turnover of FSIBL indicates the bankcollects the receivables rapidly and need not commit large amounts of funds toaccounts receivable. After all FSIBL has a strong position in receivableturnover.4.5.1.4: Days’ Sales UncollectedDays’ sales uncollected are measured to know how quickly a company convertsits receivables into cash. Here FSIBL’s days’ sales uncollected are measured.
Days’ Sales Uncollected = × 365Years 2009 2010 2011 2012 2013AccountReceivables 225,150,258 782,171,425 520,299,740 762,104,271 991,810,073Net Sales 4,661,434,075 6,211,034,438 9,406,704,137 14,044,439,448 19,007,150,115(×) Days 365 365 365 365 365
Results 18 days 46 days 20 days 20 days 19 daysExhibit -4.22: Days’ Sales Uncollected
Exhibit -4.23: Days’ Sales Uncollected
1846
20 20 1901020304050
Days2009 2010 2011 2012 2013
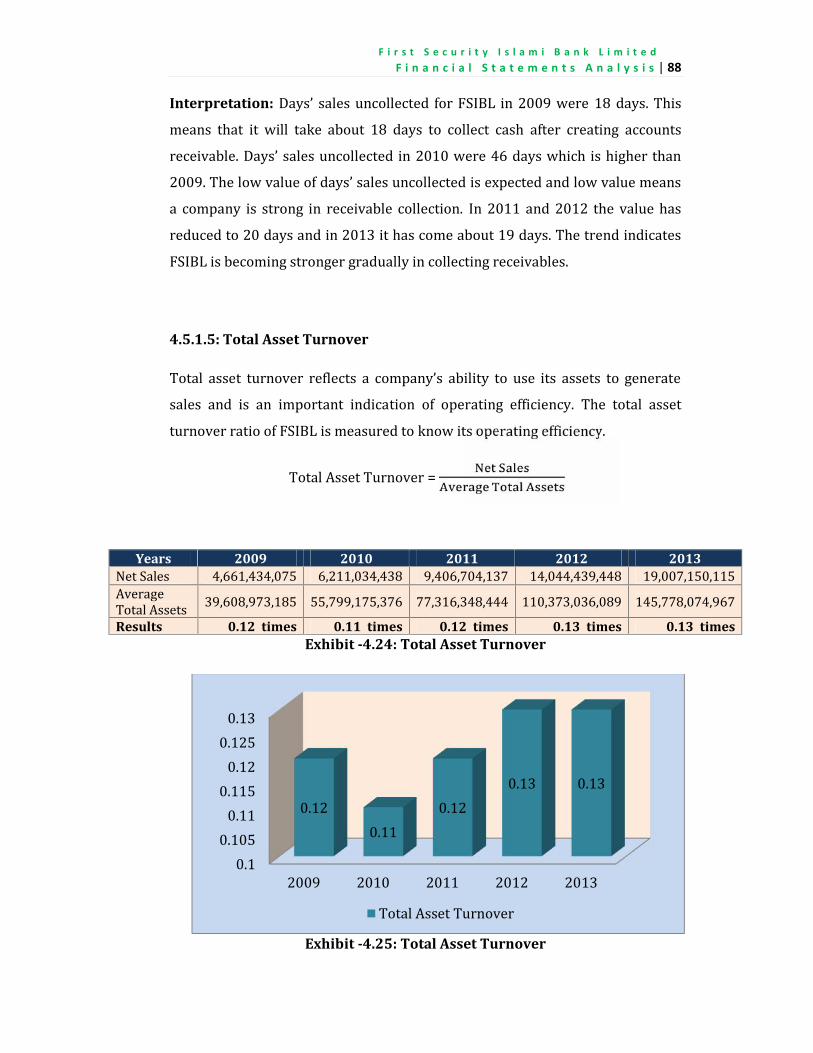
F i r s t S e c u r i t y I s l a m i B a n k L i m i t e d . . .
F i n a n c i a l S t a t e m e n t s A n a l y s i s | 88
Interpretation: Days’ sales uncollected for FSIBL in 2009 were 18 days. Thismeans that it will take about 18 days to collect cash after creating accountsreceivable. Days’ sales uncollected in 2010 were 46 days which is higher than2009. The low value of days’ sales uncollected is expected and low value meansa company is strong in receivable collection. In 2011 and 2012 the value hasreduced to 20 days and in 2013 it has come about 19 days. The trend indicatesFSIBL is becoming stronger gradually in collecting receivables.4.5.1.5: Total Asset TurnoverTotal asset turnover reflects a company’s ability to use its assets to generatesales and is an important indication of operating efficiency. The total assetturnover ratio of FSIBL is measured to know its operating efficiency.
Total Asset Turnover =
Exhibit -4.24: Total Asset Turnover
Exhibit -4.25: Total Asset Turnover
0.10.1050.110.1150.120.1250.13
2009 2010 2011 2012 20130.12 0.11 0.12 0.13 0.13
Total Asset Turnover
Years 2009 2010 2011 2012 2013Net Sales 4,661,434,075 6,211,034,438 9,406,704,137 14,044,439,448 19,007,150,115AverageTotal Assets 39,608,973,185 55,799,175,376 77,316,348,444 110,373,036,089 145,778,074,967Results 0.12 times 0.11 times 0.12 times 0.13 times 0.13 times
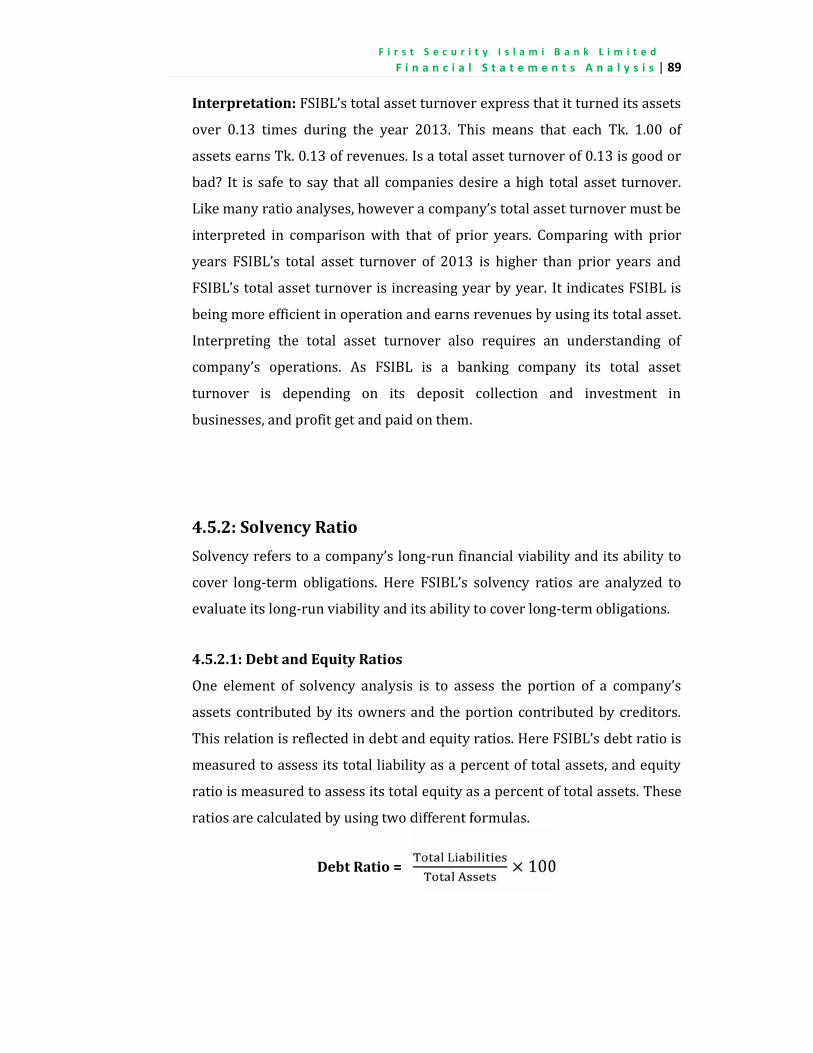
F i r s t S e c u r i t y I s l a m i B a n k L i m i t e d . . .
F i n a n c i a l S t a t e m e n t s A n a l y s i s | 89
Interpretation: FSIBL’s total asset turnover express that it turned its assetsover 0.13 times during the year 2013. This means that each Tk. 1.00 ofassets earns Tk. 0.13 of revenues. Is a total asset turnover of 0.13 is good orbad? It is safe to say that all companies desire a high total asset turnover.Like many ratio analyses, however a company’s total asset turnover must beinterpreted in comparison with that of prior years. Comparing with prioryears FSIBL’s total asset turnover of 2013 is higher than prior years andFSIBL’s total asset turnover is increasing year by year. It indicates FSIBL isbeing more efficient in operation and earns revenues by using its total asset.Interpreting the total asset turnover also requires an understanding ofcompany’s operations. As FSIBL is a banking company its total assetturnover is depending on its deposit collection and investment inbusinesses, and profit get and paid on them.
4.5.2: Solvency RatioSolvency refers to a company’s long-run financial viability and its ability tocover long-term obligations. Here FSIBL’s solvency ratios are analyzed toevaluate its long-run viability and its ability to cover long-term obligations.4.5.2.1: Debt and Equity RatiosOne element of solvency analysis is to assess the portion of a company’sassets contributed by its owners and the portion contributed by creditors.This relation is reflected in debt and equity ratios. Here FSIBL’s debt ratio ismeasured to assess its total liability as a percent of total assets, and equityratio is measured to assess its total equity as a percent of total assets. Theseratios are calculated by using two different formulas.
Debt Ratio = × 100
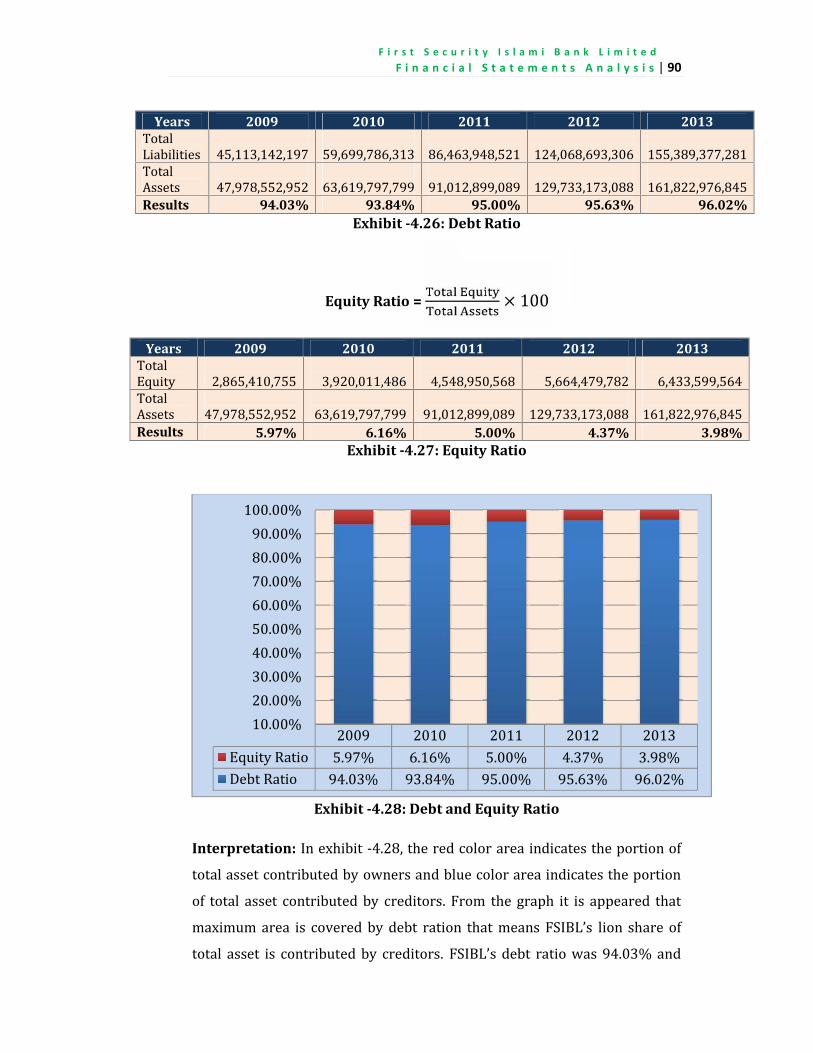
F i r s t S e c u r i t y I s l a m i B a n k L i m i t e d . . .
F i n a n c i a l S t a t e m e n t s A n a l y s i s | 90
Years 2009 2010 2011 2012 2013TotalLiabilities 45,113,142,197 59,699,786,313 86,463,948,521 124,068,693,306 155,389,377,281TotalAssets 47,978,552,952 63,619,797,799 91,012,899,089 129,733,173,088 161,822,976,845Results 94.03% 93.84% 95.00% 95.63% 96.02%
Exhibit -4.26: Debt Ratio
Equity Ratio = × 100Years 2009 2010 2011 2012 2013TotalEquity 2,865,410,755 3,920,011,486 4,548,950,568 5,664,479,782 6,433,599,564TotalAssets 47,978,552,952 63,619,797,799 91,012,899,089 129,733,173,088 161,822,976,845
Results 5.97% 6.16% 5.00% 4.37% 3.98%Exhibit -4.27: Equity Ratio
Exhibit -4.28: Debt and Equity Ratio
Interpretation: In exhibit -4.28, the red color area indicates the portion oftotal asset contributed by owners and blue color area indicates the portionof total asset contributed by creditors. From the graph it is appeared thatmaximum area is covered by debt ration that means FSIBL’s lion share oftotal asset is contributed by creditors. FSIBL’s debt ratio was 94.03% and
2009 2010 2011 2012 2013Equity Ratio 5.97% 6.16% 5.00% 4.37% 3.98%Debt Ratio 94.03% 93.84% 95.00% 95.63% 96.02%10.00%20.00%30.00%40.00%50.00%60.00%70.00%80.00%90.00%100.00%
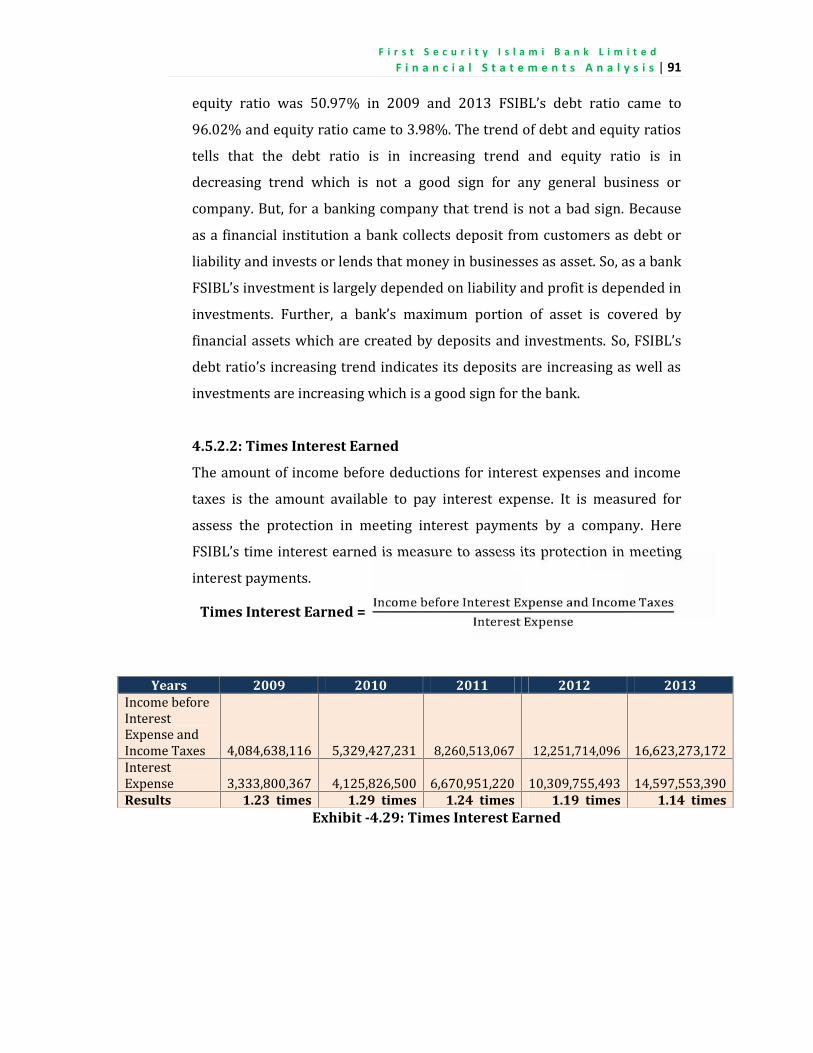
F i r s t S e c u r i t y I s l a m i B a n k L i m i t e d . . .
F i n a n c i a l S t a t e m e n t s A n a l y s i s | 91equity ratio was 50.97% in 2009 and 2013 FSIBL’s debt ratio came to96.02% and equity ratio came to 3.98%. The trend of debt and equity ratiostells that the debt ratio is in increasing trend and equity ratio is indecreasing trend which is not a good sign for any general business orcompany. But, for a banking company that trend is not a bad sign. Becauseas a financial institution a bank collects deposit from customers as debt orliability and invests or lends that money in businesses as asset. So, as a bankFSIBL’s investment is largely depended on liability and profit is depended ininvestments. Further, a bank’s maximum portion of asset is covered byfinancial assets which are created by deposits and investments. So, FSIBL’sdebt ratio’s increasing trend indicates its deposits are increasing as well asinvestments are increasing which is a good sign for the bank.4.5.2.2: Times Interest EarnedThe amount of income before deductions for interest expenses and incometaxes is the amount available to pay interest expense. It is measured forassess the protection in meeting interest payments by a company. HereFSIBL’s time interest earned is measure to assess its protection in meetinginterest payments.
Times Interest Earned =
Exhibit -4.29: Times Interest Earned
Years 2009 2010 2011 2012 2013Income beforeInterestExpense andIncome Taxes 4,084,638,116 5,329,427,231 8,260,513,067 12,251,714,096 16,623,273,172InterestExpense 3,333,800,367 4,125,826,500 6,670,951,220 10,309,755,493 14,597,553,390Results 1.23 times 1.29 times 1.24 times 1.19 times 1.14 times
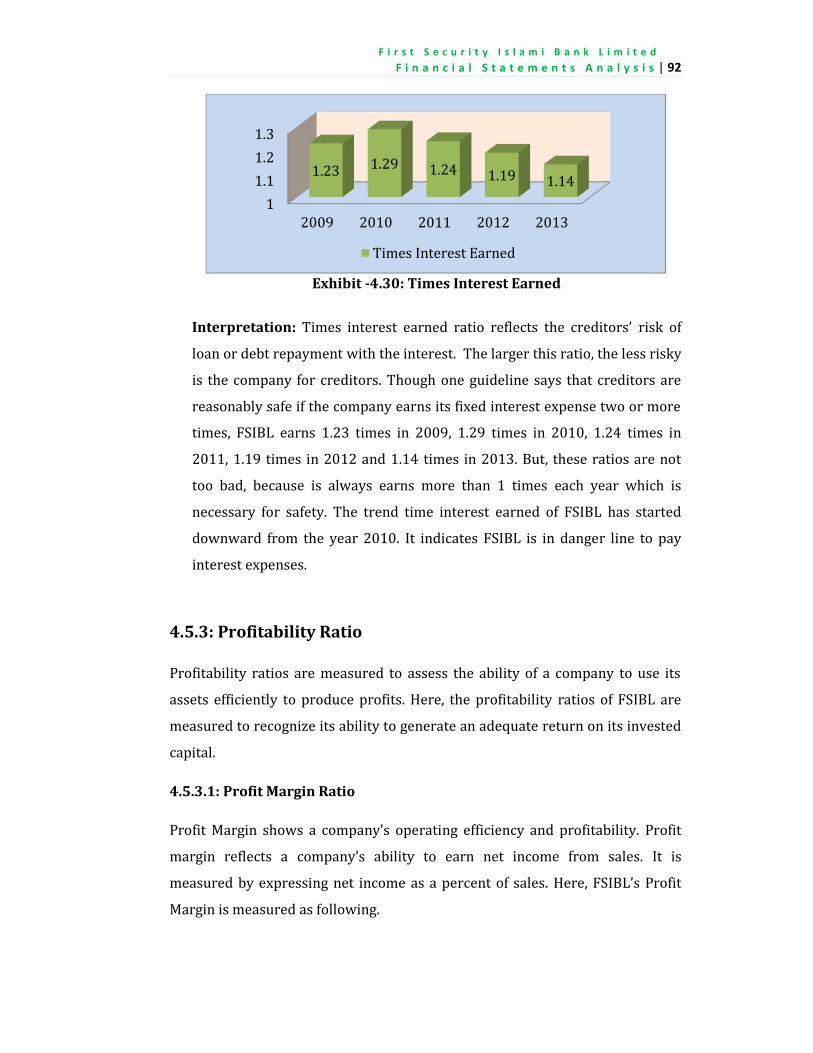
F i r s t S e c u r i t y I s l a m i B a n k L i m i t e d . . .
F i n a n c i a l S t a t e m e n t s A n a l y s i s | 92
Exhibit -4.30: Times Interest Earned
Interpretation: Times interest earned ratio reflects the creditors’ risk ofloan or debt repayment with the interest. The larger this ratio, the less riskyis the company for creditors. Though one guideline says that creditors arereasonably safe if the company earns its fixed interest expense two or moretimes, FSIBL earns 1.23 times in 2009, 1.29 times in 2010, 1.24 times in2011, 1.19 times in 2012 and 1.14 times in 2013. But, these ratios are nottoo bad, because is always earns more than 1 times each year which isnecessary for safety. The trend time interest earned of FSIBL has starteddownward from the year 2010. It indicates FSIBL is in danger line to payinterest expenses.4.5.3: Profitability RatioProfitability ratios are measured to assess the ability of a company to use itsassets efficiently to produce profits. Here, the profitability ratios of FSIBL aremeasured to recognize its ability to generate an adequate return on its investedcapital.4.5.3.1: Profit Margin RatioProfit Margin shows a company’s operating efficiency and profitability. Profitmargin reflects a company’s ability to earn net income from sales. It ismeasured by expressing net income as a percent of sales. Here, FSIBL’s ProfitMargin is measured as following.
11.11.21.32009 2010 2011 2012 2013
1.23 1.29 1.24 1.19 1.14Times Interest Earned
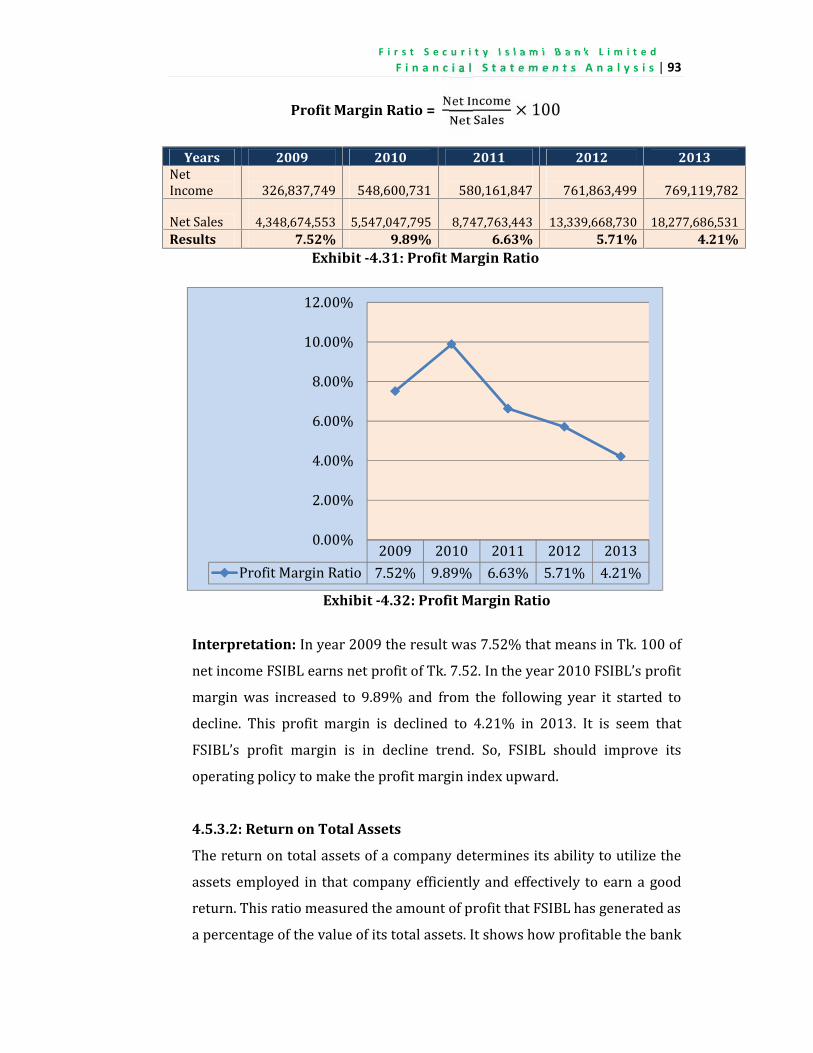
F i r s t S e c u r i t y I s l a m i B a n k L i m i t e d . . .
F i n a n c i a l S t a t e m e n t s A n a l y s i s | 93
Profit Margin Ratio = × 100Years 2009 2010 2011 2012 2013NetIncome 326,837,749 548,600,731 580,161,847 761,863,499 769,119,782Net Sales 4,348,674,553 5,547,047,795 8,747,763,443 13,339,668,730 18,277,686,531
Results 7.52% 9.89% 6.63% 5.71% 4.21%Exhibit -4.31: Profit Margin Ratio
Exhibit -4.32: Profit Margin Ratio
Interpretation: In year 2009 the result was 7.52% that means in Tk. 100 ofnet income FSIBL earns net profit of Tk. 7.52. In the year 2010 FSIBL’s profitmargin was increased to 9.89% and from the following year it started todecline. This profit margin is declined to 4.21% in 2013. It is seem thatFSIBL’s profit margin is in decline trend. So, FSIBL should improve itsoperating policy to make the profit margin index upward.4.5.3.2: Return on Total AssetsThe return on total assets of a company determines its ability to utilize theassets employed in that company efficiently and effectively to earn a goodreturn. This ratio measured the amount of profit that FSIBL has generated asa percentage of the value of its total assets. It shows how profitable the bank
2009 2010 2011 2012 2013Profit Margin Ratio 7.52% 9.89% 6.63% 5.71% 4.21%0.00%2.00%4.00%6.00%8.00%10.00%12.00%
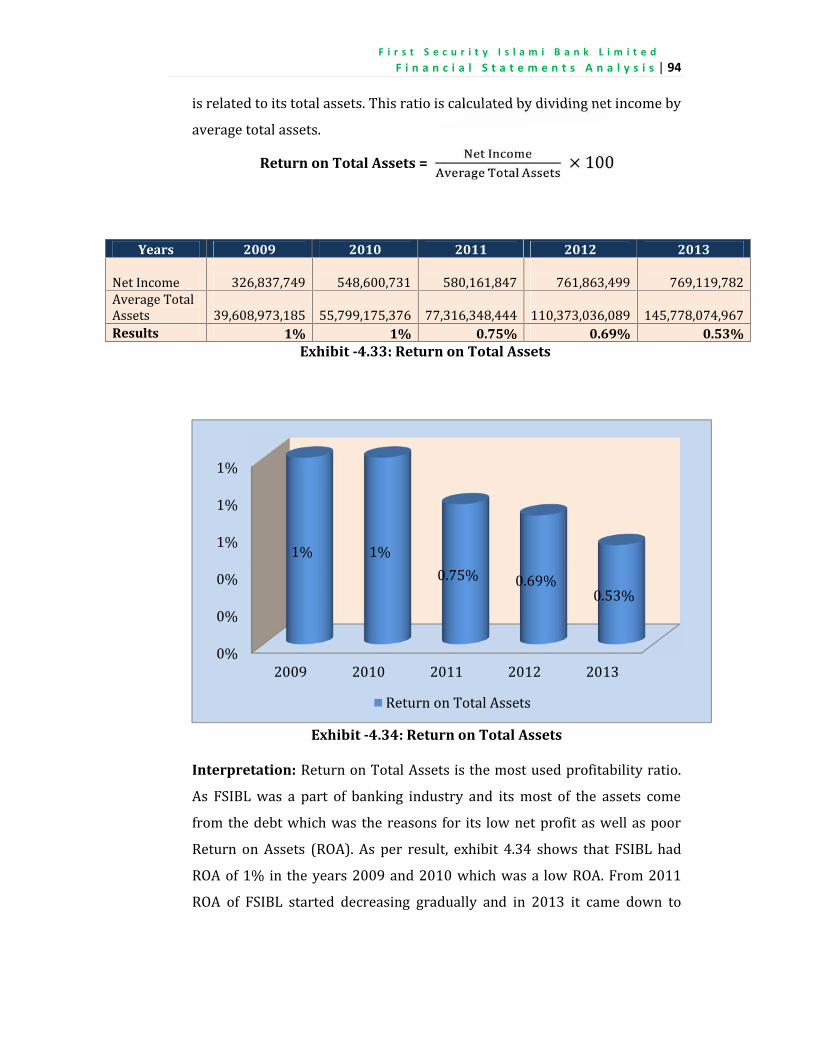
F i r s t S e c u r i t y I s l a m i B a n k L i m i t e d . . .
F i n a n c i a l S t a t e m e n t s A n a l y s i s | 94is related to its total assets. This ratio is calculated by dividing net income byaverage total assets.Return on Total Assets = × 100
Exhibit -4.33: Return on Total Assets
Exhibit -4.34: Return on Total Assets
Interpretation: Return on Total Assets is the most used profitability ratio.As FSIBL was a part of banking industry and its most of the assets comefrom the debt which was the reasons for its low net profit as well as poorReturn on Assets (ROA). As per result, exhibit 4.34 shows that FSIBL hadROA of 1% in the years 2009 and 2010 which was a low ROA. From 2011ROA of FSIBL started decreasing gradually and in 2013 it came down to
0%0%0%1%1%1%
2009 2010 2011 2012 2013
1% 1% 0.75% 0.69% 0.53%
Return on Total Assets
Years 2009 2010 2011 2012 2013Net Income 326,837,749 548,600,731 580,161,847 761,863,499 769,119,782Average TotalAssets 39,608,973,185 55,799,175,376 77,316,348,444 110,373,036,089 145,778,074,967Results 1% 1% 0.75% 0.69% 0.53%
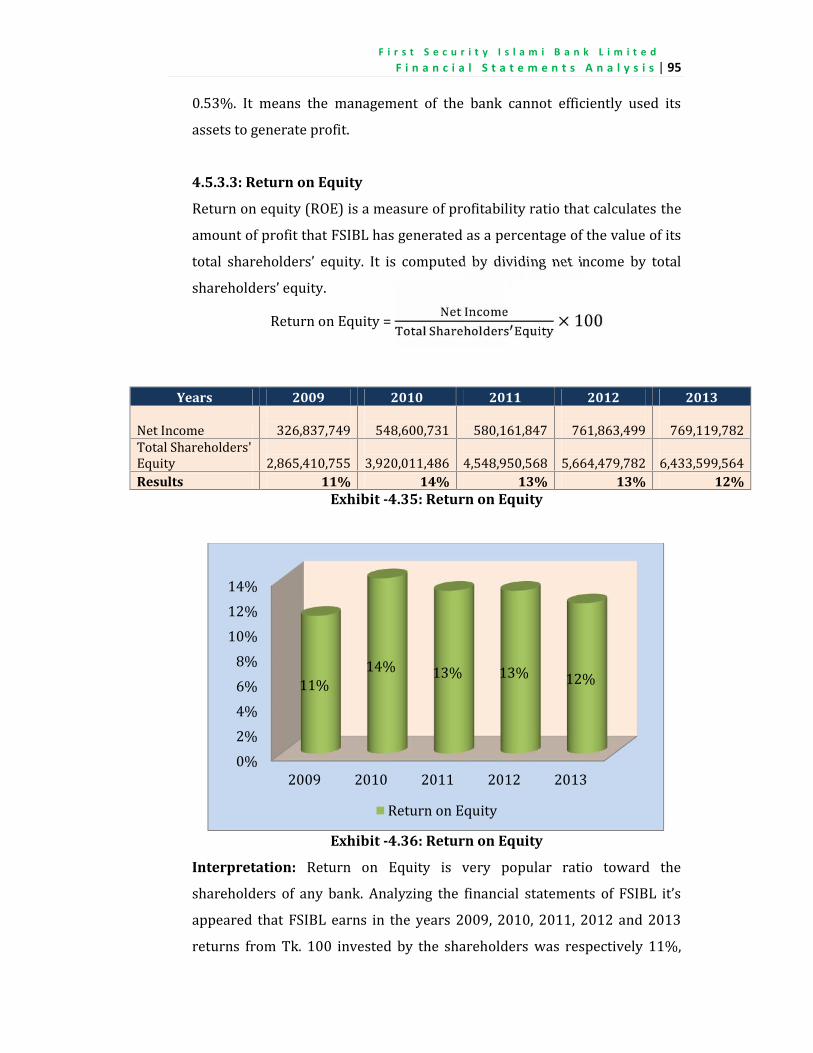
F i r s t S e c u r i t y I s l a m i B a n k L i m i t e d . . .
F i n a n c i a l S t a t e m e n t s A n a l y s i s | 950.53%. It means the management of the bank cannot efficiently used itsassets to generate profit.4.5.3.3: Return on EquityReturn on equity (ROE) is a measure of profitability ratio that calculates theamount of profit that FSIBL has generated as a percentage of the value of itstotal shareholders’ equity. It is computed by dividing net income by totalshareholders’ equity.Return on Equity = × 100
Years 2009 2010 2011 2012 2013Net Income 326,837,749 548,600,731 580,161,847 761,863,499 769,119,782Total Shareholders'Equity 2,865,410,755 3,920,011,486 4,548,950,568 5,664,479,782 6,433,599,564Results 11% 14% 13% 13% 12%
Exhibit -4.35: Return on Equity
Exhibit -4.36: Return on Equity
Interpretation: Return on Equity is very popular ratio toward theshareholders of any bank. Analyzing the financial statements of FSIBL it’sappeared that FSIBL earns in the years 2009, 2010, 2011, 2012 and 2013returns from Tk. 100 invested by the shareholders was respectively 11%,
0%2%4%6%8%10%12%14%
2009 2010 2011 2012 201311% 14% 13% 13% 12%
Return on Equity
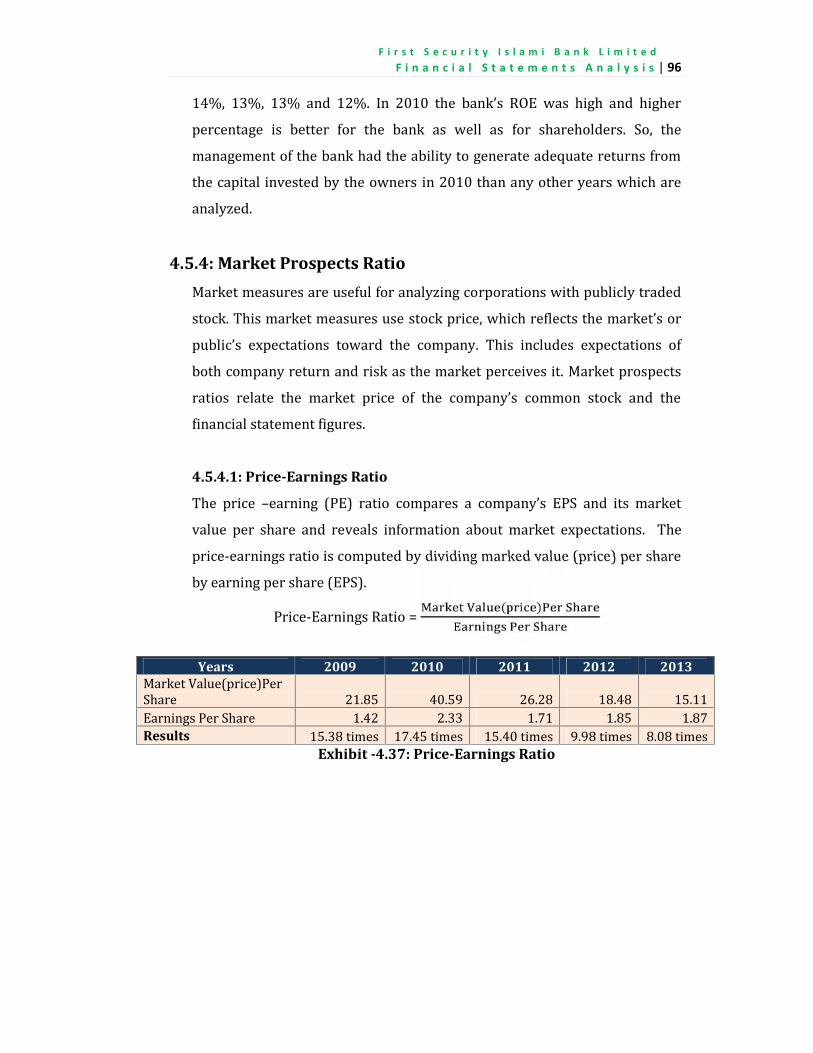
F i r s t S e c u r i t y I s l a m i B a n k L i m i t e d . . .
F i n a n c i a l S t a t e m e n t s A n a l y s i s | 9614%, 13%, 13% and 12%. In 2010 the bank’s ROE was high and higherpercentage is better for the bank as well as for shareholders. So, themanagement of the bank had the ability to generate adequate returns fromthe capital invested by the owners in 2010 than any other years which areanalyzed.4.5.4: Market Prospects RatioMarket measures are useful for analyzing corporations with publicly tradedstock. This market measures use stock price, which reflects the market’s orpublic’s expectations toward the company. This includes expectations ofboth company return and risk as the market perceives it. Market prospectsratios relate the market price of the company’s common stock and thefinancial statement figures.
4.5.4.1: Price-Earnings RatioThe price –earning (PE) ratio compares a company’s EPS and its marketvalue per share and reveals information about market expectations. Theprice-earnings ratio is computed by dividing marked value (price) per shareby earning per share (EPS).Price-Earnings Ratio = ( )Years 2009 2010 2011 2012 2013Market Value(price)PerShare 21.85 40.59 26.28 18.48 15.11Earnings Per Share 1.42 2.33 1.71 1.85 1.87
Results 15.38 times 17.45 times 15.40 times 9.98 times 8.08 timesExhibit -4.37: Price-Earnings Ratio
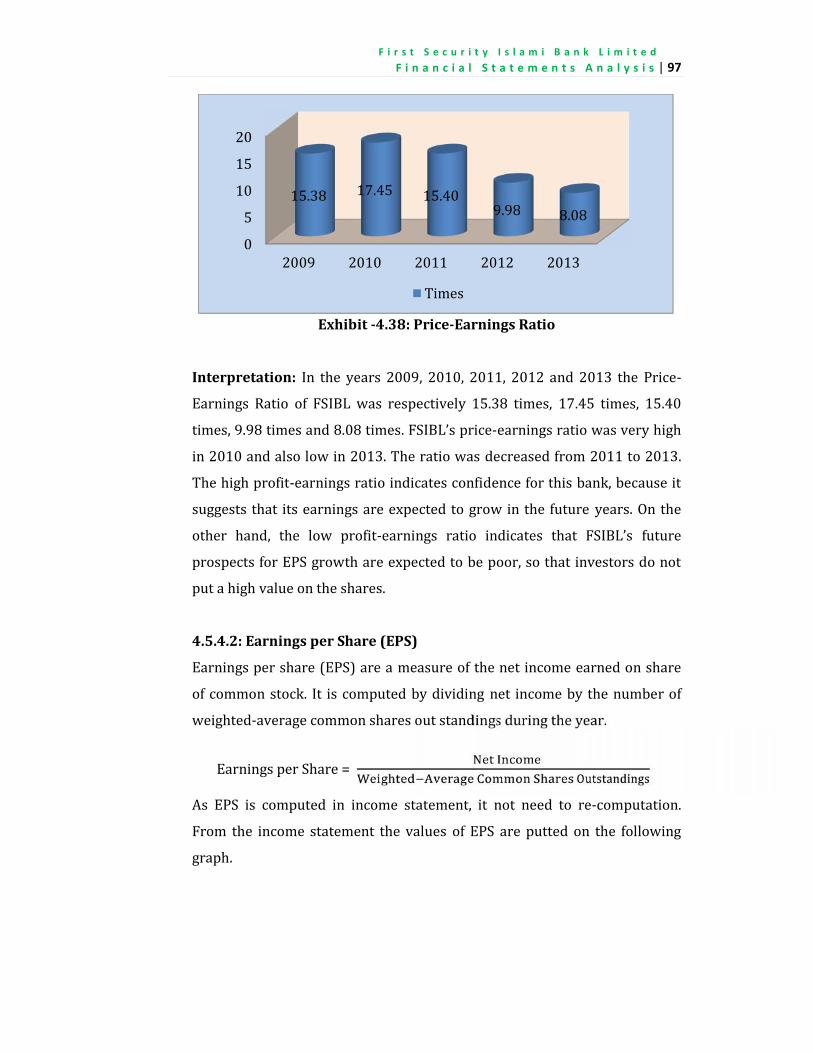
F i r s t S e c u r i t y I s l a m i B a n k L i m i t e d . . .
F i n a n c i a l S t a t e m e n t s A n a l y s i s | 97
Exhibit -4.38: Price-Earnings Ratio
Interpretation: In the years 2009, 2010, 2011, 2012 and 2013 the Price-Earnings Ratio of FSIBL was respectively 15.38 times, 17.45 times, 15.40times, 9.98 times and 8.08 times. FSIBL’s price-earnings ratio was very highin 2010 and also low in 2013. The ratio was decreased from 2011 to 2013.The high profit-earnings ratio indicates confidence for this bank, because itsuggests that its earnings are expected to grow in the future years. On theother hand, the low profit-earnings ratio indicates that FSIBL’s futureprospects for EPS growth are expected to be poor, so that investors do notput a high value on the shares.4.5.4.2: Earnings per Share (EPS)Earnings per share (EPS) are a measure of the net income earned on shareof common stock. It is computed by dividing net income by the number ofweighted-average common shares out standings during the year.
Earnings per Share =As EPS is computed in income statement, it not need to re-computation.From the income statement the values of EPS are putted on the followinggraph.
05101520
2009 2010 2011 2012 201315.38 17.45 15.40 9.98 8.08
Times
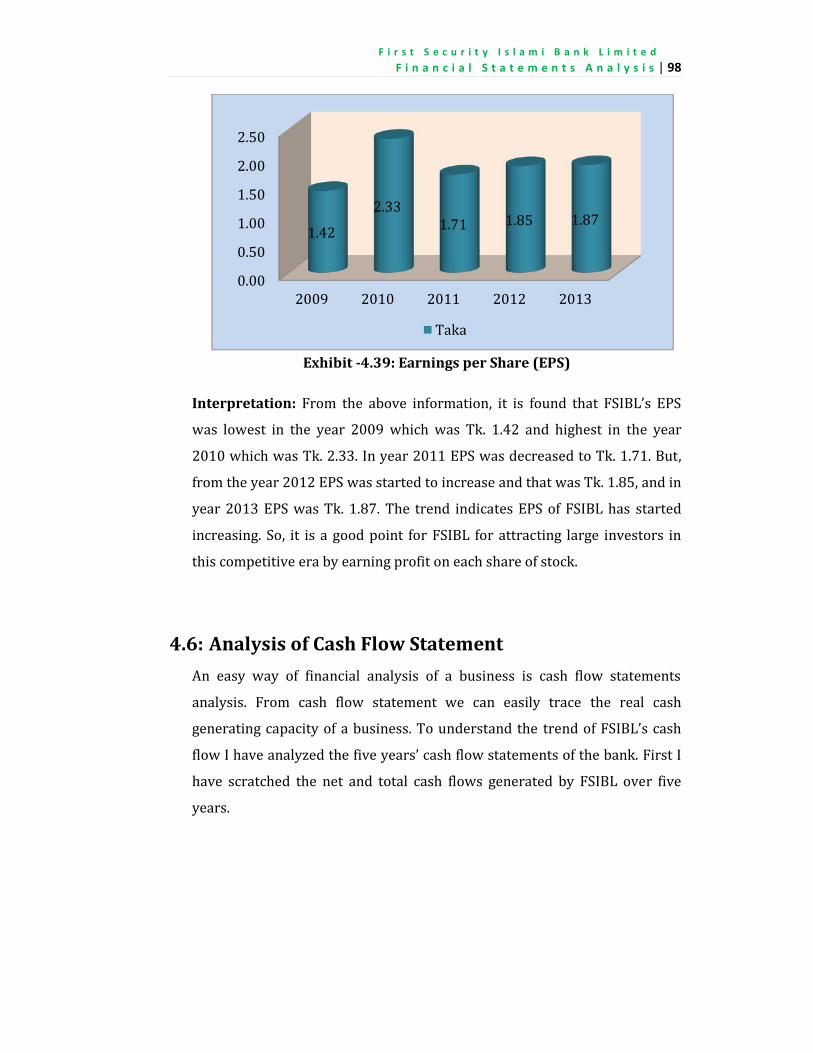
F i r s t S e c u r i t y I s l a m i B a n k L i m i t e d . . .
F i n a n c i a l S t a t e m e n t s A n a l y s i s | 98
Exhibit -4.39: Earnings per Share (EPS)
Interpretation: From the above information, it is found that FSIBL’s EPSwas lowest in the year 2009 which was Tk. 1.42 and highest in the year2010 which was Tk. 2.33. In year 2011 EPS was decreased to Tk. 1.71. But,from the year 2012 EPS was started to increase and that was Tk. 1.85, and inyear 2013 EPS was Tk. 1.87. The trend indicates EPS of FSIBL has startedincreasing. So, it is a good point for FSIBL for attracting large investors inthis competitive era by earning profit on each share of stock.4.6: Analysis of Cash Flow StatementAn easy way of financial analysis of a business is cash flow statementsanalysis. From cash flow statement we can easily trace the real cashgenerating capacity of a business. To understand the trend of FSIBL’s cashflow I have analyzed the five years’ cash flow statements of the bank. First Ihave scratched the net and total cash flows generated by FSIBL over fiveyears.
0.000.501.001.502.002.50
2009 2010 2011 2012 20131.42 2.33 1.71 1.85 1.87
Taka
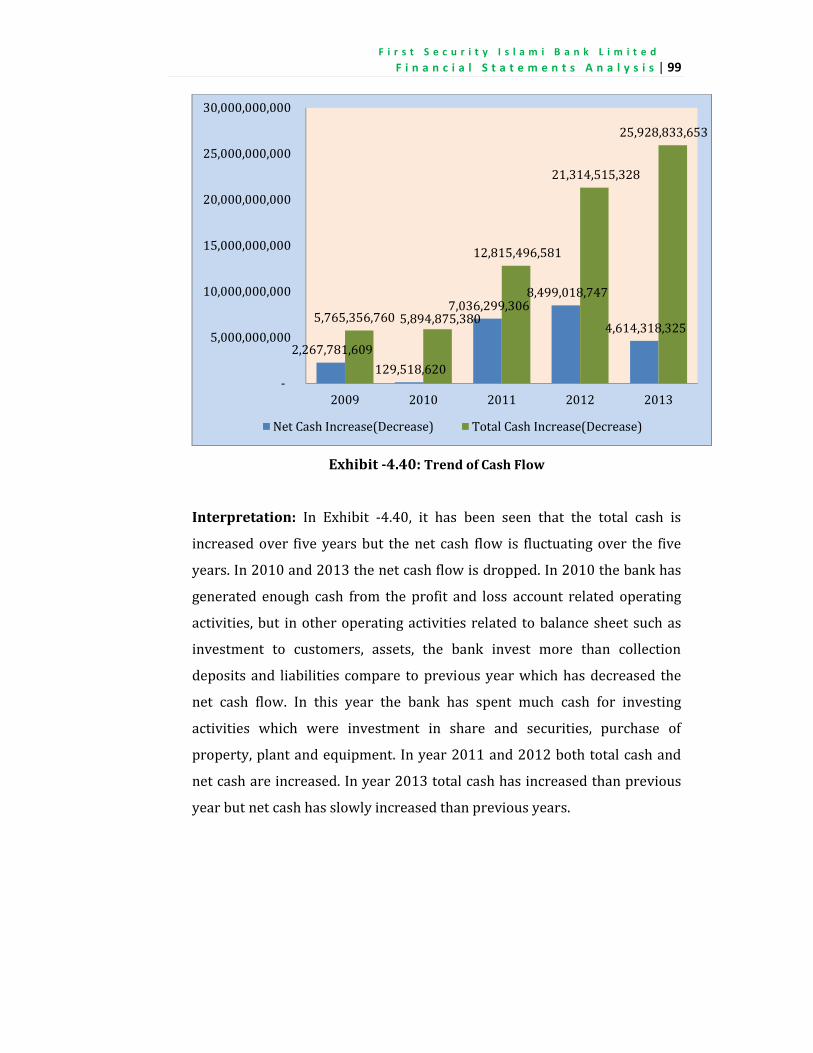
F i r s t S e c u r i t y I s l a m i B a n k L i m i t e d . . .
F i n a n c i a l S t a t e m e n t s A n a l y s i s | 99
Exhibit -4.40: Trend of Cash Flow
Interpretation: In Exhibit -4.40, it has been seen that the total cash isincreased over five years but the net cash flow is fluctuating over the fiveyears. In 2010 and 2013 the net cash flow is dropped. In 2010 the bank hasgenerated enough cash from the profit and loss account related operatingactivities, but in other operating activities related to balance sheet such asinvestment to customers, assets, the bank invest more than collectiondeposits and liabilities compare to previous year which has decreased thenet cash flow. In this year the bank has spent much cash for investingactivities which were investment in share and securities, purchase ofproperty, plant and equipment. In year 2011 and 2012 both total cash andnet cash are increased. In year 2013 total cash has increased than previousyear but net cash has slowly increased than previous years.
2,267,781,609 129,518,6207,036,299,3068,499,018,7474,614,318,3255,765,356,760 5,894,875,380
12,815,496,58121,314,515,328
25,928,833,653
- 5,000,000,000
10,000,000,000 15,000,000,000 20,000,000,000 25,000,000,000 30,000,000,000
2009 2010 2011 2012 2013Net Cash Increase(Decrease) Total Cash Increase(Decrease)
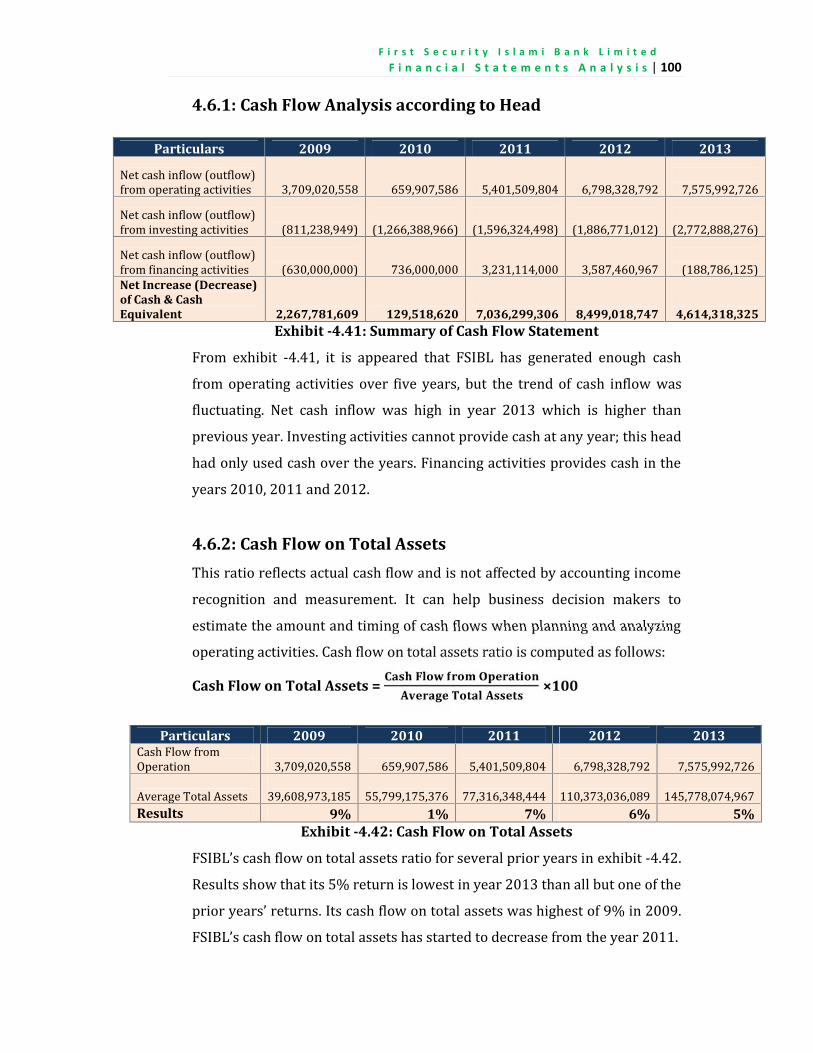
F i r s t S e c u r i t y I s l a m i B a n k L i m i t e d . . .
F i n a n c i a l S t a t e m e n t s A n a l y s i s | 100
4.6.1: Cash Flow Analysis according to Head
Particulars 2009 2010 2011 2012 2013Net cash inflow (outflow)from operating activities 3,709,020,558 659,907,586 5,401,509,804 6,798,328,792 7,575,992,726Net cash inflow (outflow)from investing activities (811,238,949) (1,266,388,966) (1,596,324,498) (1,886,771,012) (2,772,888,276)Net cash inflow (outflow)from financing activities (630,000,000) 736,000,000 3,231,114,000 3,587,460,967 (188,786,125)Net Increase (Decrease)of Cash & CashEquivalent 2,267,781,609 129,518,620 7,036,299,306 8,499,018,747 4,614,318,325
Exhibit -4.41: Summary of Cash Flow StatementFrom exhibit -4.41, it is appeared that FSIBL has generated enough cashfrom operating activities over five years, but the trend of cash inflow wasfluctuating. Net cash inflow was high in year 2013 which is higher thanprevious year. Investing activities cannot provide cash at any year; this headhad only used cash over the years. Financing activities provides cash in theyears 2010, 2011 and 2012.4.6.2: Cash Flow on Total AssetsThis ratio reflects actual cash flow and is not affected by accounting incomerecognition and measurement. It can help business decision makers toestimate the amount and timing of cash flows when planning and analyzingoperating activities. Cash flow on total assets ratio is computed as follows:Cash Flow on Total Assets = ×100
Particulars 2009 2010 2011 2012 2013Cash Flow fromOperation 3,709,020,558 659,907,586 5,401,509,804 6,798,328,792 7,575,992,726Average Total Assets 39,608,973,185 55,799,175,376 77,316,348,444 110,373,036,089 145,778,074,967Results 9% 1% 7% 6% 5%
Exhibit -4.42: Cash Flow on Total AssetsFSIBL’s cash flow on total assets ratio for several prior years in exhibit -4.42.Results show that its 5% return is lowest in year 2013 than all but one of theprior years’ returns. Its cash flow on total assets was highest of 9% in 2009.FSIBL’s cash flow on total assets has started to decrease from the year 2011.

F i r s t S e c u r i t y I s l a m i B a n k L i m i t e d . . .
F i n a n c i a l S t a t e m e n t s A n a l y s i s | 101
Chapter Five
Findings, Recommendation
and Conclusion
5
Findings,Recommendation
and Conclusion
F i r s t S e c u r i t y I s l a m i B a n k L i m i t e d . . .
F i n a n c i a l S t a t e m e n t s A n a l y s i s | 102
5.1: Findings Regarding First Security Islami BankLimited’s Financial Position by Analyzing FinancialStatements and Ratios
First Security Islami Bank Limited’s maximum assets are covered byinvestment in businesses and the lowest percentage of the bank’s totalassets is covered by fixed assets. On the other hand, the lion share of itsliabilities is covered by deposits collected from public. In total ofliabilities and equity, the bank’s liability was very high comparing withequity. In the aspect of income statement, FSIBL’s net profit wasdecreasing and operating expenses were increasing over the years2009, 2010, 2011, 2012 and 2013 consequently. This indicates the bankwas fail to control the cost in its operation or could not make adequateinvestment of its liabilities, thus the liability was expertly higher thanthe investment in years 2012 and 2013 where the most liquid asset-cash was lower than previous years. Liquidity ratios are the most important ratios to evaluate company’sliquidity to pay its short-term debt and deposits. These ratios showhow quick First Security Islami Bank Ltd. is able to pay debt or convertits assets into cash. I have discussed about current ratio, acid-test ratio,accounts receivable turnover ratio and days’ sales uncollected ratio.From the analysis of liquidity ratios I have found that the current ratioof FSIBL was 0.16 in year 2009 but it was slightly decreased to 0.14 inthe year 2010. This ratio again increased in years of 2011, 2012 and2013. The higher current ratio is better for the institution because thehigher ratio helps to prevent getting default. On the other hand FSIBLwas highly liquid in the year 2012 because its acid-test ratio or quickratio was 0.20 which was higher than the years of 2009, 2010, 2011 and2013. FSIBL’s acid-test ratio was higher in 2012 and 2013. It meansFSIBL’s acid-test ratio is increasing. The higher acid-test ratio enablesthe bank to pay short-term debt quickly. FSIBL’s accounts receivableturnover of 21.90 times and 21.67 times were substantially higher in
F i r s t S e c u r i t y I s l a m i B a n k L i m i t e d . . .
F i n a n c i a l S t a t e m e n t s A n a l y s i s | 103the years of 2012 and 2013 than years- 2009, 2010 and 2011. FSIBLtook highest time of 46 days to collect account receivable in year 2010,but the days’ sales uncollected was decreased to 19 days in year 2013.From these above information, it is cleared that FSIBL’s liquidityposition is improving, but it was not enough good comparing withindustry. Efficiency ratios determine the efficiency of using the bank’s assets andmanaging its operations. I have discussed about total asset turnoverratio. FSIBL’s total asset turnover was lowest in year 2010 and high inyear 2012 and year 2013 which was 0.13 times in both years. Thatmeans FSIBL invested more on those assets which bring more revenues. Solvency ratios measure the ability of a company to survive over a longperiod of time and to meet its financial obligations. There I havediscussed about debt and equity ratio, and times interest earned ratio.From the years 2009 to 2013 the debt to total assets ratio was high andthe equity to total assets was low. The higher debt to total assets bearshigh risk for the company. So, FSIBL bears high risk to survive over along period of time and to meet its financial obligations. On the otherhand, the higher debt to total assets not only creates higher risk but alsoincrease profitability.FSIBL’s times interest earned ratio was high in year 2010 which was1.29 times and that decreased to 1.14 times in year 2013. This meansFSIBL’s interest expense have increased more than the increment ofrevenues. Profitability ratios measure the income or operating success of acompany for a given period of time. The profitability ratios that I havediscussed are profit margin ratio, return on total assets and return onequity. The profit margin ratio of FSIBL was high in year 2010 and itwas started to decrease from year 2011. FSIBL’s lowest profit marginwas 4.21% in year 2013. FSIBL’s return on total assets was high in the
F i r s t S e c u r i t y I s l a m i B a n k L i m i t e d . . .
F i n a n c i a l S t a t e m e n t s A n a l y s i s | 104years 2009 and 2010 which was 1%. The bank’s return on total assetslow in year 2013 which was 0.53%. FSIBL’s return on equity was highin year 2010 and low in year 2013. From the above discussion it isappeared that FSIBL’s profitability was decreasing because the bankcould not operate properly its activities comparing the previous years.So, it was failing to increase the profitability. Market prospects ratios relate the observable market values like thestock price with the book values obtained from the firm’s financialstatements. The market value ratios that I have used to analyzed arePrice Earnings Ratio (P-E) and Earning per Share (EPS). FSIBL’s P-Eratio was high in year 2010 comparatively than the last three years. Theratio was decreased from 2011 to 2013. The P-E ratio was lowest in theyear 2013 which only 8.08 times. The high P-E ratio indicates a sign ofconfidence for the bank, because it suggests that its earnings areexpected to grow in the future years. On the other hand, the low P-Eratio indicates that the bank’s future prospects for EPS growth areexpected to be poor, so that investors do not put a high value on theshare. The EPS of FSIBL was taka 2.33 was high in year 2010 and itdecreased in year 2011 and increased from years 2012 to 2013 whichare taka 1.85 and taka 1.87 accordingly. So, it was a good point forFSIBL for attracting large investors in the new competitive era byearning profit on each share of stock.During my three months internship period in First Security Islami BankLimited, Amborkhana Branch, Sylhet, I have found the borrowers were notpaying the installment timely, even the bank could not recover its money yetfrom some powerful clients. These make losses for the bank and decrease theprofit. On the other hand, some depositors deposit their money for very shortperiod of time; even some of the depositors withdraw their money before thematurity date. Thus, the bank cannot use the money for long-term investmentprojects which earn high profits. For these reasons, the bank’s profitability isdecreasing.
F i r s t S e c u r i t y I s l a m i B a n k L i m i t e d . . .
F i n a n c i a l S t a t e m e n t s A n a l y s i s | 105
5.2: Recommendations
First Security Islami Bank Limited has to concentrate to adequateinvestment. It should minimize the operating expenses and follow thegreen banking system. The bank should be strict to recovery of investedmoney and time to time collecting profits. FSIBL’s liquidity position was not enough strong comparing to industry.So the bank should be concerned about increase its liquidity. The efficiency ratios of FSIBL were good and remaining in increasingtrend. FSIBL’s had fair solvency ratios in where it uses the debt most toincrease revenue rather than the equity. It may increase the risk for thebank. So, it would be better for FSIBL to finance more equity to minimizethe risk. Though there were higher profitability ratios in year 2010, FSIBL wasnot successful in increasing its overall earnings performance becauseProfit Margin, Return on Assets and Return on Equity had beendecreasing during the years 2011 to 2013. So for getting more benefit ofearnings, FSIBL should concern about its profitability and improve itsoperating polices for minimizing costs and increasing profits. Though the EPS was increased in years 2012 and 2013 comparing toyear 2011, the overall market prospects ratios of FSIBL was decreasingduring the years 2011 to 2013. If it decreases over the years, investorswill not put high value on the shares issued by the bank. So the bankshould concern about this. FSIBL should capture and hold those depositors who will agree todeposit their money for long period of time. Then the bank can make
F i r s t S e c u r i t y I s l a m i B a n k L i m i t e d . . .
F i n a n c i a l S t a t e m e n t s A n a l y s i s | 106long-term investments and earn higher profits. FSIBL also should lendthe money to reliable clients and invest in profitable businesses.5.3: Conclusion
By analyzing the financial statements as well as the ratios, it can be said thatFirst Security Islami Bank Limited gas been doing well in few sectors. If we seethe comparative analysis of balance sheet items, it is seemed that the currentliabilities are higher than assets. And all the assets and liabilities were inincreasing trend from year 2010 to 2012 and decreased from year 2012 to2013. In the case of comparative income statement, most of time the net profitwas decreased ant it was fluctuating over the period. But, when compare overalltotal operating income and net profit they were simply increased over theyears. In case of common-size comparative analysis of balance sheet items, it isappeared that the investment was in decreasing trend and the liabilities were inincreasing trend. Over the five years period of 2009 to 2013, the investmentswere lower than the liabilities created by deposits and other debt accounts. Themost liquid asset cash was decreasing and fixed assets were increasing over theperiods. In common-size income statement, the operating expenses were toohigh and they were increasing over the years and net profit was decreasing yearby year. The liquidity ratios of FSIBL were increased most of the times which isgood for the bank. If we see the profitability position of the bank, it can easilybe said the Profit Margin, Return on Assets and Return on Equity were not sogood and its trend was downward. We can see the EPS ratio of FSIBL wasfluctuating and the P-E ratio was decreasing, so it is better to give moreconcentration when maintaining these types of ratios and increasing such amarket price of the share. Also when we have a look on the solvency ratios, wecan say that FSIBL should do their best to maintain their leverage ratios as allthese ratios shows that they have very high leverage and thus they also have ahigher risk. Besides this, they need to increase the amount of equity capital astoo much leverage may be associated with more risk and also it indicates thebank’s financial weakness. Finally, it can be said that FSIBL’s overallperformance was good enough.
F i r s t S e c u r i t y I s l a m i B a n k L i m i t e d . . .
F i n a n c i a l S t a t e m e n t s A n a l y s i s | 107
References:
While preparing this report, I had to collect data from the annual reports ofFSIBL, different books related to Accounting and Finance, the website of FSIBLand other websites and blogs. The references are given below: Accounting Info (n. d.) U.S. GAAP Codification of Accounting
Standards [Internet blog]. Available from:<http://accountinginfo.com/financial-accounting-standards/asc-200/210-balance-sheet.htm> [Accessed 1st December 2014]. Ajaz A. Khan (2013) Sharia Compliant Finance. Halal Monk [Internetblog]. Available from: <http://www.halalmonk.com/ajaz-ahmed-khan-sharia-compliant-finance> [Accessed 23rd November 2014]. Annual report of First Security Islami Bank Limited -2009, 2010, 2011,2012 and 2013. Business Science Articles (n. d.) Articles, Functions of Banks [Internet],Business. Available from: <http://www.business-science-articles.com/articles/business/76-functions-of-banks-i-primary-and-secondary> [Accessed 12th November 2014]. First Security Islami Bank Limited (n. d.) Home Page [Internet], Home,Products & Services, Smart Banking, Financial Information, Meet Us, CSRand News, First Security Islami Bank Limited. Available from:< http://www.fsiblbd.com> [Accessed 10th November, 31st December2014]. Helen Mongan (2014) Guidelines for Writing a Literature Review.
Duluth [Internet blog]. Available from:<http://www.duluth.umn.edu/~hrallis/guides/researching/litreview.html> [Accessed 13th November 2014]. Investopedia (n. d.) Dictionary [Internet], Islami Banking. Availablefrom: <http://www.investopedia.com/terms/i/islamicbanking.asp>[Accessed 20th November 2014].
F i r s t S e c u r i t y I s l a m i B a n k L i m i t e d . . .
F i n a n c i a l S t a t e m e n t s A n a l y s i s | 108
Jemes C. Van Horne, John M. Wachowicz and Jr. (2009) Fundamentals of
Financial Management. 13th edition. Pearson Education Limited. K. D. Larson, J. Wild and B. Chiappetta (2005) Fundamental Accounting
Principles. 17th edition. McGraw-Hill, Irwin. S. A. Ali and R. A. Howlader (2009) Banking Law and Practice. Revisededition. New S R Printing Press, Dhaka. Smriti Chand (n. d.) Commercial Banks [Internet Blog]. Available from:<http://www.yourarticlelibrary.com/banking/commercial-banks/commercial-banks-primary-and-secondary-functions-of-commercial-banks/30321/> [Accessed 12 November 2014]. Weygandt, Kieso and Kimmel (2008) Accounting Principles. 8th edition.John Wiley & Sons, Inc.

F i r s t S e c u r i t y I s l a m i B a n k L i m i t e d . . .
F i n a n c i a l S t a t e m e n t s A n a l y s i s | 109
Appendix
F i r s t S e c u r i t y I s l a m i B a n k L i m i t e d . . .
F i n a n c i a l S t a t e m e n t s A n a l y s i s | 110
Acronyms
CIS: Comparative Income Statement FSIBL: First Security Islami Bank Limited GAAP: Generally Accepted Accounting Principles OIC: Organization of Islamic Countries PLS: Profit & Loss Sharing AIS: International Accounting Standards AAR: Average Accounts Receivable AR: Accounts Receivable PE: Price-Earnings EPS: Earnings Per Share
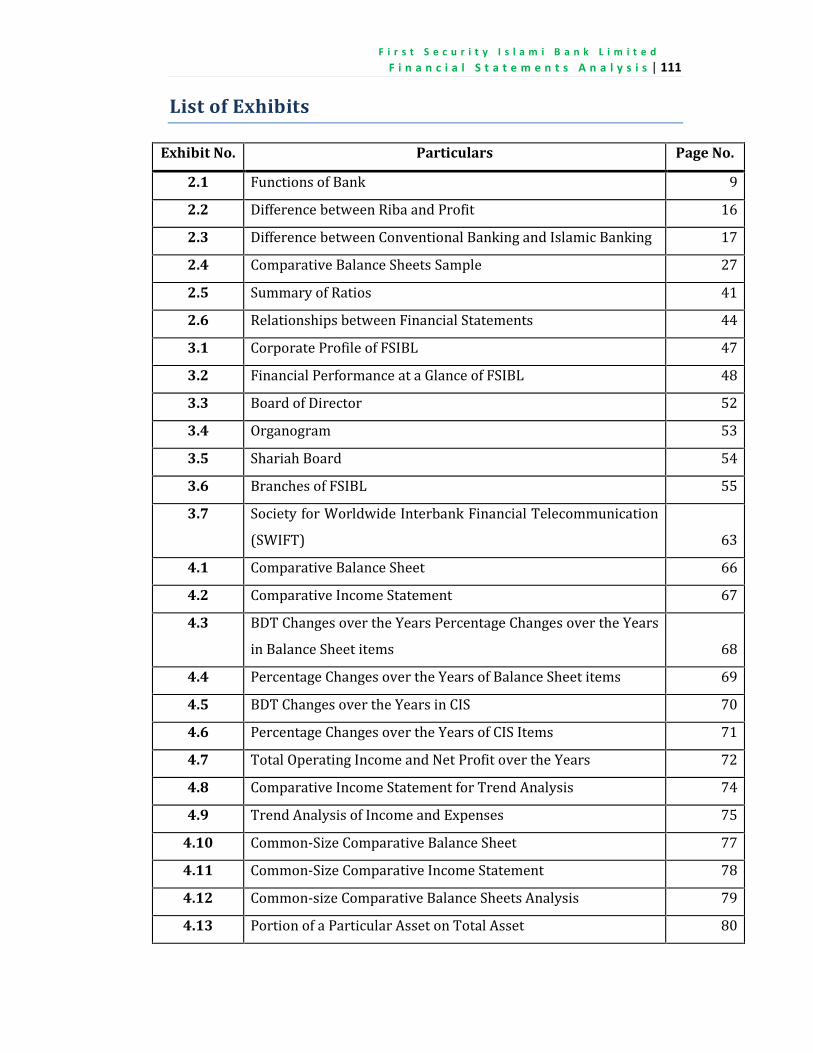
F i r s t S e c u r i t y I s l a m i B a n k L i m i t e d . . .
F i n a n c i a l S t a t e m e n t s A n a l y s i s | 111
ListofExhibits
Exhibit No. Particulars Page No.
2.1 Functions of Bank 92.2 Difference between Riba and Profit 162.3 Difference between Conventional Banking and Islamic Banking 172.4 Comparative Balance Sheets Sample 272.5 Summary of Ratios 412.6 Relationships between Financial Statements 443.1 Corporate Profile of FSIBL 473.2 Financial Performance at a Glance of FSIBL 483.3 Board of Director 523.4 Organogram 533.5 Shariah Board 543.6 Branches of FSIBL 553.7 Society for Worldwide Interbank Financial Telecommunication(SWIFT) 634.1 Comparative Balance Sheet 664.2 Comparative Income Statement 674.3 BDT Changes over the Years Percentage Changes over the Yearsin Balance Sheet items 684.4 Percentage Changes over the Years of Balance Sheet items 694.5 BDT Changes over the Years in CIS 704.6 Percentage Changes over the Years of CIS Items 714.7 Total Operating Income and Net Profit over the Years 724.8 Comparative Income Statement for Trend Analysis 744.9 Trend Analysis of Income and Expenses 75
4.10 Common-Size Comparative Balance Sheet 774.11 Common-Size Comparative Income Statement 784.12 Common-size Comparative Balance Sheets Analysis 794.13 Portion of a Particular Asset on Total Asset 80
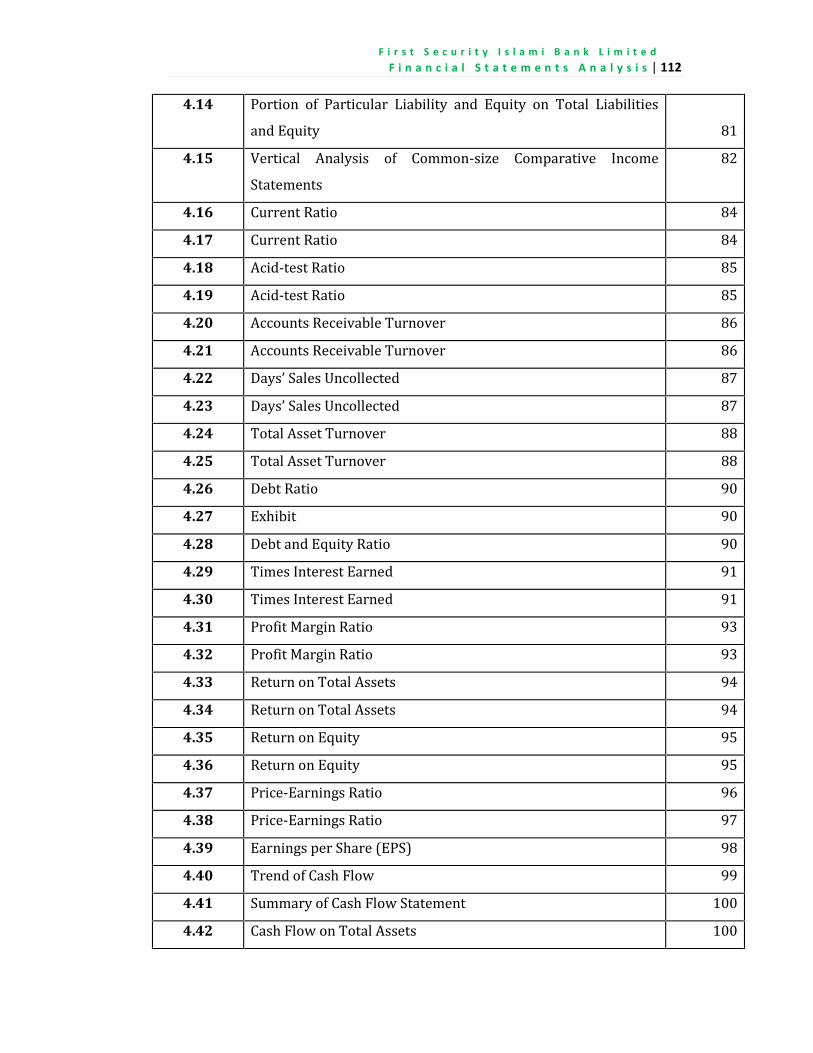
F i r s t S e c u r i t y I s l a m i B a n k L i m i t e d . . .
F i n a n c i a l S t a t e m e n t s A n a l y s i s | 112
4.14 Portion of Particular Liability and Equity on Total Liabilitiesand Equity 814.15 Vertical Analysis of Common-size Comparative IncomeStatements 824.16 Current Ratio 844.17 Current Ratio 844.18 Acid-test Ratio 854.19 Acid-test Ratio 854.20 Accounts Receivable Turnover 864.21 Accounts Receivable Turnover 864.22 Days’ Sales Uncollected 874.23 Days’ Sales Uncollected 874.24 Total Asset Turnover 884.25 Total Asset Turnover 884.26 Debt Ratio 904.27 Exhibit 904.28 Debt and Equity Ratio 904.29 Times Interest Earned 914.30 Times Interest Earned 914.31 Profit Margin Ratio 934.32 Profit Margin Ratio 934.33 Return on Total Assets 944.34 Return on Total Assets 944.35 Return on Equity 954.36 Return on Equity 954.37 Price-Earnings Ratio 964.38 Price-Earnings Ratio 974.39 Earnings per Share (EPS) 984.40 Trend of Cash Flow 994.41 Summary of Cash Flow Statement 1004.42 Cash Flow on Total Assets 100
F i r s t S e c u r i t y I s l a m i B a n k L i m i t e d . . .
F i n a n c i a l S t a t e m e n t s A n a l y s i s | 113
Click to get Excel Sheets
Click to get Financial Statements of FSIBL
Financial Year 2013
Financial Year 2012
Financial Year 2011
Financial Year 2010
Financial Year 2009

2015 JANUARY
S M T W T F S
1 2 3
4 5 6 7 8 9 10
11 12 13 14 15 16 17
18 19 20 21 22 23 24
25 26 27 28 29 30 31
MAY
S M T W T F S
1 2
3 4 5 6 7 8 9
10 11 12 13 14 15 16
17 18 19 20 21 22 23
24 25 26 27 28 29 30
31
SEPTEMBER
S M T W T F S
1 2 3 4 5
6 7 8 9 10 11 12
13 14 15 16 17 18 19
20 21 22 23 24 25 26
27 28 29 30
FEBRUARY
S M T W T F S
1 2 3 4 5 6 7
8 9 10 11 12 13 14
15 16 17 18 19 20 21
22 23 24 25 26 27 28
JUNE
S M T W T F S
1 2 3 4 5 6
7 8 9 10 11 12 13
14 15 16 17 18 19 20
21 22 23 24 25 26 27
28 29 30
OCTOBER
S M T W T F S
1 2 3
4 5 6 7 8 9 10
11 12 13 14 15 16 17
18 19 20 21 22 23 24
25 26 27 28 29 30 31
MARCH
S M T W T F S
1 2 3 4 5 6 7
8 9 10 11 12 13 14
15 16 17 18 19 20 21
22 23 24 25 26 27 28
29 30 31
JULY
S M T W T F S
1 2 3 4
5 6 7 8 9 10 11
12 13 14 15 16 17 18
19 20 21 22 23 24 25
26 27 28 29 30 31
NOVEMBER
S M T W T F S
1 2 3 4 5 6 7
8 9 10 11 12 13 14
15 16 17 18 19 20 21
22 23 24 25 26 27 28
29 30
APRIL
S M T W T F S
1 2 3 4
5 6 7 8 9 10 11
12 13 14 15 16 17 18
19 20 21 22 23 24 25
26 27 28 29 30
AUGUST
S M T W T F S
1
2 3 4 5 6 7 8
9 10 11 12 13 14 15
16 17 18 19 20 21 22
23 24 25 26 27 28 29
30 31
DECEMBER
S M T W T F S
1 2 3 4 5
6 7 8 9 10 11 12
13 14 15 16 17 18 19
20 21 22 23 24 25 26
27 28 29 30 31
Thank you…
Financial Statements Analysis First Security Islami Bank Limited