Embed Size (px)
Citation preview
INTERNATIONAL TROPICAL TIMBER ORGANIZATION
ANNUAL REVIEW AND ASSESSMENT
OF THE WORLD TIMBER SITUATION
2009

This document supersedes document ITTC(XLV)/4 “Elements for the Annual Review and Assessment of the World Timber Situation 2009”. It presents updated and revised statistics of the world timber situation received during and following consideration of document ITTC(XLV)/4 by the International Tropical Timber Council in November 2009. The designations employed and the presentation of material in this document do not imply the expression of any opinion whatsoever on the part of the International Tropical Timber Organization concerning the legal status of any country, territory, city or area or of its authorities, or concerning the delimitation of its frontiers or boundaries.
Document GI-7/09. International Tropical Timber Organization. Yokohama, Japan. Prepared by the Division of Economic Information and Market Intelligence, ITTO.
This document is also available on the Internet at http://www.itto.int/
Any revision or correction to this document will be posted on the site above.
ISBN 4-902045-74-5


(i)
(i)
TABLE OF CONTENTS
Summary...........................................................................................................................................................................(v).1..Introduction..................................................................................................................................................................1. Overview.....................................................................................................................................................................1. Scope.and.Structure...................................................................................................................................................1. Data.Sources.and.Limitations...................................................................................................................................1. Market.Developments................................................................................................................................................2
2..Production,.Trade.and.Prices.of.Primary.Products.................................................................................................7. Highlights....................................................................................................................................................................7. Data.Sources.and.Conventions..................................................................................................................................8. Industrial.Roundwood...............................................................................................................................................8. Sawnwood...................................................................................................................................................................13. Veneer..........................................................................................................................................................................17. Plywood.......................................................................................................................................................................19
3..Trade.and.Prices.of.Secondary.Processed.Wood.Products......................................................................................27. Highlights....................................................................................................................................................................27. SPWP.Data.Sources.and.Trade.Classification.........................................................................................................28. Secondary.Processed.Wood.Products.and.Trade.Overview...................................................................................28. Wooden.Furniture.and.Parts....................................................................................................................................29. Builders’.Woodwork.and.Joinery.............................................................................................................................31. Other.Secondary.Processed.Wood.Products............................................................................................................32. Mouldings....................................................................................................................................................................33. Bamboo.and.Cane.Furniture.and.Parts...................................................................................................................34
4..The.Competitiveness.of.Tropical.Timber...................................................................................................................37. Highlights....................................................................................................................................................................37. Introduction................................................................................................................................................................38. Substitution.Trends....................................................................................................................................................38. External.Factors.Impacting.on.the.Competitiveness.of.Tropical.hardwoods.......................................................40. Tropical.Hardwood.Plywood.in.Europe.and.North.America.................................................................................41. Sapele.and.Meranti.For.Window.Frames.in.Europe..............................................................................................42. Tropical.Hardwoods.Veneers.in.the.European.Interior.Sectors............................................................................43. Improving.Tropical.Wood’s.Competitiveness..........................................................................................................44
5..Long-Term.Outlook.for.the.Tropical.Timber.Market..............................................................................................47. Highlights....................................................................................................................................................................47. Introduction................................................................................................................................................................48. Trends.and.Drivers.in.the.Tropical.Timber.Market...............................................................................................48. Tropical.Forest.Resources.........................................................................................................................................48. Consumption.of.Tropical.wood.Products.................................................................................................................49. Substitution.from.Tropical.to.Non-Tropical.Wood.Products.................................................................................49. Concentration.of.Tropical.Wood.Product.Production.and.Consumption.in.Tropical.Countries.......................51. Emergence.of.Latin.America.and.Asia-Pacific.Producers......................................................................................52. Production.of.Fibre-Based.and.Secondary.Processed.Wood.Products.................................................................53. Wood.Products.Prices................................................................................................................................................54
6...References....................................................................................................................................................................55
(ii)
Appendices
Appendix.1..Production.and.Trade.of.Timber,.2005-2009...........................................................................................61. Table.1-1-a..Production.and.Trade.of.All.Timber.by.ITTO.Consumers...............................................................62. Table.1-1-b..Production.and.Trade.of.Tropical.Timber.by.ITTO.Consumers.....................................................74. Table.1-1-c..Production.and.Trade.of.All.Timber.by.ITTO.Producers.................................................................80. Table.1-1-d..Production.and.Trade.of.Tropical.Timber.by.ITTO.Producers.......................................................92. Table.1-2-a..Value.of.Trade.of.All.Timber.by.ITTO.Consumers...........................................................................98. Table.1-2-b..Value.of.Trade.of.Tropical.Timber.by.ITTO.Consumers..................................................................106. Table.1-2-c..Value.of.Trade.of.All.Timber.by.ITTO.Producers.............................................................................109. Table.1-2-d..Value.of.Trade.of.Tropical.Timber.by.ITTO.Producers....................................................................117.Appendix.2..Direction.of.Trade.in.Volume.of.Primary.Tropical.Timber.Products.between.Major.ITTO.Producers.......................and.Consumers.in.2008.............................................................................................................................121. Table.2-1..Logs............................................................................................................................................................123. Table.2-2..Sawnwood..................................................................................................................................................124. Table.2-3..Veneer........................................................................................................................................................125. Table.2-4..Plywood.....................................................................................................................................................126
Appendix.3..Major.Tropical.Species.Traded.in.2007.and.2008...................................................................................127. Table.3-1-a..Log.Imports...........................................................................................................................................129. Table.3-1-b..Sawnwood.Imports...............................................................................................................................132. Table.3-1-c..Veneer.Imports......................................................................................................................................137. Table.3-1-d..Plywood.Imports...................................................................................................................................140. Table.3-2-a..Log.Exports............................................................................................................................................143. Table.3-2-b..Sawnwood.Exports................................................................................................................................145. Table.3-2-c..Veneer.Exports.......................................................................................................................................149. Table.3-2-d..Plywood.Exports...................................................................................................................................151. Explanatory.Note.......................................................................................................................................................154
Appendix.4..Prices.of.Major.Tropical.Timber.and.Selected.Competing.Softwood.Products...................................169. 4-1..Logs......................................................................................................................................................................171. 4-2..Sawnwood............................................................................................................................................................175. 4-3..Plywood................................................................................................................................................................178. 4-4..Secondary.Processed.Wood.Products...............................................................................................................182
Appendix.5..Trade.in.Secondary.Processed.Wood.Products,.2004-2008....................................................................185. Table.5-1..Major.Importers.of.Secondary.Processed.Wood.Products...................................................................187. Table.5-2..Types.of.SPWP.Imported.by.Major.Importers,.2008...........................................................................188. Table.5-3..Major.ITTO.Importers.of.Secondary.Processed.Wood.Products........................................................189. Table.5-4..Types.of.SPWP.Imported.by.Major.Tropical.Importers,.2008............................................................190. Table.5-5..Major.Exporters.of.Secondary.Processed.Wood.Products...................................................................191. Table.5-6..Types.of.SPWP.Exported.by.Major.Exporters,.2008............................................................................192. Table.5-7..Major.ITTO.Exporters.of.Secondary.Processed.Wood.Products........................................................193. Table.5-8..Types.of.SPWP.Exported.by.Major.Tropical.Exporters,.2008.............................................................194
Appendix. 6.. UNECE. Timber. Committee. Statement. on. Forest. Products. Markets. in. 2009. and. Prospects.. ...................in.2010......................................................................................................................................................195
(iii)
FiguresChapter.1Figure.1.1....ITTO.Producers.and.Consumers.Real.GDP.Growth,.1997-2012..........................................................2Figure.1.2....ITTO.Producer.Regions.Real.GDP.Growth,.1997-2012.........................................................................3Figure.1.3....ITTO.Consumer.Regions.Real.GDP.Growth,.1997-2012.......................................................................3Figure.1.4....Japan.Housing.Starts,.1996-2009..............................................................................................................3Figure.1.5....US.Housing.Starts,.1996-2009...................................................................................................................3Chapter.2Figure.2.1....Major.Tropical.Log.Producers..................................................................................................................9Figure.2.2....Major.Tropical.Log.Consumers................................................................................................................10Figure.2.3....Major.Tropical.Log.Importers..................................................................................................................10Figure.2.4....Major.Tropical.Log.Exporters..................................................................................................................12Figure.2.5....Tropical.Log.Price.Trends,.2005-2010......................................................................................................13Figure.2.6....Major.Tropical.Sawnwood.Producers......................................................................................................14Figure.2.7....Major.Tropical.Sawnwood.Consumers....................................................................................................14Figure.2.8....Major.Tropical.Sawnwood.Importers......................................................................................................14Figure.2.9....Major.Tropical.Sawnwood.Exporters.......................................................................................................15Figure.2.10..Tropical.Sawnwood.Price.Trends,.2005-2010...........................................................................................16Figure.2.11..Major.Tropical.Veneer.Producers.............................................................................................................17Figure.2.12..Major.Tropical.Veneer.Consumers...........................................................................................................18Figure.2.13..Major.Tropical.Veneer.Importers.............................................................................................................18Figure.2.14..Major.Tropical.Veneer.Exporters.............................................................................................................19Figure.2.15..Major.Tropical.Plywood.Producers..........................................................................................................20Figure.2.16..Major.Tropical.Plywood.Consumers........................................................................................................20Figure.2.21..Major.Tropical.Plywood.Importers..........................................................................................................21Figure.2.22..Major.Tropical.Plywood.Exporters..........................................................................................................22Figure.2.19..Tropical.Plywood.Price.Trends,.2005-2010..............................................................................................23Figure.2.21..Major.Trade.Flows:.Tropical.Industrial.Roundwood,.2008...................................................................24Figure.2.22..Major.Trade.Flows:.Tropical.Sawnwood,.2008.......................................................................................25Figure.2.23..Major.Trade.Flows:.Tropical.Plywood,.2008...........................................................................................26Chapter.3Figure.3.1....Major.tropical.Exporters.of.Wooden.Furniture.and.Parts....................................................................30Figure.3.2....Major.Importers.of.Wooden.Furniture.and.Parts..................................................................................31Figure.3.3....Major.Tropical.Exporters.of.Builders’.Woodwork.and.Joinery............................................................32Figure.3.4....Major.Importers.of.Builder’s.Woodwork.and.Joinery...........................................................................32Figure.3.5....Major.Tropical.Exporters.of.Other.SPWPs.............................................................................................33Figure.3.6....Major.Importers.of.Other.SPWPs............................................................................................................33Figure.3.7....Major.Tropical.Exporters.of.Mouldings...................................................................................................34Figure.3.8....Major.Importers.of.Mouldings..................................................................................................................34Chapter.4Figure.4.1....Price.Trends.for.Commodities.Used.in.Construction.and.the.Manufacture.of.Building.Products....39Figure.4.2....EU.Plywood.Supply.2003-2008..................................................................................................................41Figure.4.3....US.Hardwood.Plywood.and.Engineered.Wood.Flooring.Imports.by.Supply.Country.2003-2008.....41Figure.4.4....Value.of.Western.European.Wood.Window.Market.by.Product...........................................................43Figure.4.5....Share.of.Western.European.Wood.Window.Market.by.Product...........................................................43Chapter.5Figure.5.1....Historical.(1995-2005).and.Predicted.(2006-2020).Softwood,.Tropical.Hardwood.and.Non-Tropical.....................Hardwood.Sawnwood.and.Plywood.Consumption..................................................................................49Figure.5.2....Historical.(1995-2005).and.Predicted.(2006-2020).Softwood,.Tropical.Hardwood.and.Non-Tropical. ................Hardwood.Log,.Sawnwood,.and.Plywood.Prices....................................................................................54
Tables
Table.1.1......Data.Quality.Indicators.............................................................................................................................2Table.5.1......Country.and.Regional.Forest.Area.Change.(%.per.year).to.2020.........................................................48Table.5.2......Share.(%).of.Softwood,.Tropical.Hardwood.and.Non-Tropical.Hardwood.in.Total.Sawnwood......................Consumption,.By.Region,.Historical.(1995-2006).and.Predicted.(2020)...............................................50Table.5.3......Share.(%).of.Softwood,.Tropical.Hardwood.and.Non-Tropical.Hardwood.in.Total.Plywood.....................Consumption,.By.Region,.Historical.(1995-2006).and.Predicted.(2020)...............................................51....................................................................................................................................................................................Contd
(iv)
Table.5.4......Historical.(1995-2006).and.Predicted.(2020).Regional.Shares.of.World.Production.of.Tropical.....................Sawnwood....................................................................................................................................................52Table.5.5......Historical.(1995-2006).and.Predicted.(2020).Regional.Shares.of.World.Production.of.Tropical.....................Plywood........................................................................................................................................................52Table.5.6......Historical.(1995-2006).and.Predicted.(2020).Regional.Shares.of.World.Production.of.Reconstituted.....................Panels...........................................................................................................................................................52Table.5.7......Historical.(1995-2006).and.Predicted.(2020).Regional.Shares.of.World.Production.of.Non-Tropical.....................Hardwood.Sawnwood.................................................................................................................................53Table.5.8......Historical.(1995-2006).and.Predicted.(2020).Regional.Shares.of.World.Production.of.Softwood.....................Sawnwood,.Reconstituted.Panels,.and.Wooden.Furniture.....................................................................53
(v)
SUMMARY
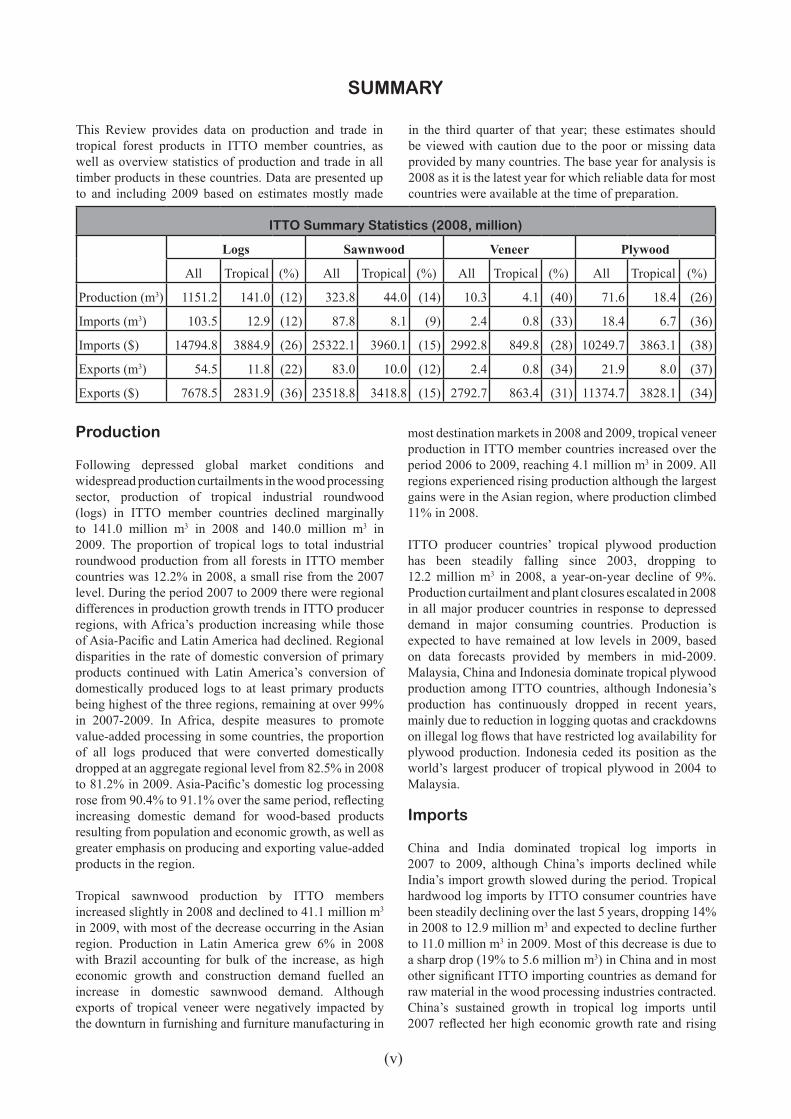
This Review provides data on production and trade in tropical forest products in ITTO member countries, as well as overview statistics of production and trade in all timber products in these countries. Data are presented up to and including 2009 based on estimates mostly made
in the third quarter of that year; these estimates should be viewed with caution due to the poor or missing data provided by many countries. The base year for analysis is 2008 as it is the latest year for which reliable data for most countries were available at the time of preparation.
ITTO Summary Statistics (2008, million)
Logs Sawnwood Veneer Plywood
All Tropical (%) All Tropical (%) All Tropical (%) All Tropical (%)
Production (m3) 1151.2 141.0 (12) 323.8 44.0 (14) 10.3 4.1 (40) 71.6 18.4 (26)
Imports (m3) 103.5 12.9 (12) 87.8 8.1 (9) 2.4 0.8 (33) 18.4 6.7 (36)
Imports ($) 14794.8 3884.9 (26) 25322.1 3960.1 (15) 2992.8 849.8 (28) 10249.7 3863.1 (38)
Exports (m3) 54.5 11.8 (22) 83.0 10.0 (12) 2.4 0.8 (34) 21.9 8.0 (37)
Exports ($) 7678.5 2831.9 (36) 23518.8 3418.8 (15) 2792.7 863.4 (31) 11374.7 3828.1 (34)
Production
Following depressed global market conditions and widespread production curtailments in the wood processing sector, production of tropical industrial roundwood (logs) in ITTO member countries declined marginally to 141.0 million m3 in 2008 and 140.0 million m3 in 2009. The proportion of tropical logs to total industrial roundwood production from all forests in ITTO member countries was 12.2% in 2008, a small rise from the 2007 level. During the period 2007 to 2009 there were regional differences in production growth trends in ITTO producer regions, with Africa’s production increasing while those of Asia-Pacific and Latin America had declined. Regional disparities in the rate of domestic conversion of primary products continued with Latin America’s conversion of domestically produced logs to at least primary products being highest of the three regions, remaining at over 99% in 2007-2009. In Africa, despite measures to promote value-added processing in some countries, the proportion of all logs produced that were converted domestically dropped at an aggregate regional level from 82.5% in 2008 to 81.2% in 2009. Asia-Pacific’s domestic log processing rose from 90.4% to 91.1% over the same period, reflecting increasing domestic demand for wood-based products resulting from population and economic growth, as well as greater emphasis on producing and exporting value-added products in the region.
Tropical sawnwood production by ITTO members increased slightly in 2008 and declined to 41.1 million m3 in 2009, with most of the decrease occurring in the Asian region. Production in Latin America grew 6% in 2008 with Brazil accounting for bulk of the increase, as high economic growth and construction demand fuelled an increase in domestic sawnwood demand. Although exports of tropical veneer were negatively impacted by the downturn in furnishing and furniture manufacturing in
most destination markets in 2008 and 2009, tropical veneer production in ITTO member countries increased over the period 2006 to 2009, reaching 4.1 million m3 in 2009. All regions experienced rising production although the largest gains were in the Asian region, where production climbed 11% in 2008.
ITTO producer countries’ tropical plywood production has been steadily falling since 2003, dropping to 12.2 million m3 in 2008, a year-on-year decline of 9%. Production curtailment and plant closures escalated in 2008 in all major producer countries in response to depressed demand in major consuming countries. Production is expected to have remained at low levels in 2009, based on data forecasts provided by members in mid-2009. Malaysia, China and Indonesia dominate tropical plywood production among ITTO countries, although Indonesia’s production has continuously dropped in recent years, mainly due to reduction in logging quotas and crackdowns on illegal log flows that have restricted log availability for plywood production. Indonesia ceded its position as the world’s largest producer of tropical plywood in 2004 to Malaysia.
Imports
China and India dominated tropical log imports in 2007 to 2009, although China’s imports declined while India’s import growth slowed during the period. Tropical hardwood log imports by ITTO consumer countries have been steadily declining over the last 5 years, dropping 14% in 2008 to 12.9 million m3 and expected to decline further to 11.0 million m3 in 2009. Most of this decrease is due to a sharp drop (19% to 5.6 million m3) in China and in most other significant ITTO importing countries as demand for raw material in the wood processing industries contracted. China’s sustained growth in tropical log imports until 2007 reflected her high economic growth rate and rising
(vi)
domestic consumption, sustained growth in exports of secondary processed wood products (SPWPs) and incentives for exports. However, as the global financial crisis took effect in 2008, China’s wood processing industry was impacted by reduced demand for exports of tropical processed wood products (mainly wooden furniture and plywood) to traditional export markets and by a reduction in tax rebates for some wood product export items (although they were partially reinstated in 2009). To a lesser extent, demand was also depressed by a downturn in the domestic construction industry, although a recovery in the housing sector has been reported in 2010. In 2010, domestic demand is expected to recover although export demand for China’s processed wood products remains uncertain, particularly in major traditional export markets such as the EU.
Major non-ITTO tropical log suppliers include the Solomon Islands and Equatorial Guinea, with their log exports in 2008 estimated at 1.3 million m3 and 272 000 m3 respectively. While tropical log imports declined in 2008 in most major importing countries, India, now the second largest importer, brought in 3.3 million m3, up marginally from 2007. Japan’s imports of tropical logs have been declining in recent years, dropping sharply to 0.7 million m3 in 2008 and 0.5 million m3 in 2009 as housing starts plunged, reducing construction activity and demand for plywood.
A significant feature of the tropical sawnwood trade is that most of the global trade (67%) is within the Asia region. Total ITTO imports declined to 8.1 million m3 in 2008 and are estimated to decline further in 2009 as demand conditions deteriorate in consuming countries. Although Thailand was the largest importer, with three-quarters of its imports from Malaysia, significant discrepancies between Thailand and Malaysia’s reported trade suggest that the reported data may be unreliable. China’s tropical sawnwood imports increased in 2009, with a recovery in domestic demand more than compensating for the depressed demand in China’s export oriented wood manufacturing industries. Malaysia’ imports plummeted to 374 000 m3 in 2008, 39% less than the previous year and over 60% less than the 2005 level. Malaysia’s suppliers were mostly from within the Asian region, with 87% of imports from Thailand, Indonesia and the Philippines. Total tropical sawnwood imports by EU countries dropped to 2.1 million m3 in 2008 with the decline worsening in late 2008. In 2009, as economic conditions in most EU countries continued to deteriorate and consumption declined further, tropical sawnwood imports plunged to 1.7 million m3, the lowest level that ITTO has recorded since documenting statistics on the tropical sawnwood trade. Serious setbacks in the construction sectors in Spain and Portugal resulted in significant declines in tropical sawnwood imports in both countries in 2008 and 2009.
Total ITTO tropical veneer imports contracted by 5% between 2007 and 2008 to 829 000 m3, and are expected to have fallen more rapidly (by 17%) in 2009, as demand
for veneer weakened in the furniture and furnishing industries in major importing countries. The Republic of Korea remained the largest ITTO tropical veneer importer in 2008, with imports totalling 164 000 m3, significantly less than the high of 249 000 m3 in 2005. Taiwan POC, Italy, France and China were also important ITTO tropical veneer importers in 2008. China’s imports (previously ITTO’s largest in the early 2000s) have continued to decline with China’s supply of tropical veneer now supplied predominantly by production from imported tropical logs.
Although tropical plywood imports by all ITTO member countries have been dropping continuously since 2004, imports dropped sharply in 2008 to 6.7 million m3, a year-on-year decline of 16%. Japan and the USA, the dominant importers of tropical plywood, together accounted for about half of total ITTO imports, although both countries’ imports fell sharply in 2008. The bulk of all tropical plywood imports are sourced from Malaysia and Indonesia, with most of the remainder from Brazil and China. Japan’s tropical plywood imports had fallen 25% in 2007 as a result of rising prices of imported Indonesian and Malaysian plywood and a dip in housing starts - caused by poor implementation of the new Building Standard Law. In 2008, housing starts did not recover as economic conditions deteriorated, resulting in a further slump in demand. In late 2009, with housing starts declining further and depressed prices, Malaysian suppliers were reportedly switching to other markets leading to severely reduced inventories in Japan. The downturn in the housing sector in the USA led to tropical plywood imports declining sharply in 2008 to 800 000 m3, down 44% on 2007. In 2008, imports from China and Malaysia – the two major supplying countries – decreased dramatically while Indonesia maintained its volume of US imports. In 2009, demand was expected to remain at depressed levels. Tropical plywood of Chinese origin was expected to be further challenged by growing demand for green building products given the general difficulty of tracking supply chains for environmental certification.
Exports
ITTO producer countries exported 11.8 million m3 of tropical logs in 2008 with Malaysia, the largest exporter, accounting for about 35% of the volume, down from almost three-quarters of the ITTO total in the early 1990s. In 2008, Malaysia’s tropical log exports contracted 8% on 2007 levels and 26% from 2005 levels, reflecting declining log production in line with government policy to implement sustainable forest management, continued emphasis on value-added processing and significant downturn in demand in some major consuming countries. Papua New Guinea, Gabon and Myanmar were the other significant log exporters, but Gabon’s log exports are expected to plummet in 2010 following the implementation of the log export ban. Tropical sawnwood exports by producer members in 2008 dropped 15% to 9.5 million m3 and are expected to have remained almost unchanged
(vii)
in 2009. Exports from the Latin American region fell from 2.2 million m3 in 2007 to 1.3 million m3 in 2008, with Brazil’s exports plunging as the currency continued to appreciate relative to the US dollar and as domestic demand grew and export demand waned. African exports also fell in 2008 (from 1.9 million m3 to 1.7 million m3), with significant declines in Côte d’Ivoire and Gabon. Malaysia, the largest tropical sawnwood exporter, recorded exports of 3.7 million m3 in 2008, constituting 37% of total ITTO producer member exports and an increase of 31% on the 2007 level. Nearly all of the increase can be attributed to a significant increase in exports to Thailand, the major market. Total ITTO producer member’s exports of veneer declined by 28% between 2007 and 2008 to 727 000 m3 and were expected to remain at a similar level in 2009. Malaysia continues to dominate exports, even though there was a large year-on-year decline (29%) in 2008, with exports dropping to 304 000 m3. Malaysia’s exports continue to be constrained by a declining availability of tropical log supplies to Malaysia’s veneer industry and the growth in domestic consumption of tropical veneer to support Malaysia’s expanding secondary processing industries. Tropical plywood exports from ITTO producer countries fell by 17% in 2008 to 7.3 million m3, the lowest level in ITTO’s statistical records. Malaysia (4.5 million m3) and Indonesia (2.1 million m3) accounted for over 80% of the total volume exported by ITTO members (8.0 million m3). Brazil and China (although not an ITTO producer) were also important tropical plywood exporters, although China’s exports fell to 210 000 m3 in 2008, a 50% decline on the previous year and a nearly 80% drop on the 2006 level. In 2009 and 2010, EU anti-dumping duties remain on Chinese okoumé-faced plywood while an EC review takes place. The export competitiveness of Chinese tropical plywood has also been affected by difficulties in supplying environmentally certified products from China due to the complexity of supply chains, quality concerns and rising production costs.
Prices
Price trends for some of the more important internationally traded species of West African logs (iroko, sapele and khaya) plunged in mid to late 2008 as the effects of the global economic downturn on demand took hold initially in the US and the UK followed by other EU markets. However, in 2009, although demand remained relatively low in the EU, prices remained firm (albeit at a relatively low level) or trended upward (in euros) as roundwood supplies and importer’s inventories dwindled because of low purchasing activity, and as suppliers diverted their exports to China and India, where demand had remained relatively stable.
Real log prices for Southeast Asian species (meranti, keruing and kapur) were impacted in early 2009 by deteriorating demand conditions in China, India, the Middle East and EU and plummeting ocean freight rates in response to movements in the price of crude oil, resulting in a rapid decline in log prices. In the UK market, during
the period of relatively high prices and limited supplies, buyers were forced to seek alternative species, reducing demand further. At the end of 2008, low demand in India was reported to have caused an excess supply of kapur (and keruing) on global markets, which contributed to further downward pressure on prices. During 2009, log prices remained stable at low levels as demand in all major markets remained depressed, resisting upward price pressure from rapidly increasing freight rates.
The demand for African mahogany sawnwood (khaya or acajou, one of the continent’s most valuable sawnwood export species) fell rapidly from mid-2008 arising from strong price competition between the African supplying countries – Ghana, Côte d’Ivoire, Gabon and Cameroon. Prices picked up again in 2009, reflecting restricted supplies, and the relatively small volumes being traded, with increases in ocean freight rates impacting CIF prices. Wawa (or obeche) sawnwood prices increased to a high in mid-2008, driven by strong demand for white timbers in the mouldings and sauna industries and a reduction in supply from Ghana. Real prices dipped to a low in February 2009 as prices were adjusted downwards in response to decreasing demand and comparatively high stocks in EU markets. From early 2009, prices trended upwards, again reflecting supply adjustments to match demand.
Until late 2007, prices for iroko sawnwood (or odum, currently West Africa’s most valuable sawnwood export species) remained relatively stable, reaching a high in mid-2008 before dropping in late 2008 and early 2009. Demand from UK and Irish importers – both major markets for iroko in the EU – were reported to be affected by very low demand in the building and carpentry sectors as their economies slowed in late 2008. The price volatility for iroko (and other tropical sawnwood species) during 2008 and 2009 reflects some reluctance by buyers to make long term purchase contracts during a period of economic uncertainty. Apart from a drop in September 2009, prices trended upwards through 2009, as production and supplies from producer countries remained low, with producers slowing production rather than increasing export volumes to demand constrained markets.
Prices for Malaysian dark red meranti sawnwood in the UK market rose considerably in early 2008, reaching a peak in mid-2008, with Asian suppliers to the EU benefiting, compared to African suppliers, from the weakness of the US dollar during this period. In late 2008, prices began to slide in US dollar terms although rising in UK pounds to the end of 2008, as Malaysian suppliers sought to push prices up in UK pounds (the currency in which dark red meranti sawnwood is traded) as it devalued steeply relative to the US dollar during this period. Prices declined in UK pounds from early 2009 until September 2009, as consumption weakened and as the UK currency strengthened. Prices trended upwards in US dollars until early 2010, with upward price pressure from rising freight costs and very limited supplies. Prices for Southeast Asian tropical plywood rose steadily to mid-2007 mainly
(viii)
due to supply-side constraints and robust demand in the US and the UK. Further price rises were prevented by competition from Chinese combi-plywood. Prices reached a plateau in the latter part of 2007 before sliding rapidly in the last quarter of 2008, as global demand weakened (including in Middle Eastern markets) and competition intensified between supply sources. By the end of 2009, real prices had dropped to the lowest levels in 3 years. At the end of 2009 and early 2010, Asian exporters were seeking to push up CIF prices on the basis of reduced supplies, improved demand in the Middle East and Japan and mounting freight rates. However, a continuation of depressed demand conditions has kept prices at relatively low levels.
In contrast to other plywood products, which have trended downwards because of reduced demand, FOB prices of Brazilian white virola destined for the US continued to rise in 2008 as Brazilian supplies were in short supply, with white virola plywood’s competitiveness increasing as the Brazilian currency weakened relative to the US dollar in 2008. With supplies remaining limited and sustained domestic demand, prices held in 2009 and early 2010, with upward price pressure from a strengthening Brazilian currency relative to the US dollar.
Secondary Products
In 2008, annual growth in world imports of SPWPs slowed significantly to 1%, even though it reached a record value of $92.5 billion. SPWP imports by many major importers such as the USA, Japan and some EU countries had declined. As markets began to shrink in major importing countries due to the weak demand caused by the global financial and economic crises, the growth of world’s imports of SPWPs slowed down significantly. This trend continued in the first half of 2009, suggesting a possible decline in annual global imports of SPWPs in 2009. Wooden furniture and parts constitutes more than 60% of global SPWP trade, followed by builder’s woodwork, other SPWPs, mouldings, and cane and bamboo furniture and parts.
Despite a significant (12%) drop on the previous year, the USA continued to dominate global SPWP imports, with $21 billion worth of imports in 2008, accounting for 27% of ITTO consumer imports and 23% of world imports. The dramatic drop in US imports was the major contributor to world SPWP import growth slowing to 1% in 2008, from nearly 20% in 2007. Germany continued to be the largest EU consumer with $6.8 billion, slightly up from last year. Following Germany, France’s imports increased
10%, replacing the UK as the second largest EU importer, while the UK and Italy’s SPWP imports declined. For the first time in the past 5 years, Japan’s imports declined by more than 3%.
Tropical countries continued to import comparatively smaller volumes of SPWP products. In 2008, ITTO producers imported $2.6 billion from the world, accounting for only 3% of the consumer imports but the import value had grown 40% on the previous year. Mexico, Singapore, Indonesia, Malaysia, India and Brazil were the major tropical importers of SPWP. Among tropical countries, Indonesia and Brazil increased their SPWP imports substantially during the same period.
ITTO consumers exported $68.2 billion of SPWPs in 2008, accounting for 75% of the world’s exports. With SPWP exports valued at $16.4 billion, China has continued to be the world’s largest exporter since 2003, accounting for 24% of ITTO consumers’ exports. However, due to weak demand from China’s major markets, particularly the decline in wooden furniture imports from the USA, the rapid growth of China’s SPWP exports appeared to slow down in 2008. The annual growth rate was less than 2%, compared with 20% on average over the past few years and this trend has continued in early 2009. Similarly, growth in the EU’s SPWP exports slowed, with Italy and Germany being the two major exporters in the EU. Poland maintained its fourth position, with exports growing 10% on the previous year.
SPWP exports from most of the major tropical exporters (except Vietnam) declined slightly in 2008. ITTO producers accounted for 12% of world SPWP exports in 2008, with the share remaining stable over the past three years. Asia-Pacific was the dominant ITTO producer region, accounting for more than 70% of ITTO producers’ exports, followed by Latin America (28%). African SPWP exports remain at very low levels. Vietnam’s SPWP exports have expanded significantly in recent years and in 2007 it became the largest tropical exporter of SPWPs. Although figures for 2009 are unavailable, anecdotal reports suggest that Vietnam has maintained its export growth despite the downturn in global markets. In 2008, Vietnam’s SPWP exports reached $3.4 billion, 13% up on 2007. Following Vietnam, ITTO producer countries including Indonesia, Malaysia, Brazil, Thailand, the Philippines and Mexico, were all major exporters of SPWPs. ITTO producers continued to play a more significant role in global mouldings exports compared with exports of other SPWP items, accounting for almost 30% of world exports of wooden mouldings in 2008.
1
1. INTRODUCTION
Overview
This report reviews developments in the global timber sector and wood markets, with a focus on tropical timber, in 2009. It contains data series on production and trade for 2005-2009, with a focus on the past three years. The year 2008 is used as the base for all global comparisons and ITTO summary totals as this is the latest year for which reasonably reliable data for most countries were available at the time of preparation.
Scope and Structure
This Review includes data appendices on total timber production volumes and trade volumes/values for all ITTO members. These data are included to assist placing tropical timber in a global context, as called for in the ITTA (1994). However, as recommended by the 1997 Technical Working Group on ITTO’s Statistical Functions, the focus of the Review remains on tropical timber. The Review consists of five substantive chapters. This chapter summarizes developments in major markets for tropical timber, including a discussion of current and projected economic conditions in ITTO regions. The second chapter provides an analysis of production, consumption, trade and prices for the primary tropical timber products covered by the ITTA (tropical logs, sawnwood, veneer and plywood). The third chapter describes trade in secondary processed wood products (SPWPs) with a focus on tropical countries where these products are playing an ever greater role. For the first time, the Review provides summaries of two important ITTO work programme activities on tropical timber markets, with chapter four analyzing the competitiveness of tropical timbers and chapter five summarizing predictions of the future outlook for the tropical timber market.
Data Sources and Limitations
Statistics in the Review have been derived from members’ responses to the 2009 Joint Forest Sector Questionnaire (JQ) wherever possible; the JQ can be downloaded from the ITTO website (www.itto.int) and includes definitions of all products covered here. ITTO is responsible for sending the JQ to all of its producer members and Japan, while responses from other consumer members are forwarded from JQ partner agencies (UNECE, Eurostat and FAO). The number of country responses (40 replies from 60 members) and quality of responses were down slightly on the 2009 JQ. Only 15 of 33 producer countries (18 of 33 in 2008) responded, while 25 of 27 consumer countries provided at least partial responses in 2009. Australia, Bolivia, Cambodia, Cameroon, Central African Republic, Democratic Republic of Congo, Republic of Congo, Côte d’Ivoire, Fiji, Gabon, Guatemala, Malaysia, Myanmar, Nepal, Nigeria, Peru, Thailand, Togo, Vanuatu and Venezuela did not respond to the 2009 JQ.
Unless otherwise indicated, all value units quoted in this Review are in nominal US dollars, while volumes are reported in cubic metres. “Tropical timber,” as defined in ITTOs governing treaty (ITTA, 1994), includes only tropical hardwood saw and veneer logs, sawnwood, veneer and plywood. This Review includes tropical softwoods (coniferous species), which are of growing importance to many countries, in the figures given for all timbers. As trade figures for saw and veneer logs are impossible to collect from existing customs classification systems, which do not distinguish between different types of industrial roundwood, figures for log trade and production given in the Review now refer to total industrial roundwood.
Estimates of trade figures for Hong Kong, Macau Special Administrative Regions (SAR) and Taiwan Province of China (POC) have been largely based on UN COMTRADE data (if available) since none of the three provide statistics directly to ITTO. Trade flow statistics for many developed countries are also derived from COMTRADE since most developed countries do not complete the direction of trade tables in the JQ. This often gives rise to difficulties when the aggregate totals given by the countries in the JQ do not match with the corresponding trade figures reported in these databases.
As in previous years, many of the statistics that were received from members via the JQ contained significant and obvious errors in one or more data categories. 9 producer and 16 consumer members met the 30 September 2009 deadline for responding to the JQ and some of the remaining 15 responses were received at ITTO Secretariat as late as March 2010, thereby depriving the Secretariat of sufficient time for analysis and clarification where necessary. Table 2 shows a breakdown of responses to the JQ, illustrating the problems that many countries still encounter in providing information to ITTO and in providing a subjective indicator of the quality of the data on which this Review is based.
Many members substantially revised statistics for 2006-2008 in the 2009 JQ they submitted. This, together with the detection of errors, resulted in several modifications and amendments to statistics; the data series presented here can differ (even substantially) from those in previous editions of the Review. Several supplementary sources were consulted to verify members’ responses to the JQ, to fill in incomplete or obviously incorrect responses and to provide data for non-responding countries.
These supplementary sources are listed in the References. Estimates of production and trade are, where possible, derived for incomplete responses and non responding countries based on direction of trade statistics reported by trading partners, information on processing capacity (if available) and the other sources listed. Comparisons with
2
Table 1.1. Data Quality Indicators
No responses:(20 of 60 countries)
Australia, Bolivia, Cambodia, Cameroon, Central African Republic, Democratic Republic of Congo, Republic of Congo, Côte d’Ivoire, Fiji, Gabon, Guatemala, Malaysia, Myanmar, Nepal, Nigeria, Peru, Thailand, Togo, Vanuatu, Venezuela.
Good responses:(27 of 40 countries)
Austria, Brazil, Canada, China, Colombia, Ecuador, Finland, France, Ghana, Guyana, Honduras, Ireland, Italy, Japan, Republic of Korea, Mexico, Netherlands, New Zealand, Norway, Panama, Philippines, Poland, Portugal, Spain, Suriname, Trinidad and Tobago, USA.●All major sections complete.●Internally consistent (material balance, year on year trends, unit values, compatibility between tables).●More or less consistent with trade partner reports.
Incomplete or erroneous responses:(13 of 40 countries)
●Tropical trade data missing or unusable: 9 of 25 Consumer responses.●Tropical production data missing or unusable: 8 of 25 Consumer responses.●Production data missing or unusable: 7 of 15 Producer responses.●Tropical species trade data missing or unusable: 5 of 15 Producer responses; 14 of 25 Consumer responses.
global totals or totals for all tropical countries for primary products are based on statistics from the FAOSTAT database, the latest summary of global forest statistics available. All other data used in the preparation of the Review are compiled in Appendices 1 - 5.
Most members that responded to the 2009 JQ reported at least some categories of data for both 2008 and 2009. Many members were not able, however, to report any partial year data or forecasts for 2009; caution should therefore be exercised when interpreting the estimates for these countries and the ITTO totals for 2009 provided in this Review. Countries for which estimates were made (or alternate sources used) are identified by the superscripts used in the Appendices. Where countries provided estimates for 2009, an added uncertainty regarding the accuracy of these estimates has been about the timing of recovery of tropical timber markets from the impacts of the
global financial and economic crisis, the impact of which has been more pervasive and longer than anticipated. Despite the best efforts of the Secretariat to ensure data consistency and accuracy it should be noted that discrepancies exist between available data sources in many categories, for both producing and consuming countries.
The final statistics compiled for presentation here are the result of analysis and synthesis of the available data sources by the Secretariat, and of consultations with member countries and other agencies. The cooperation of those countries that responded to the 2009 Joint Forest Sector Questionnaire is gratefully acknowledged, as is the support of the FAO Forestry Department, the UNECE Timber Section, Eurostat Unit F-1, the United Nations Statistical Office, and the ITTO Market Information Service in providing relevant primary and supplementary data for the Review.
Market DevelopmentsEconomic Trends
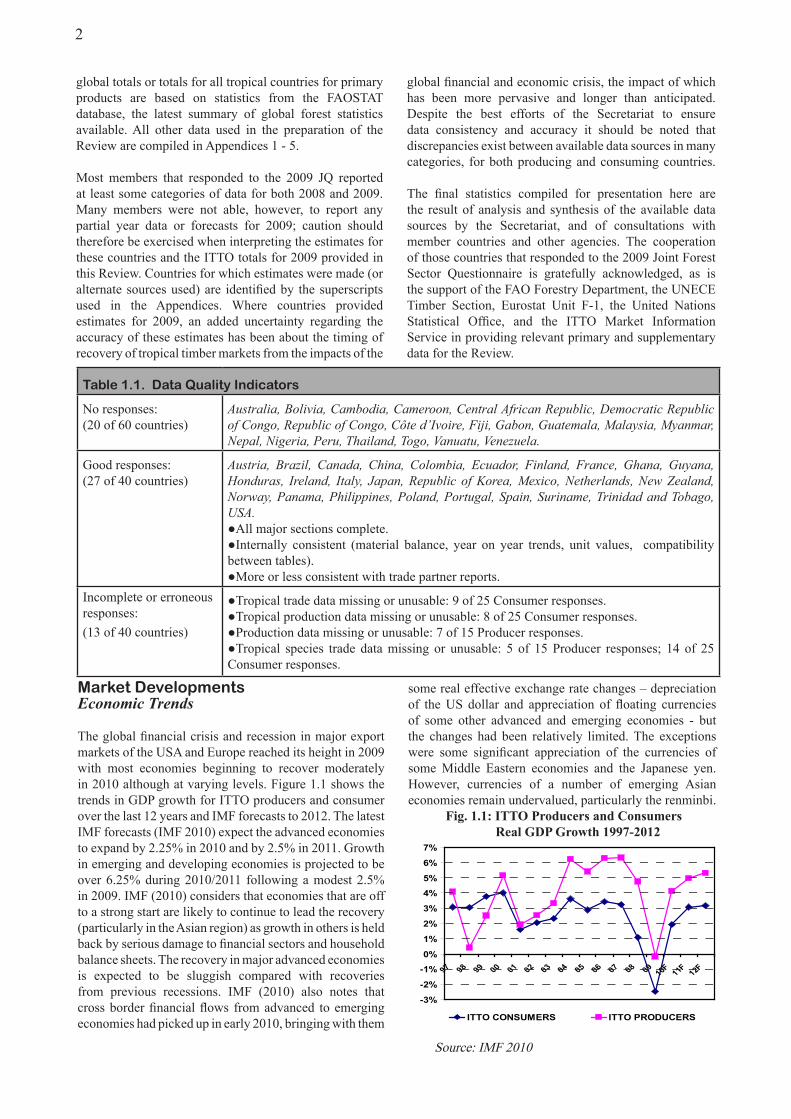
The global financial crisis and recession in major export markets of the USA and Europe reached its height in 2009 with most economies beginning to recover moderately in 2010 although at varying levels. Figure 1.1 shows the trends in GDP growth for ITTO producers and consumer over the last 12 years and IMF forecasts to 2012. The latest IMF forecasts (IMF 2010) expect the advanced economies to expand by 2.25% in 2010 and by 2.5% in 2011. Growth in emerging and developing economies is projected to be over 6.25% during 2010/2011 following a modest 2.5% in 2009. IMF (2010) considers that economies that are off to a strong start are likely to continue to lead the recovery (particularly in the Asian region) as growth in others is held back by serious damage to financial sectors and household balance sheets. The recovery in major advanced economies is expected to be sluggish compared with recoveries from previous recessions. IMF (2010) also notes that cross border financial flows from advanced to emerging economies had picked up in early 2010, bringing with them
some real effective exchange rate changes – depreciation of the US dollar and appreciation of floating currencies of some other advanced and emerging economies - but the changes had been relatively limited. The exceptions were some significant appreciation of the currencies of some Middle Eastern economies and the Japanese yen. However, currencies of a number of emerging Asian economies remain undervalued, particularly the renminbi.
-3%
-2%
-1%
0%
1%
2%
3%
4%
5%
6%
7%
97 98 99 00 01 02 03 04 05 06 07 08 0910F 11F 12F
ITTO CONSUMERS ITTO PRODUCERS
Fig..1.1:.ITTO.Producers.and.Consumers...........................Real.GDP.Growth.1997-2012
Source: IMF 2010
3
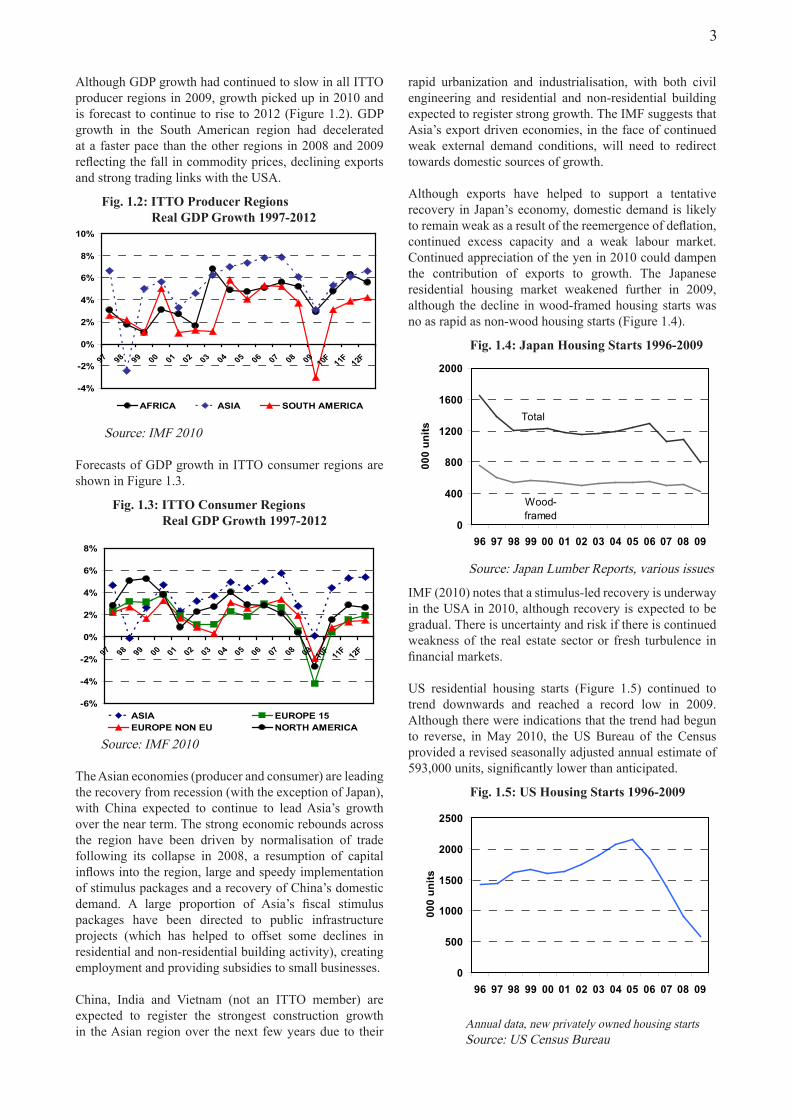
Although GDP growth had continued to slow in all ITTO producer regions in 2009, growth picked up in 2010 and is forecast to continue to rise to 2012 (Figure 1.2). GDP growth in the South American region had decelerated at a faster pace than the other regions in 2008 and 2009 reflecting the fall in commodity prices, declining exports and strong trading links with the USA.
Forecasts of GDP growth in ITTO consumer regions are shown in Figure 1.3.
The Asian economies (producer and consumer) are leading the recovery from recession (with the exception of Japan), with China expected to continue to lead Asia’s growth over the near term. The strong economic rebounds across the region have been driven by normalisation of trade following its collapse in 2008, a resumption of capital inflows into the region, large and speedy implementation of stimulus packages and a recovery of China’s domestic demand. A large proportion of Asia’s fiscal stimulus packages have been directed to public infrastructure projects (which has helped to offset some declines in residential and non-residential building activity), creating employment and providing subsidies to small businesses.
China, India and Vietnam (not an ITTO member) are expected to register the strongest construction growth in the Asian region over the next few years due to their
-4%
-2%
0%
2%
4%
6%
8%
10%
97 98 99 00 01 02 03 04 05 06 07 08 0910F 11F 12F
AFRICA ASIA SOUTH AMERICA
Fig..1.2:.ITTO.Producer.Regions..........................Real.GDP.Growth.1997-2012
Source: IMF 2010
-6%
-4%
-2%
0%
2%
4%
6%
8%
97 98 99 00 01 02 03 04 05 06 07 08 0910F 11F 12F
ASIA EUROPE 15 EUROPE NON EU NORTH AMERICA
Source: IMF 2010
Fig..1.3:.ITTO.Consumer.Regions..........................Real.GDP.Growth.1997-2012
rapid urbanization and industrialisation, with both civil engineering and residential and non-residential building expected to register strong growth. The IMF suggests that Asia’s export driven economies, in the face of continued weak external demand conditions, will need to redirect towards domestic sources of growth.
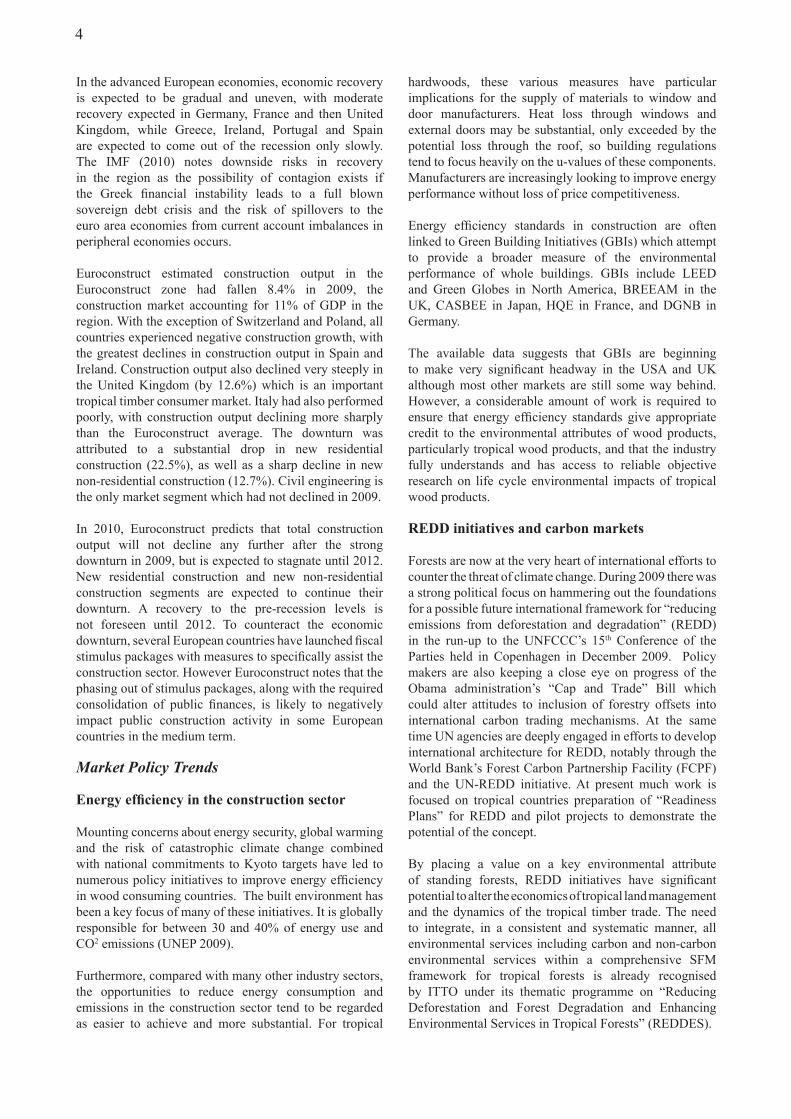
Although exports have helped to support a tentative recovery in Japan’s economy, domestic demand is likely to remain weak as a result of the reemergence of deflation, continued excess capacity and a weak labour market. Continued appreciation of the yen in 2010 could dampen the contribution of exports to growth. The Japanese residential housing market weakened further in 2009, although the decline in wood-framed housing starts was no as rapid as non-wood housing starts (Figure 1.4).
IMF (2010) notes that a stimulus-led recovery is underway in the USA in 2010, although recovery is expected to be gradual. There is uncertainty and risk if there is continued weakness of the real estate sector or fresh turbulence in financial markets.
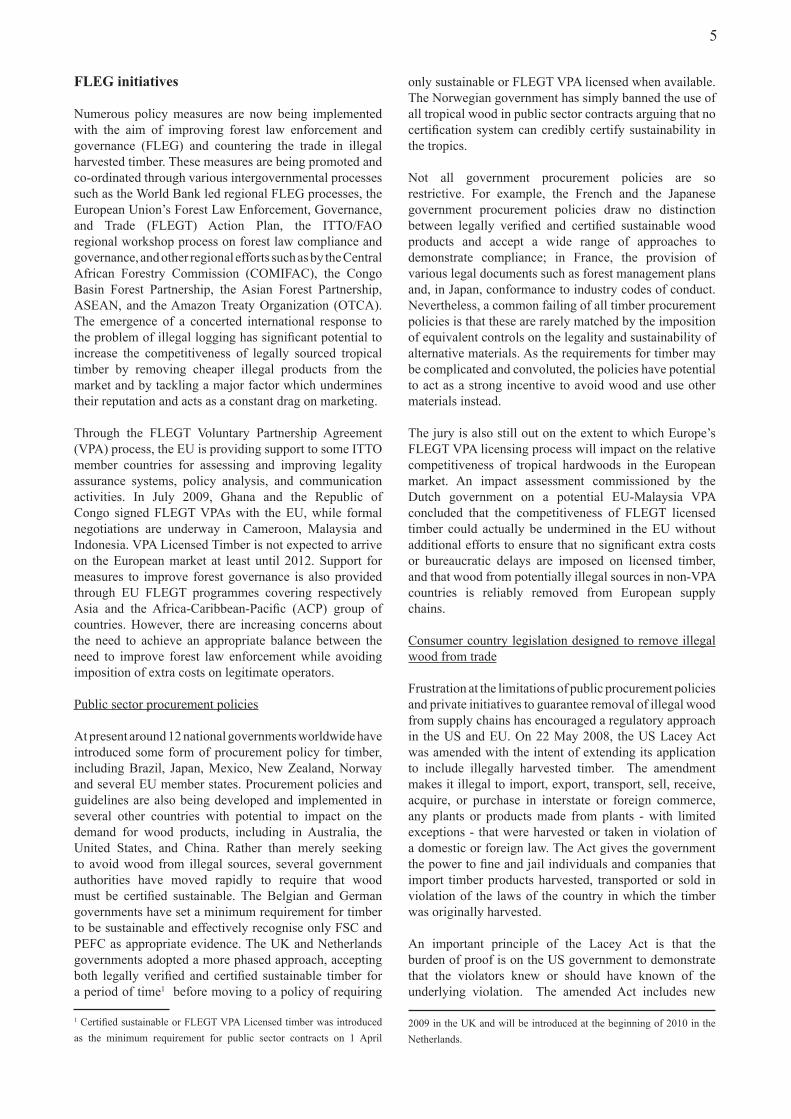
US residential housing starts (Figure 1.5) continued to trend downwards and reached a record low in 2009. Although there were indications that the trend had begun to reverse, in May 2010, the US Bureau of the Census provided a revised seasonally adjusted annual estimate of 593,000 units, significantly lower than anticipated.
Total
Wood-framed
0
400
800
1200
1600
2000
96 97 98 99 00 01 02 03 04 05 06 07 08 09
000
units
Fig..1.4:.Japan.Housing.Starts.1996-2009..........................
Source: Japan Lumber Reports, various issues
0
500
1000
1500
2000
2500
96 97 98 99 00 01 02 03 04 05 06 07 08 09
000
units
Fig..1.5:.US.Housing.Starts.1996-2009..........................
Annual data, new privately owned housing starts Source: US Census Bureau
4
hardwoods, these various measures have particular implications for the supply of materials to window and door manufacturers. Heat loss through windows and external doors may be substantial, only exceeded by the potential loss through the roof, so building regulations tend to focus heavily on the u-values of these components. Manufacturers are increasingly looking to improve energy performance without loss of price competitiveness.
Energy efficiency standards in construction are often linked to Green Building Initiatives (GBIs) which attempt to provide a broader measure of the environmental performance of whole buildings. GBIs include LEED and Green Globes in North America, BREEAM in the UK, CASBEE in Japan, HQE in France, and DGNB in Germany.
The available data suggests that GBIs are beginning to make very significant headway in the USA and UK although most other markets are still some way behind. However, a considerable amount of work is required to ensure that energy efficiency standards give appropriate credit to the environmental attributes of wood products, particularly tropical wood products, and that the industry fully understands and has access to reliable objective research on life cycle environmental impacts of tropical wood products.
REDD.initiatives.and.carbon.markets
Forests are now at the very heart of international efforts to counter the threat of climate change. During 2009 there was a strong political focus on hammering out the foundations for a possible future international framework for “reducing emissions from deforestation and degradation” (REDD) in the run-up to the UNFCCC’s 15th Conference of the Parties held in Copenhagen in December 2009. Policy makers are also keeping a close eye on progress of the Obama administration’s “Cap and Trade” Bill which could alter attitudes to inclusion of forestry offsets into international carbon trading mechanisms. At the same time UN agencies are deeply engaged in efforts to develop international architecture for REDD, notably through the World Bank’s Forest Carbon Partnership Facility (FCPF) and the UN-REDD initiative. At present much work is focused on tropical countries preparation of “Readiness Plans” for REDD and pilot projects to demonstrate the potential of the concept.
By placing a value on a key environmental attribute of standing forests, REDD initiatives have significant potential to alter the economics of tropical land management and the dynamics of the tropical timber trade. The need to integrate, in a consistent and systematic manner, all environmental services including carbon and non-carbon environmental services within a comprehensive SFM framework for tropical forests is already recognised by ITTO under its thematic programme on “Reducing Deforestation and Forest Degradation and Enhancing Environmental Services in Tropical Forests” (REDDES).
In the advanced European economies, economic recovery is expected to be gradual and uneven, with moderate recovery expected in Germany, France and then United Kingdom, while Greece, Ireland, Portugal and Spain are expected to come out of the recession only slowly. The IMF (2010) notes downside risks in recovery in the region as the possibility of contagion exists if the Greek financial instability leads to a full blown sovereign debt crisis and the risk of spillovers to the euro area economies from current account imbalances in peripheral economies occurs.
Euroconstruct estimated construction output in the Euroconstruct zone had fallen 8.4% in 2009, the construction market accounting for 11% of GDP in the region. With the exception of Switzerland and Poland, all countries experienced negative construction growth, with the greatest declines in construction output in Spain and Ireland. Construction output also declined very steeply in the United Kingdom (by 12.6%) which is an important tropical timber consumer market. Italy had also performed poorly, with construction output declining more sharply than the Euroconstruct average. The downturn was attributed to a substantial drop in new residential construction (22.5%), as well as a sharp decline in new non-residential construction (12.7%). Civil engineering is the only market segment which had not declined in 2009.
In 2010, Euroconstruct predicts that total construction output will not decline any further after the strong downturn in 2009, but is expected to stagnate until 2012. New residential construction and new non-residential construction segments are expected to continue their downturn. A recovery to the pre-recession levels is not foreseen until 2012. To counteract the economic downturn, several European countries have launched fiscal stimulus packages with measures to specifically assist the construction sector. However Euroconstruct notes that the phasing out of stimulus packages, along with the required consolidation of public finances, is likely to negatively impact public construction activity in some European countries in the medium term.
Market Policy Trends
Energy.efficiency.in.the.construction.sector
Mounting concerns about energy security, global warming and the risk of catastrophic climate change combined with national commitments to Kyoto targets have led to numerous policy initiatives to improve energy efficiency in wood consuming countries. The built environment has been a key focus of many of these initiatives. It is globally responsible for between 30 and 40% of energy use and CO2 emissions (UNEP 2009).
Furthermore, compared with many other industry sectors, the opportunities to reduce energy consumption and emissions in the construction sector tend to be regarded as easier to achieve and more substantial. For tropical
5
only sustainable or FLEGT VPA licensed when available. The Norwegian government has simply banned the use of all tropical wood in public sector contracts arguing that no certification system can credibly certify sustainability in the tropics.
Not all government procurement policies are so restrictive. For example, the French and the Japanese government procurement policies draw no distinction between legally verified and certified sustainable wood products and accept a wide range of approaches to demonstrate compliance; in France, the provision of various legal documents such as forest management plans and, in Japan, conformance to industry codes of conduct. Nevertheless, a common failing of all timber procurement policies is that these are rarely matched by the imposition of equivalent controls on the legality and sustainability of alternative materials. As the requirements for timber may be complicated and convoluted, the policies have potential to act as a strong incentive to avoid wood and use other materials instead.
The jury is also still out on the extent to which Europe’s FLEGT VPA licensing process will impact on the relative competitiveness of tropical hardwoods in the European market. An impact assessment commissioned by the Dutch government on a potential EU-Malaysia VPA concluded that the competitiveness of FLEGT licensed timber could actually be undermined in the EU without additional efforts to ensure that no significant extra costs or bureaucratic delays are imposed on licensed timber, and that wood from potentially illegal sources in non-VPA countries is reliably removed from European supply chains.
Consumer country legislation designed to remove illegal wood from trade
Frustration at the limitations of public procurement policies and private initiatives to guarantee removal of illegal wood from supply chains has encouraged a regulatory approach in the US and EU. On 22 May 2008, the US Lacey Act was amended with the intent of extending its application to include illegally harvested timber. The amendment makes it illegal to import, export, transport, sell, receive, acquire, or purchase in interstate or foreign commerce, any plants or products made from plants - with limited exceptions - that were harvested or taken in violation of a domestic or foreign law. The Act gives the government the power to fine and jail individuals and companies that import timber products harvested, transported or sold in violation of the laws of the country in which the timber was originally harvested.
An important principle of the Lacey Act is that the burden of proof is on the US government to demonstrate that the violators knew or should have known of the underlying violation. The amended Act includes new
2009 in the UK and will be introduced at the beginning of 2010 in the Netherlands.
FLEG.initiatives
Numerous policy measures are now being implemented with the aim of improving forest law enforcement and governance (FLEG) and countering the trade in illegal harvested timber. These measures are being promoted and co-ordinated through various intergovernmental processes such as the World Bank led regional FLEG processes, the European Union’s Forest Law Enforcement, Governance, and Trade (FLEGT) Action Plan, the ITTO/FAO regional workshop process on forest law compliance and governance, and other regional efforts such as by the Central African Forestry Commission (COMIFAC), the Congo Basin Forest Partnership, the Asian Forest Partnership, ASEAN, and the Amazon Treaty Organization (OTCA). The emergence of a concerted international response to the problem of illegal logging has significant potential to increase the competitiveness of legally sourced tropical timber by removing cheaper illegal products from the market and by tackling a major factor which undermines their reputation and acts as a constant drag on marketing.
Through the FLEGT Voluntary Partnership Agreement (VPA) process, the EU is providing support to some ITTO member countries for assessing and improving legality assurance systems, policy analysis, and communication activities. In July 2009, Ghana and the Republic of Congo signed FLEGT VPAs with the EU, while formal negotiations are underway in Cameroon, Malaysia and Indonesia. VPA Licensed Timber is not expected to arrive on the European market at least until 2012. Support for measures to improve forest governance is also provided through EU FLEGT programmes covering respectively Asia and the Africa-Caribbean-Pacific (ACP) group of countries. However, there are increasing concerns about the need to achieve an appropriate balance between the need to improve forest law enforcement while avoiding imposition of extra costs on legitimate operators.
Public sector procurement policies
At present around 12 national governments worldwide have introduced some form of procurement policy for timber, including Brazil, Japan, Mexico, New Zealand, Norway and several EU member states. Procurement policies and guidelines are also being developed and implemented in several other countries with potential to impact on the demand for wood products, including in Australia, the United States, and China. Rather than merely seeking to avoid wood from illegal sources, several government authorities have moved rapidly to require that wood must be certified sustainable. The Belgian and German governments have set a minimum requirement for timber to be sustainable and effectively recognise only FSC and PEFC as appropriate evidence. The UK and Netherlands governments adopted a more phased approach, accepting both legally verified and certified sustainable timber for a period of time1 before moving to a policy of requiring
1 Certified sustainable or FLEGT VPA Licensed timber was introduced as the minimum requirement for public sector contracts on 1 April
6
import declaration requirements that require information on the tree species of imported wood products and the name of the country where the timber was harvested. However it does not require the importer to have all of the information necessary to be certain of the legal origin of the wood. Instead the importer must collect information that, depending on what it suggests about the origin of the wood, should prompt further inquiry by the importer to assure its legality.
In October 2008, the European Commission proposed similar legislation that would oblige European operators who place timber and timber products for the first time on the Community market to apply a “due diligence system” designed to reduce the risk of illegal wood entering European supply chains. The expectation is that a law along these lines will be introduced sometime in 2010, with detailed requirements for due diligence systems being phased in over a period of years.
The impact of both pieces of legislation is still uncertain. It is not yet clear how successful the US authorities will be in bringing successful prosecutions under the Lacey Act given the challenges of establishing a reliable chain of evidence. The impact of the European law is likely to be heavily dependent on the specific requirements for due diligence systems introduced and the sanctions imposed, details that have yet to be worked out. In broad terms however, the new legislation in both the US and the EU is expected to encourage importers to seek further assurances – typically backed by independent third parties - that wood is from legal sources in areas or regions where the risk of illegal logging is judged to be high, while imposing few extra demands on wood suppliers in regions where the risk
of illegal logging is judged to be low. Since illegal logging is widely perceived to be a more serious issue in tropical countries, the new requirements are likely to fall most heavily on suppliers of tropical wood products.
Corporate.Social.Responsibility
Corporate Social Responsibility (CSR) is an increasingly important component of global business strategy. Definitions of CSR vary but generally include references to voluntary actions by corporations, over and above compliance with legal requirements, to address the interests of wider society. The key implication of the CSR trend is that it considerably broadens the range of issues traditionally regarded as falling within the remit of corporate action. The UN Global Compact, which is used the basis of the CSR policies for many of the world’s largest companies, encompasses principles covering human rights, labour standards, environment, and anti-corruption2.
Whilst the rapid emergence of CSR activities, which is particularly prominent amongst larger companies in consumer countries, may be seen as detrimental to the international competitiveness of the tropical wood industry, there are opportunities that CSR policies will demand a more rational and informed decision-making approach on balancing the impacts of different materials and taking account of broader issues such as community development. An implication of the rise of CSR is that it heightens the importance of engagement by all materials supplying sectors, including the tropical timber sector, in various initiatives now underway to guide and harmonise CSR procedures and standards.2 See http://www.unglobalcompact.org
7
2. PRODUCTION, TRADE AND PRICES OF PRIMARY PRODUCTS
Highlights
● Following depressed global market demand, trade in tropical roundwood, sawnwood, veneer and plywood plunged in 2008 and remained at low levels in 2009.
● China and India dominated tropical log imports in 2007 to 2009, although China’s imports declined while India’s growth slowed during the period. In the medium term, tropical roundwood demand in both China and India is expected to be sustained by their strong domestic markets, stimulated by high economic growth and incentives to both countries’ building industries.
● China’s tropical sawnwood imports increased in 2009, with domestic demand more than compensating for the depressed demand from China’s export-oriented wood remanufacturing industries.
● Japan’s tropical wood product imports were impacted by a 28% plunge in housing starts in 2009 which reduced construction activity and dampened demand for tropical primary wood products.
● In 2009, as economic conditions in most EU countries continued to deteriorate and consumption declined further, tropical sawnwood imports into EU plunged to 1.7 million m3, the lowest level that ITTO has recorded since documenting statistics on the tropical sawnwood trade.
● Log exports from African countries declined in 2008 as log export restrictions became tighter and demand dwindled, particularly in EU markets. In 2009, as the impact of the global recession resulted in significant reduction of wood processing production capacity, log export regulations were relaxed in many African producer countries to maintain revenues and business under poor trading conditions.
● Although tropical producer countries, particularly in the African region, are under-represented in the global supply of environmentally certified wood products, the increase in area of certified forest concessions in West Africa and the Congo Basin (Republic of Congo, Gabon and Cameroon), from a zero base in 2006 to around 5 million ha. in 2009, implies that an increase in production of certified wood products from the African region is expected.
● Gabon introduced a log export ban in 2010 which is expected to lead to a readjustment of sources of supply and prices in 2010, with significant impacts on the tropical plywood industries in China and France, which use significant volumes of okoumé veneers.
● Some price volatility was evident for tropical primary wood products during 2008 and 2009 reflecting some reluctance by buyers to make long term forward purchasing contracts during a period of economic uncertainty in addition to fluctuations in exchange rates and the cost of ocean freight.
● Although wood product prices trended downwards because of the unfavourable demand conditions, tropical exporters restricted supplies to meet the weak demand conditions, preventing prices from falling further.
● In 2009, demand for African roundwood species remained relatively low in the EU, but prices remained firm (albeit at a relatively low level) or trended upward (in euros) as roundwood supplies and importers’ inventories dwindled because of low purchasing activity, and as suppliers diverted their exports to China and India, where demand had remained relatively stable.
8
exporting region are contained in Appendix 4 and serve as the basis for the analyses presented here. Nominal prices were reported biweekly by the ITTO/International Trade Center Market News Service (MNS) from 1990 until the end of 1995, and have continued to be reported by the ITTO Market Information Service (MIS) from then onwards. The nominal price series from these sources were converted to real 1990 US dollars using IMF exchange rate series and the IMF Consumer Price Index (CPI) for industrial countries. Both nominal and real price trends are given in Appendix 4.
As not all species are reported regularly, and since the MIS has added coverage of new products/species, some price series commence later than 1990 and may contain gaps. An attempt has been made to prepare price trend charts for a range of species/products identified as important in international trade. However, the products covered in the Review’s price trend analyses may change from year to year since some species may drop out of regular international trade due to export bans or restrictions. Species are identified by internationally accepted pilot/trade and scientific names; the local names of timber species used by producer countries, where they differ from pilot/trade names, are given in Appendix 3.
Average prices for species/products traded in 2007-2008 are also included in Appendix 3 for those countries that provided this data in the 2009 JFSQ. No attempt has been made to adjust or verify these nominal prices. Finally, Appendix 1 contains the average unit values of exports and imports for all products and countries in 2007-2008. These figures are highly aggregated based on total value and volume trade statistics and therefore include all species, grades and markets for each product. They are also, in many cases, based on estimates due to poor responses on trade values in the JFSQ.
Average prices for species/products traded in 2007-2008 are also included in Appendix 3 for those countries that provided this data in the 2009 JFSQ. No attempt has been made to adjust or verify these nominal prices. Finally, Appendix 1 contains the average unit values of exports and imports for all products and countries in 2007-2008. These figures are highly aggregated based on total value and volume trade statistics and therefore include all species, grades and markets for each product. They are also, in many cases, based on estimates due to poor responses on trade values in the JFSQ.
Industrial Roundwood
ProductionFollowing depressed global market conditions, the production of tropical industrial roundwood (“logs”) in ITTO producer member countries declined in 2008 and 2009, reaching 134.8 million m3 in 2009 (down from 137.4 million m3 in 2007). Figure 2.1 shows ITTO’s five major tropical log producers for 2007-2009, ranked by 2008 production, as well as aggregate production by all
This chapter provides statistics on production and trade of primary tropical forest products in ITTO producer and consumer countries, as well as price trends for selected products. Appendix 6 contains the Market Statement released in October 2009 by the UNECE/FAO Timber Committee, providing an overview of developments in important markets for non-tropical primary timber products.
Data Sources and Conventions
Data on production presented here has been derived from JFSQ returns and supplemented by other available data sources (see Appendix 1). Production statistics in many ITTO member countries are often weak or non-existent. Many producer countries lack systems to measure both forest and industrial outputs, while many consumer countries are unable or unwilling to distinguish the processing of tropical timber from all timber processing. In several cases, production figures have been derived from available log supply. Apparent domestic consumption (production plus imports minus exports) statistics do not include changes in stock levels, which in the past were generally not reported or reported incorrectly by countries and which are therefore no longer collected.
As in previous years, production figures for many countries (including important producers like Cameroon, Republic of Congo, Côte d’Ivoire, India, Nigeria, Myanmar and Papua New Guinea) were either not provided or unusable in 2009 and have been estimated from other sources and/or trade levels (if reported). Production figures for these countries should therefore be viewed with caution. Some countries (e.g. Honduras, Venezuela) include tropical softwoods in the production data reported to ITTO. Where distinguished, these products were included in the figures for all timbers but not for tropical timber in Appendix 1. Several countries (e.g. Brazil, Indonesia) are reported by various sources to have high levels of “unofficial” industrial roundwood production. Unless estimates of such “unofficial” production could be independently verified, only official production figures are presented here.
The following sections also report on exports, imports and price trends for each of the four primary tropical timber product categories covered by the ITTA. Detailed trade statistics are presented in Appendices 1 and 2, with data sources given in the notes preceding the Appendices. Major species in trade, together with volumes and average prices when these were reported, are summarized by country in Appendix 3. An emerging challenge in analyzing trade data for tropical wood products has been the increase in trade between countries that do not provide trade data to COMTRADE and do not provide JQ returns. In these cases, the Secretariat provides estimates based on the best alternative sources of information available at the time of publication. Price trends through late 2009 for several important tropical log and sawnwood species and various grades and thicknesses of plywood from each
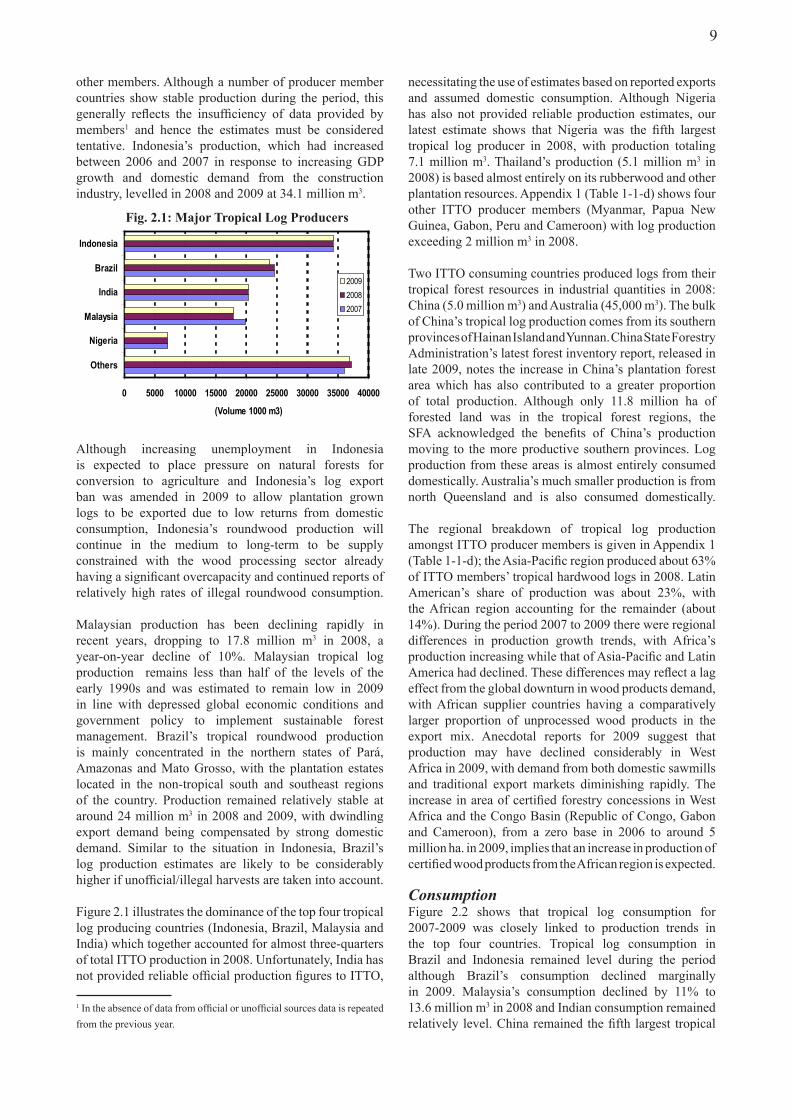
9
necessitating the use of estimates based on reported exports and assumed domestic consumption. Although Nigeria has also not provided reliable production estimates, our latest estimate shows that Nigeria was the fifth largest tropical log producer in 2008, with production totaling 7.1 million m3. Thailand’s production (5.1 million m3 in 2008) is based almost entirely on its rubberwood and other plantation resources. Appendix 1 (Table 1-1-d) shows four other ITTO producer members (Myanmar, Papua New Guinea, Gabon, Peru and Cameroon) with log production exceeding 2 million m3 in 2008.
Two ITTO consuming countries produced logs from their tropical forest resources in industrial quantities in 2008: China (5.0 million m3) and Australia (45,000 m3). The bulk of China’s tropical log production comes from its southern provinces of Hainan Island and Yunnan. China State Forestry Administration’s latest forest inventory report, released in late 2009, notes the increase in China’s plantation forest area which has also contributed to a greater proportion of total production. Although only 11.8 million ha of forested land was in the tropical forest regions, the SFA acknowledged the benefits of China’s production moving to the more productive southern provinces. Log production from these areas is almost entirely consumed domestically. Australia’s much smaller production is from north Queensland and is also consumed domestically.
The regional breakdown of tropical log production amongst ITTO producer members is given in Appendix 1 (Table 1-1-d); the Asia-Pacific region produced about 63% of ITTO members’ tropical hardwood logs in 2008. Latin American’s share of production was about 23%, with the African region accounting for the remainder (about 14%). During the period 2007 to 2009 there were regional differences in production growth trends, with Africa’s production increasing while that of Asia-Pacific and Latin America had declined. These differences may reflect a lag effect from the global downturn in wood products demand, with African supplier countries having a comparatively larger proportion of unprocessed wood products in the export mix. Anecdotal reports for 2009 suggest that production may have declined considerably in West Africa in 2009, with demand from both domestic sawmills and traditional export markets diminishing rapidly. The increase in area of certified forestry concessions in West Africa and the Congo Basin (Republic of Congo, Gabon and Cameroon), from a zero base in 2006 to around 5 million ha. in 2009, implies that an increase in production of certified wood products from the African region is expected.
ConsumptionFigure 2.2 shows that tropical log consumption for 2007-2009 was closely linked to production trends in the top four countries. Tropical log consumption in Brazil and Indonesia remained level during the period although Brazil’s consumption declined marginally in 2009. Malaysia’s consumption declined by 11% to 13.6 million m3 in 2008 and Indian consumption remained relatively level. China remained the fifth largest tropical
other members. Although a number of producer member countries show stable production during the period, this generally reflects the insufficiency of data provided by members1 and hence the estimates must be considered tentative. Indonesia’s production, which had increased between 2006 and 2007 in response to increasing GDP growth and domestic demand from the construction industry, levelled in 2008 and 2009 at 34.1 million m3.
Although increasing unemployment in Indonesia is expected to place pressure on natural forests for conversion to agriculture and Indonesia’s log export ban was amended in 2009 to allow plantation grown logs to be exported due to low returns from domestic consumption, Indonesia’s roundwood production will continue in the medium to long-term to be supply constrained with the wood processing sector already having a significant overcapacity and continued reports of relatively high rates of illegal roundwood consumption.
Malaysian production has been declining rapidly in recent years, dropping to 17.8 million m3 in 2008, a year-on-year decline of 10%. Malaysian tropical log production remains less than half of the levels of the early 1990s and was estimated to remain low in 2009 in line with depressed global economic conditions and government policy to implement sustainable forest management. Brazil’s tropical roundwood production is mainly concentrated in the northern states of Pará, Amazonas and Mato Grosso, with the plantation estates located in the non-tropical south and southeast regions of the country. Production remained relatively stable at around 24 million m3 in 2008 and 2009, with dwindling export demand being compensated by strong domestic demand. Similar to the situation in Indonesia, Brazil’s log production estimates are likely to be considerably higher if unofficial/illegal harvests are taken into account.
Figure 2.1 illustrates the dominance of the top four tropical log producing countries (Indonesia, Brazil, Malaysia and India) which together accounted for almost three-quarters of total ITTO production in 2008. Unfortunately, India has not provided reliable official production figures to ITTO,
1 In the absence of data from official or unofficial sources data is repeated from the previous year.
0 5000 10000 15000 20000 25000 30000 35000 40000
Others
Nigeria
Malaysia
India
Brazil
Indonesia
(Volume 1000 m3)
200920082007
.....Fig..2.1:.Major.Tropical.Log.Producers
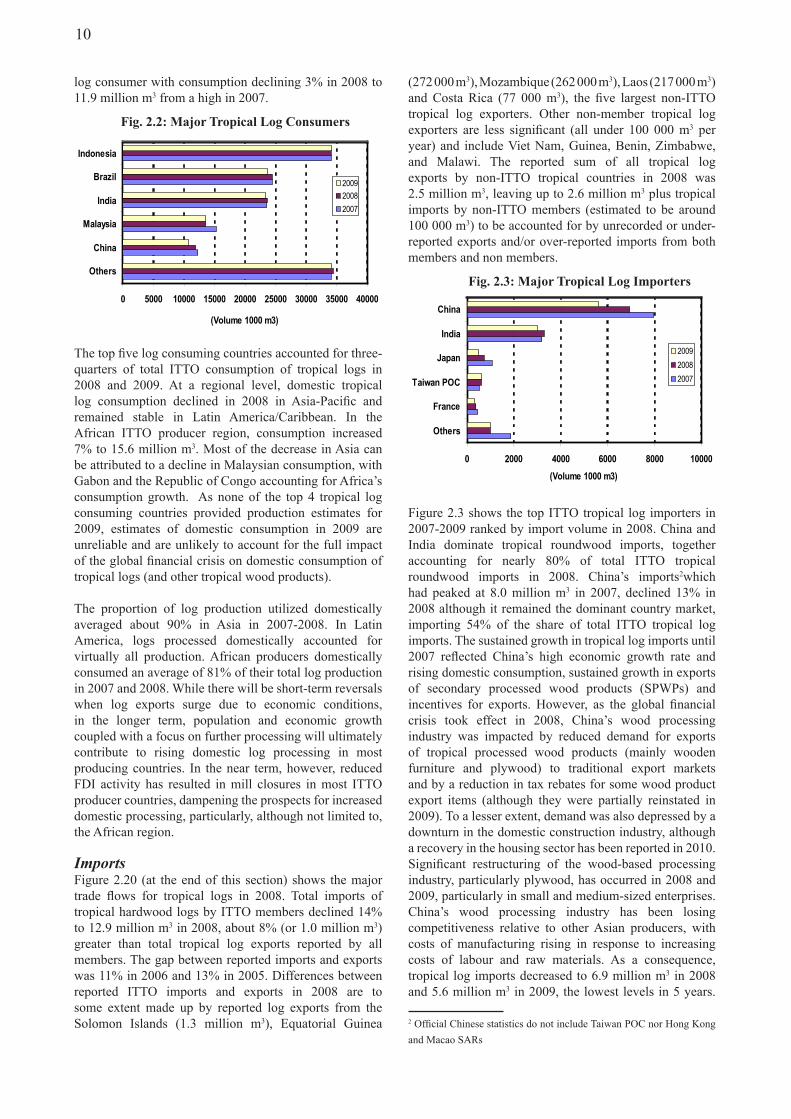
10
(272 000 m3), Mozambique (262 000 m3), Laos (217 000 m3) and Costa Rica (77 000 m3), the five largest non-ITTO tropical log exporters. Other non-member tropical log exporters are less significant (all under 100 000 m3 per year) and include Viet Nam, Guinea, Benin, Zimbabwe, and Malawi. The reported sum of all tropical log exports by non-ITTO tropical countries in 2008 was 2.5 million m3, leaving up to 2.6 million m3 plus tropical imports by non-ITTO members (estimated to be around 100 000 m3) to be accounted for by unrecorded or under-reported exports and/or over-reported imports from both members and non members.
0 2000 4000 6000 8000 10000
Others
France
Taiwan POC
Japan
India
China
(Volume 1000 m3)
200920082007
Figure 2.3 shows the top ITTO tropical log importers in 2007-2009 ranked by import volume in 2008. China and India dominate tropical roundwood imports, together accounting for nearly 80% of total ITTO tropical roundwood imports in 2008. China’s imports2which had peaked at 8.0 million m3 in 2007, declined 13% in 2008 although it remained the dominant country market, importing 54% of the share of total ITTO tropical log imports. The sustained growth in tropical log imports until 2007 reflected China’s high economic growth rate and rising domestic consumption, sustained growth in exports of secondary processed wood products (SPWPs) and incentives for exports. However, as the global financial crisis took effect in 2008, China’s wood processing industry was impacted by reduced demand for exports of tropical processed wood products (mainly wooden furniture and plywood) to traditional export markets and by a reduction in tax rebates for some wood product export items (although they were partially reinstated in 2009). To a lesser extent, demand was also depressed by a downturn in the domestic construction industry, although a recovery in the housing sector has been reported in 2010. Significant restructuring of the wood-based processing industry, particularly plywood, has occurred in 2008 and 2009, particularly in small and medium-sized enterprises. China’s wood processing industry has been losing competitiveness relative to other Asian producers, with costs of manufacturing rising in response to increasing costs of labour and raw materials. As a consequence, tropical log imports decreased to 6.9 million m3 in 2008 and 5.6 million m3 in 2009, the lowest levels in 5 years.
2 Official Chinese statistics do not include Taiwan POC nor Hong Kong and Macao SARs
log consumer with consumption declining 3% in 2008 to 11.9 million m3 from a high in 2007.
0 5000 10000 15000 20000 25000 30000 35000 40000
Others
China
Malaysia
India
Brazil
Indonesia
(Volume 1000 m3)
200920082007
The top five log consuming countries accounted for three-quarters of total ITTO consumption of tropical logs in 2008 and 2009. At a regional level, domestic tropical log consumption declined in 2008 in Asia-Pacific and remained stable in Latin America/Caribbean. In the African ITTO producer region, consumption increased 7% to 15.6 million m3. Most of the decrease in Asia can be attributed to a decline in Malaysian consumption, with Gabon and the Republic of Congo accounting for Africa’s consumption growth. As none of the top 4 tropical log consuming countries provided production estimates for 2009, estimates of domestic consumption in 2009 are unreliable and are unlikely to account for the full impact of the global financial crisis on domestic consumption of tropical logs (and other tropical wood products).
The proportion of log production utilized domestically averaged about 90% in Asia in 2007-2008. In Latin America, logs processed domestically accounted for virtually all production. African producers domestically consumed an average of 81% of their total log production in 2007 and 2008. While there will be short-term reversals when log exports surge due to economic conditions, in the longer term, population and economic growth coupled with a focus on further processing will ultimately contribute to rising domestic log processing in most producing countries. In the near term, however, reduced FDI activity has resulted in mill closures in most ITTO producer countries, dampening the prospects for increased domestic processing, particularly, although not limited to, the African region.
ImportsFigure 2.20 (at the end of this section) shows the major trade flows for tropical logs in 2008. Total imports of tropical hardwood logs by ITTO members declined 14% to 12.9 million m3 in 2008, about 8% (or 1.0 million m3) greater than total tropical log exports reported by all members. The gap between reported imports and exports was 11% in 2006 and 13% in 2005. Differences between reported ITTO imports and exports in 2008 are to some extent made up by reported log exports from the Solomon Islands (1.3 million m3), Equatorial Guinea
..............Fig..2.2:.Major.Tropical.Log.Consumers
..................Fig..2.3:.Major.Tropical.Log.Importers
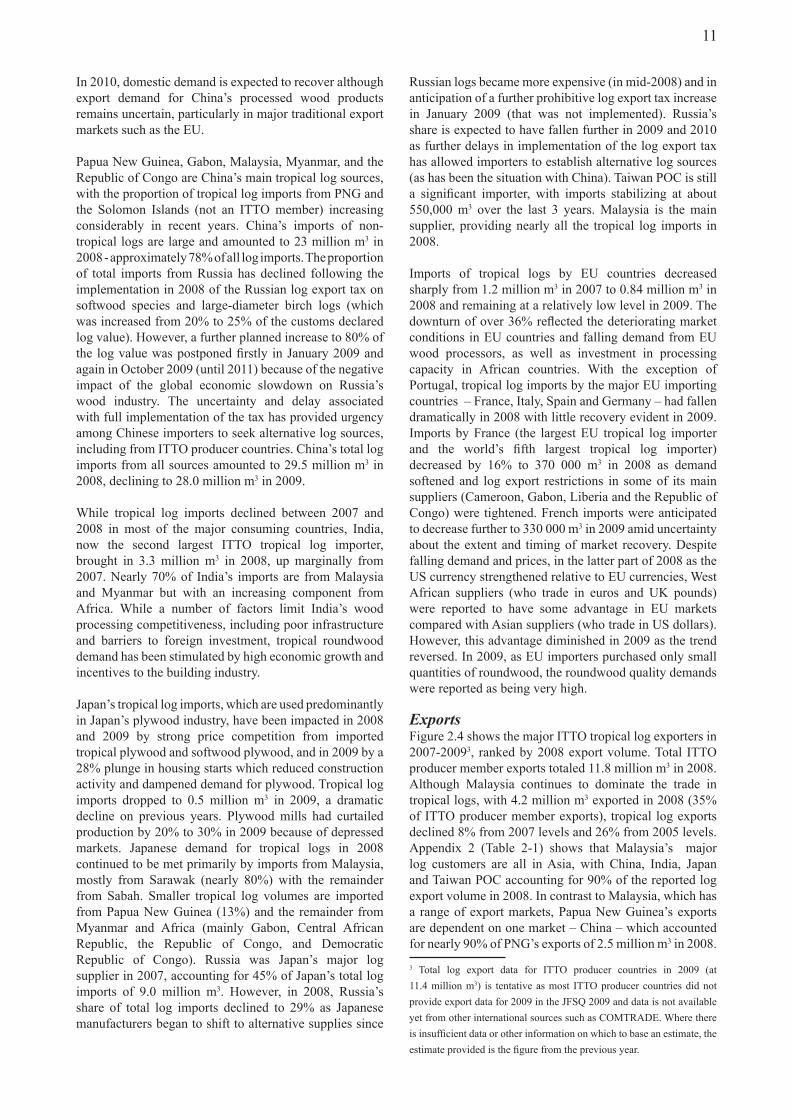
11
Russian logs became more expensive (in mid-2008) and in anticipation of a further prohibitive log export tax increase in January 2009 (that was not implemented). Russia’s share is expected to have fallen further in 2009 and 2010 as further delays in implementation of the log export tax has allowed importers to establish alternative log sources (as has been the situation with China). Taiwan POC is still a significant importer, with imports stabilizing at about 550,000 m3 over the last 3 years. Malaysia is the main supplier, providing nearly all the tropical log imports in 2008.
Imports of tropical logs by EU countries decreased sharply from 1.2 million m3 in 2007 to 0.84 million m3 in 2008 and remaining at a relatively low level in 2009. The downturn of over 36% reflected the deteriorating market conditions in EU countries and falling demand from EU wood processors, as well as investment in processing capacity in African countries. With the exception of Portugal, tropical log imports by the major EU importing countries – France, Italy, Spain and Germany – had fallen dramatically in 2008 with little recovery evident in 2009. Imports by France (the largest EU tropical log importer and the world’s fifth largest tropical log importer) decreased by 16% to 370 000 m3 in 2008 as demand softened and log export restrictions in some of its main suppliers (Cameroon, Gabon, Liberia and the Republic of Congo) were tightened. French imports were anticipated to decrease further to 330 000 m3 in 2009 amid uncertainty about the extent and timing of market recovery. Despite falling demand and prices, in the latter part of 2008 as the US currency strengthened relative to EU currencies, West African suppliers (who trade in euros and UK pounds) were reported to have some advantage in EU markets compared with Asian suppliers (who trade in US dollars). However, this advantage diminished in 2009 as the trend reversed. In 2009, as EU importers purchased only small quantities of roundwood, the roundwood quality demands were reported as being very high.
ExportsFigure 2.4 shows the major ITTO tropical log exporters in 2007-20093, ranked by 2008 export volume. Total ITTO producer member exports totaled 11.8 million m3 in 2008. Although Malaysia continues to dominate the trade in tropical logs, with 4.2 million m3 exported in 2008 (35% of ITTO producer member exports), tropical log exports declined 8% from 2007 levels and 26% from 2005 levels. Appendix 2 (Table 2-1) shows that Malaysia’s major log customers are all in Asia, with China, India, Japan and Taiwan POC accounting for 90% of the reported log export volume in 2008. In contrast to Malaysia, which has a range of export markets, Papua New Guinea’s exports are dependent on one market – China – which accounted for nearly 90% of PNG’s exports of 2.5 million m3 in 2008. 3 Total log export data for ITTO producer countries in 2009 (at 11.4 million m3) is tentative as most ITTO producer countries did not provide export data for 2009 in the JFSQ 2009 and data is not available yet from other international sources such as COMTRADE. Where there is insufficient data or other information on which to base an estimate, the estimate provided is the figure from the previous year.
In 2010, domestic demand is expected to recover although export demand for China’s processed wood products remains uncertain, particularly in major traditional export markets such as the EU.
Papua New Guinea, Gabon, Malaysia, Myanmar, and the Republic of Congo are China’s main tropical log sources, with the proportion of tropical log imports from PNG and the Solomon Islands (not an ITTO member) increasing considerably in recent years. China’s imports of non-tropical logs are large and amounted to 23 million m3 in 2008 - approximately 78% of all log imports. The proportion of total imports from Russia has declined following the implementation in 2008 of the Russian log export tax on softwood species and large-diameter birch logs (which was increased from 20% to 25% of the customs declared log value). However, a further planned increase to 80% of the log value was postponed firstly in January 2009 and again in October 2009 (until 2011) because of the negative impact of the global economic slowdown on Russia’s wood industry. The uncertainty and delay associated with full implementation of the tax has provided urgency among Chinese importers to seek alternative log sources, including from ITTO producer countries. China’s total log imports from all sources amounted to 29.5 million m3 in 2008, declining to 28.0 million m3 in 2009.
While tropical log imports declined between 2007 and 2008 in most of the major consuming countries, India, now the second largest ITTO tropical log importer, brought in 3.3 million m3 in 2008, up marginally from 2007. Nearly 70% of India’s imports are from Malaysia and Myanmar but with an increasing component from Africa. While a number of factors limit India’s wood processing competitiveness, including poor infrastructure and barriers to foreign investment, tropical roundwood demand has been stimulated by high economic growth and incentives to the building industry.
Japan’s tropical log imports, which are used predominantly in Japan’s plywood industry, have been impacted in 2008 and 2009 by strong price competition from imported tropical plywood and softwood plywood, and in 2009 by a 28% plunge in housing starts which reduced construction activity and dampened demand for plywood. Tropical log imports dropped to 0.5 million m3 in 2009, a dramatic decline on previous years. Plywood mills had curtailed production by 20% to 30% in 2009 because of depressed markets. Japanese demand for tropical logs in 2008 continued to be met primarily by imports from Malaysia, mostly from Sarawak (nearly 80%) with the remainder from Sabah. Smaller tropical log volumes are imported from Papua New Guinea (13%) and the remainder from Myanmar and Africa (mainly Gabon, Central African Republic, the Republic of Congo, and Democratic Republic of Congo). Russia was Japan’s major log supplier in 2007, accounting for 45% of Japan’s total log imports of 9.0 million m3. However, in 2008, Russia’s share of total log imports declined to 29% as Japanese manufacturers began to shift to alternative supplies since
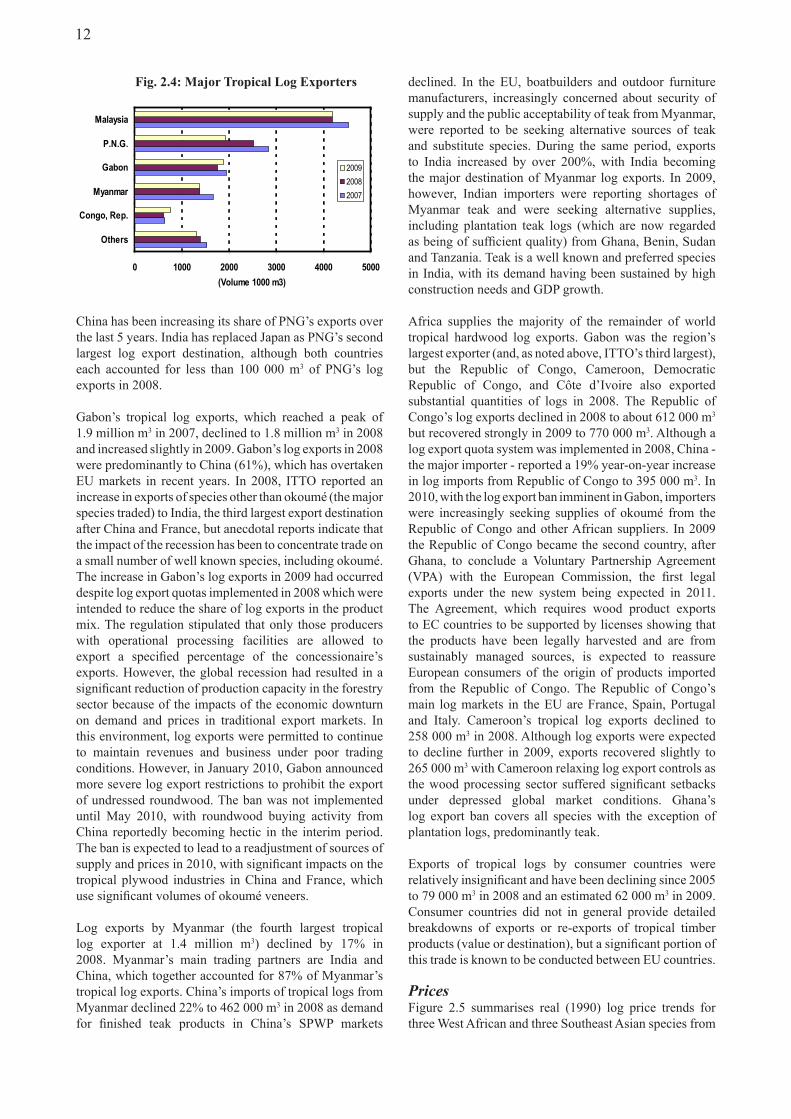
12
declined. In the EU, boatbuilders and outdoor furniture manufacturers, increasingly concerned about security of supply and the public acceptability of teak from Myanmar, were reported to be seeking alternative sources of teak and substitute species. During the same period, exports to India increased by over 200%, with India becoming the major destination of Myanmar log exports. In 2009, however, Indian importers were reporting shortages of Myanmar teak and were seeking alternative supplies, including plantation teak logs (which are now regarded as being of sufficient quality) from Ghana, Benin, Sudan and Tanzania. Teak is a well known and preferred species in India, with its demand having been sustained by high construction needs and GDP growth.
Africa supplies the majority of the remainder of world tropical hardwood log exports. Gabon was the region’s largest exporter (and, as noted above, ITTO’s third largest), but the Republic of Congo, Cameroon, Democratic Republic of Congo, and Côte d’Ivoire also exported substantial quantities of logs in 2008. The Republic of Congo’s log exports declined in 2008 to about 612 000 m3 but recovered strongly in 2009 to 770 000 m3. Although a log export quota system was implemented in 2008, China - the major importer - reported a 19% year-on-year increase in log imports from Republic of Congo to 395 000 m3. In 2010, with the log export ban imminent in Gabon, importers were increasingly seeking supplies of okoumé from the Republic of Congo and other African suppliers. In 2009 the Republic of Congo became the second country, after Ghana, to conclude a Voluntary Partnership Agreement (VPA) with the European Commission, the first legal exports under the new system being expected in 2011. The Agreement, which requires wood product exports to EC countries to be supported by licenses showing that the products have been legally harvested and are from sustainably managed sources, is expected to reassure European consumers of the origin of products imported from the Republic of Congo. The Republic of Congo’s main log markets in the EU are France, Spain, Portugal and Italy. Cameroon’s tropical log exports declined to 258 000 m3 in 2008. Although log exports were expected to decline further in 2009, exports recovered slightly to 265 000 m3 with Cameroon relaxing log export controls as the wood processing sector suffered significant setbacks under depressed global market conditions. Ghana’s log export ban covers all species with the exception of plantation logs, predominantly teak.
Exports of tropical logs by consumer countries were relatively insignificant and have been declining since 2005 to 79 000 m3 in 2008 and an estimated 62 000 m3 in 2009. Consumer countries did not in general provide detailed breakdowns of exports or re-exports of tropical timber products (value or destination), but a significant portion of this trade is known to be conducted between EU countries.
PricesFigure 2.5 summarises real (1990) log price trends for three West African and three Southeast Asian species from
China has been increasing its share of PNG’s exports over the last 5 years. India has replaced Japan as PNG’s second largest log export destination, although both countries each accounted for less than 100 000 m3 of PNG’s log exports in 2008.
Gabon’s tropical log exports, which reached a peak of 1.9 million m3 in 2007, declined to 1.8 million m3 in 2008 and increased slightly in 2009. Gabon’s log exports in 2008 were predominantly to China (61%), which has overtaken EU markets in recent years. In 2008, ITTO reported an increase in exports of species other than okoumé (the major species traded) to India, the third largest export destination after China and France, but anecdotal reports indicate that the impact of the recession has been to concentrate trade on a small number of well known species, including okoumé. The increase in Gabon’s log exports in 2009 had occurred despite log export quotas implemented in 2008 which were intended to reduce the share of log exports in the product mix. The regulation stipulated that only those producers with operational processing facilities are allowed to export a specified percentage of the concessionaire’s exports. However, the global recession had resulted in a significant reduction of production capacity in the forestry sector because of the impacts of the economic downturn on demand and prices in traditional export markets. In this environment, log exports were permitted to continue to maintain revenues and business under poor trading conditions. However, in January 2010, Gabon announced more severe log export restrictions to prohibit the export of undressed roundwood. The ban was not implemented until May 2010, with roundwood buying activity from China reportedly becoming hectic in the interim period. The ban is expected to lead to a readjustment of sources of supply and prices in 2010, with significant impacts on the tropical plywood industries in China and France, which use significant volumes of okoumé veneers.
Log exports by Myanmar (the fourth largest tropical log exporter at 1.4 million m3) declined by 17% in 2008. Myanmar’s main trading partners are India and China, which together accounted for 87% of Myanmar’s tropical log exports. China’s imports of tropical logs from Myanmar declined 22% to 462 000 m3 in 2008 as demand for finished teak products in China’s SPWP markets
.................Fig..2.4:.Major.Tropical.Log.Exporters
0 1000 2000 3000 4000 5000
Others
Congo, Rep.
Myanmar
Gabon
P.N.G.
Malaysia
(Volume 1000 m3)
200920082007
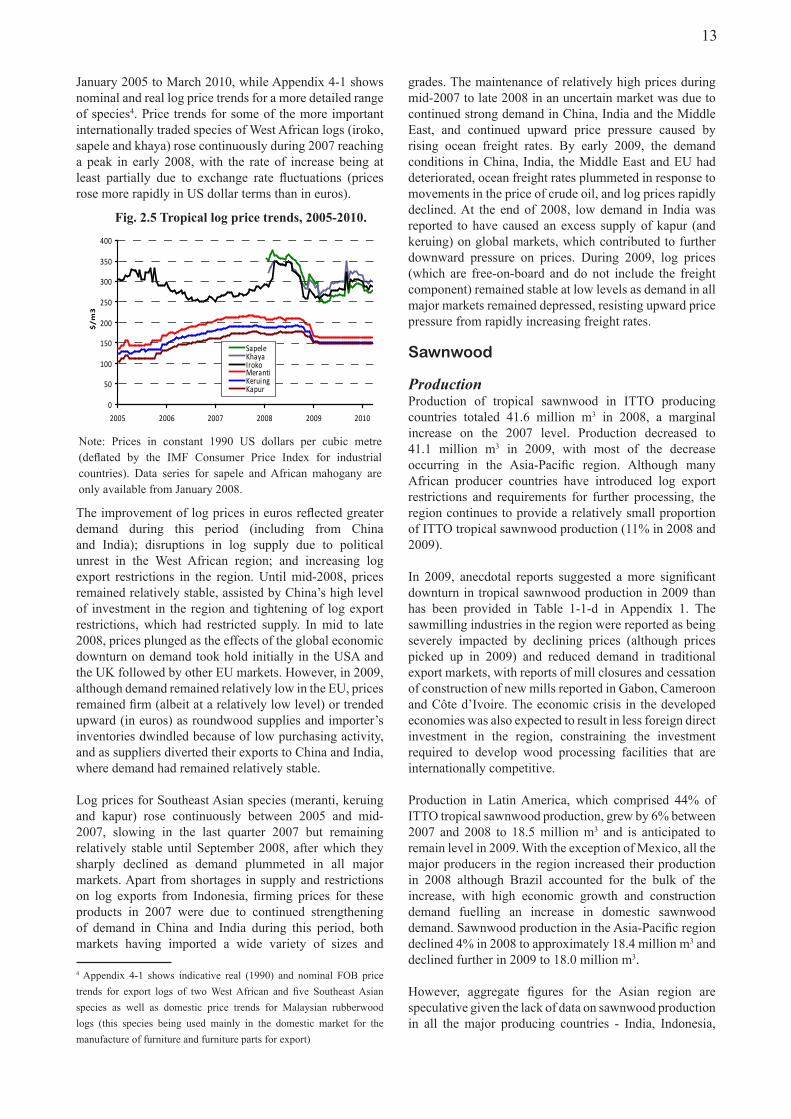
13
grades. The maintenance of relatively high prices during mid-2007 to late 2008 in an uncertain market was due to continued strong demand in China, India and the Middle East, and continued upward price pressure caused by rising ocean freight rates. By early 2009, the demand conditions in China, India, the Middle East and EU had deteriorated, ocean freight rates plummeted in response to movements in the price of crude oil, and log prices rapidly declined. At the end of 2008, low demand in India was reported to have caused an excess supply of kapur (and keruing) on global markets, which contributed to further downward pressure on prices. During 2009, log prices (which are free-on-board and do not include the freight component) remained stable at low levels as demand in all major markets remained depressed, resisting upward price pressure from rapidly increasing freight rates.
Sawnwood
ProductionProduction of tropical sawnwood in ITTO producing countries totaled 41.6 million m3 in 2008, a marginal increase on the 2007 level. Production decreased to 41.1 million m3 in 2009, with most of the decrease occurring in the Asia-Pacific region. Although many African producer countries have introduced log export restrictions and requirements for further processing, the region continues to provide a relatively small proportion of ITTO tropical sawnwood production (11% in 2008 and 2009).
In 2009, anecdotal reports suggested a more significant downturn in tropical sawnwood production in 2009 than has been provided in Table 1-1-d in Appendix 1. The sawmilling industries in the region were reported as being severely impacted by declining prices (although prices picked up in 2009) and reduced demand in traditional export markets, with reports of mill closures and cessation of construction of new mills reported in Gabon, Cameroon and Côte d’Ivoire. The economic crisis in the developed economies was also expected to result in less foreign direct investment in the region, constraining the investment required to develop wood processing facilities that are internationally competitive.
Production in Latin America, which comprised 44% of ITTO tropical sawnwood production, grew by 6% between 2007 and 2008 to 18.5 million m3 and is anticipated to remain level in 2009. With the exception of Mexico, all the major producers in the region increased their production in 2008 although Brazil accounted for the bulk of the increase, with high economic growth and construction demand fuelling an increase in domestic sawnwood demand. Sawnwood production in the Asia-Pacific region declined 4% in 2008 to approximately 18.4 million m3 and declined further in 2009 to 18.0 million m3.
However, aggregate figures for the Asian region are speculative given the lack of data on sawnwood production in all the major producing countries - India, Indonesia,
January 2005 to March 2010, while Appendix 4-1 shows nominal and real log price trends for a more detailed range of species4. Price trends for some of the more important internationally traded species of West African logs (iroko, sapele and khaya) rose continuously during 2007 reaching a peak in early 2008, with the rate of increase being at least partially due to exchange rate fluctuations (prices rose more rapidly in US dollar terms than in euros).
The improvement of log prices in euros reflected greater demand during this period (including from China and India); disruptions in log supply due to political unrest in the West African region; and increasing log export restrictions in the region. Until mid-2008, prices remained relatively stable, assisted by China’s high level of investment in the region and tightening of log export restrictions, which had restricted supply. In mid to late 2008, prices plunged as the effects of the global economic downturn on demand took hold initially in the USA and the UK followed by other EU markets. However, in 2009, although demand remained relatively low in the EU, prices remained firm (albeit at a relatively low level) or trended upward (in euros) as roundwood supplies and importer’s inventories dwindled because of low purchasing activity, and as suppliers diverted their exports to China and India, where demand had remained relatively stable.
Log prices for Southeast Asian species (meranti, keruing and kapur) rose continuously between 2005 and mid-2007, slowing in the last quarter 2007 but remaining relatively stable until September 2008, after which they sharply declined as demand plummeted in all major markets. Apart from shortages in supply and restrictions on log exports from Indonesia, firming prices for these products in 2007 were due to continued strengthening of demand in China and India during this period, both markets having imported a wide variety of sizes and
4 Appendix 4-1 shows indicative real (1990) and nominal FOB price trends for export logs of two West African and five Southeast Asian species as well as domestic price trends for Malaysian rubberwood logs (this species being used mainly in the domestic market for the manufacture of furniture and furniture parts for export)
0
50
100
150
200
250
300
350
400
2005 2006 2007 2008 2009 2010
$/m
3
SapeleKhayaIrokoMerantiKeruingKapur
Note: Prices in constant 1990 US dollars per cubic metre (deflated by the IMF Consumer Price Index for industrial countries). Data series for sapele and African mahogany are only available from January 2008.
...........Fig..2.5.Tropical.log.price.trends,.2005-2010..
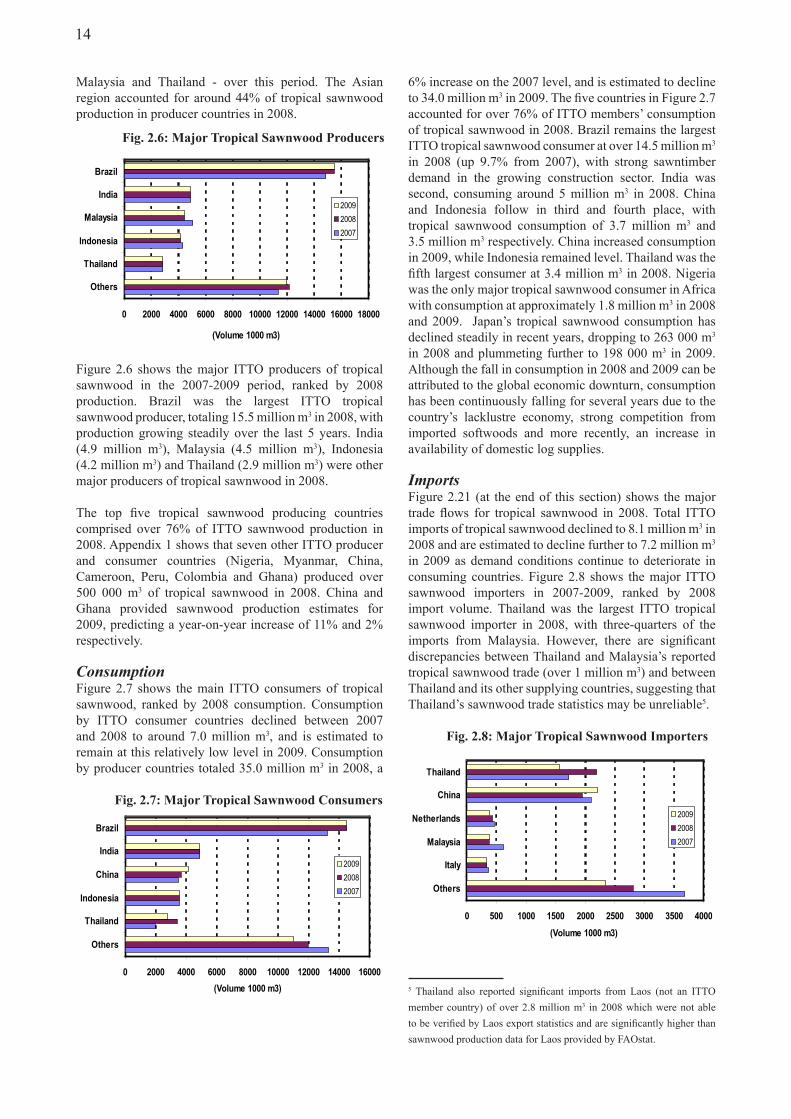
14
6% increase on the 2007 level, and is estimated to decline to 34.0 million m3 in 2009. The five countries in Figure 2.7 accounted for over 76% of ITTO members’ consumption of tropical sawnwood in 2008. Brazil remains the largest ITTO tropical sawnwood consumer at over 14.5 million m3 in 2008 (up 9.7% from 2007), with strong sawntimber demand in the growing construction sector. India was second, consuming around 5 million m3 in 2008. China and Indonesia follow in third and fourth place, with tropical sawnwood consumption of 3.7 million m3 and 3.5 million m3 respectively. China increased consumption in 2009, while Indonesia remained level. Thailand was the fifth largest consumer at 3.4 million m3 in 2008. Nigeria was the only major tropical sawnwood consumer in Africa with consumption at approximately 1.8 million m3 in 2008 and 2009. Japan’s tropical sawnwood consumption has declined steadily in recent years, dropping to 263 000 m3 in 2008 and plummeting further to 198 000 m3 in 2009. Although the fall in consumption in 2008 and 2009 can be attributed to the global economic downturn, consumption has been continuously falling for several years due to the country’s lacklustre economy, strong competition from imported softwoods and more recently, an increase in availability of domestic log supplies.
ImportsFigure 2.21 (at the end of this section) shows the major trade flows for tropical sawnwood in 2008. Total ITTO imports of tropical sawnwood declined to 8.1 million m3 in 2008 and are estimated to decline further to 7.2 million m3 in 2009 as demand conditions continue to deteriorate in consuming countries. Figure 2.8 shows the major ITTO sawnwood importers in 2007-2009, ranked by 2008 import volume. Thailand was the largest ITTO tropical sawnwood importer in 2008, with three-quarters of the imports from Malaysia. However, there are significant discrepancies between Thailand and Malaysia’s reported tropical sawnwood trade (over 1 million m3) and between Thailand and its other supplying countries, suggesting that Thailand’s sawnwood trade statistics may be unreliable5.
5 Thailand also reported significant imports from Laos (not an ITTO member country) of over 2.8 million m3 in 2008 which were not able to be verified by Laos export statistics and are significantly higher than sawnwood production data for Laos provided by FAOstat.
Malaysia and Thailand - over this period. The Asian region accounted for around 44% of tropical sawnwood production in producer countries in 2008.
Figure 2.6 shows the major ITTO producers of tropical sawnwood in the 2007-2009 period, ranked by 2008 production. Brazil was the largest ITTO tropical sawnwood producer, totaling 15.5 million m3 in 2008, with production growing steadily over the last 5 years. India (4.9 million m3), Malaysia (4.5 million m3), Indonesia (4.2 million m3) and Thailand (2.9 million m3) were other major producers of tropical sawnwood in 2008.
The top five tropical sawnwood producing countries comprised over 76% of ITTO sawnwood production in 2008. Appendix 1 shows that seven other ITTO producer and consumer countries (Nigeria, Myanmar, China, Cameroon, Peru, Colombia and Ghana) produced over 500 000 m3 of tropical sawnwood in 2008. China and Ghana provided sawnwood production estimates for 2009, predicting a year-on-year increase of 11% and 2% respectively.
ConsumptionFigure 2.7 shows the main ITTO consumers of tropical sawnwood, ranked by 2008 consumption. Consumption by ITTO consumer countries declined between 2007 and 2008 to around 7.0 million m3, and is estimated to remain at this relatively low level in 2009. Consumption by producer countries totaled 35.0 million m3 in 2008, a
...............Fig..2.6:.Major.Tropical.Sawnwood.Producers
0 500 1000 1500 2000 2500 3000 3500 4000
Others
Italy
Malaysia
Netherlands
China
Thailand
(Volume 1000 m3)
200920082007
...........Fig..2.7:.Major.Tropical.Sawnwood.Consumers
0 2000 4000 6000 8000 10000 12000 14000 16000 18000
Others
Thailand
Indonesia
Malaysia
India
Brazil
(Volume 1000 m3)
200920082007
0 2000 4000 6000 8000 10000 12000 14000 16000
Others
Thailand
Indonesia
China
India
Brazil
(Volume 1000 m3)
200920082007
...........Fig..2.8:.Major.Tropical.Sawnwood.Importers
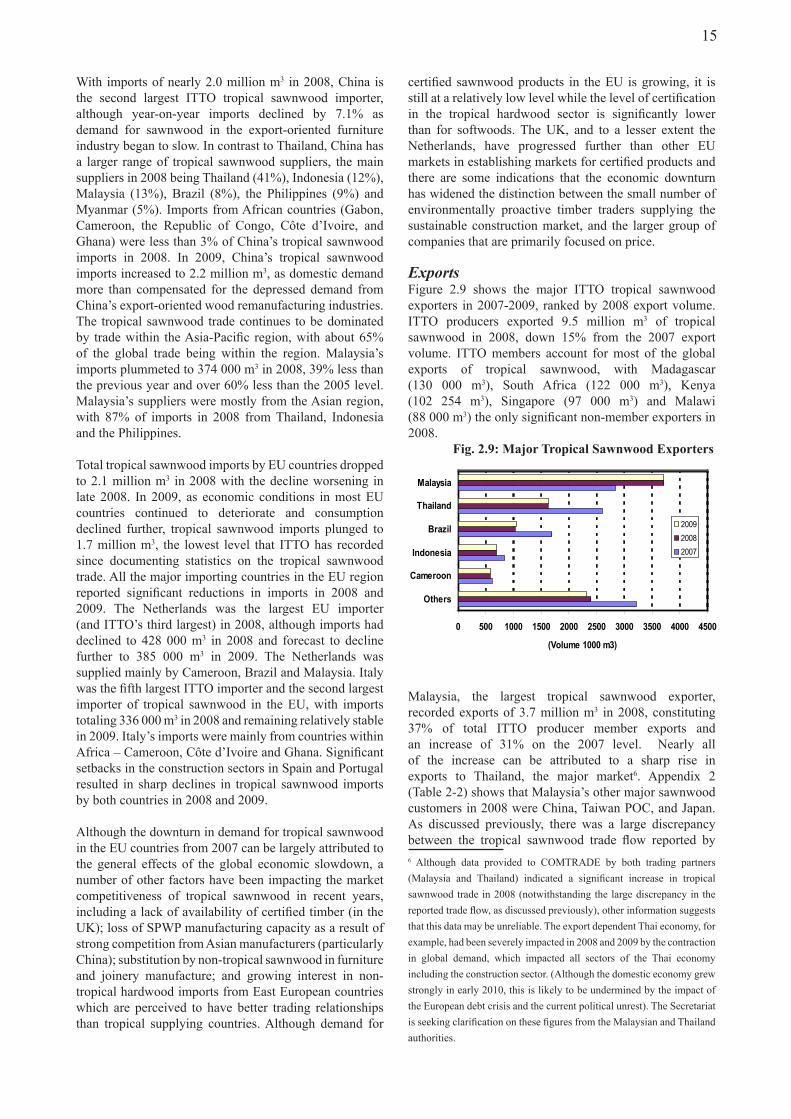
15
certified sawnwood products in the EU is growing, it is still at a relatively low level while the level of certification in the tropical hardwood sector is significantly lower than for softwoods. The UK, and to a lesser extent the Netherlands, have progressed further than other EU markets in establishing markets for certified products and there are some indications that the economic downturn has widened the distinction between the small number of environmentally proactive timber traders supplying the sustainable construction market, and the larger group of companies that are primarily focused on price.
ExportsFigure 2.9 shows the major ITTO tropical sawnwood exporters in 2007-2009, ranked by 2008 export volume. ITTO producers exported 9.5 million m3 of tropical sawnwood in 2008, down 15% from the 2007 export volume. ITTO members account for most of the global exports of tropical sawnwood, with Madagascar (130 000 m3), South Africa (122 000 m3), Kenya (102 254 m3), Singapore (97 000 m3) and Malawi (88 000 m3) the only significant non-member exporters in 2008.
Malaysia, the largest tropical sawnwood exporter, recorded exports of 3.7 million m3 in 2008, constituting 37% of total ITTO producer member exports and an increase of 31% on the 2007 level. Nearly all of the increase can be attributed to a sharp rise in exports to Thailand, the major market6. Appendix 2 (Table 2-2) shows that Malaysia’s other major sawnwood customers in 2008 were China, Taiwan POC, and Japan. As discussed previously, there was a large discrepancy between the tropical sawnwood trade flow reported by 6 Although data provided to COMTRADE by both trading partners (Malaysia and Thailand) indicated a significant increase in tropical sawnwood trade in 2008 (notwithstanding the large discrepancy in the reported trade flow, as discussed previously), other information suggests that this data may be unreliable. The export dependent Thai economy, for example, had been severely impacted in 2008 and 2009 by the contraction in global demand, which impacted all sectors of the Thai economy including the construction sector. (Although the domestic economy grew strongly in early 2010, this is likely to be undermined by the impact of the European debt crisis and the current political unrest). The Secretariat is seeking clarification on these figures from the Malaysian and Thailand authorities.
With imports of nearly 2.0 million m3 in 2008, China is the second largest ITTO tropical sawnwood importer, although year-on-year imports declined by 7.1% as demand for sawnwood in the export-oriented furniture industry began to slow. In contrast to Thailand, China has a larger range of tropical sawnwood suppliers, the main suppliers in 2008 being Thailand (41%), Indonesia (12%), Malaysia (13%), Brazil (8%), the Philippines (9%) and Myanmar (5%). Imports from African countries (Gabon, Cameroon, the Republic of Congo, Côte d’Ivoire, and Ghana) were less than 3% of China’s tropical sawnwood imports in 2008. In 2009, China’s tropical sawnwood imports increased to 2.2 million m3, as domestic demand more than compensated for the depressed demand from China’s export-oriented wood remanufacturing industries. The tropical sawnwood trade continues to be dominated by trade within the Asia-Pacific region, with about 65% of the global trade being within the region. Malaysia’s imports plummeted to 374 000 m3 in 2008, 39% less than the previous year and over 60% less than the 2005 level. Malaysia’s suppliers were mostly from the Asian region, with 87% of imports in 2008 from Thailand, Indonesia and the Philippines.
Total tropical sawnwood imports by EU countries dropped to 2.1 million m3 in 2008 with the decline worsening in late 2008. In 2009, as economic conditions in most EU countries continued to deteriorate and consumption declined further, tropical sawnwood imports plunged to 1.7 million m3, the lowest level that ITTO has recorded since documenting statistics on the tropical sawnwood trade. All the major importing countries in the EU region reported significant reductions in imports in 2008 and 2009. The Netherlands was the largest EU importer (and ITTO’s third largest) in 2008, although imports had declined to 428 000 m3 in 2008 and forecast to decline further to 385 000 m3 in 2009. The Netherlands was supplied mainly by Cameroon, Brazil and Malaysia. Italy was the fifth largest ITTO importer and the second largest importer of tropical sawnwood in the EU, with imports totaling 336 000 m3 in 2008 and remaining relatively stable in 2009. Italy’s imports were mainly from countries within Africa – Cameroon, Côte d’Ivoire and Ghana. Significant setbacks in the construction sectors in Spain and Portugal resulted in sharp declines in tropical sawnwood imports by both countries in 2008 and 2009.
Although the downturn in demand for tropical sawnwood in the EU countries from 2007 can be largely attributed to the general effects of the global economic slowdown, a number of other factors have been impacting the market competitiveness of tropical sawnwood in recent years, including a lack of availability of certified timber (in the UK); loss of SPWP manufacturing capacity as a result of strong competition from Asian manufacturers (particularly China); substitution by non-tropical sawnwood in furniture and joinery manufacture; and growing interest in non-tropical hardwood imports from East European countries which are perceived to have better trading relationships than tropical supplying countries. Although demand for
0 500 1000 1500 2000 2500 3000 3500 4000 4500
Others
Cameroon
Indonesia
Brazil
Thailand
Malaysia
(Volume 1000 m3)
200920082007
.................Fig..2.9:.Major.Tropical.Sawnwood.Exporters
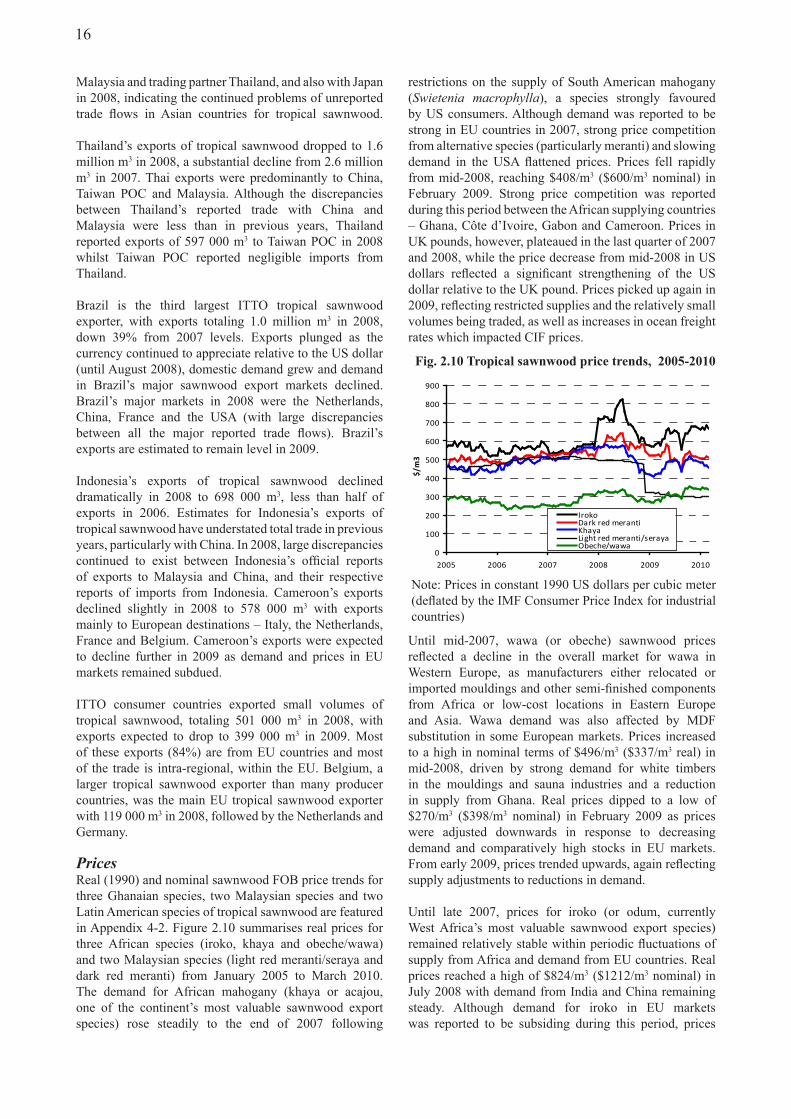
16
restrictions on the supply of South American mahogany (Swietenia macrophylla), a species strongly favoured by US consumers. Although demand was reported to be strong in EU countries in 2007, strong price competition from alternative species (particularly meranti) and slowing demand in the USA flattened prices. Prices fell rapidly from mid-2008, reaching $408/m3 ($600/m3 nominal) in February 2009. Strong price competition was reported during this period between the African supplying countries – Ghana, Côte d’Ivoire, Gabon and Cameroon. Prices in UK pounds, however, plateaued in the last quarter of 2007 and 2008, while the price decrease from mid-2008 in US dollars reflected a significant strengthening of the US dollar relative to the UK pound. Prices picked up again in 2009, reflecting restricted supplies and the relatively small volumes being traded, as well as increases in ocean freight rates which impacted CIF prices.
Until mid-2007, wawa (or obeche) sawnwood prices reflected a decline in the overall market for wawa in Western Europe, as manufacturers either relocated or imported mouldings and other semi-finished components from Africa or low-cost locations in Eastern Europe and Asia. Wawa demand was also affected by MDF substitution in some European markets. Prices increased to a high in nominal terms of $496/m3 ($337/m3 real) in mid-2008, driven by strong demand for white timbers in the mouldings and sauna industries and a reduction in supply from Ghana. Real prices dipped to a low of $270/m3 ($398/m3 nominal) in February 2009 as prices were adjusted downwards in response to decreasing demand and comparatively high stocks in EU markets. From early 2009, prices trended upwards, again reflecting supply adjustments to reductions in demand.
Until late 2007, prices for iroko (or odum, currently West Africa’s most valuable sawnwood export species) remained relatively stable within periodic fluctuations of supply from Africa and demand from EU countries. Real prices reached a high of $824/m3 ($1212/m3 nominal) in July 2008 with demand from India and China remaining steady. Although demand for iroko in EU markets was reported to be subsiding during this period, prices
Malaysia and trading partner Thailand, and also with Japan in 2008, indicating the continued problems of unreported trade flows in Asian countries for tropical sawnwood.
Thailand’s exports of tropical sawnwood dropped to 1.6 million m3 in 2008, a substantial decline from 2.6 million m3 in 2007. Thai exports were predominantly to China, Taiwan POC and Malaysia. Although the discrepancies between Thailand’s reported trade with China and Malaysia were less than in previous years, Thailand reported exports of 597 000 m3 to Taiwan POC in 2008 whilst Taiwan POC reported negligible imports from Thailand.
Brazil is the third largest ITTO tropical sawnwood exporter, with exports totaling 1.0 million m3 in 2008, down 39% from 2007 levels. Exports plunged as the currency continued to appreciate relative to the US dollar (until August 2008), domestic demand grew and demand in Brazil’s major sawnwood export markets declined. Brazil’s major markets in 2008 were the Netherlands, China, France and the USA (with large discrepancies between all the major reported trade flows). Brazil’s exports are estimated to remain level in 2009.
Indonesia’s exports of tropical sawnwood declined dramatically in 2008 to 698 000 m3, less than half of exports in 2006. Estimates for Indonesia’s exports of tropical sawnwood have understated total trade in previous years, particularly with China. In 2008, large discrepancies continued to exist between Indonesia’s official reports of exports to Malaysia and China, and their respective reports of imports from Indonesia. Cameroon’s exports declined slightly in 2008 to 578 000 m3 with exports mainly to European destinations – Italy, the Netherlands, France and Belgium. Cameroon’s exports were expected to decline further in 2009 as demand and prices in EU markets remained subdued.
ITTO consumer countries exported small volumes of tropical sawnwood, totaling 501 000 m3 in 2008, with exports expected to drop to 399 000 m3 in 2009. Most of these exports (84%) are from EU countries and most of the trade is intra-regional, within the EU. Belgium, a larger tropical sawnwood exporter than many producer countries, was the main EU tropical sawnwood exporter with 119 000 m3 in 2008, followed by the Netherlands and Germany.
PricesReal (1990) and nominal sawnwood FOB price trends for three Ghanaian species, two Malaysian species and two Latin American species of tropical sawnwood are featured in Appendix 4-2. Figure 2.10 summarises real prices for three African species (iroko, khaya and obeche/wawa) and two Malaysian species (light red meranti/seraya and dark red meranti) from January 2005 to March 2010. The demand for African mahogany (khaya or acajou, one of the continent’s most valuable sawnwood export species) rose steadily to the end of 2007 following
0
100
200
300
400
500
600
700
800
900
2005 2006 2007 2008 2009 2010
$/m3
IrokoDark red merantiKhayaLight red meranti/serayaObeche/wawa
Note: Prices in constant 1990 US dollars per cubic meter (deflated by the IMF Consumer Price Index for industrial countries)
Fig..2.10.Tropical.sawnwood.price.trends,..2005-2010
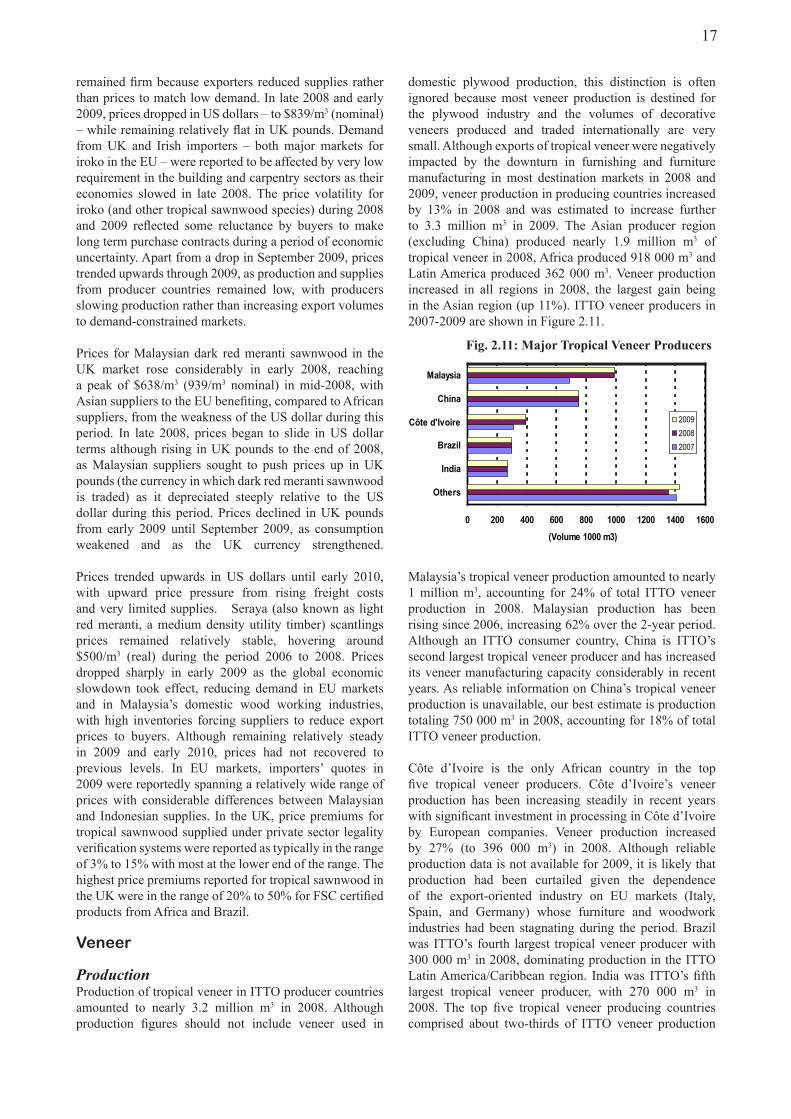
17
domestic plywood production, this distinction is often ignored because most veneer production is destined for the plywood industry and the volumes of decorative veneers produced and traded internationally are very small. Although exports of tropical veneer were negatively impacted by the downturn in furnishing and furniture manufacturing in most destination markets in 2008 and 2009, veneer production in producing countries increased by 13% in 2008 and was estimated to increase further to 3.3 million m3 in 2009. The Asian producer region (excluding China) produced nearly 1.9 million m3 of tropical veneer in 2008, Africa produced 918 000 m3 and Latin America produced 362 000 m3. Veneer production increased in all regions in 2008, the largest gain being in the Asian region (up 11%). ITTO veneer producers in 2007-2009 are shown in Figure 2.11.
Malaysia’s tropical veneer production amounted to nearly 1 million m3, accounting for 24% of total ITTO veneer production in 2008. Malaysian production has been rising since 2006, increasing 62% over the 2-year period. Although an ITTO consumer country, China is ITTO’s second largest tropical veneer producer and has increased its veneer manufacturing capacity considerably in recent years. As reliable information on China’s tropical veneer production is unavailable, our best estimate is production totaling 750 000 m3 in 2008, accounting for 18% of total ITTO veneer production.
Côte d’Ivoire is the only African country in the top five tropical veneer producers. Côte d’Ivoire’s veneer production has been increasing steadily in recent years with significant investment in processing in Côte d’Ivoire by European companies. Veneer production increased by 27% (to 396 000 m3) in 2008. Although reliable production data is not available for 2009, it is likely that production had been curtailed given the dependence of the export-oriented industry on EU markets (Italy, Spain, and Germany) whose furniture and woodwork industries had been stagnating during the period. Brazil was ITTO’s fourth largest tropical veneer producer with 300 000 m3 in 2008, dominating production in the ITTO Latin America/Caribbean region. India was ITTO’s fifth largest tropical veneer producer, with 270 000 m3 in 2008. The top five tropical veneer producing countries comprised about two-thirds of ITTO veneer production
remained firm because exporters reduced supplies rather than prices to match low demand. In late 2008 and early 2009, prices dropped in US dollars – to $839/m3 (nominal) – while remaining relatively flat in UK pounds. Demand from UK and Irish importers – both major markets for iroko in the EU – were reported to be affected by very low requirement in the building and carpentry sectors as their economies slowed in late 2008. The price volatility for iroko (and other tropical sawnwood species) during 2008 and 2009 reflected some reluctance by buyers to make long term purchase contracts during a period of economic uncertainty. Apart from a drop in September 2009, prices trended upwards through 2009, as production and supplies from producer countries remained low, with producers slowing production rather than increasing export volumes to demand-constrained markets.
Prices for Malaysian dark red meranti sawnwood in the UK market rose considerably in early 2008, reaching a peak of $638/m3 (939/m3 nominal) in mid-2008, with Asian suppliers to the EU benefiting, compared to African suppliers, from the weakness of the US dollar during this period. In late 2008, prices began to slide in US dollar terms although rising in UK pounds to the end of 2008, as Malaysian suppliers sought to push prices up in UK pounds (the currency in which dark red meranti sawnwood is traded) as it depreciated steeply relative to the US dollar during this period. Prices declined in UK pounds from early 2009 until September 2009, as consumption weakened and as the UK currency strengthened.
Prices trended upwards in US dollars until early 2010, with upward price pressure from rising freight costs and very limited supplies. Seraya (also known as light red meranti, a medium density utility timber) scantlings prices remained relatively stable, hovering around $500/m3 (real) during the period 2006 to 2008. Prices dropped sharply in early 2009 as the global economic slowdown took effect, reducing demand in EU markets and in Malaysia’s domestic wood working industries, with high inventories forcing suppliers to reduce export prices to buyers. Although remaining relatively steady in 2009 and early 2010, prices had not recovered to previous levels. In EU markets, importers’ quotes in 2009 were reportedly spanning a relatively wide range of prices with considerable differences between Malaysian and Indonesian supplies. In the UK, price premiums for tropical sawnwood supplied under private sector legality verification systems were reported as typically in the range of 3% to 15% with most at the lower end of the range. The highest price premiums reported for tropical sawnwood in the UK were in the range of 20% to 50% for FSC certified products from Africa and Brazil.
Veneer
ProductionProduction of tropical veneer in ITTO producer countries amounted to nearly 3.2 million m3 in 2008. Although production figures should not include veneer used in
0 200 400 600 800 1000 1200 1400 1600
Others
India
Brazil
Côte d'Ivoire
China
Malaysia
(Volume 1000 m3)
200920082007
.................Fig..2.11:.Major.Tropical.Veneer.Producers
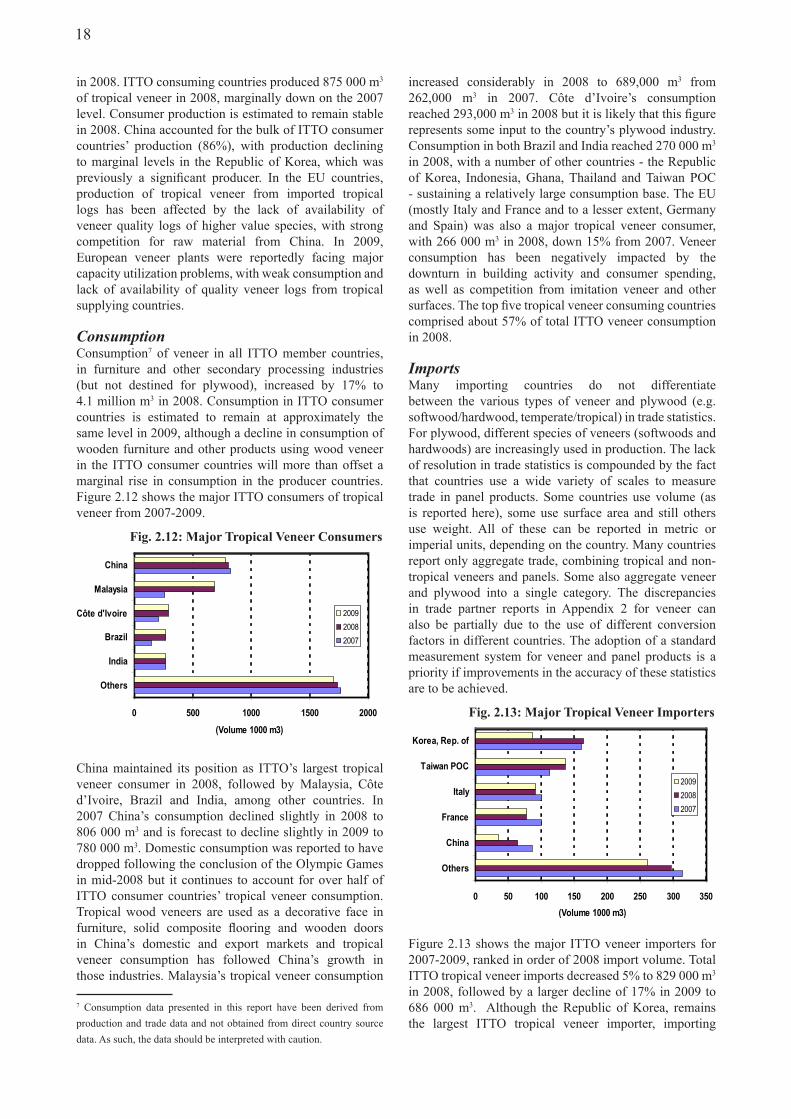
18
increased considerably in 2008 to 689,000 m3 from 262,000 m3 in 2007. Côte d’Ivoire’s consumption reached 293,000 m3 in 2008 but it is likely that this figure represents some input to the country’s plywood industry. Consumption in both Brazil and India reached 270 000 m3 in 2008, with a number of other countries - the Republic of Korea, Indonesia, Ghana, Thailand and Taiwan POC - sustaining a relatively large consumption base. The EU (mostly Italy and France and to a lesser extent, Germany and Spain) was also a major tropical veneer consumer, with 266 000 m3 in 2008, down 15% from 2007. Veneer consumption has been negatively impacted by the downturn in building activity and consumer spending, as well as competition from imitation veneer and other surfaces. The top five tropical veneer consuming countries comprised about 57% of total ITTO veneer consumption in 2008.
ImportsMany importing countries do not differentiate between the various types of veneer and plywood (e.g. softwood/hardwood, temperate/tropical) in trade statistics. For plywood, different species of veneers (softwoods and hardwoods) are increasingly used in production. The lack of resolution in trade statistics is compounded by the fact that countries use a wide variety of scales to measure trade in panel products. Some countries use volume (as is reported here), some use surface area and still others use weight. All of these can be reported in metric or imperial units, depending on the country. Many countries report only aggregate trade, combining tropical and non-tropical veneers and panels. Some also aggregate veneer and plywood into a single category. The discrepancies in trade partner reports in Appendix 2 for veneer can also be partially due to the use of different conversion factors in different countries. The adoption of a standard measurement system for veneer and panel products is a priority if improvements in the accuracy of these statistics are to be achieved.
0 50 100 150 200 250 300 350
Others
China
France
Italy
Taiwan POC
Korea, Rep. of
(Volume 1000 m3)
200920082007
Figure 2.13 shows the major ITTO veneer importers for 2007-2009, ranked in order of 2008 import volume. Total ITTO tropical veneer imports decreased 5% to 829 000 m3 in 2008, followed by a larger decline of 17% in 2009 to 686 000 m3. Although the Republic of Korea, remains the largest ITTO tropical veneer importer, importing
in 2008. ITTO consuming countries produced 875 000 m3 of tropical veneer in 2008, marginally down on the 2007 level. Consumer production is estimated to remain stable in 2008. China accounted for the bulk of ITTO consumer countries’ production (86%), with production declining to marginal levels in the Republic of Korea, which was previously a significant producer. In the EU countries, production of tropical veneer from imported tropical logs has been affected by the lack of availability of veneer quality logs of higher value species, with strong competition for raw material from China. In 2009, European veneer plants were reportedly facing major capacity utilization problems, with weak consumption and lack of availability of quality veneer logs from tropical supplying countries.
ConsumptionConsumption7 of veneer in all ITTO member countries, in furniture and other secondary processing industries (but not destined for plywood), increased by 17% to 4.1 million m3 in 2008. Consumption in ITTO consumer countries is estimated to remain at approximately the same level in 2009, although a decline in consumption of wooden furniture and other products using wood veneer in the ITTO consumer countries will more than offset a marginal rise in consumption in the producer countries. Figure 2.12 shows the major ITTO consumers of tropical veneer from 2007-2009.
China maintained its position as ITTO’s largest tropical veneer consumer in 2008, followed by Malaysia, Côte d’Ivoire, Brazil and India, among other countries. In 2007 China’s consumption declined slightly in 2008 to 806 000 m3 and is forecast to decline slightly in 2009 to 780 000 m3. Domestic consumption was reported to have dropped following the conclusion of the Olympic Games in mid-2008 but it continues to account for over half of ITTO consumer countries’ tropical veneer consumption. Tropical wood veneers are used as a decorative face in furniture, solid composite flooring and wooden doors in China’s domestic and export markets and tropical veneer consumption has followed China’s growth in those industries. Malaysia’s tropical veneer consumption
7 Consumption data presented in this report have been derived from production and trade data and not obtained from direct country source data. As such, the data should be interpreted with caution.
0 500 1000 1500 2000
Others
India
Brazil
Côte d'Ivoire
Malaysia
China
(Volume 1000 m3)
200920082007
................Fig..2.12:.Major.Tropical.Veneer.Consumers
................Fig..2.13:.Major.Tropical.Veneer.Importers
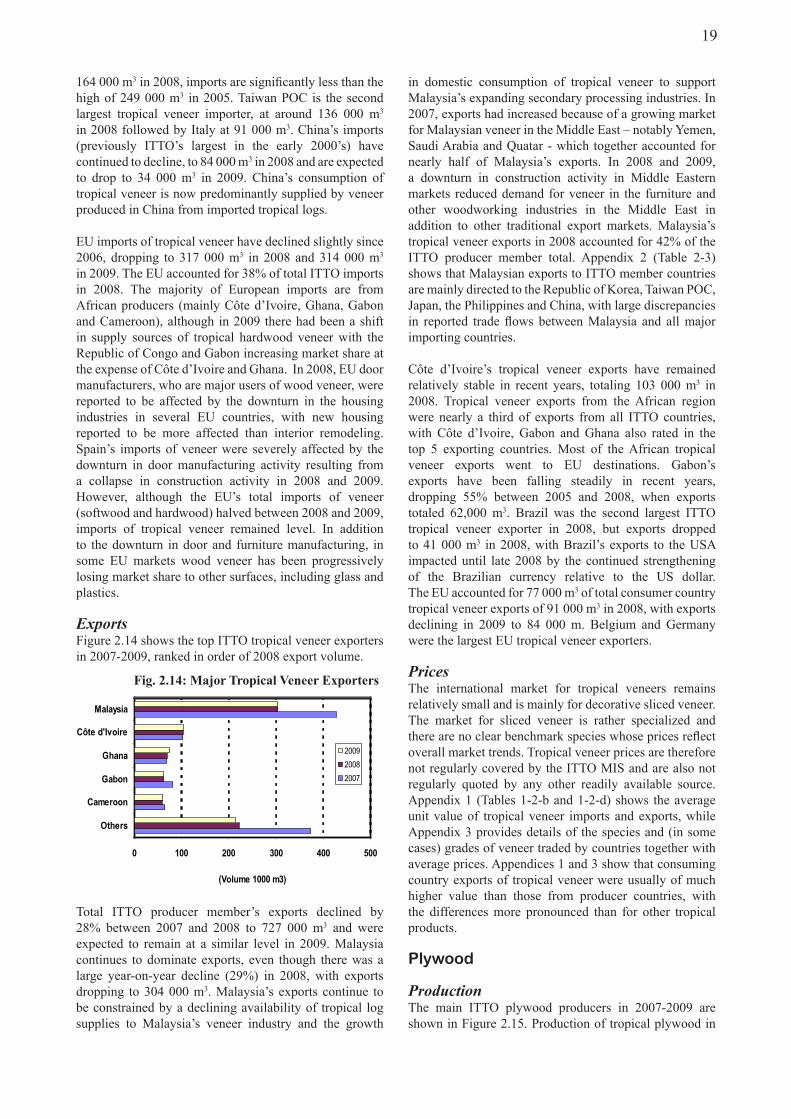
19
in domestic consumption of tropical veneer to support Malaysia’s expanding secondary processing industries. In 2007, exports had increased because of a growing market for Malaysian veneer in the Middle East – notably Yemen, Saudi Arabia and Quatar - which together accounted for nearly half of Malaysia’s exports. In 2008 and 2009, a downturn in construction activity in Middle Eastern markets reduced demand for veneer in the furniture and other woodworking industries in the Middle East in addition to other traditional export markets. Malaysia’s tropical veneer exports in 2008 accounted for 42% of the ITTO producer member total. Appendix 2 (Table 2-3) shows that Malaysian exports to ITTO member countries are mainly directed to the Republic of Korea, Taiwan POC, Japan, the Philippines and China, with large discrepancies in reported trade flows between Malaysia and all major importing countries.
Côte d’Ivoire’s tropical veneer exports have remained relatively stable in recent years, totaling 103 000 m3 in 2008. Tropical veneer exports from the African region were nearly a third of exports from all ITTO countries, with Côte d’Ivoire, Gabon and Ghana also rated in the top 5 exporting countries. Most of the African tropical veneer exports went to EU destinations. Gabon’s exports have been falling steadily in recent years, dropping 55% between 2005 and 2008, when exports totaled 62,000 m3. Brazil was the second largest ITTO tropical veneer exporter in 2008, but exports dropped to 41 000 m3 in 2008, with Brazil’s exports to the USA impacted until late 2008 by the continued strengthening of the Brazilian currency relative to the US dollar. The EU accounted for 77 000 m3 of total consumer country tropical veneer exports of 91 000 m3 in 2008, with exports declining in 2009 to 84 000 m. Belgium and Germany were the largest EU tropical veneer exporters.
PricesThe international market for tropical veneers remains relatively small and is mainly for decorative sliced veneer. The market for sliced veneer is rather specialized and there are no clear benchmark species whose prices reflect overall market trends. Tropical veneer prices are therefore not regularly covered by the ITTO MIS and are also not regularly quoted by any other readily available source. Appendix 1 (Tables 1-2-b and 1-2-d) shows the average unit value of tropical veneer imports and exports, while Appendix 3 provides details of the species and (in some cases) grades of veneer traded by countries together with average prices. Appendices 1 and 3 show that consuming country exports of tropical veneer were usually of much higher value than those from producer countries, with the differences more pronounced than for other tropical products.
Plywood
Production The main ITTO plywood producers in 2007-2009 are shown in Figure 2.15. Production of tropical plywood in
164 000 m3 in 2008, imports are significantly less than the high of 249 000 m3 in 2005. Taiwan POC is the second largest tropical veneer importer, at around 136 000 m3 in 2008 followed by Italy at 91 000 m3. China’s imports (previously ITTO’s largest in the early 2000’s) have continued to decline, to 84 000 m3 in 2008 and are expected to drop to 34 000 m3 in 2009. China’s consumption of tropical veneer is now predominantly supplied by veneer produced in China from imported tropical logs.
EU imports of tropical veneer have declined slightly since 2006, dropping to 317 000 m3 in 2008 and 314 000 m3 in 2009. The EU accounted for 38% of total ITTO imports in 2008. The majority of European imports are from African producers (mainly Côte d’Ivoire, Ghana, Gabon and Cameroon), although in 2009 there had been a shift in supply sources of tropical hardwood veneer with the Republic of Congo and Gabon increasing market share at the expense of Côte d’Ivoire and Ghana. In 2008, EU door manufacturers, who are major users of wood veneer, were reported to be affected by the downturn in the housing industries in several EU countries, with new housing reported to be more affected than interior remodeling. Spain’s imports of veneer were severely affected by the downturn in door manufacturing activity resulting from a collapse in construction activity in 2008 and 2009. However, although the EU’s total imports of veneer (softwood and hardwood) halved between 2008 and 2009, imports of tropical veneer remained level. In addition to the downturn in door and furniture manufacturing, in some EU markets wood veneer has been progressively losing market share to other surfaces, including glass and plastics.
ExportsFigure 2.14 shows the top ITTO tropical veneer exporters in 2007-2009, ranked in order of 2008 export volume.
Total ITTO producer member’s exports declined by 28% between 2007 and 2008 to 727 000 m3 and were expected to remain at a similar level in 2009. Malaysia continues to dominate exports, even though there was a large year-on-year decline (29%) in 2008, with exports dropping to 304 000 m3. Malaysia’s exports continue to be constrained by a declining availability of tropical log supplies to Malaysia’s veneer industry and the growth
0 100 200 300 400 500
Others
Cameroon
Gabon
Ghana
Côte d'Ivoire
Malaysia
(Volume 1000 m3)
200920082007
................Fig..2.14:.Major.Tropical.Veneer.Exporters
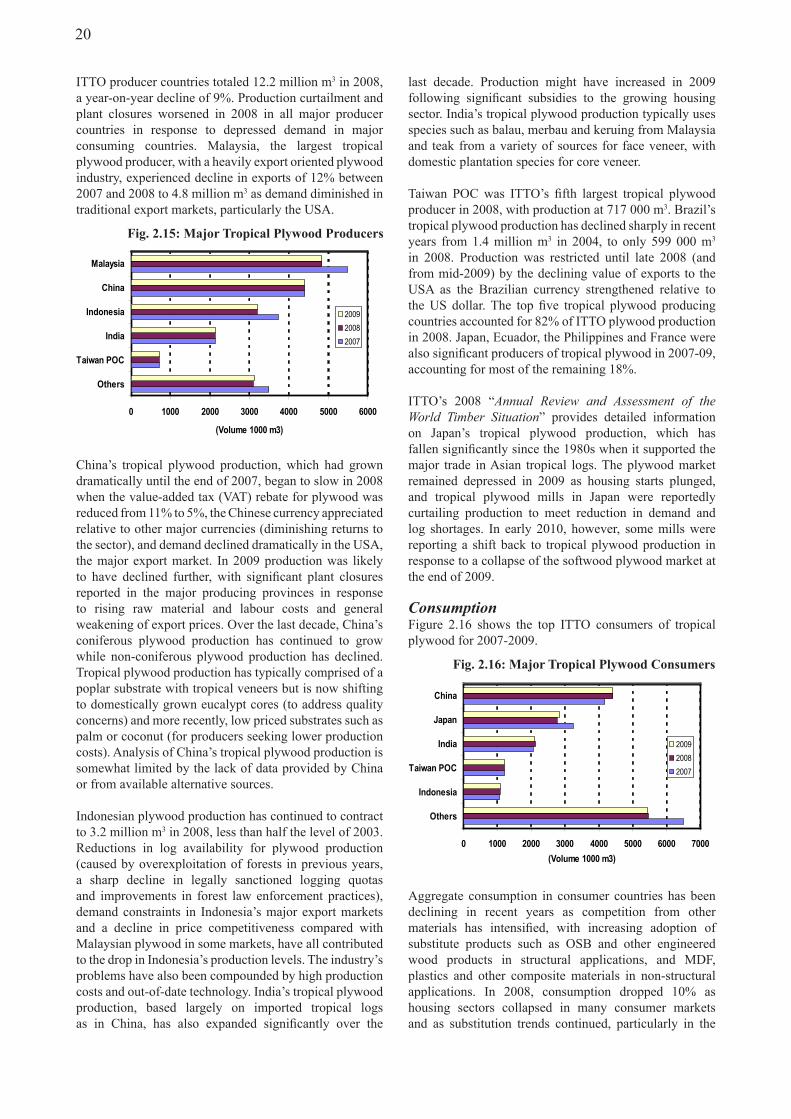
20
last decade. Production might have increased in 2009 following significant subsidies to the growing housing sector. India’s tropical plywood production typically uses species such as balau, merbau and keruing from Malaysia and teak from a variety of sources for face veneer, with domestic plantation species for core veneer.
Taiwan POC was ITTO’s fifth largest tropical plywood producer in 2008, with production at 717 000 m3. Brazil’s tropical plywood production has declined sharply in recent years from 1.4 million m3 in 2004, to only 599 000 m3 in 2008. Production was restricted until late 2008 (and from mid-2009) by the declining value of exports to the USA as the Brazilian currency strengthened relative to the US dollar. The top five tropical plywood producing countries accounted for 82% of ITTO plywood production in 2008. Japan, Ecuador, the Philippines and France were also significant producers of tropical plywood in 2007-09, accounting for most of the remaining 18%.
ITTO’s 2008 “Annual Review and Assessment of the World Timber Situation” provides detailed information on Japan’s tropical plywood production, which has fallen significantly since the 1980s when it supported the major trade in Asian tropical logs. The plywood market remained depressed in 2009 as housing starts plunged, and tropical plywood mills in Japan were reportedly curtailing production to meet reduction in demand and log shortages. In early 2010, however, some mills were reporting a shift back to tropical plywood production in response to a collapse of the softwood plywood market at the end of 2009.
ConsumptionFigure 2.16 shows the top ITTO consumers of tropical plywood for 2007-2009.
Aggregate consumption in consumer countries has been declining in recent years as competition from other materials has intensified, with increasing adoption of substitute products such as OSB and other engineered wood products in structural applications, and MDF, plastics and other composite materials in non-structural applications. In 2008, consumption dropped 10% as housing sectors collapsed in many consumer markets and as substitution trends continued, particularly in the
ITTO producer countries totaled 12.2 million m3 in 2008, a year-on-year decline of 9%. Production curtailment and plant closures worsened in 2008 in all major producer countries in response to depressed demand in major consuming countries. Malaysia, the largest tropical plywood producer, with a heavily export oriented plywood industry, experienced decline in exports of 12% between 2007 and 2008 to 4.8 million m3 as demand diminished in traditional export markets, particularly the USA.
China’s tropical plywood production, which had grown dramatically until the end of 2007, began to slow in 2008 when the value-added tax (VAT) rebate for plywood was reduced from 11% to 5%, the Chinese currency appreciated relative to other major currencies (diminishing returns to the sector), and demand declined dramatically in the USA, the major export market. In 2009 production was likely to have declined further, with significant plant closures reported in the major producing provinces in response to rising raw material and labour costs and general weakening of export prices. Over the last decade, China’s coniferous plywood production has continued to grow while non-coniferous plywood production has declined. Tropical plywood production has typically comprised of a poplar substrate with tropical veneers but is now shifting to domestically grown eucalypt cores (to address quality concerns) and more recently, low priced substrates such as palm or coconut (for producers seeking lower production costs). Analysis of China’s tropical plywood production is somewhat limited by the lack of data provided by China or from available alternative sources.
Indonesian plywood production has continued to contract to 3.2 million m3 in 2008, less than half the level of 2003. Reductions in log availability for plywood production (caused by overexploitation of forests in previous years, a sharp decline in legally sanctioned logging quotas and improvements in forest law enforcement practices), demand constraints in Indonesia’s major export markets and a decline in price competitiveness compared with Malaysian plywood in some markets, have all contributed to the drop in Indonesia’s production levels. The industry’s problems have also been compounded by high production costs and out-of-date technology. India’s tropical plywood production, based largely on imported tropical logs as in China, has also expanded significantly over the
0 1000 2000 3000 4000 5000 6000
Others
Taiwan POC
India
Indonesia
China
Malaysia
(Volume 1000 m3)
200920082007
................Fig..2.15:.Major.Tropical.Plywood.Producers
0 1000 2000 3000 4000 5000 6000 7000
Others
Indonesia
Taiwan POC
India
Japan
China
(Volume 1000 m3)
200920082007
................Fig..2.16:.Major.Tropical.Plywood.Consumers
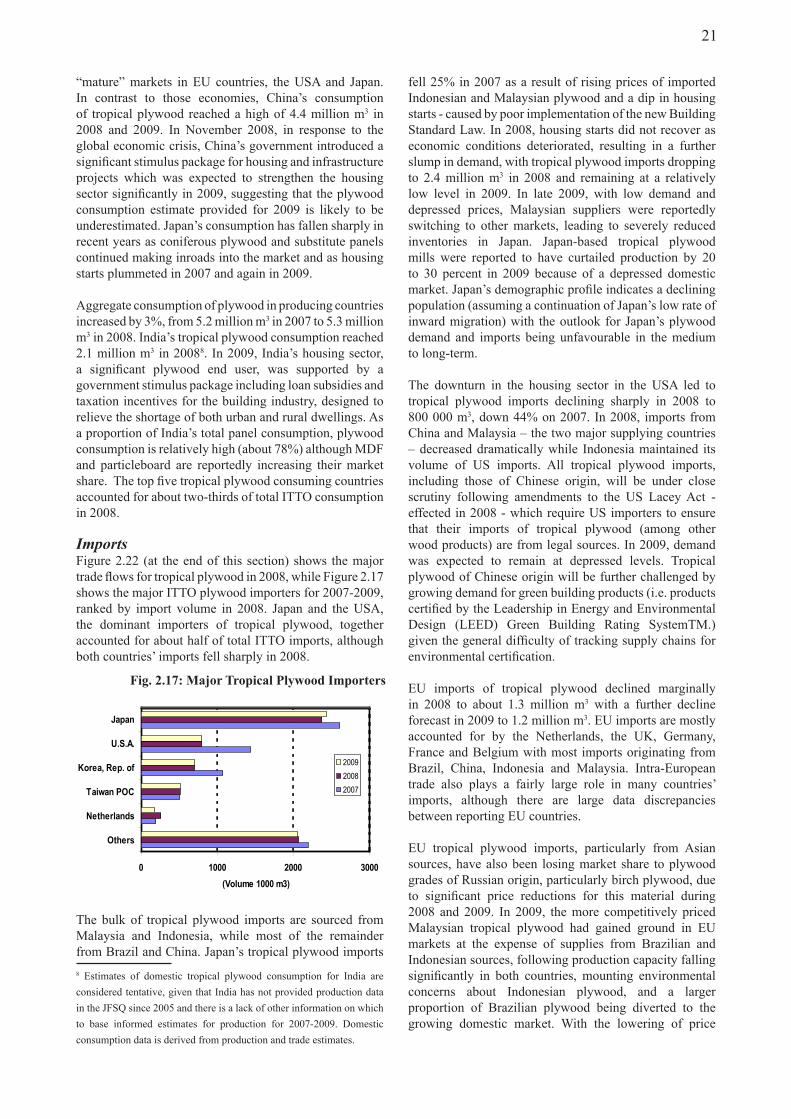
21
fell 25% in 2007 as a result of rising prices of imported Indonesian and Malaysian plywood and a dip in housing starts - caused by poor implementation of the new Building Standard Law. In 2008, housing starts did not recover as economic conditions deteriorated, resulting in a further slump in demand, with tropical plywood imports dropping to 2.4 million m3 in 2008 and remaining at a relatively low level in 2009. In late 2009, with low demand and depressed prices, Malaysian suppliers were reportedly switching to other markets, leading to severely reduced inventories in Japan. Japan-based tropical plywood mills were reported to have curtailed production by 20 to 30 percent in 2009 because of a depressed domestic market. Japan’s demographic profile indicates a declining population (assuming a continuation of Japan’s low rate of inward migration) with the outlook for Japan’s plywood demand and imports being unfavourable in the medium to long-term.
The downturn in the housing sector in the USA led to tropical plywood imports declining sharply in 2008 to 800 000 m3, down 44% on 2007. In 2008, imports from China and Malaysia – the two major supplying countries – decreased dramatically while Indonesia maintained its volume of US imports. All tropical plywood imports, including those of Chinese origin, will be under close scrutiny following amendments to the US Lacey Act - effected in 2008 - which require US importers to ensure that their imports of tropical plywood (among other wood products) are from legal sources. In 2009, demand was expected to remain at depressed levels. Tropical plywood of Chinese origin will be further challenged by growing demand for green building products (i.e. products certified by the Leadership in Energy and Environmental Design (LEED) Green Building Rating SystemTM.) given the general difficulty of tracking supply chains for environmental certification.
EU imports of tropical plywood declined marginally in 2008 to about 1.3 million m3 with a further decline forecast in 2009 to 1.2 million m3. EU imports are mostly accounted for by the Netherlands, the UK, Germany, France and Belgium with most imports originating from Brazil, China, Indonesia and Malaysia. Intra-European trade also plays a fairly large role in many countries’ imports, although there are large data discrepancies between reporting EU countries.
EU tropical plywood imports, particularly from Asian sources, have also been losing market share to plywood grades of Russian origin, particularly birch plywood, due to significant price reductions for this material during 2008 and 2009. In 2009, the more competitively priced Malaysian tropical plywood had gained ground in EU markets at the expense of supplies from Brazilian and Indonesian sources, following production capacity falling significantly in both countries, mounting environmental concerns about Indonesian plywood, and a larger proportion of Brazilian plywood being diverted to the growing domestic market. With the lowering of price
“mature” markets in EU countries, the USA and Japan. In contrast to those economies, China’s consumption of tropical plywood reached a high of 4.4 million m3 in 2008 and 2009. In November 2008, in response to the global economic crisis, China’s government introduced a significant stimulus package for housing and infrastructure projects which was expected to strengthen the housing sector significantly in 2009, suggesting that the plywood consumption estimate provided for 2009 is likely to be underestimated. Japan’s consumption has fallen sharply in recent years as coniferous plywood and substitute panels continued making inroads into the market and as housing starts plummeted in 2007 and again in 2009.
Aggregate consumption of plywood in producing countries increased by 3%, from 5.2 million m3 in 2007 to 5.3 million m3 in 2008. India’s tropical plywood consumption reached 2.1 million m3 in 20088. In 2009, India’s housing sector, a significant plywood end user, was supported by a government stimulus package including loan subsidies and taxation incentives for the building industry, designed to relieve the shortage of both urban and rural dwellings. As a proportion of India’s total panel consumption, plywood consumption is relatively high (about 78%) although MDF and particleboard are reportedly increasing their market share. The top five tropical plywood consuming countries accounted for about two-thirds of total ITTO consumption in 2008.
ImportsFigure 2.22 (at the end of this section) shows the major trade flows for tropical plywood in 2008, while Figure 2.17 shows the major ITTO plywood importers for 2007-2009, ranked by import volume in 2008. Japan and the USA, the dominant importers of tropical plywood, together accounted for about half of total ITTO imports, although both countries’ imports fell sharply in 2008.
The bulk of tropical plywood imports are sourced from Malaysia and Indonesia, while most of the remainder from Brazil and China. Japan’s tropical plywood imports 8 Estimates of domestic tropical plywood consumption for India are considered tentative, given that India has not provided production data in the JFSQ since 2005 and there is a lack of other information on which to base informed estimates for production for 2007-2009. Domestic consumption data is derived from production and trade estimates.
0 1000 2000 3000
Others
Netherlands
Taiwan POC
Korea, Rep. of
U.S.A.
Japan
(Volume 1000 m3)
200920082007
................Fig..2.17:.Major.Tropical.Plywood.Importers
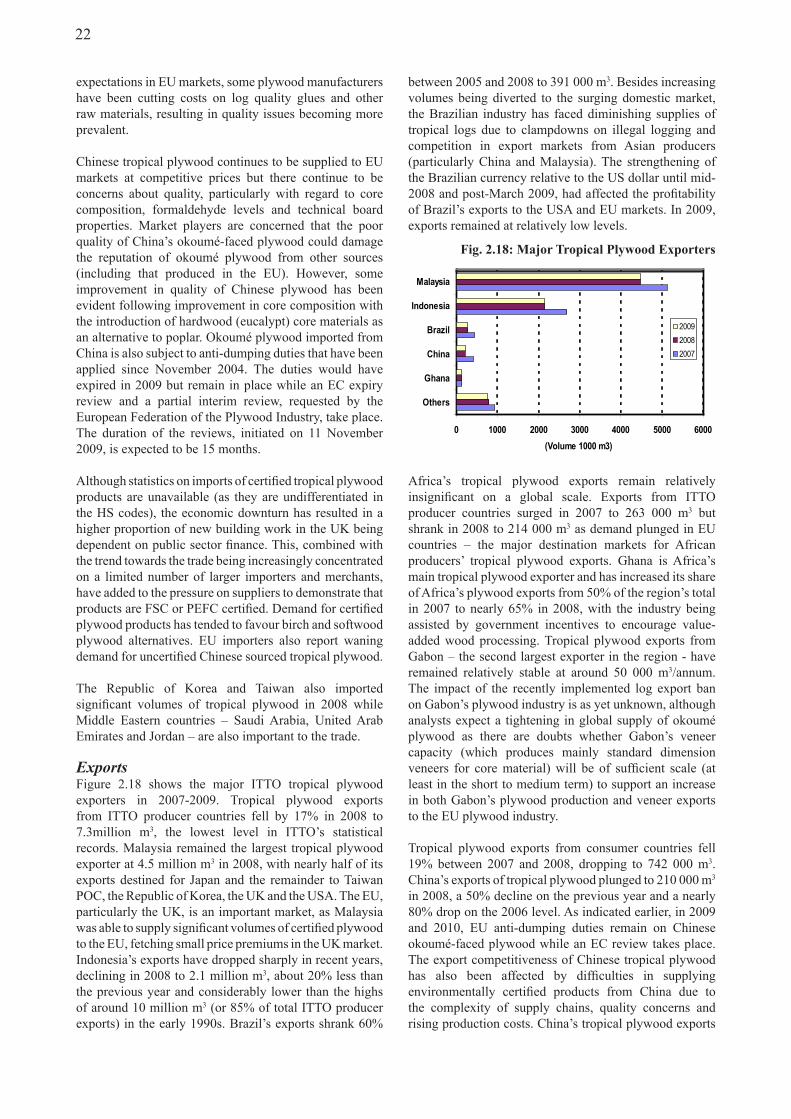
22
between 2005 and 2008 to 391 000 m3. Besides increasing volumes being diverted to the surging domestic market, the Brazilian industry has faced diminishing supplies of tropical logs due to clampdowns on illegal logging and competition in export markets from Asian producers (particularly China and Malaysia). The strengthening of the Brazilian currency relative to the US dollar until mid-2008 and post-March 2009, had affected the profitability of Brazil’s exports to the USA and EU markets. In 2009, exports remained at relatively low levels.
Africa’s tropical plywood exports remain relatively insignificant on a global scale. Exports from ITTO producer countries surged in 2007 to 263 000 m3 but shrank in 2008 to 214 000 m3 as demand plunged in EU countries – the major destination markets for African producers’ tropical plywood exports. Ghana is Africa’s main tropical plywood exporter and has increased its share of Africa’s plywood exports from 50% of the region’s total in 2007 to nearly 65% in 2008, with the industry being assisted by government incentives to encourage value-added wood processing. Tropical plywood exports from Gabon – the second largest exporter in the region - have remained relatively stable at around 50 000 m3/annum. The impact of the recently implemented log export ban on Gabon’s plywood industry is as yet unknown, although analysts expect a tightening in global supply of okoumé plywood as there are doubts whether Gabon’s veneer capacity (which produces mainly standard dimension veneers for core material) will be of sufficient scale (at least in the short to medium term) to support an increase in both Gabon’s plywood production and veneer exports to the EU plywood industry.
Tropical plywood exports from consumer countries fell 19% between 2007 and 2008, dropping to 742 000 m3. China’s exports of tropical plywood plunged to 210 000 m3 in 2008, a 50% decline on the previous year and a nearly 80% drop on the 2006 level. As indicated earlier, in 2009 and 2010, EU anti-dumping duties remain on Chinese okoumé-faced plywood while an EC review takes place. The export competitiveness of Chinese tropical plywood has also been affected by difficulties in supplying environmentally certified products from China due to the complexity of supply chains, quality concerns and rising production costs. China’s tropical plywood exports
expectations in EU markets, some plywood manufacturers have been cutting costs on log quality glues and other raw materials, resulting in quality issues becoming more prevalent.
Chinese tropical plywood continues to be supplied to EU markets at competitive prices but there continue to be concerns about quality, particularly with regard to core composition, formaldehyde levels and technical board properties. Market players are concerned that the poor quality of China’s okoumé-faced plywood could damage the reputation of okoumé plywood from other sources (including that produced in the EU). However, some improvement in quality of Chinese plywood has been evident following improvement in core composition with the introduction of hardwood (eucalypt) core materials as an alternative to poplar. Okoumé plywood imported from China is also subject to anti-dumping duties that have been applied since November 2004. The duties would have expired in 2009 but remain in place while an EC expiry review and a partial interim review, requested by the European Federation of the Plywood Industry, take place. The duration of the reviews, initiated on 11 November 2009, is expected to be 15 months.
Although statistics on imports of certified tropical plywood products are unavailable (as they are undifferentiated in the HS codes), the economic downturn has resulted in a higher proportion of new building work in the UK being dependent on public sector finance. This, combined with the trend towards the trade being increasingly concentrated on a limited number of larger importers and merchants, have added to the pressure on suppliers to demonstrate that products are FSC or PEFC certified. Demand for certified plywood products has tended to favour birch and softwood plywood alternatives. EU importers also report waning demand for uncertified Chinese sourced tropical plywood.
The Republic of Korea and Taiwan also imported significant volumes of tropical plywood in 2008 while Middle Eastern countries – Saudi Arabia, United Arab Emirates and Jordan – are also important to the trade.
ExportsFigure 2.18 shows the major ITTO tropical plywood exporters in 2007-2009. Tropical plywood exports from ITTO producer countries fell by 17% in 2008 to 7.3million m3, the lowest level in ITTO’s statistical records. Malaysia remained the largest tropical plywood exporter at 4.5 million m3 in 2008, with nearly half of its exports destined for Japan and the remainder to Taiwan POC, the Republic of Korea, the UK and the USA. The EU, particularly the UK, is an important market, as Malaysia was able to supply significant volumes of certified plywood to the EU, fetching small price premiums in the UK market. Indonesia’s exports have dropped sharply in recent years, declining in 2008 to 2.1 million m3, about 20% less than the previous year and considerably lower than the highs of around 10 million m3 (or 85% of total ITTO producer exports) in the early 1990s. Brazil’s exports shrank 60%
0 1000 2000 3000 4000 5000 6000
Others
Ghana
China
Brazil
Indonesia
Malaysia
(Volume 1000 m3)
200920082007
................Fig..2.18:.Major.Tropical.Plywood.Exporters
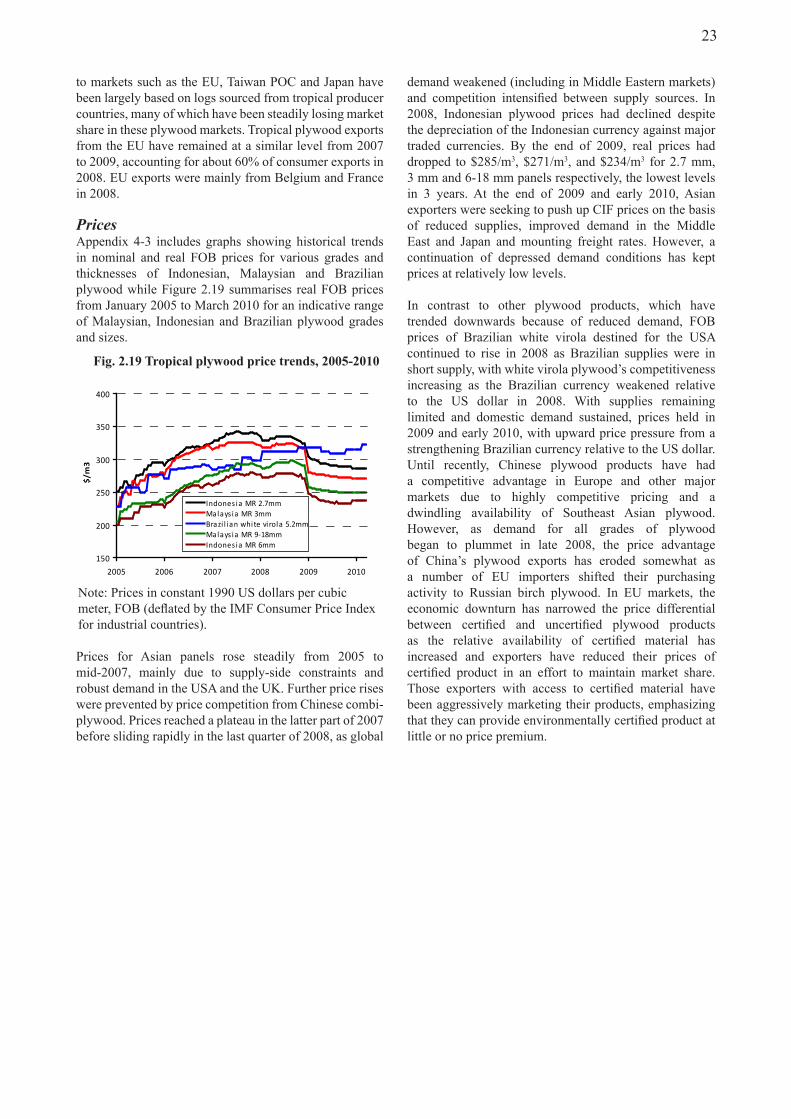
23
to markets such as the EU, Taiwan POC and Japan have been largely based on logs sourced from tropical producer countries, many of which have been steadily losing market share in these plywood markets. Tropical plywood exports from the EU have remained at a similar level from 2007 to 2009, accounting for about 60% of consumer exports in 2008. EU exports were mainly from Belgium and France in 2008.
PricesAppendix 4-3 includes graphs showing historical trends in nominal and real FOB prices for various grades and thicknesses of Indonesian, Malaysian and Brazilian plywood while Figure 2.19 summarises real FOB prices from January 2005 to March 2010 for an indicative range of Malaysian, Indonesian and Brazilian plywood grades and sizes.
Prices for Asian panels rose steadily from 2005 to mid-2007, mainly due to supply-side constraints and robust demand in the USA and the UK. Further price rises were prevented by price competition from Chinese combi-plywood. Prices reached a plateau in the latter part of 2007 before sliding rapidly in the last quarter of 2008, as global
demand weakened (including in Middle Eastern markets) and competition intensified between supply sources. In 2008, Indonesian plywood prices had declined despite the depreciation of the Indonesian currency against major traded currencies. By the end of 2009, real prices had dropped to $285/m3, $271/m3, and $234/m3 for 2.7 mm, 3 mm and 6-18 mm panels respectively, the lowest levels in 3 years. At the end of 2009 and early 2010, Asian exporters were seeking to push up CIF prices on the basis of reduced supplies, improved demand in the Middle East and Japan and mounting freight rates. However, a continuation of depressed demand conditions has kept prices at relatively low levels.
In contrast to other plywood products, which have trended downwards because of reduced demand, FOB prices of Brazilian white virola destined for the USA continued to rise in 2008 as Brazilian supplies were in short supply, with white virola plywood’s competitiveness increasing as the Brazilian currency weakened relative to the US dollar in 2008. With supplies remaining limited and domestic demand sustained, prices held in 2009 and early 2010, with upward price pressure from a strengthening Brazilian currency relative to the US dollar. Until recently, Chinese plywood products have had a competitive advantage in Europe and other major markets due to highly competitive pricing and a dwindling availability of Southeast Asian plywood. However, as demand for all grades of plywood began to plummet in late 2008, the price advantage of China’s plywood exports has eroded somewhat as a number of EU importers shifted their purchasing activity to Russian birch plywood. In EU markets, the economic downturn has narrowed the price differential between certified and uncertified plywood products as the relative availability of certified material has increased and exporters have reduced their prices of certified product in an effort to maintain market share. Those exporters with access to certified material have been aggressively marketing their products, emphasizing that they can provide environmentally certified product at little or no price premium.
150
200
250
300
350
400
2005 2006 2007 2008 2009 2010
$/m3
Indones ia MR 2.7mmMalays ia MR 3mmBrazi l ian white vi rola 5.2mmMalays ia MR 9-18mmIndones ia MR 6mm
Note: Prices in constant 1990 US dollars per cubic meter, FOB (deflated by the IMF Consumer Price Index for industrial countries).
.....Fig..2.19.Tropical.plywood.price.trends,.2005-2010
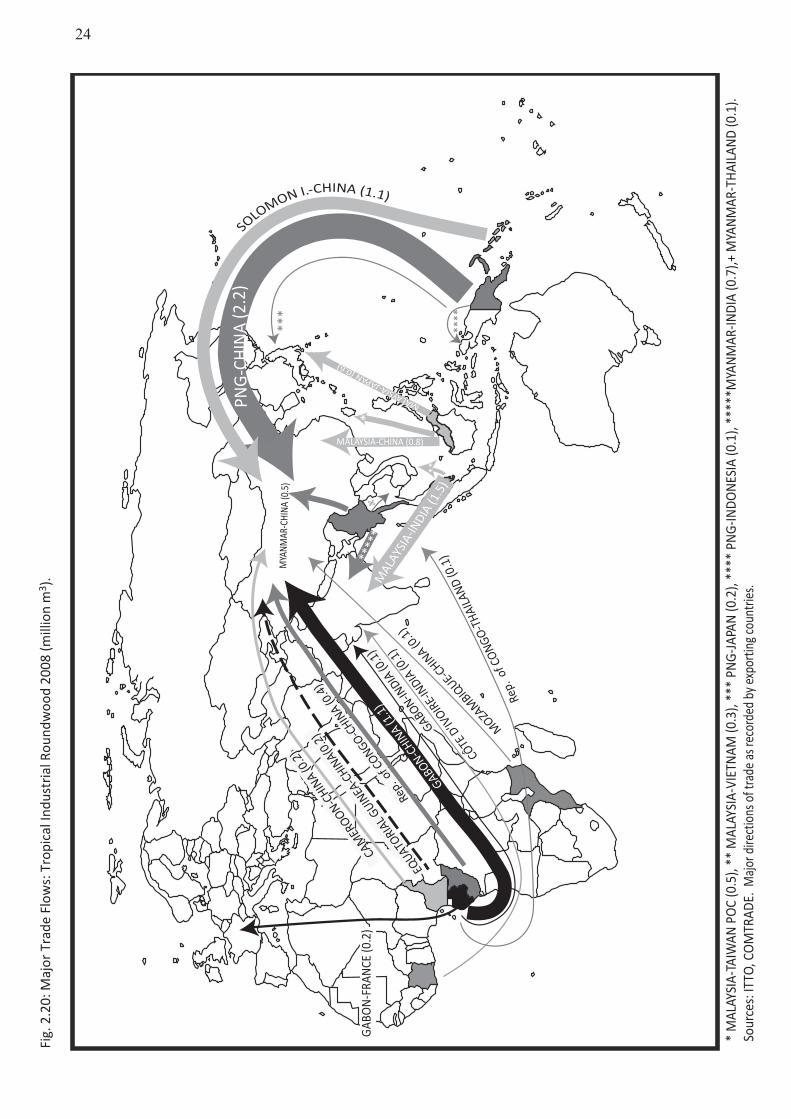
24
GABON-C
HINA (1
.1)
PNG
-CH
INA
(2.2
)
MAL
AYSI
A-IN
DIA (1
.5)
*
* M
ALAY
SIA-
TAIW
AN P
OC
(0.5
), **
MAL
AYSI
A-VI
ETN
AM (0
.3),
***
PNG
-JAPA
N (0
.2),
****
PN
G-IN
DON
ESIA
(0.1
), **
***M
YAN
MAR
-INDI
A (0
.7),+
MYA
NM
AR-T
HAIL
AND
(0.1
). So
urce
s: IT
TO, C
OM
TRAD
E. M
ajor
dire
ctio
ns o
f tra
de a
s rec
orde
d by
exp
ortin
g cou
ntrie
s.
Fig.
2.2
0: M
ajor
Tra
de F
low
s: T
ropi
cal I
ndus
tria
l Rou
ndw
ood
2008
(mill
ion
m3 )
.
MYA
NMAR
-CHI
NA (0
.5)
**
***
MALAYSIA-CHINA (0.8)
CÔTE
D'IV
OIRE-
INDIA
(0.1
)Re
p. o
f CONGO-C
HINA (0
.4)
EQUATO
RIAL G
UINEA
-CHIN
A(0.2
) GABON-IN
DIA (0
.1)
CAM
EROON-C
HINA (0
.2)
MOZA
MBIQ
UE-CHIN
A (0.1)
****
GAB
ON
-FRA
NCE
(0.2
)**
***
+
Rep.
of C
ONGO
-THA
ILAND
(0.1
)
MALAYSIA-JAPAN (0.6)
SOLO
MON I.-CHINA (1.1)
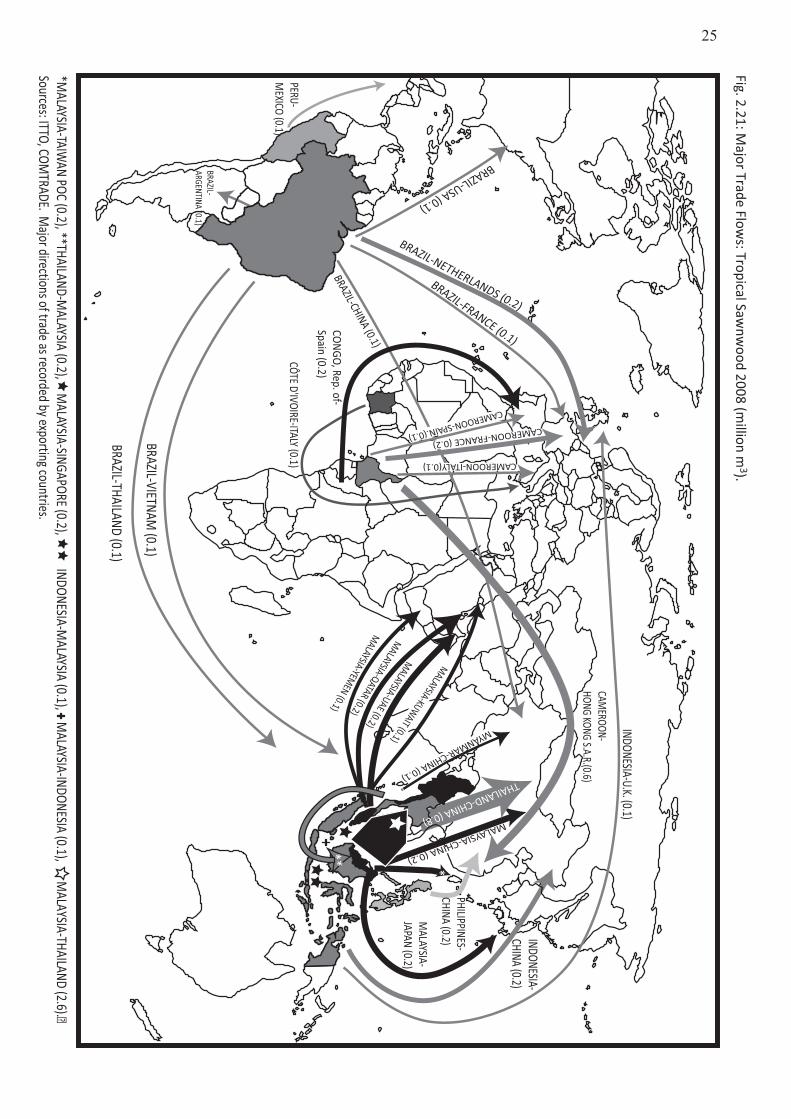
25
BRAZIL-FRANCE (0.1)
BRAZIL-USA (0.1)
BRAZIL-CHINA (0.1)
INDONESIA-CHINA (0.2)
*
*MALAYSIA-TAIW
AN POC (0.2), **THAILAND-MALAYSIA (0.2), M
ALAYSIA-SINGAPORE (0.2), INDONESIA-MALAYSIA (0.1), + M
ALAYSIA-INDONESIA (0.1), MALAYSIA-THAILAND (2.6).�
Sources: ITTO, COMTRADE. M
ajor directions of trade as recorded by exporting countries.
MALAYSIA-CHINA (0.2)
**
Fig. 2.21: Major Trade Flow
s: Tropical Sawnw
ood 2008 (million m
3).
MYANMAR-CHINA (0.1)
CAMEROON-FRANCE (0.2)
CAMEROON-SPAIN.(0.1)
MALAYSIA-
JAPAN (0.2)
MALAYSIA-YEM
EN (0.1)
THAILAND-CHINA (0.8)
BRAZIL-NETHERLANDS (0.2)
BRAZIL-VIETNAM (0.1)
CAMEROON-ITALY(0.1)
CÔTE D'IVOIRE-ITALY (0.1)PERU-M
EXICO (0.1)
PHILIPPINES-CHINA (0.2)
MALAYSIA-UAE (0.2)
MALAYSIA-QATAR (0.2)
MALAYSIA-KUW
AIT (0.1)
+
BRAZIL-THAILAND (0.1)
BRAZIL-ARGENTINA (0.1)
INDONESIA-U.K. (0.1)
CAMEROON-
HONG KONG S.A.R.(0.6)
CON
GO, Rep. of-Spain (0.2)
**+
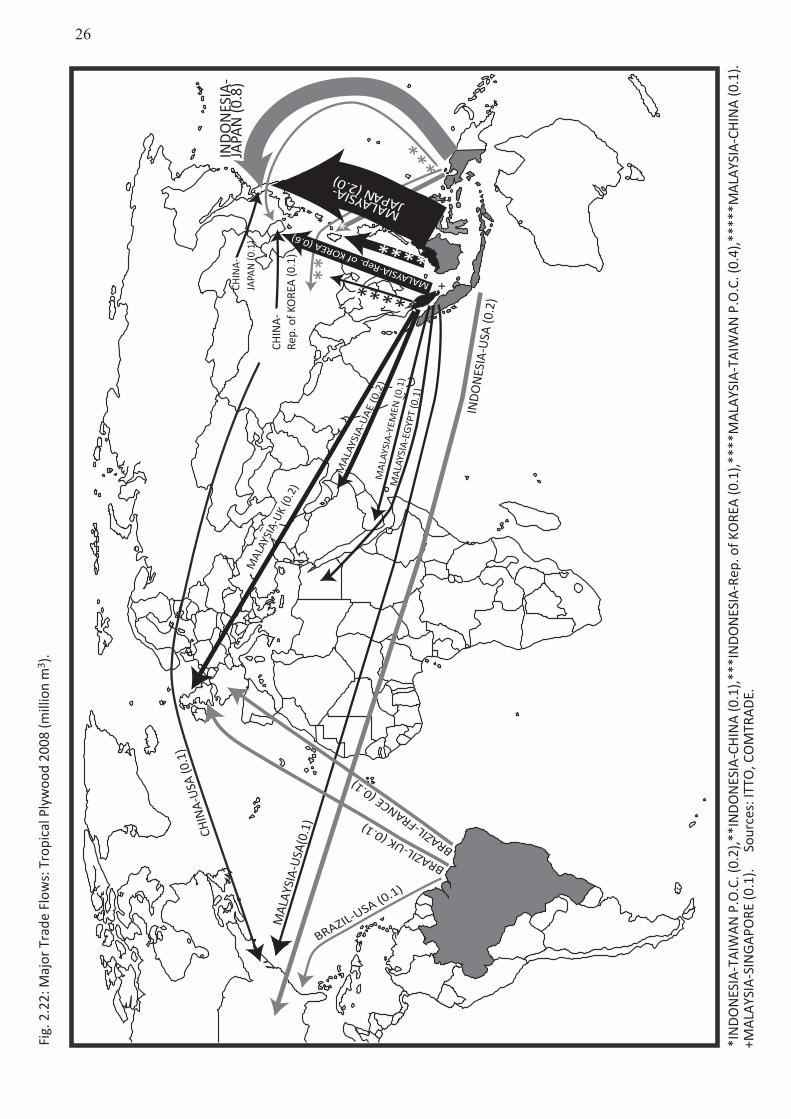
26
MALAYSIA-JAPAN (2.0)
IND
ON
ESIA
-JA
PAN
(0.8
)
*
*IN
DO
NES
IA-T
AIW
AN P
.O.C
. (0.
2),*
*IN
DO
NES
IA-C
HIN
A (0
.1),*
**IN
DO
NES
IA-R
ep. o
f KO
REA
(0.1
),***
*MAL
AYSI
A-TA
IWAN
P.O
.C. (
0.4)
,***
**M
ALAY
SIA-
CHIN
A (0
.1).
**
***
****
MALAYSIA-Rep. of KOREA (0.6)
MAL
AYSI
A-U
SA(0
.1)
BRAZIL-UK (0.1)
BRAZIL-USA (0.1)
CHIN
A-U
SA (0
.1)
CHIN
A-Re
p. o
f KO
REA
(0.1
)
MAL
AYSI
A-U
K (0
.2)
MA
LAYS
IA-U
AE
(0.2
)
IND
ON
ESIA
-USA
(0.2
)
Fig.
2.2
2: M
ajor
Tra
de F
low
s: T
ropi
cal P
lyw
ood
2008
(mill
ion
m3 )
.
+MAL
AYSI
A-SI
NG
APO
RE (0
.1).
S
ourc
es: I
TTO
, CO
MTR
ADE.
MAL
AYSI
A-EG
YPT
(0.1
)
MA
LAYS
IA-Y
EMEN
(0.1
)
*****
+
BRAZIL-FRANCE (0.1)
CHIN
A-JA
PAN
(0.1
)
27
3. TRADE AND PRICES OF SECONDARY PROCESSED WOOD PRODUCTS
Highlights
● ITTO consumer countries continued to dominate global trade in secondary processed wood products (SPWPs), accounting for 60% of the global trade and more than 80% of the world’s imports in 2008.
● Among ITTO producer regions, the Asian and Latin American regions were still active in trade, while the African region continued to show lower activity, constrained by limited processing capabilities.
● As markets began to shrink in major importing countries due to the weak demand caused by the global financial and economic crises, the growth of world’s imports of SPWPs slowed down significantly.
● For the first time since 2001, SPWP imports by ITTO consumer countries declined, including in particular the USA, Japan and some EU countries, with this trend continuing in the first half of 2009.
● Although the USA continued to dominate overall imports, accounting for 23% of the world’s imports of all SPWP products, imports dropped 12% between 2007 and 2008. EU’s import growth slowed during the same period to 1.3%, compared with nearly 20% in the previous year, while Japan’s declined by more than 3%.
● China has been the largest global exporter of SPWPs since 2003, although growth in SPWP exports appeared to slow dramatically from 20% annual growth on average over the past few years to less than 2% in 2008.
● ITTO tropical producers’ exports declined slightly in 2008, accounting for 12% of the world’s exports, and most producer country exports were from the Asia-Pacific region (70%) followed by Latin America (28%).
● Wooden furniture and parts constitutes more than 60% of global SPWP trade, followed by builder’s woodwork, other SPWPs, mouldings, and cane and bamboo furniture and parts.
● US wooden furniture imports dropped 10% in 2008 as housing starts and consumer spending continued to decline.
● With both export and domestic markets in difficulty, growth in China’s wooden furniture exports slowed sharply, after nearly twenty years of rapid growth at an average rate of around 30%.
● ITTO producers continued to play a more significant role in global mouldings exports compared with exports of other SPWP items, accounting for almost 30% of world exports of wooden mouldings in 2008.
28
Secondary Processed Wood Products Trade Overview
Major importers of SPWPsAs in previous years, ITTO consumers were the major SPWP importers, accounting for more than 83% of the world’s imports in 2008 and most of the global trade (60%) is between ITTO consumer countries. In 2008, annual growth in world imports of SPWPs slowed significantly to 1%, even though imports reached a record value of $92.5 billion. SPWP imports by many major importers such as the USA, Japan and some EU countries had declined. This trend had continued in the first half of 2009, suggesting a possible decline in annual global imports of SPWPs in 2009.
Despite a significant (12%) drop in imports on the previous year, the USA continued to dominate global SPWP imports, with $21 billion worth of imports in 2008, accounting for 27% of ITTO consumer imports and 23% of world imports. The sizeable drop in US imports was the major contributor to world SPWP import growth slowing to 1% in 2008, from nearly 20% in 2007. Germany continued to be the largest EU consumer with $6.8 billion, slightly up from last year. Following Germany, France’s imports increased 10%, replacing the UK as the second largest EU importer, while the UK and Italy’s SPWP imports declined. For the first time in the past 5 years, Japan’s imports declined by more than 3%.
Tropical countries continued to import comparatively smaller volumes of SPWP products. In 2008, ITTO producers imported $2.6 billion from the world, accounting for only 3% of the consumer imports but the import value had grown 40% on the previous year. Mexico, Singapore, Indonesia, Malaysia, India and Brazil were the major tropical importers of SPWP. Among tropical countries, Indonesia and Brazil increased their SPWP imports substantially during the same period.
Major exporters of SPWPsITTO consumers exported $68.2 billion of SPWPs in 2008, accounting for 75% of the world’s exports. With SPWP exports valued at $16.4 billion, China has continued to be the world’s largest exporter since 2003, accounting for 24% of ITTO consumers’ exports. However, due to weak demand from China’s major markets, as particularly reflected by the decline in wooden furniture imports from the USA, the rapid growth of China’s SPWP exports appeared to have slowed down in 2008. The annual growth rate was less than 2%, compared with 20% on the average over the past few years and this trend has continued in early 2009. Similarly, growth in the EU’s SPWP exports slowed, with Italy and Germany being the two major exporters in the EU. Poland maintained its fourth position, with exports growing 10% on the previous year.SPWP exports from most of the major tropical exporters (except Vietnam) declined slightly in 2008. ITTO producers accounted for 12% of world SPWP exports in 2008, with the share remaining stable over the past three years. Asia-Pacific was the dominant ITTO producer
This chapter provides statistics and analysis of trade of secondary processed wood products in ITTO producer and consumer countries.
SPWP Data Sources and Trade Classifi-cation
The SPWP trade data presented here was extracted from the COMTRADE database which at the time of preparation contained time series of trade statistics up to 2008 for most developed and some developing countries. This chapter is based on these trade value data for the 2004-2008 period which are summarized in Tables 5-1 to 5-8 in Appendix 5.
Data in these tables has been ranked by 2008 trade figures, the reference year for this analysis, although 2008 figures were still preliminary or missing in many cases (particularly for producer countries) at the time of downloading the data from COMTRADE in early 2010.
As the base year is 2008, the more recent impacts of the global financial and economic crises are not captured in the analysis of this data. Where possible, however, comments are provided on the impacts of the crisis in 2009 and 2010 on SPWP trade.
Appendix 5 shows the SPWP categories employed in the analysis together with their corresponding trade nomenclature in the Standard International Trade Classification, Revision 3 (SITC, Rev.3) and in the 1996,2002 and 2007 versions of the Harmonized Commodity Description and Coding System of the Customs Cooperation Council (Harmonized System or HS 96/02/07).
The primary categories of tropical SPWP in trade are wooden furniture and parts (the major category, accounting on the average for almost two thirds of trade values); builders’ woodwork (joinery and carpentry); other SPWP (packing, wooden boxes, etc.; casks, barrels, vats and other cooper’s products; picture frames; table/kitchenware and other articles for domestic/decorative use; and tools, handles, brooms and other manufactured products) and mouldings (continuously shaped or profiled wood, including mouldings, unassembled strips and friezes for parquet flooring, beaded wood, dowels, etc).
Since furniture and parts of cane and bamboo have become important non-wood tropical forest products exports for many ITTO member countries, these products are also included in this analysis. It should be noted that other SPWP analyses sometimes cover product categories not included here (e.g. “other” furniture parts) which may or may not include wood.
This analysis includes only those products explicitly specified as including wood or non-wood forest products such as bamboo and rattan. It should also be noted that tropical and non-tropical SPWPs are not differentiated in the trade statistics and that data presented in Tables 5-1 to 5-8 in Appendix 5 include all species.
29
and policies, particularly in the wooden furniture sector. China’s wooden furniture exports had become dependent on the USA, the EU and Japan, with the US market receiving almost half of China’s wooden furniture exports. In order to increase their profitability, many US and European furniture manufacturers were either increasing their investment in production in China or outsourcing the production of semi-finished pieces to China, as Original Equipment Manufacturing (OEM) became the main strategy to the US market. CNFA (2009) estimates that around 60% of Chinese wooden furniture exports were from foreign furniture companies while nearly 90% of furniture products made by Chinese small and medium-sized enterprises were produced for OEM.
In addition to strong competition from other producers and exporters to low and medium-quality furniture markets, China has also faced serious trade frictions with its major trading partners, particularly the USA and some European countries, who have faced pressure from domestic producers to impose tariffs and other trade measures to protect their domestic markets against low cost imports from China. Since 2004, the Chinese wooden bedroom furniture industry had been subject to US anti-dumping measures which have had a significant impact on furniture enterprises including US invested companies. In 2008, the US Lacey Act amendments as well as EU’s newly issued technical standards and forest certification requirements could potentially further weaken the competitiveness of China’s furniture exports to the US and EU markets.
During the latter half of 2008 and early 2009, the impact of the global economic crisis on global furniture trade became evident. Demand for furniture in major markets, especially the USA, appeared to have sharply declined due to a slowdown in the housing construction market. China’s export-oriented furniture manufacturers suffered from a lack of new orders as housing starts and consumer spending rapidly slumped. After nearly twenty years of rapid expansion at an average annual growth in value of around 30%, China’s wooden furniture export appeared to slow down sharply, increasing by only 3% in 2008.
Following the deterioration in the international trading environment, China’s furniture industry has undergone considerable restructuring, with furniture enterprises taking advantage of national economic stimulation policies, including the resumption of VAT rebates for furniture exports, and the downsizing of less competitive enterprises. Exporters have also been exploring newly emerging markets such as the Middle East, Russia, and ASEAN countries, to reduce reliance on the US market. As a result of these efforts, the share of wooden furniture exports to the US market declined from 48% in 2007 to 35% in 2009 (CNFA 2009). Another export strategy has been to divert some furniture production from wooden bedroom furniture items (which have been subject to US anti-dumping measures) to seats with wooden frames. These strategies and other measures such as technology upgrades and focusing on expansion of the domestic
region, accounting for more than 70% of ITTO producers’ exports, followed by Latin America (28%). African SPWP exports remain at very low levels.
Vietnam’s SPWP exports have expanded significantly in recent years and in 2007 it became the largest tropical exporter of SPWPs. Although figures for 2009 are unavailable, anecdotal reports suggest that Vietnam has maintained its export growth despite the downturn in global markets. This year’s SPWP exports reached $3.4 billion, 13% up on 2007. Following Vietnam, ITTO producer countries including Indonesia, Malaysia, Brazil, Thailand, the Philippines and Mexico, were the major exporters of SPWPs.
Wooden Furniture and Parts
Wooden furniture and parts is the major SPWP product of ITTO producer and consumer countries and constitutes more than 60% of trade between them, followed by builder’s woodwork, other SPWPs, mouldings, and cane and bamboo furniture and parts. The most important importers and exporters of wooden furniture and parts in 2008 are shown in Tables 5-2 and 5-6 in Appendix 5.
Exports of Wooden Furniture and PartsITTO consumers exported $ 44.5 billion of wooden furniture and parts in 2008, an increase of 10% from 2007. Exports by ITTO consumers accounted for 79% of world exports, slightly less than the previous year. Most of the trade in wooden furniture and parts (77%) was between ITTO consumer countries. In addition to the tropical supplying countries, this analysis focuses on exports from the two major wooden furniture exporters – China and Italy – as both countries import considerable volumes of tropical primary products for use in their domestic furniture industries. Although tropical wooden furniture items are unable to be differentiated in the HS codes, it can be assumed that wooden furniture exports from these two countries will include a considerable volume/value of tropical wooden furniture items and therefore trends are relevant to the tropical trade.
China has been the world’s largest exporter of wooden furniture and parts since 2005, based on more than ten years’ expansion at around 30% average annual growth rate of furniture production and exports. In 2007 and 2008, China was the only exporter with exports of wooden furniture and parts exceeding $10 billion. Similar to the previous year, China accounted for one-fifth of world exports and more than one-quarter of ITTO consumers’ exports in 2008. Wooden furniture and parts was also China’s largest wood product export item, accounting for one-third of wood product exports and two-thirds of SPWP exports.
China’s growth in wooden furniture production and exports to 2007 reflected sustained growth in the world economy and associated strong global demand for furniture, and adoption of export-oriented strategies
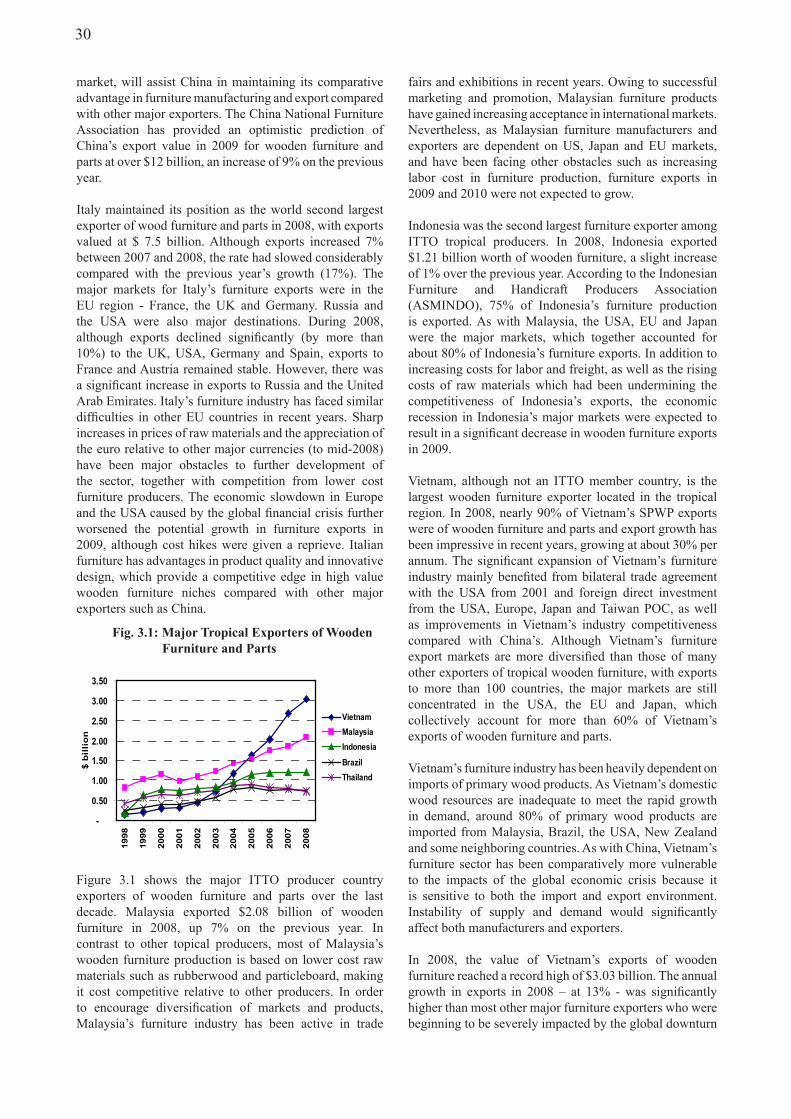
30
fairs and exhibitions in recent years. Owing to successful marketing and promotion, Malaysian furniture products have gained increasing acceptance in international markets. Nevertheless, as Malaysian furniture manufacturers and exporters are dependent on US, Japan and EU markets, and have been facing other obstacles such as increasing labor cost in furniture production, furniture exports in 2009 and 2010 were not expected to grow.
Indonesia was the second largest furniture exporter among ITTO tropical producers. In 2008, Indonesia exported $1.21 billion worth of wooden furniture, a slight increase of 1% over the previous year. According to the Indonesian Furniture and Handicraft Producers Association (ASMINDO), 75% of Indonesia’s furniture production is exported. As with Malaysia, the USA, EU and Japan were the major markets, which together accounted for about 80% of Indonesia’s furniture exports. In addition to increasing costs for labor and freight, as well as the rising costs of raw materials which had been undermining the competitiveness of Indonesia’s exports, the economic recession in Indonesia’s major markets were expected to result in a significant decrease in wooden furniture exports in 2009.
Vietnam, although not an ITTO member country, is the largest wooden furniture exporter located in the tropical region. In 2008, nearly 90% of Vietnam’s SPWP exports were of wooden furniture and parts and export growth has been impressive in recent years, growing at about 30% per annum. The significant expansion of Vietnam’s furniture industry mainly benefited from bilateral trade agreement with the USA from 2001 and foreign direct investment from the USA, Europe, Japan and Taiwan POC, as well as improvements in Vietnam’s industry competitiveness compared with China’s. Although Vietnam’s furniture export markets are more diversified than those of many other exporters of tropical wooden furniture, with exports to more than 100 countries, the major markets are still concentrated in the USA, the EU and Japan, which collectively account for more than 60% of Vietnam’s exports of wooden furniture and parts.
Vietnam’s furniture industry has been heavily dependent on imports of primary wood products. As Vietnam’s domestic wood resources are inadequate to meet the rapid growth in demand, around 80% of primary wood products are imported from Malaysia, Brazil, the USA, New Zealand and some neighboring countries. As with China, Vietnam’s furniture sector has been comparatively more vulnerable to the impacts of the global economic crisis because it is sensitive to both the import and export environment. Instability of supply and demand would significantly affect both manufacturers and exporters.
In 2008, the value of Vietnam’s exports of wooden furniture reached a record high of $3.03 billion. The annual growth in exports in 2008 – at 13% - was significantly higher than most other major furniture exporters who were beginning to be severely impacted by the global downturn
market, will assist China in maintaining its comparative advantage in furniture manufacturing and export compared with other major exporters. The China National Furniture Association has provided an optimistic prediction of China’s export value in 2009 for wooden furniture and parts at over $12 billion, an increase of 9% on the previous year.
Italy maintained its position as the world second largest exporter of wood furniture and parts in 2008, with exports valued at $ 7.5 billion. Although exports increased 7% between 2007 and 2008, the rate had slowed considerably compared with the previous year’s growth (17%). The major markets for Italy’s furniture exports were in the EU region - France, the UK and Germany. Russia and the USA were also major destinations. During 2008, although exports declined significantly (by more than 10%) to the UK, USA, Germany and Spain, exports to France and Austria remained stable. However, there was a significant increase in exports to Russia and the United Arab Emirates. Italy’s furniture industry has faced similar difficulties in other EU countries in recent years. Sharp increases in prices of raw materials and the appreciation of the euro relative to other major currencies (to mid-2008) have been major obstacles to further development of the sector, together with competition from lower cost furniture producers. The economic slowdown in Europe and the USA caused by the global financial crisis further worsened the potential growth in furniture exports in 2009, although cost hikes were given a reprieve. Italian furniture has advantages in product quality and innovative design, which provide a competitive edge in high value wooden furniture niches compared with other major exporters such as China.
Figure 3.1 shows the major ITTO producer country exporters of wooden furniture and parts over the last decade. Malaysia exported $2.08 billion of wooden furniture in 2008, up 7% on the previous year. In contrast to other topical producers, most of Malaysia’s wooden furniture production is based on lower cost raw materials such as rubberwood and particleboard, making it cost competitive relative to other producers. In order to encourage diversification of markets and products, Malaysia’s furniture industry has been active in trade
-
0.50
1.00
1.50
2.00
2.50
3.00
3.50
1998
1999
2000
2001
2002
2003
2004
2005
2006
2007
2008
$ b
illi
on
VietnamMalaysiaIndonesia
BrazilThailand
................Fig..3.1:.Major.Tropical.Exporters.of.Wooden
...............................Furniture.and.Parts
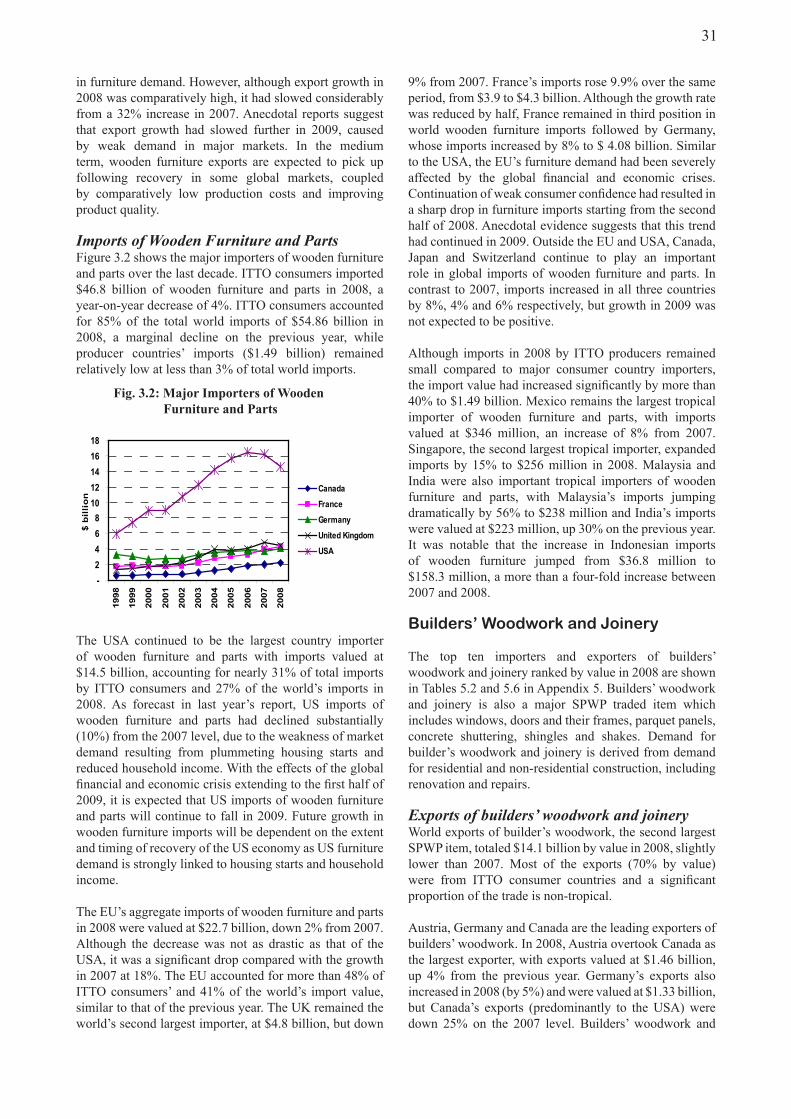
31
9% from 2007. France’s imports rose 9.9% over the same period, from $3.9 to $4.3 billion. Although the growth rate was reduced by half, France remained in third position in world wooden furniture imports followed by Germany, whose imports increased by 8% to $ 4.08 billion. Similar to the USA, the EU’s furniture demand had been severely affected by the global financial and economic crises. Continuation of weak consumer confidence had resulted in a sharp drop in furniture imports starting from the second half of 2008. Anecdotal evidence suggests that this trend had continued in 2009. Outside the EU and USA, Canada, Japan and Switzerland continue to play an important role in global imports of wooden furniture and parts. In contrast to 2007, imports increased in all three countries by 8%, 4% and 6% respectively, but growth in 2009 was not expected to be positive.
Although imports in 2008 by ITTO producers remained small compared to major consumer country importers, the import value had increased significantly by more than 40% to $1.49 billion. Mexico remains the largest tropical importer of wooden furniture and parts, with imports valued at $346 million, an increase of 8% from 2007. Singapore, the second largest tropical importer, expanded imports by 15% to $256 million in 2008. Malaysia and India were also important tropical importers of wooden furniture and parts, with Malaysia’s imports jumping dramatically by 56% to $238 million and India’s imports were valued at $223 million, up 30% on the previous year. It was notable that the increase in Indonesian imports of wooden furniture jumped from $36.8 million to $158.3 million, a more than a four-fold increase between 2007 and 2008.
Builders’ Woodwork and Joinery
The top ten importers and exporters of builders’ woodwork and joinery ranked by value in 2008 are shown in Tables 5.2 and 5.6 in Appendix 5. Builders’ woodwork and joinery is also a major SPWP traded item which includes windows, doors and their frames, parquet panels, concrete shuttering, shingles and shakes. Demand for builder’s woodwork and joinery is derived from demand for residential and non-residential construction, including renovation and repairs.
Exports of builders’ woodwork and joineryWorld exports of builder’s woodwork, the second largest SPWP item, totaled $14.1 billion by value in 2008, slightly lower than 2007. Most of the exports (70% by value) were from ITTO consumer countries and a significant proportion of the trade is non-tropical.
Austria, Germany and Canada are the leading exporters of builders’ woodwork. In 2008, Austria overtook Canada as the largest exporter, with exports valued at $1.46 billion, up 4% from the previous year. Germany’s exports also increased in 2008 (by 5%) and were valued at $1.33 billion, but Canada’s exports (predominantly to the USA) were down 25% on the 2007 level. Builders’ woodwork and
in furniture demand. However, although export growth in 2008 was comparatively high, it had slowed considerably from a 32% increase in 2007. Anecdotal reports suggest that export growth had slowed further in 2009, caused by weak demand in major markets. In the medium term, wooden furniture exports are expected to pick up following recovery in some global markets, coupled by comparatively low production costs and improving product quality.
Imports of Wooden Furniture and PartsFigure 3.2 shows the major importers of wooden furniture and parts over the last decade. ITTO consumers imported $46.8 billion of wooden furniture and parts in 2008, a year-on-year decrease of 4%. ITTO consumers accounted for 85% of the total world imports of $54.86 billion in 2008, a marginal decline on the previous year, while producer countries’ imports ($1.49 billion) remained relatively low at less than 3% of total world imports.
The USA continued to be the largest country importer of wooden furniture and parts with imports valued at $14.5 billion, accounting for nearly 31% of total imports by ITTO consumers and 27% of the world’s imports in 2008. As forecast in last year’s report, US imports of wooden furniture and parts had declined substantially (10%) from the 2007 level, due to the weakness of market demand resulting from plummeting housing starts and reduced household income. With the effects of the global financial and economic crisis extending to the first half of 2009, it is expected that US imports of wooden furniture and parts will continue to fall in 2009. Future growth in wooden furniture imports will be dependent on the extent and timing of recovery of the US economy as US furniture demand is strongly linked to housing starts and household income.
The EU’s aggregate imports of wooden furniture and parts in 2008 were valued at $22.7 billion, down 2% from 2007. Although the decrease was not as drastic as that of the USA, it was a significant drop compared with the growth in 2007 at 18%. The EU accounted for more than 48% of ITTO consumers’ and 41% of the world’s import value, similar to that of the previous year. The UK remained the world’s second largest importer, at $4.8 billion, but down
-2468
1012141618
1998
1999
2000
2001
2002
2003
2004
2005
2006
2007
2008
$ b
illi
on
Canada
France
Germany
United Kingdom
USA
.................Fig..3.2:.Major.Importers.of.Wooden
................................Furniture.and.Parts
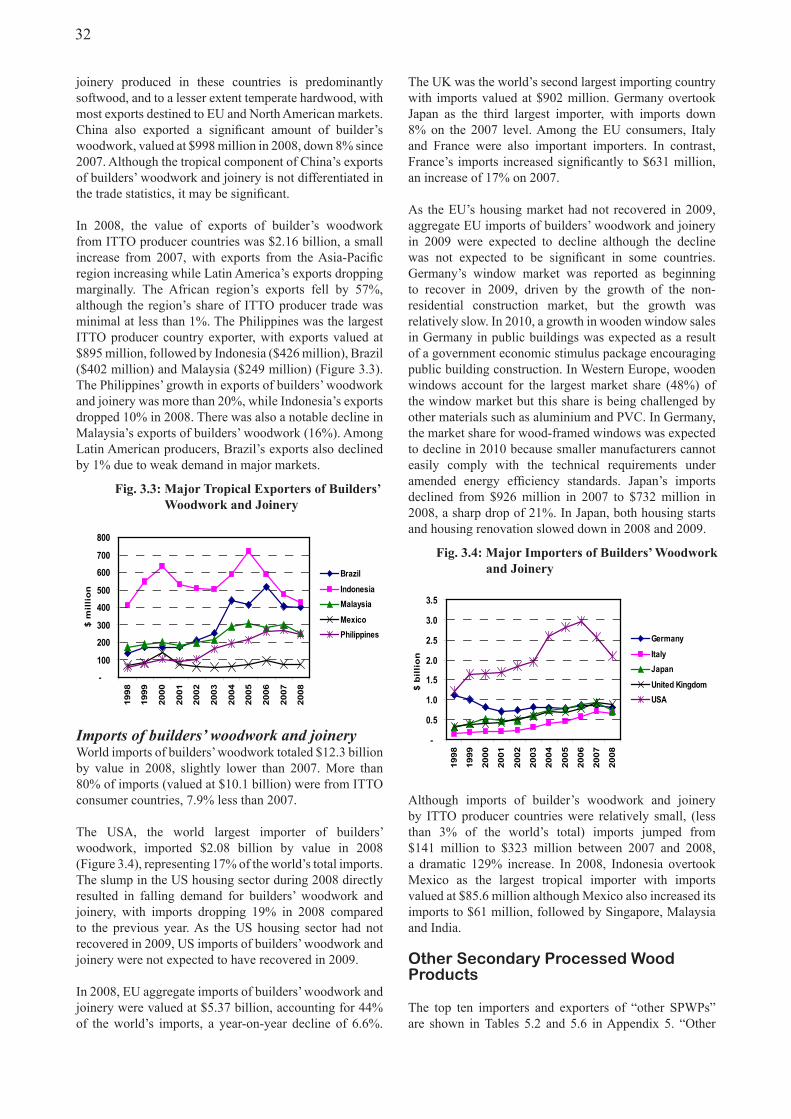
32
The UK was the world’s second largest importing country with imports valued at $902 million. Germany overtook Japan as the third largest importer, with imports down 8% on the 2007 level. Among the EU consumers, Italy and France were also important importers. In contrast, France’s imports increased significantly to $631 million, an increase of 17% on 2007.
As the EU’s housing market had not recovered in 2009, aggregate EU imports of builders’ woodwork and joinery in 2009 were expected to decline although the decline was not expected to be significant in some countries. Germany’s window market was reported as beginning to recover in 2009, driven by the growth of the non-residential construction market, but the growth was relatively slow. In 2010, a growth in wooden window sales in Germany in public buildings was expected as a result of a government economic stimulus package encouraging public building construction. In Western Europe, wooden windows account for the largest market share (48%) of the window market but this share is being challenged by other materials such as aluminium and PVC. In Germany, the market share for wood-framed windows was expected to decline in 2010 because smaller manufacturers cannot easily comply with the technical requirements under amended energy efficiency standards. Japan’s imports declined from $926 million in 2007 to $732 million in 2008, a sharp drop of 21%. In Japan, both housing starts and housing renovation slowed down in 2008 and 2009.
Although imports of builder’s woodwork and joinery by ITTO producer countries were relatively small, (less than 3% of the world’s total) imports jumped from $141 million to $323 million between 2007 and 2008, a dramatic 129% increase. In 2008, Indonesia overtook Mexico as the largest tropical importer with imports valued at $85.6 million although Mexico also increased its imports to $61 million, followed by Singapore, Malaysia and India.
Other Secondary Processed Wood Products
The top ten importers and exporters of “other SPWPs” are shown in Tables 5.2 and 5.6 in Appendix 5. “Other
joinery produced in these countries is predominantly softwood, and to a lesser extent temperate hardwood, with most exports destined to EU and North American markets. China also exported a significant amount of builder’s woodwork, valued at $998 million in 2008, down 8% since 2007. Although the tropical component of China’s exports of builders’ woodwork and joinery is not differentiated in the trade statistics, it may be significant.
In 2008, the value of exports of builder’s woodwork from ITTO producer countries was $2.16 billion, a small increase from 2007, with exports from the Asia-Pacific region increasing while Latin America’s exports dropping marginally. The African region’s exports fell by 57%, although the region’s share of ITTO producer trade was minimal at less than 1%. The Philippines was the largest ITTO producer country exporter, with exports valued at $895 million, followed by Indonesia ($426 million), Brazil ($402 million) and Malaysia ($249 million) (Figure 3.3). The Philippines’ growth in exports of builders’ woodwork and joinery was more than 20%, while Indonesia’s exports dropped 10% in 2008. There was also a notable decline in Malaysia’s exports of builders’ woodwork (16%). Among Latin American producers, Brazil’s exports also declined by 1% due to weak demand in major markets.
Imports of builders’ woodwork and joineryWorld imports of builders’ woodwork totaled $12.3 billion by value in 2008, slightly lower than 2007. More than 80% of imports (valued at $10.1 billion) were from ITTO consumer countries, 7.9% less than 2007.
The USA, the world largest importer of builders’ woodwork, imported $2.08 billion by value in 2008 (Figure 3.4), representing 17% of the world’s total imports. The slump in the US housing sector during 2008 directly resulted in falling demand for builders’ woodwork and joinery, with imports dropping 19% in 2008 compared to the previous year. As the US housing sector had not recovered in 2009, US imports of builders’ woodwork and joinery were not expected to have recovered in 2009.
In 2008, EU aggregate imports of builders’ woodwork and joinery were valued at $5.37 billion, accounting for 44% of the world’s imports, a year-on-year decline of 6.6%.
-
100
200
300
400
500
600
700
800
1998
1999
2000
2001
2002
2003
2004
2005
2006
2007
2008
$ m
illi
on
Brazil
IndonesiaMalaysia
MexicoPhilippines
................Fig..3.3:.Major.Tropical.Exporters.of.Builders’.
...............................Woodwork.and.Joinery
-
0.5
1.0
1.5
2.0
2.5
3.0
3.5
1998
1999
2000
2001
2002
2003
2004
2005
2006
2007
2008
$ b
illi
on
Germany
ItalyJapan
United KingdomUSA
...............Fig..3.4:.Major.Importers.of.Builders’.Woodwork
..............................and.Joinery
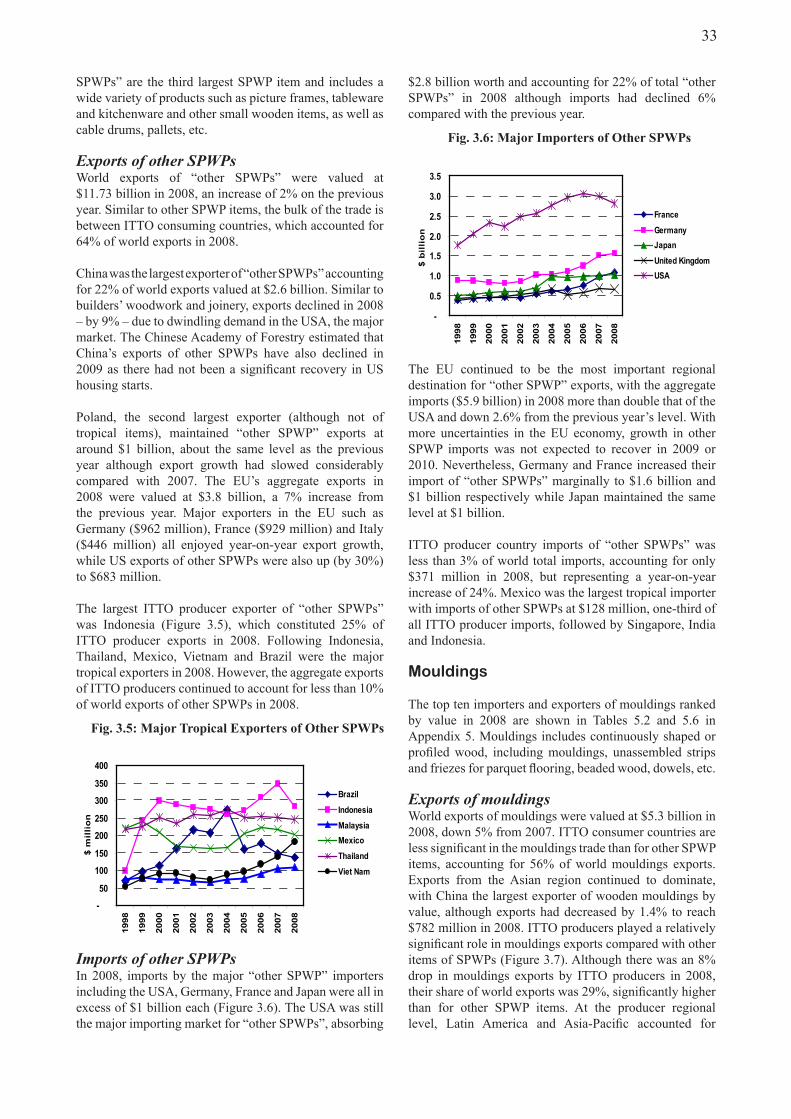
33
$2.8 billion worth and accounting for 22% of total “other SPWPs” in 2008 although imports had declined 6% compared with the previous year.
The EU continued to be the most important regional destination for “other SPWP” exports, with the aggregate imports ($5.9 billion) in 2008 more than double that of the USA and down 2.6% from the previous year’s level. With more uncertainties in the EU economy, growth in other SPWP imports was not expected to recover in 2009 or 2010. Nevertheless, Germany and France increased their import of “other SPWPs” marginally to $1.6 billion and $1 billion respectively while Japan maintained the same level at $1 billion.
ITTO producer country imports of “other SPWPs” was less than 3% of world total imports, accounting for only $371 million in 2008, but representing a year-on-year increase of 24%. Mexico was the largest tropical importer with imports of other SPWPs at $128 million, one-third of all ITTO producer imports, followed by Singapore, India and Indonesia.
Mouldings
The top ten importers and exporters of mouldings ranked by value in 2008 are shown in Tables 5.2 and 5.6 in Appendix 5. Mouldings includes continuously shaped or profiled wood, including mouldings, unassembled strips and friezes for parquet flooring, beaded wood, dowels, etc.
Exports of mouldingsWorld exports of mouldings were valued at $5.3 billion in 2008, down 5% from 2007. ITTO consumer countries are less significant in the mouldings trade than for other SPWP items, accounting for 56% of world mouldings exports. Exports from the Asian region continued to dominate, with China the largest exporter of wooden mouldings by value, although exports had decreased by 1.4% to reach $782 million in 2008. ITTO producers played a relatively significant role in mouldings exports compared with other items of SPWPs (Figure 3.7). Although there was an 8% drop in mouldings exports by ITTO producers in 2008, their share of world exports was 29%, significantly higher than for other SPWP items. At the producer regional level, Latin America and Asia-Pacific accounted for
SPWPs” are the third largest SPWP item and includes a wide variety of products such as picture frames, tableware and kitchenware and other small wooden items, as well as cable drums, pallets, etc.
Exports of other SPWPsWorld exports of “other SPWPs” were valued at $11.73 billion in 2008, an increase of 2% on the previous year. Similar to other SPWP items, the bulk of the trade is between ITTO consuming countries, which accounted for 64% of world exports in 2008.
China was the largest exporter of “other SPWPs” accounting for 22% of world exports valued at $2.6 billion. Similar to builders’ woodwork and joinery, exports declined in 2008 – by 9% – due to dwindling demand in the USA, the major market. The Chinese Academy of Forestry estimated that China’s exports of other SPWPs have also declined in 2009 as there had not been a significant recovery in US housing starts.
Poland, the second largest exporter (although not of tropical items), maintained “other SPWP” exports at around $1 billion, about the same level as the previous year although export growth had slowed considerably compared with 2007. The EU’s aggregate exports in 2008 were valued at $3.8 billion, a 7% increase from the previous year. Major exporters in the EU such as Germany ($962 million), France ($929 million) and Italy ($446 million) all enjoyed year-on-year export growth, while US exports of other SPWPs were also up (by 30%) to $683 million.
The largest ITTO producer exporter of “other SPWPs” was Indonesia (Figure 3.5), which constituted 25% of ITTO producer exports in 2008. Following Indonesia, Thailand, Mexico, Vietnam and Brazil were the major tropical exporters in 2008. However, the aggregate exports of ITTO producers continued to account for less than 10% of world exports of other SPWPs in 2008.
Imports of other SPWPsIn 2008, imports by the major “other SPWP” importers including the USA, Germany, France and Japan were all in excess of $1 billion each (Figure 3.6). The USA was still the major importing market for “other SPWPs”, absorbing
-
50
100
150
200
250
300
350
400
1998
1999
2000
2001
2002
2003
2004
2005
2006
2007
2008
$ m
illi
on
Brazil
Indonesia
Malaysia Mexico
Thailand
Viet Nam
...............Fig..3.5:.Major.Tropical.Exporters.of.Other.SPWPs
-
0.5
1.0
1.5
2.0
2.5
3.0
3.5
1998
1999
2000
2001
2002
2003
2004
2005
2006
2007
2008
$ b
illi
on
France
GermanyJapan
United Kingdom USA
...................Fig..3.6:.Major.Importers.of.Other.SPWPs
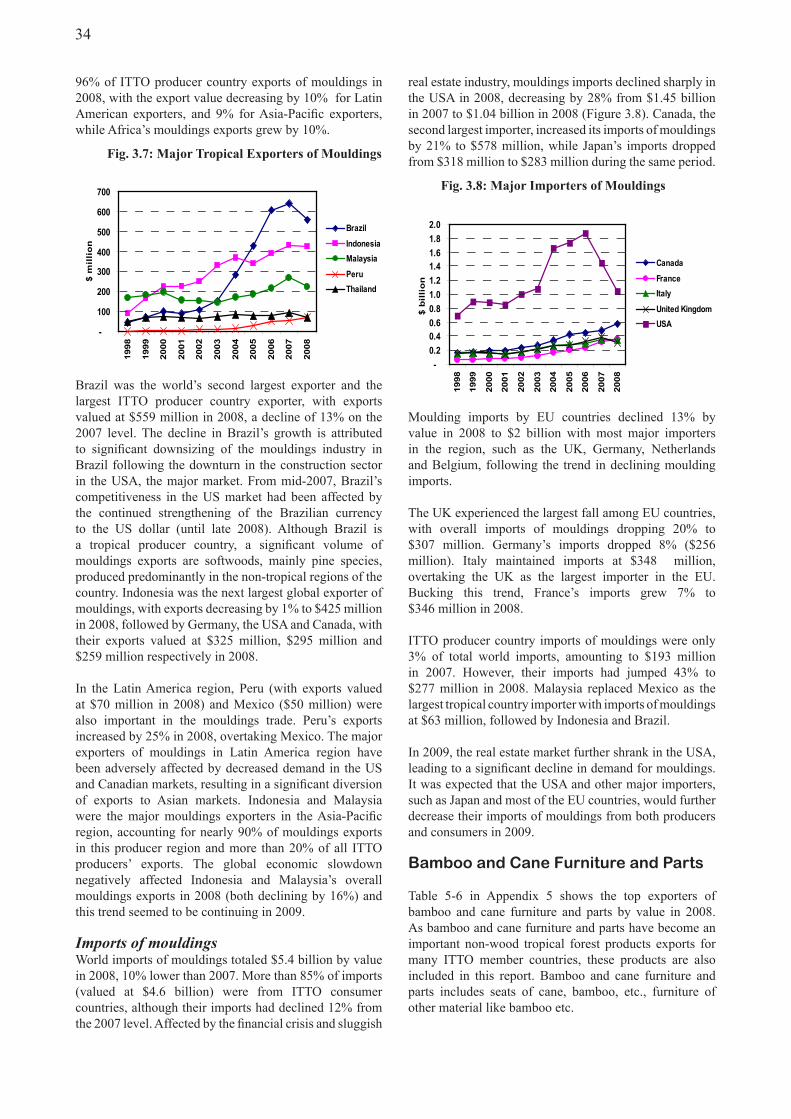
34
real estate industry, mouldings imports declined sharply in the USA in 2008, decreasing by 28% from $1.45 billion in 2007 to $1.04 billion in 2008 (Figure 3.8). Canada, the second largest importer, increased its imports of mouldings by 21% to $578 million, while Japan’s imports dropped from $318 million to $283 million during the same period.
Moulding imports by EU countries declined 13% by value in 2008 to $2 billion with most major importers in the region, such as the UK, Germany, Netherlands and Belgium, following the trend in declining moulding imports.
The UK experienced the largest fall among EU countries, with overall imports of mouldings dropping 20% to $307 million. Germany’s imports dropped 8% ($256 million). Italy maintained imports at $348 million, overtaking the UK as the largest importer in the EU. Bucking this trend, France’s imports grew 7% to $346 million in 2008.
ITTO producer country imports of mouldings were only 3% of total world imports, amounting to $193 million in 2007. However, their imports had jumped 43% to $277 million in 2008. Malaysia replaced Mexico as the largest tropical country importer with imports of mouldings at $63 million, followed by Indonesia and Brazil.
In 2009, the real estate market further shrank in the USA, leading to a significant decline in demand for mouldings. It was expected that the USA and other major importers, such as Japan and most of the EU countries, would further decrease their imports of mouldings from both producers and consumers in 2009.
Bamboo and Cane Furniture and Parts
Table 5-6 in Appendix 5 shows the top exporters of bamboo and cane furniture and parts by value in 2008. As bamboo and cane furniture and parts have become an important non-wood tropical forest products exports for many ITTO member countries, these products are also included in this report. Bamboo and cane furniture and parts includes seats of cane, bamboo, etc., furniture of other material like bamboo etc.
96% of ITTO producer country exports of mouldings in 2008, with the export value decreasing by 10% for Latin American exporters, and 9% for Asia-Pacific exporters, while Africa’s mouldings exports grew by 10%.
Brazil was the world’s second largest exporter and the largest ITTO producer country exporter, with exports valued at $559 million in 2008, a decline of 13% on the 2007 level. The decline in Brazil’s growth is attributed to significant downsizing of the mouldings industry in Brazil following the downturn in the construction sector in the USA, the major market. From mid-2007, Brazil’s competitiveness in the US market had been affected by the continued strengthening of the Brazilian currency to the US dollar (until late 2008). Although Brazil is a tropical producer country, a significant volume of mouldings exports are softwoods, mainly pine species, produced predominantly in the non-tropical regions of the country. Indonesia was the next largest global exporter of mouldings, with exports decreasing by 1% to $425 million in 2008, followed by Germany, the USA and Canada, with their exports valued at $325 million, $295 million and $259 million respectively in 2008.
In the Latin America region, Peru (with exports valued at $70 million in 2008) and Mexico ($50 million) were also important in the mouldings trade. Peru’s exports increased by 25% in 2008, overtaking Mexico. The major exporters of mouldings in Latin America region have been adversely affected by decreased demand in the US and Canadian markets, resulting in a significant diversion of exports to Asian markets. Indonesia and Malaysia were the major mouldings exporters in the Asia-Pacific region, accounting for nearly 90% of mouldings exports in this producer region and more than 20% of all ITTO producers’ exports. The global economic slowdown negatively affected Indonesia and Malaysia’s overall mouldings exports in 2008 (both declining by 16%) and this trend seemed to be continuing in 2009.
Imports of mouldingsWorld imports of mouldings totaled $5.4 billion by value in 2008, 10% lower than 2007. More than 85% of imports (valued at $4.6 billion) were from ITTO consumer countries, although their imports had declined 12% from the 2007 level. Affected by the financial crisis and sluggish
-
100
200
300
400
500
600
700
1998
1999
2000
2001
2002
2003
2004
2005
2006
2007
2008
$ m
illi
on
Brazil
IndonesiaMalaysia
PeruThailand
................Fig..3.7:.Major.Tropical.Exporters.of.Mouldings
-0.20.40.60.81.01.21.41.61.82.0
1998
1999
2000
2001
2002
2003
2004
2005
2006
2007
2008
$ b
illi
on
Canada
FranceItaly
United KingdomUSA
................Fig..3.8:.Major.Importers.of.Mouldings
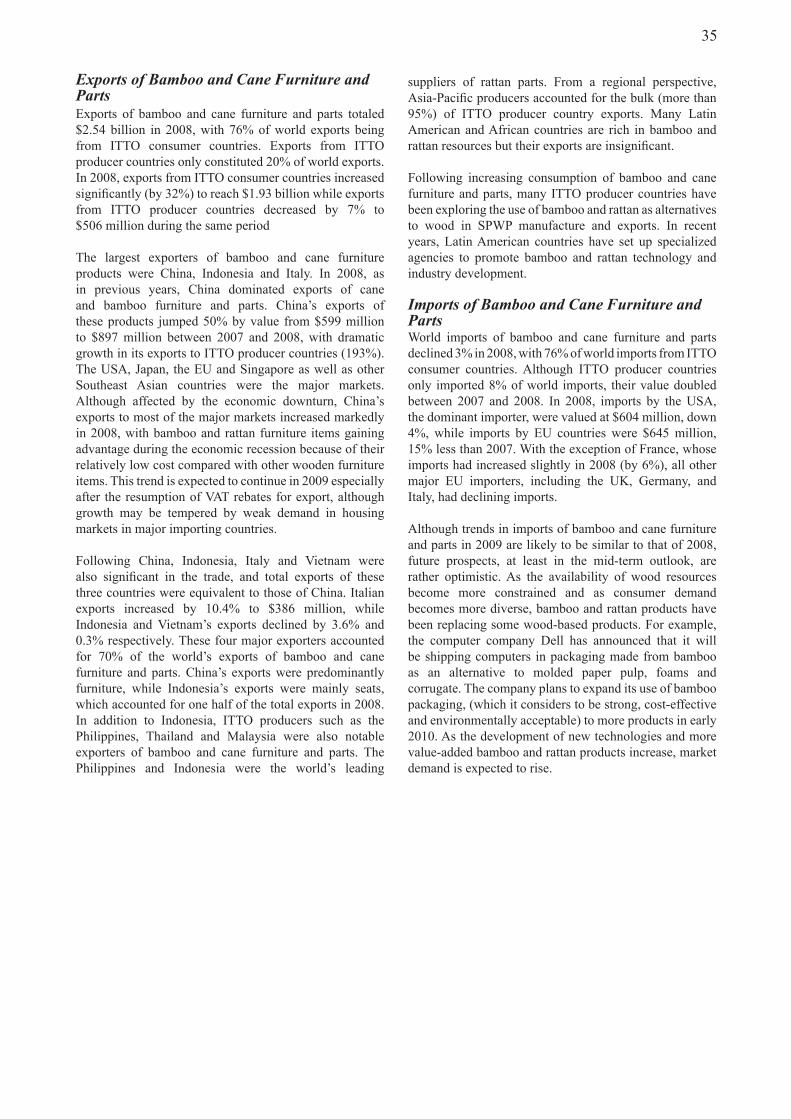
35
Exports of Bamboo and Cane Furniture and PartsExports of bamboo and cane furniture and parts totaled $2.54 billion in 2008, with 76% of world exports being from ITTO consumer countries. Exports from ITTO producer countries only constituted 20% of world exports. In 2008, exports from ITTO consumer countries increased significantly (by 32%) to reach $1.93 billion while exports from ITTO producer countries decreased by 7% to $506 million during the same period
The largest exporters of bamboo and cane furniture products were China, Indonesia and Italy. In 2008, as in previous years, China dominated exports of cane and bamboo furniture and parts. China’s exports of these products jumped 50% by value from $599 million to $897 million between 2007 and 2008, with dramatic growth in its exports to ITTO producer countries (193%). The USA, Japan, the EU and Singapore as well as other Southeast Asian countries were the major markets. Although affected by the economic downturn, China’s exports to most of the major markets increased markedly in 2008, with bamboo and rattan furniture items gaining advantage during the economic recession because of their relatively low cost compared with other wooden furniture items. This trend is expected to continue in 2009 especially after the resumption of VAT rebates for export, although growth may be tempered by weak demand in housing markets in major importing countries.
Following China, Indonesia, Italy and Vietnam were also significant in the trade, and total exports of these three countries were equivalent to those of China. Italian exports increased by 10.4% to $386 million, while Indonesia and Vietnam’s exports declined by 3.6% and 0.3% respectively. These four major exporters accounted for 70% of the world’s exports of bamboo and cane furniture and parts. China’s exports were predominantly furniture, while Indonesia’s exports were mainly seats, which accounted for one half of the total exports in 2008.In addition to Indonesia, ITTO producers such as the Philippines, Thailand and Malaysia were also notable exporters of bamboo and cane furniture and parts. The Philippines and Indonesia were the world’s leading
suppliers of rattan parts. From a regional perspective, Asia-Pacific producers accounted for the bulk (more than 95%) of ITTO producer country exports. Many Latin American and African countries are rich in bamboo and rattan resources but their exports are insignificant.
Following increasing consumption of bamboo and cane furniture and parts, many ITTO producer countries have been exploring the use of bamboo and rattan as alternatives to wood in SPWP manufacture and exports. In recent years, Latin American countries have set up specialized agencies to promote bamboo and rattan technology and industry development.
Imports of Bamboo and Cane Furniture and PartsWorld imports of bamboo and cane furniture and parts declined 3% in 2008, with 76% of world imports from ITTO consumer countries. Although ITTO producer countries only imported 8% of world imports, their value doubled between 2007 and 2008. In 2008, imports by the USA, the dominant importer, were valued at $604 million, down 4%, while imports by EU countries were $645 million, 15% less than 2007. With the exception of France, whose imports had increased slightly in 2008 (by 6%), all other major EU importers, including the UK, Germany, and Italy, had declining imports.
Although trends in imports of bamboo and cane furniture and parts in 2009 are likely to be similar to that of 2008, future prospects, at least in the mid-term outlook, are rather optimistic. As the availability of wood resources become more constrained and as consumer demand becomes more diverse, bamboo and rattan products have been replacing some wood-based products. For example, the computer company Dell has announced that it will be shipping computers in packaging made from bamboo as an alternative to molded paper pulp, foams and corrugate. The company plans to expand its use of bamboo packaging, (which it considers to be strong, cost-effective and environmentally acceptable) to more products in early 2010. As the development of new technologies and more value-added bamboo and rattan products increase, market demand is expected to rise.

36
37
4. THE COMPETITIVENESS OF TROPICAL TIMBER1
1 By Rupert Oliver, Forest Industries Intelligence Limited.
Highlights
● The tropical hardwood sector faces some very significant challenges with its market position being threatened by a wide and increasing range of innovative products. Tropical hardwoods suffer from declining price expectations and falling raw material quality, have a very significant image problem, and are being squeezed by a whole host of policy measures.
● The industry stands at a crossroads. One way leads to a progressive loss of market share for tropical hardwoods to alternative wood and non-wood products, particularly in the low-volume high-value markets of more developed countries. This may be linked to increased consumption of tropical hardwoods in the lower-value, higher-volume markets of emerging economies. In this scenario, only the uncertain possibility of a huge influx of international REDD funding holds out any real prospect of preventing high levels of tropical forest degradation and conversion to alternative uses.
● There are, however, opportunities to build on the considerable technical, aesthetic, and environmental strengths of tropical hardwoods to enhance access to high-value markets.
● By doing so, much greater value may be derived from every cubic metre of wood harvested, more jobs may be protected and created in rural areas which lack alternative sources of income, more emissions may be offset and carbon stored in the forest and in durable hardwood products, and the incentives for forest conversion may be reduced.
● Achievement of these objectives will depend partly on the development of tropical forest management regimes that combine sustainable timber production with income from a wide range of environmental services.
● It will also require significant new investment in design-led marketing, political lobbying, value-added processing, product development, and certification.
● Facilitation of efforts at international level to bring together producer governments, large corporations dealing in tropical hardwoods, and trade associations to develop an industry-wide generic marketing campaign for tropical hardwoods, is encouraged.
● Tropical wood industries are encouraged to focus on developing opportunities for tropical hardwoods in higher value niche markets where long-term competitiveness will lie in tight conformance to emerging quality and environmental standards and in supply of ‘knowledge-based products’.
● Special emphasis should be placed on improving the regularity and consistency of wood supply through improved logistics, increased dependence on resources managed for long-term sustained yield, including both plantations and managed natural forests, training in wood handling, and other efforts to improve the efficiency of wood processing operations.
38
Introduction
This chapter summarises the main findings of an ITTO study1 which evaluated the competitive position of tropical wood products vis-à-vis other products (wood and non-wood) in selected markets. The chapter considers substitution trends and policy measures impacting on global consumption of tropical wood products and also provides case studies on the competitive position of tropical hardwoods in the European and North American plywood sector, sapele and meranti window frames in the European window sector and tropical hardwood veneers in the European interiors sector. The chapter concludes with recommendations to improve tropical wood’s competitiveness.
Substitution Trends
Tropical hardwood availability declines while consumption is forecast to increaseAn analysis of global forest resource data (FAO 2005) suggests that the availability and quality of large diameter tropical hardwood logs of primary wood species is generally declining and that this trend is set to continue. Efforts to improve forestry practices and reverse the decline in tropical forest resources are constrained in many regions due to an unfavourable investment climate; severe institutional, financial and technical constraints; and illegal activities and corruption. Selective logging is the primary focus of concession management in most areas, but there may be little attention to post-harvest silviculture, while unregulated harvesting is leading to further degradation.
In contrast, the forest resource areas of the temperate zones are generally either stable or increasing (FAO 2005). The forests of the temperate zone are more productive per unit area, and are attracting more investment to further improve levels of productivity and stand quality and for establishment of plantations. Overall this implies continuing loss of competitiveness for tropical hardwoods compared to non-wood products. Declining availability of tropical hardwoods is reflected in trade statistics. Overall, there has been a decline in the share of tropical logs in global log imports in ITTO member countries from around 30% in 1994 to 12% in 2008 (ITTO 2009). During this period the volume of tropical sawnwood and plywood produced annually in ITTO producer countries has generally declined, from around 44 million m3 to 42 million m3, and from 23 million m3 to 18 million m3 respectively. Veneer production in ITTO producer countries has remained broadly flat at around 3 million m3.Meanwhile, domestic and regional consumption of wood products in tropical regions is expected to generally increase, driven by strong population growth and rising per capita consumption. New demand is also being generated in emerging markets, notably China where a
1 Oliver R. and Donkor B. (2010): Monitoring the competitiveness of tropical timber. ITTO Technical Series (in press). International Tropical Timber Organization, Yokohama.
massive wood supply-demand gap is forecast which will be particularly pronounced for decorative hardwoods from large diameter logs.
Plantations an incomplete solutionHigh yields and quick economic returns relative to management of natural tropical forests for timber suggest that plantations have potential to off-set declining wood supply in tropical regions. Some tropical countries now have ambitious programmes to expand plantation area. However the log and wood quality supplied by plantations is not directly comparable to that supplied by natural forests. Their further development in tropical regions requires significant reorientation of national wood industries to harvest and process larger volumes of small dimension and low density material. Furthermore, analysis of current trends indicates that tropical regions have fallen well behind other regions in plantation development. Only 15.6 million hectares (14%) of the world’s plantations are in countries fully located in the tropical zone, the vast majority of this being in Southeast Asia. During the 1990s, the majority of new plantations were being established in temperate regions. Since 2000 the vast majority of new plantations have been established in China (FAO 2009).
New technology benefits softwoods and tem-perate hardwoods more than tropical hard-woodsResearch and development in the tropical wood sector is falling significantly behind other sectors of the international wood industry (FAO 2009). Efforts have been made, notably in Southeast Asia, to use modern technologies to improve the product quality and range of applications of wood products from tropical hardwood plantations and natural forests. Research has focused on smaller dimension and less durable material, including FSC certified tropical wood. However many of the new wood treatment technologies being developed are more likely to threaten rather than to enhance the current market position of tropical hardwoods. Whilst tropical hardwoods have been the benchmark for technical wood property performance, global research has focused on improving the ability of softwoods to match the technical performance of tropical hardwoods, rather than on the development of new and innovative products and applications to extend the market share of tropical hardwoods.
For example, a major competitive threat for tropical hardwoods is ongoing efforts to modify the characteristics of temperate hardwoods and softwoods to improve their performance through heat treatment, acetylation, chemical impregnation, and a wide range of new surface technologies. Often the specific intent of these processes is to mimic the aesthetics, durability, stability and strength of tropical hardwoods. Other competitive threats have emerged from the development of new engineered wood products and wood-plastic composites which utilise small diameter wood, wood chips and residues. Many of these alternative products are sold with Forest Stewardship Council (FSC) or Programme for the Endorsement of
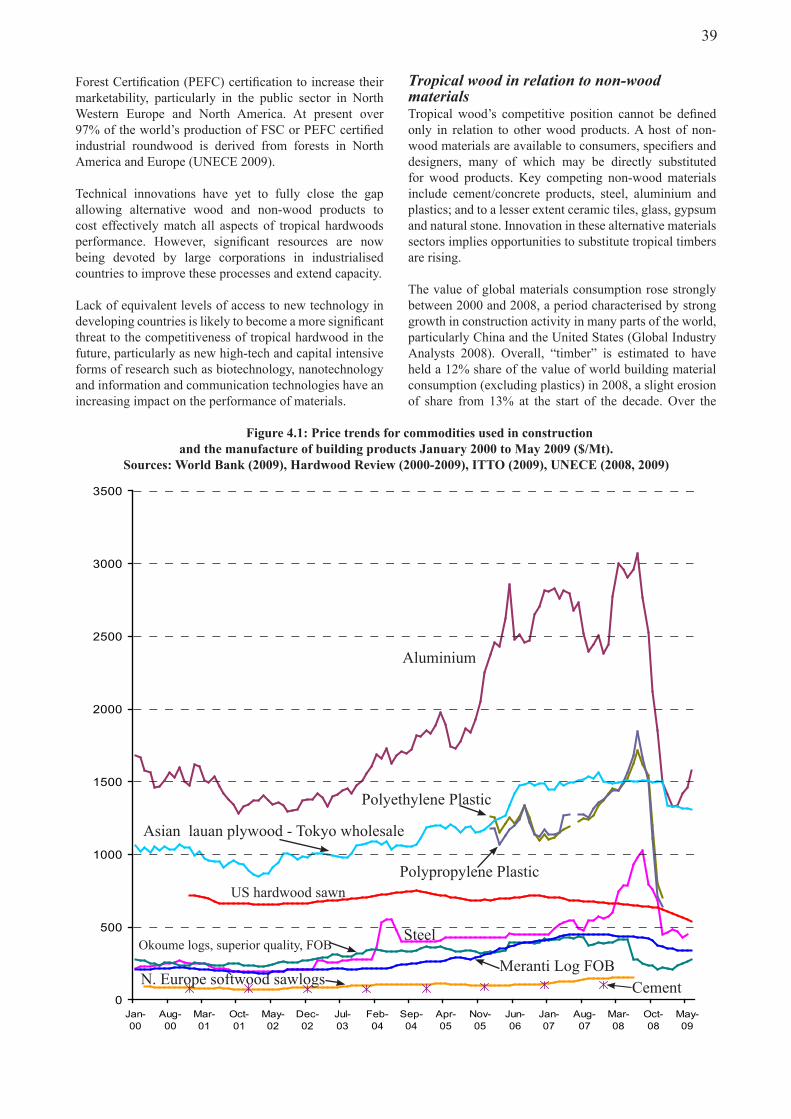
39
Forest Certification (PEFC) certification to increase their marketability, particularly in the public sector in North Western Europe and North America. At present over 97% of the world’s production of FSC or PEFC certified industrial roundwood is derived from forests in North America and Europe (UNECE 2009).
Technical innovations have yet to fully close the gap allowing alternative wood and non-wood products to cost effectively match all aspects of tropical hardwoods performance. However, significant resources are now being devoted by large corporations in industrialised countries to improve these processes and extend capacity.
Lack of equivalent levels of access to new technology in developing countries is likely to become a more significant threat to the competitiveness of tropical hardwood in the future, particularly as new high-tech and capital intensive forms of research such as biotechnology, nanotechnology and information and communication technologies have an increasing impact on the performance of materials.
Tropical wood in relation to non-wood materialsTropical wood’s competitive position cannot be defined only in relation to other wood products. A host of non-wood materials are available to consumers, specifiers and designers, many of which may be directly substituted for wood products. Key competing non-wood materials include cement/concrete products, steel, aluminium and plastics; and to a lesser extent ceramic tiles, glass, gypsum and natural stone. Innovation in these alternative materials sectors implies opportunities to substitute tropical timbers are rising.
The value of global materials consumption rose strongly between 2000 and 2008, a period characterised by strong growth in construction activity in many parts of the world, particularly China and the United States (Global Industry Analysts 2008). Overall, “timber” is estimated to have held a 12% share of the value of world building material consumption (excluding plastics) in 2008, a slight erosion of share from 13% at the start of the decade. Over the
..............Figure.4.1:.Price.trends.for.commodities.used.in.constructionand.the.manufacture.of.building.products.January.2000.to.May.2009.($/Mt)..
Sources:.World.Bank.(2009),.Hardwood.Review.(2000-2009),.ITTO.(2009),.UNECE.(2008,.2009)
0
500
1000
1500
2000
2500
3000
3500
Jan-00
Aug-00
Mar-01
Oct-01
May-02
Dec-02
Jul-03
Feb-04
Sep-04
Apr-05
Nov-05
Jun-06
Jan-07
Aug-07
Mar-08
Oct-08
May-09
Aluminium
Asian lauan plywood - Tokyo wholesale
US hardwood sawn
SteelOkoume logs, superior quality, FOB
Polypropylene Plastic
Polyethylene Plastic
Meranti Log FOBN. Europe softwood sawlogs Cement
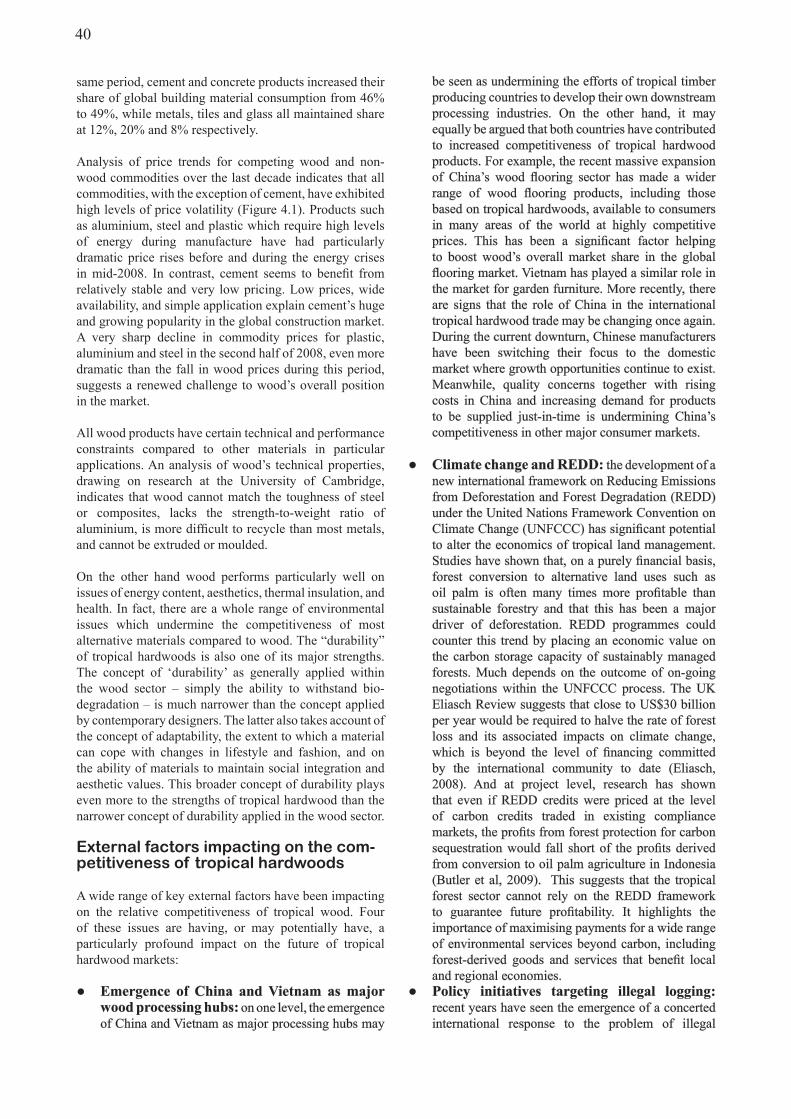
40
be seen as undermining the efforts of tropical timber producing countries to develop their own downstream processing industries. On the other hand, it may equally be argued that both countries have contributed to increased competitiveness of tropical hardwood products. For example, the recent massive expansion of China’s wood flooring sector has made a wider range of wood flooring products, including those based on tropical hardwoods, available to consumers in many areas of the world at highly competitive prices. This has been a significant factor helping to boost wood’s overall market share in the global flooring market. Vietnam has played a similar role in the market for garden furniture. More recently, there are signs that the role of China in the international tropical hardwood trade may be changing once again. During the current downturn, Chinese manufacturers have been switching their focus to the domestic market where growth opportunities continue to exist. Meanwhile, quality concerns together with rising costs in China and increasing demand for products to be supplied just-in-time is undermining China’s competitiveness in other major consumer markets.
.● Climate.change.and.REDD:.the development of a new international framework on Reducing Emissions from Deforestation and Forest Degradation (REDD) under the United Nations Framework Convention on Climate Change (UNFCCC) has significant potential to alter the economics of tropical land management. Studies have shown that, on a purely financial basis, forest conversion to alternative land uses such as oil palm is often many times more profitable than sustainable forestry and that this has been a major driver of deforestation. REDD programmes could counter this trend by placing an economic value on the carbon storage capacity of sustainably managed forests. Much depends on the outcome of on-going negotiations within the UNFCCC process. The UK Eliasch Review suggests that close to US$30 billion per year would be required to halve the rate of forest loss and its associated impacts on climate change, which is beyond the level of financing committed by the international community to date (Eliasch, 2008). And at project level, research has shown that even if REDD credits were priced at the level of carbon credits traded in existing compliance markets, the profits from forest protection for carbon sequestration would fall short of the profits derived from conversion to oil palm agriculture in Indonesia (Butler et al, 2009). This suggests that the tropical forest sector cannot rely on the REDD framework to guarantee future profitability. It highlights the importance of maximising payments for a wide range of environmental services beyond carbon, including forest-derived goods and services that benefit local and regional economies.
.● Policy. initiatives. targeting. illegal. logging:.recent years have seen the emergence of a concerted international response to the problem of illegal
same period, cement and concrete products increased their share of global building material consumption from 46% to 49%, while metals, tiles and glass all maintained share at 12%, 20% and 8% respectively.
Analysis of price trends for competing wood and non-wood commodities over the last decade indicates that all commodities, with the exception of cement, have exhibited high levels of price volatility (Figure 4.1). Products such as aluminium, steel and plastic which require high levels of energy during manufacture have had particularly dramatic price rises before and during the energy crises in mid-2008. In contrast, cement seems to benefit from relatively stable and very low pricing. Low prices, wide availability, and simple application explain cement’s huge and growing popularity in the global construction market. A very sharp decline in commodity prices for plastic, aluminium and steel in the second half of 2008, even more dramatic than the fall in wood prices during this period, suggests a renewed challenge to wood’s overall position in the market.
All wood products have certain technical and performance constraints compared to other materials in particular applications. An analysis of wood’s technical properties, drawing on research at the University of Cambridge, indicates that wood cannot match the toughness of steel or composites, lacks the strength-to-weight ratio of aluminium, is more difficult to recycle than most metals, and cannot be extruded or moulded.
On the other hand wood performs particularly well on issues of energy content, aesthetics, thermal insulation, and health. In fact, there are a whole range of environmental issues which undermine the competitiveness of most alternative materials compared to wood. The “durability” of tropical hardwoods is also one of its major strengths. The concept of ‘durability’ as generally applied within the wood sector – simply the ability to withstand bio-degradation – is much narrower than the concept applied by contemporary designers. The latter also takes account of the concept of adaptability, the extent to which a material can cope with changes in lifestyle and fashion, and on the ability of materials to maintain social integration and aesthetic values. This broader concept of durability plays even more to the strengths of tropical hardwood than the narrower concept of durability applied in the wood sector.
External factors impacting on the com-petitiveness of tropical hardwoods
A wide range of key external factors have been impacting on the relative competitiveness of tropical wood. Four of these issues are having, or may potentially have, a particularly profound impact on the future of tropical hardwood markets:
.● Emergence. of. China. and.Vietnam. as.major.wood.processing.hubs: on one level, the emergence of China and Vietnam as major processing hubs may
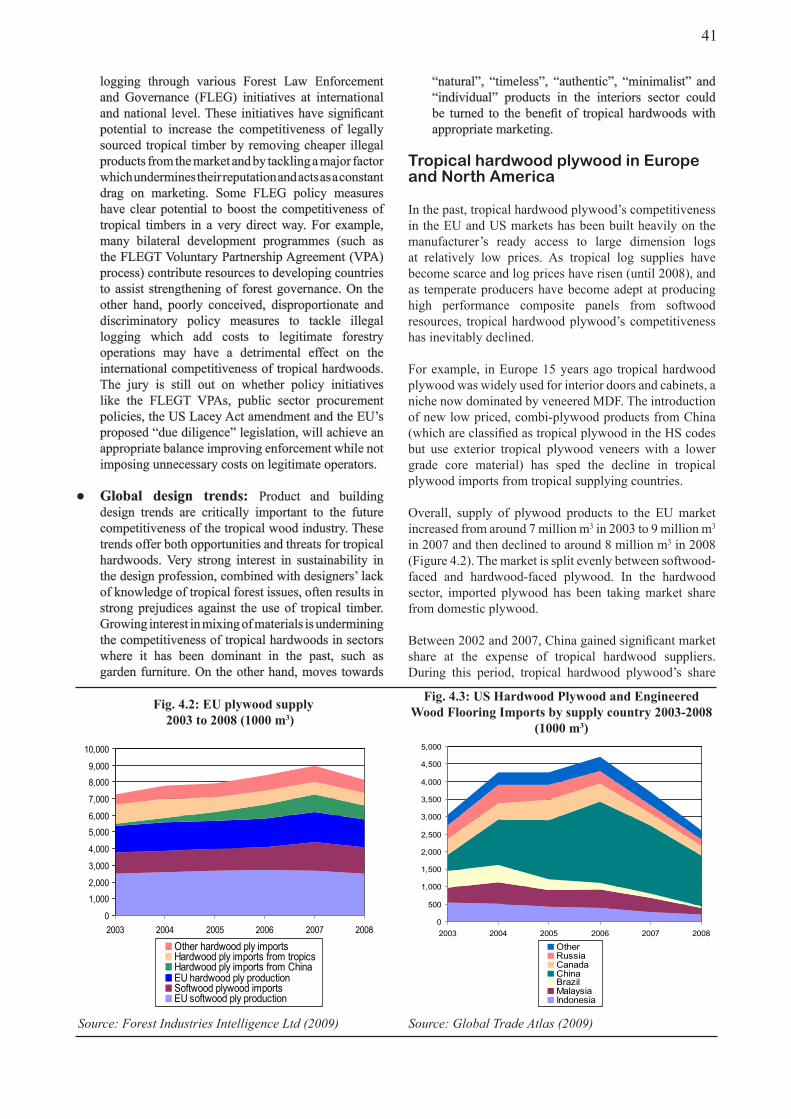
41
“natural”, “timeless”, “authentic”, “minimalist” and “individual” products in the interiors sector could be turned to the benefit of tropical hardwoods with appropriate marketing.
Tropical hardwood plywood in Europe and North America
In the past, tropical hardwood plywood’s competitiveness in the EU and US markets has been built heavily on the manufacturer’s ready access to large dimension logs at relatively low prices. As tropical log supplies have become scarce and log prices have risen (until 2008), and as temperate producers have become adept at producing high performance composite panels from softwood resources, tropical hardwood plywood’s competitiveness has inevitably declined.
For example, in Europe 15 years ago tropical hardwood plywood was widely used for interior doors and cabinets, a niche now dominated by veneered MDF. The introduction of new low priced, combi-plywood products from China (which are classified as tropical plywood in the HS codes but use exterior tropical plywood veneers with a lower grade core material) has sped the decline in tropical plywood imports from tropical supplying countries.
Overall, supply of plywood products to the EU market increased from around 7 million m3 in 2003 to 9 million m3 in 2007 and then declined to around 8 million m3 in 2008 (Figure 4.2). The market is split evenly between softwood-faced and hardwood-faced plywood. In the hardwood sector, imported plywood has been taking market share from domestic plywood.
Between 2002 and 2007, China gained significant market share at the expense of tropical hardwood suppliers. During this period, tropical hardwood plywood’s share
logging through various Forest Law Enforcement and Governance (FLEG) initiatives at international and national level. These initiatives have significant potential to increase the competitiveness of legally sourced tropical timber by removing cheaper illegal products from the market and by tackling a major factor which undermines their reputation and acts as a constant drag on marketing. Some FLEG policy measures have clear potential to boost the competitiveness of tropical timbers in a very direct way. For example, many bilateral development programmes (such as the FLEGT Voluntary Partnership Agreement (VPA) process) contribute resources to developing countries to assist strengthening of forest governance. On the other hand, poorly conceived, disproportionate and discriminatory policy measures to tackle illegal logging which add costs to legitimate forestry operations may have a detrimental effect on the international competitiveness of tropical hardwoods. The jury is still out on whether policy initiatives like the FLEGT VPAs, public sector procurement policies, the US Lacey Act amendment and the EU’s proposed “due diligence” legislation, will achieve an appropriate balance improving enforcement while not imposing unnecessary costs on legitimate operators.
.● Global. design. trends:. Product and building design trends are critically important to the future competitiveness of the tropical wood industry. These trends offer both opportunities and threats for tropical hardwoods. Very strong interest in sustainability in the design profession, combined with designers’ lack of knowledge of tropical forest issues, often results in strong prejudices against the use of tropical timber. Growing interest in mixing of materials is undermining the competitiveness of tropical hardwoods in sectors where it has been dominant in the past, such as garden furniture. On the other hand, moves towards
0
1,000
2,000
3,000
4,000
5,000
6,000
7,000
8,000
9,000
10,000
2003 2004 2005 2006 2007 2008
Other hardwood ply importsHardwood ply imports from tropicsHardwood ply imports from ChinaEU hardwood ply productionSoftwood plywood importsEU softwood ply production
...Fig..4.2:.EU.plywood.supply.2003.to.2008.(1000.m3).
0
500
1,000
1,500
2,000
2,500
3,000
3,500
4,000
4,500
5,000
2003 2004 2005 2006 2007 2008
OtherRussiaCanadaChinaBrazilMalaysiaIndonesia
Fig..4.3:.US.Hardwood.Plywood.and.Engineered.Wood.Flooring.Imports.by.supply.country.2003-2008.
(1000.m3)
Source: Forest Industries Intelligence Ltd (2009) Source: Global Trade Atlas (2009)
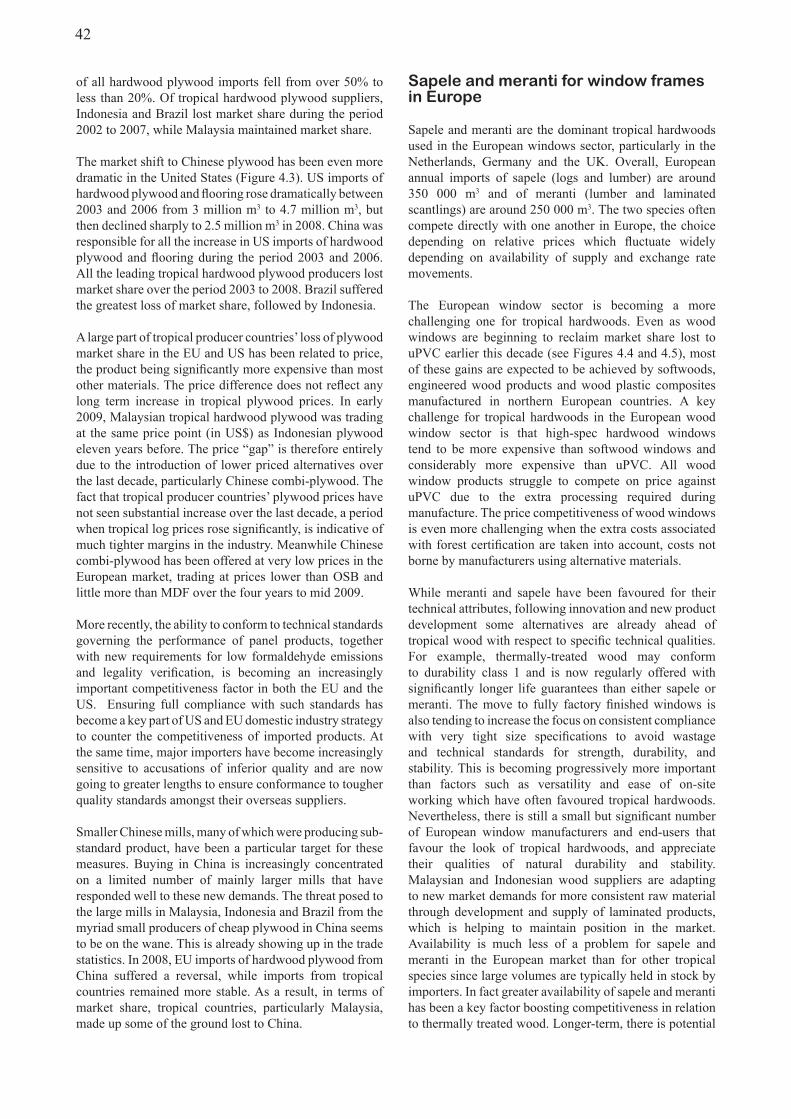
42
Sapele and meranti for window frames in Europe
Sapele and meranti are the dominant tropical hardwoods used in the European windows sector, particularly in the Netherlands, Germany and the UK. Overall, European annual imports of sapele (logs and lumber) are around 350 000 m3 and of meranti (lumber and laminated scantlings) are around 250 000 m3. The two species often compete directly with one another in Europe, the choice depending on relative prices which fluctuate widely depending on availability of supply and exchange rate movements.
The European window sector is becoming a more challenging one for tropical hardwoods. Even as wood windows are beginning to reclaim market share lost to uPVC earlier this decade (see Figures 4.4 and 4.5), most of these gains are expected to be achieved by softwoods, engineered wood products and wood plastic composites manufactured in northern European countries. A key challenge for tropical hardwoods in the European wood window sector is that high-spec hardwood windows tend to be more expensive than softwood windows and considerably more expensive than uPVC. All wood window products struggle to compete on price against uPVC due to the extra processing required during manufacture. The price competitiveness of wood windows is even more challenging when the extra costs associated with forest certification are taken into account, costs not borne by manufacturers using alternative materials.
While meranti and sapele have been favoured for their technical attributes, following innovation and new product development some alternatives are already ahead of tropical wood with respect to specific technical qualities. For example, thermally-treated wood may conform to durability class 1 and is now regularly offered with significantly longer life guarantees than either sapele or meranti. The move to fully factory finished windows is also tending to increase the focus on consistent compliance with very tight size specifications to avoid wastage and technical standards for strength, durability, and stability. This is becoming progressively more important than factors such as versatility and ease of on-site working which have often favoured tropical hardwoods.Nevertheless, there is still a small but significant number of European window manufacturers and end-users that favour the look of tropical hardwoods, and appreciate their qualities of natural durability and stability. Malaysian and Indonesian wood suppliers are adapting to new market demands for more consistent raw material through development and supply of laminated products, which is helping to maintain position in the market. Availability is much less of a problem for sapele and meranti in the European market than for other tropical species since large volumes are typically held in stock by importers. In fact greater availability of sapele and meranti has been a key factor boosting competitiveness in relation to thermally treated wood. Longer-term, there is potential
of all hardwood plywood imports fell from over 50% to less than 20%. Of tropical hardwood plywood suppliers, Indonesia and Brazil lost market share during the period 2002 to 2007, while Malaysia maintained market share.
The market shift to Chinese plywood has been even more dramatic in the United States (Figure 4.3). US imports of hardwood plywood and flooring rose dramatically between 2003 and 2006 from 3 million m3 to 4.7 million m3, but then declined sharply to 2.5 million m3 in 2008. China was responsible for all the increase in US imports of hardwood plywood and flooring during the period 2003 and 2006. All the leading tropical hardwood plywood producers lost market share over the period 2003 to 2008. Brazil suffered the greatest loss of market share, followed by Indonesia.
A large part of tropical producer countries’ loss of plywood market share in the EU and US has been related to price, the product being significantly more expensive than most other materials. The price difference does not reflect any long term increase in tropical plywood prices. In early 2009, Malaysian tropical hardwood plywood was trading at the same price point (in US$) as Indonesian plywood eleven years before. The price “gap” is therefore entirely due to the introduction of lower priced alternatives over the last decade, particularly Chinese combi-plywood. The fact that tropical producer countries’ plywood prices have not seen substantial increase over the last decade, a period when tropical log prices rose significantly, is indicative of much tighter margins in the industry. Meanwhile Chinese combi-plywood has been offered at very low prices in the European market, trading at prices lower than OSB and little more than MDF over the four years to mid 2009.
More recently, the ability to conform to technical standards governing the performance of panel products, together with new requirements for low formaldehyde emissions and legality verification, is becoming an increasingly important competitiveness factor in both the EU and the US. Ensuring full compliance with such standards has become a key part of US and EU domestic industry strategy to counter the competitiveness of imported products. At the same time, major importers have become increasingly sensitive to accusations of inferior quality and are now going to greater lengths to ensure conformance to tougher quality standards amongst their overseas suppliers.
Smaller Chinese mills, many of which were producing sub-standard product, have been a particular target for these measures. Buying in China is increasingly concentrated on a limited number of mainly larger mills that have responded well to these new demands. The threat posed to the large mills in Malaysia, Indonesia and Brazil from the myriad small producers of cheap plywood in China seems to be on the wane. This is already showing up in the trade statistics. In 2008, EU imports of hardwood plywood from China suffered a reversal, while imports from tropical countries remained more stable. As a result, in terms of market share, tropical countries, particularly Malaysia, made up some of the ground lost to China.
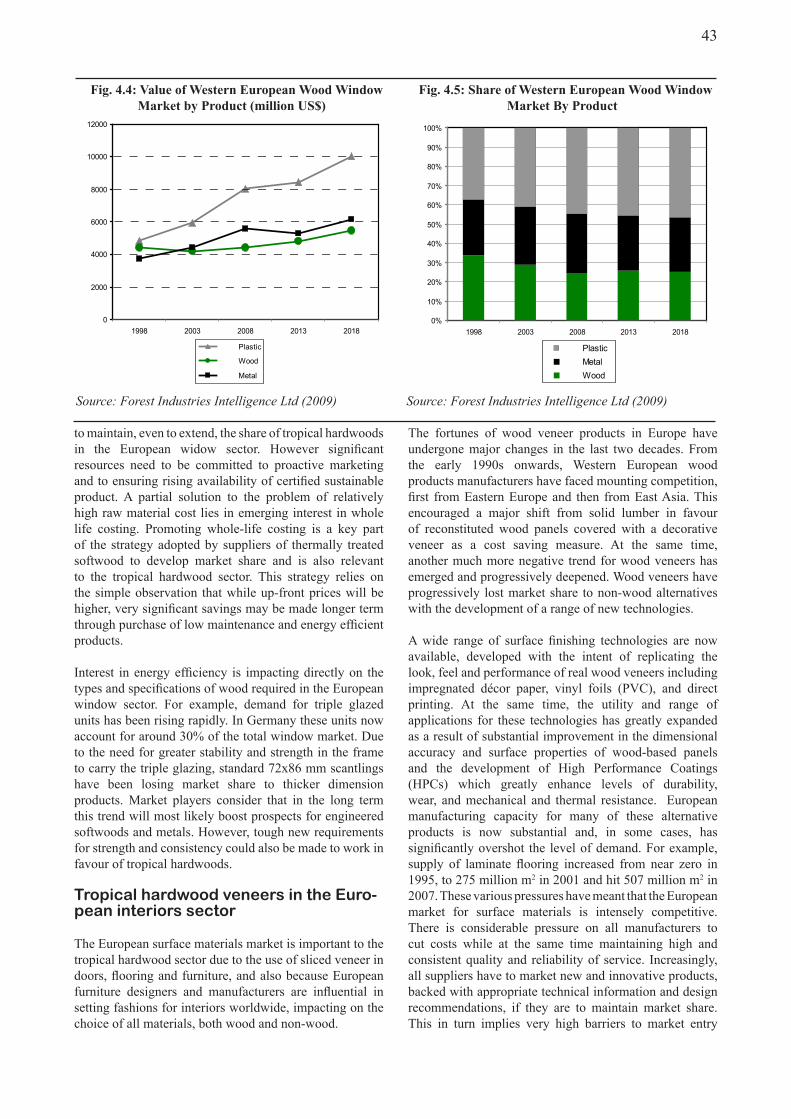
43
0
2000
4000
6000
8000
10000
12000
1998 2003 2008 2013 2018
Plastic
Wood
Metal
...Fig..4.4:.Value.of.Western.European.Wood.Window.Market.by.Product.(million.US$)
Source: Forest Industries Intelligence Ltd (2009)
0%
10%
20%
30%
40%
50%
60%
70%
80%
90%
100%
1998 2003 2008 2013 2018
Plastic Metal Wood
..Fig..4.5:.Share.of.Western.European.Wood.Window.Market.By.Product.
Source: Forest Industries Intelligence Ltd (2009)
to maintain, even to extend, the share of tropical hardwoods in the European widow sector. However significant resources need to be committed to proactive marketing and to ensuring rising availability of certified sustainable product. A partial solution to the problem of relatively high raw material cost lies in emerging interest in whole life costing. Promoting whole-life costing is a key part of the strategy adopted by suppliers of thermally treated softwood to develop market share and is also relevant to the tropical hardwood sector. This strategy relies on the simple observation that while up-front prices will be higher, very significant savings may be made longer term through purchase of low maintenance and energy efficient products.
Interest in energy efficiency is impacting directly on the types and specifications of wood required in the European window sector. For example, demand for triple glazed units has been rising rapidly. In Germany these units now account for around 30% of the total window market. Due to the need for greater stability and strength in the frame to carry the triple glazing, standard 72x86 mm scantlings have been losing market share to thicker dimension products. Market players consider that in the long term this trend will most likely boost prospects for engineered softwoods and metals. However, tough new requirements for strength and consistency could also be made to work in favour of tropical hardwoods.
Tropical hardwood veneers in the Euro-pean interiors sector
The European surface materials market is important to the tropical hardwood sector due to the use of sliced veneer in doors, flooring and furniture, and also because European furniture designers and manufacturers are influential in setting fashions for interiors worldwide, impacting on the choice of all materials, both wood and non-wood.
The fortunes of wood veneer products in Europe have undergone major changes in the last two decades. From the early 1990s onwards, Western European wood products manufacturers have faced mounting competition, first from Eastern Europe and then from East Asia. This encouraged a major shift from solid lumber in favour of reconstituted wood panels covered with a decorative veneer as a cost saving measure. At the same time, another much more negative trend for wood veneers has emerged and progressively deepened. Wood veneers have progressively lost market share to non-wood alternatives with the development of a range of new technologies.
A wide range of surface finishing technologies are now available, developed with the intent of replicating the look, feel and performance of real wood veneers including impregnated décor paper, vinyl foils (PVC), and direct printing. At the same time, the utility and range of applications for these technologies has greatly expanded as a result of substantial improvement in the dimensional accuracy and surface properties of wood-based panels and the development of High Performance Coatings (HPCs) which greatly enhance levels of durability, wear, and mechanical and thermal resistance. European manufacturing capacity for many of these alternative products is now substantial and, in some cases, has significantly overshot the level of demand. For example, supply of laminate flooring increased from near zero in 1995, to 275 million m2 in 2001 and hit 507 million m2 in 2007. These various pressures have meant that the European market for surface materials is intensely competitive. There is considerable pressure on all manufacturers to cut costs while at the same time maintaining high and consistent quality and reliability of service. Increasingly, all suppliers have to market new and innovative products, backed with appropriate technical information and design recommendations, if they are to maintain market share. This in turn implies very high barriers to market entry
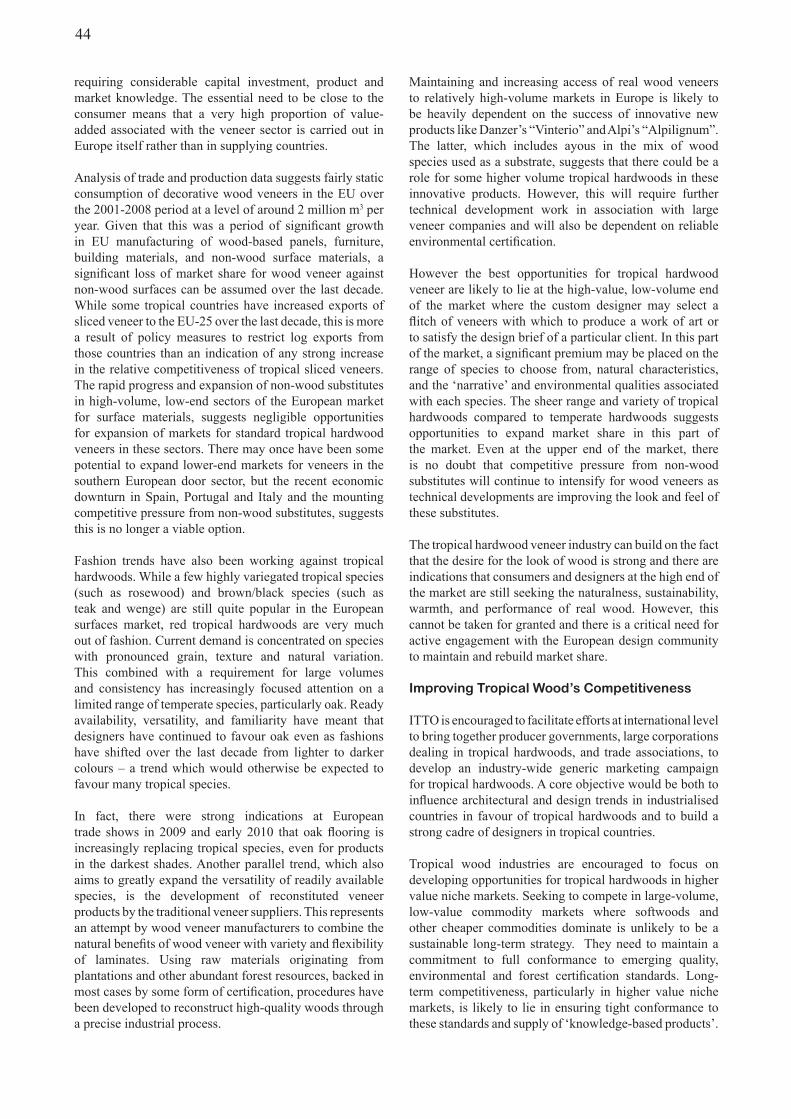
44
requiring considerable capital investment, product and market knowledge. The essential need to be close to the consumer means that a very high proportion of value-added associated with the veneer sector is carried out in Europe itself rather than in supplying countries.
Analysis of trade and production data suggests fairly static consumption of decorative wood veneers in the EU over the 2001-2008 period at a level of around 2 million m3 per year. Given that this was a period of significant growth in EU manufacturing of wood-based panels, furniture, building materials, and non-wood surface materials, a significant loss of market share for wood veneer against non-wood surfaces can be assumed over the last decade. While some tropical countries have increased exports of sliced veneer to the EU-25 over the last decade, this is more a result of policy measures to restrict log exports from those countries than an indication of any strong increase in the relative competitiveness of tropical sliced veneers. The rapid progress and expansion of non-wood substitutes in high-volume, low-end sectors of the European market for surface materials, suggests negligible opportunities for expansion of markets for standard tropical hardwood veneers in these sectors. There may once have been some potential to expand lower-end markets for veneers in the southern European door sector, but the recent economic downturn in Spain, Portugal and Italy and the mounting competitive pressure from non-wood substitutes, suggests this is no longer a viable option.
Fashion trends have also been working against tropical hardwoods. While a few highly variegated tropical species (such as rosewood) and brown/black species (such as teak and wenge) are still quite popular in the European surfaces market, red tropical hardwoods are very much out of fashion. Current demand is concentrated on species with pronounced grain, texture and natural variation. This combined with a requirement for large volumes and consistency has increasingly focused attention on a limited range of temperate species, particularly oak. Ready availability, versatility, and familiarity have meant that designers have continued to favour oak even as fashions have shifted over the last decade from lighter to darker colours – a trend which would otherwise be expected to favour many tropical species.
In fact, there were strong indications at European trade shows in 2009 and early 2010 that oak flooring is increasingly replacing tropical species, even for products in the darkest shades. Another parallel trend, which also aims to greatly expand the versatility of readily available species, is the development of reconstituted veneer products by the traditional veneer suppliers. This represents an attempt by wood veneer manufacturers to combine the natural benefits of wood veneer with variety and flexibility of laminates. Using raw materials originating from plantations and other abundant forest resources, backed in most cases by some form of certification, procedures have been developed to reconstruct high-quality woods through a precise industrial process.
Maintaining and increasing access of real wood veneers to relatively high-volume markets in Europe is likely to be heavily dependent on the success of innovative new products like Danzer’s “Vinterio” and Alpi’s “Alpilignum”. The latter, which includes ayous in the mix of wood species used as a substrate, suggests that there could be a role for some higher volume tropical hardwoods in these innovative products. However, this will require further technical development work in association with large veneer companies and will also be dependent on reliable environmental certification.
However the best opportunities for tropical hardwood veneer are likely to lie at the high-value, low-volume end of the market where the custom designer may select a flitch of veneers with which to produce a work of art or to satisfy the design brief of a particular client. In this part of the market, a significant premium may be placed on the range of species to choose from, natural characteristics, and the ‘narrative’ and environmental qualities associated with each species. The sheer range and variety of tropical hardwoods compared to temperate hardwoods suggests opportunities to expand market share in this part of the market. Even at the upper end of the market, there is no doubt that competitive pressure from non-wood substitutes will continue to intensify for wood veneers as technical developments are improving the look and feel of these substitutes.
The tropical hardwood veneer industry can build on the fact that the desire for the look of wood is strong and there are indications that consumers and designers at the high end of the market are still seeking the naturalness, sustainability, warmth, and performance of real wood. However, this cannot be taken for granted and there is a critical need for active engagement with the European design community to maintain and rebuild market share.
Improving Tropical Wood’s Competitiveness
ITTO is encouraged to facilitate efforts at international level to bring together producer governments, large corporations dealing in tropical hardwoods, and trade associations, to develop an industry-wide generic marketing campaign for tropical hardwoods. A core objective would be both to influence architectural and design trends in industrialised countries in favour of tropical hardwoods and to build a strong cadre of designers in tropical countries.
Tropical wood industries are encouraged to focus on developing opportunities for tropical hardwoods in higher value niche markets. Seeking to compete in large-volume, low-value commodity markets where softwoods and other cheaper commodities dominate is unlikely to be a sustainable long-term strategy. They need to maintain a commitment to full conformance to emerging quality, environmental and forest certification standards. Long-term competitiveness, particularly in higher value niche markets, is likely to lie in ensuring tight conformance to these standards and supply of ‘knowledge-based products’.

45
Special emphasis also needs to be placed on improving the regularity and consistency of wood supply through improved logistics, increased dependence on resources managed for long-term sustained yield, including both plantations and managed natural forests, training in wood handling, and other efforts to improve the efficiency of wood processing operations.
Drawing on the results of this study, the governments of tropical countries are encouraged to undertake more detailed reviews of the global positioning and competitiveness of their national tropical wood products industries with a view to developing realistic long-term market development strategies.

46
47
5. LONG-TERM OUTLOOK FOR THE TROPICAL TIMBER MARKET1
1 By James Turner, Scion.
Highlights
● Qualitative scenario planning and quantitative economic analysis have been combined to estimate the impact of long-term global and sector trends on tropical timber markets and forests. In this chapter one of the four plausible scenarios (a scenario of the world in which the tropical forest industry may thrive in 2020) and model predictions are presented.
● Between 1995 and 2005 forest area in tropical producer countries declined by 0.5% per year. This decline could be halted by trends toward forest protection through Reduced Emissions from Deforestation and Degradation, and expansion of plantation forests under the Clean Development Mechanism, driven by a post-Kyoto agreement to mitigate climate change and adoption of cost-effective approaches to forest governance.
● From the mid-1990s to 2005 global consumption of tropical wood products was stagnant or declining, due to substitution by non-tropical and non-wood products. The global economic crisis exacerbated this trend. Study predictions suggest that tropical sawnwood and plywood consumption from 2010 to 2020 could increase through a return to high economic growth post-crisis, particularly in emerging economies, and increased consumer preferences for tropical timber products driven by certification harmonisation, cost-effective approaches to ensuring legality, and strategies to increase tropical timber product competitiveness.
● Global production of tropical sawnwood and plywood will remain in tropical producer countries which have stronger economic growth post-crisis and where improvements in wood processing occur due to improved investment environments.
● Though North America and Europe remain dominant producers and consumers, especially of softwood products, Asia & Pacific and Latin America are gaining, particularly in production of more processed products. If trends in stronger economic growth, expansion of plantation forests, and improvements in processing in Asia & Pacific continue, this region is predicted to surpass North American and European production of reconstituted panels and close the gap with these regions in non-tropical hardwood sawnwood production.
● Historically, growth in production of fibre-based and secondary processed wood products has been more rapid than for traditional solidwood products. Model predictions suggest greater than 5.5% per year growth in production of fibre-based and secondary processed wood products in Asia & Pacific and Latin America if there remains a consumer preference for these products, and plantation forest expansion and processing improvements continue.
● Over the last two decades, forest product prices have declined. Given the important influence of economic growth on historical forest product prices, model predictions suggest that the global economic crisis will lead to a dip in prices due to lower global demand. Beyond the crisis, growth in prices will be dependent on robust economic growth and strengthening preferences for tropical timber products, combined with a reduction in forest available for supply due to expansion of protected forest area.
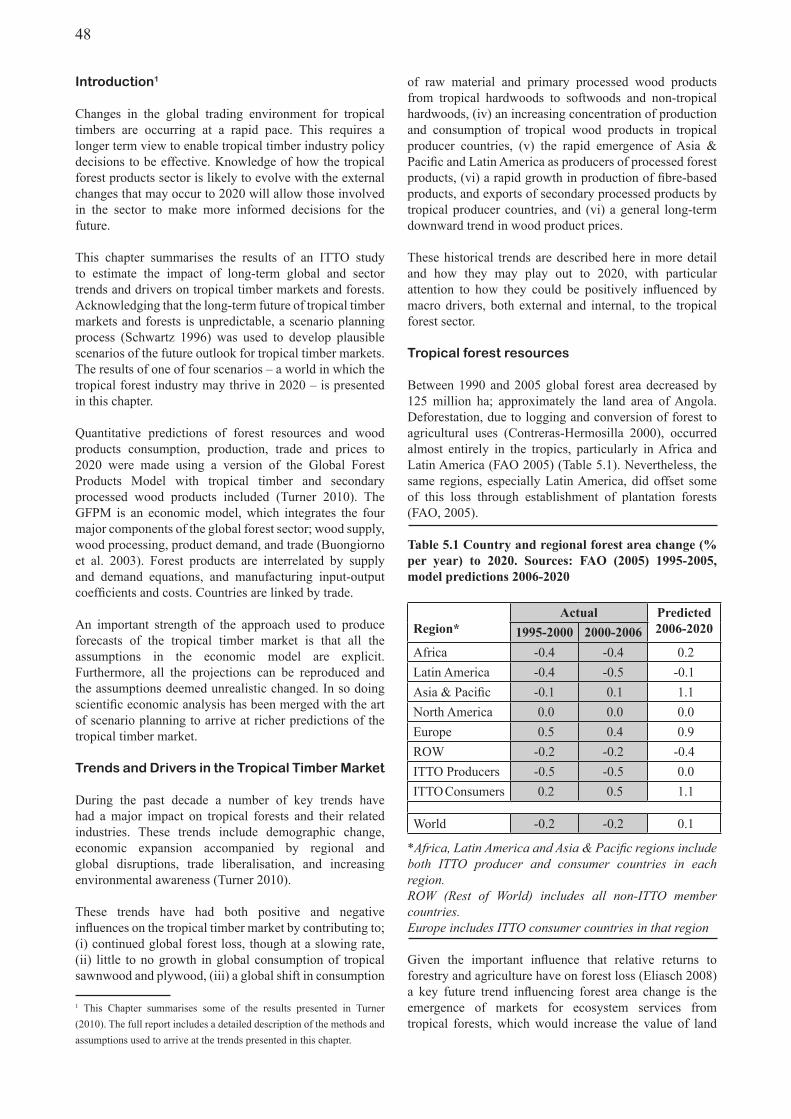
48
Introduction1
Changes in the global trading environment for tropical timbers are occurring at a rapid pace. This requires a longer term view to enable tropical timber industry policy decisions to be effective. Knowledge of how the tropical forest products sector is likely to evolve with the external changes that may occur to 2020 will allow those involved in the sector to make more informed decisions for the future.
This chapter summarises the results of an ITTO study to estimate the impact of long-term global and sector trends and drivers on tropical timber markets and forests. Acknowledging that the long-term future of tropical timber markets and forests is unpredictable, a scenario planning process (Schwartz 1996) was used to develop plausible scenarios of the future outlook for tropical timber markets. The results of one of four scenarios – a world in which the tropical forest industry may thrive in 2020 – is presented in this chapter.
Quantitative predictions of forest resources and wood products consumption, production, trade and prices to 2020 were made using a version of the Global Forest Products Model with tropical timber and secondary processed wood products included (Turner 2010). The GFPM is an economic model, which integrates the four major components of the global forest sector; wood supply, wood processing, product demand, and trade (Buongiorno et al. 2003). Forest products are interrelated by supply and demand equations, and manufacturing input-output coefficients and costs. Countries are linked by trade.
An important strength of the approach used to produce forecasts of the tropical timber market is that all the assumptions in the economic model are explicit. Furthermore, all the projections can be reproduced and the assumptions deemed unrealistic changed. In so doing scientific economic analysis has been merged with the art of scenario planning to arrive at richer predictions of the tropical timber market.
Trends and Drivers in the Tropical Timber Market
During the past decade a number of key trends have had a major impact on tropical forests and their related industries. These trends include demographic change, economic expansion accompanied by regional and global disruptions, trade liberalisation, and increasing environmental awareness (Turner 2010).
These trends have had both positive and negative influences on the tropical timber market by contributing to; (i) continued global forest loss, though at a slowing rate, (ii) little to no growth in global consumption of tropical sawnwood and plywood, (iii) a global shift in consumption
1 This Chapter summarises some of the results presented in Turner (2010). The full report includes a detailed description of the methods and assumptions used to arrive at the trends presented in this chapter.
of raw material and primary processed wood products from tropical hardwoods to softwoods and non-tropical hardwoods, (iv) an increasing concentration of production and consumption of tropical wood products in tropical producer countries, (v) the rapid emergence of Asia & Pacific and Latin America as producers of processed forest products, (vi) a rapid growth in production of fibre-based products, and exports of secondary processed products by tropical producer countries, and (vi) a general long-term downward trend in wood product prices.
These historical trends are described here in more detail and how they may play out to 2020, with particular attention to how they could be positively influenced by macro drivers, both external and internal, to the tropical forest sector.
Tropical forest resources
Between 1990 and 2005 global forest area decreased by 125 million ha; approximately the land area of Angola. Deforestation, due to logging and conversion of forest to agricultural uses (Contreras-Hermosilla 2000), occurred almost entirely in the tropics, particularly in Africa and Latin America (FAO 2005) (Table 5.1). Nevertheless, the same regions, especially Latin America, did offset some of this loss through establishment of plantation forests (FAO, 2005). Table.5.1.Country.and.regional.forest.area.change.(%.per. year). to. 2020.. Sources:. FAO. (2005). 1995-2005,.model.predictions.2006-2020
Region*Actual Predicted
2006-20201995-2000 2000-2006Africa -0.4 -0.4 0.2Latin America -0.4 -0.5 -0.1Asia & Pacific -0.1 0.1 1.1North America 0.0 0.0 0.0Europe 0.5 0.4 0.9ROW -0.2 -0.2 -0.4ITTO Producers -0.5 -0.5 0.0ITTO Consumers 0.2 0.5 1.1
World -0.2 -0.2 0.1
*Africa, Latin America and Asia & Pacific regions include both ITTO producer and consumer countries in each region. ROW (Rest of World) includes all non-ITTO member countries.Europe includes ITTO consumer countries in that region
Given the important influence that relative returns to forestry and agriculture have on forest loss (Eliasch 2008) a key future trend influencing forest area change is the emergence of markets for ecosystem services from tropical forests, which would increase the value of land
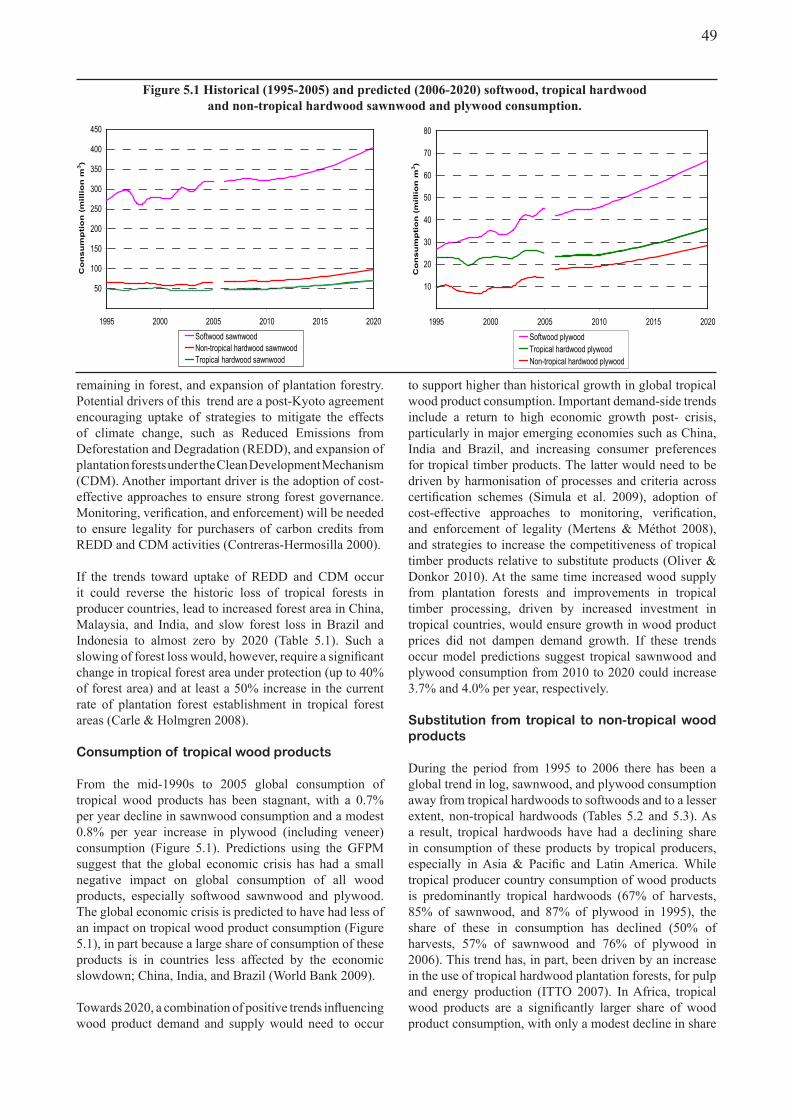
49
remaining in forest, and expansion of plantation forestry. Potential drivers of this trend are a post-Kyoto agreement encouraging uptake of strategies to mitigate the effects of climate change, such as Reduced Emissions from Deforestation and Degradation (REDD), and expansion of plantation forests under the Clean Development Mechanism (CDM). Another important driver is the adoption of cost-effective approaches to ensure strong forest governance. Monitoring, verification, and enforcement) will be needed to ensure legality for purchasers of carbon credits from REDD and CDM activities (Contreras-Hermosilla 2000).
If the trends toward uptake of REDD and CDM occur it could reverse the historic loss of tropical forests in producer countries, lead to increased forest area in China, Malaysia, and India, and slow forest loss in Brazil and Indonesia to almost zero by 2020 (Table 5.1). Such a slowing of forest loss would, however, require a significant change in tropical forest area under protection (up to 40% of forest area) and at least a 50% increase in the current rate of plantation forest establishment in tropical forest areas (Carle & Holmgren 2008).
Consumption of tropical wood products
From the mid-1990s to 2005 global consumption of tropical wood products has been stagnant, with a 0.7% per year decline in sawnwood consumption and a modest 0.8% per year increase in plywood (including veneer) consumption (Figure 5.1). Predictions using the GFPM suggest that the global economic crisis has had a small negative impact on global consumption of all wood products, especially softwood sawnwood and plywood. The global economic crisis is predicted to have had less of an impact on tropical wood product consumption (Figure 5.1), in part because a large share of consumption of these products is in countries less affected by the economic slowdown; China, India, and Brazil (World Bank 2009).
Towards 2020, a combination of positive trends influencing wood product demand and supply would need to occur
50
100
150
200
250
300
350
400
450
1995 2000 2005 2010 2015 2020
Co
nsu
mp
tio
n (
mil
lio
n m
3)
Softwood sawnwoodNon-tropical hardwood sawnwoodTropical hardwood sawnwood
Figure.5.1.Historical.(1995-2005).and.predicted.(2006-2020).softwood,.tropical.hardwood.and.non-tropical.hardwood.sawnwood.and.plywood.consumption.
10
20
30
40
50
60
70
80
1995 2000 2005 2010 2015 2020
Co
nsu
mp
tio
n (
mil
lio
n m
3)
Softwood plywoodTropical hardwood plywoodNon-tropical hardwood plywood
to support higher than historical growth in global tropical wood product consumption. Important demand-side trends include a return to high economic growth post- crisis, particularly in major emerging economies such as China, India and Brazil, and increasing consumer preferences for tropical timber products. The latter would need to be driven by harmonisation of processes and criteria across certification schemes (Simula et al. 2009), adoption of cost-effective approaches to monitoring, verification, and enforcement of legality (Mertens & Méthot 2008), and strategies to increase the competitiveness of tropical timber products relative to substitute products (Oliver & Donkor 2010). At the same time increased wood supply from plantation forests and improvements in tropical timber processing, driven by increased investment in tropical countries, would ensure growth in wood product prices did not dampen demand growth. If these trends occur model predictions suggest tropical sawnwood and plywood consumption from 2010 to 2020 could increase 3.7% and 4.0% per year, respectively.
Substitution from tropical to non-tropical wood products
During the period from 1995 to 2006 there has been a global trend in log, sawnwood, and plywood consumption away from tropical hardwoods to softwoods and to a lesser extent, non-tropical hardwoods (Tables 5.2 and 5.3). As a result, tropical hardwoods have had a declining share in consumption of these products by tropical producers, especially in Asia & Pacific and Latin America. While tropical producer country consumption of wood products is predominantly tropical hardwoods (67% of harvests, 85% of sawnwood, and 87% of plywood in 1995), the share of these in consumption has declined (50% of harvests, 57% of sawnwood and 76% of plywood in 2006). This trend has, in part, been driven by an increase in the use of tropical hardwood plantation forests, for pulp and energy production (ITTO 2007). In Africa, tropical wood products are a significantly larger share of wood product consumption, with only a modest decline in share
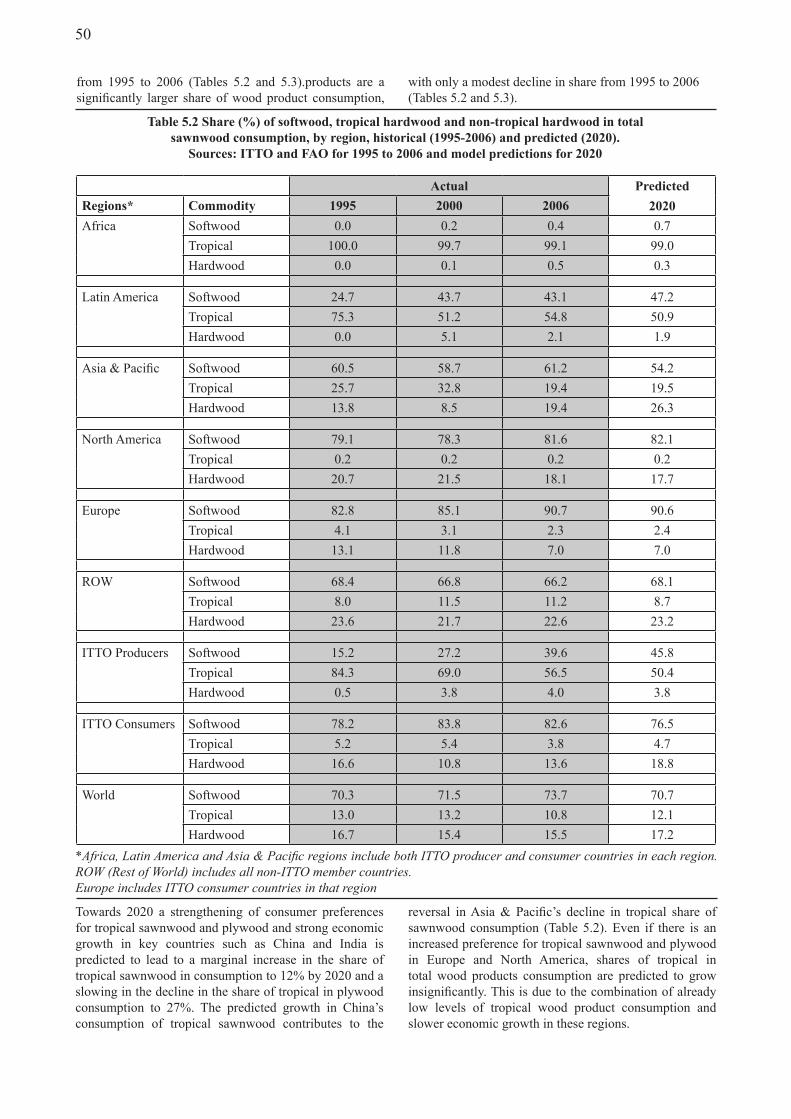
50
Actual Predicted.2020Regions* Commodity 1995 2000 2006
Africa Softwood 0.0 0.2 0.4 0.7Tropical 100.0 99.7 99.1 99.0Hardwood 0.0 0.1 0.5 0.3
Latin America Softwood 24.7 43.7 43.1 47.2Tropical 75.3 51.2 54.8 50.9Hardwood 0.0 5.1 2.1 1.9
Asia & Pacific Softwood 60.5 58.7 61.2 54.2Tropical 25.7 32.8 19.4 19.5Hardwood 13.8 8.5 19.4 26.3
North America Softwood 79.1 78.3 81.6 82.1Tropical 0.2 0.2 0.2 0.2Hardwood 20.7 21.5 18.1 17.7
Europe Softwood 82.8 85.1 90.7 90.6Tropical 4.1 3.1 2.3 2.4Hardwood 13.1 11.8 7.0 7.0
ROW Softwood 68.4 66.8 66.2 68.1Tropical 8.0 11.5 11.2 8.7Hardwood 23.6 21.7 22.6 23.2
ITTO Producers Softwood 15.2 27.2 39.6 45.8Tropical 84.3 69.0 56.5 50.4Hardwood 0.5 3.8 4.0 3.8
ITTO Consumers Softwood 78.2 83.8 82.6 76.5Tropical 5.2 5.4 3.8 4.7Hardwood 16.6 10.8 13.6 18.8
World
Softwood 70.3 71.5 73.7 70.7Tropical 13.0 13.2 10.8 12.1Hardwood 16.7 15.4 15.5 17.2
Table.5.2.Share.(%).of.softwood,.tropical.hardwood.and.non-tropical.hardwood.in.total.sawnwood.consumption,.by.region,.historical.(1995-2006).and.predicted.(2020)..
Sources:.ITTO.and.FAO.for.1995.to.2006.and.model.predictions.for.2020
*Africa, Latin America and Asia & Pacific regions include both ITTO producer and consumer countries in each region. ROW (Rest of World) includes all non-ITTO member countries.Europe includes ITTO consumer countries in that region
Towards 2020 a strengthening of consumer preferences for tropical sawnwood and plywood and strong economic growth in key countries such as China and India is predicted to lead to a marginal increase in the share of tropical sawnwood in consumption to 12% by 2020 and a slowing in the decline in the share of tropical in plywood consumption to 27%. The predicted growth in China’s consumption of tropical sawnwood contributes to the
reversal in Asia & Pacific’s decline in tropical share of sawnwood consumption (Table 5.2). Even if there is an increased preference for tropical sawnwood and plywood in Europe and North America, shares of tropical in total wood products consumption are predicted to grow insignificantly. This is due to the combination of already low levels of tropical wood product consumption and slower economic growth in these regions.
from 1995 to 2006 (Tables 5.2 and 5.3).products are a significantly larger share of wood product consumption,
with only a modest decline in share from 1995 to 2006 (Tables 5.2 and 5.3).
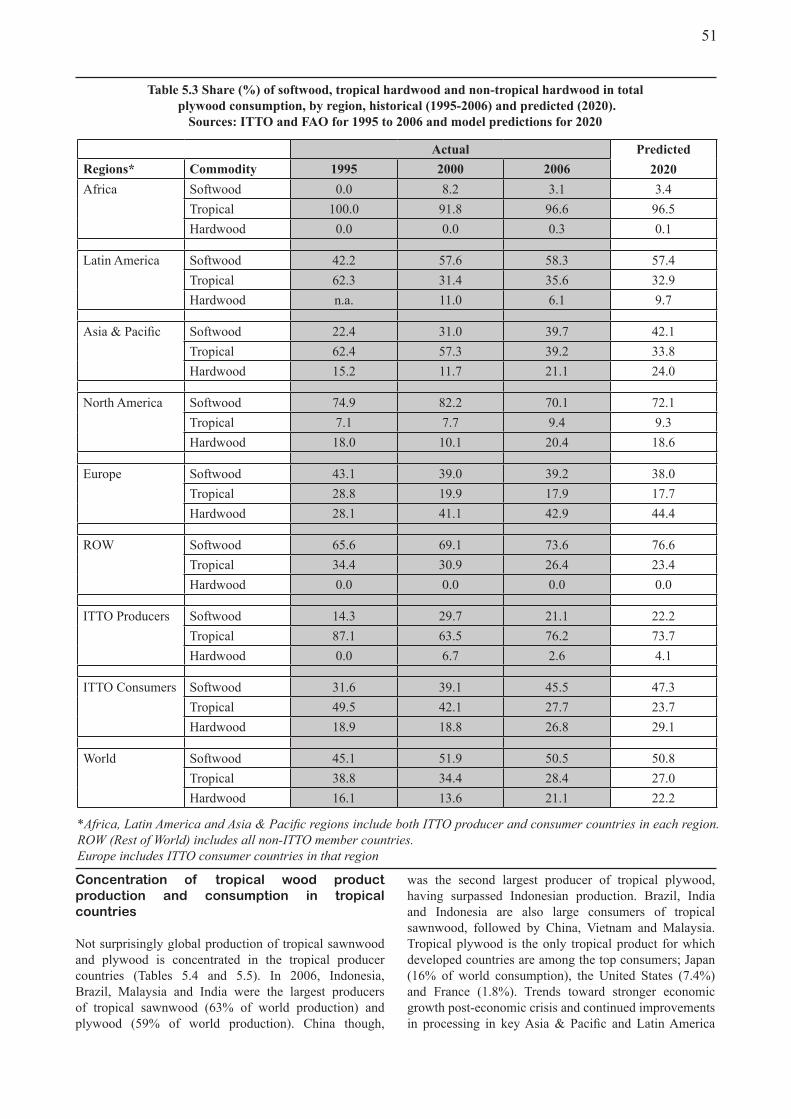
51
Actual Predicted.2020Regions* Commodity 1995 2000 2006
Africa Softwood 0.0 8.2 3.1 3.4Tropical 100.0 91.8 96.6 96.5Hardwood 0.0 0.0 0.3 0.1
Latin America Softwood 42.2 57.6 58.3 57.4Tropical 62.3 31.4 35.6 32.9Hardwood n.a. 11.0 6.1 9.7
Asia & Pacific Softwood 22.4 31.0 39.7 42.1Tropical 62.4 57.3 39.2 33.8Hardwood 15.2 11.7 21.1 24.0
North America Softwood 74.9 82.2 70.1 72.1Tropical 7.1 7.7 9.4 9.3Hardwood 18.0 10.1 20.4 18.6
Europe Softwood 43.1 39.0 39.2 38.0Tropical 28.8 19.9 17.9 17.7Hardwood 28.1 41.1 42.9 44.4
ROW Softwood 65.6 69.1 73.6 76.6Tropical 34.4 30.9 26.4 23.4Hardwood 0.0 0.0 0.0 0.0
ITTO Producers Softwood 14.3 29.7 21.1 22.2Tropical 87.1 63.5 76.2 73.7Hardwood 0.0 6.7 2.6 4.1
ITTO Consumers Softwood 31.6 39.1 45.5 47.3Tropical 49.5 42.1 27.7 23.7Hardwood 18.9 18.8 26.8 29.1
World
Softwood 45.1 51.9 50.5 50.8Tropical 38.8 34.4 28.4 27.0Hardwood 16.1 13.6 21.1 22.2
Table.5.3.Share.(%).of.softwood,.tropical.hardwood.and.non-tropical.hardwood.in.total.plywood.consumption,.by.region,.historical.(1995-2006).and.predicted.(2020)..Sources:.ITTO.and.FAO.for.1995.to.2006.and.model.predictions.for.2020
*Africa, Latin America and Asia & Pacific regions include both ITTO producer and consumer countries in each region. ROW (Rest of World) includes all non-ITTO member countries.Europe includes ITTO consumer countries in that region
Concentration of tropical wood product production and consumption in tropicalcountries
Not surprisingly global production of tropical sawnwood and plywood is concentrated in the tropical producer countries (Tables 5.4 and 5.5). In 2006, Indonesia, Brazil, Malaysia and India were the largest producers of tropical sawnwood (63% of world production) and plywood (59% of world production). China though,
was the second largest producer of tropical plywood, having surpassed Indonesian production. Brazil, India and Indonesia are also large consumers of tropical sawnwood, followed by China, Vietnam and Malaysia. Tropical plywood is the only tropical product for which developed countries are among the top consumers; Japan (16% of world consumption), the United States (7.4%) and France (1.8%). Trends toward stronger economic growth post-economic crisis and continued improvements in processing in key Asia & Pacific and Latin America
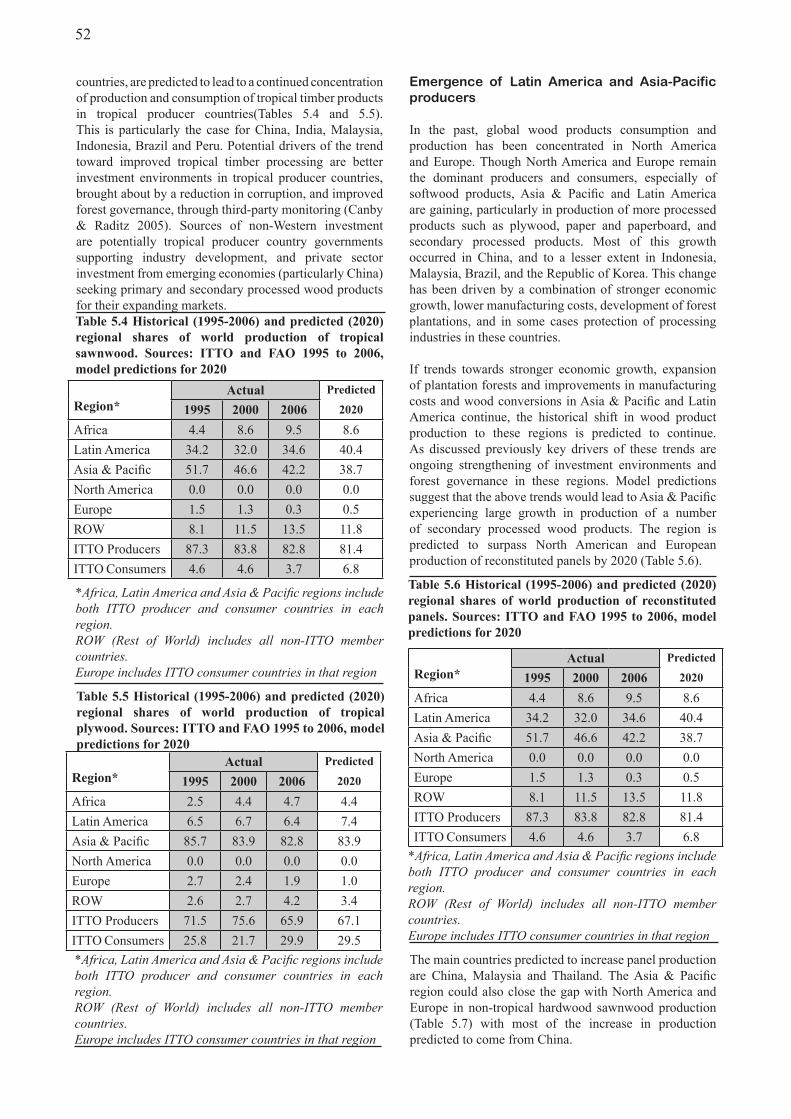
52
countries, are predicted to lead to a continued concentration of production and consumption of tropical timber products in tropical producer countries(Tables 5.4 and 5.5). This is particularly the case for China, India, Malaysia, Indonesia, Brazil and Peru. Potential drivers of the trend toward improved tropical timber processing are better investment environments in tropical producer countries, brought about by a reduction in corruption, and improved forest governance, through third-party monitoring (Canby & Raditz 2005). Sources of non-Western investment are potentially tropical producer country governments supporting industry development, and private sector investment from emerging economies (particularly China) seeking primary and secondary processed wood products for their expanding markets.Table.5.4.Historical.(1995-2006).and.predicted.(2020).regional. shares. of. world. production. of. tropical.sawnwood.. Sources:. ITTO. and. FAO. 1995. to. 2006,.model.predictions.for.2020
Region*Actual Predicted
20201995 2000 2006Africa 4.4 8.6 9.5 8.6Latin America 34.2 32.0 34.6 40.4Asia & Pacific 51.7 46.6 42.2 38.7North America 0.0 0.0 0.0 0.0Europe 1.5 1.3 0.3 0.5ROW 8.1 11.5 13.5 11.8ITTO Producers 87.3 83.8 82.8 81.4ITTO Consumers 4.6 4.6 3.7 6.8
Table.5.5.Historical.(1995-2006).and.predicted.(2020).regional. shares. of. world. production. of. tropical.plywood..Sources:.ITTO.and.FAO.1995.to.2006,.model.predictions.for.2020
Region*Actual Predicted
20201995 2000 2006Africa 2.5 4.4 4.7 4.4Latin America 6.5 6.7 6.4 7.4Asia & Pacific 85.7 83.9 82.8 83.9North America 0.0 0.0 0.0 0.0Europe 2.7 2.4 1.9 1.0ROW 2.6 2.7 4.2 3.4ITTO Producers 71.5 75.6 65.9 67.1ITTO Consumers 25.8 21.7 29.9 29.5
*Africa, Latin America and Asia & Pacific regions include both ITTO producer and consumer countries in each region. ROW (Rest of World) includes all non-ITTO member countries.Europe includes ITTO consumer countries in that region
Emergence of Latin America and Asia-Pacific producers
In the past, global wood products consumption and production has been concentrated in North America and Europe. Though North America and Europe remain the dominant producers and consumers, especially of softwood products, Asia & Pacific and Latin America are gaining, particularly in production of more processed products such as plywood, paper and paperboard, and secondary processed products. Most of this growth occurred in China, and to a lesser extent in Indonesia, Malaysia, Brazil, and the Republic of Korea. This change has been driven by a combination of stronger economic growth, lower manufacturing costs, development of forest plantations, and in some cases protection of processing industries in these countries.
If trends towards stronger economic growth, expansion of plantation forests and improvements in manufacturing costs and wood conversions in Asia & Pacific and Latin America continue, the historical shift in wood product production to these regions is predicted to continue. As discussed previously key drivers of these trends are ongoing strengthening of investment environments and forest governance in these regions. Model predictions suggest that the above trends would lead to Asia & Pacific experiencing large growth in production of a number of secondary processed wood products. The region is predicted to surpass North American and European production of reconstituted panels by 2020 (Table 5.6).
*Africa, Latin America and Asia & Pacific regions include both ITTO producer and consumer countries in each region. ROW (Rest of World) includes all non-ITTO member countries.Europe includes ITTO consumer countries in that region
Table.5.6.Historical.(1995-2006).and.predicted.(2020).regional. shares. of. world. production. of. reconstituted.panels..Sources:.ITTO.and.FAO.1995.to.2006,.model.predictions.for.2020
Region*Actual Predicted
20201995 2000 2006Africa 4.4 8.6 9.5 8.6Latin America 34.2 32.0 34.6 40.4Asia & Pacific 51.7 46.6 42.2 38.7North America 0.0 0.0 0.0 0.0Europe 1.5 1.3 0.3 0.5ROW 8.1 11.5 13.5 11.8ITTO Producers 87.3 83.8 82.8 81.4ITTO Consumers 4.6 4.6 3.7 6.8
*Africa, Latin America and Asia & Pacific regions include both ITTO producer and consumer countries in each region. ROW (Rest of World) includes all non-ITTO member countries.Europe includes ITTO consumer countries in that region
The main countries predicted to increase panel production are China, Malaysia and Thailand. The Asia & Pacific region could also close the gap with North America and Europe in non-tropical hardwood sawnwood production (Table 5.7) with most of the increase in production predicted to come from China.
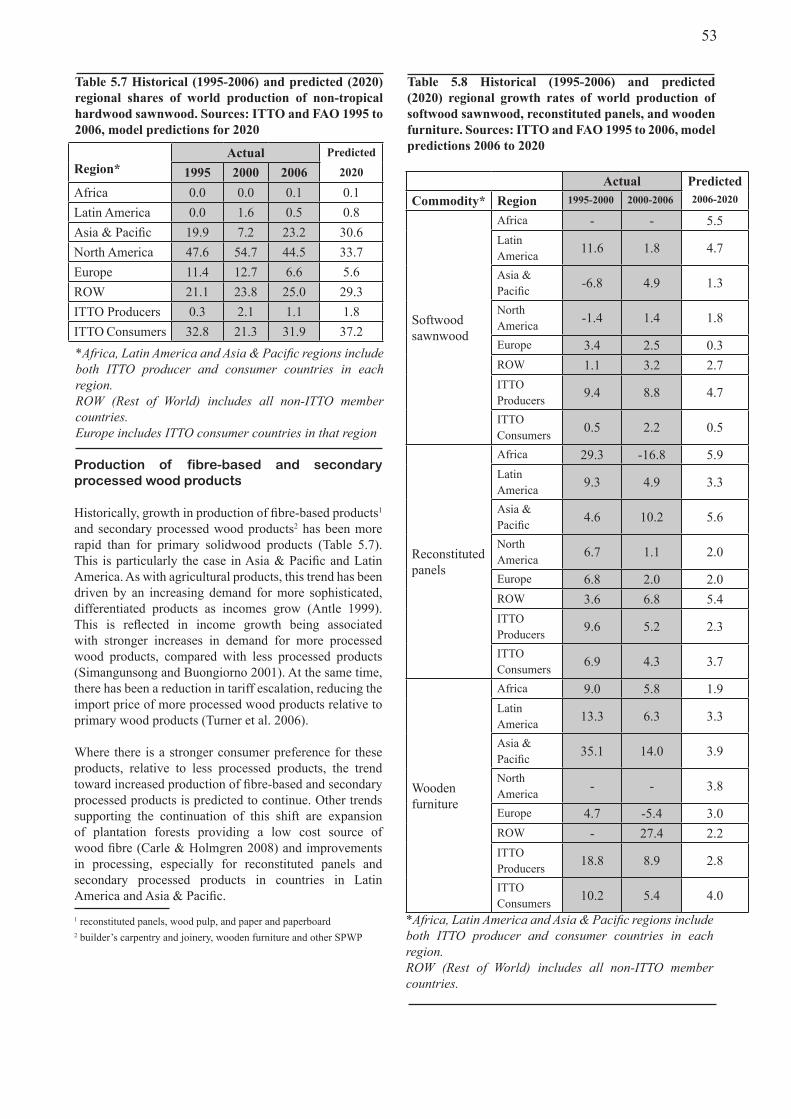
53
Actual Predicted2006-2020Commodity* Region 1995-2000 2000-2006
Softwood sawnwood
Africa - - 5.5Latin America 11.6 1.8 4.7
Asia & Pacific -6.8 4.9 1.3
North America -1.4 1.4 1.8
Europe 3.4 2.5 0.3ROW 1.1 3.2 2.7ITTO Producers 9.4 8.8 4.7
ITTO Consumers 0.5 2.2 0.5
Reconstituted panels
Africa 29.3 -16.8 5.9Latin America 9.3 4.9 3.3
Asia & Pacific 4.6 10.2 5.6
North America 6.7 1.1 2.0
Europe 6.8 2.0 2.0ROW 3.6 6.8 5.4ITTO Producers 9.6 5.2 2.3
ITTO Consumers 6.9 4.3 3.7
Wooden furniture
Africa 9.0 5.8 1.9Latin America 13.3 6.3 3.3
Asia & Pacific 35.1 14.0 3.9
North America - - 3.8
Europe 4.7 -5.4 3.0ROW - 27.4 2.2ITTO Producers 18.8 8.9 2.8
ITTO Consumers 10.2 5.4 4.0
*Africa, Latin America and Asia & Pacific regions include both ITTO producer and consumer countries in each region.ROW (Rest of World) includes all non-ITTO member countries.
Table.5.7.Historical.(1995-2006).and.predicted.(2020).regional. shares. of. world. production. of. non-tropical.hardwood.sawnwood..Sources:.ITTO.and.FAO.1995.to.2006,.model.predictions.for.2020
Region*Actual Predicted
20201995 2000 2006Africa 0.0 0.0 0.1 0.1Latin America 0.0 1.6 0.5 0.8Asia & Pacific 19.9 7.2 23.2 30.6North America 47.6 54.7 44.5 33.7Europe 11.4 12.7 6.6 5.6ROW 21.1 23.8 25.0 29.3ITTO Producers 0.3 2.1 1.1 1.8ITTO Consumers 32.8 21.3 31.9 37.2*Africa, Latin America and Asia & Pacific regions include both ITTO producer and consumer countries in each region. ROW (Rest of World) includes all non-ITTO member countries.Europe includes ITTO consumer countries in that region
Table. 5.8. Historical. (1995-2006). and. predicted.(2020). regional. growth. rates. of. world. production. of.softwood.sawnwood,.reconstituted.panels,.and.wooden.furniture..Sources:.ITTO.and.FAO.1995.to.2006,.model.predictions.2006.to.2020
Production of fibre-based and secondary processed wood products
Historically, growth in production of fibre-based products1 and secondary processed wood products2 has been more rapid than for primary solidwood products (Table 5.7). This is particularly the case in Asia & Pacific and Latin America. As with agricultural products, this trend has been driven by an increasing demand for more sophisticated, differentiated products as incomes grow (Antle 1999). This is reflected in income growth being associated with stronger increases in demand for more processed wood products, compared with less processed products (Simangunsong and Buongiorno 2001). At the same time, there has been a reduction in tariff escalation, reducing the import price of more processed wood products relative to primary wood products (Turner et al. 2006).
Where there is a stronger consumer preference for these products, relative to less processed products, the trend toward increased production of fibre-based and secondary processed products is predicted to continue. Other trends supporting the continuation of this shift are expansion of plantation forests providing a low cost source of wood fibre (Carle & Holmgren 2008) and improvements in processing, especially for reconstituted panels and secondary processed products in countries in Latin America and Asia & Pacific.1 reconstituted panels, wood pulp, and paper and paperboard2 builder’s carpentry and joinery, wooden furniture and other SPWP
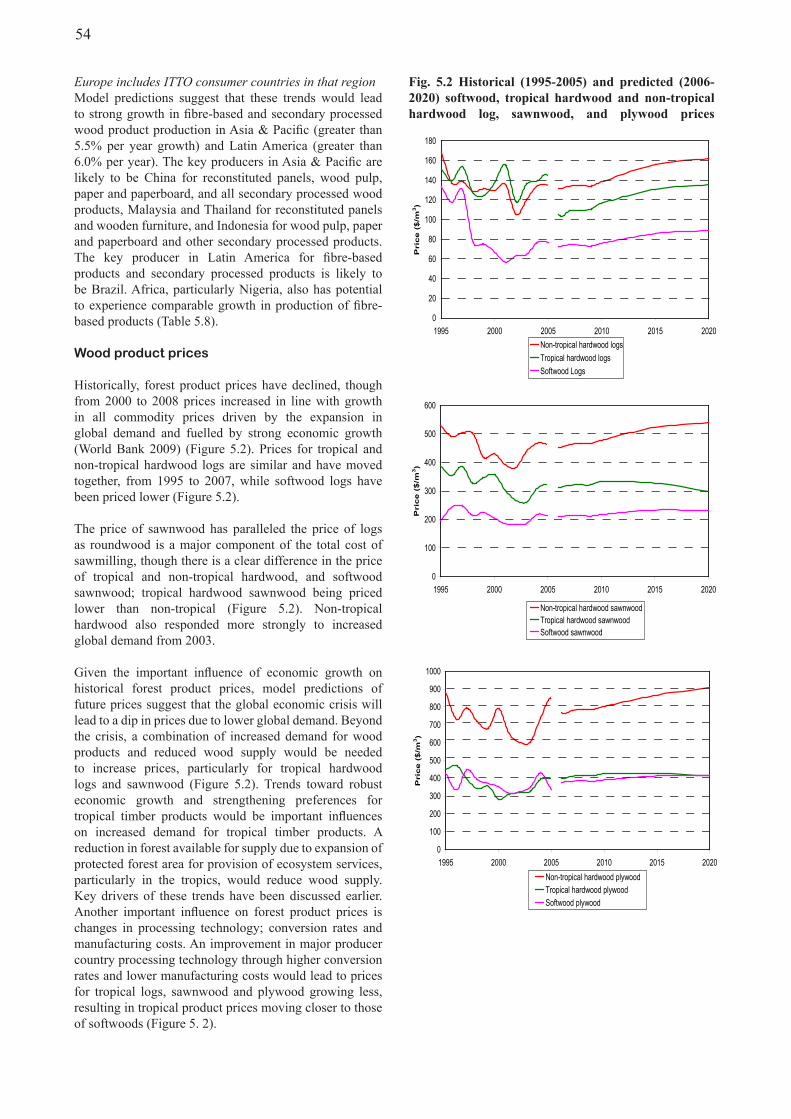
54
Europe includes ITTO consumer countries in that regionModel predictions suggest that these trends would lead to strong growth in fibre-based and secondary processed wood product production in Asia & Pacific (greater than 5.5% per year growth) and Latin America (greater than 6.0% per year). The key producers in Asia & Pacific are likely to be China for reconstituted panels, wood pulp, paper and paperboard, and all secondary processed wood products, Malaysia and Thailand for reconstituted panels and wooden furniture, and Indonesia for wood pulp, paper and paperboard and other secondary processed products. The key producer in Latin America for fibre-based products and secondary processed products is likely to be Brazil. Africa, particularly Nigeria, also has potential to experience comparable growth in production of fibre-based products (Table 5.8).
Wood product prices
Historically, forest product prices have declined, though from 2000 to 2008 prices increased in line with growth in all commodity prices driven by the expansion in global demand and fuelled by strong economic growth (World Bank 2009) (Figure 5.2). Prices for tropical and non-tropical hardwood logs are similar and have moved together, from 1995 to 2007, while softwood logs have been priced lower (Figure 5.2).
The price of sawnwood has paralleled the price of logs as roundwood is a major component of the total cost of sawmilling, though there is a clear difference in the price of tropical and non-tropical hardwood, and softwood sawnwood; tropical hardwood sawnwood being priced lower than non-tropical (Figure 5.2). Non-tropical hardwood also responded more strongly to increased global demand from 2003.
Given the important influence of economic growth on historical forest product prices, model predictions of future prices suggest that the global economic crisis will lead to a dip in prices due to lower global demand. Beyond the crisis, a combination of increased demand for wood products and reduced wood supply would be needed to increase prices, particularly for tropical hardwood logs and sawnwood (Figure 5.2). Trends toward robust economic growth and strengthening preferences for tropical timber products would be important influences on increased demand for tropical timber products. A reduction in forest available for supply due to expansion of protected forest area for provision of ecosystem services, particularly in the tropics, would reduce wood supply. Key drivers of these trends have been discussed earlier.Another important influence on forest product prices is changes in processing technology; conversion rates and manufacturing costs. An improvement in major producer country processing technology through higher conversion rates and lower manufacturing costs would lead to prices for tropical logs, sawnwood and plywood growing less, resulting in tropical product prices moving closer to those of softwoods (Figure 5. 2).
Fig.. 5.2. Historical. (1995-2005). and. predicted. (2006-2020). softwood,. tropical. hardwood. and. non-tropical.hardwood. log,. sawnwood,. and. plywood. prices.
0
20
40
60
80
100
120
140
160
180
1995 2000 2005 2010 2015 2020
Pri
ce (
$/m
3)
Non-tropical hardwood logsTropical hardwood logsSoftwood Logs
0
100
200
300
400
500
600
1995 2000 2005 2010 2015 2020
Pri
ce (
$/m
3)
Non-tropical hardwood sawnwoodTropical hardwood sawnwoodSoftwood sawnwood
0
100
200
300
400
500
600
700
800
900
1000
1995 2000 2005 2010 2015 2020
Pri
ce (
$/m
3)
Non-tropical hardwood plywoodTropical hardwood plywoodSoftwood plywood
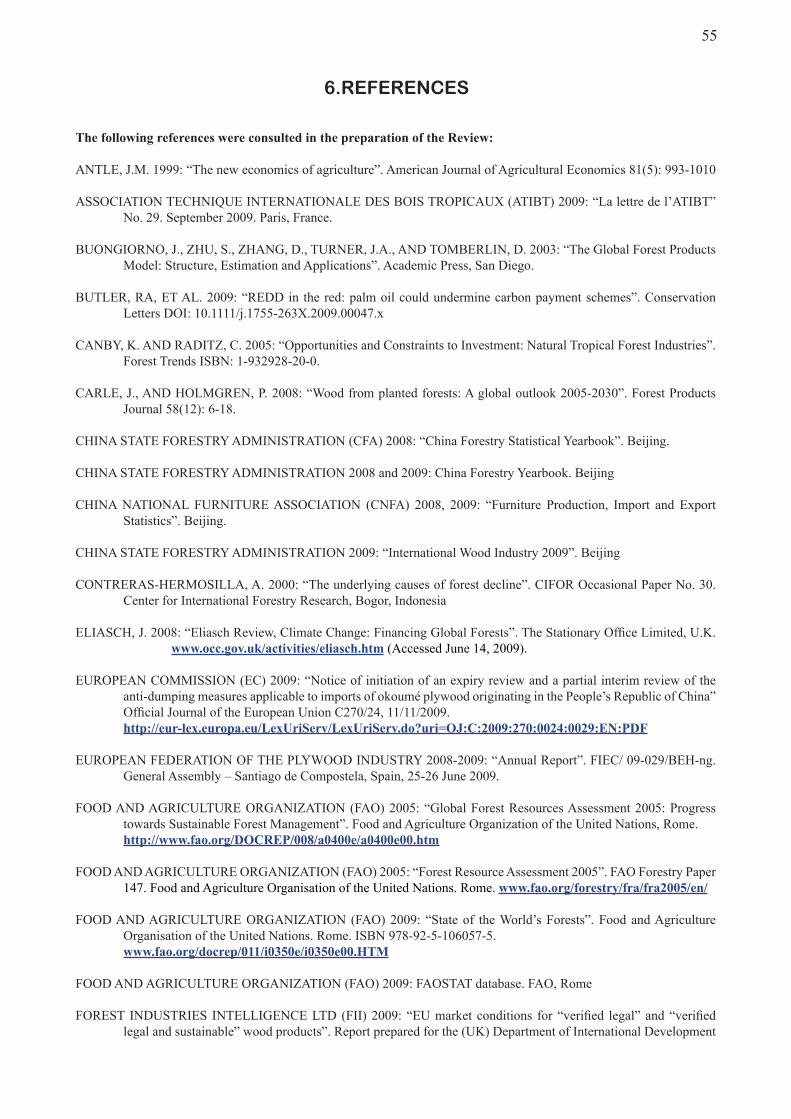
55
6.REFERENCES
The.following.references.were.consulted.in.the.preparation.of.the.Review:
ANTLE, J.M. 1999: “The new economics of agriculture”. American Journal of Agricultural Economics 81(5): 993-1010
ASSOCIATION TECHNIQUE INTERNATIONALE DES BOIS TROPICAUX (ATIBT) 2009: “La lettre de l’ATIBT” No. 29. September 2009. Paris, France.
BUONGIORNO, J., ZHU, S., ZHANG, D., TURNER, J.A., AND TOMBERLIN, D. 2003: “The Global Forest Products Model: Structure, Estimation and Applications”. Academic Press, San Diego.
BUTLER, RA, ET AL. 2009: “REDD in the red: palm oil could undermine carbon payment schemes”. Conservation Letters DOI: 10.1111/j.1755-263X.2009.00047.x
CANBY, K. AND RADITZ, C. 2005: “Opportunities and Constraints to Investment: Natural Tropical Forest Industries”. Forest Trends ISBN: 1-932928-20-0.
CARLE, J., AND HOLMGREN, P. 2008: “Wood from planted forests: A global outlook 2005-2030”. Forest Products Journal 58(12): 6-18.
CHINA STATE FORESTRY ADMINISTRATION (CFA) 2008: “China Forestry Statistical Yearbook”. Beijing.
CHINA STATE FORESTRY ADMINISTRATION 2008 and 2009: China Forestry Yearbook. Beijing
CHINA NATIONAL FURNITURE ASSOCIATION (CNFA) 2008, 2009: “Furniture Production, Import and Export Statistics”. Beijing.
CHINA STATE FORESTRY ADMINISTRATION 2009: “International Wood Industry 2009”. Beijing
CONTRERAS-HERMOSILLA, A. 2000: “The underlying causes of forest decline”. CIFOR Occasional Paper No. 30. Center for International Forestry Research, Bogor, Indonesia
ELIASCH, J. 2008: “Eliasch Review, Climate Change: Financing Global Forests”. The Stationary Office Limited, U.K. www.occ.gov.uk/activities/eliasch.htm (Accessed June 14, 2009).
EUROPEAN COMMISSION (EC) 2009: “Notice of initiation of an expiry review and a partial interim review of the anti-dumping measures applicable to imports of okoumé plywood originating in the People’s Republic of China” Official Journal of the European Union C270/24, 11/11/2009. http://eur-lex.europa.eu/LexUriServ/LexUriServ.do?uri=OJ:C:2009:270:0024:0029:EN:PDF
EUROPEAN FEDERATION OF THE PLYWOOD INDUSTRY 2008-2009: “Annual Report”. FIEC/ 09-029/BEH-ng. General Assembly – Santiago de Compostela, Spain, 25-26 June 2009.
FOOD AND AGRICULTURE ORGANIZATION (FAO) 2005: “Global Forest Resources Assessment 2005: Progress towards Sustainable Forest Management”. Food and Agriculture Organization of the United Nations, Rome. http://www.fao.org/DOCREP/008/a0400e/a0400e00.htm
FOOD AND AGRICULTURE ORGANIZATION (FAO) 2005: “Forest Resource Assessment 2005”. FAO Forestry Paper 147. Food and Agriculture Organisation of the United Nations. Rome. www.fao.org/forestry/fra/fra2005/en/
FOOD AND AGRICULTURE ORGANIZATION (FAO) 2009: “State of the World’s Forests”. Food and Agriculture Organisation of the United Nations. Rome. ISBN 978-92-5-106057-5. www.fao.org/docrep/011/i0350e/i0350e00.HTM
FOOD AND AGRICULTURE ORGANIZATION (FAO) 2009: FAOSTAT database. FAO, Rome
FOREST INDUSTRIES INTELLIGENCE LTD (FII) 2009: “EU market conditions for “verified legal” and “verified legal and sustainable” wood products”. Report prepared for the (UK) Department of International Development
56
and the Timber Trade Federation. http://www.ttf.co.uk/Environment/Certification.aspx
FOREST INDUSTRIES INTELLIGENCE LTD. 2009: “Analysis of Eurostat Wood Import Statistics”. (Unpublished report).
FREEDONIA GROUP INC. 2009: “World Windows and Doors to 2013 - Demand and Sales Forecasts, Market Share, Market Size, Market Leaders”. Freedonia Study No. 2513. www.freedoniagroup.com/World-Windows-And-Doors.html..June.2009
GENERAL ADMINISTRATION OF CUSTOMS OF CHINA 2008, 2009: “Import and Export Statistics of China. Statistics of 2008 and 2009”, Beijing
GLOBAL INDUSTRY ANALYSTS, INC. 2008: “Building Materials: A Global Industry Outlook”. Global Industry Analysts Inc, 5645 Silver Creek Valley Road, San Jose, California 95138, USA. Document Code GOS-007. www.strategyr.com/GOS.asp?code=GOS-007
GLOBAL TRADE INFORMATION SERVICE (GTIS) 2009: Global Trade Atlas Database. http://www.gtis.com/gta/, accessed May 2010.
HARDWOOD PUBLISHING INC. 200-2009: “Hardwood Review”. Various issues, December 2000 to July 2009. www.hardwoodreview.com
INTERNATIONAL MONETARY FUND (IMF) 2009: “World Economic Outlook ‘Sustaining the Recovery’”. October 2009. Washington, D.C.
INTERNATIONAL MONETARY FUND (IMF) 2010: World Economic Outlook “Rebalancing Growth”. April 2010. Washington, D.C.
INTERNATIONAL TROPICAL TIMBER ORGANIZATION (ITTO) 1996: “Pre-Project Study on Evaluation and Enhancement of ITTO’s Statistical Functions and Networks”. International Tropical Timber Organization. Yokohama.
INTERNATIONAL TROPICAL TIMBER ORGANIZATION (ITTO) 1995-2008: “Annual Review and Assessment of the World Timber Situation”. Various issues 1995-2008. International Tropical Timber Organization. Yokohama.
INTERNATIONAL TROPICAL TIMBER ORGANIZATION (ITTO) 2010: “ITTO Market Information Service” Various Reports. International Tropical Timber Organization, Yokohama.
MERTENS, B. AND MÉTHOT, P. 2008: “Improving forest governance in the Republic of Congo”. Tropical Forest Update 18(1): 10-11
MOORE, N. 2009: “UK Timber Industry Certification”. Timber Trade Federation, London. 44pp. http://www.ttf.co.uk/Environment/Certification.aspx
OLIVER R. AND DONKOR B. 2010: “Monitoring the competitiveness of tropical timber”. ITTO Technical Series (in press). International Tropical Timber Organization, Yokohama.
ROYAL INSTITUTE OF CHARTERED SURVEYORS (RICS) 2010: “2010 European Housing Review”. RICS Research, Brussels. http://www.joinricsineurope.eu/uploads/files/2010EuropeanHousingReviewfullreport.pdf
SCHWARTZ, P. 1996: “The Art of the Long View”. Bantam Doubleday Dell, New York.
SIMANGUNSONG, B., AND BUONGIORNO, J. 2001: “International demand for forest products: A comparison of methods”. Scandinavian Journal of Forest Research 16: 155-172.
SIMULA, M., GHAZALI, B.H., EBA’A ATYI, R., PEREZ CONTRERAS, O. 2010: “The Pros and Cons of Procurement. Developments and process in timber procurement policies as tools for promoting the sustainable management of tropical forests”. ITTO Technical Series No. 34. April 2010. International Tropical Timber Organization, Yokohama, Japan.
57
TURNER, J., BUORNGIORNO, J., MAPLESDEN, F., ZHU, S., BATES, S., AND LI, R. 2006: “World wood industries outlook 2005-2030”. Forest Research Bulletin No. 230. Scion, Rotorua, New Zealand.
TURNER, J.A. 2010: “Long-term outlook for the tropical timber market”. ITTO Technical Series (in press). International Tropical Timber Organization, Yokohama.
UNITED NATIONS ECONOMIC COMMISSION FOR EUROPE/ FOOD AND AGRICULTURE ORGANIZATION (UNECE/ FAO) 2008. “Forest products Annual Market Review 2007-2008”. Geneva Timber and Forest Study Paper 23. ECE/TIM/SP/23. United Nations, Geneva.
UNITED NATIONS ECONOMIC COMMISSION FOR EUROPE/ FOOD AND AGRICULTURE ORGANIZATION (UNECE/ FAO) 2009. “Forest products Annual Market Review 2008-2009”. Geneva Timber and Forest Study Paper 24. ECE/TIM/SP/24. United Nations, Geneva.
UNITED NATIONS ENVIRONMENT PROGRAMME (UNEP) 2009. “Buildings and Climate Change - Summary for Decision Makers”. December 2009.
UNITED NATIONS STATISTICS OFFICE 2009: “UN COMTRADE database”. New York.
US INTERNATIONAL TRADE COMMISSION (ITC) 2008: “Wood Flooring and Hardwood Plywood. Competitive Conditions Affecting the US Industries”. Investigation No. 332-487. USITC Publication 4032. www.usitc.gov
WORLD BANK 2009: “Commodity Price Data”. http://econ.worldbank.org/, accessed May 2009.
WORLD BANK. 2009: “Global Economic Prospects: Commodities at the Crossroads”. The World Bank, Washington DC. http://siteresources.worldbank.org/INTGEP2009/Resources/10363_WebPDF-w47.pdf
The.following.websites.were.also.consulted:
American Forest and Paper Association, www.afandpa.orgBritish Furniture Manufacturers, www.bfm.org.ukChina State Forestry Administration, www.forestry.gov.cnChina National Furniture Association (CNFA), www.cnfa.com.cnCAFNET-China Academy of Forestry Website, www.cas.sc.cnChinatimber, www.chinatimber.orgChinawood.net (CWI), www.chinawood.netCenter for International Forestry Research, www.cifor.cgiar.orgConvention on International Trade in Endangered Species of Wild Fauna and Flora, www.cites.orgEnergy, Environment and Development Programme, Chatham House, www.illegal-logging.infoEnvironment News Service, www.ens-news.comEU Indonesia FLEGT Support Project, www.eu-flegt.orgEurostat, www.eurostat.ecEuroconstruct, www.euroconstruct.orgFederation of German Woodworking and Furniture Industries (HDH), www.hdh-ev.deForest Industries Intelligence Ltd, www.sustainablewood.comForest Protection Portal, http://forests.orgForest Trends, www.forest-trends.orgGeneral Administration of Customs of China, www.customs.gov.cnGlobal Demographics, www.global-dem.comGlobalwood.org, www.globalwood.orgIndonesian Furniture Industry and Handicraft Association, www.iffina-indonesia.comInternational Monetary Fund, www.imf.orgInternational Trade Centre, Trade Competitiveness Map, http://www.intracen.org/appli1/TradeCom/RS_TP_CI.aspx?RP=120&YR=2005Italian Federation of wood, furniture, cork and Furnishing Industries, www.federlegnoarredo.itJapan Ministry of Agriculture, Forestry and Fisheries, www.maff.go.jpJapan Statistics Bureau, www.stat.go.jpMalaysian Timber Industry Board, www.mtib.gov.myRainforest Action Network, www.ran.orgStatisches Bundesamt Deutschland, www.destatis.deTaiwan Bureau of Foreign Trade, www.trade.gov.tw
58
Timber Trade Journal Online (TTJ), www.ttjonline.comUN Comtrade, www.unstats.org/unsd/comtradeUNECE/FAO TIMBER database, www.unece.org/trade/timberUnited Nations Statistics Division, www.unstats.un.orgUS Census Bureau, www.census.govUS Department of Agriculture, Foreign Agricultural Service, Attaché Reports, www.fas.usda.govUS International Trade Commission,.www.usitc.gov
Various.issues.of.the.following.publications.were.also.consulted:
Asian TimberChina National Light Industry Council (CNLIC): Statistics on furniture of 2008 and 2009China Wood Monthly Market ReportEurostatEUWID Wood Products and PanelsFurniture Design and Manufacturing AsiaITTO Market Information ServiceJapan Forest Products JournalJapan Lumber JournalJapan Lumber ReportsMaskayuMinistry of Commerce of China: Import and Export Statistics and Analysis of 2008 and 2009National Bureau of Statistics of China: Main Social and Economic Indicators of 2008 and 2009Random Lengths InternationalSTA ReviewThe EconomistTimber Trade JournalTropical Forest UpdateUSDA Foreign Agricultural Service GAIN ReportsWood Based Panels InternationalWood Furniture-International Market ReviewWood Markets
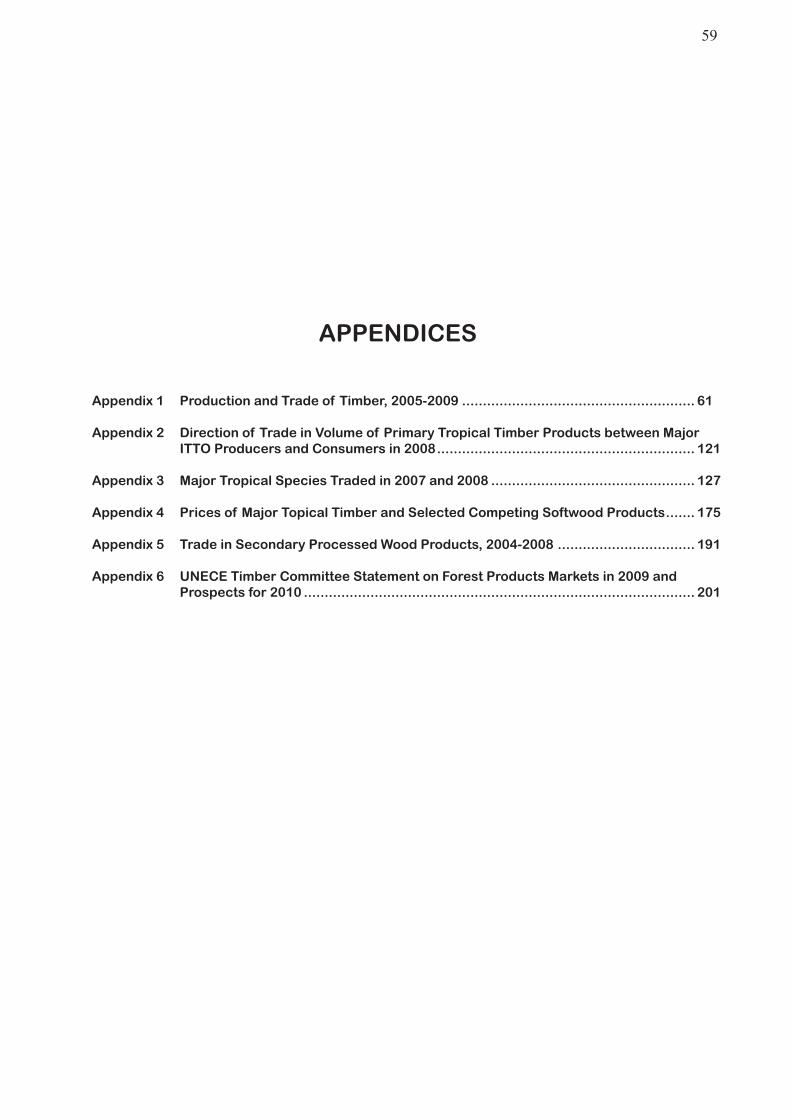
59
APPENDICES
Appendix 1 Production and Trade of Timber, 2005-2009 ........................................................ 61
Appendix 2 Direction of Trade in Volume of Primary Tropical Timber Products between Major ITTO Producers and Consumers in 2008 .............................................................. 121
Appendix 3 Major Tropical Species Traded in 2007 and 2008 ................................................. 127
Appendix 4 Prices of Major Topical Timber and Selected Competing Softwood Products ....... 175
Appendix 5 Trade in Secondary Processed Wood Products, 2004-2008 ................................. 191
Appendix 6 UNECE Timber Committee Statement on Forest Products Markets in 2009 and Prospects for 2010 .............................................................................................. 201
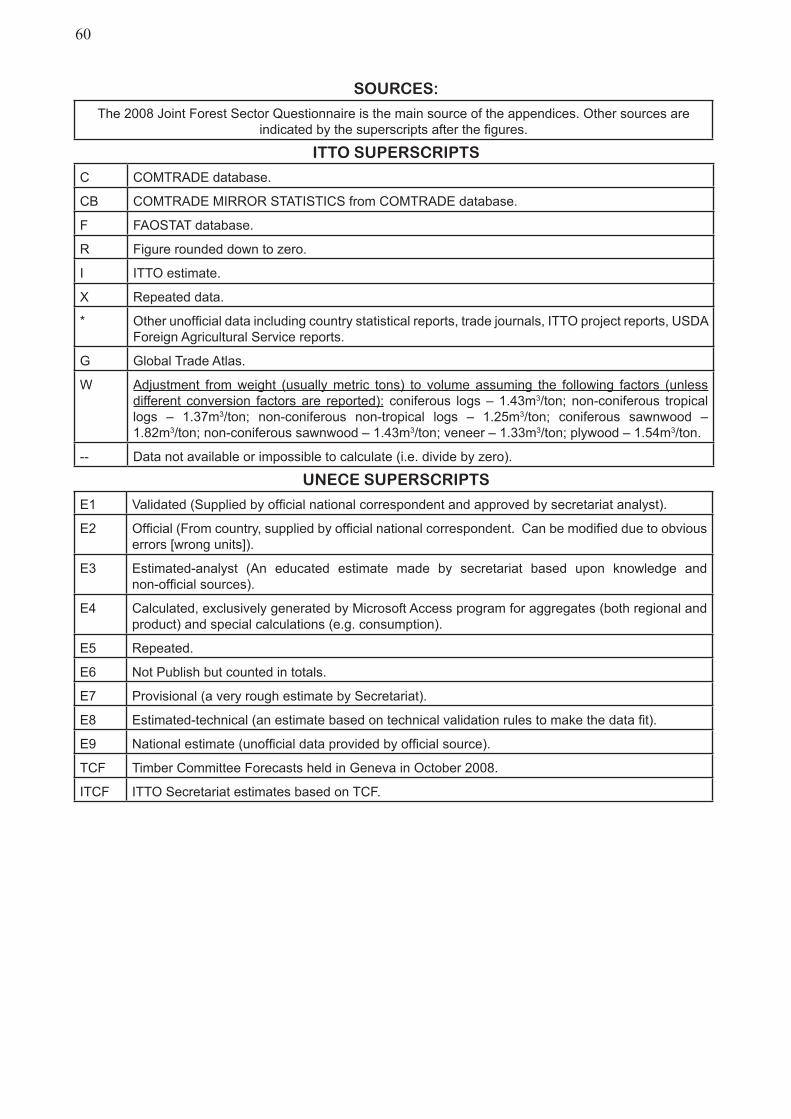
60
SOURCES:
The 2008 Joint Forest Sector Questionnaire is the main source of the appendices. Other sources are indicated by the superscripts after the figures.
ITTO SUPERSCRIPTS
C COMTRADE database.
CB COMTRADE MIRROR STATISTICS from COMTRADE database.
F FAOSTAT database.
R Figure rounded down to zero.
I ITTO estimate.
X Repeated data.
* Other unofficial data including country statistical reports, trade journals, ITTO project reports, USDA Foreign Agricultural Service reports.
G Global Trade Atlas.
W Adjustment from weight (usually metric tons) to volume assuming the following factors (unless different conversion factors are reported): coniferous logs – 1.43m3/ton; non-coniferous tropical logs – 1.37m3/ton; non-coniferous non-tropical logs – 1.25m3/ton; coniferous sawnwood – 1.82m3/ton; non-coniferous sawnwood – 1.43m3/ton; veneer – 1.33m3/ton; plywood – 1.54m3/ton.
-- Data not available or impossible to calculate (i.e. divide by zero).
UNECE SUPERSCRIPTS
E1 Validated (Supplied by official national correspondent and approved by secretariat analyst).
E2 Official (From country, supplied by official national correspondent. Can be modified due to obvious errors [wrong units]).
E3 Estimated-analyst (An educated estimate made by secretariat based upon knowledge and non-official sources).
E4 Calculated, exclusively generated by Microsoft Access program for aggregates (both regional and product) and special calculations (e.g. consumption).
E5 Repeated.
E6 Not Publish but counted in totals.
E7 Provisional (a very rough estimate by Secretariat).
E8 Estimated-technical (an estimate based on technical validation rules to make the data fit).
E9 National estimate (unofficial data provided by official source).
TCF Timber Committee Forecasts held in Geneva in October 2008.
ITCF ITTO Secretariat estimates based on TCF.
61
APPENDIX 1
Production and Trade of Timber, 2005-2009
Table 1-1-a. Production and Trade of All Timber by ITTO Consumers ........................................ 62
Table 1-1-b. Production and Trade of Tropical Timber by ITTO Consumers ................................ 74
Table 1-1-c. Production and Trade of All Timber by ITTO Producers .......................................... 80
Table 1-1-d. Production and Trade of Tropical Timber by ITTO Producers ................................. 92
Table 1-2-a. Value of Trade of All Timber by ITTO Consumers, 2007-2008 ................................. 98
Table 1-2-b. Value of Trade of Tropical Timber by ITTO Consumers, 2007-2008 ......................... 106
Table 1-2-c. Value of Trade of All Timber by ITTO Producers, 2007-2008 ................................... 109
Table 1-2-d. Value of Trade of Tropical Timber by ITTO Producers, 2007-2008 .......................... 117
N.B. Domestic Consumption = Production + Imports - Exports. Unit values may differ for equivalent volumes/values due to rounding. Export values/prices are FOB; import values are CIF, unless otherwise stated.
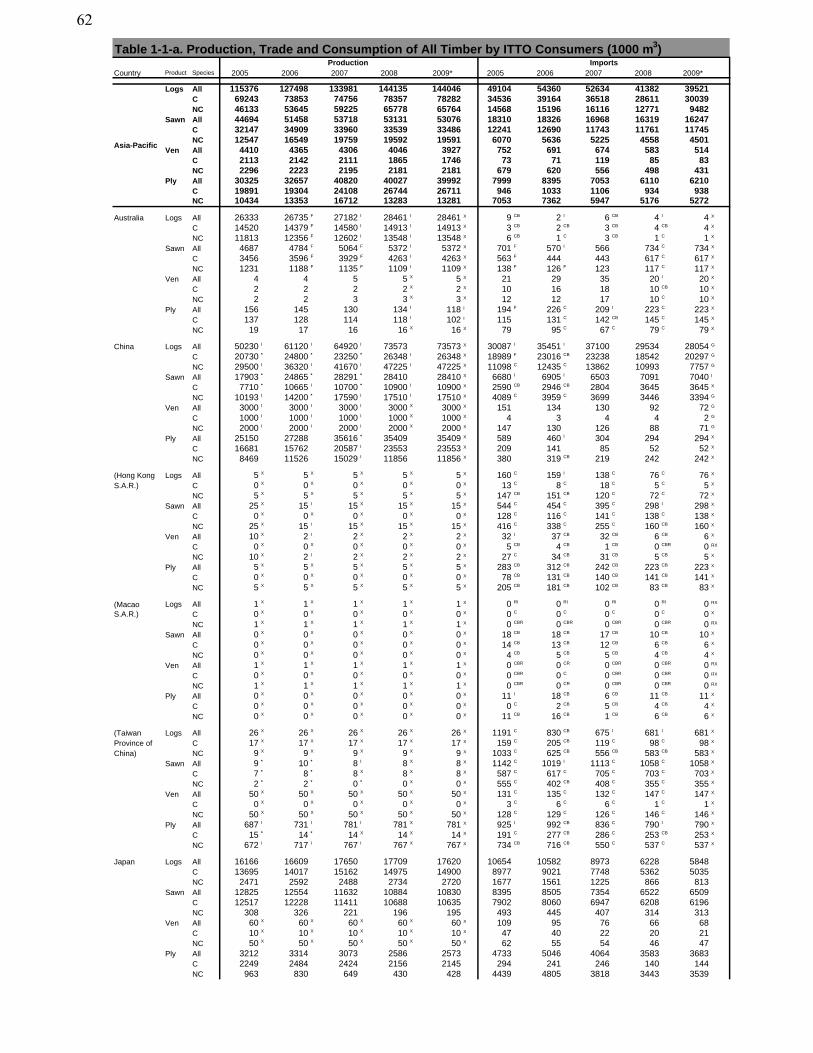
Table 1-1-a. Production, Trade and Consumption of All Timber by ITTO Consumers (1000 m3)
Country Product Species 2005 2006 2007 2008 2009* 2005 2006 2007 2008 2009*
Logs All 115376 127498 133981 144135 144046 49104 54360 52634 41382 39521C 69243 73853 74756 78357 78282 34536 39164 36518 28611 30039NC 46133 53645 59225 65778 65764 14568 15196 16116 12771 9482
Sawn All 44694 51458 53718 53131 53076 18310 18326 16968 16319 16247C 32147 34909 33960 33539 33486 12241 12690 11743 11761 11745NC 12547 16549 19759 19592 19591 6070 5636 5225 4558 4501
Ven All 4410 4365 4306 4046 3927 752 691 674 583 514C 2113 2142 2111 1865 1746 73 71 119 85 83NC 2296 2223 2195 2181 2181 679 620 556 498 431
Ply All 30325 32657 40820 40027 39992 7999 8395 7053 6110 6210C 19891 19304 24108 26744 26711 946 1033 1106 934 938NC 10434 13353 16712 13283 13281 7053 7362 5947 5176 5272
Australia Logs All 26333 26735 F 27182 I 28461 I 28461 X 9 CB 2 I 6 CB 4 I 4 X
C 14520 14379 F 14580 I 14913 I 14913 X 3 CB 2 CB 3 CB 4 CB 4 X
NC 11813 12356 F 12602 I 13548 I 13548 X 6 CB 1 C 3 CB 1 C 1 X
Sawn All 4687 4784 F 5064 F 5372 I 5372 X 701 F 570 I 566 734 C 734 X
C 3456 3596 F 3929 F 4263 I 4263 X 563 F 444 443 617 C 617 X
NC 1231 1188 F 1135 F 1109 I 1109 X 138 F 126 F 123 117 C 117 X
Ven All 4 4 5 5 X 5 X 21 29 35 20 I 20 X
C 2 2 2 2 X 2 X 10 16 18 10 CB 10 X
NC 2 2 3 3 X 3 X 12 12 17 10 C 10 X
Ply All 156 145 130 134 I 118 I 194 F 226 C 209 I 223 C 223 X
C 137 128 114 118 I 102 I 115 131 C 142 CB 145 C 145 X
NC 19 17 16 16 X 16 X 79 95 C 67 C 79 C 79 X
China Logs All 50230 I 61120 I 64920 I 73573 73573 X 30087 I 35451 I 37100 29534 28054 G
C 20730 * 24800 * 23250 * 26348 I 26348 X 18989 F 23016 CB 23238 18542 20297 G
NC 29500 I 36320 I 41670 I 47225 I 47225 X 11098 C 12435 C 13862 10993 7757 G
Sawn All 17903 * 24865 * 28291 * 28410 28410 X 6680 I 6905 I 6503 7091 7040 I
C 7710 * 10665 I 10700 * 10900 I 10900 X 2590 CB 2946 CB 2804 3645 3645 X
NC 10193 I 14200 * 17590 I 17510 I 17510 X 4089 C 3959 C 3699 3446 3394 G
Ven All 3000 I 3000 I 3000 I 3000 X 3000 X 151 134 130 92 72 G
C 1000 I 1000 I 1000 I 1000 X 1000 X 4 3 4 4 2 G
NC 2000 I 2000 I 2000 I 2000 X 2000 X 147 130 126 88 71 G
Ply All 25150 27288 35616 * 35409 35409 X 589 460 I 304 294 294 X
C 16681 15762 20587 I 23553 23553 X 209 141 85 52 52 X
NC 8469 11526 15029 I 11856 11856 X 380 319 CB 219 242 242 X
(Hong Kong Logs All 5 X 5 X 5 X 5 X 5 X 160 C 159 I 138 C 76 C 76 X
S.A.R.) C 0 X 0 X 0 X 0 X 0 X 13 C 8 C 18 C 5 C 5 X
NC 5 X 5 X 5 X 5 X 5 X 147 CB 151 CB 120 C 72 C 72 X
Sawn All 25 X 15 I 15 X 15 X 15 X 544 C 454 C 395 C 298 I 298 X
C 0 X 0 X 0 X 0 X 0 X 128 C 116 C 141 C 138 C 138 X
NC 25 X 15 I 15 X 15 X 15 X 416 C 338 C 255 C 160 CB 160 X
Ven All 10 X 2 I 2 X 2 X 2 X 32 I 37 CB 32 CB 6 CB 6 X
C 0 X 0 X 0 X 0 X 0 X 5 CB 4 CB 1 CB 0 CBR 0 RX
NC 10 X 2 I 2 X 2 X 2 X 27 C 34 CB 31 CB 5 CB 5 X
Ply All 5 X 5 X 5 X 5 X 5 X 283 CB 312 CB 242 CB 223 CB 223 X
C 0 X 0 X 0 X 0 X 0 X 78 CB 131 CB 140 CB 141 CB 141 X
NC 5 X 5 X 5 X 5 X 5 X 205 CB 181 CB 102 CB 83 CB 83 X
Logs All 1 X 1 X 1 X 1 X 1 X 0 RI 0 RI 0 RI 0 RI 0 RX
C 0 X 0 X 0 X 0 X 0 X 0 C 0 C 0 C 0 C 0 X
NC 1 X 1 X 1 X 1 X 1 X 0 CBR 0 CBR 0 CBR 0 CBR 0 RX
Sawn All 0 X 0 X 0 X 0 X 0 X 18 CB 18 CB 17 CB 10 CB 10 X
C 0 X 0 X 0 X 0 X 0 X 14 CB 13 CB 12 CB 6 CB 6 X
NC 0 X 0 X 0 X 0 X 0 X 4 CB 5 CB 5 CB 4 CB 4 X
Ven All 1 X 1 X 1 X 1 X 1 X 0 CBR 0 CR 0 CBR 0 CBR 0 RX
C 0 X 0 X 0 X 0 X 0 X 0 CBR 0 C 0 CBR 0 CBR 0 RX
NC 1 X 1 X 1 X 1 X 1 X 0 CBR 0 CR 0 CBR 0 CBR 0 RX
Ply All 0 X 0 X 0 X 0 X 0 X 11 I 18 CB 6 CB 11 CB 11 X
C 0 X 0 X 0 X 0 X 0 X 0 C 2 CB 5 CB 4 CB 4 X
NC 0 X 0 X 0 X 0 X 0 X 11 CB 16 CB 1 CB 6 CB 6 X
(Taiwan Logs All 26 X 26 X 26 X 26 X 26 X 1191 C 830 CB 675 I 681 I 681 X
Province of C 17 X 17 X 17 X 17 X 17 X 159 C 205 CB 119 C 98 C 98 X
China) NC 9 X 9 X 9 X 9 X 9 X 1033 C 625 CB 556 CB 583 CB 583 X
Sawn All 9 * 10 * 8 I 8 X 8 X 1142 C 1019 I 1113 C 1058 C 1058 X
C 7 * 8 * 8 X 8 X 8 X 587 C 617 C 705 C 703 C 703 X
NC 2 * 2 * 0 * 0 X 0 X 555 C 402 CB 408 C 355 C 355 X
Ven All 50 X 50 X 50 X 50 X 50 X 131 C 135 C 132 C 147 C 147 X
C 0 X 0 X 0 X 0 X 0 X 3 C 6 C 6 C 1 C 1 X
NC 50 X 50 X 50 X 50 X 50 X 128 C 129 C 126 C 146 C 146 X
Ply All 687 I 731 I 781 I 781 X 781 X 925 I 992 CB 836 C 790 I 790 X
C 15 * 14 * 14 X 14 X 14 X 191 C 277 CB 286 C 253 CB 253 X
NC 672 I 717 I 767 I 767 X 767 X 734 CB 716 CB 550 C 537 C 537 X
Japan Logs All 16166 16609 17650 17709 17620 10654 10582 8973 6228 5848
C 13695 14017 15162 14975 14900 8977 9021 7748 5362 5035
NC 2471 2592 2488 2734 2720 1677 1561 1225 866 813
Sawn All 12825 12554 11632 10884 10830 8395 8505 7354 6522 6509
C 12517 12228 11411 10688 10635 7902 8060 6947 6208 6196
NC 308 326 221 196 195 493 445 407 314 313
Ven All 60 X 60 X 60 X 60 X 60 X 109 95 76 66 68
C 10 X 10 X 10 X 10 X 10 X 47 40 22 20 21
NC 50 X 50 X 50 X 50 X 50 X 62 55 54 46 47
Ply All 3212 3314 3073 2586 2573 4733 5046 4064 3583 3683
C 2249 2484 2424 2156 2145 294 241 246 140 144
NC 963 830 649 430 428 4439 4805 3818 3443 3539
Asia-Pacific
(Macao S.A.R.)
Production Imports
62
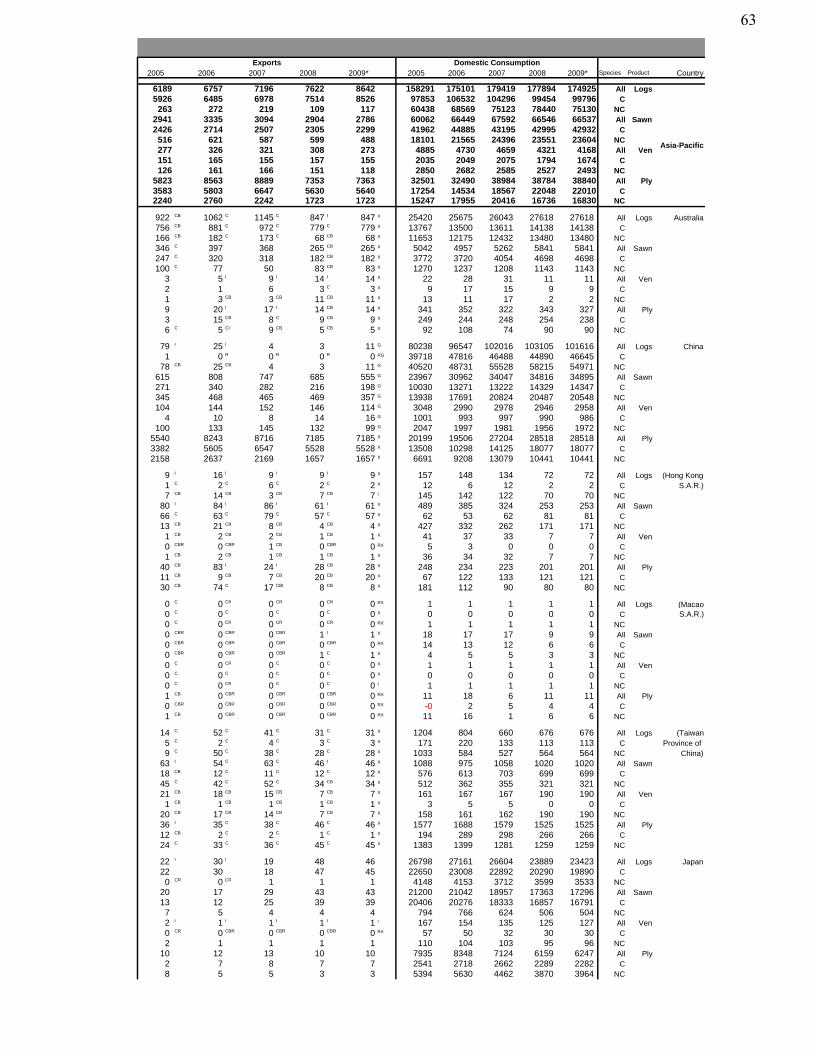
2005 2006 2007 2008 2009* 2005 2006 2007 2008 2009* Species Product Country
6189 6757 7196 7622 8642 158291 175101 179419 177894 174925 All Logs5926 6485 6978 7514 8526 97853 106532 104296 99454 99796 C263 272 219 109 117 60438 68569 75123 78440 75130 NC
2941 3335 3094 2904 2786 60062 66449 67592 66546 66537 All Sawn2426 2714 2507 2305 2299 41962 44885 43195 42995 42932 C516 621 587 599 488 18101 21565 24396 23551 23604 NC277 326 321 308 273 4885 4730 4659 4321 4168 All Ven151 165 155 157 155 2035 2049 2075 1794 1674 C126 161 166 151 118 2850 2682 2585 2527 2493 NC
5823 8563 8889 7353 7363 32501 32490 38984 38784 38840 All Ply3583 5803 6647 5630 5640 17254 14534 18567 22048 22010 C2240 2760 2242 1723 1723 15247 17955 20416 16736 16830 NC
922 CB 1062 C 1145 C 847 I 847 X 25420 25675 26043 27618 27618 All Logs Australia756 CB 881 C 972 C 779 C 779 X 13767 13500 13611 14138 14138 C166 CB 182 C 173 C 68 CB 68 X 11653 12175 12432 13480 13480 NC346 C 397 368 265 CB 265 X 5042 4957 5262 5841 5841 All Sawn247 C 320 318 182 CB 182 X 3772 3720 4054 4698 4698 C100 C 77 50 83 CB 83 X 1270 1237 1208 1143 1143 NC
3 5 I 9 I 14 I 14 X 22 28 31 11 11 All Ven2 1 6 3 C 3 X 9 17 15 9 9 C1 3 CB 3 CB 11 CB 11 X 13 11 17 2 2 NC9 20 I 17 I 14 CB 14 X 341 352 322 343 327 All Ply3 15 CB 8 C 9 CB 9 X 249 244 248 254 238 C6 C 5 CI 9 CB 5 CB 5 X 92 108 74 90 90 NC
79 I 25 I 4 3 11 G 80238 96547 102016 103105 101616 All Logs China1 0 R 0 R 0 R 0 RG 39718 47816 46488 44890 46645 C
78 CB 25 CB 4 3 11 G 40520 48731 55528 58215 54971 NC615 808 747 685 555 G 23967 30962 34047 34816 34895 All Sawn271 340 282 216 198 G 10030 13271 13222 14329 14347 C345 468 465 469 357 G 13938 17691 20824 20487 20548 NC104 144 152 146 114 G 3048 2990 2978 2946 2958 All Ven
4 10 8 14 16 G 1001 993 997 990 986 C100 133 145 132 99 G 2047 1997 1981 1956 1972 NC
5540 8243 8716 7185 7185 X 20199 19506 27204 28518 28518 All Ply3382 5605 6547 5528 5528 X 13508 10298 14125 18077 18077 C2158 2637 2169 1657 1657 X 6691 9208 13079 10441 10441 NC
9 I 16 I 9 I 9 I 9 X 157 148 134 72 72 All Logs (Hong Kong1 C 2 C 6 C 2 C 2 X 12 6 12 2 2 C S.A.R.)7 CB 14 CB 3 CB 7 CB 7 I 145 142 122 70 70 NC
80 I 84 I 86 I 61 I 61 X 489 385 324 253 253 All Sawn66 C 63 C 79 C 57 C 57 X 62 53 62 81 81 C13 CB 21 CB 8 CB 4 CB 4 X 427 332 262 171 171 NC1 CB 2 CB 2 CB 1 CB 1 X 41 37 33 7 7 All Ven0 CBR 0 CBR 1 CB 0 CBR 0 RX 5 3 0 0 0 C1 CB 2 CB 1 CB 1 CB 1 X 36 34 32 7 7 NC
40 CB 83 I 24 I 28 CB 28 X 248 234 223 201 201 All Ply11 CB 9 CB 7 CB 20 CB 20 X 67 122 133 121 121 C30 CB 74 C 17 CBI 8 CB 8 X 181 112 90 80 80 NC
0 C 0 CR 0 CR 0 CR 0 RX 1 1 1 1 1 All Logs0 C 0 C 0 C 0 C 0 X 0 0 0 0 0 C0 C 0 CR 0 CR 0 CR 0 RX 1 1 1 1 1 NC0 CBR 0 CBR 0 CBR 1 I 1 X 18 17 17 9 9 All Sawn0 CBR 0 CBR 0 CBR 0 CBR 0 RX 14 13 12 6 6 C0 CBR 0 CBR 0 CBR 1 C 1 X 4 5 5 3 3 NC0 C 0 CR 0 C 0 C 0 X 1 1 1 1 1 All Ven0 C 0 C 0 C 0 C 0 X 0 0 0 0 0 C0 C 0 CR 0 C 0 C 0 I 1 1 1 1 1 NC1 CB 0 CBR 0 CBR 0 CBR 0 RX 11 18 6 11 11 All Ply0 CBR 0 CBR 0 CBR 0 CBR 0 RX -0 2 5 4 4 C1 CB 0 CBR 0 CBR 0 CBR 0 RX 11 16 1 6 6 NC
14 C 52 C 41 C 31 C 31 X 1204 804 660 676 676 All Logs (Taiwan5 C 2 C 4 C 3 C 3 X 171 220 133 113 113 C Province of 9 C 50 C 38 C 28 C 28 X 1033 584 527 564 564 NC China)
63 I 54 C 63 C 46 I 46 X 1088 975 1058 1020 1020 All Sawn18 CB 12 C 11 C 12 C 12 X 576 613 703 699 699 C45 C 42 C 52 C 34 CB 34 X 512 362 355 321 321 NC21 CB 18 CB 15 CB 7 CB 7 X 161 167 167 190 190 All Ven1 CB 1 CB 1 CB 1 CB 1 X 3 5 5 0 0 C
20 CB 17 CB 14 CB 7 CB 7 X 158 161 162 190 190 NC36 I 35 C 38 C 46 C 46 X 1577 1688 1579 1525 1525 All Ply12 CB 2 C 2 C 1 C 1 X 194 289 298 266 266 C24 C 33 C 36 C 45 C 45 X 1383 1399 1281 1259 1259 NC
22 I 30 I 19 48 46 26798 27161 26604 23889 23423 All Logs Japan22 30 18 47 45 22650 23008 22892 20290 19890 C0 CR 0 CR 1 1 1 4148 4153 3712 3599 3533 NC
20 17 29 43 43 21200 21042 18957 17363 17296 All Sawn13 12 25 39 39 20406 20276 18333 16857 16791 C7 5 4 4 4 794 766 624 506 504 NC2 I 1 I 1 I 1 I 1 I 167 154 135 125 127 All Ven0 CR 0 CBR 0 CBR 0 CBR 0 RX 57 50 32 30 30 C2 1 1 1 1 110 104 103 95 96 NC
10 12 13 10 10 7935 8348 7124 6159 6247 All Ply2 7 8 7 7 2541 2718 2662 2289 2282 C8 5 5 3 3 5394 5630 4462 3870 3964 NC
Asia-Pacific
(Macao S.A.R.)
Exports Domestic Consumption
63
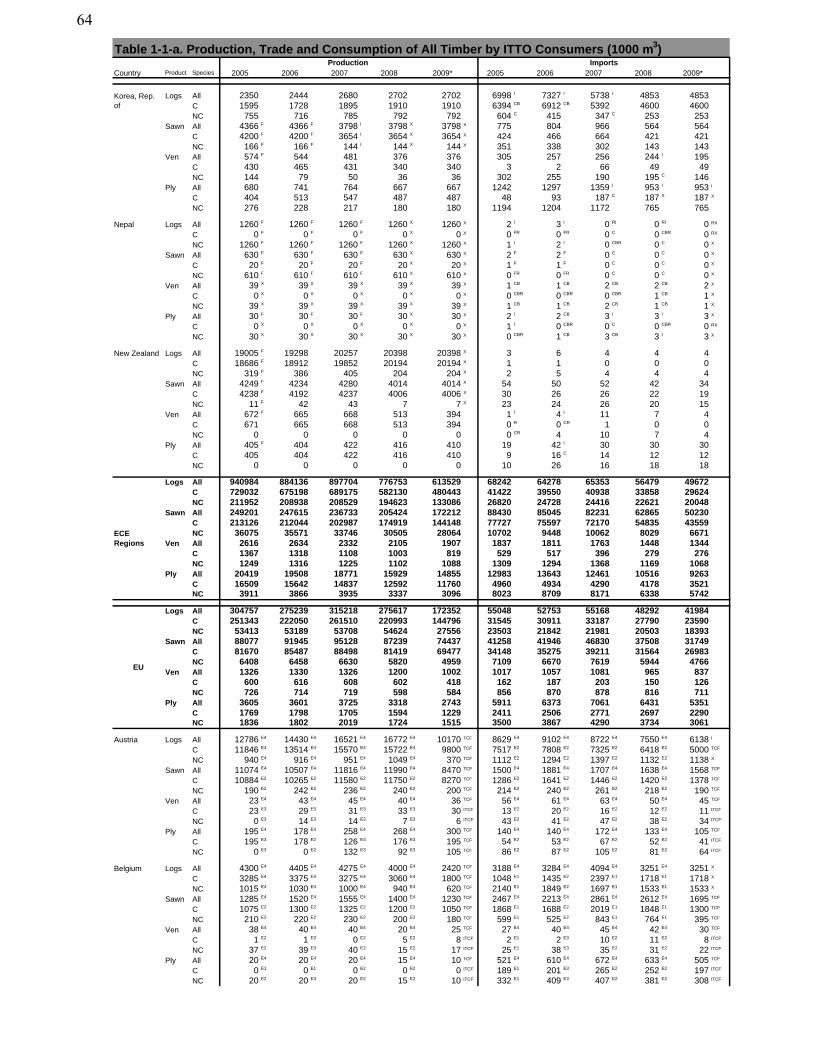
Table 1-1-a. Production, Trade and Consumption of All Timber by ITTO Consumers (1000 m3)
Country Product Species 2005 2006 2007 2008 2009* 2005 2006 2007 2008 2009*Production Imports
Logs All 2350 2444 2680 2702 2702 6998 I 7327 I 5738 I 4853 4853
C 1595 1728 1895 1910 1910 6394 CB 6912 CB 5392 4600 4600
NC 755 716 785 792 792 604 C 415 347 C 253 253
Sawn All 4366 F 4366 F 3798 I 3798 X 3798 X 775 804 966 564 564
C 4200 F 4200 F 3654 I 3654 X 3654 X 424 466 664 421 421
NC 166 F 166 F 144 I 144 X 144 X 351 338 302 143 143
Ven All 574 F 544 481 376 376 305 257 256 244 I 195
C 430 465 431 340 340 3 2 66 49 49
NC 144 79 50 36 36 302 255 190 195 C 146
Ply All 680 741 764 667 667 1242 1297 1359 I 953 I 953 I
C 404 513 547 487 487 48 93 187 C 187 X 187 X
NC 276 228 217 180 180 1194 1204 1172 765 765
Nepal Logs All 1260 F 1260 F 1260 F 1260 X 1260 X 2 I 3 I 0 RI 0 RI 0 RX
C 0 F 0 F 0 F 0 X 0 X 0 FR 0 FR 0 C 0 CBR 0 RX
NC 1260 F 1260 F 1260 F 1260 X 1260 X 1 I 2 I 0 CBR 0 C 0 X
Sawn All 630 F 630 F 630 F 630 X 630 X 2 F 2 F 0 C 0 C 0 X
C 20 F 20 F 20 F 20 X 20 X 1 F 1 F 0 C 0 C 0 X
NC 610 F 610 F 610 F 610 X 610 X 0 FR 0 FR 0 C 0 C 0 X
Ven All 39 X 39 X 39 X 39 X 39 X 1 CB 1 CB 2 CB 2 CB 2 X
C 0 X 0 X 0 X 0 X 0 X 0 CBR 0 CBR 0 CBR 1 CB 1 X
NC 39 X 39 X 39 X 39 X 39 X 1 CB 1 CB 2 CB 1 CB 1 X
Ply All 30 F 30 F 30 F 30 X 30 X 2 I 2 CB 3 I 3 I 3 X
C 0 X 0 X 0 X 0 X 0 X 1 I 0 CBR 0 C 0 CBR 0 RX
NC 30 X 30 X 30 X 30 X 30 X 0 CBR 1 CB 3 CB 3 I 3 X
New Zealand Logs All 19005 F 19298 20257 20398 20398 X 3 6 4 4 4
C 18686 F 18912 19852 20194 20194 X 1 1 0 0 0
NC 319 F 386 405 204 204 X 2 5 4 4 4
Sawn All 4249 F 4234 4280 4014 4014 X 54 50 52 42 34
C 4238 F 4192 4237 4006 4006 X 30 26 26 22 19
NC 11 F 42 43 7 7 X 23 24 26 20 15
Ven All 672 F 665 668 513 394 1 I 4 I 11 7 4
C 671 665 668 513 394 0 R 0 CR 1 0 0
NC 0 0 0 0 0 0 CR 4 10 7 4
Ply All 405 F 404 422 416 410 19 42 I 30 30 30
C 405 404 422 416 410 9 16 C 14 12 12
NC 0 0 0 0 0 10 26 16 18 18
Logs All 940984 884136 897704 776753 613529 68242 64278 65353 56479 49672C 729032 675198 689175 582130 480443 41422 39550 40938 33858 29624NC 211952 208938 208529 194623 133086 26820 24728 24416 22621 20048
Sawn All 249201 247615 236733 205424 172212 88430 85045 82231 62865 50230C 213126 212044 202987 174919 144148 77727 75597 72170 54835 43559NC 36075 35571 33746 30505 28064 10702 9448 10062 8029 6671
Ven All 2616 2634 2332 2105 1907 1837 1811 1763 1448 1344C 1367 1318 1108 1003 819 529 517 396 279 276NC 1249 1316 1225 1102 1088 1309 1294 1368 1169 1068
Ply All 20419 19508 18771 15929 14855 12983 13643 12461 10516 9263C 16509 15642 14837 12592 11760 4960 4934 4290 4178 3521NC 3911 3866 3935 3337 3096 8023 8709 8171 6338 5742
Logs All 304757 275239 315218 275617 172352 55048 52753 55168 48292 41984C 251343 222050 261510 220993 144796 31545 30911 33187 27790 23590NC 53413 53189 53708 54624 27556 23503 21842 21981 20503 18393
Sawn All 88077 91945 95128 87239 74437 41258 41946 46830 37508 31749C 81670 85487 88498 81419 69477 34148 35275 39211 31564 26983NC 6408 6458 6630 5820 4959 7109 6670 7619 5944 4766
Ven All 1326 1330 1326 1200 1002 1017 1057 1081 965 837C 600 616 608 602 418 162 187 203 150 126NC 726 714 719 598 584 856 870 878 816 711
Ply All 3605 3601 3725 3318 2743 5911 6373 7061 6431 5351C 1769 1798 1705 1594 1229 2411 2506 2771 2697 2290NC 1836 1802 2019 1724 1515 3500 3867 4290 3734 3061
Austria Logs All 12786 E4 14430 E4 16521 E4 16772 E4 10170 TCF 8629 E4 9102 E4 8722 E4 7550 E4 6138 I
C 11846 E4 13514 E4 15570 E4 15722 E4 9800 TCF 7517 E2 7808 E2 7325 E2 6418 E2 5000 TCF
NC 940 E4 916 E4 951 E4 1049 E4 370 TCF 1112 E2 1294 E2 1397 E2 1132 E2 1138 X
Sawn All 11074 E4 10507 E4 11816 E4 11990 E4 8470 TCF 1500 E4 1881 E4 1707 E4 1638 E4 1568 TCF
C 10884 E2 10265 E2 11580 E2 11750 E2 8270 TCF 1286 E2 1641 E2 1446 E2 1420 E2 1378 TCF
NC 190 E2 242 E2 236 E2 240 E2 200 TCF 214 E2 240 E2 261 E2 218 E2 190 TCF
Ven All 23 E4 43 E4 45 E4 40 E4 36 TCF 56 E4 61 E4 63 E4 50 E4 45 TCF
C 23 E3 29 E3 31 E3 33 E3 30 ITCF 13 E2 20 E2 16 E2 12 E2 11 ITCF
NC 0 E3 14 E3 14 E3 7 E3 6 ITCF 43 E2 41 E2 47 E2 38 E2 34 ITCF
Ply All 195 E4 178 E4 258 E4 268 E4 300 TCF 140 E4 140 E4 172 E4 133 E4 105 TCF
C 195 E3 178 E2 126 E3 176 E3 195 TCF 54 E2 53 E2 67 E2 52 E2 41 ITCF
NC 0 E3 0 E2 132 E3 92 E3 105 TCF 86 E2 87 E2 105 E2 81 E2 64 ITCF
Belgium Logs All 4300 E4 4405 E4 4275 E4 4000 E4 2420 TCF 3188 E4 3284 E4 4094 E4 3251 E4 3251 X
C 3285 E4 3375 E4 3275 E4 3060 E4 1800 TCF 1048 E1 1435 E2 2397 E1 1718 E1 1718 X
NC 1015 E4 1030 E4 1000 E4 940 E4 620 TCF 2140 E1 1849 E2 1697 E1 1533 E1 1533 X
Sawn All 1285 E4 1520 E4 1555 E4 1400 E4 1230 TCF 2467 E4 2213 E4 2861 E4 2612 E4 1695 TCF
C 1075 E2 1300 E2 1325 E2 1200 E2 1050 TCF 1868 E1 1688 E2 2019 E1 1848 E1 1300 TCF
NC 210 E2 220 E2 230 E2 200 E2 180 TCF 599 E1 525 E2 843 E1 764 E1 395 TCF
Ven All 38 E4 40 E4 40 E4 20 E4 25 TCF 27 E4 40 E4 45 E4 42 E4 30 TCF
C 1 E2 1 E3 0 E2 5 E2 8 ITCF 2 E1 2 E3 10 E2 11 E2 8 ITCF
NC 37 E2 39 E3 40 E2 15 E2 17 ITCF 25 E1 38 E3 35 E2 31 E2 22 ITCF
Ply All 20 E4 20 E4 20 E4 15 E4 10 TCF 521 E4 610 E4 672 E4 633 E4 505 TCF
C 0 E1 0 E1 0 E2 0 E2 0 ITCF 189 E1 201 E3 265 E2 252 E2 197 ITCF
NC 20 E2 20 E3 20 E2 15 E2 10 ITCF 332 E1 409 E3 407 E2 381 E2 308 ITCF
ECERegions
EU
Korea, Rep. of
64
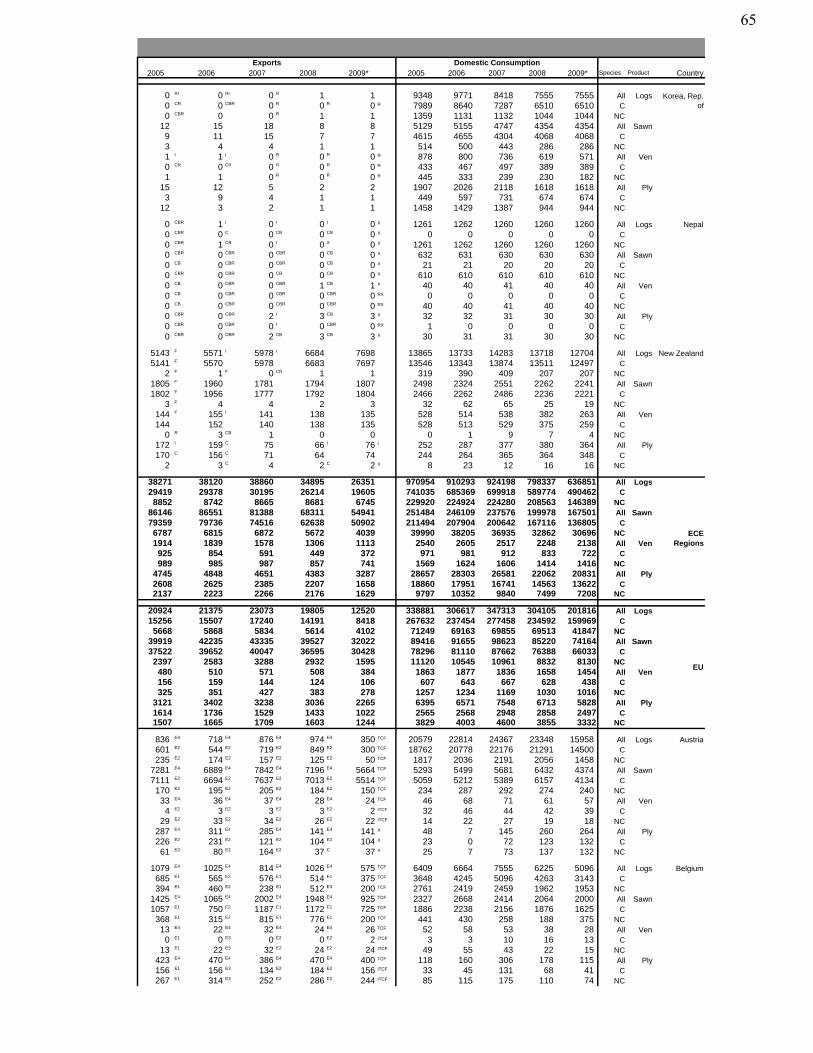
2005 2006 2007 2008 2009* 2005 2006 2007 2008 2009* Species Product CountryExports Domestic Consumption
0 RI 0 RI 0 R 1 1 9348 9771 8418 7555 7555 All Logs0 CR 0 CBR 0 R 0 R 0 R 7989 8640 7287 6510 6510 C0 CBR 0 0 R 1 1 1359 1131 1132 1044 1044 NC
12 15 18 8 8 5129 5155 4747 4354 4354 All Sawn9 11 15 7 7 4615 4655 4304 4068 4068 C3 4 4 1 1 514 500 443 286 286 NC1 I 1 I 0 R 0 R 0 R 878 800 736 619 571 All Ven0 CR 0 CR 0 R 0 R 0 R 433 467 497 389 389 C1 1 0 R 0 R 0 R 445 333 239 230 182 NC
15 12 5 2 2 1907 2026 2118 1618 1618 All Ply3 9 4 1 1 449 597 731 674 674 C
12 3 2 1 1 1458 1429 1387 944 944 NC
0 CBR 1 I 0 I 0 I 0 X 1261 1262 1260 1260 1260 All Logs Nepal0 CBR 0 C 0 CB 0 CB 0 X 0 0 0 0 0 C0 CBR 1 CB 0 I 0 X 0 X 1261 1262 1260 1260 1260 NC0 CBR 0 CBR 0 CBR 0 CB 0 X 632 631 630 630 630 All Sawn0 CB 0 CBR 0 CBR 0 CB 0 X 21 21 20 20 20 C0 CBR 0 CBR 0 CB 0 CB 0 X 610 610 610 610 610 NC0 CB 0 CBR 0 CBR 1 CB 1 X 40 40 41 40 40 All Ven0 CB 0 CBR 0 CBR 0 CBR 0 RX 0 0 0 0 0 C0 CB 0 CBR 0 CBR 0 CBR 0 RX 40 40 41 40 40 NC0 CBR 0 CBR 2 I 3 CB 3 X 32 32 31 30 30 All Ply0 CBR 0 CBR 0 I 0 CBR 0 RX 1 0 0 0 0 C0 CBR 0 CBR 2 CB 3 CB 3 X 30 31 31 30 30 NC
5143 F 5571 I 5978 I 6684 7698 13865 13733 14283 13718 12704 All Logs New Zealand5141 F 5570 5978 6683 7697 13546 13343 13874 13511 12497 C
2 F 1 F 0 CR 1 1 319 390 409 207 207 NC1805 F 1960 1781 1794 1807 2498 2324 2551 2262 2241 All Sawn1802 F 1956 1777 1792 1804 2466 2262 2486 2236 2221 C
3 F 4 4 2 3 32 62 65 25 19 NC144 F 155 I 141 138 135 528 514 538 382 263 All Ven144 152 140 138 135 528 513 529 375 259 C
0 R 3 CB 1 0 0 0 1 9 7 4 NC172 I 159 C 75 66 I 76 I 252 287 377 380 364 All Ply170 C 156 C 71 64 74 244 264 365 364 348 C
2 3 C 4 2 C 2 X 8 23 12 16 16 NC
38271 38120 38860 34895 26351 970954 910293 924198 798337 636851 All Logs29419 29378 30195 26214 19605 741035 685369 699918 589774 490462 C8852 8742 8665 8681 6745 229920 224924 224280 208563 146389 NC
86146 86551 81388 68311 54941 251484 246109 237576 199978 167501 All Sawn79359 79736 74516 62638 50902 211494 207904 200642 167116 136805 C6787 6815 6872 5672 4039 39990 38205 36935 32862 30696 NC1914 1839 1578 1306 1113 2540 2605 2517 2248 2138 All Ven925 854 591 449 372 971 981 912 833 722 C989 985 987 857 741 1569 1624 1606 1414 1416 NC
4745 4848 4651 4383 3287 28657 28303 26581 22062 20831 All Ply2608 2625 2385 2207 1658 18860 17951 16741 14563 13622 C2137 2223 2266 2176 1629 9797 10352 9840 7499 7208 NC
20924 21375 23073 19805 12520 338881 306617 347313 304105 201816 All Logs15256 15507 17240 14191 8418 267632 237454 277458 234592 159969 C5668 5868 5834 5614 4102 71249 69163 69855 69513 41847 NC
39919 42235 43335 39527 32022 89416 91655 98623 85220 74164 All Sawn37522 39652 40047 36595 30428 78296 81110 87662 76388 66033 C2397 2583 3288 2932 1595 11120 10545 10961 8832 8130 NC480 510 571 508 384 1863 1877 1836 1658 1454 All Ven156 159 144 124 106 607 643 667 628 438 C325 351 427 383 278 1257 1234 1169 1030 1016 NC
3121 3402 3238 3036 2265 6395 6571 7548 6713 5828 All Ply1614 1736 1529 1433 1022 2565 2568 2948 2858 2497 C1507 1665 1709 1603 1244 3829 4003 4600 3855 3332 NC
836 E4 718 E4 876 E4 974 E4 350 TCF 20579 22814 24367 23348 15958 All Logs Austria601 E2 544 E2 719 E2 849 E2 300 TCF 18762 20778 22176 21291 14500 C235 E2 174 E2 157 E2 125 E2 50 TCF 1817 2036 2191 2056 1458 NC
7281 E4 6889 E4 7842 E4 7196 E4 5664 TCF 5293 5499 5681 6432 4374 All Sawn7111 E2 6694 E2 7637 E2 7013 E2 5514 TCF 5059 5212 5389 6157 4134 C170 E2 195 E2 205 E2 184 E2 150 TCF 234 287 292 274 240 NC33 E4 36 E4 37 E4 28 E4 24 TCF 46 68 71 61 57 All Ven4 E2 3 E2 3 E2 3 E2 2 ITCF 32 46 44 42 39 C
29 E2 33 E2 34 E2 26 E2 22 ITCF 14 22 27 19 18 NC287 E4 311 E4 285 E4 141 E4 141 X 48 7 145 260 264 All Ply226 E2 231 E2 121 E2 104 E2 104 X 23 0 72 123 132 C61 E2 80 E2 164 E2 37 C 37 X 25 7 73 137 132 NC
1079 E4 1025 E4 814 E4 1026 E4 575 TCF 6409 6664 7555 6225 5096 All Logs Belgium685 E1 565 E2 576 E1 514 E1 375 TCF 3648 4245 5096 4263 3143 C394 E1 460 E2 238 E1 512 E3 200 TCF 2761 2419 2459 1962 1953 NC
1425 E4 1065 E4 2002 E4 1948 E4 925 TCF 2327 2668 2414 2064 2000 All Sawn1057 E1 750 E2 1187 E1 1172 E1 725 TCF 1886 2238 2156 1876 1625 C368 E1 315 E2 815 E1 776 E1 200 TCF 441 430 258 188 375 NC13 E4 22 E4 32 E4 24 E4 26 TCF 52 58 53 38 28 All Ven0 E1 0 E3 0 E2 0 E2 2 ITCF 3 3 10 16 13 C
13 E1 22 E3 32 E2 24 E2 24 ITCF 49 55 43 22 15 NC423 E4 470 E4 386 E4 470 E4 400 TCF 118 160 306 178 115 All Ply156 E1 156 E3 134 E2 184 E2 156 ITCF 33 45 131 68 41 C267 E1 314 E3 252 E2 286 E2 244 ITCF 85 115 175 110 74 NC
Korea, Rep. of
ECERegions
EU
65
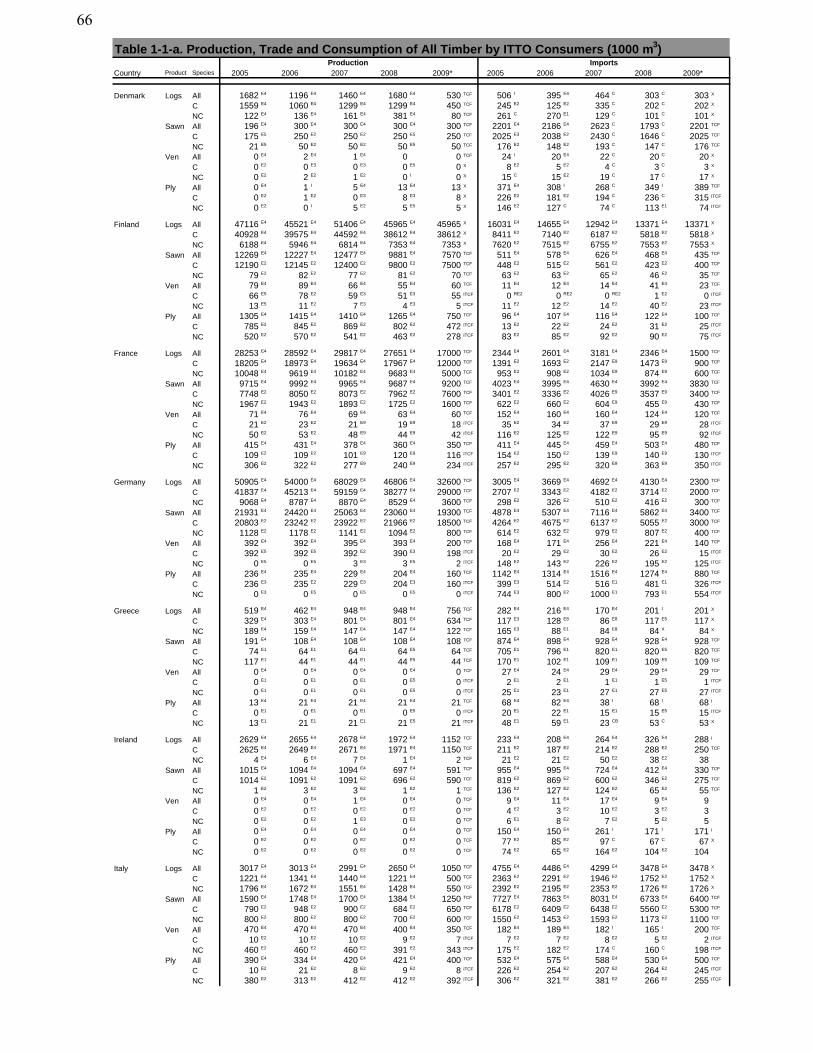
Table 1-1-a. Production, Trade and Consumption of All Timber by ITTO Consumers (1000 m3)
Country Product Species 2005 2006 2007 2008 2009* 2005 2006 2007 2008 2009*Production Imports
Denmark Logs All 1682 E4 1196 E4 1460 E4 1680 E4 530 TCF 506 I 395 E4 464 C 303 C 303 X
C 1559 E4 1060 E4 1299 E4 1299 E4 450 TCF 245 E2 125 E2 335 C 202 C 202 X
NC 122 E4 136 E4 161 E4 381 E4 80 TCF 261 C 270 E1 129 C 101 C 101 X
Sawn All 196 E4 300 E4 300 E4 300 E4 300 TCF 2201 E4 2186 E4 2623 C 1793 C 2201 TCF
C 175 E5 250 E2 250 E2 250 E5 250 TCF 2025 E3 2038 E2 2430 C 1646 C 2025 TCF
NC 21 E5 50 E2 50 E2 50 E5 50 TCF 176 E2 148 E2 193 C 147 C 176 TCF
Ven All 0 E4 2 E4 1 E4 0 0 TCF 24 I 20 E4 22 C 20 C 20 X
C 0 E2 0 E3 0 E3 0 E5 0 X 8 E2 5 E2 4 C 3 C 3 X
NC 0 E2 2 E2 1 E2 0 I 0 X 15 C 15 E2 19 C 17 C 17 X
Ply All 0 E4 1 I 5 E4 13 E4 13 X 371 E4 308 I 268 C 349 I 389 TCF
C 0 E2 1 E2 0 E3 8 E3 8 X 226 E2 181 E2 194 C 236 C 315 ITCF
NC 0 E2 0 I 5 E2 5 E5 5 X 146 E2 127 C 74 C 113 E1 74 ITCF
Finland Logs All 47116 E4 45521 E4 51406 E4 45965 E4 45965 X 16031 E4 14655 E4 12942 E4 13371 E4 13371 X
C 40928 E4 39575 E4 44592 E4 38612 E4 38612 X 8411 E2 7140 E2 6187 E2 5818 E2 5818 X
NC 6188 E4 5946 E4 6814 E4 7353 E4 7353 X 7620 E2 7515 E2 6755 E2 7553 E2 7553 X
Sawn All 12269 E4 12227 E4 12477 E4 9881 E4 7570 TCF 511 E4 578 E4 626 E4 468 E4 435 TCF
C 12190 E2 12145 E2 12400 E2 9800 E2 7500 TCF 448 E2 515 E2 561 E2 423 E2 400 TCF
NC 79 E2 82 E2 77 E2 81 E2 70 TCF 63 E2 63 E2 65 E2 46 E2 35 TCF
Ven All 79 E4 89 E4 66 E4 55 E4 60 TCF 11 E4 12 E4 14 E4 41 E4 23 TCF
C 66 E5 78 E2 59 E3 51 E3 55 ITCF 0 RE2 0 RE2 0 RE2 1 E2 0 ITCF
NC 13 E5 11 E2 7 E3 4 E3 5 ITCF 11 E2 12 E2 14 E2 40 E2 23 ITCF
Ply All 1305 E4 1415 E4 1410 E4 1265 E4 750 TCF 96 E4 107 E4 116 E4 122 E4 100 TCF
C 785 E2 845 E2 869 E2 802 E2 472 ITCF 13 E2 22 E2 24 E2 31 E2 25 ITCF
NC 520 E2 570 E2 541 E2 463 E2 278 ITCF 83 E2 85 E2 92 E2 90 E2 75 ITCF
France Logs All 28253 E4 28592 E4 29817 E4 27651 E4 17000 TCF 2344 E4 2601 E4 3181 E4 2346 E4 1500 TCF
C 18205 E4 18973 E4 19634 E4 17967 E4 12000 TCF 1391 E2 1693 E2 2147 E9 1473 E9 900 TCF
NC 10048 E4 9619 E4 10182 E4 9683 E4 5000 TCF 953 E2 908 E2 1034 E9 874 E9 600 TCF
Sawn All 9715 E4 9992 E4 9965 E4 9687 E4 9200 TCF 4023 E4 3995 E4 4630 E4 3992 E4 3830 TCF
C 7748 E2 8050 E2 8073 E2 7962 E2 7600 TCF 3401 E2 3336 E2 4026 E9 3537 E9 3400 TCF
NC 1967 E2 1943 E2 1893 E2 1725 E2 1600 TCF 622 E2 660 E2 604 E9 455 E9 430 TCF
Ven All 71 E4 76 E4 69 E4 63 E4 60 TCF 152 E4 160 E4 160 E4 124 E4 120 TCF
C 21 E2 23 E2 21 E9 19 E9 18 ITCF 35 E2 34 E2 37 E9 29 E9 28 ITCF
NC 50 E2 53 E2 48 E9 44 E9 42 ITCF 116 E2 125 E2 122 E9 95 E9 92 ITCF
Ply All 415 E4 431 E4 378 E4 360 E4 350 TCF 411 E4 445 E4 459 E4 503 E4 480 TCF
C 109 E2 109 E2 101 E9 120 E9 116 ITCF 154 E2 150 E2 139 E9 140 E9 130 ITCF
NC 306 E2 322 E2 277 E9 240 E9 234 ITCF 257 E2 295 E2 320 E9 363 E9 350 ITCF
Germany Logs All 50905 E4 54000 E4 68029 E4 46806 E4 32600 TCF 3005 E4 3669 E4 4692 E4 4130 E4 2300 TCF
C 41837 E4 45213 E4 59159 E4 38277 E4 29000 TCF 2707 E2 3343 E2 4182 E2 3714 E2 2000 TCF
NC 9068 E4 8787 E4 8870 E4 8529 E4 3600 TCF 298 E2 326 E2 510 E2 416 E2 300 TCF
Sawn All 21931 E4 24420 E4 25063 E4 23060 E4 19300 TCF 4878 E4 5307 E4 7116 E4 5862 E4 3400 TCF
C 20803 E2 23242 E2 23922 E2 21966 E2 18500 TCF 4264 E2 4675 E2 6137 E2 5055 E2 3000 TCF
NC 1128 E2 1178 E2 1141 E2 1094 E2 800 TCF 614 E2 632 E2 979 E2 807 E2 400 TCF
Ven All 392 E4 392 E4 395 E4 393 E4 200 TCF 168 E4 171 E4 256 E4 221 E4 140 TCF
C 392 E5 392 E5 392 E2 390 E3 198 ITCF 20 E2 29 E2 30 E2 26 E2 15 ITCF
NC 0 E5 0 E5 3 E3 3 E5 2 ITCF 148 E2 143 E2 226 E2 195 E2 125 ITCF
Ply All 236 E4 235 E4 229 E4 204 E4 160 TCF 1142 E4 1314 E4 1516 E4 1274 E4 880 TCF
C 236 E3 235 E2 229 E3 204 E3 160 ITCF 399 E3 514 E2 516 E1 481 E1 326 ITCF
NC 0 E3 0 E5 0 E5 0 E5 0 ITCF 744 E3 800 E2 1000 E1 793 E1 554 ITCF
Greece Logs All 519 E4 462 E4 948 E4 948 E4 756 TCF 282 E4 216 E4 170 E4 201 I 201 X
C 329 E4 303 E4 801 E4 801 E4 634 TCF 117 E3 128 E8 86 E8 117 E5 117 X
NC 189 E4 159 E4 147 E4 147 E4 122 TCF 165 E3 88 E1 84 E8 84 X 84 X
Sawn All 191 E4 108 E4 108 E4 108 E4 108 TCF 874 E4 898 E4 928 E4 928 E4 928 TCF
C 74 E1 64 E1 64 E1 64 E5 64 TCF 705 E1 796 E1 820 E1 820 E5 820 TCF
NC 117 E1 44 E1 44 E1 44 E5 44 TCF 170 E1 102 E1 109 E1 109 E5 109 TCF
Ven All 0 E4 0 E4 0 E4 0 E4 0 TCF 27 E4 24 E4 29 E4 29 E4 29 TCF
C 0 E1 0 E1 0 E1 0 E5 0 ITCF 2 E1 2 E1 1 E1 1 E5 1 ITCF
NC 0 E1 0 E1 0 E1 0 E5 0 ITCF 25 E1 23 E1 27 E1 27 E5 27 ITCF
Ply All 13 E4 21 E4 21 E4 21 E4 21 TCF 68 E4 82 E4 38 I 68 I 68 I
C 0 E1 0 E1 0 E1 0 E5 0 ITCF 20 E1 22 E1 15 E1 15 E5 15 ITCF
NC 13 E1 21 E1 21 E1 21 E5 21 ITCF 48 E1 59 E1 23 CB 53 C 53 X
Ireland Logs All 2629 E4 2655 E4 2678 E4 1972 E4 1152 TCF 233 E4 208 E4 264 E4 326 E4 288 I
C 2625 E4 2649 E4 2671 E4 1971 E4 1150 TCF 211 E2 187 E2 214 E2 288 E2 250 TCF
NC 4 E4 6 E4 7 E4 1 E4 2 TCF 21 E2 21 E2 50 E2 38 E2 38
Sawn All 1015 E4 1094 E4 1094 E4 697 E4 591 TCF 955 E4 995 E4 724 E4 412 E4 330 TCF
C 1014 E2 1091 E2 1091 E2 696 E2 590 TCF 819 E2 869 E2 600 E2 346 E2 275 TCF
NC 1 E2 3 E2 3 E2 1 E2 1 TCF 136 E2 127 E2 124 E2 65 E2 55 TCF
Ven All 0 E4 0 E4 1 E4 0 E4 0 TCF 9 E4 11 E4 17 E4 9 E4 9
C 0 E2 0 E2 0 E2 0 E2 0 TCF 4 E2 3 E2 10 E2 3 E2 3
NC 0 E2 0 E2 1 E3 0 E2 0 TCF 6 E1 8 E2 7 E2 5 E2 5
Ply All 0 E4 0 E4 0 E4 0 E4 0 TCF 150 E4 150 E4 261 I 171 I 171 I
C 0 E2 0 E2 0 E2 0 E2 0 TCF 77 E2 85 E2 97 C 67 C 67 X
NC 0 E2 0 E2 0 E2 0 E2 0 TCF 74 E2 65 E2 164 E2 104 E2 104
Italy Logs All 3017 E4 3013 E4 2991 E4 2650 E4 1050 TCF 4755 E4 4486 E4 4299 E4 3478 E4 3478 X
C 1221 E4 1341 E4 1440 E4 1221 E4 500 TCF 2363 E2 2291 E2 1946 E2 1752 E2 1752 X
NC 1796 E4 1672 E4 1551 E4 1428 E4 550 TCF 2392 E2 2195 E2 2353 E2 1726 E2 1726 X
Sawn All 1590 E4 1748 E4 1700 E4 1384 E4 1250 TCF 7727 E4 7863 E4 8031 E4 6733 E4 6400 TCF
C 790 E2 948 E2 900 E2 684 E2 650 TCF 6178 E2 6409 E2 6438 E2 5560 E2 5300 TCF
NC 800 E2 800 E2 800 E2 700 E2 600 TCF 1550 E2 1453 E2 1593 E2 1173 E2 1100 TCF
Ven All 470 E4 470 E4 470 E4 400 E4 350 TCF 182 E4 189 E4 182 I 165 I 200 TCF
C 10 E2 10 E2 10 E2 9 E2 7 ITCF 7 E2 7 E2 8 E2 5 E2 2 ITCF
NC 460 E2 460 E2 460 E2 391 E2 343 ITCF 175 E2 182 E2 174 C 160 C 198 ITCF
Ply All 390 E4 334 E4 420 E4 421 E4 400 TCF 532 E4 575 E4 588 E4 530 E4 500 TCF
C 10 E2 21 E2 8 E2 9 E2 8 ITCF 226 E2 254 E2 207 E2 264 E2 245 ITCF
NC 380 E2 313 E2 412 E2 412 E2 392 ITCF 306 E2 321 E2 381 E2 266 E2 255 ITCF
66
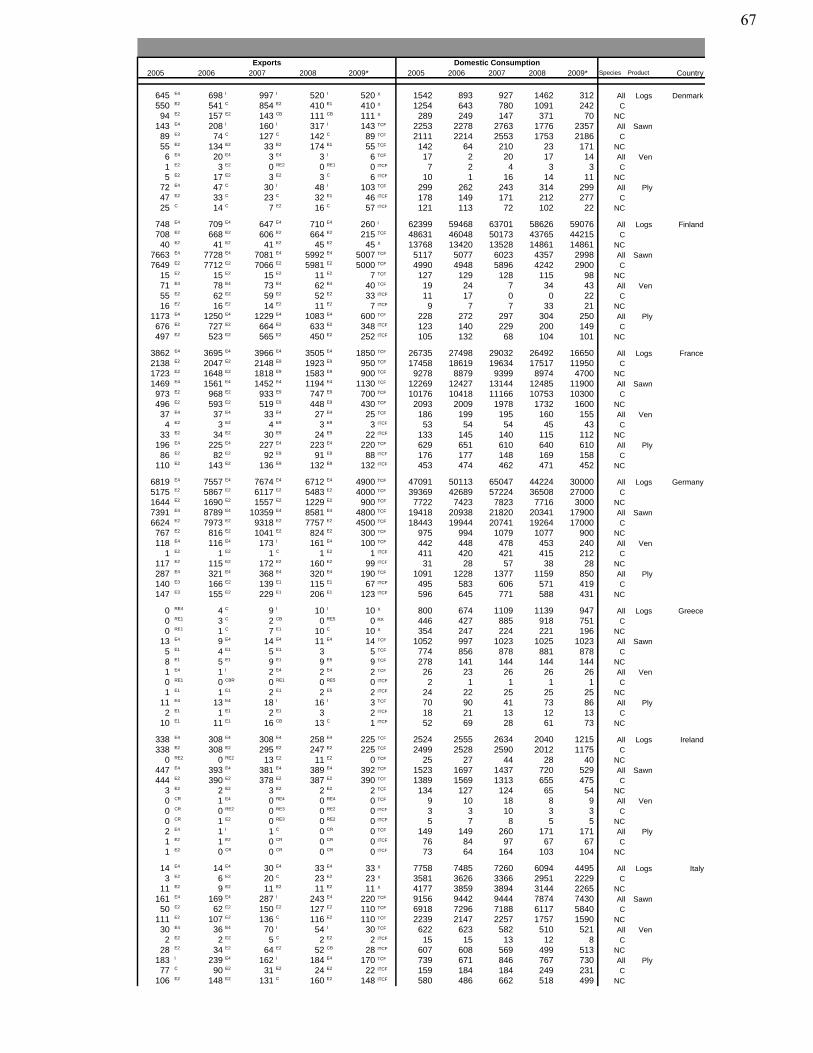
2005 2006 2007 2008 2009* 2005 2006 2007 2008 2009* Species Product CountryExports Domestic Consumption
645 E4 698 I 997 I 520 I 520 X 1542 893 927 1462 312 All Logs Denmark550 E2 541 C 854 E2 410 E1 410 X 1254 643 780 1091 242 C94 E2 157 E2 143 CB 111 CB 111 X 289 249 147 371 70 NC
143 E4 208 I 160 I 317 I 143 TCF 2253 2278 2763 1776 2357 All Sawn89 E3 74 C 127 C 142 C 89 TCF 2111 2214 2553 1753 2186 C55 E2 134 E2 33 E2 174 E1 55 TCF 142 64 210 23 171 NC6 E4 20 E4 3 E4 3 I 6 TCF 17 2 20 17 14 All Ven1 E2 3 E2 0 RE2 0 RE1 0 ITCF 7 2 4 3 3 C5 E2 17 E2 3 E2 3 C 6 ITCF 10 1 16 14 11 NC
72 E4 47 C 30 I 48 I 103 TCF 299 262 243 314 299 All Ply47 E2 33 C 23 C 32 E1 46 ITCF 178 149 171 212 277 C25 C 14 C 7 E2 16 C 57 ITCF 121 113 72 102 22 NC
748 E4 709 E4 647 E4 710 E4 260 I 62399 59468 63701 58626 59076 All Logs Finland708 E2 668 E2 606 E2 664 E2 215 TCF 48631 46048 50173 43765 44215 C40 E2 41 E2 41 E2 45 E2 45 X 13768 13420 13528 14861 14861 NC
7663 E4 7728 E4 7081 E4 5992 E4 5007 TCF 5117 5077 6023 4357 2998 All Sawn7649 E2 7712 E2 7066 E2 5981 E2 5000 TCF 4990 4948 5896 4242 2900 C
15 E2 15 E2 15 E2 11 E2 7 TCF 127 129 128 115 98 NC71 E4 78 E4 73 E4 62 E4 40 TCF 19 24 7 34 43 All Ven55 E2 62 E2 59 E2 52 E2 33 ITCF 11 17 0 0 22 C16 E2 16 E2 14 E2 11 E2 7 ITCF 9 7 7 33 21 NC
1173 E4 1250 E4 1229 E4 1083 E4 600 TCF 228 272 297 304 250 All Ply676 E2 727 E2 664 E2 633 E2 348 ITCF 123 140 229 200 149 C497 E2 523 E2 565 E2 450 E2 252 ITCF 105 132 68 104 101 NC
3862 E4 3695 E4 3966 E4 3505 E4 1850 TCF 26735 27498 29032 26492 16650 All Logs France2138 E2 2047 E2 2148 E9 1923 E9 950 TCF 17458 18619 19634 17517 11950 C1723 E2 1648 E2 1818 E9 1583 E9 900 TCF 9278 8879 9399 8974 4700 NC1469 E4 1561 E4 1452 E4 1194 E4 1130 TCF 12269 12427 13144 12485 11900 All Sawn973 E2 968 E2 933 E9 747 E9 700 TCF 10176 10418 11166 10753 10300 C496 E2 593 E2 519 E9 448 E9 430 TCF 2093 2009 1978 1732 1600 NC37 E4 37 E4 33 E4 27 E4 25 TCF 186 199 195 160 155 All Ven4 E2 3 E2 4 E9 3 E9 3 ITCF 53 54 54 45 43 C
33 E2 34 E2 30 E9 24 E9 22 ITCF 133 145 140 115 112 NC196 E4 225 E4 227 E4 223 E4 220 TCF 629 651 610 640 610 All Ply86 E2 82 E2 92 E9 91 E9 88 ITCF 176 177 148 169 158 C
110 E2 143 E2 136 E9 132 E9 132 ITCF 453 474 462 471 452 NC
6819 E4 7557 E4 7674 E4 6712 E4 4900 TCF 47091 50113 65047 44224 30000 All Logs Germany5175 E2 5867 E2 6117 E2 5483 E2 4000 TCF 39369 42689 57224 36508 27000 C1644 E2 1690 E2 1557 E2 1229 E2 900 TCF 7722 7423 7823 7716 3000 NC7391 E4 8789 E4 10359 E4 8581 E4 4800 TCF 19418 20938 21820 20341 17900 All Sawn6624 E2 7973 E2 9318 E2 7757 E2 4500 TCF 18443 19944 20741 19264 17000 C767 E2 816 E2 1041 E2 824 E2 300 TCF 975 994 1079 1077 900 NC118 E4 116 E4 173 I 161 E4 100 TCF 442 448 478 453 240 All Ven
1 E2 1 E2 1 C 1 E2 1 ITCF 411 420 421 415 212 C117 E2 115 E2 172 E2 160 E2 99 ITCF 31 28 57 38 28 NC287 E4 321 E4 368 E4 320 E4 190 TCF 1091 1228 1377 1159 850 All Ply140 E3 166 E2 139 E1 115 E1 67 ITCF 495 583 606 571 419 C147 E3 155 E2 229 E1 206 E1 123 ITCF 596 645 771 588 431 NC
0 RE4 4 C 9 I 10 I 10 X 800 674 1109 1139 947 All Logs Greece0 RE1 3 C 2 CB 0 RE5 0 RX 446 427 885 918 751 C0 RE1 1 C 7 E1 10 C 10 X 354 247 224 221 196 NC
13 E4 9 E4 14 E4 11 E4 14 TCF 1052 997 1023 1025 1023 All Sawn5 E1 4 E1 5 E1 3 5 TCF 774 856 878 881 878 C8 E1 5 E1 9 E1 9 E5 9 TCF 278 141 144 144 144 NC1 E4 1 I 2 E4 2 E4 2 TCF 26 23 26 26 26 All Ven0 RE1 0 CBR 0 RE1 0 RE5 0 ITCF 2 1 1 1 1 C1 E1 1 E1 2 E1 2 E5 2 ITCF 24 22 25 25 25 NC
11 E4 13 E4 18 I 16 I 3 TCF 70 90 41 73 86 All Ply2 E1 1 E1 2 E1 3 2 ITCF 18 21 13 12 13 C
10 E1 11 E1 16 CB 13 C 1 ITCF 52 69 28 61 73 NC
338 E4 308 E4 308 E4 258 E4 225 TCF 2524 2555 2634 2040 1215 All Logs Ireland338 E2 308 E2 295 E2 247 E2 225 TCF 2499 2528 2590 2012 1175 C
0 RE2 0 RE2 13 E2 11 E2 0 TCF 25 27 44 28 40 NC447 E4 393 E4 381 E4 389 E4 392 TCF 1523 1697 1437 720 529 All Sawn444 E2 390 E2 378 E2 387 E2 390 TCF 1389 1569 1313 655 475 C
3 E2 2 E2 3 E2 2 E2 2 TCF 134 127 124 65 54 NC0 CR 1 E4 0 RE4 0 RE4 0 TCF 9 10 18 8 9 All Ven0 CR 0 RE2 0 RE3 0 RE2 0 ITCF 3 3 10 3 3 C0 CR 1 E2 0 RE3 0 RE2 0 ITCF 5 7 8 5 5 NC2 E4 1 I 1 C 0 CR 0 TCF 149 149 260 171 171 All Ply1 E2 1 E2 0 CR 0 CR 0 ITCF 76 84 97 67 67 C1 E2 0 CR 0 CR 0 CR 0 ITCF 73 64 164 103 104 NC
14 E4 14 E4 30 E4 33 E4 33 X 7758 7485 7260 6094 4495 All Logs Italy3 E2 6 E2 20 C 23 E2 23 X 3581 3626 3366 2951 2229 C
11 E2 9 E2 11 E2 11 E2 11 X 4177 3859 3894 3144 2265 NC161 E4 169 E4 287 I 243 E4 220 TCF 9156 9442 9444 7874 7430 All Sawn50 E2 62 E2 150 E2 127 E2 110 TCF 6918 7296 7188 6117 5840 C
111 E2 107 E2 136 C 116 E2 110 TCF 2239 2147 2257 1757 1590 NC30 E4 36 E4 70 I 54 I 30 TCF 622 623 582 510 521 All Ven2 E2 2 E2 5 C 2 E2 2 ITCF 15 15 13 12 8 C
28 E2 34 E2 64 E2 52 CB 28 ITCF 607 608 569 499 513 NC183 I 239 E4 162 I 184 E4 170 TCF 739 671 846 767 730 All Ply77 C 90 E2 31 E2 24 E2 22 ITCF 159 184 184 249 231 C
106 E2 148 E2 131 C 160 E2 148 ITCF 580 486 662 518 499 NC
67
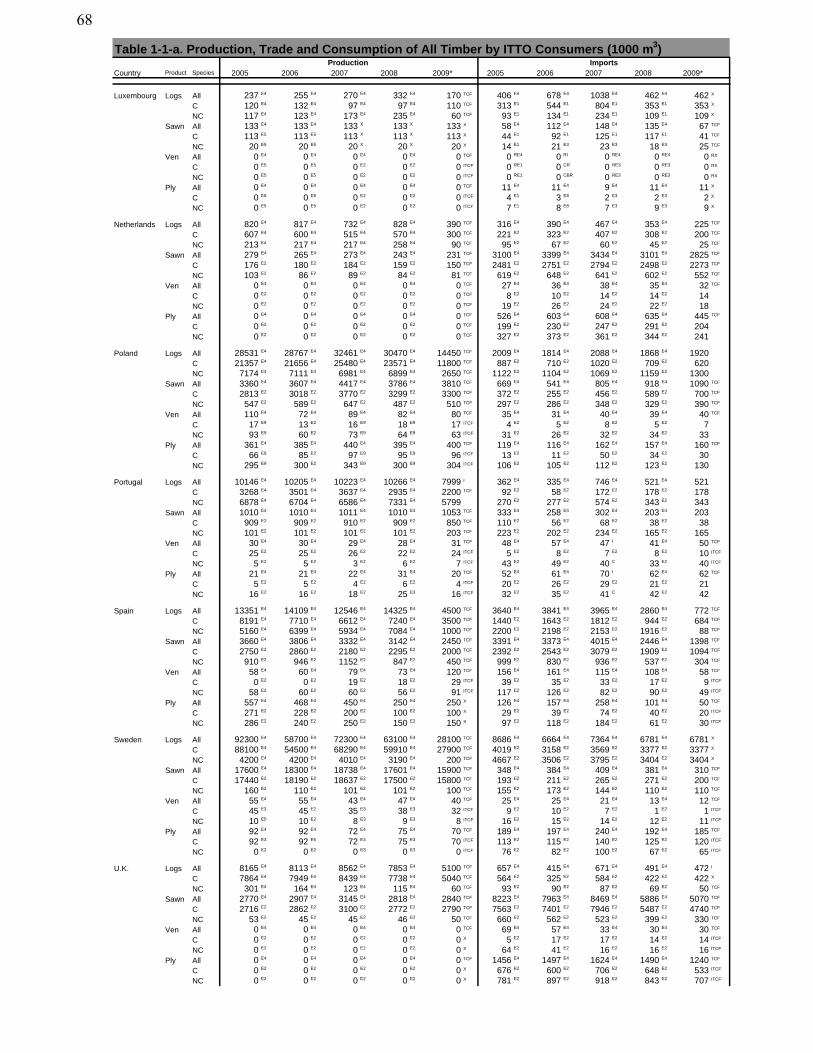
Table 1-1-a. Production, Trade and Consumption of All Timber by ITTO Consumers (1000 m3)
Country Product Species 2005 2006 2007 2008 2009* 2005 2006 2007 2008 2009*Production Imports
Luxembourg Logs All 237 E4 255 E4 270 E4 332 E4 170 TCF 406 E4 678 E4 1038 E4 462 E4 462 X
C 120 E4 132 E4 97 E4 97 E4 110 TCF 313 E1 544 E1 804 E1 353 E1 353 X
NC 117 E4 123 E4 173 E4 235 E4 60 TCF 93 E1 134 E1 234 E1 109 E1 109 X
Sawn All 133 E4 133 E4 133 X 133 X 133 X 58 E4 112 E4 148 E4 135 E4 67 TCF
C 113 E5 113 E5 113 X 113 X 113 X 44 E1 92 E1 125 E1 117 E1 41 TCF
NC 20 E5 20 E5 20 X 20 X 20 X 14 E1 21 E3 23 E3 18 E3 25 TCF
Ven All 0 E4 0 E4 0 E4 0 E4 0 TCF 0 RE4 0 RI 0 RE4 0 RE4 0 RX
C 0 E5 0 E5 0 E2 0 E2 0 ITCF 0 RE1 0 CR 0 RE3 0 RE3 0 RX
NC 0 E5 0 E5 0 E2 0 E2 0 ITCF 0 RE1 0 CBR 0 RE3 0 RE3 0 RX
Ply All 0 E4 0 E4 0 E4 0 E4 0 TCF 11 E4 11 E4 9 E4 11 E4 11 X
C 0 E5 0 E5 0 E2 0 E2 0 ITCF 4 E1 3 E8 2 E3 2 E3 2 X
NC 0 E5 0 E5 0 E2 0 E2 0 ITCF 7 E1 8 E8 7 E3 9 E3 9 X
Netherlands Logs All 820 E4 817 E4 732 E4 828 E4 390 TCF 316 E4 390 E4 467 E4 353 E4 225 TCF
C 607 E4 600 E4 515 E4 570 E4 300 TCF 221 E2 323 E2 407 E2 308 E2 200 TCF
NC 213 E4 217 E4 217 E4 258 E4 90 TCF 95 E2 67 E2 60 E2 45 E2 25 TCF
Sawn All 279 E4 265 E4 273 E4 243 E4 231 TCF 3100 E4 3399 E4 3434 E4 3101 E4 2825 TCF
C 176 E2 180 E2 184 E2 159 E2 150 TCF 2481 E2 2751 E2 2794 E2 2498 E2 2273 TCF
NC 103 E2 86 E2 89 E2 84 E2 81 TCF 619 E2 648 E2 641 E2 602 E2 552 TCF
Ven All 0 E4 0 E4 0 E4 0 E4 0 TCF 27 E4 36 E4 38 E4 35 E4 32 TCF
C 0 E2 0 E2 0 E2 0 E2 0 TCF 8 E2 10 E2 14 E2 14 E2 14
NC 0 E2 0 E2 0 E2 0 E2 0 TCF 19 E2 26 E2 24 E2 22 E2 18
Ply All 0 E4 0 E4 0 E4 0 E4 0 TCF 526 E4 603 E4 608 E4 635 E4 445 TCF
C 0 E2 0 E2 0 E2 0 E2 0 TCF 199 E2 230 E2 247 E2 291 E2 204
NC 0 E2 0 E2 0 E2 0 E2 0 TCF 327 E2 373 E2 361 E2 344 E2 241
Poland Logs All 28531 E4 28767 E4 32461 E4 30470 E4 14450 TCF 2009 E4 1814 E4 2088 E4 1868 E4 1920
C 21357 E4 21656 E4 25480 E4 23571 E4 11800 TCF 887 E2 710 E2 1020 E2 709 E2 620
NC 7174 E4 7111 E4 6981 E4 6899 E4 2650 TCF 1122 E2 1104 E2 1069 E2 1159 E2 1300
Sawn All 3360 E4 3607 E4 4417 E4 3786 E4 3810 TCF 669 E4 541 E4 805 E4 918 E4 1090 TCF
C 2813 E2 3018 E2 3770 E2 3299 E2 3300 TCF 372 E2 255 E2 456 E2 589 E2 700 TCF
NC 547 E2 589 E2 647 E2 487 E2 510 TCF 297 E2 286 E2 348 E2 329 E2 390 TCF
Ven All 110 E4 72 E4 89 E4 82 E4 80 TCF 35 E4 31 E4 40 E4 39 E4 40 TCF
C 17 E9 13 E2 16 E9 18 E9 17 ITCF 4 E2 5 E2 8 E2 5 E2 7
NC 93 E9 60 E2 73 E9 64 E9 63 ITCF 31 E2 26 E2 32 E2 34 E2 33
Ply All 361 E4 385 E4 440 E4 395 E4 400 TCF 119 E4 116 E4 162 E4 157 E4 160 TCF
C 66 E9 85 E2 97 E9 95 E9 96 ITCF 13 E2 11 E2 50 E2 34 E2 30
NC 295 E9 300 E2 343 E9 300 E9 304 ITCF 106 E2 105 E2 112 E2 123 E2 130
Portugal Logs All 10146 E4 10205 E4 10223 E4 10266 E4 7999 I 362 E4 335 E4 746 E4 521 E4 521
C 3268 E4 3501 E4 3637 E4 2935 E4 2200 TCF 92 E2 58 E2 172 E2 178 E2 178
NC 6878 E4 6704 E4 6586 E4 7331 E4 5799 270 E2 277 E2 574 E2 343 E2 343
Sawn All 1010 E4 1010 E4 1011 E4 1010 E4 1053 TCF 333 E4 258 E4 302 E4 203 E4 203
C 909 E2 909 E2 910 E2 909 E2 850 TCF 110 E2 56 E2 68 E2 38 E2 38
NC 101 E2 101 E2 101 E2 101 E2 203 TCF 223 E2 202 E2 234 E2 165 E2 165
Ven All 30 E4 30 E4 29 E4 28 E4 31 TCF 48 E4 57 E4 47 I 41 E4 50 TCF
C 25 E2 25 E2 26 E2 22 E2 24 ITCF 5 E2 8 E2 7 E2 8 E2 10 ITCF
NC 5 E2 5 E2 3 E2 6 E2 7 ITCF 43 E2 49 E2 40 C 33 E2 40 ITCF
Ply All 21 E4 21 E4 22 E4 31 E4 20 TCF 52 E4 61 E4 70 I 62 E4 62 TCF
C 5 E2 5 E2 4 E2 6 E2 4 ITCF 20 E2 26 E2 29 E2 21 E2 21
NC 16 E2 16 E2 18 E2 25 E3 16 ITCF 32 E2 35 E2 41 C 42 E2 42
Spain Logs All 13351 E4 14109 E4 12546 E4 14325 E4 4500 TCF 3640 E4 3841 E4 3965 E4 2860 E4 772 TCF
C 8191 E4 7710 E4 6612 E4 7240 E4 3500 TCF 1440 E2 1643 E2 1812 E2 944 E2 684 TCF
NC 5160 E4 6399 E4 5934 E4 7084 E4 1000 TCF 2200 E2 2198 E2 2153 E2 1916 E2 88 TCF
Sawn All 3660 E4 3806 E4 3332 E4 3142 E4 2450 TCF 3391 E4 3373 E4 4015 E4 2446 E4 1398 TCF
C 2750 E2 2860 E2 2180 E2 2295 E2 2000 TCF 2392 E2 2543 E2 3079 E2 1909 E2 1094 TCF
NC 910 E2 946 E2 1152 E2 847 E2 450 TCF 999 E2 830 E2 936 E2 537 E2 304 TCF
Ven All 58 E4 60 E4 79 E4 73 E4 120 TCF 156 E4 161 E4 115 E4 108 E4 58 TCF
C 0 E2 0 E2 19 E2 18 E2 29 ITCF 39 E2 35 E2 33 E2 17 E2 9 ITCF
NC 58 E2 60 E2 60 E2 56 E2 91 ITCF 117 E2 126 E2 82 E2 90 E2 49 ITCF
Ply All 557 E4 468 E4 450 E4 250 E4 250 X 126 E4 157 E4 258 E4 101 E4 50 TCF
C 271 E2 228 E2 200 E2 100 E2 100 X 29 E2 39 E2 74 E2 40 E2 20 ITCF
NC 286 E2 240 E2 250 E2 150 E2 150 X 97 E2 118 E2 184 E2 61 E2 30 ITCF
Sweden Logs All 92300 E4 58700 E4 72300 E4 63100 E4 28100 TCF 8686 E4 6664 E4 7364 E4 6781 E4 6781 X
C 88100 E4 54500 E4 68290 E4 59910 E4 27900 TCF 4019 E2 3158 E2 3569 E2 3377 E2 3377 X
NC 4200 E4 4200 E4 4010 E4 3190 E4 200 TCF 4667 E2 3506 E2 3795 E2 3404 E2 3404 X
Sawn All 17600 E4 18300 E4 18738 E4 17601 E4 15900 TCF 348 E4 384 E4 409 E4 381 E4 310 TCF
C 17440 E2 18190 E2 18637 E2 17500 E2 15800 TCF 193 E2 211 E2 265 E2 271 E2 200 TCF
NC 160 E2 110 E2 101 E2 101 E2 100 TCF 155 E2 173 E2 144 E2 110 E2 110 TCF
Ven All 55 E4 55 E4 43 E4 47 E4 40 TCF 25 E4 25 E4 21 E4 13 E4 12 TCF
C 45 E3 45 E2 35 E3 38 E3 32 ITCF 9 E2 10 E2 7 E2 1 E2 1 ITCF
NC 10 E5 10 E2 8 E3 9 E3 8 ITCF 16 E2 15 E2 14 E2 12 E2 11 ITCF
Ply All 92 E4 92 E4 72 E4 75 E4 70 TCF 189 E4 197 E4 240 E4 192 E4 185 TCF
C 92 E3 92 E5 72 E3 75 E3 70 ITCF 113 E2 115 E2 140 E2 125 E2 120 ITCF
NC 0 E2 0 E2 0 E3 0 E3 0 ITCF 76 E2 82 E2 100 E2 67 E2 65 ITCF
U.K. Logs All 8165 E4 8113 E4 8562 E4 7853 E4 5100 TCF 657 E4 415 E4 671 E4 491 E4 472 I
C 7864 E4 7949 E4 8439 E4 7738 E4 5040 TCF 564 E2 325 E2 584 E2 422 E2 422 X
NC 301 E4 164 E4 123 E4 115 E4 60 TCF 93 E2 90 E2 87 E2 69 E2 50 TCF
Sawn All 2770 E4 2907 E4 3145 E4 2818 E4 2840 TCF 8223 E4 7963 E4 8469 E4 5886 E4 5070 TCF
C 2716 E2 2862 E2 3100 E2 2772 E2 2790 TCF 7563 E2 7401 E2 7946 E2 5487 E2 4740 TCF
NC 53 E2 45 E2 45 E2 46 E2 50 TCF 660 E2 562 E2 523 E2 399 E2 330 TCF
Ven All 0 E4 0 E4 0 E4 0 E4 0 TCF 69 E4 57 E4 33 E4 30 E4 30 TCF
C 0 E2 0 E2 0 E2 0 E2 0 X 5 E2 17 E2 17 E2 14 E2 14 ITCF
NC 0 E2 0 E2 0 E2 0 E2 0 X 64 E2 41 E2 16 E2 16 E2 16 ITCF
Ply All 0 E4 0 E4 0 E4 0 E4 0 TCF 1456 E4 1497 E4 1624 E4 1490 E4 1240 TCF
C 0 E2 0 E2 0 E2 0 E2 0 X 676 E2 600 E2 706 E2 648 E2 533 ITCF
NC 0 E2 0 E2 0 E2 0 E2 0 X 781 E2 897 E2 918 E2 843 E2 707 ITCF
68
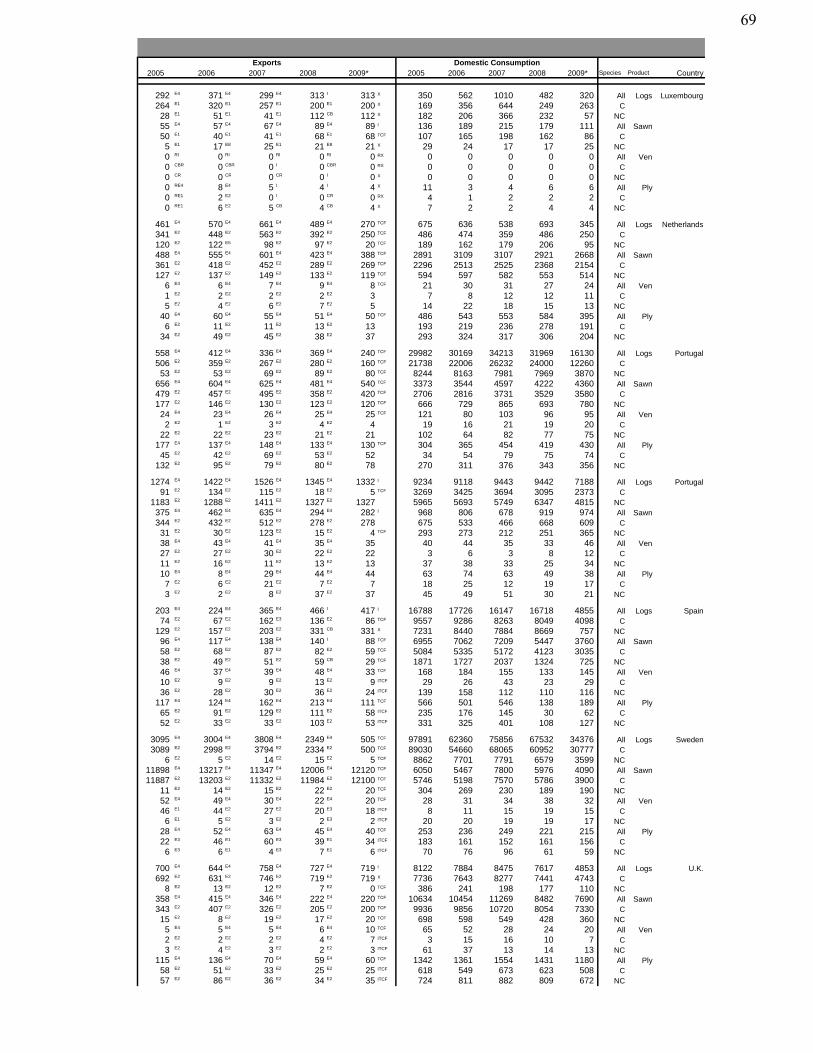
2005 2006 2007 2008 2009* 2005 2006 2007 2008 2009* Species Product CountryExports Domestic Consumption
292 E4 371 E4 299 E4 313 I 313 X 350 562 1010 482 320 All Logs Luxembourg264 E1 320 E1 257 E1 200 E1 200 X 169 356 644 249 263 C28 E1 51 E1 41 E1 112 CB 112 X 182 206 366 232 57 NC55 E4 57 E4 67 E4 89 E4 89 I 136 189 215 179 111 All Sawn50 E1 40 E1 41 E1 68 E1 68 TCF 107 165 198 162 86 C5 E1 17 E8 25 E1 21 E8 21 X 29 24 17 17 25 NC0 RI 0 RI 0 RI 0 RI 0 RX 0 0 0 0 0 All Ven0 CBR 0 CBR 0 I 0 CBR 0 RX 0 0 0 0 0 C0 CR 0 CR 0 CR 0 I 0 X 0 0 0 0 0 NC0 RE4 8 E4 5 I 4 I 4 X 11 3 4 6 6 All Ply0 RE1 2 E2 0 I 0 CR 0 RX 4 1 2 2 2 C0 RE1 6 E2 5 CB 4 CB 4 X 7 2 2 4 4 NC
461 E4 570 E4 661 E4 489 E4 270 TCF 675 636 538 693 345 All Logs Netherlands341 E2 448 E2 563 E2 392 E2 250 TCF 486 474 359 486 250 C120 E2 122 E5 98 E2 97 E2 20 TCF 189 162 179 206 95 NC488 E4 555 E4 601 E4 423 E4 388 TCF 2891 3109 3107 2921 2668 All Sawn361 E2 418 E2 452 E2 289 E2 269 TCF 2296 2513 2525 2368 2154 C127 E2 137 E2 149 E2 133 E2 119 TCF 594 597 582 553 514 NC
6 E4 6 E4 7 E4 9 E4 8 TCF 21 30 31 27 24 All Ven1 E2 2 E2 2 E2 2 E2 3 7 8 12 12 11 C5 E2 4 E2 6 E2 7 E2 5 14 22 18 15 13 NC
40 E4 60 E4 55 E4 51 E4 50 TCF 486 543 553 584 395 All Ply6 E2 11 E2 11 E2 13 E2 13 193 219 236 278 191 C
34 E2 49 E2 45 E2 38 E2 37 293 324 317 306 204 NC
558 E4 412 E4 336 E4 369 E4 240 TCF 29982 30169 34213 31969 16130 All Logs Portugal506 E2 359 E2 267 E2 280 E2 160 TCF 21738 22006 26232 24000 12260 C53 E2 53 E2 69 E2 89 E2 80 TCF 8244 8163 7981 7969 3870 NC
656 E4 604 E4 625 E4 481 E4 540 TCF 3373 3544 4597 4222 4360 All Sawn479 E2 457 E2 495 E2 358 E2 420 TCF 2706 2816 3731 3529 3580 C177 E2 146 E2 130 E2 123 E2 120 TCF 666 729 865 693 780 NC24 E4 23 E4 26 E4 25 E4 25 TCF 121 80 103 96 95 All Ven2 E2 1 E2 3 E2 4 E2 4 19 16 21 19 20 C
22 E2 22 E2 23 E2 21 E2 21 102 64 82 77 75 NC177 E4 137 E4 148 E4 133 E4 130 TCF 304 365 454 419 430 All Ply45 E2 42 E2 69 E2 53 E2 52 34 54 79 75 74 C
132 E2 95 E2 79 E2 80 E2 78 270 311 376 343 356 NC
1274 E4 1422 E4 1526 E4 1345 E4 1332 I 9234 9118 9443 9442 7188 All Logs Portugal91 E2 134 E2 115 E2 18 E2 5 TCF 3269 3425 3694 3095 2373 C
1183 E2 1288 E2 1411 E2 1327 E2 1327 5965 5693 5749 6347 4815 NC375 E4 462 E4 635 E4 294 E4 282 I 968 806 678 919 974 All Sawn344 E2 432 E2 512 E2 278 E2 278 675 533 466 668 609 C31 E2 30 E2 123 E2 15 E2 4 TCF 293 273 212 251 365 NC38 E4 43 E4 41 E4 35 E4 35 40 44 35 33 46 All Ven27 E2 27 E2 30 E2 22 E2 22 3 6 3 8 12 C11 E2 16 E2 11 E2 13 E2 13 37 38 33 25 34 NC10 E4 8 E4 29 E4 44 E4 44 63 74 63 49 38 All Ply7 E2 6 E2 21 E2 7 E2 7 18 25 12 19 17 C3 E2 2 E2 8 E2 37 E2 37 45 49 51 30 21 NC
203 E4 224 E4 365 E4 466 I 417 I 16788 17726 16147 16718 4855 All Logs Spain74 E2 67 E2 162 E3 136 E2 86 TCF 9557 9286 8263 8049 4098 C
129 E2 157 E2 203 E2 331 CB 331 X 7231 8440 7884 8669 757 NC96 E4 117 E4 138 E4 140 I 88 TCF 6955 7062 7209 5447 3760 All Sawn58 E2 68 E2 87 E2 82 E2 59 TCF 5084 5335 5172 4123 3035 C38 E2 49 E2 51 E2 59 CB 29 TCF 1871 1727 2037 1324 725 NC46 E4 37 E4 39 E4 48 E4 33 TCF 168 184 155 133 145 All Ven10 E2 9 E2 9 E2 13 E2 9 ITCF 29 26 43 23 29 C36 E2 28 E2 30 E2 36 E2 24 ITCF 139 158 112 110 116 NC
117 E4 124 E4 162 E4 213 E4 111 TCF 566 501 546 138 189 All Ply65 E2 91 E2 129 E2 111 E2 58 ITCF 235 176 145 30 62 C52 E2 33 E2 33 E2 103 E2 53 ITCF 331 325 401 108 127 NC
3095 E4 3004 E4 3808 E4 2349 E4 505 TCF 97891 62360 75856 67532 34376 All Logs Sweden3089 E2 2998 E2 3794 E2 2334 E2 500 TCF 89030 54660 68065 60952 30777 C
6 E2 5 E2 14 E2 15 E2 5 TCF 8862 7701 7791 6579 3599 NC11898 E4 13217 E4 11347 E4 12006 E4 12120 TCF 6050 5467 7800 5976 4090 All Sawn11887 E2 13203 E2 11332 E2 11984 E2 12100 TCF 5746 5198 7570 5786 3900 C
11 E2 14 E2 15 E2 22 E2 20 TCF 304 269 230 189 190 NC52 E4 49 E4 30 E4 22 E4 20 TCF 28 31 34 38 32 All Ven46 E1 44 E2 27 E2 20 E3 18 ITCF 8 11 15 19 15 C6 E1 5 E2 3 E2 2 E3 2 ITCF 20 20 19 19 17 NC
28 E4 52 E4 63 E4 45 E4 40 TCF 253 236 249 221 215 All Ply22 E3 46 E1 60 E3 39 E1 34 ITCF 183 161 152 161 156 C6 E3 6 E1 4 E3 7 E1 6 ITCF 70 76 96 61 59 NC
700 E4 644 E4 758 E4 727 E4 719 I 8122 7884 8475 7617 4853 All Logs U.K.692 E2 631 E2 746 E2 719 E2 719 X 7736 7643 8277 7441 4743 C
8 E2 13 E2 12 E2 7 E2 0 TCF 386 241 198 177 110 NC358 E4 415 E4 346 E4 222 E4 220 TCF 10634 10454 11269 8482 7690 All Sawn343 E2 407 E2 326 E2 205 E2 200 TCF 9936 9856 10720 8054 7330 C15 E2 8 E2 19 E2 17 E2 20 TCF 698 598 549 428 360 NC5 E4 5 E4 5 E4 6 E4 10 TCF 65 52 28 24 20 All Ven2 E2 2 E2 2 E2 4 E2 7 ITCF 3 15 16 10 7 C3 E2 4 E2 3 E2 2 E2 3 ITCF 61 37 13 14 13 NC
115 E4 136 E4 70 E4 59 E4 60 TCF 1342 1361 1554 1431 1180 All Ply58 E2 51 E2 33 E2 25 E2 25 ITCF 618 549 673 623 508 C57 E2 86 E2 36 E2 34 E2 35 ITCF 724 811 882 809 672 NC
69
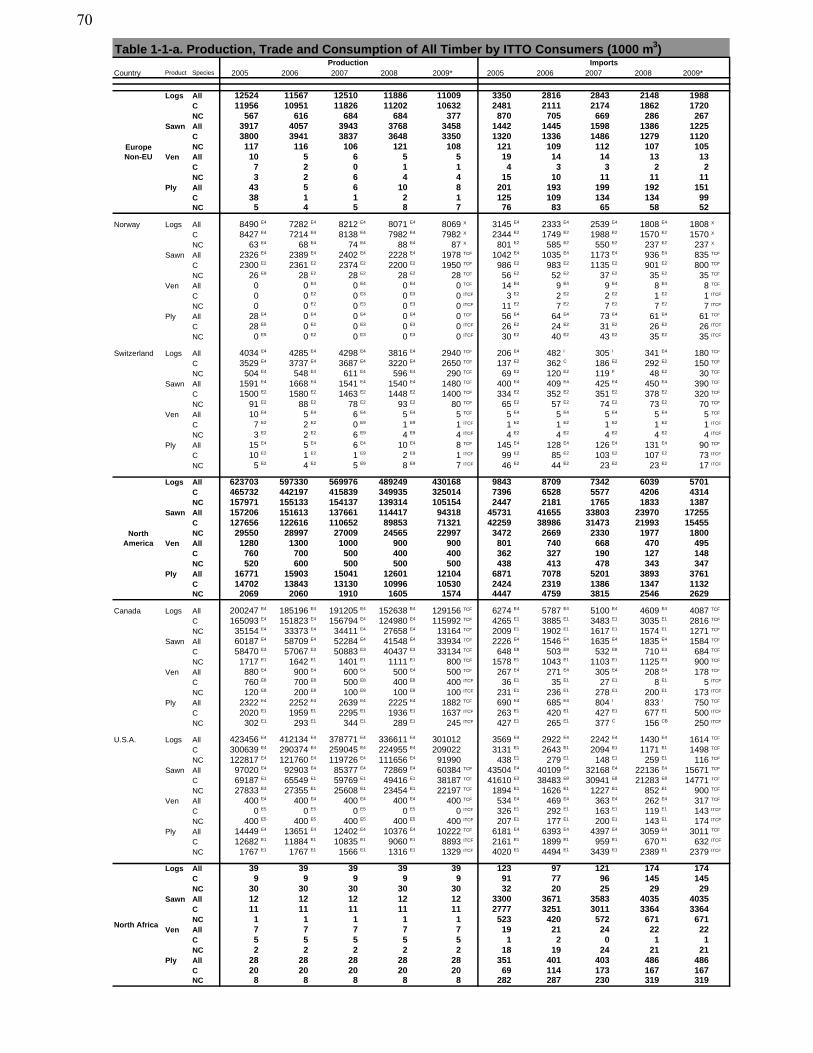
Table 1-1-a. Production, Trade and Consumption of All Timber by ITTO Consumers (1000 m3)
Country Product Species 2005 2006 2007 2008 2009* 2005 2006 2007 2008 2009*Production Imports
Logs All 12524 11567 12510 11886 11009 3350 2816 2843 2148 1988C 11956 10951 11826 11202 10632 2481 2111 2174 1862 1720NC 567 616 684 684 377 870 705 669 286 267
Sawn All 3917 4057 3943 3768 3458 1442 1445 1598 1386 1225C 3800 3941 3837 3648 3350 1320 1336 1486 1279 1120NC 117 116 106 121 108 121 109 112 107 105
Ven All 10 5 6 5 5 19 14 14 13 13C 7 2 0 1 1 4 3 3 2 2NC 3 2 6 4 4 15 10 11 11 11
Ply All 43 5 6 10 8 201 193 199 192 151C 38 1 1 2 1 125 109 134 134 99NC 5 4 5 8 7 76 83 65 58 52
Norway Logs All 8490 E4 7282 E4 8212 E4 8071 E4 8069 X 3145 E4 2333 E4 2539 E4 1808 E4 1808 X
C 8427 E4 7214 E4 8138 E4 7982 E4 7982 X 2344 E2 1749 E2 1988 E2 1570 E2 1570 X
NC 63 E4 68 E4 74 E4 88 E4 87 X 801 E2 585 E2 550 E2 237 E2 237 X
Sawn All 2326 E4 2389 E4 2402 E4 2228 E4 1978 TCF 1042 E4 1035 E4 1173 E4 936 E4 835 TCF
C 2300 E2 2361 E2 2374 E2 2200 E2 1950 TCF 986 E2 983 E2 1135 E2 901 E2 800 TCF
NC 26 E9 28 E2 28 E2 28 E2 28 TCF 56 E2 52 E2 37 E2 35 E2 35 TCF
Ven All 0 0 E4 0 E4 0 E4 0 TCF 14 E4 9 E4 9 E4 8 E4 8 TCF
C 0 0 E2 0 E3 0 E3 0 ITCF 3 E2 2 E2 2 E2 1 E2 1 ITCF
NC 0 0 E2 0 E3 0 E3 0 ITCF 11 E2 7 E2 7 E2 7 E2 7 ITCF
Ply All 28 E4 0 E4 0 E4 0 E4 0 TCF 56 E4 64 E4 73 E4 61 E4 61 TCF
C 28 E5 0 E2 0 E3 0 E3 0 ITCF 26 E2 24 E2 31 E2 26 E2 26 ITCF
NC 0 E5 0 E2 0 E3 0 E3 0 ITCF 30 E2 40 E2 43 E2 35 E2 35 ITCF
Switzerland Logs All 4034 E4 4285 E4 4298 E4 3816 E4 2940 TCF 206 E4 482 I 305 I 341 E4 180 TCF
C 3529 E4 3737 E4 3687 E4 3220 E4 2650 TCF 137 E2 362 C 186 E2 292 E2 150 TCF
NC 504 E4 548 E4 611 E4 596 E4 290 TCF 69 E2 120 E2 119 F 48 E2 30 TCF
Sawn All 1591 E4 1668 E4 1541 E4 1540 E4 1480 TCF 400 E4 409 E4 425 E4 450 E4 390 TCF
C 1500 E2 1580 E2 1463 E2 1448 E2 1400 TCF 334 E2 352 E2 351 E2 378 E2 320 TCF
NC 91 E2 88 E2 78 E2 93 E2 80 TCF 65 E2 57 E2 74 E2 73 E2 70 TCF
Ven All 10 E4 5 E4 6 E4 5 E4 5 TCF 5 E4 5 E4 5 E4 5 E4 5 TCF
C 7 E2 2 E2 0 E9 1 E9 1 ITCF 1 E2 1 E2 1 E2 1 E2 1 ITCF
NC 3 E2 2 E2 6 E9 4 E9 4 ITCF 4 E2 4 E2 4 E2 4 E2 4 ITCF
Ply All 15 E4 5 E4 6 E4 10 E4 8 TCF 145 E4 128 E4 126 E4 131 E4 90 TCF
C 10 E2 1 E2 1 E9 2 E9 1 ITCF 99 E2 85 E2 103 E2 107 E2 73 ITCF
NC 5 E2 4 E2 5 E9 8 E9 7 ITCF 46 E2 44 E2 23 E2 23 E2 17 ITCF
Logs All 623703 597330 569976 489249 430168 9843 8709 7342 6039 5701C 465732 442197 415839 349935 325014 7396 6528 5577 4206 4314NC 157971 155133 154137 139314 105154 2447 2181 1765 1833 1387
Sawn All 157206 151613 137661 114417 94318 45731 41655 33803 23970 17255C 127656 122616 110652 89853 71321 42259 38986 31473 21993 15455NC 29550 28997 27009 24565 22997 3472 2669 2330 1977 1800
Ven All 1280 1300 1000 900 900 801 740 668 470 495C 760 700 500 400 400 362 327 190 127 148NC 520 600 500 500 500 438 413 478 343 347
Ply All 16771 15903 15041 12601 12104 6871 7078 5201 3893 3761C 14702 13843 13130 10996 10530 2424 2319 1386 1347 1132NC 2069 2060 1910 1605 1574 4447 4759 3815 2546 2629
Canada Logs All 200247 E4 185196 E4 191205 E4 152638 E4 129156 TCF 6274 E4 5787 E4 5100 E4 4609 E4 4087 TCF
C 165093 E4 151823 E4 156794 E4 124980 E4 115992 TCF 4265 E1 3885 E1 3483 E1 3035 E1 2816 TCF
NC 35154 E4 33373 E4 34411 E4 27658 E4 13164 TCF 2009 E1 1902 E1 1617 E1 1574 E1 1271 TCF
Sawn All 60187 E4 58709 E4 52284 E4 41548 E4 33934 TCF 2226 E4 1546 E4 1635 E4 1835 E4 1584 TCF
C 58470 E3 57067 E3 50883 E3 40437 E3 33134 TCF 648 E8 503 E8 532 E8 710 E3 684 TCF
NC 1717 E1 1642 E1 1401 E1 1111 E1 800 TCF 1578 E1 1043 E1 1103 E1 1125 E3 900 TCF
Ven All 880 E4 900 E4 600 E4 500 E4 500 TCF 267 E4 271 E4 305 E4 208 E4 178 TCF
C 760 E8 700 E8 500 E8 400 E8 400 ITCF 36 E1 35 E1 27 E1 8 E1 5 ITCF
NC 120 E8 200 E8 100 E8 100 E8 100 ITCF 231 E1 236 E1 278 E1 200 E1 173 ITCF
Ply All 2322 E4 2252 E4 2639 E4 2225 E4 1882 TCF 690 E4 685 E4 804 I 833 I 750 TCF
C 2020 E1 1959 E1 2295 E1 1936 E1 1637 ITCF 263 E1 420 E1 427 E1 677 E1 500 ITCF
NC 302 E1 293 E1 344 E1 289 E1 245 ITCF 427 E1 265 E1 377 C 156 CB 250 ITCF
U.S.A. Logs All 423456 E4 412134 E4 378771 E4 336611 E4 301012 3569 E4 2922 E4 2242 E4 1430 E4 1614 TCF
C 300639 E4 290374 E4 259045 E4 224955 E4 209022 3131 E1 2643 E1 2094 E1 1171 E1 1498 TCF
NC 122817 E4 121760 E4 119726 E4 111656 E4 91990 438 E1 279 E1 148 E1 259 E1 116 TCF
Sawn All 97020 E4 92903 E4 85377 E4 72869 E4 60384 TCF 43504 E4 40109 E4 32168 E4 22136 E4 15671 TCF
C 69187 E1 65549 E1 59769 E1 49416 E1 38187 TCF 41610 E3 38483 E8 30941 E8 21283 E8 14771 TCF
NC 27833 E3 27355 E1 25608 E1 23454 E1 22197 TCF 1894 E1 1626 E1 1227 E1 852 E1 900 TCF
Ven All 400 E4 400 E4 400 E4 400 E4 400 TCF 534 E4 469 E4 363 E4 262 E4 317 TCF
C 0 E5 0 E5 0 E5 0 E5 0 ITCF 326 E1 292 E1 163 E1 119 E1 143 ITCF
NC 400 E5 400 E5 400 E5 400 E5 400 ITCF 207 E1 177 E1 200 E1 143 E1 174 ITCF
Ply All 14449 E4 13651 E4 12402 E4 10376 E4 10222 TCF 6181 E4 6393 E4 4397 E4 3059 E4 3011 TCF
C 12682 E1 11884 E1 10835 E1 9060 E1 8893 ITCF 2161 E1 1899 E1 959 E1 670 E1 632 ITCF
NC 1767 E1 1767 E1 1566 E1 1316 E1 1329 ITCF 4020 E1 4494 E1 3439 E1 2389 E1 2379 ITCF
Logs All 39 39 39 39 39 123 97 121 174 174C 9 9 9 9 9 91 77 96 145 145NC 30 30 30 30 30 32 20 25 29 29
Sawn All 12 12 12 12 12 3300 3671 3583 4035 4035C 11 11 11 11 11 2777 3251 3011 3364 3364NC 1 1 1 1 1 523 420 572 671 671
Ven All 7 7 7 7 7 19 21 24 22 22C 5 5 5 5 5 1 2 0 1 1NC 2 2 2 2 2 18 19 24 21 21
Ply All 28 28 28 28 28 351 401 403 486 486C 20 20 20 20 20 69 114 173 167 167NC 8 8 8 8 8 282 287 230 319 319
Europe Non-EU
North Africa
North America
70
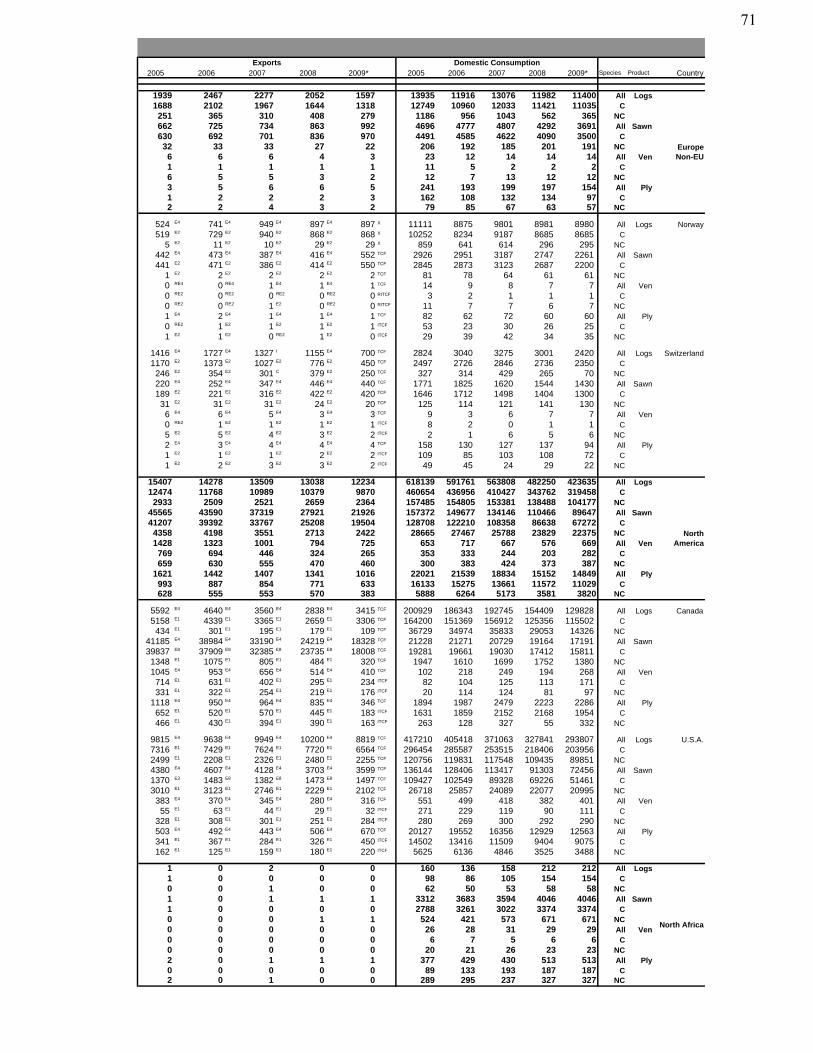
2005 2006 2007 2008 2009* 2005 2006 2007 2008 2009* Species Product CountryExports Domestic Consumption
1939 2467 2277 2052 1597 13935 11916 13076 11982 11400 All Logs1688 2102 1967 1644 1318 12749 10960 12033 11421 11035 C251 365 310 408 279 1186 956 1043 562 365 NC662 725 734 863 992 4696 4777 4807 4292 3691 All Sawn630 692 701 836 970 4491 4585 4622 4090 3500 C32 33 33 27 22 206 192 185 201 191 NC6 6 6 4 3 23 12 14 14 14 All Ven1 1 1 1 1 11 5 2 2 2 C6 5 5 3 2 12 7 13 12 12 NC3 5 6 6 5 241 193 199 197 154 All Ply1 2 2 2 3 162 108 132 134 97 C2 2 4 3 2 79 85 67 63 57 NC
524 E4 741 E4 949 E4 897 E4 897 X 11111 8875 9801 8981 8980 All Logs Norway519 E2 729 E2 940 E2 868 E2 868 X 10252 8234 9187 8685 8685 C
5 E2 11 E2 10 E2 29 E2 29 X 859 641 614 296 295 NC442 E4 473 E4 387 E4 416 E4 552 TCF 2926 2951 3187 2747 2261 All Sawn441 E2 471 E2 386 E2 414 E2 550 TCF 2845 2873 3123 2687 2200 C
1 E2 2 E2 2 E2 2 E2 2 TCF 81 78 64 61 61 NC0 RE4 0 RE4 1 E4 1 E4 1 TCF 14 9 8 7 7 All Ven0 RE2 0 RE2 0 RE2 0 RE2 0 RITCF 3 2 1 1 1 C0 RE2 0 RE2 1 E2 0 RE2 0 RITCF 11 7 7 6 7 NC1 E4 2 E4 1 E4 1 E4 1 TCF 82 62 72 60 60 All Ply0 RE2 1 E2 1 E2 1 E2 1 ITCF 53 23 30 26 25 C1 E2 1 E2 0 RE2 1 E2 0 ITCF 29 39 42 34 35 NC
1416 E4 1727 E4 1327 I 1155 E4 700 TCF 2824 3040 3275 3001 2420 All Logs Switzerland1170 E2 1373 E2 1027 E2 776 E2 450 TCF 2497 2726 2846 2736 2350 C246 E2 354 E2 301 C 379 E2 250 TCF 327 314 429 265 70 NC220 E4 252 E4 347 E4 446 E4 440 TCF 1771 1825 1620 1544 1430 All Sawn189 E2 221 E2 316 E2 422 E2 420 TCF 1646 1712 1498 1404 1300 C31 E2 31 E2 31 E2 24 E2 20 TCF 125 114 121 141 130 NC6 E4 6 E4 5 E4 3 E4 3 TCF 9 3 6 7 7 All Ven0 RE2 1 E2 1 E2 1 E2 1 ITCF 8 2 0 1 1 C5 E2 5 E2 4 E2 3 E2 2 ITCF 2 1 6 5 6 NC2 E4 3 E4 4 E4 4 E4 4 TCF 158 130 127 137 94 All Ply1 E2 1 E2 1 E2 2 E2 2 ITCF 109 85 103 108 72 C1 E2 2 E2 3 E2 3 E2 2 ITCF 49 45 24 29 22 NC
15407 14278 13509 13038 12234 618139 591761 563808 482250 423635 All Logs12474 11768 10989 10379 9870 460654 436956 410427 343762 319458 C2933 2509 2521 2659 2364 157485 154805 153381 138488 104177 NC
45565 43590 37319 27921 21926 157372 149677 134146 110466 89647 All Sawn41207 39392 33767 25208 19504 128708 122210 108358 86638 67272 C4358 4198 3551 2713 2422 28665 27467 25788 23829 22375 NC1428 1323 1001 794 725 653 717 667 576 669 All Ven769 694 446 324 265 353 333 244 203 282 C659 630 555 470 460 300 383 424 373 387 NC
1621 1442 1407 1341 1016 22021 21539 18834 15152 14849 All Ply993 887 854 771 633 16133 15275 13661 11572 11029 C628 555 553 570 383 5888 6264 5173 3581 3820 NC
5592 E4 4640 E4 3560 E4 2838 E4 3415 TCF 200929 186343 192745 154409 129828 All Logs Canada5158 E1 4339 E1 3365 E1 2659 E1 3306 TCF 164200 151369 156912 125356 115502 C434 E1 301 E1 195 E1 179 E1 109 TCF 36729 34974 35833 29053 14326 NC
41185 E4 38984 E4 33190 E4 24219 E4 18328 TCF 21228 21271 20729 19164 17191 All Sawn39837 E8 37909 E8 32385 E8 23735 E8 18008 TCF 19281 19661 19030 17412 15811 C1348 E1 1075 E1 805 E1 484 E1 320 TCF 1947 1610 1699 1752 1380 NC1045 E4 953 E4 656 E4 514 E4 410 TCF 102 218 249 194 268 All Ven714 E1 631 E1 402 E1 295 E1 234 ITCF 82 104 125 113 171 C331 E1 322 E1 254 E1 219 E1 176 ITCF 20 114 124 81 97 NC
1118 E4 950 E4 964 E4 835 E4 346 TCF 1894 1987 2479 2223 2286 All Ply652 E1 520 E1 570 E1 445 E1 183 ITCF 1631 1859 2152 2168 1954 C466 E1 430 E1 394 E1 390 E1 163 ITCF 263 128 327 55 332 NC
9815 E4 9638 E4 9949 E4 10200 E4 8819 TCF 417210 405418 371063 327841 293807 All Logs U.S.A.7316 E1 7429 E1 7624 E1 7720 E1 6564 TCF 296454 285587 253515 218406 203956 C2499 E1 2208 E1 2326 E1 2480 E1 2255 TCF 120756 119831 117548 109435 89851 NC4380 E4 4607 E4 4128 E4 3703 E4 3599 TCF 136144 128406 113417 91303 72456 All Sawn1370 E3 1483 E8 1382 E8 1473 E8 1497 TCF 109427 102549 89328 69226 51461 C3010 E1 3123 E1 2746 E1 2229 E1 2102 TCF 26718 25857 24089 22077 20995 NC383 E4 370 E4 345 E4 280 E4 316 TCF 551 499 418 382 401 All Ven55 E1 63 E1 44 E1 29 E1 32 ITCF 271 229 119 90 111 C
328 E1 308 E1 301 E1 251 E1 284 ITCF 280 269 300 292 290 NC503 E4 492 E4 443 E4 506 E4 670 TCF 20127 19552 16356 12929 12563 All Ply341 E1 367 E1 284 E1 326 E1 450 ITCF 14502 13416 11509 9404 9075 C162 E1 125 E1 159 E1 180 E1 220 ITCF 5625 6136 4846 3525 3488 NC
1 0 2 0 0 160 136 158 212 212 All Logs1 0 0 0 0 98 86 105 154 154 C0 0 1 0 0 62 50 53 58 58 NC1 0 1 1 1 3312 3683 3594 4046 4046 All Sawn1 0 0 0 0 2788 3261 3022 3374 3374 C0 0 0 1 1 524 421 573 671 671 NC0 0 0 0 0 26 28 31 29 29 All Ven0 0 0 0 0 6 7 5 6 6 C0 0 0 0 0 20 21 26 23 23 NC2 0 1 1 1 377 429 430 513 513 All Ply0 0 0 0 0 89 133 193 187 187 C2 0 1 0 0 289 295 237 327 327 NC
NorthAmerica
Europe Non-EU
North Africa
71
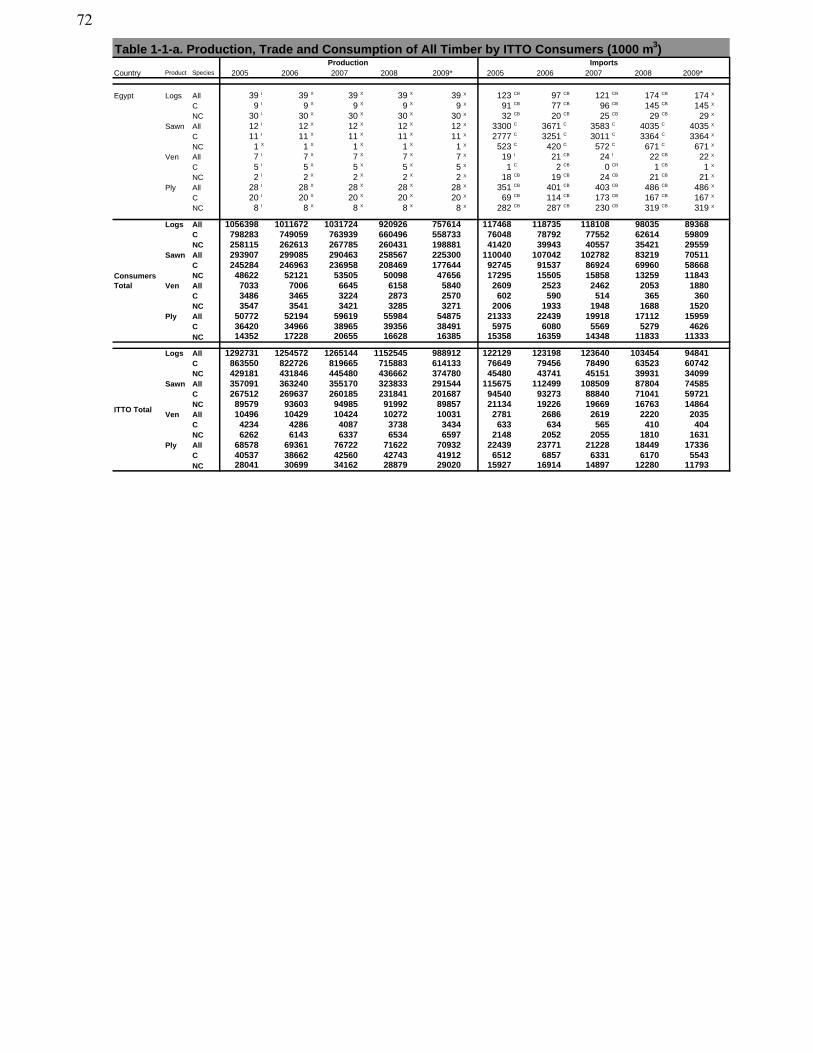
Table 1-1-a. Production, Trade and Consumption of All Timber by ITTO Consumers (1000 m3)
Country Product Species 2005 2006 2007 2008 2009* 2005 2006 2007 2008 2009*Production Imports
Egypt Logs All 39 I 39 X 39 X 39 X 39 X 123 CB 97 CB 121 CB 174 CB 174 X
C 9 I 9 X 9 X 9 X 9 X 91 CB 77 CB 96 CB 145 CB 145 X
NC 30 I 30 X 30 X 30 X 30 X 32 CB 20 CB 25 CB 29 CB 29 X
Sawn All 12 I 12 X 12 X 12 X 12 X 3300 C 3671 C 3583 C 4035 C 4035 X
C 11 I 11 X 11 X 11 X 11 X 2777 C 3251 C 3011 C 3364 C 3364 X
NC 1 X 1 X 1 X 1 X 1 X 523 C 420 C 572 C 671 C 671 X
Ven All 7 I 7 X 7 X 7 X 7 X 19 I 21 CB 24 I 22 CB 22 X
C 5 I 5 X 5 X 5 X 5 X 1 C 2 CB 0 CR 1 CB 1 X
NC 2 I 2 X 2 X 2 X 2 X 18 CB 19 CB 24 CB 21 CB 21 X
Ply All 28 I 28 X 28 X 28 X 28 X 351 CB 401 CB 403 CB 486 CB 486 X
C 20 I 20 X 20 X 20 X 20 X 69 CB 114 CB 173 CB 167 CB 167 X
NC 8 I 8 X 8 X 8 X 8 X 282 CB 287 CB 230 CB 319 CB 319 X
Logs All 1056398 1011672 1031724 920926 757614 117468 118735 118108 98035 89368C 798283 749059 763939 660496 558733 76048 78792 77552 62614 59809NC 258115 262613 267785 260431 198881 41420 39943 40557 35421 29559
Sawn All 293907 299085 290463 258567 225300 110040 107042 102782 83219 70511C 245284 246963 236958 208469 177644 92745 91537 86924 69960 58668NC 48622 52121 53505 50098 47656 17295 15505 15858 13259 11843
Ven All 7033 7006 6645 6158 5840 2609 2523 2462 2053 1880C 3486 3465 3224 2873 2570 602 590 514 365 360NC 3547 3541 3421 3285 3271 2006 1933 1948 1688 1520
Ply All 50772 52194 59619 55984 54875 21333 22439 19918 17112 15959C 36420 34966 38965 39356 38491 5975 6080 5569 5279 4626NC 14352 17228 20655 16628 16385 15358 16359 14348 11833 11333
Logs All 1292731 1254572 1265144 1152545 988912 122129 123198 123640 103454 94841C 863550 822726 819665 715883 614133 76649 79456 78490 63523 60742NC 429181 431846 445480 436662 374780 45480 43741 45151 39931 34099
Sawn All 357091 363240 355170 323833 291544 115675 112499 108509 87804 74585C 267512 269637 260185 231841 201687 94540 93273 88840 71041 59721NC 89579 93603 94985 91992 89857 21134 19226 19669 16763 14864
Ven All 10496 10429 10424 10272 10031 2781 2686 2619 2220 2035C 4234 4286 4087 3738 3434 633 634 565 410 404NC 6262 6143 6337 6534 6597 2148 2052 2055 1810 1631
Ply All 68578 69361 76722 71622 70932 22439 23771 21228 18449 17336C 40537 38662 42560 42743 41912 6512 6857 6331 6170 5543NC 28041 30699 34162 28879 29020 15927 16914 14897 12280 11793
ITTO Total
ConsumersTotal
72
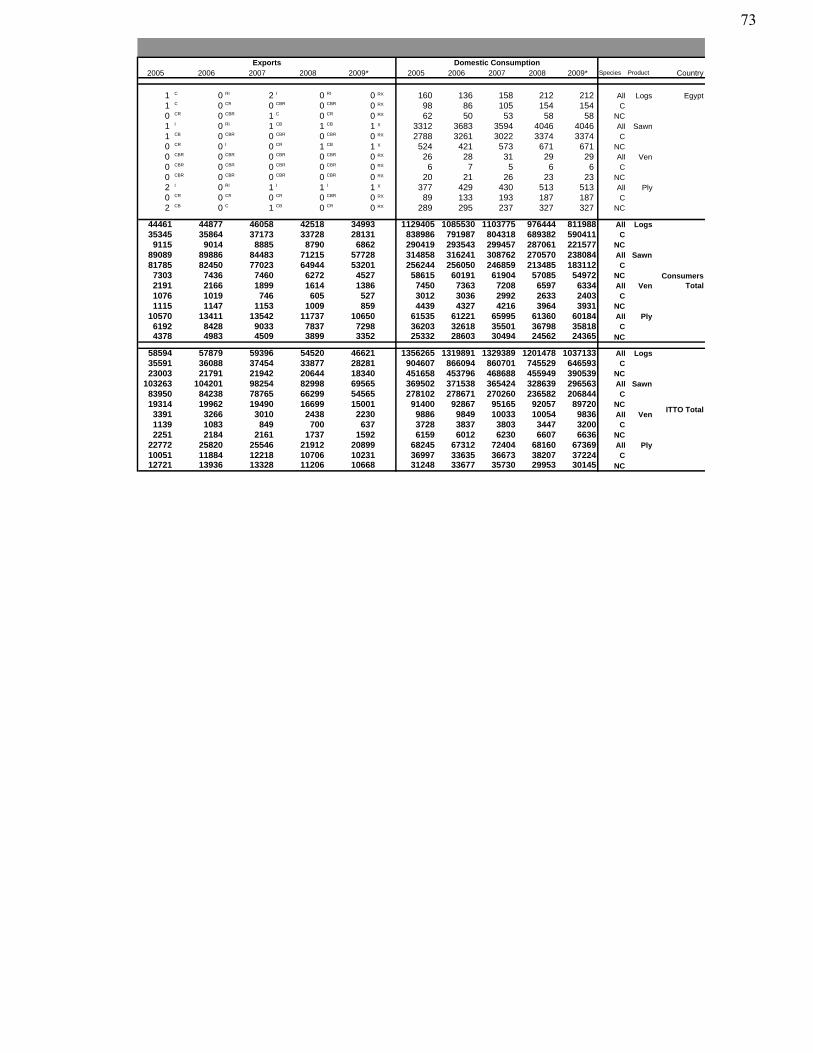
2005 2006 2007 2008 2009* 2005 2006 2007 2008 2009* Species Product CountryExports Domestic Consumption
1 C 0 RI 2 I 0 RI 0 RX 160 136 158 212 212 All Logs Egypt1 C 0 CR 0 CBR 0 CBR 0 RX 98 86 105 154 154 C0 CR 0 CBR 1 C 0 CR 0 RX 62 50 53 58 58 NC1 I 0 RI 1 CB 1 CB 1 X 3312 3683 3594 4046 4046 All Sawn1 CB 0 CBR 0 CBR 0 CBR 0 RX 2788 3261 3022 3374 3374 C0 CR 0 I 0 CR 1 CB 1 X 524 421 573 671 671 NC0 CBR 0 CBR 0 CBR 0 CBR 0 RX 26 28 31 29 29 All Ven0 CBR 0 CBR 0 CBR 0 CBR 0 RX 6 7 5 6 6 C0 CBR 0 CBR 0 CBR 0 CBR 0 RX 20 21 26 23 23 NC2 I 0 RI 1 I 1 I 1 X 377 429 430 513 513 All Ply0 CR 0 CR 0 CR 0 CBR 0 RX 89 133 193 187 187 C2 CB 0 C 1 CB 0 CR 0 RX 289 295 237 327 327 NC
44461 44877 46058 42518 34993 1129405 1085530 1103775 976444 811988 All Logs35345 35864 37173 33728 28131 838986 791987 804318 689382 590411 C9115 9014 8885 8790 6862 290419 293543 299457 287061 221577 NC
89089 89886 84483 71215 57728 314858 316241 308762 270570 238084 All Sawn81785 82450 77023 64944 53201 256244 256050 246859 213485 183112 C7303 7436 7460 6272 4527 58615 60191 61904 57085 54972 NC2191 2166 1899 1614 1386 7450 7363 7208 6597 6334 All Ven1076 1019 746 605 527 3012 3036 2992 2633 2403 C1115 1147 1153 1009 859 4439 4327 4216 3964 3931 NC
10570 13411 13542 11737 10650 61535 61221 65995 61360 60184 All Ply6192 8428 9033 7837 7298 36203 32618 35501 36798 35818 C4378 4983 4509 3899 3352 25332 28603 30494 24562 24365 NC
58594 57879 59396 54520 46621 1356265 1319891 1329389 1201478 1037133 All Logs35591 36088 37454 33877 28281 904607 866094 860701 745529 646593 C23003 21791 21942 20644 18340 451658 453796 468688 455949 390539 NC
103263 104201 98254 82998 69565 369502 371538 365424 328639 296563 All Sawn83950 84238 78765 66299 54565 278102 278671 270260 236582 206844 C19314 19962 19490 16699 15001 91400 92867 95165 92057 89720 NC3391 3266 3010 2438 2230 9886 9849 10033 10054 9836 All Ven1139 1083 849 700 637 3728 3837 3803 3447 3200 C2251 2184 2161 1737 1592 6159 6012 6230 6607 6636 NC
22772 25820 25546 21912 20899 68245 67312 72404 68160 67369 All Ply10051 11884 12218 10706 10231 36997 33635 36673 38207 37224 C12721 13936 13328 11206 10668 31248 33677 35730 29953 30145 NC
ConsumersTotal
ITTO Total
73
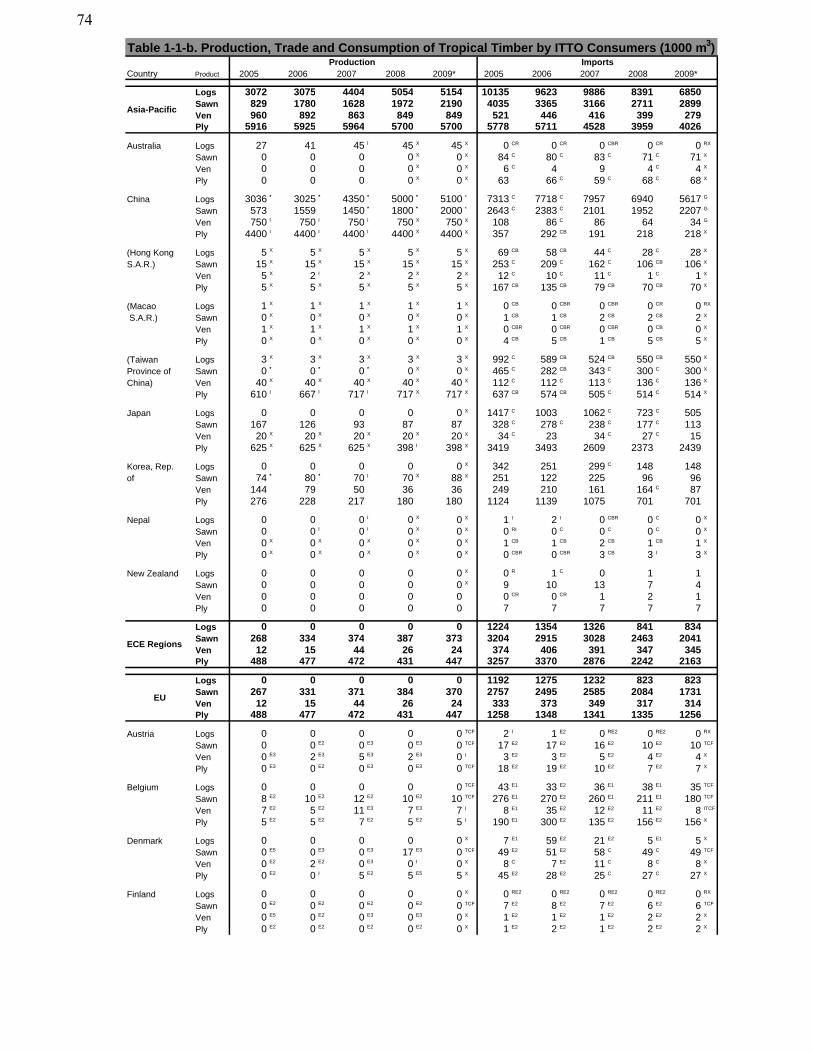
Table 1-1-b. Production, Trade and Consumption of Tropical Timber by ITTO Consumers (1000 m3)
Country Product 2005 2006 2007 2008 2009* 2005 2006 2007 2008 2009*
Logs 3072 3075 4404 5054 5154 10135 9623 9886 8391 6850Sawn 829 1780 1628 1972 2190 4035 3365 3166 2711 2899Ven 960 892 863 849 849 521 446 416 399 279Ply 5916 5925 5964 5700 5700 5778 5711 4528 3959 4026
Australia Logs 27 41 45 I 45 X 45 X 0 CR 0 CR 0 CBR 0 CR 0 RX
Sawn 0 0 0 0 X 0 X 84 C 80 C 83 C 71 C 71 X
Ven 0 0 0 0 X 0 X 6 C 4 9 4 C 4 X
Ply 0 0 0 0 X 0 X 63 66 C 59 C 68 C 68 X
China Logs 3036 * 3025 * 4350 * 5000 * 5100 * 7313 C 7718 C 7957 6940 5617 G
Sawn 573 1559 1450 * 1800 * 2000 * 2643 C 2383 C 2101 1952 2207 G
Ven 750 I 750 I 750 I 750 X 750 X 108 86 C 86 64 34 G
Ply 4400 I 4400 I 4400 I 4400 X 4400 X 357 292 CB 191 218 218 X
(Hong Kong Logs 5 X 5 X 5 X 5 X 5 X 69 CB 58 CB 44 C 28 C 28 X
S.A.R.) Sawn 15 X 15 X 15 X 15 X 15 X 253 C 209 C 162 C 106 CB 106 X
Ven 5 X 2 I 2 X 2 X 2 X 12 C 10 C 11 C 1 C 1 X
Ply 5 X 5 X 5 X 5 X 5 X 167 CB 135 CB 79 CB 70 CB 70 X
(Macao Logs 1 X 1 X 1 X 1 X 1 X 0 CB 0 CBR 0 CBR 0 CR 0 RX
S.A.R.) Sawn 0 X 0 X 0 X 0 X 0 X 1 CB 1 CB 2 CB 2 CB 2 X
Ven 1 X 1 X 1 X 1 X 1 X 0 CBR 0 CBR 0 CBR 0 CB 0 X
Ply 0 X 0 X 0 X 0 X 0 X 4 CB 5 CB 1 CB 5 CB 5 X
(Taiwan Logs 3 X 3 X 3 X 3 X 3 X 992 C 589 CB 524 CB 550 CB 550 X
Province of Sawn 0 * 0 * 0 * 0 X 0 X 465 C 282 CB 343 C 300 C 300 X
China) Ven 40 X 40 X 40 X 40 X 40 X 112 C 112 C 113 C 136 C 136 X
Ply 610 I 667 I 717 I 717 X 717 X 637 CB 574 CB 505 C 514 C 514 X
Japan Logs 0 0 0 0 0 X 1417 C 1003 1062 C 723 C 505
Sawn 167 126 93 87 87 328 C 278 C 238 C 177 C 113
Ven 20 X 20 X 20 X 20 X 20 X 34 C 23 34 C 27 C 15
Ply 625 X 625 X 625 X 398 I 398 X 3419 3493 2609 2373 2439
Korea, Rep. Logs 0 0 0 0 0 X 342 251 299 C 148 148
of Sawn 74 * 80 * 70 I 70 X 88 X 251 122 225 96 96
Ven 144 79 50 36 36 249 210 161 164 C 87
Ply 276 228 217 180 180 1124 1139 1075 701 701
Nepal Logs 0 0 0 I 0 X 0 X 1 I 2 I 0 CBR 0 C 0 X
Sawn 0 0 I 0 I 0 X 0 X 0 RI 0 C 0 C 0 C 0 X
Ven 0 X 0 X 0 X 0 X 0 X 1 CB 1 CB 2 CB 1 CB 1 X
Ply 0 X 0 X 0 X 0 X 0 X 0 CBR 0 CBR 3 CB 3 I 3 X
New Zealand Logs 0 0 0 0 0 X 0 R 1 C 0 1 1
Sawn 0 0 0 0 0 X 9 10 13 7 4
Ven 0 0 0 0 0 0 CR 0 CR 1 2 1
Ply 0 0 0 0 0 7 7 7 7 7
Logs 0 0 0 0 0 1224 1354 1326 841 834Sawn 268 334 374 387 373 3204 2915 3028 2463 2041Ven 12 15 44 26 24 374 406 391 347 345Ply 488 477 472 431 447 3257 3370 2876 2242 2163
Logs 0 0 0 0 0 1192 1275 1232 823 823Sawn 267 331 371 384 370 2757 2495 2585 2084 1731Ven 12 15 44 26 24 333 373 349 317 314Ply 488 477 472 431 447 1258 1348 1341 1335 1256
Austria Logs 0 0 0 0 0 TCF 2 I 1 E2 0 RE2 0 RE2 0 RX
Sawn 0 0 E2 0 E3 0 E3 0 TCF 17 E2 17 E2 16 E2 10 E2 10 TCF
Ven 0 E3 2 E3 5 E3 2 E3 0 I 3 E2 3 E2 5 E2 4 E2 4 X
Ply 0 E3 0 E2 0 E3 0 E3 0 TCF 18 E2 19 E2 10 E2 7 E2 7 X
Belgium Logs 0 0 0 0 0 TCF 43 E1 33 E2 36 E1 38 E1 35 TCF
Sawn 8 E2 10 E2 12 E2 10 E2 10 TCF 276 E1 270 E2 260 E1 211 E1 180 TCF
Ven 7 E2 5 E2 11 E3 7 E3 7 I 8 E1 35 E2 12 E2 11 E2 8 ITCF
Ply 5 E2 5 E2 7 E2 5 E2 5 I 190 E1 300 E2 135 E2 156 E2 156 X
Denmark Logs 0 0 0 0 0 X 7 E1 59 E2 21 E2 5 E1 5 X
Sawn 0 E5 0 E3 0 E3 17 E3 0 TCF 49 E2 51 E2 58 C 49 C 49 TCF
Ven 0 E2 2 E2 0 E3 0 I 0 X 8 C 7 E2 11 C 8 C 8 X
Ply 0 E2 0 I 5 E2 5 E5 5 X 45 E2 28 E2 25 C 27 C 27 X
Finland Logs 0 0 0 0 0 X 0 RE2 0 RE2 0 RE2 0 RE2 0 RX
Sawn 0 E2 0 E2 0 E2 0 E2 0 TCF 7 E2 8 E2 7 E2 6 E2 6 TCF
Ven 0 E5 0 E2 0 E3 0 E3 0 X 1 E2 1 E2 1 E2 2 E2 2 X
Ply 0 E2 0 E2 0 E2 0 E2 0 X 1 E2 2 E2 1 E2 2 E2 2 X
Production Imports
EU
Asia-Pacific
ECE Regions
74
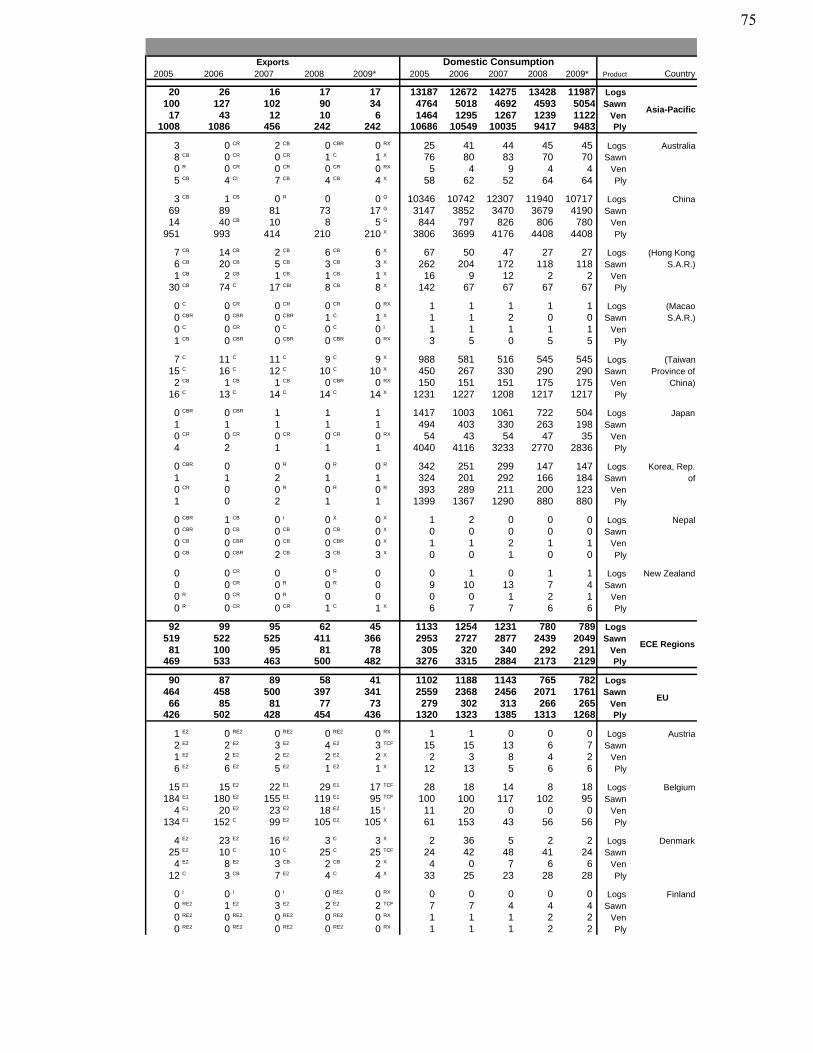
2005 2006 2007 2008 2009* 2005 2006 2007 2008 2009* Product Country
20 26 16 17 17 13187 12672 14275 13428 11987 Logs100 127 102 90 34 4764 5018 4692 4593 5054 Sawn17 43 12 10 6 1464 1295 1267 1239 1122 Ven
1008 1086 456 242 242 10686 10549 10035 9417 9483 Ply
3 0 CR 2 CB 0 CBR 0 RX 25 41 44 45 45 Logs Australia8 CB 0 CR 0 CR 1 C 1 X 76 80 83 70 70 Sawn0 R 0 CR 0 CR 0 CR 0 RX 5 4 9 4 4 Ven5 CB 4 CI 7 CB 4 CB 4 X 58 62 52 64 64 Ply
3 CB 1 CB 0 R 0 0 G 10346 10742 12307 11940 10717 Logs China69 89 81 73 17 G 3147 3852 3470 3679 4190 Sawn14 40 CB 10 8 5 G 844 797 826 806 780 Ven
951 993 414 210 210 X 3806 3699 4176 4408 4408 Ply
7 CB 14 CB 2 CB 6 CB 6 X 67 50 47 27 27 Logs (Hong Kong6 CB 20 CB 5 CB 3 CB 3 X 262 204 172 118 118 Sawn S.A.R.)1 CB 2 CB 1 CB 1 CB 1 X 16 9 12 2 2 Ven
30 CB 74 C 17 CBI 8 CB 8 X 142 67 67 67 67 Ply
0 C 0 CR 0 CR 0 CR 0 RX 1 1 1 1 1 Logs (Macao0 CBR 0 CBR 0 CBR 1 C 1 X 1 1 2 0 0 Sawn S.A.R.)0 C 0 CR 0 C 0 C 0 I 1 1 1 1 1 Ven1 CB 0 CBR 0 CBR 0 CBR 0 RX 3 5 0 5 5 Ply
7 C 11 C 11 C 9 C 9 X 988 581 516 545 545 Logs (Taiwan15 C 16 C 12 C 10 C 10 X 450 267 330 290 290 Sawn Province of2 CB 1 CB 1 CB 0 CBR 0 RX 150 151 151 175 175 Ven China)
16 C 13 C 14 C 14 C 14 X 1231 1227 1208 1217 1217 Ply
0 CBR 0 CBR 1 1 1 1417 1003 1061 722 504 Logs Japan1 1 1 1 1 494 403 330 263 198 Sawn0 CR 0 CR 0 CR 0 CR 0 RX 54 43 54 47 35 Ven4 2 1 1 1 4040 4116 3233 2770 2836 Ply
0 CBR 0 0 R 0 R 0 R 342 251 299 147 147 Logs Korea, Rep.1 1 2 1 1 324 201 292 166 184 Sawn of0 CR 0 0 R 0 R 0 R 393 289 211 200 123 Ven1 0 2 1 1 1399 1367 1290 880 880 Ply
0 CBR 1 CB 0 I 0 X 0 X 1 2 0 0 0 Logs Nepal0 CBR 0 CB 0 CB 0 CB 0 X 0 0 0 0 0 Sawn0 CB 0 CBR 0 CB 0 CBR 0 X 1 1 2 1 1 Ven0 CB 0 CBR 2 CB 3 CB 3 X 0 0 1 0 0 Ply
0 0 CR 0 0 R 0 0 1 0 1 1 Logs New Zealand0 0 CR 0 R 0 R 0 9 10 13 7 4 Sawn0 R 0 CR 0 R 0 0 0 0 1 2 1 Ven0 R 0 CR 0 CR 1 C 1 X 6 7 7 6 6 Ply
92 99 95 62 45 1133 1254 1231 780 789 Logs519 522 525 411 366 2953 2727 2877 2439 2049 Sawn81 100 95 81 78 305 320 340 292 291 Ven
469 533 463 500 482 3276 3315 2884 2173 2129 Ply
90 87 89 58 41 1102 1188 1143 765 782 Logs464 458 500 397 341 2559 2368 2456 2071 1761 Sawn66 85 81 77 73 279 302 313 266 265 Ven
426 502 428 454 436 1320 1323 1385 1313 1268 Ply
1 E2 0 RE2 0 RE2 0 RE2 0 RX 1 1 0 0 0 Logs Austria2 E2 2 E2 3 E2 4 E2 3 TCF 15 15 13 6 7 Sawn1 E2 2 E2 2 E2 2 E2 2 X 2 3 8 4 2 Ven6 E2 6 E2 5 E2 1 E2 1 X 12 13 5 6 6 Ply
15 E1 15 E2 22 E1 29 E1 17 TCF 28 18 14 8 18 Logs Belgium184 E1 180 E2 155 E1 119 E1 95 TCF 100 100 117 102 95 Sawn
4 E1 20 E2 23 E2 18 E2 15 I 11 20 0 0 0 Ven134 E1 152 C 99 E2 105 E2 105 X 61 153 43 56 56 Ply
4 E2 23 E2 16 E2 3 C 3 X 2 36 5 2 2 Logs Denmark25 E2 10 C 10 C 25 C 25 TCF 24 42 48 41 24 Sawn4 E2 8 E2 3 CB 2 CB 2 X 4 0 7 6 6 Ven
12 C 3 CB 7 E2 4 C 4 X 33 25 23 28 28 Ply
0 I 0 I 0 I 0 RE2 0 RX 0 0 0 0 0 Logs Finland0 RE2 1 E2 3 E2 2 E2 2 TCF 7 7 4 4 4 Sawn0 RE2 0 RE2 0 RE2 0 RE2 0 RX 1 1 1 2 2 Ven0 RE2 0 RE2 0 RE2 0 RE2 0 RX 1 1 1 2 2 Ply
Exports Domestic Consumption
Asia-Pacific
ECE Regions
EU
75
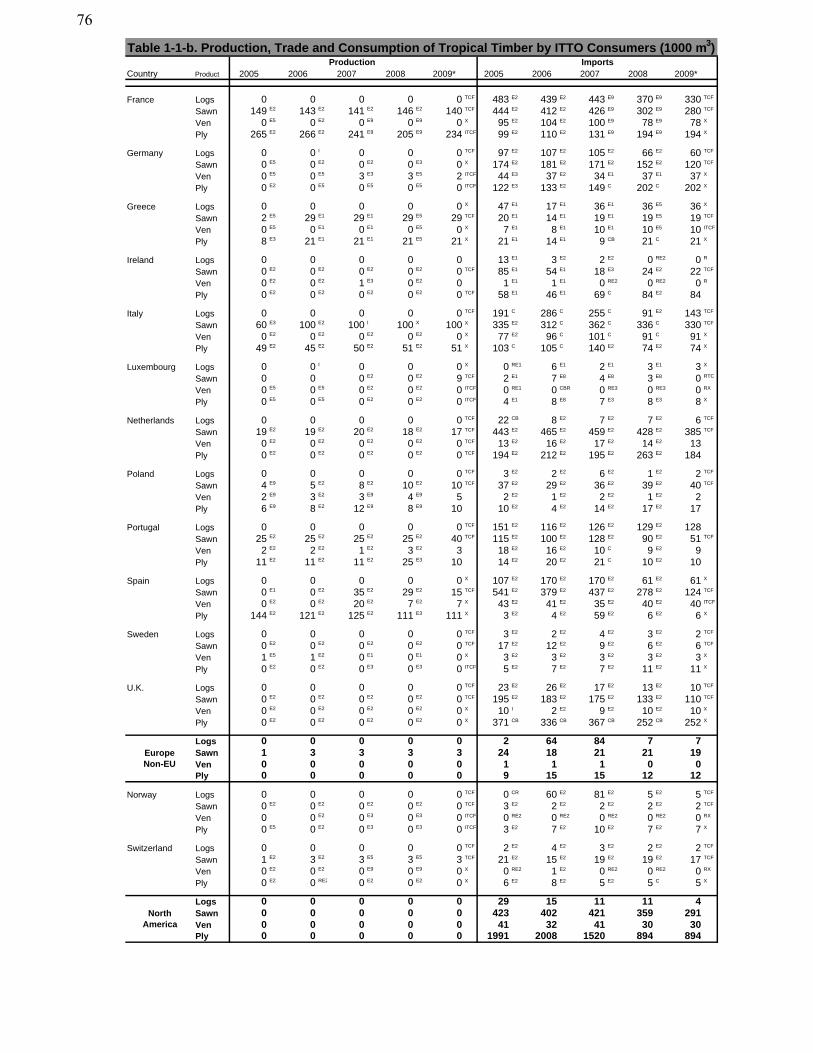
Table 1-1-b. Production, Trade and Consumption of Tropical Timber by ITTO Consumers (1000 m3)
Country Product 2005 2006 2007 2008 2009* 2005 2006 2007 2008 2009*Production Imports
France Logs 0 0 0 0 0 TCF 483 E2 439 E2 443 E9 370 E9 330 TCF
Sawn 149 E2 143 E2 141 E2 146 E2 140 TCF 444 E2 412 E2 426 E9 302 E9 280 TCF
Ven 0 E5 0 E2 0 E9 0 E9 0 X 95 E2 104 E2 100 E9 78 E9 78 X
Ply 265 E2 266 E2 241 E9 205 E9 234 ITCF 99 E2 110 E2 131 E9 194 E9 194 X
Germany Logs 0 0 I 0 0 0 TCF 97 E2 107 E2 105 E2 66 E2 60 TCF
Sawn 0 E5 0 E2 0 E2 0 E3 0 X 174 E2 181 E2 171 E2 152 E2 120 TCF
Ven 0 E5 0 E5 3 E3 3 E5 2 ITCF 44 E3 37 E2 34 E1 37 E1 37 X
Ply 0 E2 0 E5 0 E5 0 E5 0 ITCF 122 E3 133 E2 149 C 202 C 202 X
Greece Logs 0 0 0 0 0 X 47 E1 17 E1 36 E1 36 E5 36 X
Sawn 2 E5 29 E1 29 E1 29 E5 29 TCF 20 E1 14 E1 19 E1 19 E5 19 TCF
Ven 0 E5 0 E1 0 E1 0 E5 0 X 7 E1 8 E1 10 E1 10 E5 10 ITCF
Ply 8 E3 21 E1 21 E1 21 E5 21 X 21 E1 14 E1 9 CB 21 C 21 X
Ireland Logs 0 0 0 0 0 13 E1 3 E2 2 E2 0 RE2 0 R
Sawn 0 E2 0 E2 0 E2 0 E2 0 TCF 85 E1 54 E1 18 E3 24 E2 22 TCF
Ven 0 E2 0 E2 1 E3 0 E2 0 1 E1 1 E1 0 RE2 0 RE2 0 R
Ply 0 E2 0 E2 0 E2 0 E2 0 TCF 58 E1 46 E1 69 C 84 E2 84
Italy Logs 0 0 0 0 0 TCF 191 C 286 C 255 C 91 E2 143 TCF
Sawn 60 E3 100 E2 100 I 100 X 100 X 335 E2 312 C 362 C 336 C 330 TCF
Ven 0 E2 0 E2 0 E2 0 E2 0 X 77 E2 96 C 101 C 91 C 91 X
Ply 49 E2 45 E2 50 E2 51 E2 51 X 103 C 105 C 140 E2 74 E2 74 X
Luxembourg Logs 0 0 I 0 0 0 X 0 RE1 6 E1 2 E1 3 E1 3 X
Sawn 0 0 0 E2 0 E2 9 TCF 2 E1 7 E8 4 E8 3 E8 0 RTC
Ven 0 E5 0 E5 0 E2 0 E2 0 ITCF 0 RE1 0 CBR 0 RE3 0 RE3 0 RX
Ply 0 E5 0 E5 0 E2 0 E2 0 ITCF 4 E1 8 E8 7 E3 8 E3 8 X
Netherlands Logs 0 0 0 0 0 TCF 22 CB 8 E2 7 E2 7 E2 6 TCF
Sawn 19 E2 19 E2 20 E2 18 E2 17 TCF 443 E2 465 E2 459 E2 428 E2 385 TCF
Ven 0 E2 0 E2 0 E2 0 E2 0 TCF 13 E2 16 E2 17 E2 14 E2 13
Ply 0 E2 0 E2 0 E2 0 E2 0 TCF 194 E2 212 E2 195 E2 263 E2 184
Poland Logs 0 0 0 0 0 TCF 3 E2 2 E2 6 E2 1 E2 2 TCF
Sawn 4 E9 5 E2 8 E2 10 E2 10 TCF 37 E2 29 E2 36 E2 39 E2 40 TCF
Ven 2 E9 3 E2 3 E9 4 E9 5 2 E2 1 E2 2 E2 1 E2 2
Ply 6 E9 8 E2 12 E9 8 E9 10 10 E2 4 E2 14 E2 17 E2 17
Portugal Logs 0 0 0 0 0 TCF 151 E2 116 E2 126 E2 129 E2 128
Sawn 25 E2 25 E2 25 E2 25 E2 40 TCF 115 E2 100 E2 128 E2 90 E2 51 TCF
Ven 2 E2 2 E2 1 E2 3 E2 3 18 E2 16 E2 10 C 9 E2 9
Ply 11 E2 11 E2 11 E2 25 E3 10 14 E2 20 E2 21 C 10 E2 10
Spain Logs 0 0 0 0 0 X 107 E2 170 E2 170 E2 61 E2 61 X
Sawn 0 E1 0 E2 35 E2 29 E2 15 TCF 541 E2 379 E2 437 E2 278 E2 124 TCF
Ven 0 E2 0 E2 20 E2 7 E2 7 X 43 E2 41 E2 35 E2 40 E2 40 ITCF
Ply 144 E2 121 E2 125 E2 111 E3 111 X 3 E2 4 E2 59 E2 6 E2 6 X
Sweden Logs 0 0 0 0 0 TCF 3 E2 2 E2 4 E2 3 E2 2 TCF
Sawn 0 E2 0 E2 0 E2 0 E2 0 TCF 17 E2 12 E2 9 E2 6 E2 6 TCF
Ven 1 E5 1 E2 0 E1 0 E1 0 X 3 E2 3 E2 3 E2 3 E2 3 X
Ply 0 E2 0 E2 0 E3 0 E3 0 ITCF 5 E2 7 E2 7 E2 11 E2 11 X
U.K. Logs 0 0 0 0 0 TCF 23 E2 26 E2 17 E2 13 E2 10 TCF
Sawn 0 E2 0 E2 0 E2 0 E2 0 TCF 195 E2 183 E2 175 E2 133 E2 110 TCF
Ven 0 E2 0 E2 0 E2 0 E2 0 X 10 I 2 E2 9 E2 10 E2 10 X
Ply 0 E2 0 E2 0 E2 0 E2 0 X 371 CB 336 CB 367 CB 252 CB 252 X
Logs 0 0 0 0 0 2 64 84 7 7Sawn 1 3 3 3 3 24 18 21 21 19Ven 0 0 0 0 0 1 1 1 0 0Ply 0 0 0 0 0 9 15 15 12 12
Norway Logs 0 0 0 0 0 TCF 0 CR 60 E2 81 E2 5 E2 5 TCF
Sawn 0 E2 0 E2 0 E2 0 E2 0 TCF 3 E2 2 E2 2 E2 2 E2 2 TCF
Ven 0 0 E2 0 E3 0 E3 0 ITCF 0 RE2 0 RE2 0 RE2 0 RE2 0 RX
Ply 0 E5 0 E2 0 E3 0 E3 0 ITCF 3 E2 7 E2 10 E2 7 E2 7 X
Switzerland Logs 0 0 0 0 0 TCF 2 E2 4 E2 3 E2 2 E2 2 TCF
Sawn 1 E2 3 E2 3 E5 3 E5 3 TCF 21 E2 15 E2 19 E2 19 E2 17 TCF
Ven 0 E2 0 E2 0 E9 0 E9 0 X 0 RE2 1 E2 0 RE2 0 RE2 0 RX
Ply 0 E2 0 RE2 0 E2 0 E2 0 X 6 E2 8 E2 5 E2 5 C 5 X
Logs 0 0 0 0 0 29 15 11 11 4Sawn 0 0 0 0 0 423 402 421 359 291Ven 0 0 0 0 0 41 32 41 30 30Ply 0 0 0 0 0 1991 2008 1520 894 894
Europe Non-EU
North America
76
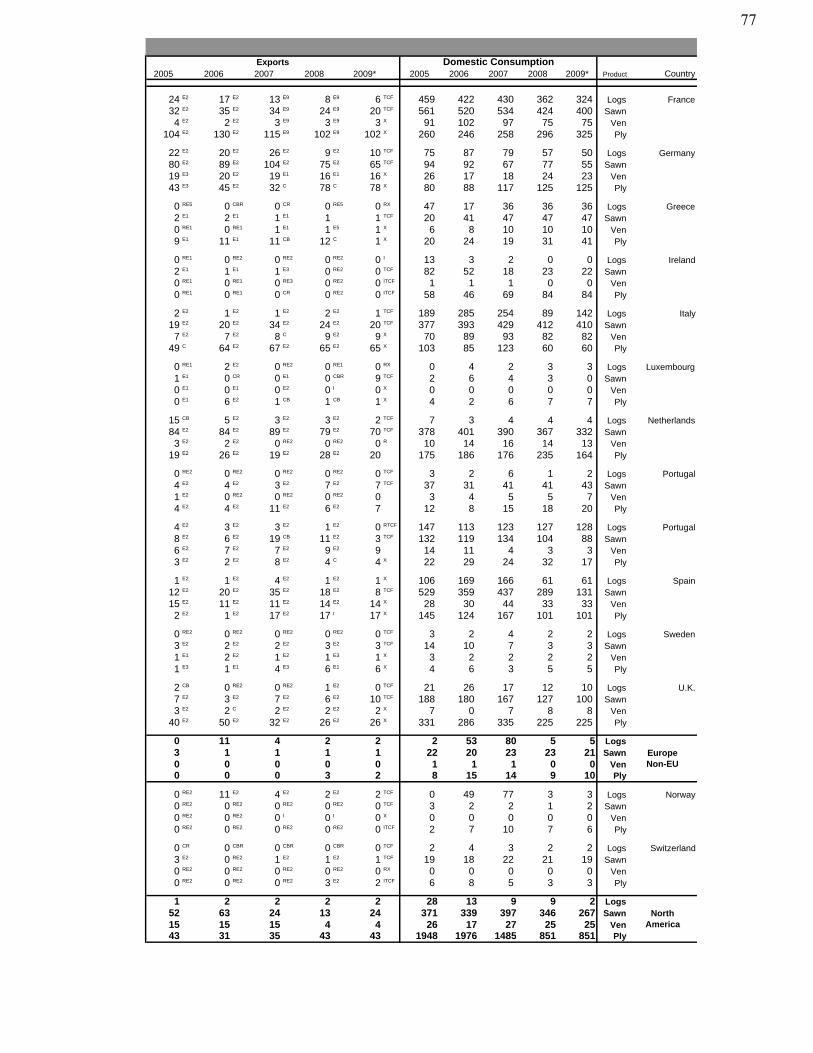
2005 2006 2007 2008 2009* 2005 2006 2007 2008 2009* Product CountryExports Domestic Consumption
24 E2 17 E2 13 E9 8 E9 6 TCF 459 422 430 362 324 Logs France32 E2 35 E2 34 E9 24 E9 20 TCF 561 520 534 424 400 Sawn4 E2 2 E2 3 E9 3 E9 3 X 91 102 97 75 75 Ven
104 E2 130 E2 115 E9 102 E9 102 X 260 246 258 296 325 Ply
22 E2 20 E2 26 E2 9 E2 10 TCF 75 87 79 57 50 Logs Germany80 E2 89 E2 104 E2 75 E2 65 TCF 94 92 67 77 55 Sawn19 E3 20 E2 19 E1 16 E1 16 X 26 17 18 24 23 Ven43 E3 45 E2 32 C 78 C 78 X 80 88 117 125 125 Ply
0 RE5 0 CBR 0 CR 0 RE5 0 RX 47 17 36 36 36 Logs Greece2 E1 2 E1 1 E1 1 1 TCF 20 41 47 47 47 Sawn0 RE1 0 RE1 1 E1 1 E5 1 X 6 8 10 10 10 Ven9 E1 11 E1 11 CB 12 C 1 X 20 24 19 31 41 Ply
0 RE1 0 RE2 0 RE2 0 RE2 0 I 13 3 2 0 0 Logs Ireland2 E1 1 E1 1 E3 0 RE2 0 TCF 82 52 18 23 22 Sawn0 RE1 0 RE1 0 RE3 0 RE2 0 ITCF 1 1 1 0 0 Ven0 RE1 0 RE1 0 CR 0 RE2 0 ITCF 58 46 69 84 84 Ply
2 E2 1 E2 1 E2 2 E2 1 TCF 189 285 254 89 142 Logs Italy19 E2 20 E2 34 E2 24 E2 20 TCF 377 393 429 412 410 Sawn7 E2 7 E2 8 C 9 E2 9 X 70 89 93 82 82 Ven
49 C 64 E2 67 E2 65 E2 65 X 103 85 123 60 60 Ply
0 RE1 2 E2 0 RE2 0 RE1 0 RX 0 4 2 3 3 Logs Luxembourg1 E1 0 CR 0 E1 0 CBR 9 TCF 2 6 4 3 0 Sawn0 E1 0 E1 0 E2 0 I 0 X 0 0 0 0 0 Ven0 E1 6 E2 1 CB 1 CB 1 X 4 2 6 7 7 Ply
15 CB 5 E2 3 E2 3 E2 2 TCF 7 3 4 4 4 Logs Netherlands84 E2 84 E2 89 E2 79 E2 70 TCF 378 401 390 367 332 Sawn3 E2 2 E2 0 RE2 0 RE2 0 R 10 14 16 14 13 Ven
19 E2 26 E2 19 E2 28 E2 20 175 186 176 235 164 Ply
0 RE2 0 RE2 0 RE2 0 RE2 0 TCF 3 2 6 1 2 Logs Portugal4 E2 4 E2 3 E2 7 E2 7 TCF 37 31 41 41 43 Sawn1 E2 0 RE2 0 RE2 0 RE2 0 3 4 5 5 7 Ven4 E2 4 E2 11 E2 6 E2 7 12 8 15 18 20 Ply
4 E2 3 E2 3 E2 1 E2 0 RTCF 147 113 123 127 128 Logs Portugal8 E2 6 E2 19 CB 11 E2 3 TCF 132 119 134 104 88 Sawn6 E2 7 E2 7 E2 9 E2 9 14 11 4 3 3 Ven3 E2 2 E2 8 E2 4 C 4 X 22 29 24 32 17 Ply
1 E2 1 E2 4 E2 1 E2 1 X 10⁶ 169 166 61 61 Logs Spain12 E2 20 E2 35 E2 18 E2 8 TCF 529 359 437 289 131 Sawn15 E2 11 E2 11 E2 14 E2 14 X 28 30 44 33 33 Ven2 E2 1 E2 17 E2 17 I 17 X 145 124 167 101 101 Ply
0 RE2 0 RE2 0 RE2 0 RE2 0 TCF 3 2 4 2 2 Logs Sweden3 E2 2 E2 2 E2 3 E2 3 TCF 14 10 7 3 3 Sawn1 E1 2 E2 1 E2 1 E3 1 X 3 2 2 2 2 Ven1 E3 1 E1 4 E3 6 E1 6 X 4 6 3 5 5 Ply
2 CB 0 RE2 0 RE2 1 E2 0 TCF 21 26 17 12 10 Logs U.K.7 E2 3 E2 7 E2 6 E2 10 TCF 188 180 167 127 100 Sawn3 E2 2 C 2 E2 2 E2 2 X 7 0 7 8 8 Ven
40 E2 50 E2 32 E2 26 E2 26 X 331 286 335 225 225 Ply
0 11 4 2 2 2 53 80 5 5 Logs3 1 1 1 1 22 20 23 23 21 Sawn0 0 0 0 0 1 1 1 0 0 Ven0 0 0 3 2 8 15 14 9 10 Ply
0 RE2 11 E2 4 E2 2 E2 2 TCF 0 49 77 3 3 Logs Norway0 RE2 0 RE2 0 RE2 0 RE2 0 TCF 3 2 2 1 2 Sawn0 RE2 0 RE2 0 I 0 I 0 X 0 0 0 0 0 Ven0 RE2 0 RE2 0 RE2 0 RE2 0 ITCF 2 7 10 7 6 Ply
0 CR 0 CBR 0 CBR 0 CBR 0 TCF 2 4 3 2 2 Logs Switzerland3 E2 0 RE2 1 E2 1 E2 1 TCF 19 18 22 21 19 Sawn0 RE2 0 RE2 0 RE2 0 RE2 0 RX 0 0 0 0 0 Ven0 RE2 0 RE2 0 RE2 3 E2 2 ITCF 6 8 5 3 3 Ply
1 2 2 2 2 28 13 9 9 2 Logs52 63 24 13 24 371 339 397 346 267 Sawn15 15 15 4 4 26 17 27 25 25 Ven43 31 35 43 43 1948 1976 1485 851 851 Ply
Europe Non-EU
North America
77
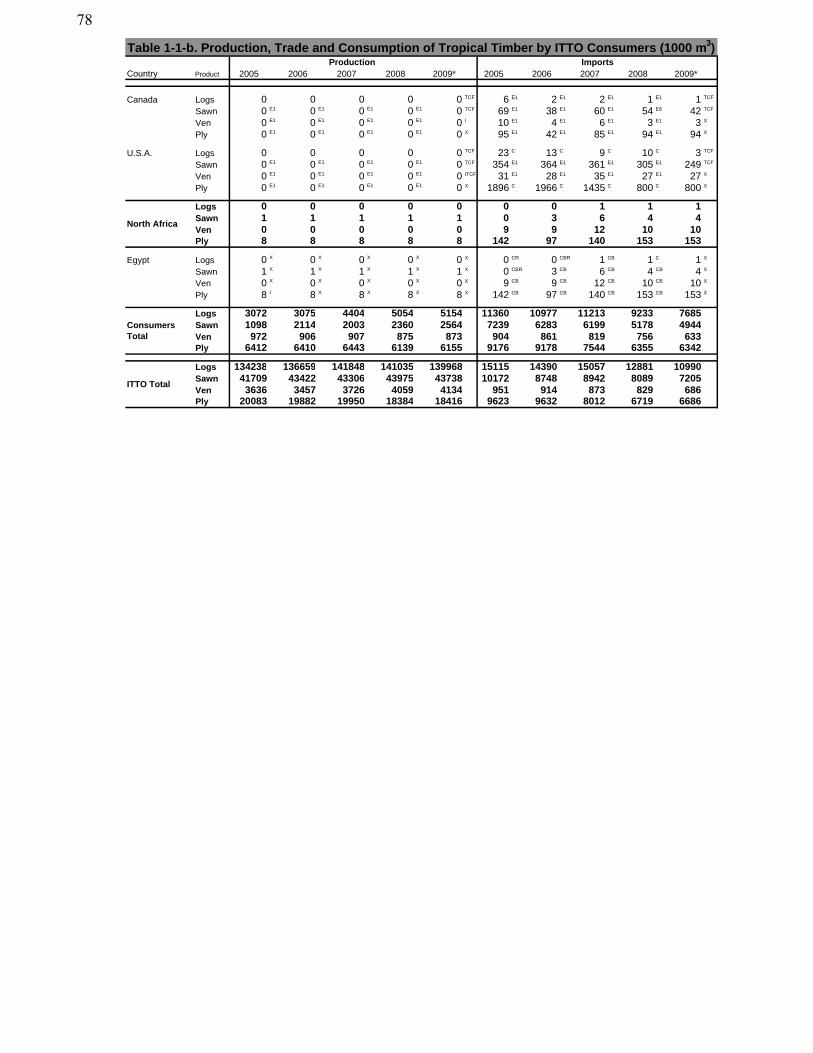
Table 1-1-b. Production, Trade and Consumption of Tropical Timber by ITTO Consumers (1000 m3)
Country Product 2005 2006 2007 2008 2009* 2005 2006 2007 2008 2009*Production Imports
Canada Logs 0 0 0 0 0 TCF 6 E1 2 E1 2 E1 1 E1 1 TCF
Sawn 0 E1 0 E1 0 E1 0 E1 0 TCF 69 E1 38 E1 60 E1 54 E8 42 TCF
Ven 0 E1 0 E1 0 E1 0 E1 0 I 10 E1 4 E1 6 E1 3 E1 3 X
Ply 0 E1 0 E1 0 E1 0 E1 0 X 95 E1 42 E1 85 E1 94 E1 94 X
U.S.A. Logs 0 0 0 0 0 TCF 23 C 13 C 9 C 10 C 3 TCF
Sawn 0 E1 0 E1 0 E1 0 E1 0 TCF 354 E1 364 E1 361 E1 305 E1 249 TCF
Ven 0 E1 0 E1 0 E1 0 E1 0 ITCF 31 E1 28 E1 35 E1 27 E1 27 X
Ply 0 E1 0 E1 0 E1 0 E1 0 X 1896 C 1966 C 1435 C 800 C 800 X
Logs 0 0 0 0 0 0 0 1 1 1Sawn 1 1 1 1 1 0 3 6 4 4Ven 0 0 0 0 0 9 9 12 10 10Ply 8 8 8 8 8 142 97 140 153 153
Egypt Logs 0 X 0 X 0 X 0 X 0 X 0 CR 0 CBR 1 CB 1 C 1 X
Sawn 1 X 1 X 1 X 1 X 1 X 0 CBR 3 CB 6 CB 4 CB 4 X
Ven 0 X 0 X 0 X 0 X 0 X 9 CB 9 CB 12 CB 10 CB 10 X
Ply 8 I 8 X 8 X 8 X 8 X 142 CB 97 CB 140 CB 153 CB 153 X
Logs 3072 3075 4404 5054 5154 11360 10977 11213 9233 7685Sawn 1098 2114 2003 2360 2564 7239 6283 6199 5178 4944Ven 972 906 907 875 873 904 861 819 756 633Ply 6412 6410 6443 6139 6155 9176 9178 7544 6355 6342
Logs 134238 136659 141848 141035 139968 15115 14390 15057 12881 10990Sawn 41709 43422 43306 43975 43738 10172 8748 8942 8089 7205Ven 3636 3457 3726 4059 4134 951 914 873 829 686Ply 20083 19882 19950 18384 18416 9623 9632 8012 6719 6686
ConsumersTotal
ITTO Total
North Africa
78
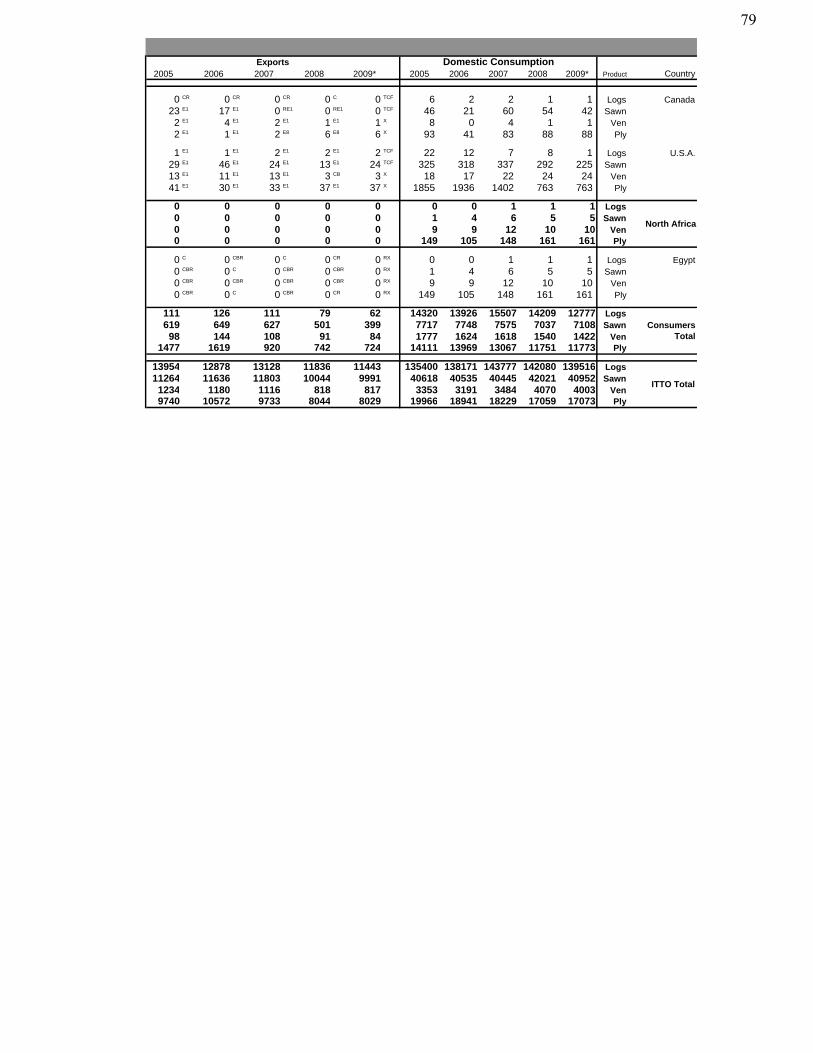
2005 2006 2007 2008 2009* 2005 2006 2007 2008 2009* Product CountryExports Domestic Consumption
0 CR 0 CR 0 CR 0 C 0 TCF 6 2 2 1 1 Logs Canada23 E1 17 E1 0 RE1 0 RE1 0 TCF 46 21 60 54 42 Sawn2 E1 4 E1 2 E1 1 E1 1 X 8 0 4 1 1 Ven2 E1 1 E1 2 E8 6 E8 6 X 93 41 83 88 88 Ply
1 E1 1 E1 2 E1 2 E1 2 TCF 22 12 7 8 1 Logs U.S.A.29 E1 46 E1 24 E1 13 E1 24 TCF 325 318 337 292 225 Sawn13 E1 11 E1 13 E1 3 CB 3 X 18 17 22 24 24 Ven41 E1 30 E1 33 E1 37 E1 37 X 1855 1936 1402 763 763 Ply
0 0 0 0 0 0 0 1 1 1 Logs0 0 0 0 0 1 4 6 5 5 Sawn0 0 0 0 0 9 9 12 10 10 Ven0 0 0 0 0 149 105 148 161 161 Ply
0 C 0 CBR 0 C 0 CR 0 RX 0 0 1 1 1 Logs Egypt0 CBR 0 C 0 CBR 0 CBR 0 RX 1 4 6 5 5 Sawn0 CBR 0 CBR 0 CBR 0 CBR 0 RX 9 9 12 10 10 Ven0 CBR 0 C 0 CBR 0 CR 0 RX 149 105 148 161 161 Ply
111 126 111 79 62 14320 13926 15507 14209 12777 Logs619 649 627 501 399 7717 7748 7575 7037 7108 Sawn98 144 108 91 84 1777 1624 1618 1540 1422 Ven
1477 1619 920 742 724 14111 13969 13067 11751 11773 Ply
13954 12878 13128 11836 11443 135400 138171 143777 142080 139516 Logs11264 11636 11803 10044 9991 40618 40535 40445 42021 40952 Sawn1234 1180 1116 818 817 3353 3191 3484 4070 4003 Ven9740 10572 9733 8044 8029 19966 18941 18229 17059 17073 Ply
ITTO Total
North Africa
ConsumersTotal
79
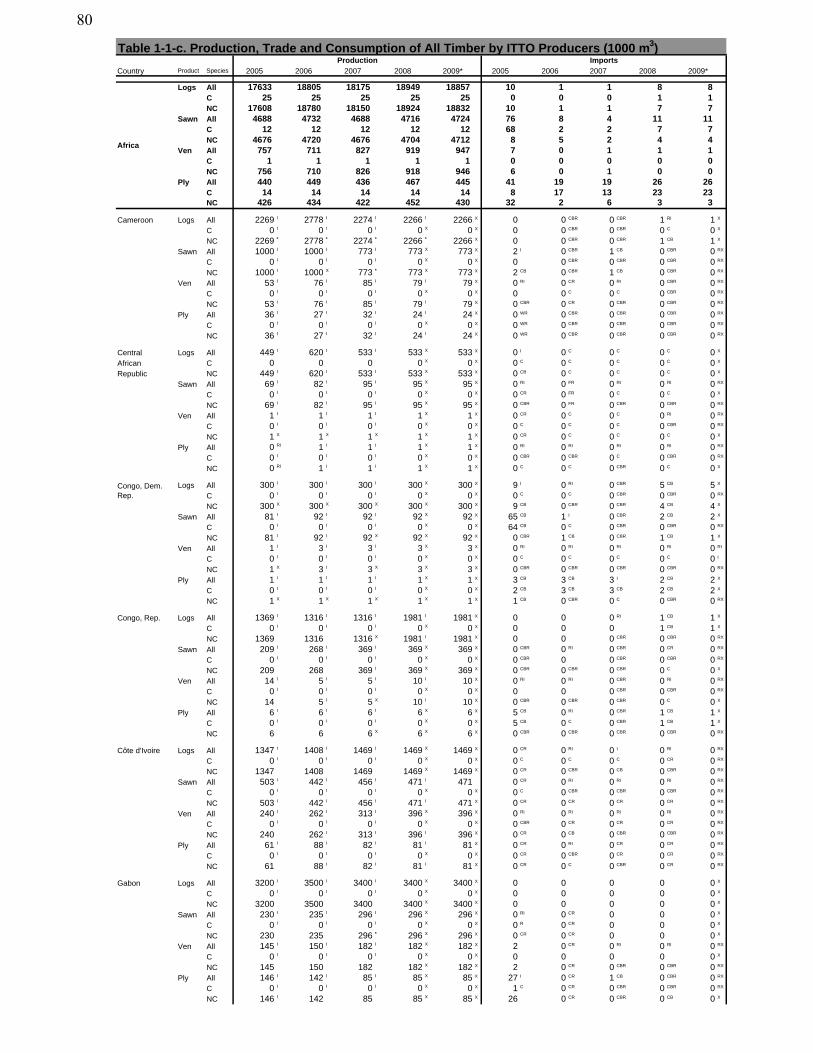
Table 1-1-c. Production, Trade and Consumption of All Timber by ITTO Producers (1000 m3)
Country Product Species 2005 2006 2007 2008 2009* 2005 2006 2007 2008 2009*
Logs All 17633 18805 18175 18949 18857 10 1 1 8 8C 25 25 25 25 25 0 0 0 1 1NC 17608 18780 18150 18924 18832 10 1 1 7 7
Sawn All 4688 4732 4688 4716 4724 76 8 4 11 11C 12 12 12 12 12 68 2 2 7 7NC 4676 4720 4676 4704 4712 8 5 2 4 4
Ven All 757 711 827 919 947 7 0 1 1 1C 1 1 1 1 1 0 0 0 0 0NC 756 710 826 918 946 6 0 1 0 0
Ply All 440 449 436 467 445 41 19 19 26 26C 14 14 14 14 14 8 17 13 23 23NC 426 434 422 452 430 32 2 6 3 3
Cameroon Logs All 2269 I 2778 I 2274 I 2266 I 2266 X 0 0 CBR 0 CBR 1 RI 1 X
C 0 I 0 I 0 I 0 X 0 X 0 0 CBR 0 CBR 0 C 0 X
NC 2269 * 2778 * 2274 * 2266 * 2266 X 0 0 CBR 0 CBR 1 CB 1 X
Sawn All 1000 I 1000 I 773 I 773 X 773 X 2 I 0 CBR 1 CB 0 CBR 0 RX
C 0 I 0 I 0 I 0 X 0 X 0 0 CBR 0 CBR 0 CBR 0 RX
NC 1000 I 1000 X 773 * 773 X 773 X 2 CB 0 CBR 1 CB 0 CBR 0 RX
Ven All 53 I 76 I 85 I 79 I 79 X 0 RI 0 CR 0 RI 0 CBR 0 RX
C 0 I 0 I 0 I 0 X 0 X 0 0 C 0 C 0 CBR 0 RX
NC 53 I 76 I 85 I 79 I 79 X 0 CBR 0 CR 0 CBR 0 CBR 0 RX
Ply All 36 I 27 I 32 I 24 I 24 X 0 WR 0 CBR 0 CBR 0 CBR 0 RX
C 0 I 0 I 0 I 0 X 0 X 0 WR 0 CBR 0 CBR 0 CBR 0 RX
NC 36 I 27 I 32 I 24 I 24 X 0 WR 0 CBR 0 CBR 0 CBR 0 RX
Central Logs All 449 I 620 I 533 I 533 X 533 X 0 I 0 C 0 C 0 C 0 X
African C 0 0 0 0 X 0 X 0 C 0 C 0 C 0 C 0 X
Republic NC 449 I 620 I 533 I 533 X 533 X 0 CB 0 C 0 C 0 C 0 X
Sawn All 69 I 82 I 95 I 95 X 95 X 0 RI 0 FR 0 RI 0 RI 0 RX
C 0 I 0 I 0 I 0 X 0 X 0 CR 0 FR 0 C 0 C 0 X
NC 69 I 82 I 95 I 95 X 95 X 0 CBR 0 FR 0 CBR 0 CBR 0 RX
Ven All 1 I 1 I 1 I 1 X 1 X 0 CR 0 C 0 C 0 RI 0 RX
C 0 I 0 I 0 I 0 X 0 X 0 C 0 C 0 C 0 CBR 0 RX
NC 1 X 1 X 1 X 1 X 1 X 0 CR 0 C 0 C 0 C 0 X
Ply All 0 RI 1 I 1 I 1 X 1 X 0 RI 0 RI 0 RI 0 RI 0 RX
C 0 I 0 I 0 I 0 X 0 X 0 CBR 0 CBR 0 C 0 CBR 0 RX
NC 0 RI 1 I 1 I 1 X 1 X 0 C 0 C 0 CBR 0 C 0 X
Logs All 300 I 300 I 300 I 300 X 300 X 9 I 0 RI 0 CBR 5 CB 5 X
C 0 I 0 I 0 I 0 X 0 X 0 C 0 C 0 CBR 0 CBR 0 RX
NC 300 X 300 X 300 X 300 X 300 X 9 CB 0 CBR 0 CBR 4 CB 4 X
Sawn All 81 I 92 I 92 I 92 X 92 X 65 CB 1 I 0 CBR 2 CB 2 X
C 0 I 0 I 0 I 0 X 0 X 64 CB 0 C 0 CBR 0 CBR 0 RX
NC 81 I 92 I 92 X 92 X 92 X 0 CBR 1 CB 0 CBR 1 CB 1 X
Ven All 1 I 3 I 3 I 3 X 3 X 0 RI 0 RI 0 RI 0 RI 0 RI
C 0 I 0 I 0 I 0 X 0 X 0 C 0 C 0 C 0 C 0 I
NC 1 X 3 I 3 X 3 X 3 X 0 CBR 0 CBR 0 CBR 0 CBR 0 RX
Ply All 1 I 1 I 1 I 1 X 1 X 3 CB 3 CB 3 I 2 CB 2 X
C 0 I 0 I 0 I 0 X 0 X 2 CB 3 CB 3 CB 2 CB 2 X
NC 1 X 1 X 1 X 1 X 1 X 1 CB 0 CBR 0 C 0 CBR 0 RX
Congo, Rep. Logs All 1369 I 1316 I 1316 I 1981 I 1981 X 0 0 0 RI 1 CB 1 X
C 0 I 0 I 0 I 0 X 0 X 0 0 0 1 CB 1 X
NC 1369 1316 1316 X 1981 I 1981 X 0 0 0 CBR 0 CBR 0 RX
Sawn All 209 I 268 I 369 I 369 X 369 X 0 CBR 0 RI 0 CBR 0 CR 0 RX
C 0 I 0 I 0 I 0 X 0 X 0 CBR 0 0 CBR 0 CBR 0 RX
NC 209 268 369 I 369 X 369 X 0 CBR 0 CBR 0 CBR 0 C 0 X
Ven All 14 I 5 I 5 I 10 I 10 X 0 RI 0 RI 0 CBR 0 RI 0 RX
C 0 I 0 I 0 I 0 X 0 X 0 0 0 CBR 0 CBR 0 RX
NC 14 5 I 5 X 10 I 10 X 0 CBR 0 CBR 0 CBR 0 C 0 X
Ply All 6 I 6 I 6 I 6 X 6 X 5 CB 0 RI 0 CBR 1 CB 1 X
C 0 I 0 I 0 I 0 X 0 X 5 CB 0 C 0 CBR 1 CB 1 X
NC 6 6 6 X 6 X 6 X 0 CBR 0 CBR 0 CBR 0 CBR 0 RX
Côte d'Ivoire Logs All 1347 I 1408 I 1469 I 1469 X 1469 X 0 CR 0 RI 0 I 0 RI 0 RX
C 0 I 0 I 0 I 0 X 0 X 0 C 0 C 0 C 0 CR 0 RX
NC 1347 1408 1469 1469 X 1469 X 0 CR 0 CBR 0 CB 0 CBR 0 RX
Sawn All 503 I 442 I 456 I 471 I 471 0 CR 0 RI 0 RI 0 RI 0 RX
C 0 I 0 I 0 I 0 X 0 X 0 C 0 CBR 0 CBR 0 CBR 0 RX
NC 503 I 442 I 456 I 471 I 471 X 0 CR 0 CR 0 CR 0 CR 0 RX
Ven All 240 I 262 I 313 I 396 X 396 X 0 RI 0 RI 0 RI 0 RI 0 RX
C 0 I 0 I 0 I 0 X 0 X 0 CBR 0 CR 0 CR 0 CR 0 RX
NC 240 262 I 313 I 396 I 396 X 0 CR 0 CB 0 CBR 0 CBR 0 RX
Ply All 61 I 88 I 82 I 81 I 81 X 0 CR 0 RI 0 CR 0 CR 0 RX
C 0 I 0 I 0 I 0 X 0 X 0 CR 0 CBR 0 CR 0 CR 0 RX
NC 61 88 I 82 I 81 I 81 X 0 CR 0 C 0 CBR 0 CR 0 RX
Gabon Logs All 3200 I 3500 I 3400 I 3400 X 3400 X 0 0 0 0 0 X
C 0 I 0 I 0 I 0 X 0 X 0 0 0 0 0 X
NC 3200 3500 3400 3400 X 3400 X 0 0 0 0 0 X
Sawn All 230 I 235 I 296 I 296 X 296 X 0 RI 0 CR 0 0 0 X
C 0 I 0 I 0 I 0 X 0 X 0 R 0 CR 0 0 0 X
NC 230 235 296 * 296 X 296 X 0 CR 0 CR 0 0 0 X
Ven All 145 I 150 I 182 I 182 X 182 X 2 0 CR 0 RI 0 RI 0 RX
C 0 I 0 I 0 I 0 X 0 X 0 0 0 0 0 X
NC 145 150 182 182 X 182 X 2 0 CR 0 CBR 0 CBR 0 RX
Ply All 146 I 142 I 85 I 85 X 85 X 27 I 0 CR 1 CB 0 CBR 0 RX
C 0 I 0 I 0 I 0 X 0 X 1 C 0 CR 0 CBR 0 CBR 0 RX
NC 146 I 142 85 85 X 85 X 26 0 CR 0 CBR 0 CB 0 X
Congo, Dem. Rep.
Africa
Production Imports
80
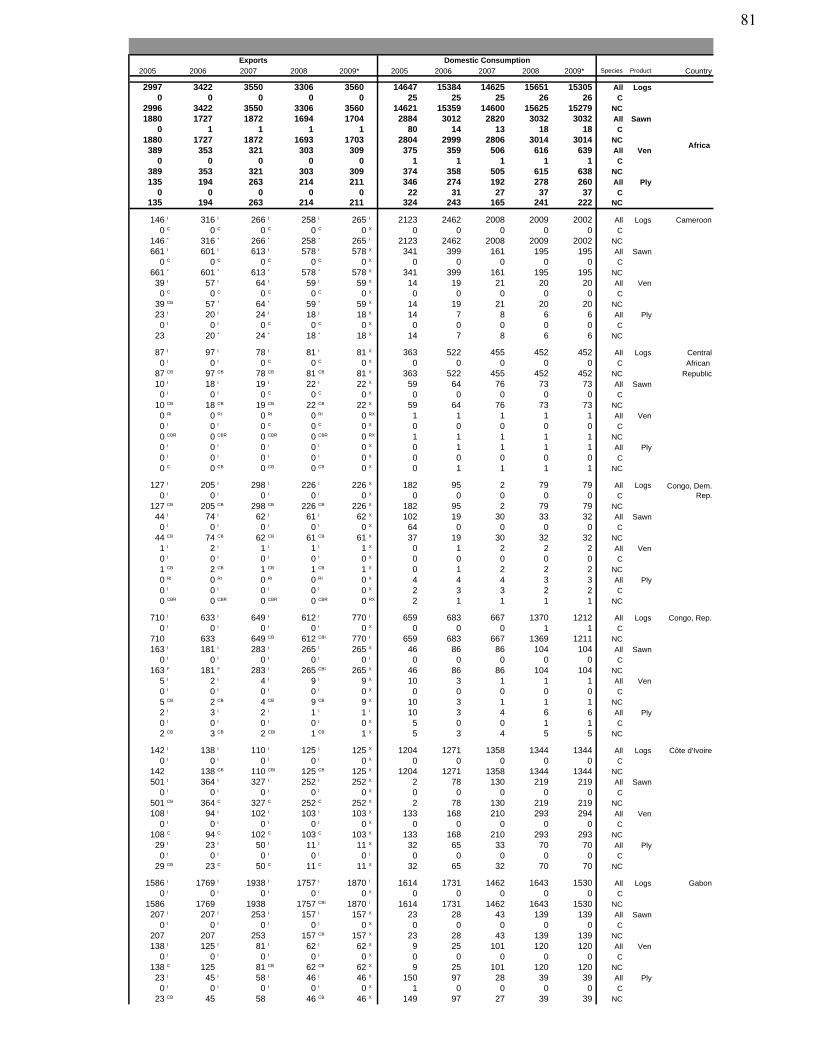
2005 2006 2007 2008 2009* 2005 2006 2007 2008 2009* Species Product Country
2997 3422 3550 3306 3560 14647 15384 14625 15651 15305 All Logs0 0 0 0 0 25 25 25 26 26 C
2996 3422 3550 3306 3560 14621 15359 14600 15625 15279 NC1880 1727 1872 1694 1704 2884 3012 2820 3032 3032 All Sawn
0 1 1 1 1 80 14 13 18 18 C1880 1727 1872 1693 1703 2804 2999 2806 3014 3014 NC389 353 321 303 309 375 359 506 616 639 All Ven
0 0 0 0 0 1 1 1 1 1 C389 353 321 303 309 374 358 505 615 638 NC135 194 263 214 211 346 274 192 278 260 All Ply
0 0 0 0 0 22 31 27 37 37 C135 194 263 214 211 324 243 165 241 222 NC
146 I 316 I 266 I 258 I 265 I 2123 2462 2008 2009 2002 All Logs Cameroon0 C 0 C 0 C 0 C 0 X 0 0 0 0 0 C
146 * 316 * 266 * 258 * 265 I 2123 2462 2008 2009 2002 NC661 I 601 I 613 I 578 I 578 X 341 399 161 195 195 All Sawn
0 C 0 C 0 C 0 C 0 X 0 0 0 0 0 C661 * 601 * 613 * 578 * 578 X 341 399 161 195 195 NC39 I 57 I 64 I 59 I 59 X 14 19 21 20 20 All Ven0 C 0 C 0 C 0 C 0 X 0 0 0 0 0 C
39 CB 57 * 64 * 59 * 59 X 14 19 21 20 20 NC23 I 20 I 24 I 18 I 18 X 14 7 8 6 6 All Ply0 I 0 I 0 C 0 C 0 X 0 0 0 0 0 C
23 20 * 24 * 18 * 18 X 14 7 8 6 6 NC
87 I 97 I 78 I 81 I 81 X 363 522 455 452 452 All Logs Central0 I 0 I 0 C 0 C 0 X 0 0 0 0 0 C African
87 CB 97 CB 78 CB 81 CB 81 X 363 522 455 452 452 NC Republic10 I 18 I 19 I 22 I 22 X 59 64 76 73 73 All Sawn0 I 0 I 0 C 0 C 0 X 0 0 0 0 0 C
10 CB 18 CB 19 CB 22 CB 22 X 59 64 76 73 73 NC0 RI 0 RI 0 RI 0 RI 0 RX 1 1 1 1 1 All Ven0 I 0 I 0 C 0 C 0 X 0 0 0 0 0 C0 CBR 0 CBR 0 CBR 0 CBR 0 RX 1 1 1 1 1 NC0 I 0 I 0 I 0 I 0 X 0 1 1 1 1 All Ply0 I 0 I 0 I 0 I 0 X 0 0 0 0 0 C0 C 0 CB 0 CB 0 CB 0 X 0 1 1 1 1 NC
127 I 205 I 298 I 226 I 226 X 182 95 2 79 79 All Logs0 I 0 I 0 I 0 I 0 X 0 0 0 0 0 C
127 CB 205 CB 298 CB 226 CB 226 X 182 95 2 79 79 NC44 I 74 I 62 I 61 I 62 X 102 19 30 33 32 All Sawn0 I 0 I 0 I 0 I 0 X 64 0 0 0 0 C
44 CB 74 CB 62 CB 61 CB 61 X 37 19 30 32 32 NC1 I 2 I 1 I 1 I 1 X 0 1 2 2 2 All Ven0 I 0 I 0 I 0 I 0 X 0 0 0 0 0 C1 CB 2 CB 1 CB 1 CB 1 X 0 1 2 2 2 NC0 RI 0 RI 0 RI 0 RI 0 X 4 4 4 3 3 All Ply0 I 0 I 0 I 0 I 0 X 2 3 3 2 2 C0 CBR 0 CBR 0 CBR 0 CBR 0 RX 2 1 1 1 1 NC
710 I 633 I 649 I 612 I 770 I 659 683 667 1370 1212 All Logs Congo, Rep.0 I 0 I 0 I 0 I 0 X 0 0 0 1 1 C
710 633 649 CB 612 CBI 770 I 659 683 667 1369 1211 NC163 I 181 I 283 I 265 I 265 X 46 86 86 104 104 All Sawn
0 I 0 I 0 I 0 I 0 I 0 0 0 0 0 C163 F 181 F 283 I 265 CBI 265 X 46 86 86 104 104 NC
5 I 2 I 4 I 9 I 9 X 10 3 1 1 1 All Ven0 I 0 I 0 I 0 I 0 X 0 0 0 0 0 C5 CB 2 CB 4 CB 9 CB 9 X 10 3 1 1 1 NC2 I 3 I 2 I 1 I 1 I 10 3 4 6 6 All Ply0 I 0 I 0 I 0 I 0 X 5 0 0 1 1 C2 CB 3 CB 2 CBI 1 CB 1 X 5 3 4 5 5 NC
142 I 138 I 110 I 125 I 125 X 1204 1271 1358 1344 1344 All Logs Côte d'Ivoire0 I 0 I 0 I 0 I 0 X 0 0 0 0 0 C
142 138 CB 110 CBI 125 CB 125 X 1204 1271 1358 1344 1344 NC501 I 364 I 327 I 252 I 252 X 2 78 130 219 219 All Sawn
0 I 0 I 0 I 0 I 0 X 0 0 0 0 0 C501 CB 364 C 327 C 252 C 252 X 2 78 130 219 219 NC108 I 94 I 102 I 103 I 103 X 133 168 210 293 294 All Ven
0 I 0 I 0 I 0 I 0 X 0 0 0 0 0 C108 C 94 C 102 C 103 C 103 X 133 168 210 293 293 NC29 I 23 I 50 I 11 I 11 X 32 65 33 70 70 All Ply0 I 0 I 0 I 0 I 0 I 0 0 0 0 0 C
29 CB 23 C 50 C 11 C 11 X 32 65 32 70 70 NC
1586 I 1769 I 1938 I 1757 I 1870 I 1614 1731 1462 1643 1530 All Logs Gabon0 I 0 I 0 I 0 I 0 X 0 0 0 0 0 C
1586 1769 1938 1757 CBI 1870 I 1614 1731 1462 1643 1530 NC207 I 207 I 253 I 157 I 157 X 23 28 43 139 139 All Sawn
0 I 0 I 0 I 0 I 0 X 0 0 0 0 0 C207 207 253 157 CB 157 X 23 28 43 139 139 NC138 I 125 I 81 I 62 I 62 X 9 25 101 120 120 All Ven
0 I 0 I 0 I 0 I 0 X 0 0 0 0 0 C138 C 125 81 CB 62 CB 62 X 9 25 101 120 120 NC23 I 45 I 58 I 46 I 46 X 150 97 28 39 39 All Ply0 I 0 I 0 I 0 I 0 X 1 0 0 0 0 C
23 CB 45 58 46 CB 46 X 149 97 27 39 39 NC
Domestic Consumption
Africa
Congo, Dem. Rep.
Exports
81
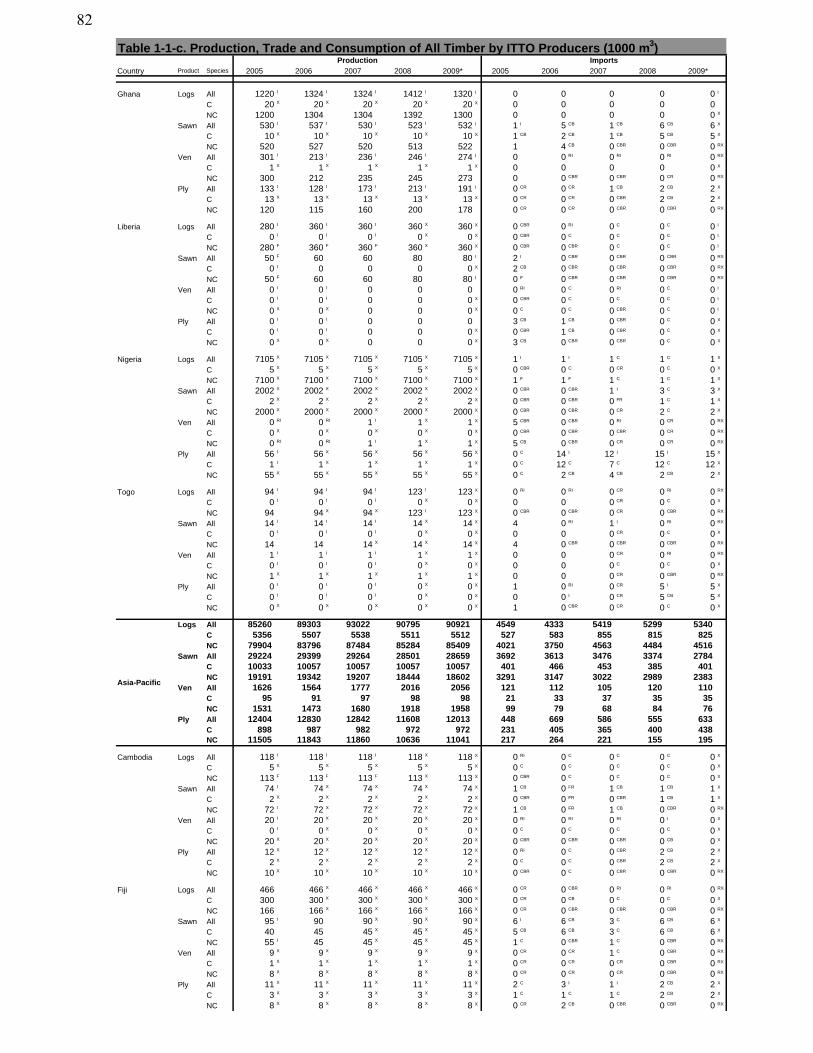
Table 1-1-c. Production, Trade and Consumption of All Timber by ITTO Producers (1000 m3)
Country Product Species 2005 2006 2007 2008 2009* 2005 2006 2007 2008 2009*
Production Imports
Ghana Logs All 1220 I 1324 I 1324 I 1412 I 1320 I 0 0 0 0 0 I
C 20 X 20 X 20 X 20 X 20 X 0 0 0 0 0
NC 1200 1304 1304 1392 1300 0 0 0 0 0 X
Sawn All 530 I 537 I 530 I 523 I 532 I 1 I 5 CB 1 CB 6 CB 6 X
C 10 X 10 X 10 X 10 X 10 X 1 CB 2 CB 1 CB 5 CB 5 X
NC 520 527 520 513 522 1 4 CB 0 CBR 0 CBR 0 RX
Ven All 301 I 213 I 236 I 246 I 274 I 0 0 RI 0 RI 0 RI 0 RX
C 1 X 1 X 1 X 1 X 1 X 0 0 0 0 0 X
NC 300 212 235 245 273 0 0 CBR 0 CBR 0 CR 0 RX
Ply All 133 I 128 I 173 I 213 I 191 I 0 CR 0 CR 1 CB 2 CB 2 X
C 13 X 13 X 13 X 13 X 13 X 0 CR 0 CR 0 CBR 2 CB 2 X
NC 120 115 160 200 178 0 CR 0 CR 0 CBR 0 CBR 0 RX
Liberia Logs All 280 I 360 I 360 I 360 X 360 X 0 CBR 0 RI 0 C 0 C 0 I
C 0 I 0 I 0 I 0 X 0 X 0 CBR 0 C 0 C 0 C 0 I
NC 280 F 360 F 360 F 360 X 360 X 0 CBR 0 CBR 0 C 0 C 0 I
Sawn All 50 F 60 60 80 80 I 2 I 0 CBR 0 CBR 0 CBR 0 RX
C 0 I 0 0 0 0 X 2 CB 0 CBR 0 CBR 0 CBR 0 RX
NC 50 F 60 60 80 80 I 0 F 0 CBR 0 CBR 0 CBR 0 RX
Ven All 0 I 0 I 0 0 0 0 RI 0 C 0 RI 0 C 0 I
C 0 I 0 I 0 0 0 X 0 CBR 0 C 0 C 0 C 0 I
NC 0 X 0 X 0 0 0 X 0 C 0 C 0 CBR 0 C 0 I
Ply All 0 I 0 I 0 0 0 3 CB 1 CB 0 CBR 0 C 0 X
C 0 I 0 I 0 0 0 X 0 CBR 1 CB 0 CBR 0 C 0 X
NC 0 X 0 X 0 0 0 X 3 CB 0 CBR 0 CBR 0 C 0 X
Nigeria Logs All 7105 X 7105 X 7105 X 7105 X 7105 X 1 I 1 I 1 C 1 C 1 X
C 5 X 5 X 5 X 5 X 5 X 0 CBR 0 C 0 CR 0 C 0 X
NC 7100 X 7100 X 7100 X 7100 X 7100 X 1 F 1 F 1 C 1 C 1 X
Sawn All 2002 X 2002 X 2002 X 2002 X 2002 X 0 CBR 0 CBR 1 I 3 C 3 X
C 2 X 2 X 2 X 2 X 2 X 0 CBR 0 CBR 0 FR 1 C 1 X
NC 2000 X 2000 X 2000 X 2000 X 2000 X 0 CBR 0 CBR 0 CR 2 C 2 X
Ven All 0 RI 0 RI 1 I 1 X 1 X 5 CBR 0 CBR 0 RI 0 CR 0 RX
C 0 X 0 X 0 X 0 X 0 X 0 CBR 0 CBR 0 CBR 0 CR 0 RX
NC 0 RI 0 RI 1 I 1 X 1 X 5 CB 0 CBR 0 CR 0 CR 0 RX
Ply All 56 I 56 X 56 X 56 X 56 X 0 C 14 I 12 I 15 I 15 X
C 1 I 1 X 1 X 1 X 1 X 0 C 12 C 7 C 12 C 12 X
NC 55 X 55 X 55 X 55 X 55 X 0 C 2 CB 4 CB 2 CB 2 X
Togo Logs All 94 I 94 I 94 I 123 I 123 X 0 RI 0 RI 0 CR 0 RI 0 RX
C 0 I 0 I 0 I 0 X 0 X 0 0 0 CR 0 C 0 X
NC 94 94 X 94 X 123 I 123 X 0 CBR 0 CBR 0 CR 0 CBR 0 RX
Sawn All 14 I 14 I 14 I 14 X 14 X 4 0 RI 1 I 0 RI 0 RX
C 0 I 0 I 0 I 0 X 0 X 0 0 0 CR 0 C 0 X
NC 14 14 14 X 14 X 14 X 4 0 CBR 0 CBR 0 CBR 0 RX
Ven All 1 I 1 I 1 I 1 X 1 X 0 0 0 CR 0 RI 0 RX
C 0 I 0 I 0 I 0 X 0 X 0 0 0 C 0 C 0 X
NC 1 X 1 X 1 X 1 X 1 X 0 0 0 CR 0 CBR 0 RX
Ply All 0 I 0 I 0 I 0 X 0 X 1 0 RI 0 CR 5 I 5 X
C 0 I 0 I 0 I 0 X 0 X 0 0 I 0 CR 5 CB 5 X
NC 0 X 0 X 0 X 0 X 0 X 1 0 CBR 0 CR 0 C 0 X
Logs All 85260 89303 93022 90795 90921 4549 4333 5419 5299 5340C 5356 5507 5538 5511 5512 527 583 855 815 825NC 79904 83796 87484 85284 85409 4021 3750 4563 4484 4516
Sawn All 29224 29399 29264 28501 28659 3692 3613 3476 3374 2784C 10033 10057 10057 10057 10057 401 466 453 385 401NC 19191 19342 19207 18444 18602 3291 3147 3022 2989 2383
Ven All 1626 1564 1777 2016 2056 121 112 105 120 110C 95 91 97 98 98 21 33 37 35 35NC 1531 1473 1680 1918 1958 99 79 68 84 76
Ply All 12404 12830 12842 11608 12013 448 669 586 555 633C 898 987 982 972 972 231 405 365 400 438NC 11505 11843 11860 10636 11041 217 264 221 155 195
Cambodia Logs All 118 I 118 I 118 I 118 X 118 X 0 RI 0 C 0 C 0 C 0 X
C 5 X 5 X 5 X 5 X 5 X 0 C 0 C 0 C 0 C 0 X
NC 113 F 113 F 113 F 113 X 113 X 0 CBR 0 C 0 C 0 C 0 X
Sawn All 74 I 74 X 74 X 74 X 74 X 1 CB 0 FR 1 CB 1 CB 1 X
C 2 X 2 X 2 X 2 X 2 X 0 CBR 0 FR 0 CBR 1 CB 1 X
NC 72 I 72 X 72 X 72 X 72 X 1 CB 0 FR 1 CB 0 CBR 0 RX
Ven All 20 I 20 X 20 X 20 X 20 X 0 RI 0 RI 0 RI 0 I 0 X
C 0 I 0 X 0 X 0 X 0 X 0 C 0 C 0 C 0 C 0 X
NC 20 X 20 X 20 X 20 X 20 X 0 CBR 0 CBR 0 CBR 0 CB 0 X
Ply All 12 X 12 X 12 X 12 X 12 X 0 RI 0 C 0 CBR 2 CB 2 X
C 2 X 2 X 2 X 2 X 2 X 0 C 0 C 0 CBR 2 CB 2 X
NC 10 X 10 X 10 X 10 X 10 X 0 CBR 0 C 0 CBR 0 CBR 0 RX
Fiji Logs All 466 466 X 466 X 466 X 466 X 0 CR 0 CBR 0 RI 0 RI 0 RX
C 300 300 X 300 X 300 X 300 X 0 CR 0 CB 0 C 0 C 0 X
NC 166 166 X 166 X 166 X 166 X 0 CR 0 CBR 0 CBR 0 CBR 0 RX
Sawn All 95 I 90 90 X 90 X 90 X 6 I 6 CB 3 C 6 CB 6 X
C 40 45 45 X 45 X 45 X 5 CB 6 CB 3 C 6 CB 6 X
NC 55 I 45 45 X 45 X 45 X 1 C 0 CBR 1 C 0 CBR 0 RX
Ven All 9 X 9 X 9 X 9 X 9 X 0 CR 0 CR 1 C 0 CBR 0 RX
C 1 X 1 X 1 X 1 X 1 X 0 CR 0 CR 0 CR 0 CBR 0 RX
NC 8 X 8 X 8 X 8 X 8 X 0 CR 0 CR 0 CR 0 CBR 0 RX
Ply All 11 X 11 X 11 X 11 X 11 X 2 C 3 I 1 I 2 CB 2 X
C 3 X 3 X 3 X 3 X 3 X 1 C 1 C 1 C 2 CB 2 X
NC 8 X 8 X 8 X 8 X 8 X 0 CR 2 CB 0 CBR 0 CBR 0 RX
Asia-Pacific
82
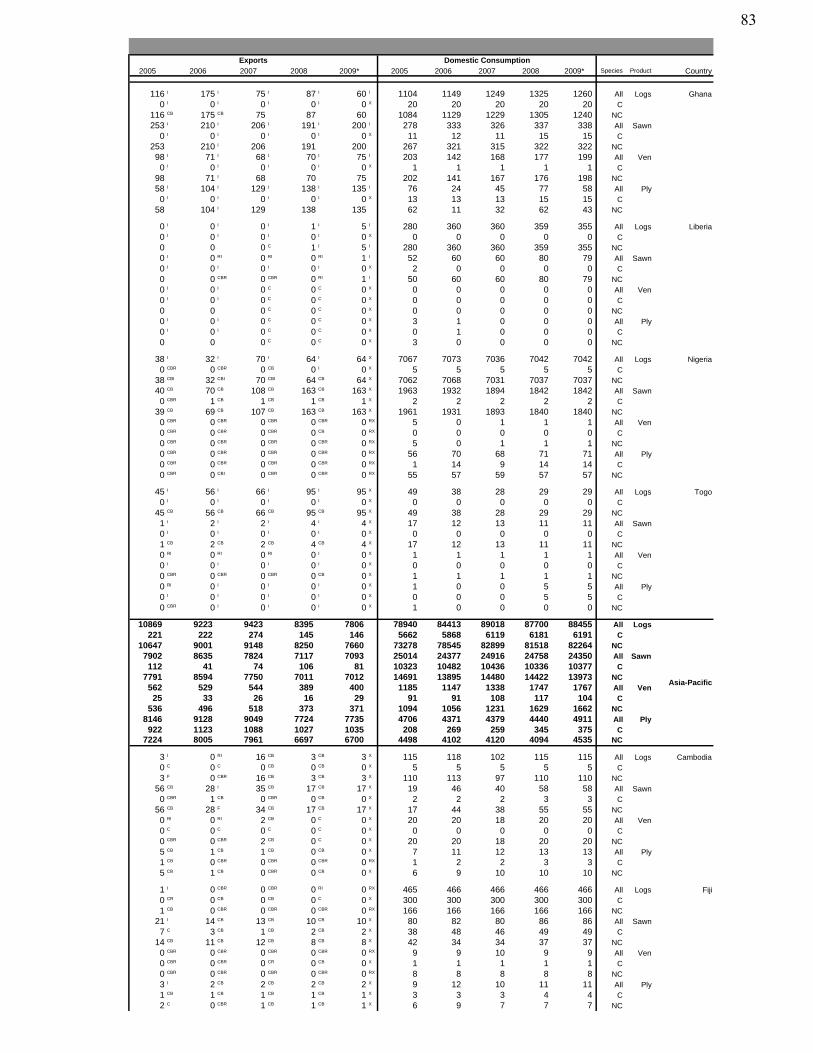
2005 2006 2007 2008 2009* 2005 2006 2007 2008 2009* Species Product Country
Domestic ConsumptionExports
116 I 175 I 75 I 87 I 60 I 1104 1149 1249 1325 1260 All Logs Ghana0 I 0 I 0 I 0 I 0 X 20 20 20 20 20 C
116 CB 175 CB 75 87 60 1084 1129 1229 1305 1240 NC253 I 210 I 206 I 191 I 200 I 278 333 326 337 338 All Sawn
0 I 0 I 0 I 0 I 0 X 11 12 11 15 15 C253 210 I 206 191 200 267 321 315 322 322 NC98 I 71 I 68 I 70 I 75 I 203 142 168 177 199 All Ven0 I 0 I 0 I 0 I 0 X 1 1 1 1 1 C
98 71 I 68 70 75 202 141 167 176 198 NC58 I 104 I 129 I 138 I 135 I 76 24 45 77 58 All Ply0 I 0 I 0 I 0 I 0 X 13 13 13 15 15 C
58 104 I 129 138 135 62 11 32 62 43 NC
0 I 0 I 0 I 1 I 5 I 280 360 360 359 355 All Logs Liberia0 I 0 I 0 I 0 I 0 X 0 0 0 0 0 C0 0 0 C 1 I 5 I 280 360 360 359 355 NC0 I 0 RI 0 RI 0 RI 1 I 52 60 60 80 79 All Sawn0 I 0 I 0 I 0 I 0 X 2 0 0 0 0 C0 0 CBR 0 CBR 0 RI 1 I 50 60 60 80 79 NC0 I 0 I 0 C 0 C 0 X 0 0 0 0 0 All Ven0 I 0 I 0 C 0 C 0 X 0 0 0 0 0 C0 0 0 C 0 C 0 X 0 0 0 0 0 NC0 I 0 I 0 C 0 C 0 X 3 1 0 0 0 All Ply0 I 0 I 0 C 0 C 0 X 0 1 0 0 0 C0 0 0 C 0 C 0 X 3 0 0 0 0 NC
38 I 32 I 70 I 64 I 64 X 7067 7073 7036 7042 7042 All Logs Nigeria0 CBR 0 CBR 0 CB 0 I 0 X 5 5 5 5 5 C
38 CBI 32 CBI 70 CBI 64 CB 64 X 7062 7068 7031 7037 7037 NC40 CB 70 CB 108 CB 163 CB 163 X 1963 1932 1894 1842 1842 All Sawn0 CBR 1 CB 1 CB 1 CB 1 X 2 2 2 2 2 C
39 CB 69 CB 107 CB 163 CB 163 X 1961 1931 1893 1840 1840 NC0 CBR 0 CBR 0 CBR 0 CBR 0 RX 5 0 1 1 1 All Ven0 CBR 0 CBR 0 CBR 0 CB 0 RX 0 0 0 0 0 C0 CBR 0 CBR 0 CBR 0 CBR 0 RX 5 0 1 1 1 NC0 CBR 0 CBR 0 CBR 0 CBR 0 RX 56 70 68 71 71 All Ply0 CBR 0 CBR 0 CBR 0 CBR 0 RX 1 14 9 14 14 C0 CBR 0 CBI 0 CBR 0 CBR 0 RX 55 57 59 57 57 NC
45 I 56 I 66 I 95 I 95 X 49 38 28 29 29 All Logs Togo0 I 0 I 0 I 0 I 0 X 0 0 0 0 0 C
45 CB 56 CB 66 CB 95 CB 95 X 49 38 28 29 29 NC1 I 2 I 2 I 4 I 4 X 17 12 13 11 11 All Sawn0 I 0 I 0 I 0 I 0 X 0 0 0 0 0 C1 CB 2 CB 2 CB 4 CB 4 X 17 12 13 11 11 NC0 RI 0 RI 0 RI 0 I 0 X 1 1 1 1 1 All Ven0 I 0 I 0 I 0 I 0 X 0 0 0 0 0 C0 CBR 0 CBR 0 CBR 0 CB 0 X 1 1 1 1 1 NC0 RI 0 I 0 I 0 I 0 X 1 0 0 5 5 All Ply0 I 0 I 0 I 0 I 0 X 0 0 0 5 5 C0 CBR 0 I 0 I 0 I 0 X 1 0 0 0 0 NC
10869 9223 9423 8395 7806 78940 84413 89018 87700 88455 All Logs221 222 274 145 146 5662 5868 6119 6181 6191 C
10647 9001 9148 8250 7660 73278 78545 82899 81518 82264 NC7902 8635 7824 7117 7093 25014 24377 24916 24758 24350 All Sawn112 41 74 106 81 10323 10482 10436 10336 10377 C
7791 8594 7750 7011 7012 14691 13895 14480 14422 13973 NC562 529 544 389 400 1185 1147 1338 1747 1767 All Ven25 33 26 16 29 91 91 108 117 104 C
536 496 518 373 371 1094 1056 1231 1629 1662 NC8146 9128 9049 7724 7735 4706 4371 4379 4440 4911 All Ply922 1123 1088 1027 1035 208 269 259 345 375 C
7224 8005 7961 6697 6700 4498 4102 4120 4094 4535 NC
3 I 0 RI 16 CB 3 CB 3 X 115 118 102 115 115 All Logs Cambodia0 C 0 C 0 CB 0 CB 0 X 5 5 5 5 5 C3 F 0 CBR 16 CB 3 CB 3 X 110 113 97 110 110 NC
56 CB 28 I 35 CB 17 CB 17 X 19 46 40 58 58 All Sawn0 CBR 1 CB 0 CBR 0 CB 0 X 2 2 2 3 3 C
56 CB 28 F 34 CB 17 CB 17 X 17 44 38 55 55 NC0 RI 0 RI 2 CB 0 C 0 X 20 20 18 20 20 All Ven0 C 0 C 0 C 0 C 0 X 0 0 0 0 0 C0 CBR 0 CBR 2 CB 0 C 0 X 20 20 18 20 20 NC5 CB 1 CB 1 CB 0 CB 0 X 7 11 12 13 13 All Ply1 CB 0 CBR 0 CBR 0 CBR 0 RX 1 2 2 3 3 C5 CB 1 CB 0 CBR 0 CB 0 X 6 9 10 10 10 NC
1 I 0 CBR 0 CBR 0 RI 0 RX 465 466 466 466 466 All Logs Fiji0 CR 0 CB 0 CB 0 C 0 X 300 300 300 300 300 C1 CB 0 CBR 0 CBR 0 CBR 0 RX 166 166 166 166 166 NC
21 I 14 CB 13 CB 10 CB 10 X 80 82 80 86 86 All Sawn7 C 3 CB 1 CB 2 CB 2 X 38 48 46 49 49 C
14 CB 11 CB 12 CB 8 CB 8 X 42 34 34 37 37 NC0 CBR 0 CBR 0 CBR 0 CBR 0 RX 9 9 10 9 9 All Ven0 CBR 0 CBR 0 CR 0 CB 0 X 1 1 1 1 1 C0 CBR 0 CBR 0 CBR 0 CBR 0 RX 8 8 8 8 8 NC3 I 2 CB 2 CB 2 CB 2 X 9 12 10 11 11 All Ply1 CB 1 CB 1 CB 1 CB 1 X 3 3 3 4 4 C2 C 0 CBR 1 CB 1 CB 1 X 6 9 7 7 7 NC
Asia-Pacific
83
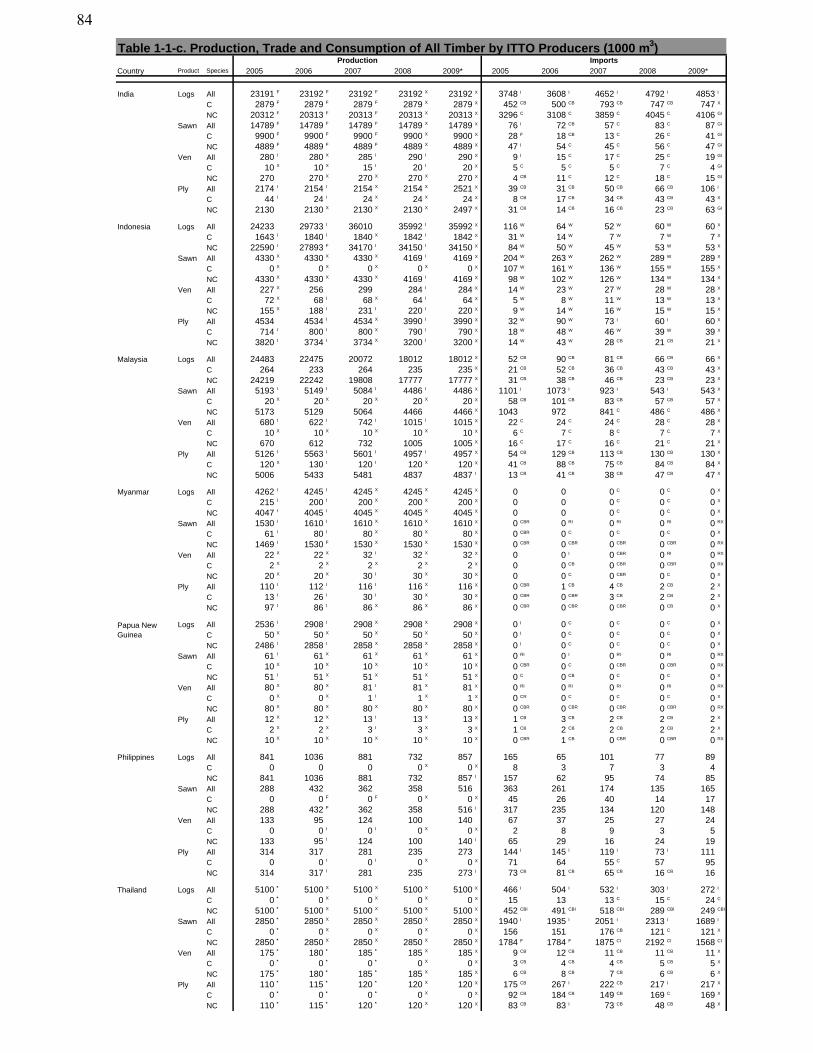
Table 1-1-c. Production, Trade and Consumption of All Timber by ITTO Producers (1000 m3)
Country Product Species 2005 2006 2007 2008 2009* 2005 2006 2007 2008 2009*
Production Imports
India Logs All 23191 F 23192 F 23192 F 23192 X 23192 X 3748 I 3608 I 4652 I 4792 I 4853 I
C 2879 F 2879 F 2879 F 2879 X 2879 X 452 CB 500 CB 793 CB 747 CB 747 X
NC 20312 F 20313 F 20313 F 20313 X 20313 X 3296 C 3108 C 3859 C 4045 C 4106 GI
Sawn All 14789 F 14789 F 14789 F 14789 X 14789 X 76 I 72 CB 57 C 83 C 87 GI
C 9900 F 9900 F 9900 F 9900 X 9900 X 28 F 18 CB 13 C 26 C 41 GI
NC 4889 F 4889 F 4889 F 4889 X 4889 X 47 I 54 C 45 C 56 C 47 GI
Ven All 280 I 280 X 285 I 290 I 290 X 9 I 15 C 17 C 25 C 19 GI
C 10 X 10 X 15 I 20 I 20 X 5 C 5 C 5 C 7 C 4 GI
NC 270 270 X 270 X 270 X 270 X 4 CB 11 C 12 C 18 C 15 GI
Ply All 2174 I 2154 I 2154 X 2154 X 2521 X 39 CB 31 CB 50 CB 66 CB 106 I
C 44 I 24 I 24 X 24 X 24 X 8 CB 17 CB 34 CB 43 CB 43 X
NC 2130 2130 X 2130 X 2130 X 2497 X 31 CB 14 CB 16 CB 23 CB 63 GI
Indonesia Logs All 24233 29733 I 36010 35992 I 35992 X 116 W 64 W 52 W 60 W 60 X
C 1643 I 1840 I 1840 X 1842 I 1842 X 31 W 14 W 7 W 7 W 7 X
NC 22590 I 27893 F 34170 I 34150 I 34150 X 84 W 50 W 45 W 53 W 53 X
Sawn All 4330 X 4330 X 4330 X 4169 I 4169 X 204 W 263 W 262 W 289 W 289 X
C 0 X 0 X 0 X 0 X 0 X 107 W 161 W 136 W 155 W 155 X
NC 4330 X 4330 X 4330 X 4169 I 4169 X 98 W 102 W 126 W 134 W 134 X
Ven All 227 X 256 299 284 I 284 X 14 W 23 W 27 W 28 W 28 X
C 72 X 68 I 68 X 64 I 64 X 5 W 8 W 11 W 13 W 13 X
NC 155 X 188 I 231 I 220 I 220 X 9 W 14 W 16 W 15 W 15 X
Ply All 4534 4534 I 4534 X 3990 I 3990 X 32 W 90 W 73 I 60 I 60 X
C 714 I 800 I 800 X 790 I 790 X 18 W 48 W 46 W 39 W 39 X
NC 3820 I 3734 I 3734 X 3200 I 3200 X 14 W 43 W 28 CB 21 CB 21 X
Malaysia Logs All 24483 22475 20072 18012 18012 X 52 CB 90 CB 81 CB 66 CB 66 X
C 264 233 264 235 235 X 21 CB 52 CB 36 CB 43 CB 43 X
NC 24219 22242 19808 17777 17777 X 31 CB 38 CB 46 CB 23 CB 23 X
Sawn All 5193 I 5149 I 5084 I 4486 I 4486 X 1101 I 1073 I 923 I 543 I 543 X
C 20 X 20 X 20 X 20 X 20 X 58 CB 101 CB 83 CB 57 CB 57 X
NC 5173 5129 5064 4466 4466 X 1043 972 841 C 486 C 486 X
Ven All 680 I 622 I 742 I 1015 I 1015 X 22 C 24 C 24 C 28 C 28 X
C 10 X 10 X 10 X 10 X 10 X 6 C 7 C 8 C 7 C 7 X
NC 670 612 732 1005 1005 X 16 C 17 C 16 C 21 C 21 X
Ply All 5126 I 5563 I 5601 I 4957 I 4957 X 54 CB 129 CB 113 CB 130 CB 130 X
C 120 X 130 I 120 I 120 X 120 X 41 CB 88 CB 75 CB 84 CB 84 X
NC 5006 5433 5481 4837 4837 I 13 CB 41 CB 38 CB 47 CB 47 X
Myanmar Logs All 4262 I 4245 I 4245 X 4245 X 4245 X 0 0 0 C 0 C 0 X
C 215 I 200 I 200 X 200 X 200 X 0 0 0 C 0 C 0 X
NC 4047 I 4045 I 4045 X 4045 X 4045 X 0 0 0 C 0 C 0 X
Sawn All 1530 I 1610 I 1610 X 1610 X 1610 X 0 CBR 0 RI 0 RI 0 RI 0 RX
C 61 I 80 I 80 X 80 X 80 X 0 CBR 0 C 0 C 0 C 0 X
NC 1469 I 1530 F 1530 X 1530 X 1530 X 0 CBR 0 CBR 0 CBR 0 CBR 0 RX
Ven All 22 X 22 X 32 I 32 X 32 X 0 0 I 0 CBR 0 RI 0 RX
C 2 X 2 X 2 X 2 X 2 X 0 0 CB 0 CBR 0 CBR 0 RX
NC 20 X 20 X 30 I 30 X 30 X 0 0 C 0 CBR 0 C 0 X
Ply All 110 I 112 I 116 I 116 X 116 X 0 CBR 1 CB 4 CB 2 CB 2 X
C 13 I 26 I 30 I 30 X 30 X 0 CBR 0 CBR 3 CB 2 CB 2 X
NC 97 I 86 I 86 X 86 X 86 X 0 CBR 0 CBR 0 CBR 0 CB 0 X
Logs All 2536 I 2908 I 2908 X 2908 X 2908 X 0 I 0 C 0 C 0 C 0 X
C 50 X 50 X 50 X 50 X 50 X 0 I 0 C 0 C 0 C 0 X
NC 2486 I 2858 I 2858 X 2858 X 2858 X 0 I 0 C 0 C 0 C 0 X
Sawn All 61 I 61 X 61 X 61 X 61 X 0 RI 0 I 0 RI 0 RI 0 RX
C 10 X 10 X 10 X 10 X 10 X 0 CBR 0 C 0 CBR 0 CBR 0 RX
NC 51 I 51 X 51 X 51 X 51 X 0 C 0 CB 0 C 0 C 0 X
Ven All 80 X 80 X 81 I 81 X 81 X 0 RI 0 RI 0 RI 0 RI 0 RX
C 0 X 0 X 1 I 1 X 1 X 0 CR 0 C 0 C 0 C 0 X
NC 80 X 80 X 80 X 80 X 80 X 0 CBR 0 CBR 0 CBR 0 CBR 0 RX
Ply All 12 X 12 X 13 I 13 X 13 X 1 CB 3 CB 2 CB 2 CB 2 X
C 2 X 2 X 3 I 3 X 3 X 1 CB 2 CB 2 CB 2 CB 2 X
NC 10 X 10 X 10 X 10 X 10 X 0 CBR 1 CB 0 CBR 0 CBR 0 RX
Philippines Logs All 841 1036 881 732 857 165 65 101 77 89
C 0 0 0 0 X 0 X 8 3 7 3 4
NC 841 1036 881 732 857 I 157 62 95 74 85
Sawn All 288 432 362 358 516 363 261 174 135 165
C 0 0 F 0 F 0 X 0 X 45 26 40 14 17
NC 288 432 F 362 358 516 I 317 235 134 120 148
Ven All 133 95 124 100 140 67 37 25 27 24
C 0 0 I 0 I 0 X 0 X 2 8 9 3 5
NC 133 95 I 124 100 140 I 65 29 16 24 19
Ply All 314 317 281 235 273 144 I 145 I 119 I 73 I 111
C 0 0 I 0 I 0 X 0 X 71 64 55 C 57 95
NC 314 317 I 281 235 273 I 73 CB 81 CB 65 CB 16 CB 16
Thailand Logs All 5100 * 5100 X 5100 X 5100 X 5100 X 466 I 504 I 532 I 303 I 272 I
C 0 * 0 X 0 X 0 X 0 X 15 13 13 C 15 C 24 C
NC 5100 * 5100 X 5100 X 5100 X 5100 X 452 CBI 491 CBI 518 CBI 289 CBI 249 CBI
Sawn All 2850 * 2850 X 2850 X 2850 X 2850 X 1940 I 1935 I 2051 I 2313 I 1689 I
C 0 * 0 X 0 X 0 X 0 X 156 151 176 CB 121 C 121 X
NC 2850 * 2850 X 2850 X 2850 X 2850 X 1784 F 1784 F 1875 CI 2192 CI 1568 CI
Ven All 175 * 180 * 185 * 185 X 185 X 9 CB 12 CB 11 CB 11 CB 11 X
C 0 * 0 * 0 * 0 X 0 X 3 CB 4 CB 4 CB 5 CB 5 X
NC 175 * 180 * 185 * 185 X 185 X 6 CB 8 CB 7 CB 6 CB 6 X
Ply All 110 * 115 * 120 * 120 X 120 X 175 CB 267 I 222 CB 217 I 217 X
C 0 * 0 * 0 * 0 X 0 X 92 CB 184 CB 149 CB 169 C 169 X
NC 110 * 115 * 120 * 120 X 120 X 83 CB 83 I 73 CB 48 CB 48 X
Papua New Guinea
84
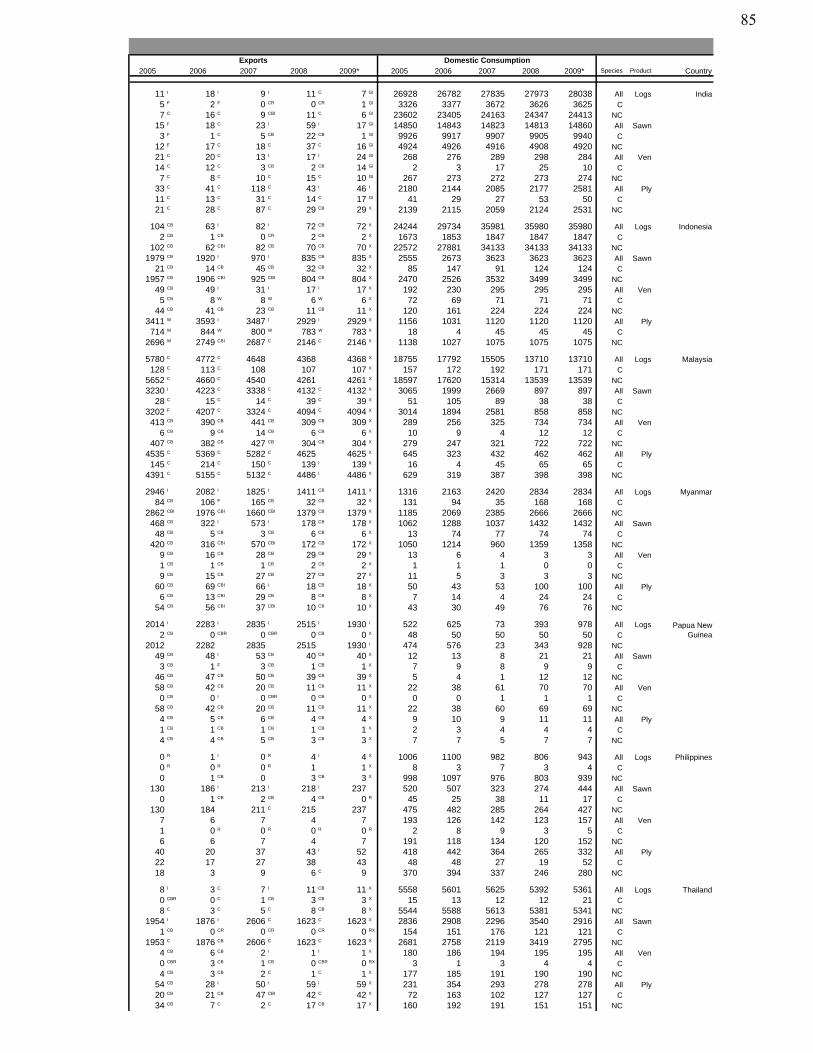
2005 2006 2007 2008 2009* 2005 2006 2007 2008 2009* Species Product Country
Domestic ConsumptionExports
11 I 18 I 9 I 11 C 7 GI 26928 26782 27835 27973 28038 All Logs India5 F 2 F 0 CR 0 CR 1 GI 3326 3377 3672 3626 3625 C7 C 16 C 9 CBI 11 C 6 GI 23602 23405 24163 24347 24413 NC
15 F 18 C 23 I 59 I 17 GI 14850 14843 14823 14813 14860 All Sawn3 F 1 C 5 CB 22 CB 1 GI 9926 9917 9907 9905 9940 C
12 F 17 C 18 C 37 C 16 GI 4924 4926 4916 4908 4920 NC21 C 20 C 13 I 17 I 24 GI 268 276 289 298 284 All Ven14 C 12 C 3 CB 2 CB 14 GI 2 3 17 25 10 C7 C 8 C 10 C 15 C 10 GI 267 273 272 273 274 NC
33 C 41 C 118 C 43 I 46 I 2180 2144 2085 2177 2581 All Ply11 C 13 C 31 C 14 C 17 GI 41 29 27 53 50 C21 C 28 C 87 C 29 CB 29 X 2139 2115 2059 2124 2531 NC
104 CB 63 I 82 I 72 CB 72 X 24244 29734 35981 35980 35980 All Logs Indonesia2 CB 1 CB 0 CR 2 CB 2 X 1673 1853 1847 1847 1847 C
102 CB 62 CBI 82 CB 70 CB 70 X 22572 27881 34133 34133 34133 NC1979 CB 1920 I 970 I 835 CB 835 X 2555 2673 3623 3623 3623 All Sawn
21 CB 14 CB 45 CB 32 CB 32 X 85 147 91 124 124 C1957 CB 1906 CBI 925 CBI 804 CB 804 X 2470 2526 3532 3499 3499 NC
49 CB 49 I 31 I 17 I 17 X 192 230 295 295 295 All Ven5 CB 8 W 8 W 6 W 6 X 72 69 71 71 71 C
44 CB 41 CB 23 CB 11 CB 11 X 120 161 224 224 224 NC3411 W 3593 I 3487 I 2929 I 2929 X 1156 1031 1120 1120 1120 All Ply714 W 844 W 800 W 783 W 783 X 18 4 45 45 45 C
2696 W 2749 CBI 2687 C 2146 C 2146 X 1138 1027 1075 1075 1075 NC
5780 C 4772 C 4648 4368 4368 X 18755 17792 15505 13710 13710 All Logs Malaysia128 C 113 C 108 107 107 X 157 172 192 171 171 C
5652 C 4660 C 4540 4261 4261 X 18597 17620 15314 13539 13539 NC3230 I 4223 C 3338 C 4132 C 4132 X 3065 1999 2669 897 897 All Sawn
28 C 15 C 14 C 39 C 39 X 51 105 89 38 38 C3202 F 4207 C 3324 C 4094 C 4094 X 3014 1894 2581 858 858 NC413 CB 390 CB 441 CB 309 CB 309 X 289 256 325 734 734 All Ven
6 CB 9 CB 14 CB 6 CB 6 X 10 9 4 12 12 C407 CB 382 CB 427 CB 304 CB 304 X 279 247 321 722 722 NC
4535 C 5369 C 5282 C 4625 4625 X 645 323 432 462 462 All Ply145 C 214 C 150 C 139 I 139 X 16 4 45 65 65 C
4391 C 5155 C 5132 C 4486 I 4486 X 629 319 387 398 398 NC
2946 I 2082 I 1825 I 1411 CB 1411 X 1316 2163 2420 2834 2834 All Logs Myanmar84 CB 106 F 165 CB 32 CB 32 X 131 94 35 168 168 C
2862 CBI 1976 CBI 1660 CBI 1379 CB 1379 X 1185 2069 2385 2666 2666 NC468 CB 322 I 573 I 178 CB 178 X 1062 1288 1037 1432 1432 All Sawn48 CB 5 CB 3 CB 6 CB 6 X 13 74 77 74 74 C
420 CB 316 CBI 570 CBI 172 CB 172 X 1050 1214 960 1359 1358 NC9 CB 16 CB 28 CB 29 CB 29 X 13 6 4 3 3 All Ven1 CB 1 CB 1 CB 2 CB 2 X 1 1 1 0 0 C9 CB 15 CB 27 CB 27 CB 27 X 11 5 3 3 3 NC
60 CB 69 CBI 66 I 18 CB 18 X 50 43 53 100 100 All Ply6 CB 13 CBI 29 CB 8 CB 8 X 7 14 4 24 24 C
54 CB 56 CBI 37 CBI 10 CB 10 X 43 30 49 76 76 NC
2014 I 2283 I 2835 I 2515 I 1930 I 522 625 73 393 978 All Logs2 CB 0 CBR 0 CBR 0 CB 0 X 48 50 50 50 50 C
2012 2282 2835 2515 1930 I 474 576 23 343 928 NC49 CB 48 I 53 CB 40 CB 40 X 12 13 8 21 21 All Sawn3 CB 1 F 3 CB 1 CB 1 X 7 9 8 9 9 C
46 CB 47 CB 50 CB 39 CB 39 X 5 4 1 12 12 NC58 CB 42 CB 20 CB 11 CB 11 X 22 38 61 70 70 All Ven0 CB 0 I 0 CBR 0 CB 0 X 0 0 1 1 1 C
58 CB 42 CB 20 CB 11 CB 11 X 22 38 60 69 69 NC4 CB 5 CB 6 CB 4 CB 4 X 9 10 9 11 11 All Ply1 CB 1 CB 1 CB 1 CB 1 X 2 3 4 4 4 C4 CB 4 CB 5 CB 3 CB 3 X 7 7 5 7 7 NC
0 R 1 I 0 R 4 I 4 X 1006 1100 982 806 943 All Logs Philippines0 R 0 R 0 R 1 1 X 8 3 7 3 4 C0 1 CB 0 3 CB 3 X 998 1097 976 803 939 NC
130 186 I 213 I 218 I 237 520 507 323 274 444 All Sawn0 1 CB 2 CB 4 CB 0 R 45 25 38 11 17 C
130 184 211 C 215 237 475 482 285 264 427 NC7 6 7 4 7 193 126 142 123 157 All Ven1 0 R 0 R 0 R 0 R 2 8 9 3 5 C6 6 7 4 7 191 118 134 120 152 NC
40 20 37 43 I 52 418 442 364 265 332 All Ply22 17 27 38 43 48 48 27 19 52 C18 3 9 6 C 9 370 394 337 246 280 NC
8 I 3 C 7 I 11 CB 11 X 5558 5601 5625 5392 5361 All Logs Thailand0 CBR 0 C 1 CB 3 CB 3 X 15 13 12 12 21 C8 C 3 C 5 C 8 CB 8 X 5544 5588 5613 5381 5341 NC
1954 I 1876 I 2606 C 1623 C 1623 X 2836 2908 2296 3540 2916 All Sawn1 CB 0 CR 0 CR 0 CR 0 RX 154 151 176 121 121 C
1953 C 1876 CB 2606 C 1623 C 1623 X 2681 2758 2119 3419 2795 NC4 CB 6 CB 2 I 1 I 1 X 180 186 194 195 195 All Ven0 CBR 3 CB 1 CB 0 CBR 0 RX 3 1 3 4 4 C4 CB 3 CB 2 C 1 C 1 X 177 185 191 190 190 NC
54 CB 28 I 50 I 59 I 59 X 231 354 293 278 278 All Ply20 CB 21 CB 47 CBI 42 C 42 X 72 163 102 127 127 C34 CB 7 C 2 C 17 CB 17 X 160 192 191 151 151 NC
Papua New Guinea
85
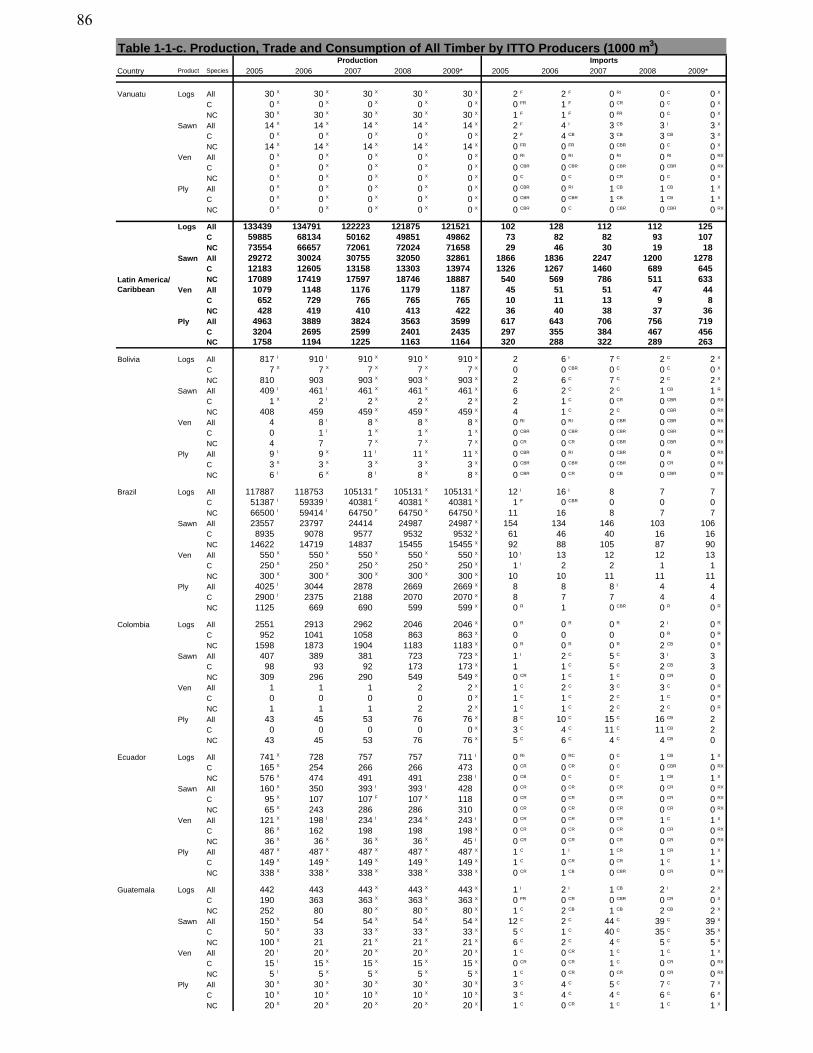
Table 1-1-c. Production, Trade and Consumption of All Timber by ITTO Producers (1000 m3)
Country Product Species 2005 2006 2007 2008 2009* 2005 2006 2007 2008 2009*
Production Imports
Vanuatu Logs All 30 X 30 X 30 X 30 X 30 X 2 F 2 F 0 RI 0 C 0 X
C 0 X 0 X 0 X 0 X 0 X 0 FR 1 F 0 CR 0 C 0 X
NC 30 X 30 X 30 X 30 X 30 X 1 F 1 F 0 FR 0 C 0 X
Sawn All 14 X 14 X 14 X 14 X 14 X 2 F 4 I 3 CB 3 I 3 X
C 0 X 0 X 0 X 0 X 0 X 2 F 4 CB 3 CB 3 CB 3 X
NC 14 X 14 X 14 X 14 X 14 X 0 FR 0 FR 0 CBR 0 C 0 X
Ven All 0 X 0 X 0 X 0 X 0 X 0 RI 0 RI 0 RI 0 RI 0 RX
C 0 X 0 X 0 X 0 X 0 X 0 CBR 0 CBR 0 CBR 0 CBR 0 RX
NC 0 X 0 X 0 X 0 X 0 X 0 C 0 C 0 CR 0 C 0 X
Ply All 0 X 0 X 0 X 0 X 0 X 0 CBR 0 RI 1 CB 1 CB 1 X
C 0 X 0 X 0 X 0 X 0 X 0 CBR 0 CBR 1 CB 1 CB 1 X
NC 0 X 0 X 0 X 0 X 0 X 0 CBR 0 C 0 CBR 0 CBR 0 RX
Logs All 133439 134791 122223 121875 121521 102 128 112 112 125C 59885 68134 50162 49851 49862 73 82 82 93 107NC 73554 66657 72061 72024 71658 29 46 30 19 18
Sawn All 29272 30024 30755 32050 32861 1866 1836 2247 1200 1278C 12183 12605 13158 13303 13974 1326 1267 1460 689 645NC 17089 17419 17597 18746 18887 540 569 786 511 633
Ven All 1079 1148 1176 1179 1187 45 51 51 47 44C 652 729 765 765 765 10 11 13 9 8NC 428 419 410 413 422 36 40 38 37 36
Ply All 4963 3889 3824 3563 3599 617 643 706 756 719C 3204 2695 2599 2401 2435 297 355 384 467 456NC 1758 1194 1225 1163 1164 320 288 322 289 263
Bolivia Logs All 817 I 910 I 910 X 910 X 910 X 2 6 I 7 C 2 C 2 X
C 7 X 7 X 7 X 7 X 7 X 0 0 CBR 0 C 0 C 0 X
NC 810 903 903 X 903 X 903 X 2 6 C 7 C 2 C 2 X
Sawn All 409 I 461 I 461 X 461 X 461 X 6 2 C 2 C 1 CB 1 R
C 1 X 2 I 2 X 2 X 2 X 2 1 C 0 CR 0 CBR 0 RX
NC 408 459 459 X 459 X 459 X 4 1 C 2 C 0 CBR 0 RX
Ven All 4 8 I 8 X 8 X 8 X 0 RI 0 RI 0 CBR 0 CBR 0 RX
C 0 1 I 1 X 1 X 1 X 0 CBR 0 CBR 0 CBR 0 CBR 0 RX
NC 4 7 7 X 7 X 7 X 0 CR 0 CR 0 CBR 0 CBR 0 RX
Ply All 9 I 9 X 11 I 11 X 11 X 0 CBR 0 RI 0 CBR 0 RI 0 RX
C 3 X 3 X 3 X 3 X 3 X 0 CBR 0 CBR 0 CBR 0 CR 0 RX
NC 6 I 6 X 8 I 8 X 8 X 0 CBR 0 CR 0 CB 0 CBR 0 RX
Brazil Logs All 117887 118753 105131 F 105131 X 105131 X 12 I 16 I 8 7 7
C 51387 I 59339 I 40381 F 40381 X 40381 X 1 F 0 CBR 0 0 0
NC 66500 I 59414 I 64750 F 64750 X 64750 X 11 16 8 7 7
Sawn All 23557 23797 24414 24987 24987 X 154 134 146 103 106
C 8935 9078 9577 9532 9532 X 61 46 40 16 16
NC 14622 14719 14837 15455 15455 X 92 88 105 87 90
Ven All 550 X 550 X 550 X 550 X 550 X 10 I 13 12 12 13
C 250 X 250 X 250 X 250 X 250 X 1 I 2 2 1 1
NC 300 X 300 X 300 X 300 X 300 X 10 10 11 11 11
Ply All 4025 I 3044 2878 2669 2669 X 8 8 8 I 4 4
C 2900 I 2375 2188 2070 2070 X 8 7 7 4 4
NC 1125 669 690 599 599 X 0 R 1 0 CBR 0 R 0 R
Colombia Logs All 2551 2913 2962 2046 2046 X 0 R 0 R 0 R 2 I 0 R
C 952 1041 1058 863 863 X 0 0 0 0 R 0 R
NC 1598 1873 1904 1183 1183 X 0 R 0 R 0 R 2 CB 0 R
Sawn All 407 389 381 723 723 X 1 I 2 C 5 C 3 I 3
C 98 93 92 173 173 X 1 1 C 5 C 2 CB 3
NC 309 296 290 549 549 X 0 CR 1 C 1 C 0 CR 0
Ven All 1 1 1 2 2 X 1 C 2 C 3 C 3 C 0 R
C 0 0 0 0 0 X 1 C 1 C 2 C 1 C 0 R
NC 1 1 1 2 2 X 1 C 1 C 2 C 2 C 0 R
Ply All 43 45 53 76 76 X 8 C 10 C 15 C 16 CB 2
C 0 0 0 0 0 X 3 C 4 C 11 C 11 CB 2
NC 43 45 53 76 76 X 5 C 6 C 4 C 4 CB 0
Ecuador Logs All 741 X 728 757 757 711 I 0 RI 0 RC 0 C 1 CB 1 X
C 165 X 254 266 266 473 0 CR 0 CR 0 C 0 CBR 0 RX
NC 576 X 474 491 491 238 I 0 CB 0 C 0 C 1 CB 1 X
Sawn All 160 X 350 393 I 393 I 428 0 CR 0 CR 0 CR 0 CR 0 RX
C 95 X 107 107 F 107 X 118 0 CR 0 CR 0 CR 0 CR 0 RX
NC 65 X 243 286 286 310 0 CR 0 CR 0 CR 0 CR 0 RX
Ven All 121 X 198 I 234 I 234 X 243 I 0 CR 0 CR 0 CR 1 C 1 X
C 86 X 162 198 198 198 X 0 CR 0 CR 0 CR 0 CR 0 RX
NC 36 X 36 X 36 X 36 X 45 I 0 CR 0 CR 0 CR 0 CR 0 RX
Ply All 487 X 487 X 487 X 487 X 487 X 1 C 1 I 1 CR 1 CR 1 X
C 149 X 149 X 149 X 149 X 149 X 1 C 0 CR 0 CR 1 C 1 X
NC 338 X 338 X 338 X 338 X 338 X 0 CR 1 CB 0 CBR 0 CR 0 RX
Guatemala Logs All 442 443 443 X 443 X 443 X 1 I 2 I 1 CB 2 I 2 X
C 190 363 363 X 363 X 363 X 0 FR 0 CR 0 CBR 0 CR 0 X
NC 252 80 80 X 80 X 80 X 1 C 2 CB 1 CB 2 CB 2 X
Sawn All 150 X 54 54 X 54 X 54 X 12 C 2 C 44 C 39 C 39 X
C 50 X 33 33 X 33 X 33 X 5 C 1 C 40 C 35 C 35 X
NC 100 X 21 21 X 21 X 21 X 6 C 2 C 4 C 5 C 5 X
Ven All 20 I 20 X 20 X 20 X 20 X 1 C 0 CR 1 C 1 C 1 X
C 15 I 15 X 15 X 15 X 15 X 0 CR 0 CR 1 C 0 CR 0 RX
NC 5 I 5 X 5 X 5 X 5 X 1 C 0 CR 0 CR 0 CR 0 RX
Ply All 30 X 30 X 30 X 30 X 30 X 3 C 4 C 5 C 7 C 7 X
C 10 X 10 X 10 X 10 X 10 X 3 C 4 C 4 C 6 C 6 X
NC 20 X 20 X 20 X 20 X 20 X 1 C 0 CR 1 C 1 C 1 X
Latin America/Caribbean
86
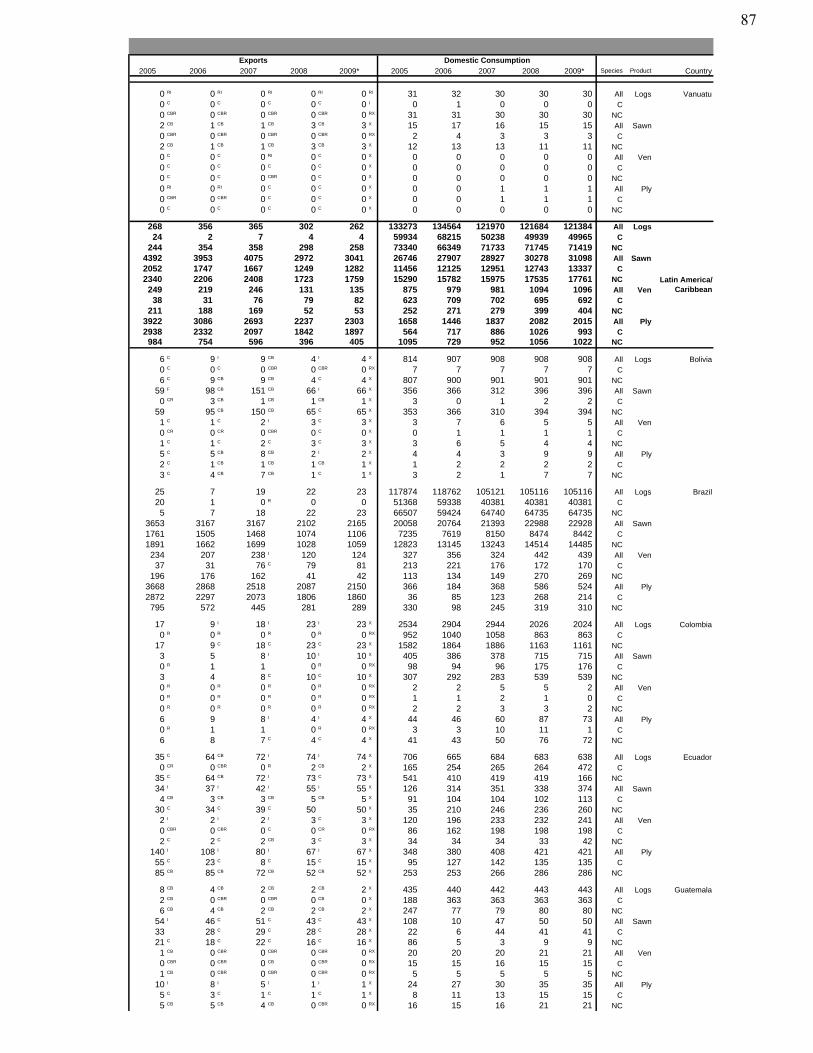
2005 2006 2007 2008 2009* 2005 2006 2007 2008 2009* Species Product Country
Domestic ConsumptionExports
0 RI 0 RI 0 RI 0 RI 0 RI 31 32 30 30 30 All Logs Vanuatu0 C 0 C 0 C 0 C 0 I 0 1 0 0 0 C0 CBR 0 CBR 0 CBR 0 CBR 0 RX 31 31 30 30 30 NC2 CB 1 CB 1 CB 3 CB 3 X 15 17 16 15 15 All Sawn0 CBR 0 CBR 0 CBR 0 CBR 0 RX 2 4 3 3 3 C2 CB 1 CB 1 CB 3 CB 3 X 12 13 13 11 11 NC0 C 0 C 0 RI 0 C 0 X 0 0 0 0 0 All Ven0 C 0 C 0 C 0 C 0 X 0 0 0 0 0 C0 C 0 C 0 CBR 0 C 0 X 0 0 0 0 0 NC0 RI 0 RI 0 C 0 C 0 X 0 0 1 1 1 All Ply0 CBR 0 CBR 0 C 0 C 0 X 0 0 1 1 1 C0 C 0 C 0 C 0 C 0 X 0 0 0 0 0 NC
268 356 365 302 262 133273 134564 121970 121684 121384 All Logs24 2 7 4 4 59934 68215 50238 49939 49965 C
244 354 358 298 258 73340 66349 71733 71745 71419 NC4392 3953 4075 2972 3041 26746 27907 28927 30278 31098 All Sawn2052 1747 1667 1249 1282 11456 12125 12951 12743 13337 C2340 2206 2408 1723 1759 15290 15782 15975 17535 17761 NC249 219 246 131 135 875 979 981 1094 1096 All Ven38 31 76 79 82 623 709 702 695 692 C
211 188 169 52 53 252 271 279 399 404 NC3922 3086 2693 2237 2303 1658 1446 1837 2082 2015 All Ply2938 2332 2097 1842 1897 564 717 886 1026 993 C984 754 596 396 405 1095 729 952 1056 1022 NC
6 C 9 I 9 CB 4 I 4 X 814 907 908 908 908 All Logs Bolivia0 C 0 C 0 CBR 0 CBR 0 RX 7 7 7 7 7 C6 C 9 CB 9 CB 4 C 4 X 807 900 901 901 901 NC
59 F 98 CB 151 CB 66 I 66 X 356 366 312 396 396 All Sawn0 CR 3 CB 1 CB 1 CB 1 X 3 0 1 2 2 C
59 95 CB 150 CB 65 C 65 X 353 366 310 394 394 NC1 C 1 C 2 I 3 C 3 X 3 7 6 5 5 All Ven0 CR 0 CR 0 CBR 0 C 0 X 0 1 1 1 1 C1 C 1 C 2 C 3 C 3 X 3 6 5 4 4 NC5 C 5 CB 8 CB 2 I 2 X 4 4 3 9 9 All Ply2 C 1 CB 1 CB 1 CB 1 X 1 2 2 2 2 C3 C 4 CB 7 CB 1 C 1 X 3 2 1 7 7 NC
25 7 19 22 23 117874 118762 105121 105116 105116 All Logs Brazil20 1 0 R 0 0 51368 59338 40381 40381 40381 C5 7 18 22 23 66507 59424 64740 64735 64735 NC
3653 3167 3167 2102 2165 20058 20764 21393 22988 22928 All Sawn1761 1505 1468 1074 1106 7235 7619 8150 8474 8442 C1891 1662 1699 1028 1059 12823 13145 13243 14514 14485 NC234 207 238 I 120 124 327 356 324 442 439 All Ven37 31 76 C 79 81 213 221 176 172 170 C
196 176 162 41 42 113 134 149 270 269 NC3668 2868 2518 2087 2150 366 184 368 586 524 All Ply2872 2297 2073 1806 1860 36 85 123 268 214 C795 572 445 281 289 330 98 245 319 310 NC
17 9 I 18 I 23 I 23 X 2534 2904 2944 2026 2024 All Logs Colombia0 R 0 R 0 R 0 R 0 RX 952 1040 1058 863 863 C
17 9 C 18 C 23 C 23 X 1582 1864 1886 1163 1161 NC3 5 8 I 10 I 10 X 405 386 378 715 715 All Sawn0 R 1 1 0 R 0 RX 98 94 96 175 176 C3 4 8 C 10 C 10 X 307 292 283 539 539 NC0 R 0 R 0 R 0 R 0 RX 2 2 5 5 2 All Ven0 R 0 R 0 R 0 R 0 RX 1 1 2 1 0 C0 R 0 R 0 R 0 R 0 RX 2 2 3 3 2 NC6 9 8 I 4 I 4 X 44 46 60 87 73 All Ply0 R 1 1 0 R 0 RX 3 3 10 11 1 C6 8 7 C 4 C 4 X 41 43 50 76 72 NC
35 C 64 CB 72 I 74 I 74 X 706 665 684 683 638 All Logs Ecuador0 CR 0 CBR 0 R 2 CB 2 X 165 254 265 264 472 C
35 C 64 CB 72 I 73 C 73 X 541 410 419 419 166 NC34 I 37 I 42 I 55 I 55 X 126 314 351 338 374 All Sawn4 CB 3 CB 3 CB 5 CB 5 X 91 104 104 102 113 C
30 C 34 C 39 C 50 50 X 35 210 246 236 260 NC2 I 2 I 2 I 3 C 3 X 120 196 233 232 241 All Ven0 CBR 0 CBR 0 C 0 CR 0 RX 86 162 198 198 198 C2 C 2 C 2 CB 3 C 3 X 34 34 34 33 42 NC
140 I 108 I 80 I 67 I 67 X 348 380 408 421 421 All Ply55 C 23 C 8 C 15 C 15 X 95 127 142 135 135 C85 CB 85 CB 72 CB 52 CB 52 X 253 253 266 286 286 NC
8 CB 4 CB 2 CB 2 CB 2 X 435 440 442 443 443 All Logs Guatemala2 CB 0 CBR 0 CBR 0 CB 0 X 188 363 363 363 363 C6 CB 4 CB 2 CB 2 CB 2 X 247 77 79 80 80 NC
54 I 46 C 51 C 43 C 43 X 108 10 47 50 50 All Sawn33 28 C 29 C 28 C 28 X 22 6 44 41 41 C21 C 18 C 22 C 16 C 16 X 86 5 3 9 9 NC1 CB 0 CBR 0 CBR 0 CBR 0 RX 20 20 20 21 21 All Ven0 CBR 0 CBR 0 CB 0 CBR 0 RX 15 15 16 15 15 C1 CB 0 CBR 0 CBR 0 CBR 0 RX 5 5 5 5 5 NC
10 I 8 I 5 I 1 I 1 X 24 27 30 35 35 All Ply5 C 3 C 1 C 1 C 1 X 8 11 13 15 15 C5 CB 5 CB 4 CB 0 CBR 0 RX 16 15 16 21 21 NC
Latin America/Caribbean
87
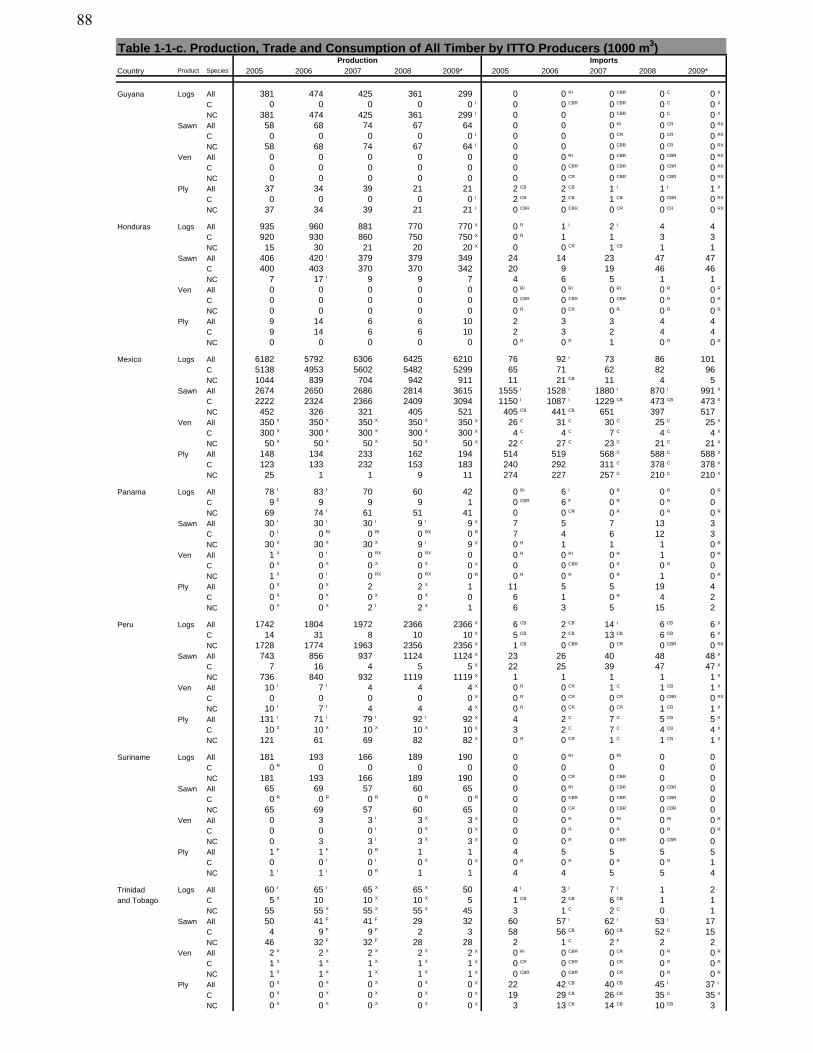
Table 1-1-c. Production, Trade and Consumption of All Timber by ITTO Producers (1000 m3)
Country Product Species 2005 2006 2007 2008 2009* 2005 2006 2007 2008 2009*
Production Imports
Guyana Logs All 381 474 425 361 299 0 0 RI 0 CBR 0 C 0 X
C 0 0 0 0 0 I 0 0 CBR 0 CBR 0 C 0 X
NC 381 474 425 361 299 I 0 0 0 CBR 0 C 0 X
Sawn All 58 68 74 67 64 0 0 0 RI 0 CR 0 RX
C 0 0 0 0 0 I 0 0 0 CR 0 CR 0 RX
NC 58 68 74 67 64 I 0 0 0 CBR 0 CR 0 RX
Ven All 0 0 0 0 0 0 0 RI 0 CBR 0 CBR 0 RX
C 0 0 0 0 0 0 0 CBR 0 CBR 0 CBR 0 RX
NC 0 0 0 0 0 0 0 CR 0 CBR 0 CBR 0 RX
Ply All 37 34 39 21 21 2 CB 2 CB 1 I 1 I 1 X
C 0 0 0 0 0 I 2 CB 2 CB 1 CB 0 CBR 0 RX
NC 37 34 39 21 21 I 0 CBR 0 CBR 0 CR 0 CR 0 RX
Honduras Logs All 935 960 881 770 770 X 0 R 1 I 2 I 4 4
C 920 930 860 750 750 X 0 R 1 1 3 3
NC 15 30 21 20 20 X 0 0 CR 1 CB 1 1
Sawn All 406 420 I 379 379 349 24 14 23 47 47
C 400 403 370 370 342 20 9 19 46 46
NC 7 17 I 9 9 7 4 6 5 1 1
Ven All 0 0 0 0 0 0 RI 0 RI 0 RI 0 R 0 R
C 0 0 0 0 0 0 CBR 0 CBR 0 CBR 0 R 0 R
NC 0 0 0 0 0 0 R 0 CR 0 R 0 R 0 R
Ply All 9 14 6 6 10 2 3 3 4 4
C 9 14 6 6 10 2 3 2 4 4
NC 0 0 0 0 0 0 R 0 R 1 0 R 0 R
Mexico Logs All 6182 5792 6306 6425 6210 76 92 I 73 86 101
C 5138 4953 5602 5482 5299 65 71 62 82 96
NC 1044 839 704 942 911 11 21 CB 11 4 5
Sawn All 2674 2650 2686 2814 3615 1555 I 1528 I 1880 I 870 I 991 X
C 2222 2324 2366 2409 3094 1150 I 1087 I 1229 CB 473 CB 473 X
NC 452 326 321 405 521 405 CB 441 CB 651 397 517
Ven All 350 X 350 X 350 X 350 X 350 X 26 C 31 C 30 C 25 C 25 X
C 300 X 300 X 300 X 300 X 300 X 4 C 4 C 7 C 4 C 4 X
NC 50 X 50 X 50 X 50 X 50 X 22 C 27 C 23 C 21 C 21 X
Ply All 148 134 233 162 194 514 519 568 C 588 C 588 X
C 123 133 232 153 183 240 292 311 C 378 C 378 X
NC 25 1 1 9 11 274 227 257 C 210 C 210 X
Panama Logs All 78 I 83 I 70 60 42 0 RI 6 I 0 R 0 R 0 R
C 9 F 9 9 9 1 0 CBR 6 F 0 R 0 R 0
NC 69 74 I 61 51 41 0 0 CR 0 R 0 R 0 R
Sawn All 30 I 30 I 30 I 9 I 9 X 7 5 7 13 3
C 0 I 0 RI 0 RI 0 RX 0 R 7 4 6 12 3
NC 30 X 30 X 30 X 9 I 9 X 0 R 1 1 1 0 R
Ven All 1 X 0 I 0 RX 0 RX 0 0 R 0 RI 0 R 1 0 R
C 0 X 0 X 0 X 0 X 0 X 0 0 CBR 0 R 0 R 0
NC 1 X 0 I 0 RX 0 RX 0 R 0 R 0 R 0 R 1 0 R
Ply All 0 X 0 X 2 2 X 1 11 5 5 19 4
C 0 X 0 X 0 X 0 X 0 6 1 0 R 4 2
NC 0 X 0 X 2 I 2 X 1 6 3 5 15 2
Peru Logs All 1742 1804 1972 2366 2366 X 6 CB 2 CB 14 I 6 CB 6 X
C 14 31 8 10 10 X 5 CB 2 CB 13 CB 6 CB 6 X
NC 1728 1774 1963 2356 2356 X 1 CB 0 CBR 0 CR 0 CBR 0 RX
Sawn All 743 856 937 1124 1124 X 23 26 40 48 48 X
C 7 16 4 5 5 X 22 25 39 47 47 X
NC 736 840 932 1119 1119 X 1 1 1 1 1 X
Ven All 10 I 7 I 4 4 4 X 0 R 0 CR 1 C 1 CB 1 X
C 0 0 0 0 0 X 0 R 0 CR 0 CR 0 CBR 0 RX
NC 10 I 7 I 4 4 4 X 0 R 0 CR 0 CR 1 CB 1 X
Ply All 131 I 71 I 79 I 92 I 92 X 4 2 C 7 C 5 CB 5 X
C 10 X 10 X 10 X 10 X 10 X 3 2 C 7 C 4 CB 4 X
NC 121 61 69 82 82 X 0 R 0 CR 1 C 1 CB 1 X
Suriname Logs All 181 193 166 189 190 0 0 RI 0 RI 0 0
C 0 R 0 0 0 0 0 0 0 0 0
NC 181 193 166 189 190 0 0 CR 0 CBR 0 0
Sawn All 65 69 57 60 65 0 0 RI 0 CBR 0 CBR 0
C 0 R 0 R 0 R 0 R 0 R 0 0 CBR 0 CBR 0 CBR 0
NC 65 69 57 60 65 0 0 CR 0 CBR 0 CBR 0
Ven All 0 3 3 I 3 X 3 X 0 0 R 0 RI 0 RI 0 R
C 0 0 0 I 0 X 0 X 0 0 R 0 R 0 R 0 R
NC 0 3 3 I 3 X 3 X 0 0 R 0 CBR 0 CBR 0
Ply All 1 F 1 F 0 R 1 1 4 5 5 5 5
C 0 0 I 0 I 0 X 0 X 0 R 0 R 0 R 0 R 1
NC 1 I 1 I 0 R 1 1 4 4 5 5 4
Trinidad Logs All 60 I 65 I 65 X 65 X 50 4 I 3 I 7 I 1 2
and Tobago C 5 X 10 10 X 10 X 5 1 CB 2 CB 6 CB 1 1
NC 55 55 X 55 X 55 X 45 3 1 C 2 C 0 1
Sawn All 50 41 F 41 F 29 32 60 57 I 62 I 53 I 17
C 4 9 F 9 F 2 3 58 56 CB 60 CB 52 C 15
NC 46 32 F 32 F 28 28 2 1 C 2 F 2 2
Ven All 2 X 2 X 2 X 2 X 2 X 0 RI 0 CBR 0 CR 0 R 0 R
C 1 X 1 X 1 X 1 X 1 X 0 CR 0 CBR 0 CR 0 R 0 R
NC 1 X 1 X 1 X 1 X 1 X 0 CBR 0 CBR 0 CR 0 R 0 R
Ply All 0 X 0 X 0 X 0 X 0 X 22 42 CB 40 CB 45 I 37 I
C 0 X 0 X 0 X 0 X 0 X 19 29 CB 26 CB 35 C 35 X
NC 0 X 0 X 0 X 0 X 0 X 3 13 CB 14 CB 10 CB 3
88
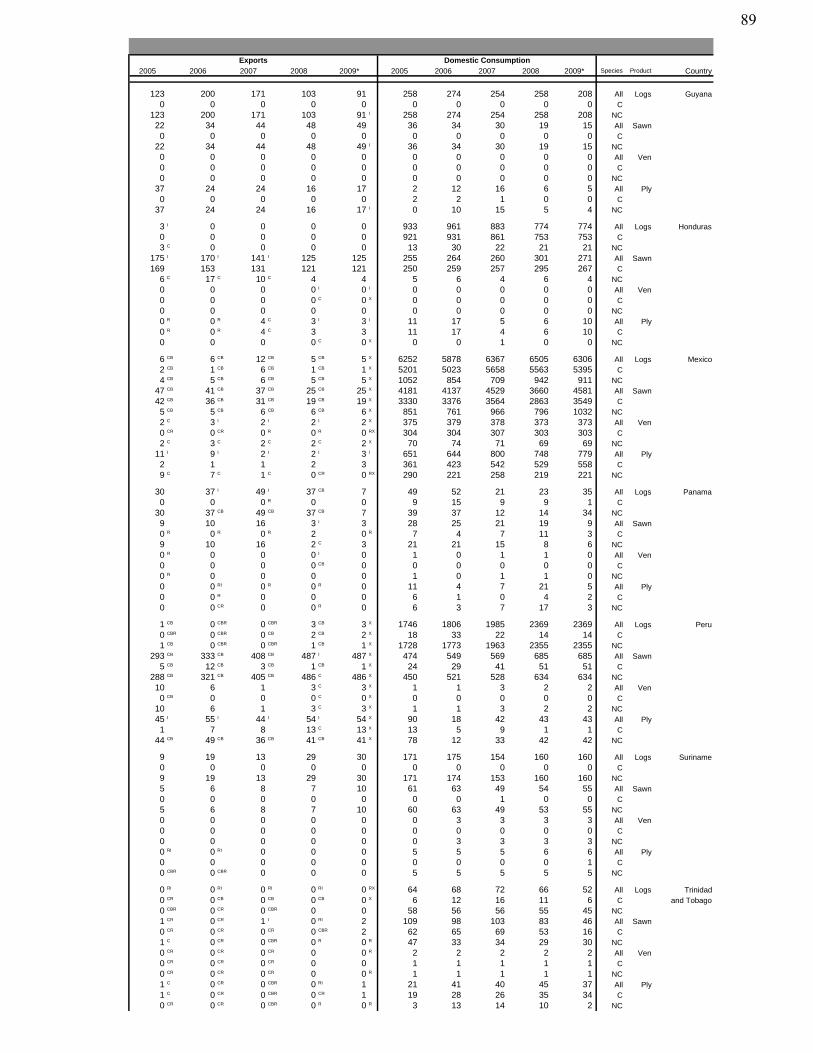
2005 2006 2007 2008 2009* 2005 2006 2007 2008 2009* Species Product Country
Domestic ConsumptionExports
123 200 171 103 91 258 274 254 258 208 All Logs Guyana0 0 0 0 0 0 0 0 0 0 C
123 200 171 103 91 I 258 274 254 258 208 NC22 34 44 48 49 36 34 30 19 15 All Sawn0 0 0 0 0 0 0 0 0 0 C
22 34 44 48 49 I 36 34 30 19 15 NC0 0 0 0 0 0 0 0 0 0 All Ven0 0 0 0 0 0 0 0 0 0 C0 0 0 0 0 0 0 0 0 0 NC
37 24 24 16 17 2 12 16 6 5 All Ply0 0 0 0 0 2 2 1 0 0 C
37 24 24 16 17 I 0 10 15 5 4 NC
3 I 0 0 0 0 933 961 883 774 774 All Logs Honduras0 0 0 0 0 921 931 861 753 753 C3 C 0 0 0 0 13 30 22 21 21 NC
175 I 170 I 141 I 125 125 255 264 260 301 271 All Sawn169 153 131 121 121 250 259 257 295 267 C
6 C 17 C 10 C 4 4 5 6 4 6 4 NC0 0 0 0 I 0 I 0 0 0 0 0 All Ven0 0 0 0 C 0 X 0 0 0 0 0 C0 0 0 0 0 0 0 0 0 0 NC0 R 0 R 4 C 3 I 3 I 11 17 5 6 10 All Ply0 R 0 R 4 C 3 3 11 17 4 6 10 C0 0 0 0 C 0 X 0 0 1 0 0 NC
6 CB 6 CB 12 CB 5 CB 5 X 6252 5878 6367 6505 6306 All Logs Mexico2 CB 1 CB 6 CB 1 CB 1 X 5201 5023 5658 5563 5395 C4 CB 5 CB 6 CB 5 CB 5 X 1052 854 709 942 911 NC
47 CB 41 CB 37 CB 25 CB 25 X 4181 4137 4529 3660 4581 All Sawn42 CB 36 CB 31 CB 19 CB 19 X 3330 3376 3564 2863 3549 C5 CB 5 CB 6 CB 6 CB 6 X 851 761 966 796 1032 NC2 C 3 I 2 I 2 I 2 X 375 379 378 373 373 All Ven0 CR 0 CR 0 R 0 R 0 RX 304 304 307 303 303 C2 C 3 C 2 C 2 C 2 X 70 74 71 69 69 NC
11 I 9 I 2 I 2 I 3 I 651 644 800 748 779 All Ply2 1 1 2 3 361 423 542 529 558 C9 C 7 C 1 C 0 CR 0 RX 290 221 258 219 221 NC
30 37 I 49 I 37 CB 7 49 52 21 23 35 All Logs Panama0 0 0 R 0 0 9 15 9 9 1 C
30 37 CB 49 CB 37 CB 7 39 37 12 14 34 NC9 10 16 3 I 3 28 25 21 19 9 All Sawn0 R 0 R 0 R 2 0 R 7 4 7 11 3 C9 10 16 2 C 3 21 21 15 8 6 NC0 R 0 0 0 I 0 1 0 1 1 0 All Ven0 0 0 0 CB 0 0 0 0 0 0 C0 R 0 0 0 0 1 0 1 1 0 NC0 0 RI 0 R 0 R 0 11 4 7 21 5 All Ply0 0 R 0 0 0 6 1 0 4 2 C0 0 CR 0 0 R 0 6 3 7 17 3 NC
1 CB 0 CBR 0 CBR 3 CB 3 X 1746 1806 1985 2369 2369 All Logs Peru0 CBR 0 CBR 0 CB 2 CB 2 X 18 33 22 14 14 C1 CB 0 CBR 0 CBR 1 CB 1 X 1728 1773 1963 2355 2355 NC
293 CB 333 CB 408 CB 487 I 487 X 474 549 569 685 685 All Sawn5 CB 12 CB 3 CB 1 CB 1 X 24 29 41 51 51 C
288 CB 321 CB 405 CB 486 C 486 X 450 521 528 634 634 NC10 6 1 3 C 3 X 1 1 3 2 2 All Ven0 CB 0 0 0 C 0 X 0 0 0 0 0 C
10 6 1 3 C 3 X 1 1 3 2 2 NC45 I 55 I 44 I 54 I 54 X 90 18 42 43 43 All Ply1 7 8 13 C 13 X 13 5 9 1 1 C
44 CB 49 CB 36 CB 41 CB 41 X 78 12 33 42 42 NC
9 19 13 29 30 171 175 154 160 160 All Logs Suriname0 0 0 0 0 0 0 0 0 0 C9 19 13 29 30 171 174 153 160 160 NC5 6 8 7 10 61 63 49 54 55 All Sawn0 0 0 0 0 0 0 1 0 0 C5 6 8 7 10 60 63 49 53 55 NC0 0 0 0 0 0 3 3 3 3 All Ven0 0 0 0 0 0 0 0 0 0 C0 0 0 0 0 0 3 3 3 3 NC0 RI 0 RI 0 0 0 5 5 5 6 6 All Ply0 0 0 0 0 0 0 0 0 1 C0 CBR 0 CBR 0 0 0 5 5 5 5 5 NC
0 RI 0 RI 0 RI 0 RI 0 RX 64 68 72 66 52 All Logs Trinidad0 CR 0 CB 0 CB 0 CB 0 X 6 12 16 11 6 C and Tobago0 CBR 0 CR 0 CBR 0 0 58 56 56 55 45 NC1 CR 0 CR 1 I 0 RI 2 109 98 103 83 46 All Sawn0 CR 0 CR 0 CR 0 CBR 2 62 65 69 53 16 C1 C 0 CR 0 CBR 0 R 0 R 47 33 34 29 30 NC0 CR 0 CR 0 CR 0 0 R 2 2 2 2 2 All Ven0 CR 0 CR 0 CR 0 0 1 1 1 1 1 C0 CR 0 CR 0 CR 0 0 R 1 1 1 1 1 NC1 C 0 CR 0 CBR 0 RI 1 21 41 40 45 37 All Ply1 C 0 CR 0 CBR 0 CR 1 19 28 26 35 34 C0 CR 0 CR 0 CBR 0 R 0 R 3 13 14 10 2 NC
89
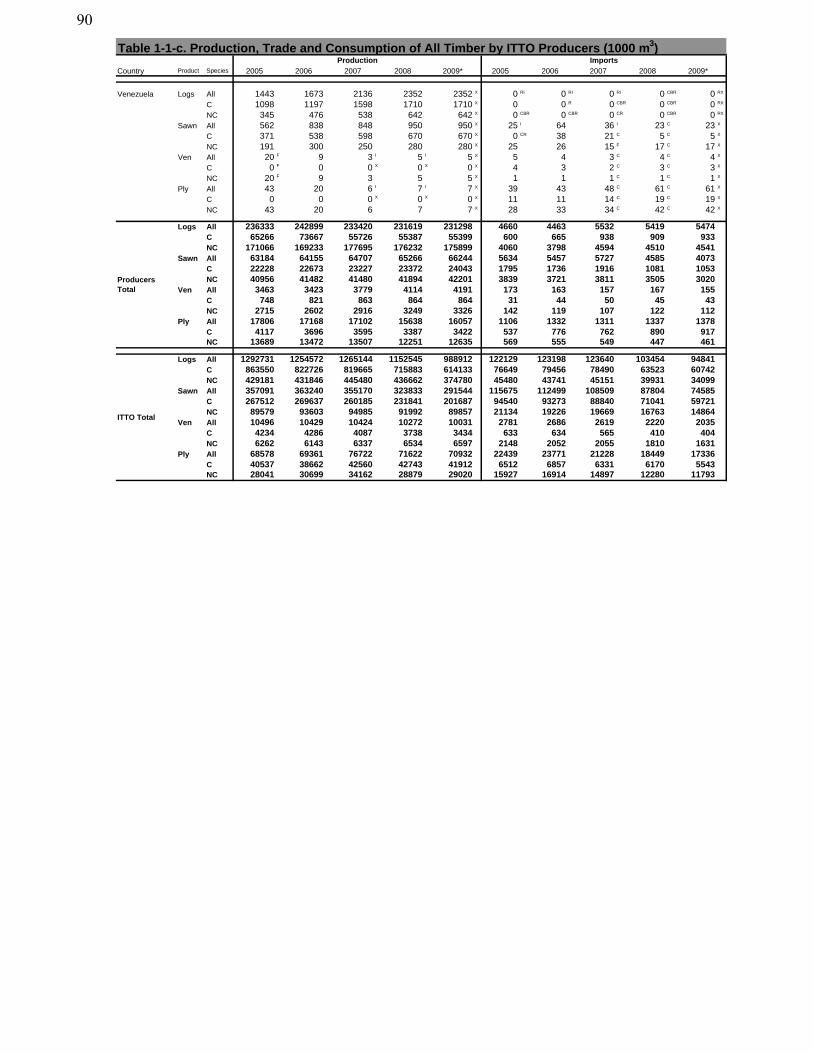
Table 1-1-c. Production, Trade and Consumption of All Timber by ITTO Producers (1000 m3)
Country Product Species 2005 2006 2007 2008 2009* 2005 2006 2007 2008 2009*
Production Imports
Venezuela Logs All 1443 1673 2136 2352 2352 X 0 RI 0 RI 0 RI 0 CBR 0 RX
C 1098 1197 1598 1710 1710 X 0 0 R 0 CBR 0 CBR 0 RX
NC 345 476 538 642 642 X 0 CBR 0 CBR 0 CR 0 CBR 0 RX
Sawn All 562 838 848 950 950 X 25 I 64 36 I 23 C 23 X
C 371 538 598 670 670 X 0 CR 38 21 C 5 C 5 X
NC 191 300 250 280 280 X 25 26 15 F 17 C 17 X
Ven All 20 F 9 3 I 5 I 5 X 5 4 3 C 4 C 4 X
C 0 F 0 0 X 0 X 0 X 4 3 2 C 3 C 3 X
NC 20 F 9 3 5 5 X 1 1 1 C 1 C 1 X
Ply All 43 20 6 I 7 I 7 X 39 43 48 C 61 C 61 X
C 0 0 0 X 0 X 0 X 11 11 14 C 19 C 19 X
NC 43 20 6 7 7 X 28 33 34 C 42 C 42 X
Logs All 236333 242899 233420 231619 231298 4660 4463 5532 5419 5474C 65266 73667 55726 55387 55399 600 665 938 909 933NC 171066 169233 177695 176232 175899 4060 3798 4594 4510 4541
Sawn All 63184 64155 64707 65266 66244 5634 5457 5727 4585 4073C 22228 22673 23227 23372 24043 1795 1736 1916 1081 1053NC 40956 41482 41480 41894 42201 3839 3721 3811 3505 3020
Ven All 3463 3423 3779 4114 4191 173 163 157 167 155C 748 821 863 864 864 31 44 50 45 43NC 2715 2602 2916 3249 3326 142 119 107 122 112
Ply All 17806 17168 17102 15638 16057 1106 1332 1311 1337 1378C 4117 3696 3595 3387 3422 537 776 762 890 917NC 13689 13472 13507 12251 12635 569 555 549 447 461
Logs All 1292731 1254572 1265144 1152545 988912 122129 123198 123640 103454 94841C 863550 822726 819665 715883 614133 76649 79456 78490 63523 60742NC 429181 431846 445480 436662 374780 45480 43741 45151 39931 34099
Sawn All 357091 363240 355170 323833 291544 115675 112499 108509 87804 74585C 267512 269637 260185 231841 201687 94540 93273 88840 71041 59721NC 89579 93603 94985 91992 89857 21134 19226 19669 16763 14864
Ven All 10496 10429 10424 10272 10031 2781 2686 2619 2220 2035C 4234 4286 4087 3738 3434 633 634 565 410 404NC 6262 6143 6337 6534 6597 2148 2052 2055 1810 1631
Ply All 68578 69361 76722 71622 70932 22439 23771 21228 18449 17336C 40537 38662 42560 42743 41912 6512 6857 6331 6170 5543NC 28041 30699 34162 28879 29020 15927 16914 14897 12280 11793
ProducersTotal
ITTO Total
90
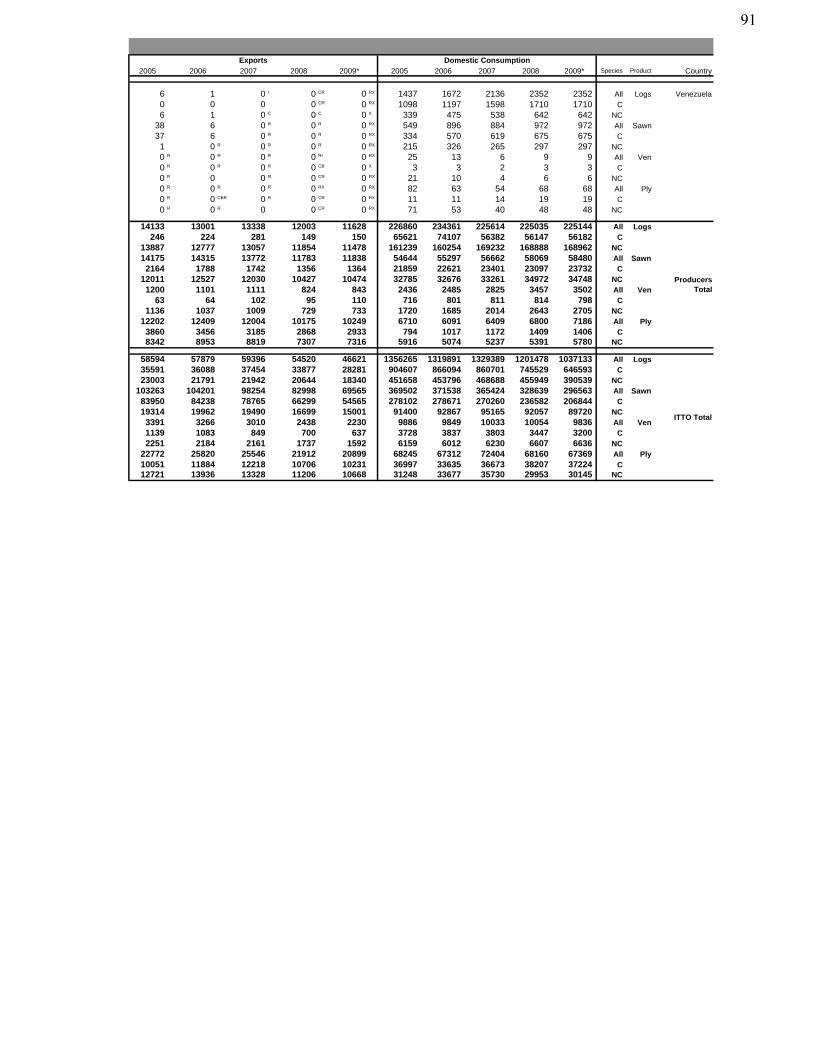
2005 2006 2007 2008 2009* 2005 2006 2007 2008 2009* Species Product Country
Domestic ConsumptionExports
6 1 0 I 0 CR 0 RX 1437 1672 2136 2352 2352 All Logs Venezuela0 0 0 0 CR 0 RX 1098 1197 1598 1710 1710 C6 1 0 C 0 C 0 X 339 475 538 642 642 NC
38 6 0 R 0 R 0 RX 549 896 884 972 972 All Sawn37 6 0 R 0 R 0 RX 334 570 619 675 675 C1 0 R 0 R 0 R 0 RX 215 326 265 297 297 NC0 R 0 R 0 R 0 RI 0 RX 25 13 6 9 9 All Ven0 R 0 R 0 R 0 CB 0 X 3 3 2 3 3 C0 R 0 0 R 0 CR 0 RX 21 10 4 6 6 NC0 R 0 R 0 R 0 RX 0 RX 82 63 54 68 68 All Ply0 R 0 CBR 0 R 0 CR 0 RX 11 11 14 19 19 C0 R 0 R 0 0 CR 0 RX 71 53 40 48 48 NC
14133 13001 13338 12003 11628 226860 234361 225614 225035 225144 All Logs246 224 281 149 150 65621 74107 56382 56147 56182 C
13887 12777 13057 11854 11478 161239 160254 169232 168888 168962 NC14175 14315 13772 11783 11838 54644 55297 56662 58069 58480 All Sawn2164 1788 1742 1356 1364 21859 22621 23401 23097 23732 C
12011 12527 12030 10427 10474 32785 32676 33261 34972 34748 NC1200 1101 1111 824 843 2436 2485 2825 3457 3502 All Ven
63 64 102 95 110 716 801 811 814 798 C1136 1037 1009 729 733 1720 1685 2014 2643 2705 NC
12202 12409 12004 10175 10249 6710 6091 6409 6800 7186 All Ply3860 3456 3185 2868 2933 794 1017 1172 1409 1406 C8342 8953 8819 7307 7316 5916 5074 5237 5391 5780 NC
58594 57879 59396 54520 46621 1356265 1319891 1329389 1201478 1037133 All Logs35591 36088 37454 33877 28281 904607 866094 860701 745529 646593 C23003 21791 21942 20644 18340 451658 453796 468688 455949 390539 NC
103263 104201 98254 82998 69565 369502 371538 365424 328639 296563 All Sawn83950 84238 78765 66299 54565 278102 278671 270260 236582 206844 C19314 19962 19490 16699 15001 91400 92867 95165 92057 89720 NC3391 3266 3010 2438 2230 9886 9849 10033 10054 9836 All Ven1139 1083 849 700 637 3728 3837 3803 3447 3200 C2251 2184 2161 1737 1592 6159 6012 6230 6607 6636 NC
22772 25820 25546 21912 20899 68245 67312 72404 68160 67369 All Ply10051 11884 12218 10706 10231 36997 33635 36673 38207 37224 C12721 13936 13328 11206 10668 31248 33677 35730 29953 30145 NC
ProducersTotal
ITTO Total
91
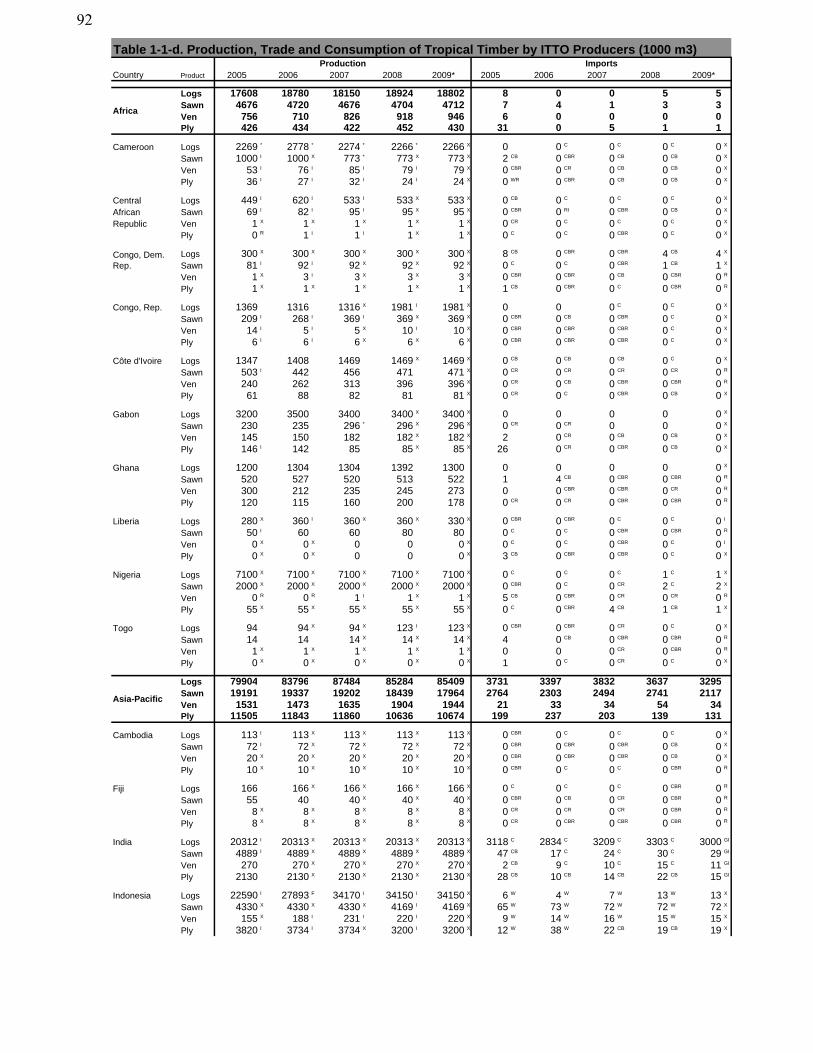
Table 1-1-d. Production, Trade and Consumption of Tropical Timber by ITTO Producers (1000 m3)
Country Product 2005 2006 2007 2008 2009* 2005 2006 2007 2008 2009*
Logs 17608 18780 18150 18924 18802 8 0 0 5 5Sawn 4676 4720 4676 4704 4712 7 4 1 3 3Ven 756 710 826 918 946 6 0 0 0 0Ply 426 434 422 452 430 31 0 5 1 1
Cameroon Logs 2269 * 2778 * 2274 * 2266 * 2266 X 0 0 C 0 C 0 C 0 X
Sawn 1000 I 1000 X 773 * 773 X 773 X 2 CB 0 CBR 0 CB 0 CB 0 X
Ven 53 I 76 I 85 I 79 I 79 X 0 CBR 0 CR 0 CB 0 CB 0 X
Ply 36 I 27 I 32 I 24 I 24 X 0 WR 0 CBR 0 CB 0 CB 0 X
Central Logs 449 I 620 I 533 I 533 X 533 X 0 CB 0 C 0 C 0 C 0 X
African Sawn 69 I 82 I 95 I 95 X 95 X 0 CBR 0 RI 0 CBR 0 CB 0 X
Republic Ven 1 X 1 X 1 X 1 X 1 X 0 CR 0 C 0 C 0 C 0 X
Ply 0 R 1 I 1 I 1 X 1 X 0 C 0 C 0 CBR 0 C 0 X
Logs 300 X 300 X 300 X 300 X 300 X 8 CB 0 CBR 0 CBR 4 CB 4 X
Sawn 81 I 92 I 92 X 92 X 92 X 0 C 0 C 0 CBR 1 CB 1 X
Ven 1 X 3 I 3 X 3 X 3 X 0 CBR 0 CBR 0 CB 0 CBR 0 R
Ply 1 X 1 X 1 X 1 X 1 X 1 CB 0 CBR 0 C 0 CBR 0 R
Congo, Rep. Logs 1369 1316 1316 X 1981 I 1981 X 0 0 0 C 0 C 0 X
Sawn 209 I 268 I 369 I 369 X 369 X 0 CBR 0 CB 0 CBR 0 C 0 X
Ven 14 I 5 I 5 X 10 I 10 X 0 CBR 0 CBR 0 CBR 0 C 0 X
Ply 6 I 6 I 6 X 6 X 6 X 0 CBR 0 CBR 0 CBR 0 C 0 X
Côte d'Ivoire Logs 1347 1408 1469 1469 X 1469 X 0 CB 0 CB 0 CB 0 C 0 X
Sawn 503 I 442 456 471 471 X 0 CR 0 CR 0 CR 0 CR 0 R
Ven 240 262 313 396 396 X 0 CR 0 CB 0 CBR 0 CBR 0 R
Ply 61 88 82 81 81 X 0 CR 0 C 0 CBR 0 CB 0 X
Gabon Logs 3200 3500 3400 3400 X 3400 X 0 0 0 0 0 X
Sawn 230 235 296 * 296 X 296 X 0 CR 0 CR 0 0 0 X
Ven 145 150 182 182 X 182 X 2 0 CR 0 CB 0 CB 0 X
Ply 146 I 142 85 85 X 85 X 26 0 CR 0 CBR 0 CB 0 X
Ghana Logs 1200 1304 1304 1392 1300 0 0 0 0 0 X
Sawn 520 527 520 513 522 1 4 CB 0 CBR 0 CBR 0 R
Ven 300 212 235 245 273 0 0 CBR 0 CBR 0 CR 0 R
Ply 120 115 160 200 178 0 CR 0 CR 0 CBR 0 CBR 0 R
Liberia Logs 280 X 360 I 360 X 360 X 330 X 0 CBR 0 CBR 0 C 0 C 0 I
Sawn 50 I 60 60 80 80 0 C 0 C 0 CBR 0 CBR 0 R
Ven 0 X 0 X 0 0 0 X 0 C 0 C 0 CBR 0 C 0 I
Ply 0 X 0 X 0 0 0 X 3 CB 0 CBR 0 CBR 0 C 0 X
Nigeria Logs 7100 X 7100 X 7100 X 7100 X 7100 X 0 C 0 C 0 C 1 C 1 X
Sawn 2000 X 2000 X 2000 X 2000 X 2000 X 0 CBR 0 C 0 CR 2 C 2 X
Ven 0 R 0 R 1 I 1 X 1 X 5 CB 0 CBR 0 CR 0 CR 0 R
Ply 55 X 55 X 55 X 55 X 55 X 0 C 0 CBR 4 CB 1 CB 1 X
Togo Logs 94 94 X 94 X 123 I 123 X 0 CBR 0 CBR 0 CR 0 C 0 X
Sawn 14 14 14 X 14 X 14 X 4 0 CB 0 CBR 0 CBR 0 R
Ven 1 X 1 X 1 X 1 X 1 X 0 0 0 CR 0 CBR 0 R
Ply 0 X 0 X 0 X 0 X 0 X 1 0 C 0 CR 0 C 0 X
Logs 79904 83796 87484 85284 85409 3731 3397 3832 3637 3295Sawn 19191 19337 19202 18439 17964 2764 2303 2494 2741 2117Ven 1531 1473 1635 1904 1944 21 33 34 54 34Ply 11505 11843 11860 10636 10674 199 237 203 139 131
Cambodia Logs 113 I 113 X 113 X 113 X 113 X 0 CBR 0 C 0 C 0 C 0 X
Sawn 72 I 72 X 72 X 72 X 72 X 0 CBR 0 CBR 0 CBR 0 CB 0 X
Ven 20 X 20 X 20 X 20 X 20 X 0 CBR 0 CBR 0 CBR 0 CB 0 X
Ply 10 X 10 X 10 X 10 X 10 X 0 CBR 0 C 0 C 0 CBR 0 R
Fiji Logs 166 166 X 166 X 166 X 166 X 0 C 0 C 0 C 0 CBR 0 R
Sawn 55 40 40 X 40 X 40 X 0 CBR 0 CB 0 CR 0 CBR 0 R
Ven 8 X 8 X 8 X 8 X 8 X 0 CR 0 CR 0 CR 0 CBR 0 R
Ply 8 X 8 X 8 X 8 X 8 X 0 CR 0 CBR 0 CBR 0 CBR 0 R
India Logs 20312 I 20313 X 20313 X 20313 X 20313 X 3118 C 2834 C 3209 C 3303 C 3000 GI
Sawn 4889 I 4889 X 4889 X 4889 X 4889 X 47 CB 17 C 24 C 30 C 29 GI
Ven 270 270 X 270 X 270 X 270 X 2 CB 9 C 10 C 15 C 11 GI
Ply 2130 2130 X 2130 X 2130 X 2130 X 28 CB 10 CB 14 CB 22 CB 15 GI
Indonesia Logs 22590 I 27893 F 34170 I 34150 I 34150 X 6 W 4 W 7 W 13 W 13 X
Sawn 4330 X 4330 X 4330 X 4169 I 4169 X 65 W 73 W 72 W 72 W 72 X
Ven 155 X 188 I 231 I 220 I 220 X 9 W 14 W 16 W 15 W 15 X
Ply 3820 I 3734 I 3734 X 3200 I 3200 X 12 W 38 W 22 CB 19 CB 19 X
Production Imports
Africa
Asia-Pacific
Congo, Dem. Rep.
92
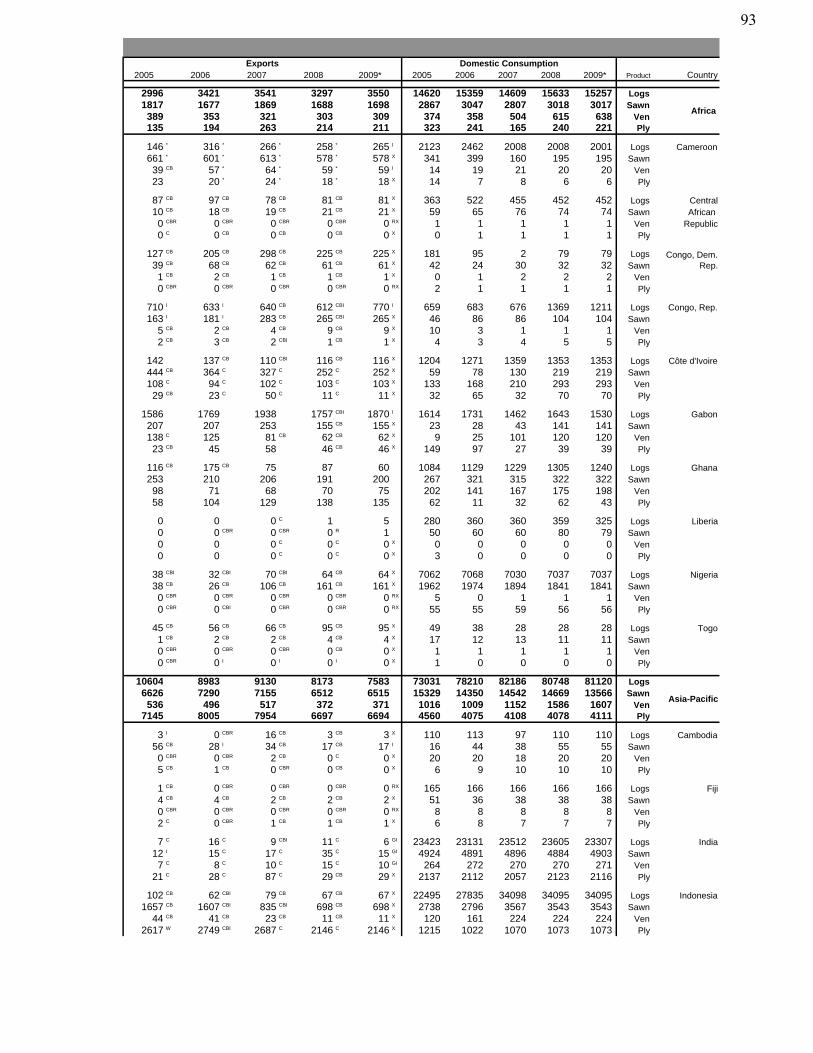
2005 2006 2007 2008 2009* 2005 2006 2007 2008 2009* Product Country
2996 3421 3541 3297 3550 14620 15359 14609 15633 15257 Logs1817 1677 1869 1688 1698 2867 3047 2807 3018 3017 Sawn389 353 321 303 309 374 358 504 615 638 Ven135 194 263 214 211 323 241 165 240 221 Ply
146 * 316 * 266 * 258 * 265 I 2123 2462 2008 2008 2001 Logs Cameroon661 * 601 * 613 * 578 * 578 X 341 399 160 195 195 Sawn39 CB 57 * 64 * 59 * 59 I 14 19 21 20 20 Ven23 20 * 24 * 18 * 18 X 14 7 8 6 6 Ply
87 CB 97 CB 78 CB 81 CB 81 X 363 522 455 452 452 Logs Central10 CB 18 CB 19 CB 21 CB 21 X 59 65 76 74 74 Sawn African 0 CBR 0 CBR 0 CBR 0 CBR 0 RX 1 1 1 1 1 Ven Republic0 C 0 CB 0 CB 0 CB 0 X 0 1 1 1 1 Ply
127 CB 205 CB 298 CB 225 CB 225 X 181 95 2 79 79 Logs39 CB 68 CB 62 CB 61 CB 61 X 42 24 30 32 32 Sawn1 CB 2 CB 1 CB 1 CB 1 X 0 1 2 2 2 Ven0 CBR 0 CBR 0 CBR 0 CBR 0 RX 2 1 1 1 1 Ply
710 I 633 I 640 CB 612 CBI 770 I 659 683 676 1369 1211 Logs Congo, Rep.163 I 181 I 283 CB 265 CBI 265 X 46 86 86 104 104 Sawn
5 CB 2 CB 4 CB 9 CB 9 X 10 3 1 1 1 Ven2 CB 3 CB 2 CBI 1 CB 1 X 4 3 4 5 5 Ply
142 137 CB 110 CBI 116 CB 116 X 1204 1271 1359 1353 1353 Logs Côte d'Ivoire444 CB 364 C 327 C 252 C 252 X 59 78 130 219 219 Sawn108 C 94 C 102 C 103 C 103 X 133 168 210 293 293 Ven29 CB 23 C 50 C 11 C 11 X 32 65 32 70 70 Ply
1586 1769 1938 1757 CBI 1870 I 1614 1731 1462 1643 1530 Logs Gabon207 207 253 155 CB 155 X 23 28 43 141 141 Sawn138 C 125 81 CB 62 CB 62 X 9 25 101 120 120 Ven23 CB 45 58 46 CB 46 X 149 97 27 39 39 Ply
116 CB 175 CB 75 87 60 1084 1129 1229 1305 1240 Logs Ghana253 210 206 191 200 267 321 315 322 322 Sawn98 71 68 70 75 202 141 167 175 198 Ven58 104 129 138 135 62 11 32 62 43 Ply
0 0 0 C 1 5 280 360 360 359 325 Logs Liberia0 0 CBR 0 CBR 0 R 1 50 60 60 80 79 Sawn0 0 0 C 0 C 0 X 0 0 0 0 0 Ven0 0 0 C 0 C 0 X 3 0 0 0 0 Ply
38 CBI 32 CBI 70 CBI 64 CB 64 X 7062 7068 7030 7037 7037 Logs Nigeria38 CB 26 CB 106 CB 161 CB 161 X 1962 1974 1894 1841 1841 Sawn0 CBR 0 CBR 0 CBR 0 CBR 0 RX 5 0 1 1 1 Ven0 CBR 0 CBI 0 CBR 0 CBR 0 RX 55 55 59 56 56 Ply
45 CB 56 CB 66 CB 95 CB 95 X 49 38 28 28 28 Logs Togo1 CB 2 CB 2 CB 4 CB 4 X 17 12 13 11 11 Sawn0 CBR 0 CBR 0 CBR 0 CB 0 X 1 1 1 1 1 Ven0 CBR 0 I 0 I 0 I 0 X 1 0 0 0 0 Ply
10604 8983 9130 8173 7583 73031 78210 82186 80748 81120 Logs6626 7290 7155 6512 6515 15329 14350 14542 14669 13566 Sawn536 496 517 372 371 1016 1009 1152 1586 1607 Ven
7145 8005 7954 6697 6694 4560 4075 4108 4078 4111 Ply
3 I 0 CBR 16 CB 3 CB 3 X 110 113 97 110 110 Logs Cambodia56 CB 28 I 34 CB 17 CB 17 I 16 44 38 55 55 Sawn0 CBR 0 CBR 2 CB 0 C 0 X 20 20 18 20 20 Ven5 CB 1 CB 0 CBR 0 CB 0 X 6 9 10 10 10 Ply
1 CB 0 CBR 0 CBR 0 CBR 0 RX 165 166 166 166 166 Logs Fiji4 CB 4 CB 2 CB 2 CB 2 X 51 36 38 38 38 Sawn0 CBR 0 CBR 0 CBR 0 CBR 0 RX 8 8 8 8 8 Ven2 C 0 CBR 1 CB 1 CB 1 X 6 8 7 7 7 Ply
7 C 16 C 9 CBI 11 C 6 GI 23423 23131 23512 23605 23307 Logs India12 I 15 C 17 C 35 C 15 GI 4924 4891 4896 4884 4903 Sawn7 C 8 C 10 C 15 C 10 GI 264 272 270 270 271 Ven
21 C 28 C 87 C 29 CB 29 X 2137 2112 2057 2123 2116 Ply
102 CB 62 CBI 79 CB 67 CB 67 X 22495 27835 34098 34095 34095 Logs Indonesia1657 CB 1607 CBI 835 CBI 698 CB 698 X 2738 2796 3567 3543 3543 Sawn
44 CB 41 CB 23 CB 11 CB 11 X 120 161 224 224 224 Ven2617 W 2749 CBI 2687 C 2146 C 2146 X 1215 1022 1070 1073 1073 Ply
Africa
Congo, Dem. Rep.
Asia-Pacific
Exports Domestic Consumption
93
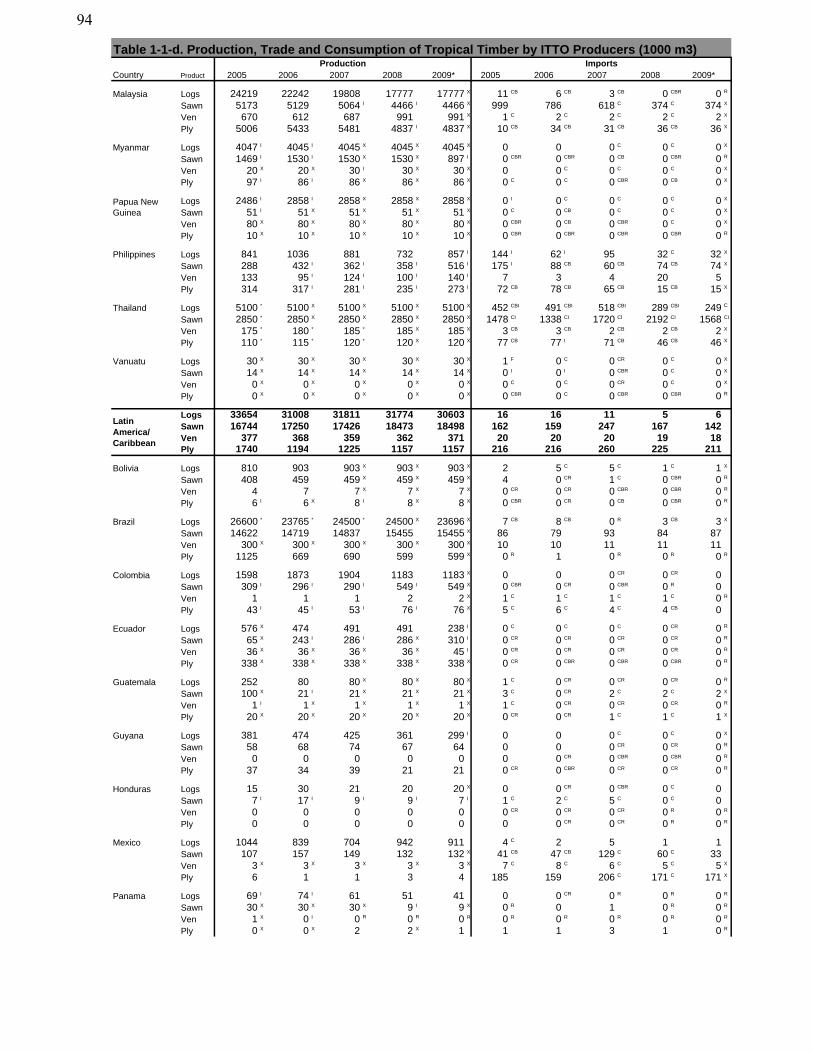
Table 1-1-d. Production, Trade and Consumption of Tropical Timber by ITTO Producers (1000 m3)
Country Product 2005 2006 2007 2008 2009* 2005 2006 2007 2008 2009*Production Imports
Malaysia Logs 24219 22242 19808 17777 17777 X 11 CB 6 CB 3 CB 0 CBR 0 R
Sawn 5173 5129 5064 I 4466 I 4466 X 999 786 618 C 374 C 374 X
Ven 670 612 687 991 991 X 1 C 2 C 2 C 2 C 2 X
Ply 5006 5433 5481 4837 I 4837 X 10 CB 34 CB 31 CB 36 CB 36 X
Myanmar Logs 4047 I 4045 I 4045 X 4045 X 4045 X 0 0 0 C 0 C 0 X
Sawn 1469 I 1530 I 1530 X 1530 X 897 I 0 CBR 0 CBR 0 CB 0 CBR 0 R
Ven 20 X 20 X 30 I 30 X 30 X 0 0 C 0 C 0 C 0 X
Ply 97 I 86 I 86 X 86 X 86 X 0 C 0 C 0 CBR 0 CB 0 X
Logs 2486 I 2858 I 2858 X 2858 X 2858 X 0 I 0 C 0 C 0 C 0 X
Sawn 51 I 51 X 51 X 51 X 51 X 0 C 0 CB 0 C 0 C 0 X
Ven 80 X 80 X 80 X 80 X 80 X 0 CBR 0 CB 0 CBR 0 C 0 X
Ply 10 X 10 X 10 X 10 X 10 X 0 CBR 0 CBR 0 CBR 0 CBR 0 R
Philippines Logs 841 1036 881 732 857 I 144 I 62 I 95 32 C 32 X
Sawn 288 432 I 362 I 358 I 516 I 175 I 88 CB 60 CB 74 CB 74 X
Ven 133 95 I 124 I 100 I 140 I 7 3 4 20 5
Ply 314 317 I 281 I 235 I 273 I 72 CB 78 CB 65 CB 15 CB 15 X
Thailand Logs 5100 * 5100 X 5100 X 5100 X 5100 X 452 CBI 491 CBI 518 CBI 289 CBI 249 C
Sawn 2850 * 2850 X 2850 X 2850 X 2850 X 1478 CI 1338 CI 1720 CI 2192 CI 1568 CI
Ven 175 * 180 * 185 * 185 X 185 X 3 CB 3 CB 2 CB 2 CB 2 X
Ply 110 * 115 * 120 * 120 X 120 X 77 CB 77 I 71 CB 46 CB 46 X
Vanuatu Logs 30 X 30 X 30 X 30 X 30 X 1 F 0 C 0 CR 0 C 0 X
Sawn 14 X 14 X 14 X 14 X 14 X 0 I 0 I 0 CBR 0 C 0 X
Ven 0 X 0 X 0 X 0 X 0 X 0 C 0 C 0 CR 0 C 0 X
Ply 0 X 0 X 0 X 0 X 0 X 0 CBR 0 C 0 CBR 0 CBR 0 R
Logs 33654 31008 31811 31774 30603 16 16 11 5 6Sawn 16744 17250 17426 18473 18498 162 159 247 167 142Ven 377 368 359 362 371 20 20 20 19 18Ply 1740 1194 1225 1157 1157 216 216 260 225 211
Bolivia Logs 810 903 903 X 903 X 903 X 2 5 C 5 C 1 C 1 X
Sawn 408 459 459 X 459 X 459 X 4 0 CR 1 C 0 CBR 0 R
Ven 4 7 7 X 7 X 7 X 0 CR 0 CR 0 CBR 0 CBR 0 R
Ply 6 I 6 X 8 I 8 X 8 X 0 CBR 0 CR 0 CB 0 CBR 0 R
Brazil Logs 26600 * 23765 * 24500 * 24500 X 23696 X 7 CB 8 CB 0 R 3 CB 3 X
Sawn 14622 14719 14837 15455 15455 X 86 79 93 84 87
Ven 300 X 300 X 300 X 300 X 300 X 10 10 11 11 11
Ply 1125 669 690 599 599 X 0 R 1 0 R 0 R 0 R
Colombia Logs 1598 1873 1904 1183 1183 X 0 0 0 CR 0 CR 0
Sawn 309 I 296 I 290 I 549 I 549 X 0 CBR 0 CR 0 CBR 0 R 0
Ven 1 1 1 2 2 X 1 C 1 C 1 C 1 C 0 R
Ply 43 I 45 I 53 I 76 I 76 X 5 C 6 C 4 C 4 CB 0
Ecuador Logs 576 X 474 491 491 238 I 0 C 0 C 0 C 0 CR 0 R
Sawn 65 X 243 I 286 I 286 X 310 I 0 CR 0 CR 0 CR 0 CR 0 R
Ven 36 X 36 X 36 X 36 X 45 I 0 CR 0 CR 0 CR 0 CR 0 R
Ply 338 X 338 X 338 X 338 X 338 X 0 CR 0 CBR 0 CBR 0 CBR 0 R
Guatemala Logs 252 80 80 X 80 X 80 X 1 C 0 CR 0 CR 0 CR 0 R
Sawn 100 X 21 I 21 X 21 X 21 X 3 C 0 CR 2 C 2 C 2 X
Ven 1 I 1 X 1 X 1 X 1 X 1 C 0 CR 0 CR 0 CR 0 R
Ply 20 X 20 X 20 X 20 X 20 X 0 CR 0 CR 1 C 1 C 1 X
Guyana Logs 381 474 425 361 299 I 0 0 0 C 0 C 0 X
Sawn 58 68 74 67 64 0 0 0 CR 0 CR 0 R
Ven 0 0 0 0 0 0 0 CR 0 CBR 0 CBR 0 R
Ply 37 34 39 21 21 0 CR 0 CBR 0 CR 0 CR 0 R
Honduras Logs 15 30 21 20 20 X 0 0 CR 0 CBR 0 C 0
Sawn 7 I 17 I 9 I 9 I 7 I 1 C 2 C 5 C 0 C 0
Ven 0 0 0 0 0 0 CR 0 CR 0 CR 0 R 0 R
Ply 0 0 0 0 0 0 0 CR 0 CR 0 R 0 R
Mexico Logs 1044 839 704 942 911 4 C 2 5 1 1
Sawn 107 157 149 132 132 X 41 CB 47 CB 129 C 60 C 33
Ven 3 X 3 X 3 X 3 X 3 X 7 C 8 C 6 C 5 C 5 X
Ply 6 1 1 3 4 185 159 206 C 171 C 171 X
Panama Logs 69 I 74 I 61 51 41 0 0 CR 0 R 0 R 0 R
Sawn 30 X 30 X 30 X 9 I 9 X 0 R 0 1 0 R 0 R
Ven 1 X 0 I 0 R 0 R 0 R 0 R 0 R 0 R 0 R 0 R
Ply 0 X 0 X 2 2 X 1 1 1 3 1 0 R
LatinAmerica/Caribbean
Papua New Guinea
94
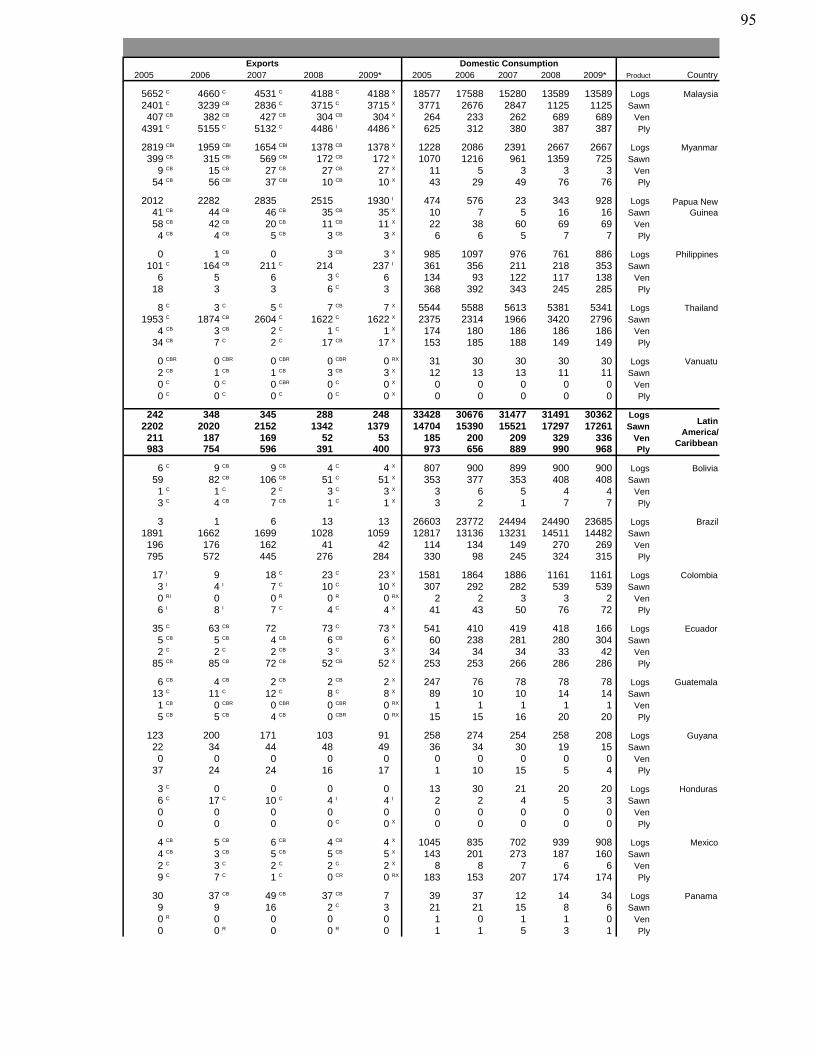
2005 2006 2007 2008 2009* 2005 2006 2007 2008 2009* Product CountryExports Domestic Consumption
5652 C 4660 C 4531 C 4188 C 4188 X 18577 17588 15280 13589 13589 Logs Malaysia2401 C 3239 CB 2836 C 3715 C 3715 X 3771 2676 2847 1125 1125 Sawn407 CB 382 CB 427 CB 304 CB 304 X 264 233 262 689 689 Ven
4391 C 5155 C 5132 C 4486 I 4486 X 625 312 380 387 387 Ply
2819 CBI 1959 CBI 1654 CBI 1378 CB 1378 X 1228 2086 2391 2667 2667 Logs Myanmar399 CB 315 CBI 569 CBI 172 CB 172 X 1070 1216 961 1359 725 Sawn
9 CB 15 CB 27 CB 27 CB 27 X 11 5 3 3 3 Ven54 CB 56 CBI 37 CBI 10 CB 10 X 43 29 49 76 76 Ply
2012 2282 2835 2515 1930 I 474 576 23 343 928 Logs41 CB 44 CB 46 CB 35 CB 35 X 10 7 5 16 16 Sawn58 CB 42 CB 20 CB 11 CB 11 X 22 38 60 69 69 Ven4 CB 4 CB 5 CB 3 CB 3 X 6 6 5 7 7 Ply
0 1 CB 0 3 CB 3 X 985 1097 976 761 886 Logs Philippines101 C 164 CB 211 C 214 237 I 361 356 211 218 353 Sawn
6 5 6 3 C 6 134 93 122 117 138 Ven18 3 3 6 C 3 368 392 343 245 285 Ply
8 C 3 C 5 C 7 CB 7 X 5544 5588 5613 5381 5341 Logs Thailand1953 C 1874 CB 2604 C 1622 C 1622 X 2375 2314 1966 3420 2796 Sawn
4 CB 3 CB 2 C 1 C 1 X 174 180 186 186 186 Ven34 CB 7 C 2 C 17 CB 17 X 153 185 188 149 149 Ply
0 CBR 0 CBR 0 CBR 0 CBR 0 RX 31 30 30 30 30 Logs Vanuatu2 CB 1 CB 1 CB 3 CB 3 X 12 13 13 11 11 Sawn0 C 0 C 0 CBR 0 C 0 X 0 0 0 0 0 Ven0 C 0 C 0 C 0 C 0 X 0 0 0 0 0 Ply
242 348 345 288 248 33428 30676 31477 31491 30362 Logs2202 2020 2152 1342 1379 14704 15390 15521 17297 17261 Sawn211 187 169 52 53 185 200 209 329 336 Ven983 754 596 391 400 973 656 889 990 968 Ply
6 C 9 CB 9 CB 4 C 4 X 807 900 899 900 900 Logs Bolivia59 82 CB 106 CB 51 C 51 X 353 377 353 408 408 Sawn1 C 1 C 2 C 3 C 3 X 3 6 5 4 4 Ven3 C 4 CB 7 CB 1 C 1 X 3 2 1 7 7 Ply
3 1 6 13 13 26603 23772 24494 24490 23685 Logs Brazil1891 1662 1699 1028 1059 12817 13136 13231 14511 14482 Sawn196 176 162 41 42 114 134 149 270 269 Ven795 572 445 276 284 330 98 245 324 315 Ply
17 I 9 18 C 23 C 23 X 1581 1864 1886 1161 1161 Logs Colombia3 I 4 I 7 C 10 C 10 X 307 292 282 539 539 Sawn0 RI 0 0 R 0 R 0 RX 2 2 3 3 2 Ven6 I 8 I 7 C 4 C 4 X 41 43 50 76 72 Ply
35 C 63 CB 72 73 C 73 X 541 410 419 418 166 Logs Ecuador5 CB 5 CB 4 CB 6 CB 6 X 60 238 281 280 304 Sawn2 C 2 C 2 CB 3 C 3 X 34 34 34 33 42 Ven
85 CB 85 CB 72 CB 52 CB 52 X 253 253 266 286 286 Ply
6 CB 4 CB 2 CB 2 CB 2 X 247 76 78 78 78 Logs Guatemala13 C 11 C 12 C 8 C 8 X 89 10 10 14 14 Sawn1 CB 0 CBR 0 CBR 0 CBR 0 RX 1 1 1 1 1 Ven5 CB 5 CB 4 CB 0 CBR 0 RX 15 15 16 20 20 Ply
123 200 171 103 91 258 274 254 258 208 Logs Guyana22 34 44 48 49 36 34 30 19 15 Sawn0 0 0 0 0 0 0 0 0 0 Ven
37 24 24 16 17 1 10 15 5 4 Ply
3 C 0 0 0 0 13 30 21 20 20 Logs Honduras6 C 17 C 10 C 4 I 4 I 2 2 4 5 3 Sawn0 0 0 0 0 0 0 0 0 0 Ven0 0 0 0 C 0 X 0 0 0 0 0 Ply
4 CB 5 CB 6 CB 4 CB 4 X 1045 835 702 939 908 Logs Mexico4 CB 3 CB 5 CB 5 CB 5 X 143 201 273 187 160 Sawn2 C 3 C 2 C 2 C 2 X 8 8 7 6 6 Ven9 C 7 C 1 C 0 CR 0 RX 183 153 207 174 174 Ply
30 37 CB 49 CB 37 CB 7 39 37 12 14 34 Logs Panama9 9 16 2 C 3 21 21 15 8 6 Sawn0 R 0 0 0 0 1 0 1 1 0 Ven0 0 R 0 0 R 0 1 1 5 3 1 Ply
LatinAmerica/
Caribbean
Papua New Guinea
95
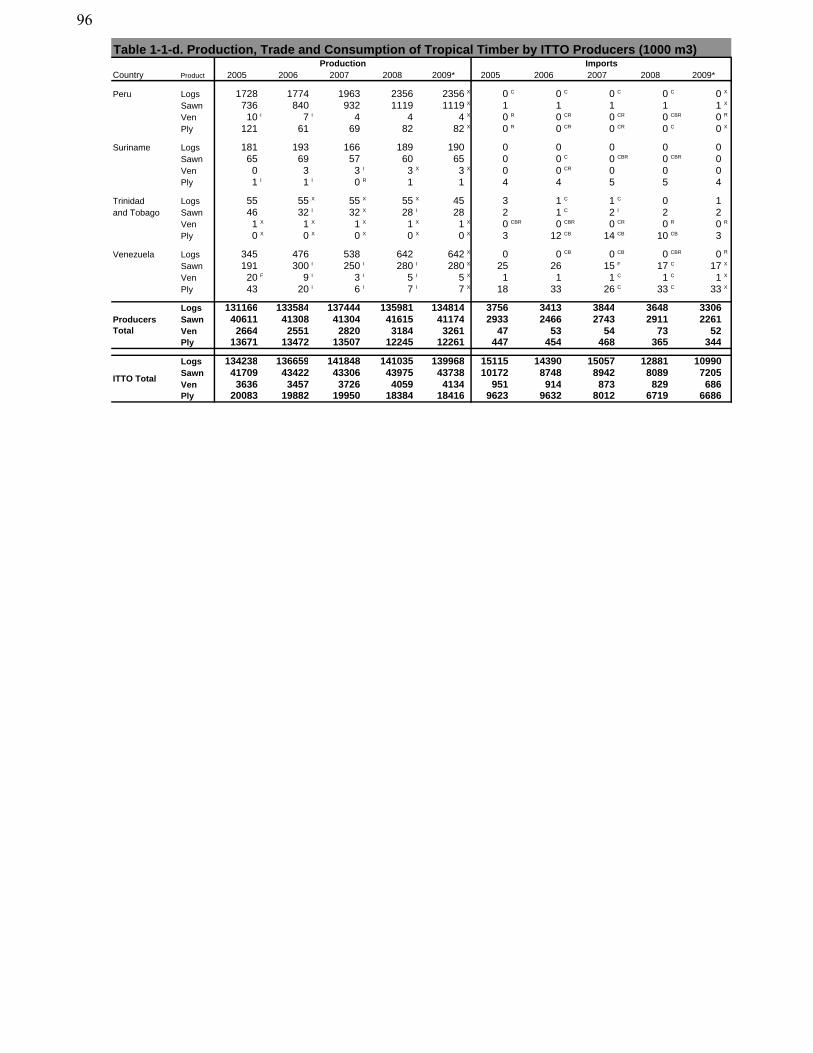
Table 1-1-d. Production, Trade and Consumption of Tropical Timber by ITTO Producers (1000 m3)
Country Product 2005 2006 2007 2008 2009* 2005 2006 2007 2008 2009*Production Imports
Peru Logs 1728 1774 1963 2356 2356 X 0 C 0 C 0 C 0 C 0 X
Sawn 736 840 932 1119 1119 X 1 1 1 1 1 X
Ven 10 I 7 I 4 4 4 X 0 R 0 CR 0 CR 0 CBR 0 R
Ply 121 61 69 82 82 X 0 R 0 CR 0 CR 0 C 0 X
Suriname Logs 181 193 166 189 190 0 0 0 0 0
Sawn 65 69 57 60 65 0 0 C 0 CBR 0 CBR 0
Ven 0 3 3 I 3 X 3 X 0 0 CR 0 0 0
Ply 1 I 1 I 0 R 1 1 4 4 5 5 4
Trinidad Logs 55 55 X 55 X 55 X 45 3 1 C 1 C 0 1
and Tobago Sawn 46 32 I 32 X 28 I 28 2 1 C 2 I 2 2
Ven 1 X 1 X 1 X 1 X 1 X 0 CBR 0 CBR 0 CR 0 R 0 R
Ply 0 X 0 X 0 X 0 X 0 X 3 12 CB 14 CB 10 CB 3
Venezuela Logs 345 476 538 642 642 X 0 0 CB 0 CB 0 CBR 0 R
Sawn 191 300 I 250 I 280 I 280 X 25 26 15 F 17 C 17 X
Ven 20 F 9 I 3 I 5 I 5 X 1 1 1 C 1 C 1 X
Ply 43 20 I 6 I 7 I 7 X 18 33 26 C 33 C 33 X
Logs 131166 133584 137444 135981 134814 3756 3413 3844 3648 3306Sawn 40611 41308 41304 41615 41174 2933 2466 2743 2911 2261Ven 2664 2551 2820 3184 3261 47 53 54 73 52Ply 13671 13472 13507 12245 12261 447 454 468 365 344
Logs 134238 136659 141848 141035 139968 15115 14390 15057 12881 10990Sawn 41709 43422 43306 43975 43738 10172 8748 8942 8089 7205Ven 3636 3457 3726 4059 4134 951 914 873 829 686Ply 20083 19882 19950 18384 18416 9623 9632 8012 6719 6686
ITTO Total
ProducersTotal
96
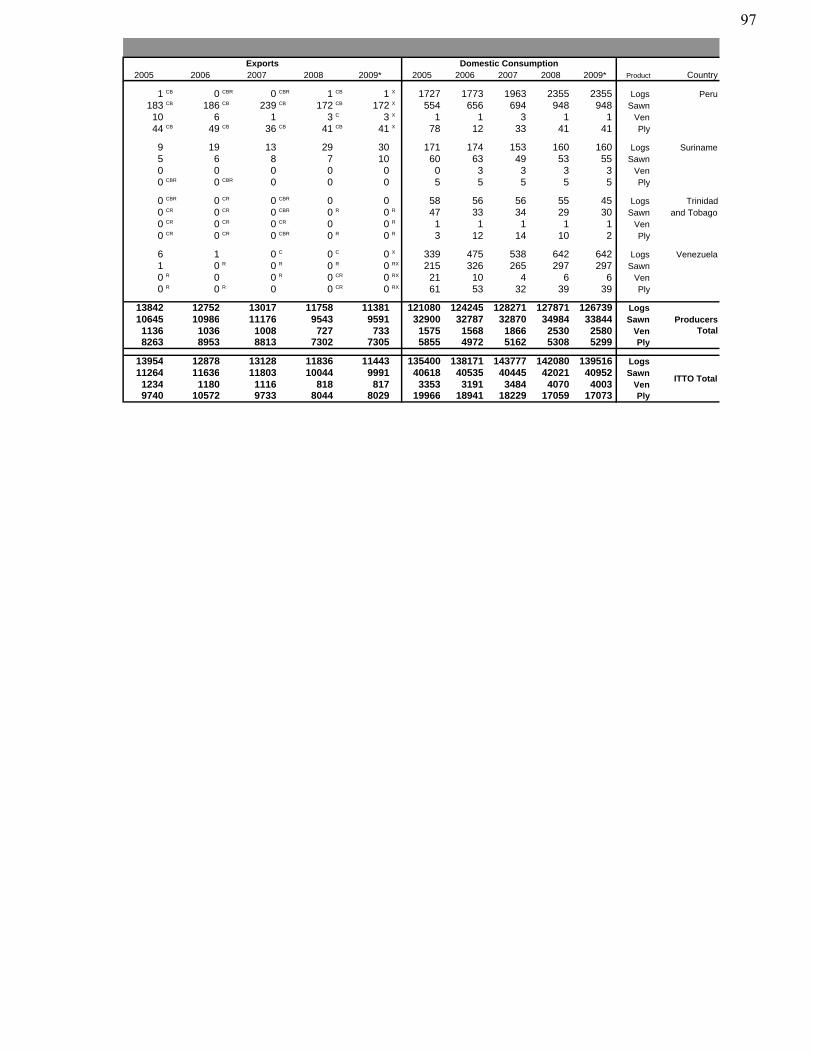
2005 2006 2007 2008 2009* 2005 2006 2007 2008 2009* Product CountryExports Domestic Consumption
1 CB 0 CBR 0 CBR 1 CB 1 X 1727 1773 1963 2355 2355 Logs Peru183 CB 186 CB 239 CB 172 CB 172 X 554 656 694 948 948 Sawn10 6 1 3 C 3 X 1 1 3 1 1 Ven44 CB 49 CB 36 CB 41 CB 41 X 78 12 33 41 41 Ply
9 19 13 29 30 171 174 153 160 160 Logs Suriname5 6 8 7 10 60 63 49 53 55 Sawn0 0 0 0 0 0 3 3 3 3 Ven0 CBR 0 CBR 0 0 0 5 5 5 5 5 Ply
0 CBR 0 CR 0 CBR 0 0 58 56 56 55 45 Logs Trinidad0 CR 0 CR 0 CBR 0 R 0 R 47 33 34 29 30 Sawn and Tobago0 CR 0 CR 0 CR 0 0 R 1 1 1 1 1 Ven0 CR 0 CR 0 CBR 0 R 0 R 3 12 14 10 2 Ply
6 1 0 C 0 C 0 X 339 475 538 642 642 Logs Venezuela1 0 R 0 R 0 R 0 RX 215 326 265 297 297 Sawn0 R 0 0 R 0 CR 0 RX 21 10 4 6 6 Ven0 R 0 R 0 0 CR 0 RX 61 53 32 39 39 Ply
13842 12752 13017 11758 11381 121080 124245 128271 127871 126739 Logs10645 10986 11176 9543 9591 32900 32787 32870 34984 33844 Sawn1136 1036 1008 727 733 1575 1568 1866 2530 2580 Ven8263 8953 8813 7302 7305 5855 4972 5162 5308 5299 Ply
13954 12878 13128 11836 11443 135400 138171 143777 142080 139516 Logs11264 11636 11803 10044 9991 40618 40535 40445 42021 40952 Sawn1234 1180 1116 818 817 3353 3191 3484 4070 4003 Ven9740 10572 9733 8044 8029 19966 18941 18229 17059 17073 Ply
ProducersTotal
ITTO Total
97
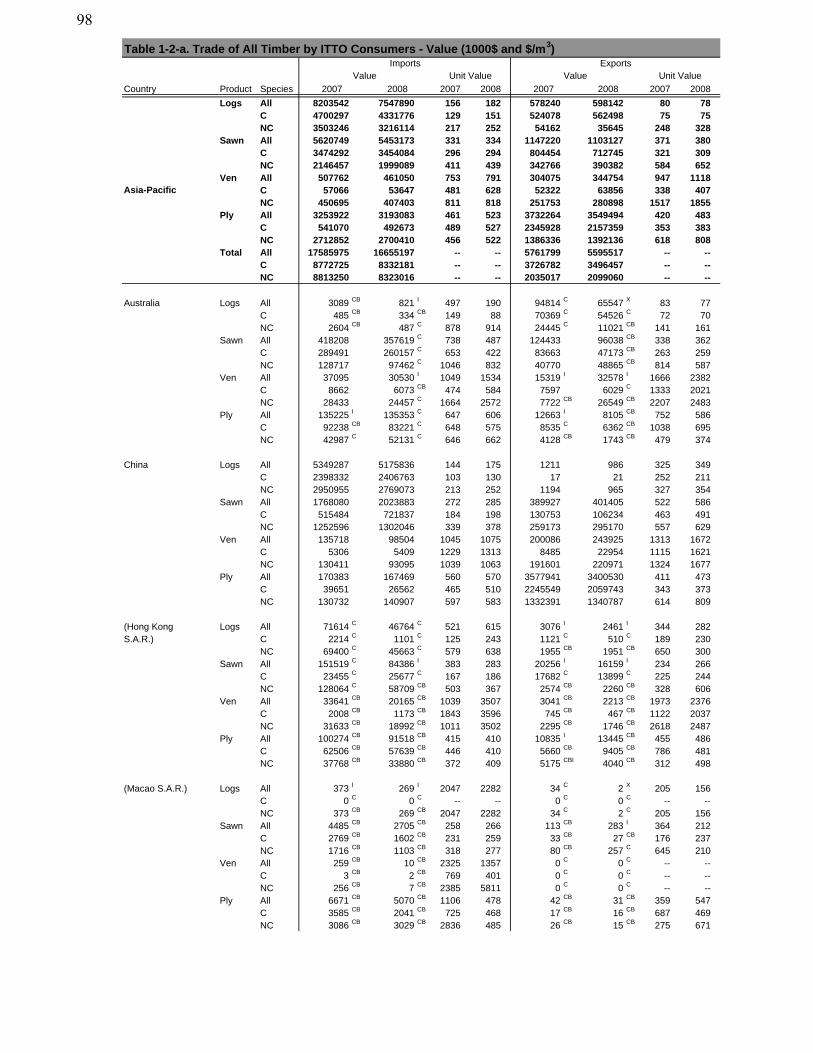
Table 1-2-a. Trade of All Timber by ITTO Consumers - Value (1000$ and $/m3)
Country Product Species
Logs All 8203542 7547890 156 182 578240 598142 80 78C 4700297 4331776 129 151 524078 562498 75 75NC 3503246 3216114 217 252 54162 35645 248 328
Sawn All 5620749 5453173 331 334 1147220 1103127 371 380C 3474292 3454084 296 294 804454 712745 321 309NC 2146457 1999089 411 439 342766 390382 584 652
Ven All 507762 461050 753 791 304075 344754 947 1118C 57066 53647 481 628 52322 63856 338 407NC 450695 407403 811 818 251753 280898 1517 1855
Ply All 3253922 3193083 461 523 3732264 3549494 420 483C 541070 492673 489 527 2345928 2157359 353 383NC 2712852 2700410 456 522 1386336 1392136 618 808
Total All 17585975 16655197 -- -- 5761799 5595517 -- --C 8772725 8332181 -- -- 3726782 3496457 -- --NC 8813250 8323016 -- -- 2035017 2099060 -- --
Australia Logs All 3089 CB 821 I 497 190 94814 C 65547 X 83 77C 485 CB 334 CB 149 88 70369 C 54526 C 72 70NC 2604 CB 487 C 878 914 24445 C 11021 CB 141 161
Sawn All 418208 357619 C 738 487 124433 96038 CB 338 362C 289491 260157 C 653 422 83663 47173 CB 263 259NC 128717 97462 C 1046 832 40770 48865 CB 814 587
Ven All 37095 30530 I 1049 1534 15319 I 32578 I 1666 2382C 8662 6073 CB 474 584 7597 6029 C 1333 2021NC 28433 24457 C 1664 2572 7722 CB 26549 CB 2207 2483
Ply All 135225 I 135353 C 647 606 12663 I 8105 CB 752 586C 92238 CB 83221 C 648 575 8535 C 6362 CB 1038 695NC 42987 C 52131 C 646 662 4128 CB 1743 CB 479 374
China Logs All 5349287 5175836 144 175 1211 986 325 349C 2398332 2406763 103 130 17 21 252 211NC 2950955 2769073 213 252 1194 965 327 354
Sawn All 1768080 2023883 272 285 389927 401405 522 586C 515484 721837 184 198 130753 106234 463 491NC 1252596 1302046 339 378 259173 295170 557 629
Ven All 135718 98504 1045 1075 200086 243925 1313 1672C 5306 5409 1229 1313 8485 22954 1115 1621NC 130411 93095 1039 1063 191601 220971 1324 1677
Ply All 170383 167469 560 570 3577941 3400530 411 473C 39651 26562 465 510 2245549 2059743 343 373NC 130732 140907 597 583 1332391 1340787 614 809
(Hong Kong Logs All 71614 C 46764 C 521 615 3076 I 2461 I 344 282S.A.R.) C 2214 C 1101 C 125 243 1121 C 510 C 189 230
NC 69400 C 45663 C 579 638 1955 CB 1951 CB 650 300Sawn All 151519 C 84386 I 383 283 20256 I 16159 I 234 266
C 23455 C 25677 C 167 186 17682 C 13899 C 225 244NC 128064 C 58709 CB 503 367 2574 CB 2260 CB 328 606
Ven All 33641 CB 20165 CB 1039 3507 3041 CB 2213 CB 1973 2376C 2008 CB 1173 CB 1843 3596 745 CB 467 CB 1122 2037NC 31633 CB 18992 CB 1011 3502 2295 CB 1746 CB 2618 2487
Ply All 100274 CB 91518 CB 415 410 10835 I 13445 CB 455 486C 62506 CB 57639 CB 446 410 5660 CB 9405 CB 786 481NC 37768 CB 33880 CB 372 409 5175 CBI 4040 CB 312 498
(Macao S.A.R.) Logs All 373 I 269 I 2047 2282 34 C 2 X 205 156C 0 C 0 C -- -- 0 C 0 C -- --NC 373 CB 269 CB 2047 2282 34 C 2 C 205 156
Sawn All 4485 CB 2705 CB 258 266 113 CB 283 I 364 212C 2769 CB 1602 CB 231 259 33 CB 27 CB 176 237NC 1716 CB 1103 CB 318 277 80 CB 257 C 645 210
Ven All 259 CB 10 CB 2325 1357 0 C 0 C -- --C 3 CB 2 CB 769 401 0 C 0 C -- --NC 256 CB 7 CB 2385 5811 0 C 0 C -- --
Ply All 6671 CB 5070 CB 1106 478 42 CB 31 CB 359 547C 3585 CB 2041 CB 725 468 17 CB 16 CB 687 469NC 3086 CB 3029 CB 2836 485 26 CB 15 CB 275 671
ImportsValue Unit Value
2008 2007
Exports
2008 2007
Value Unit Value
2007 200820082007
Asia-Pacific
98
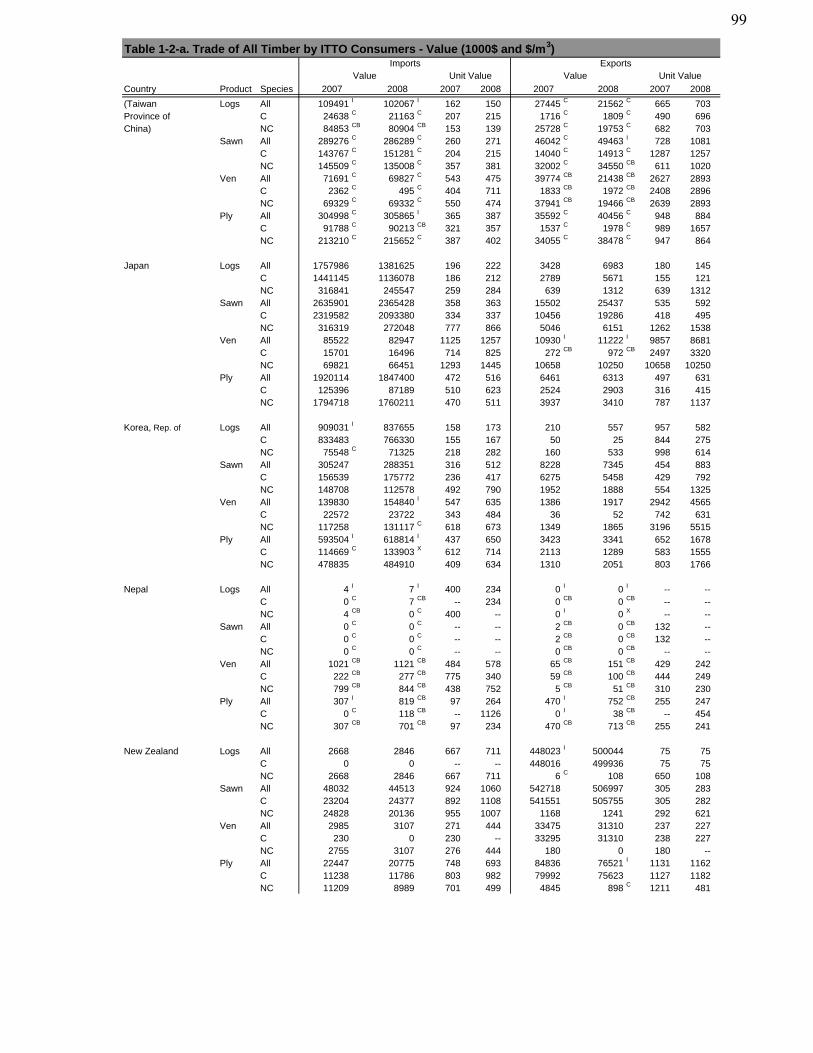
Table 1-2-a. Trade of All Timber by ITTO Consumers - Value (1000$ and $/m3)
Country Product Species
ImportsValue Unit Value
2008 2007
Exports
2008 2007
Value Unit Value
2007 200820082007
(Taiwan Logs All 109491 I 102067 I 162 150 27445 C 21562 C 665 703Province of C 24638 C 21163 C 207 215 1716 C 1809 C 490 696China) NC 84853 CB 80904 CB 153 139 25728 C 19753 C 682 703
Sawn All 289276 C 286289 C 260 271 46042 C 49463 I 728 1081C 143767 C 151281 C 204 215 14040 C 14913 C 1287 1257NC 145509 C 135008 C 357 381 32002 C 34550 CB 611 1020
Ven All 71691 C 69827 C 543 475 39774 CB 21438 CB 2627 2893C 2362 C 495 C 404 711 1833 CB 1972 CB 2408 2896NC 69329 C 69332 C 550 474 37941 CB 19466 CB 2639 2893
Ply All 304998 C 305865 I 365 387 35592 C 40456 C 948 884C 91788 C 90213 CB 321 357 1537 C 1978 C 989 1657NC 213210 C 215652 C 387 402 34055 C 38478 C 947 864
Japan Logs All 1757986 1381625 196 222 3428 6983 180 145C 1441145 1136078 186 212 2789 5671 155 121NC 316841 245547 259 284 639 1312 639 1312
Sawn All 2635901 2365428 358 363 15502 25437 535 592C 2319582 2093380 334 337 10456 19286 418 495NC 316319 272048 777 866 5046 6151 1262 1538
Ven All 85522 82947 1125 1257 10930 I 11222 I 9857 8681C 15701 16496 714 825 272 CB 972 CB 2497 3320NC 69821 66451 1293 1445 10658 10250 10658 10250
Ply All 1920114 1847400 472 516 6461 6313 497 631C 125396 87189 510 623 2524 2903 316 415NC 1794718 1760211 470 511 3937 3410 787 1137
Korea, Rep. of Logs All 909031 I 837655 158 173 210 557 957 582C 833483 766330 155 167 50 25 844 275NC 75548 C 71325 218 282 160 533 998 614
Sawn All 305247 288351 316 512 8228 7345 454 883C 156539 175772 236 417 6275 5458 429 792NC 148708 112578 492 790 1952 1888 554 1325
Ven All 139830 154840 I 547 635 1386 1917 2942 4565C 22572 23722 343 484 36 52 742 631NC 117258 131117 C 618 673 1349 1865 3196 5515
Ply All 593504 I 618814 I 437 650 3423 3341 652 1678C 114669 C 133903 X 612 714 2113 1289 583 1555NC 478835 484910 409 634 1310 2051 803 1766
Nepal Logs All 4 I 7 I 400 234 0 I 0 I -- --C 0 C 7 CB -- 234 0 CB 0 CB -- --NC 4 CB 0 C 400 -- 0 I 0 X -- --
Sawn All 0 C 0 C -- -- 2 CB 0 CB 132 --C 0 C 0 C -- -- 2 CB 0 CB 132 --NC 0 C 0 C -- -- 0 CB 0 CB -- --
Ven All 1021 CB 1121 CB 484 578 65 CB 151 CB 429 242C 222 CB 277 CB 775 340 59 CB 100 CB 444 249NC 799 CB 844 CB 438 752 5 CB 51 CB 310 230
Ply All 307 I 819 CB 97 264 470 I 752 CB 255 247C 0 C 118 CB -- 1126 0 I 38 CB -- 454NC 307 CB 701 CB 97 234 470 CB 713 CB 255 241
New Zealand Logs All 2668 2846 667 711 448023 I 500044 75 75C 0 0 -- -- 448016 499936 75 75NC 2668 2846 667 711 6 C 108 650 108
Sawn All 48032 44513 924 1060 542718 506997 305 283C 23204 24377 892 1108 541551 505755 305 282NC 24828 20136 955 1007 1168 1241 292 621
Ven All 2985 3107 271 444 33475 31310 237 227C 230 0 230 -- 33295 31310 238 227NC 2755 3107 276 444 180 0 180 --
Ply All 22447 20775 748 693 84836 76521 I 1131 1162C 11238 11786 803 982 79992 75623 1127 1182NC 11209 8989 701 499 4845 898 C 1211 481
99
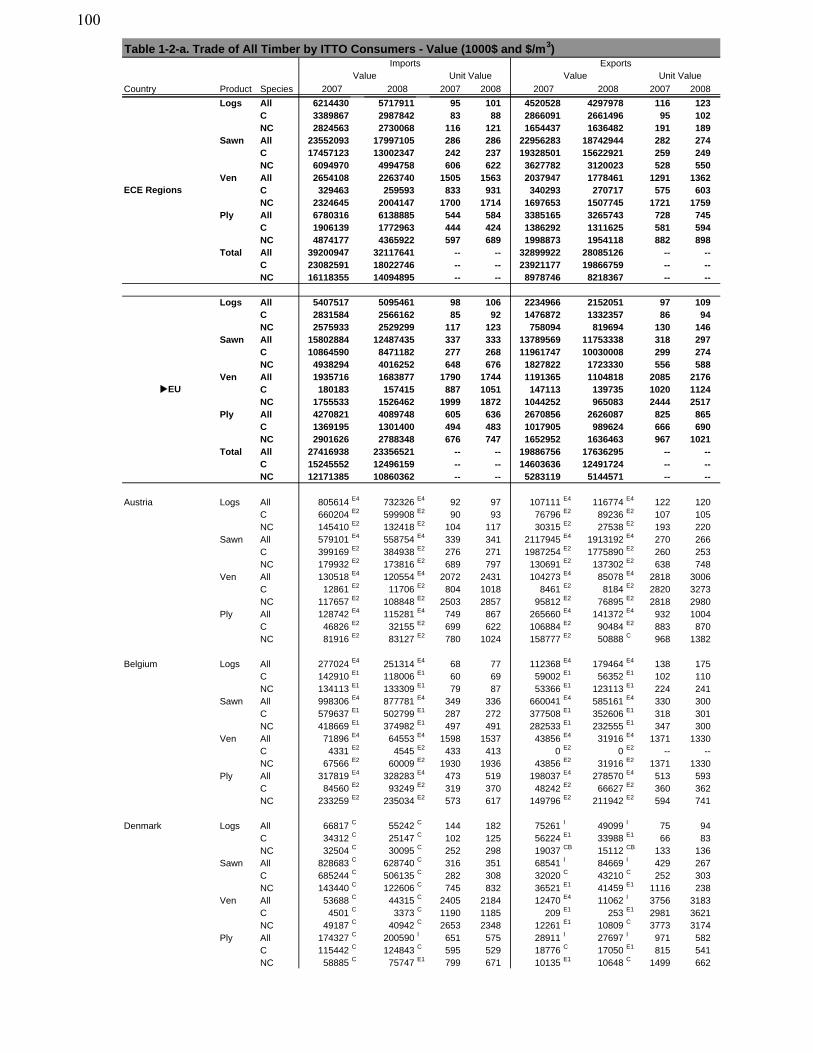
Table 1-2-a. Trade of All Timber by ITTO Consumers - Value (1000$ and $/m3)
Country Product Species
ImportsValue Unit Value
2008 2007
Exports
2008 2007
Value Unit Value
2007 200820082007
Logs All 6214430 5717911 95 101 4520528 4297978 116 123C 3389867 2987842 83 88 2866091 2661496 95 102NC 2824563 2730068 116 121 1654437 1636482 191 189
Sawn All 23552093 17997105 286 286 22956283 18742944 282 274C 17457123 13002347 242 237 19328501 15622921 259 249NC 6094970 4994758 606 622 3627782 3120023 528 550
Ven All 2654108 2263740 1505 1563 2037947 1778461 1291 1362C 329463 259593 833 931 340293 270717 575 603NC 2324645 2004147 1700 1714 1697653 1507745 1721 1759
Ply All 6780316 6138885 544 584 3385165 3265743 728 745C 1906139 1772963 444 424 1386292 1311625 581 594NC 4874177 4365922 597 689 1998873 1954118 882 898
Total All 39200947 32117641 -- -- 32899922 28085126 -- --C 23082591 18022746 -- -- 23921177 19866759 -- --NC 16118355 14094895 -- -- 8978746 8218367 -- --
Logs All 5407517 5095461 98 106 2234966 2152051 97 109C 2831584 2566162 85 92 1476872 1332357 86 94NC 2575933 2529299 117 123 758094 819694 130 146
Sawn All 15802884 12487435 337 333 13789569 11753338 318 297C 10864590 8471182 277 268 11961747 10030008 299 274NC 4938294 4016252 648 676 1827822 1723330 556 588
Ven All 1935716 1683877 1790 1744 1191365 1104818 2085 2176C 180183 157415 887 1051 147113 139735 1020 1124NC 1755533 1526462 1999 1872 1044252 965083 2444 2517
Ply All 4270821 4089748 605 636 2670856 2626087 825 865C 1369195 1301400 494 483 1017905 989624 666 690NC 2901626 2788348 676 747 1652952 1636463 967 1021
Total All 27416938 23356521 -- -- 19886756 17636295 -- --C 15245552 12496159 -- -- 14603636 12491724 -- --NC 12171385 10860362 -- -- 5283119 5144571 -- --
Austria Logs All 805614 E4 732326 E4 92 97 107111 E4 116774 E4 122 120C 660204 E2 599908 E2 90 93 76796 E2 89236 E2 107 105NC 145410 E2 132418 E2 104 117 30315 E2 27538 E2 193 220
Sawn All 579101 E4 558754 E4 339 341 2117945 E4 1913192 E4 270 266C 399169 E2 384938 E2 276 271 1987254 E2 1775890 E2 260 253NC 179932 E2 173816 E2 689 797 130691 E2 137302 E2 638 748
Ven All 130518 E4 120554 E4 2072 2431 104273 E4 85078 E4 2818 3006C 12861 E2 11706 E2 804 1018 8461 E2 8184 E2 2820 3273NC 117657 E2 108848 E2 2503 2857 95812 E2 76895 E2 2818 2980
Ply All 128742 E4 115281 E4 749 867 265660 E4 141372 E4 932 1004C 46826 E2 32155 E2 699 622 106884 E2 90484 E2 883 870NC 81916 E2 83127 E2 780 1024 158777 E2 50888 C 968 1382
Belgium Logs All 277024 E4 251314 E4 68 77 112368 E4 179464 E4 138 175C 142910 E1 118006 E1 60 69 59002 E1 56352 E1 102 110NC 134113 E1 133309 E1 79 87 53366 E1 123113 E1 224 241
Sawn All 998306 E4 877781 E4 349 336 660041 E4 585161 E4 330 300C 579637 E1 502799 E1 287 272 377508 E1 352606 E1 318 301NC 418669 E1 374982 E1 497 491 282533 E1 232555 E1 347 300
Ven All 71896 E4 64553 E4 1598 1537 43856 E4 31916 E4 1371 1330C 4331 E2 4545 E2 433 413 0 E2 0 E2 -- --NC 67566 E2 60009 E2 1930 1936 43856 E2 31916 E2 1371 1330
Ply All 317819 E4 328283 E4 473 519 198037 E4 278570 E4 513 593C 84560 E2 93249 E2 319 370 48242 E2 66627 E2 360 362NC 233259 E2 235034 E2 573 617 149796 E2 211942 E2 594 741
Denmark Logs All 66817 C 55242 C 144 182 75261 I 49099 I 75 94C 34312 C 25147 C 102 125 56224 E1 33988 E1 66 83NC 32504 C 30095 C 252 298 19037 CB 15112 CB 133 136
Sawn All 828683 C 628740 C 316 351 68541 I 84669 I 429 267C 685244 C 506135 C 282 308 32020 C 43210 C 252 303NC 143440 C 122606 C 745 832 36521 E1 41459 E1 1116 238
Ven All 53688 C 44315 C 2405 2184 12470 E4 11062 I 3756 3183C 4501 C 3373 C 1190 1185 209 E1 253 E1 2981 3621NC 49187 C 40942 C 2653 2348 12261 E1 10809 C 3773 3174
Ply All 174327 C 200590 I 651 575 28911 I 27697 I 971 582C 115442 C 124843 C 595 529 18776 C 17050 E1 815 541NC 58885 C 75747 E1 799 671 10135 E1 10648 C 1499 662
EU
ECE Regions
100
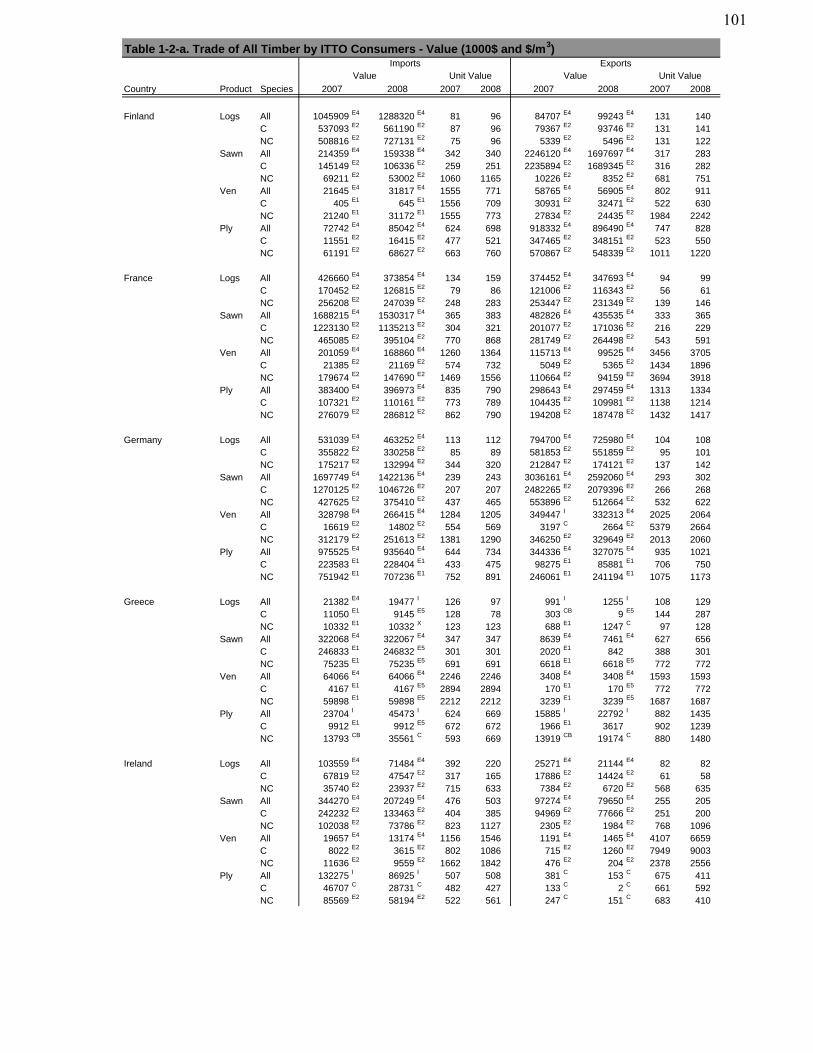
Table 1-2-a. Trade of All Timber by ITTO Consumers - Value (1000$ and $/m3)
Country Product Species
ImportsValue Unit Value
2008 2007
Exports
2008 2007
Value Unit Value
2007 200820082007
Finland Logs All 1045909 E4 1288320 E4 81 96 84707 E4 99243 E4 131 140C 537093 E2 561190 E2 87 96 79367 E2 93746 E2 131 141NC 508816 E2 727131 E2 75 96 5339 E2 5496 E2 131 122
Sawn All 214359 E4 159338 E4 342 340 2246120 E4 1697697 E4 317 283C 145149 E2 106336 E2 259 251 2235894 E2 1689345 E2 316 282NC 69211 E2 53002 E2 1060 1165 10226 E2 8352 E2 681 751
Ven All 21645 E4 31817 E4 1555 771 58765 E4 56905 E4 802 911C 405 E1 645 E1 1556 709 30931 E2 32471 E2 522 630NC 21240 E1 31172 E1 1555 773 27834 E2 24435 E2 1984 2242
Ply All 72742 E4 85042 E4 624 698 918332 E4 896490 E4 747 828C 11551 E2 16415 E2 477 521 347465 E2 348151 E2 523 550NC 61191 E2 68627 E2 663 760 570867 E2 548339 E2 1011 1220
France Logs All 426660 E4 373854 E4 134 159 374452 E4 347693 E4 94 99C 170452 E2 126815 E2 79 86 121006 E2 116343 E2 56 61NC 256208 E2 247039 E2 248 283 253447 E2 231349 E2 139 146
Sawn All 1688215 E4 1530317 E4 365 383 482826 E4 435535 E4 333 365C 1223130 E2 1135213 E2 304 321 201077 E2 171036 E2 216 229NC 465085 E2 395104 E2 770 868 281749 E2 264498 E2 543 591
Ven All 201059 E4 168860 E4 1260 1364 115713 E4 99525 E4 3456 3705C 21385 E2 21169 E2 574 732 5049 E2 5365 E2 1434 1896NC 179674 E2 147690 E2 1469 1556 110664 E2 94159 E2 3694 3918
Ply All 383400 E4 396973 E4 835 790 298643 E4 297459 E4 1313 1334C 107321 E2 110161 E2 773 789 104435 E2 109981 E2 1138 1214NC 276079 E2 286812 E2 862 790 194208 E2 187478 E2 1432 1417
Germany Logs All 531039 E4 463252 E4 113 112 794700 E4 725980 E4 104 108C 355822 E2 330258 E2 85 89 581853 E2 551859 E2 95 101NC 175217 E2 132994 E2 344 320 212847 E2 174121 E2 137 142
Sawn All 1697749 E4 1422136 E4 239 243 3036161 E4 2592060 E4 293 302C 1270125 E2 1046726 E2 207 207 2482265 E2 2079396 E2 266 268NC 427625 E2 375410 E2 437 465 553896 E2 512664 E2 532 622
Ven All 328798 E4 266415 E4 1284 1205 349447 I 332313 E4 2025 2064C 16619 E2 14802 E2 554 569 3197 C 2664 E2 5379 2664NC 312179 E2 251613 E2 1381 1290 346250 E2 329649 E2 2013 2060
Ply All 975525 E4 935640 E4 644 734 344336 E4 327075 E4 935 1021C 223583 E1 228404 E1 433 475 98275 E1 85881 E1 706 750NC 751942 E1 707236 E1 752 891 246061 E1 241194 E1 1075 1173
Greece Logs All 21382 E4 19477 I 126 97 991 I 1255 I 108 129C 11050 E1 9145 E5 128 78 303 CB 9 E5 144 287NC 10332 E1 10332 X 123 123 688 E1 1247 C 97 128
Sawn All 322068 E4 322067 E4 347 347 8639 E4 7461 E4 627 656C 246833 E1 246832 E5 301 301 2020 E1 842 388 301NC 75235 E1 75235 E5 691 691 6618 E1 6618 E5 772 772
Ven All 64066 E4 64066 E4 2246 2246 3408 E4 3408 E4 1593 1593C 4167 E1 4167 E5 2894 2894 170 E1 170 E5 772 772NC 59898 E1 59898 E5 2212 2212 3239 E1 3239 E5 1687 1687
Ply All 23704 I 45473 I 624 669 15885 I 22792 I 882 1435C 9912 E1 9912 E5 672 672 1966 E1 3617 902 1239NC 13793 CB 35561 C 593 669 13919 CB 19174 C 880 1480
Ireland Logs All 103559 E4 71484 E4 392 220 25271 E4 21144 E4 82 82C 67819 E2 47547 E2 317 165 17886 E2 14424 E2 61 58NC 35740 E2 23937 E2 715 633 7384 E2 6720 E2 568 635
Sawn All 344270 E4 207249 E4 476 503 97274 E4 79650 E4 255 205C 242232 E2 133463 E2 404 385 94969 E2 77666 E2 251 200NC 102038 E2 73786 E2 823 1127 2305 E2 1984 E2 768 1096
Ven All 19657 E4 13174 E4 1156 1546 1191 E4 1465 E4 4107 6659C 8022 E2 3615 E2 802 1086 715 E2 1260 E2 7949 9003NC 11636 E2 9559 E2 1662 1842 476 E2 204 E2 2378 2556
Ply All 132275 I 86925 I 507 508 381 C 153 C 675 411C 46707 C 28731 C 482 427 133 C 2 C 661 592NC 85569 E2 58194 E2 522 561 247 C 151 C 683 410
101
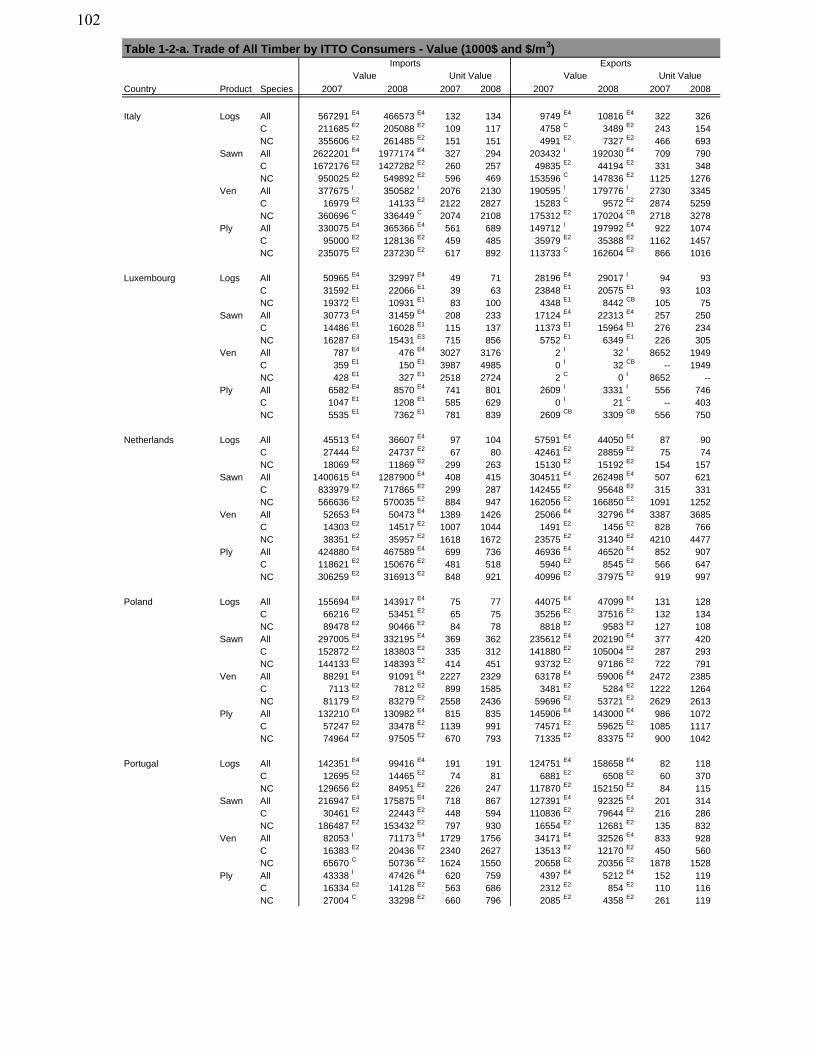
Table 1-2-a. Trade of All Timber by ITTO Consumers - Value (1000$ and $/m3)
Country Product Species
ImportsValue Unit Value
2008 2007
Exports
2008 2007
Value Unit Value
2007 200820082007
Italy Logs All 567291 E4 466573 E4 132 134 9749 E4 10816 E4 322 326C 211685 E2 205088 E2 109 117 4758 C 3489 E2 243 154NC 355606 E2 261485 E2 151 151 4991 E2 7327 E2 466 693
Sawn All 2622201 E4 1977174 E4 327 294 203432 I 192030 E4 709 790C 1672176 E2 1427282 E2 260 257 49835 E2 44194 E2 331 348NC 950025 E2 549892 E2 596 469 153596 C 147836 E2 1125 1276
Ven All 377675 I 350582 I 2076 2130 190595 I 179776 I 2730 3345C 16979 E2 14133 E2 2122 2827 15283 C 9572 E2 2874 5259NC 360696 C 336449 C 2074 2108 175312 E2 170204 CB 2718 3278
Ply All 330075 E4 365366 E4 561 689 149712 I 197992 E4 922 1074C 95000 E2 128136 E2 459 485 35979 E2 35388 E2 1162 1457NC 235075 E2 237230 E2 617 892 113733 C 162604 E2 866 1016
Luxembourg Logs All 50965 E4 32997 E4 49 71 28196 E4 29017 I 94 93C 31592 E1 22066 E1 39 63 23848 E1 20575 E1 93 103NC 19372 E1 10931 E1 83 100 4348 E1 8442 CB 105 75
Sawn All 30773 E4 31459 E4 208 233 17124 E4 22313 E4 257 250C 14486 E1 16028 E1 115 137 11373 E1 15964 E1 276 234NC 16287 E3 15431 E3 715 856 5752 E1 6349 E1 226 305
Ven All 787 E4 476 E4 3027 3176 2 I 32 I 8652 1949C 359 E1 150 E1 3987 4985 0 I 32 CB -- 1949NC 428 E1 327 E1 2518 2724 2 C 0 I 8652 --
Ply All 6582 E4 8570 E4 741 801 2609 I 3331 I 556 746C 1047 E1 1208 E1 585 629 0 I 21 C -- 403NC 5535 E1 7362 E1 781 839 2609 CB 3309 CB 556 750
Netherlands Logs All 45513 E4 36607 E4 97 104 57591 E4 44050 E4 87 90C 27444 E2 24737 E2 67 80 42461 E2 28859 E2 75 74NC 18069 E2 11869 E2 299 263 15130 E2 15192 E2 154 157
Sawn All 1400615 E4 1287900 E4 408 415 304511 E4 262498 E4 507 621C 833979 E2 717865 E2 299 287 142455 E2 95648 E2 315 331NC 566636 E2 570035 E2 884 947 162056 E2 166850 E2 1091 1252
Ven All 52653 E4 50473 E4 1389 1426 25066 E4 32796 E4 3387 3685C 14303 E2 14517 E2 1007 1044 1491 E2 1456 E2 828 766NC 38351 E2 35957 E2 1618 1672 23575 E2 31340 E2 4210 4477
Ply All 424880 E4 467589 E4 699 736 46936 E4 46520 E4 852 907C 118621 E2 150676 E2 481 518 5940 E2 8545 E2 566 647NC 306259 E2 316913 E2 848 921 40996 E2 37975 E2 919 997
Poland Logs All 155694 E4 143917 E4 75 77 44075 E4 47099 E4 131 128C 66216 E2 53451 E2 65 75 35256 E2 37516 E2 132 134NC 89478 E2 90466 E2 84 78 8818 E2 9583 E2 127 108
Sawn All 297005 E4 332195 E4 369 362 235612 E4 202190 E4 377 420C 152872 E2 183803 E2 335 312 141880 E2 105004 E2 287 293NC 144133 E2 148393 E2 414 451 93732 E2 97186 E2 722 791
Ven All 88291 E4 91091 E4 2227 2329 63178 E4 59006 E4 2472 2385C 7113 E2 7812 E2 899 1585 3481 E2 5284 E2 1222 1264NC 81179 E2 83279 E2 2558 2436 59696 E2 53721 E2 2629 2613
Ply All 132210 E4 130982 E4 815 835 145906 E4 143000 E4 986 1072C 57247 E2 33478 E2 1139 991 74571 E2 59625 E2 1085 1117NC 74964 E2 97505 E2 670 793 71335 E2 83375 E2 900 1042
Portugal Logs All 142351 E4 99416 E4 191 191 124751 E4 158658 E4 82 118C 12695 E2 14465 E2 74 81 6881 E2 6508 E2 60 370NC 129656 E2 84951 E2 226 247 117870 E2 152150 E2 84 115
Sawn All 216947 E4 175875 E4 718 867 127391 E4 92325 E4 201 314C 30461 E2 22443 E2 448 594 110836 E2 79644 E2 216 286NC 186487 E2 153432 E2 797 930 16554 E2 12681 E2 135 832
Ven All 82053 I 71173 E4 1729 1756 34171 E4 32526 E4 833 928C 16383 E2 20436 E2 2340 2627 13513 E2 12170 E2 450 560NC 65670 C 50736 E2 1624 1550 20658 E2 20356 E2 1878 1528
Ply All 43338 I 47426 E4 620 759 4397 E4 5212 E4 152 119C 16334 E2 14128 E2 563 686 2312 E2 854 E2 110 116NC 27004 C 33298 E2 660 796 2085 E2 4358 E2 261 119
102
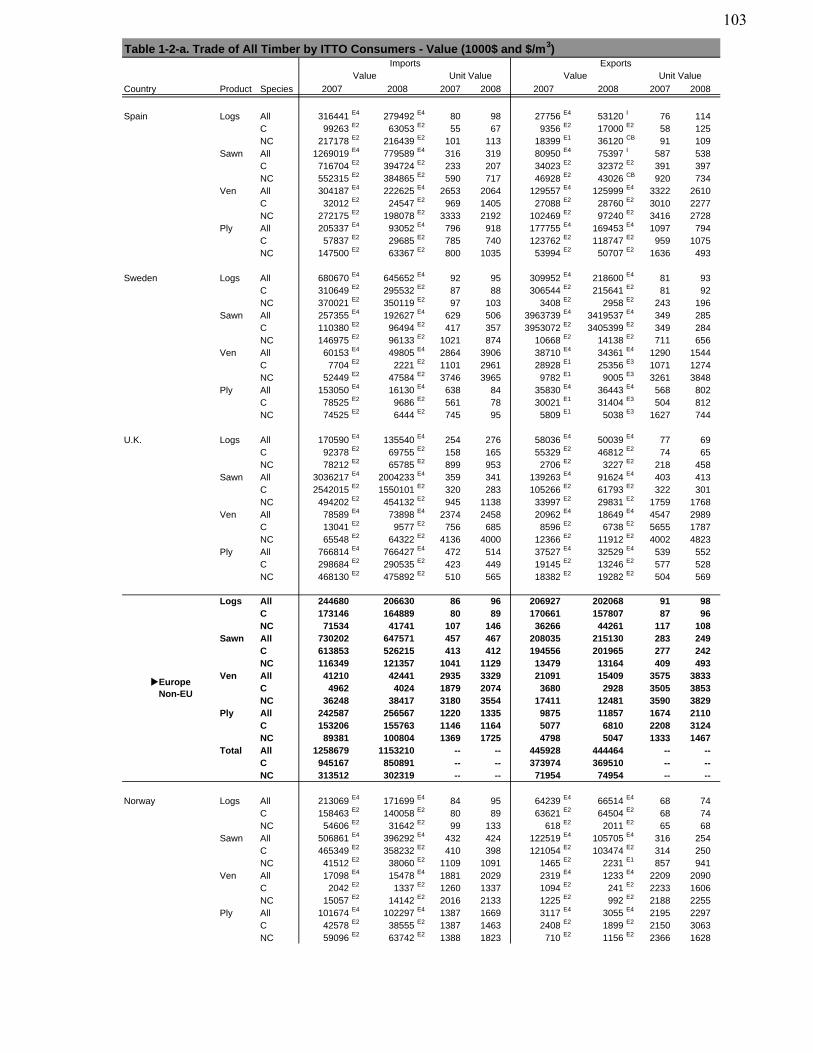
Table 1-2-a. Trade of All Timber by ITTO Consumers - Value (1000$ and $/m3)
Country Product Species
ImportsValue Unit Value
2008 2007
Exports
2008 2007
Value Unit Value
2007 200820082007
Spain Logs All 316441 E4 279492 E4 80 98 27756 E4 53120 I 76 114C 99263 E2 63053 E2 55 67 9356 E2 17000 E2 58 125NC 217178 E2 216439 E2 101 113 18399 E1 36120 CB 91 109
Sawn All 1269019 E4 779589 E4 316 319 80950 E4 75397 I 587 538C 716704 E2 394724 E2 233 207 34023 E2 32372 E2 391 397NC 552315 E2 384865 E2 590 717 46928 E2 43026 CB 920 734
Ven All 304187 E4 222625 E4 2653 2064 129557 E4 125999 E4 3322 2610C 32012 E2 24547 E2 969 1405 27088 E2 28760 E2 3010 2277NC 272175 E2 198078 E2 3333 2192 102469 E2 97240 E2 3416 2728
Ply All 205337 E4 93052 E4 796 918 177755 E4 169453 E4 1097 794C 57837 E2 29685 E2 785 740 123762 E2 118747 E2 959 1075NC 147500 E2 63367 E2 800 1035 53994 E2 50707 E2 1636 493
Sweden Logs All 680670 E4 645652 E4 92 95 309952 E4 218600 E4 81 93C 310649 E2 295532 E2 87 88 306544 E2 215641 E2 81 92NC 370021 E2 350119 E2 97 103 3408 E2 2958 E2 243 196
Sawn All 257355 E4 192627 E4 629 506 3963739 E4 3419537 E4 349 285C 110380 E2 96494 E2 417 357 3953072 E2 3405399 E2 349 284NC 146975 E2 96133 E2 1021 874 10668 E2 14138 E2 711 656
Ven All 60153 E4 49805 E4 2864 3906 38710 E4 34361 E4 1290 1544C 7704 E2 2221 E2 1101 2961 28928 E1 25356 E3 1071 1274NC 52449 E2 47584 E2 3746 3965 9782 E1 9005 E3 3261 3848
Ply All 153050 E4 16130 E4 638 84 35830 E4 36443 E4 568 802C 78525 E2 9686 E2 561 78 30021 E1 31404 E3 504 812NC 74525 E2 6444 E2 745 95 5809 E1 5038 E3 1627 744
U.K. Logs All 170590 E4 135540 E4 254 276 58036 E4 50039 E4 77 69C 92378 E2 69755 E2 158 165 55329 E2 46812 E2 74 65NC 78212 E2 65785 E2 899 953 2706 E2 3227 E2 218 458
Sawn All 3036217 E4 2004233 E4 359 341 139263 E4 91624 E4 403 413C 2542015 E2 1550101 E2 320 283 105266 E2 61793 E2 322 301NC 494202 E2 454132 E2 945 1138 33997 E2 29831 E2 1759 1768
Ven All 78589 E4 73898 E4 2374 2458 20962 E4 18649 E4 4547 2989C 13041 E2 9577 E2 756 685 8596 E2 6738 E2 5655 1787NC 65548 E2 64322 E2 4136 4000 12366 E2 11912 E2 4002 4823
Ply All 766814 E4 766427 E4 472 514 37527 E4 32529 E4 539 552C 298684 E2 290535 E2 423 449 19145 E2 13246 E2 577 528NC 468130 E2 475892 E2 510 565 18382 E2 19282 E2 504 569
Logs All 244680 206630 86 96 206927 202068 91 98C 173146 164889 80 89 170661 157807 87 96NC 71534 41741 107 146 36266 44261 117 108
Sawn All 730202 647571 457 467 208035 215130 283 249C 613853 526215 413 412 194556 201965 277 242NC 116349 121357 1041 1129 13479 13164 409 493
Ven All 41210 42441 2935 3329 21091 15409 3575 3833C 4962 4024 1879 2074 3680 2928 3505 3853NC 36248 38417 3180 3554 17411 12481 3590 3829
Ply All 242587 256567 1220 1335 9875 11857 1674 2110C 153206 155763 1146 1164 5077 6810 2208 3124NC 89381 100804 1369 1725 4798 5047 1333 1467
Total All 1258679 1153210 -- -- 445928 444464 -- --C 945167 850891 -- -- 373974 369510 -- --NC 313512 302319 -- -- 71954 74954 -- --
Norway Logs All 213069 E4 171699 E4 84 95 64239 E4 66514 E4 68 74C 158463 E2 140058 E2 80 89 63621 E2 64504 E2 68 74NC 54606 E2 31642 E2 99 133 618 E2 2011 E2 65 68
Sawn All 506861 E4 396292 E4 432 424 122519 E4 105705 E4 316 254C 465349 E2 358232 E2 410 398 121054 E2 103474 E2 314 250NC 41512 E2 38060 E2 1109 1091 1465 E2 2231 E1 857 941
Ven All 17098 E4 15478 E4 1881 2029 2319 E4 1233 E4 2209 2090C 2042 E2 1337 E2 1260 1337 1094 E2 241 E2 2233 1606NC 15057 E2 14142 E2 2016 2133 1225 E2 992 E2 2188 2255
Ply All 101674 E4 102297 E4 1387 1669 3117 E4 3055 E4 2195 2297C 42578 E2 38555 E2 1387 1463 2408 E2 1899 E2 2150 3063NC 59096 E2 63742 E2 1388 1823 710 E2 1156 E2 2366 1628
Europe Non-EU
103
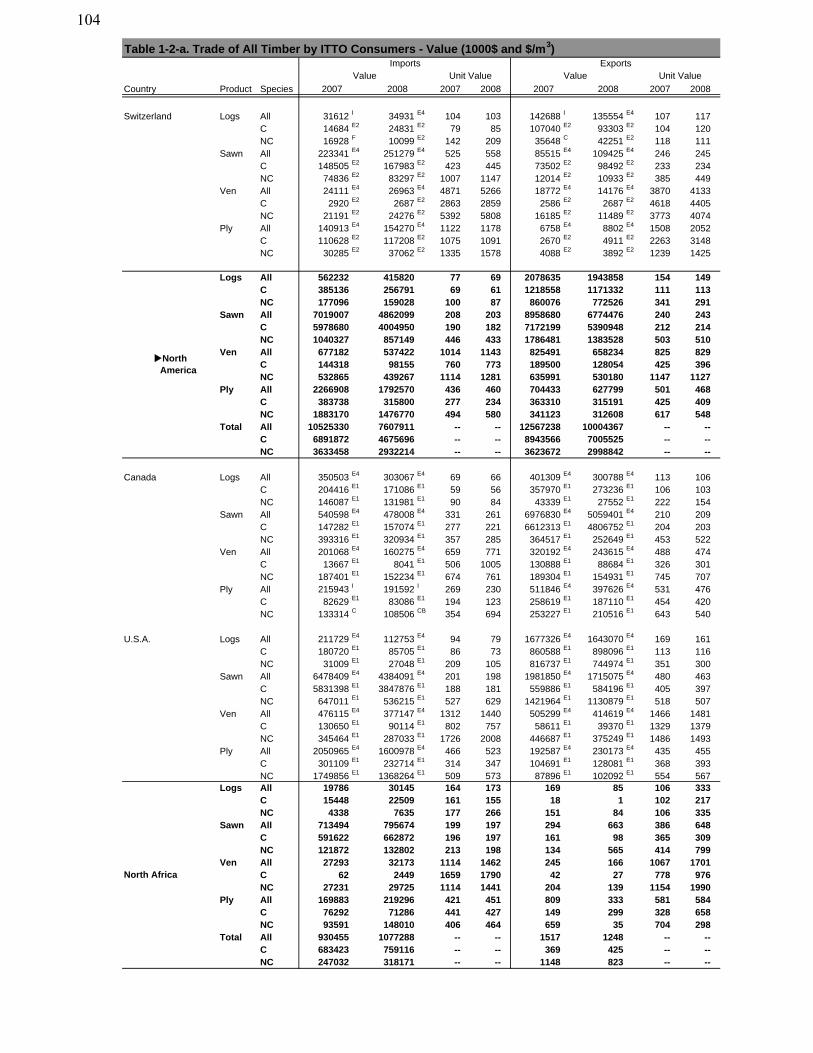
Table 1-2-a. Trade of All Timber by ITTO Consumers - Value (1000$ and $/m3)
Country Product Species
ImportsValue Unit Value
2008 2007
Exports
2008 2007
Value Unit Value
2007 200820082007
Switzerland Logs All 31612 I 34931 E4 104 103 142688 I 135554 E4 107 117C 14684 E2 24831 E2 79 85 107040 E2 93303 E2 104 120NC 16928 F 10099 E2 142 209 35648 C 42251 E2 118 111
Sawn All 223341 E4 251279 E4 525 558 85515 E4 109425 E4 246 245C 148505 E2 167983 E2 423 445 73502 E2 98492 E2 233 234NC 74836 E2 83297 E2 1007 1147 12014 E2 10933 E2 385 449
Ven All 24111 E4 26963 E4 4871 5266 18772 E4 14176 E4 3870 4133C 2920 E2 2687 E2 2863 2859 2586 E2 2687 E2 4618 4405NC 21191 E2 24276 E2 5392 5808 16185 E2 11489 E2 3773 4074
Ply All 140913 E4 154270 E4 1122 1178 6758 E4 8802 E4 1508 2052C 110628 E2 117208 E2 1075 1091 2670 E2 4911 E2 2263 3148NC 30285 E2 37062 E2 1335 1578 4088 E2 3892 E2 1239 1425
Logs All 562232 415820 77 69 2078635 1943858 154 149C 385136 256791 69 61 1218558 1171332 111 113NC 177096 159028 100 87 860076 772526 341 291
Sawn All 7019007 4862099 208 203 8958680 6774476 240 243C 5978680 4004950 190 182 7172199 5390948 212 214NC 1040327 857149 446 433 1786481 1383528 503 510
Ven All 677182 537422 1014 1143 825491 658234 825 829C 144318 98155 760 773 189500 128054 425 396NC 532865 439267 1114 1281 635991 530180 1147 1127
Ply All 2266908 1792570 436 460 704433 627799 501 468C 383738 315800 277 234 363310 315191 425 409NC 1883170 1476770 494 580 341123 312608 617 548
Total All 10525330 7607911 -- -- 12567238 10004367 -- --C 6891872 4675696 -- -- 8943566 7005525 -- --NC 3633458 2932214 -- -- 3623672 2998842 -- --
Canada Logs All 350503 E4 303067 E4 69 66 401309 E4 300788 E4 113 106C 204416 E1 171086 E1 59 56 357970 E1 273236 E1 106 103NC 146087 E1 131981 E1 90 84 43339 E1 27552 E1 222 154
Sawn All 540598 E4 478008 E4 331 261 6976830 E4 5059401 E4 210 209C 147282 E1 157074 E1 277 221 6612313 E1 4806752 E1 204 203NC 393316 E1 320934 E1 357 285 364517 E1 252649 E1 453 522
Ven All 201068 E4 160275 E4 659 771 320192 E4 243615 E4 488 474C 13667 E1 8041 E1 506 1005 130888 E1 88684 E1 326 301NC 187401 E1 152234 E1 674 761 189304 E1 154931 E1 745 707
Ply All 215943 I 191592 I 269 230 511846 E4 397626 E4 531 476C 82629 E1 83086 E1 194 123 258619 E1 187110 E1 454 420NC 133314 C 108506 CB 354 694 253227 E1 210516 E1 643 540
U.S.A. Logs All 211729 E4 112753 E4 94 79 1677326 E4 1643070 E4 169 161C 180720 E1 85705 E1 86 73 860588 E1 898096 E1 113 116NC 31009 E1 27048 E1 209 105 816737 E1 744974 E1 351 300
Sawn All 6478409 E4 4384091 E4 201 198 1981850 E4 1715075 E4 480 463C 5831398 E1 3847876 E1 188 181 559886 E1 584196 E1 405 397NC 647011 E1 536215 E1 527 629 1421964 E1 1130879 E1 518 507
Ven All 476115 E4 377147 E4 1312 1440 505299 E4 414619 E4 1466 1481C 130650 E1 90114 E1 802 757 58611 E1 39370 E1 1329 1379NC 345464 E1 287033 E1 1726 2008 446687 E1 375249 E1 1486 1493
Ply All 2050965 E4 1600978 E4 466 523 192587 E4 230173 E4 435 455C 301109 E1 232714 E1 314 347 104691 E1 128081 E1 368 393NC 1749856 E1 1368264 E1 509 573 87896 E1 102092 E1 554 567
Logs All 19786 30145 164 173 169 85 106 333C 15448 22509 161 155 18 1 102 217NC 4338 7635 177 266 151 84 106 335
Sawn All 713494 795674 199 197 294 663 386 648C 591622 662872 196 197 161 98 365 309NC 121872 132802 213 198 134 565 414 799
Ven All 27293 32173 1114 1462 245 166 1067 1701C 62 2449 1659 1790 42 27 778 976NC 27231 29725 1114 1441 204 139 1154 1990
Ply All 169883 219296 421 451 809 333 581 584C 76292 71286 441 427 149 299 328 658NC 93591 148010 406 464 659 35 704 298
Total All 930455 1077288 -- -- 1517 1248 -- --C 683423 759116 -- -- 369 425 -- --NC 247032 318171 -- -- 1148 823 -- --
North America
North Africa
104
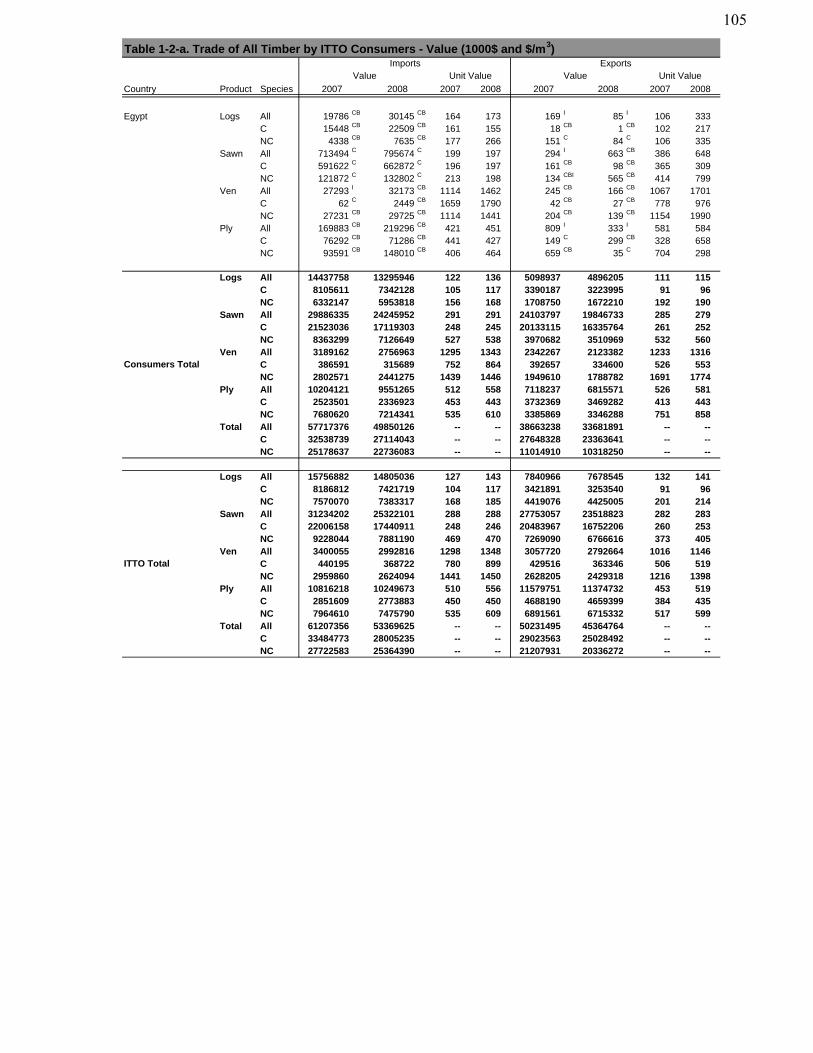
Table 1-2-a. Trade of All Timber by ITTO Consumers - Value (1000$ and $/m3)
Country Product Species
ImportsValue Unit Value
2008 2007
Exports
2008 2007
Value Unit Value
2007 200820082007
Egypt Logs All 19786 CB 30145 CB 164 173 169 I 85 I 106 333C 15448 CB 22509 CB 161 155 18 CB 1 CB 102 217NC 4338 CB 7635 CB 177 266 151 C 84 C 106 335
Sawn All 713494 C 795674 C 199 197 294 I 663 CB 386 648C 591622 C 662872 C 196 197 161 CB 98 CB 365 309NC 121872 C 132802 C 213 198 134 CBI 565 CB 414 799
Ven All 27293 I 32173 CB 1114 1462 245 CB 166 CB 1067 1701C 62 C 2449 CB 1659 1790 42 CB 27 CB 778 976NC 27231 CB 29725 CB 1114 1441 204 CB 139 CB 1154 1990
Ply All 169883 CB 219296 CB 421 451 809 I 333 I 581 584C 76292 CB 71286 CB 441 427 149 C 299 CB 328 658NC 93591 CB 148010 CB 406 464 659 CB 35 C 704 298
Logs All 14437758 13295946 122 136 5098937 4896205 111 115C 8105611 7342128 105 117 3390187 3223995 91 96NC 6332147 5953818 156 168 1708750 1672210 192 190
Sawn All 29886335 24245952 291 291 24103797 19846733 285 279C 21523036 17119303 248 245 20133115 16335764 261 252NC 8363299 7126649 527 538 3970682 3510969 532 560
Ven All 3189162 2756963 1295 1343 2342267 2123382 1233 1316C 386591 315689 752 864 392657 334600 526 553NC 2802571 2441275 1439 1446 1949610 1788782 1691 1774
Ply All 10204121 9551265 512 558 7118237 6815571 526 581C 2523501 2336923 453 443 3732369 3469282 413 443NC 7680620 7214341 535 610 3385869 3346288 751 858
Total All 57717376 49850126 -- -- 38663238 33681891 -- --C 32538739 27114043 -- -- 27648328 23363641 -- --NC 25178637 22736083 -- -- 11014910 10318250 -- --
Logs All 15756882 14805036 127 143 7840966 7678545 132 141C 8186812 7421719 104 117 3421891 3253540 91 96NC 7570070 7383317 168 185 4419076 4425005 201 214
Sawn All 31234202 25322101 288 288 27753057 23518823 282 283C 22006158 17440911 248 246 20483967 16752206 260 253NC 9228044 7881190 469 470 7269090 6766616 373 405
Ven All 3400055 2992816 1298 1348 3057720 2792664 1016 1146C 440195 368722 780 899 429516 363346 506 519NC 2959860 2624094 1441 1450 2628205 2429318 1216 1398
Ply All 10816218 10249673 510 556 11579751 11374732 453 519C 2851609 2773883 450 450 4688190 4659399 384 435NC 7964610 7475790 535 609 6891561 6715332 517 599
Total All 61207356 53369625 -- -- 50231495 45364764 -- --C 33484773 28005235 -- -- 29023563 25028492 -- --NC 27722583 25364390 -- -- 21207931 20336272 -- --
ITTO Total
Consumers Total
105
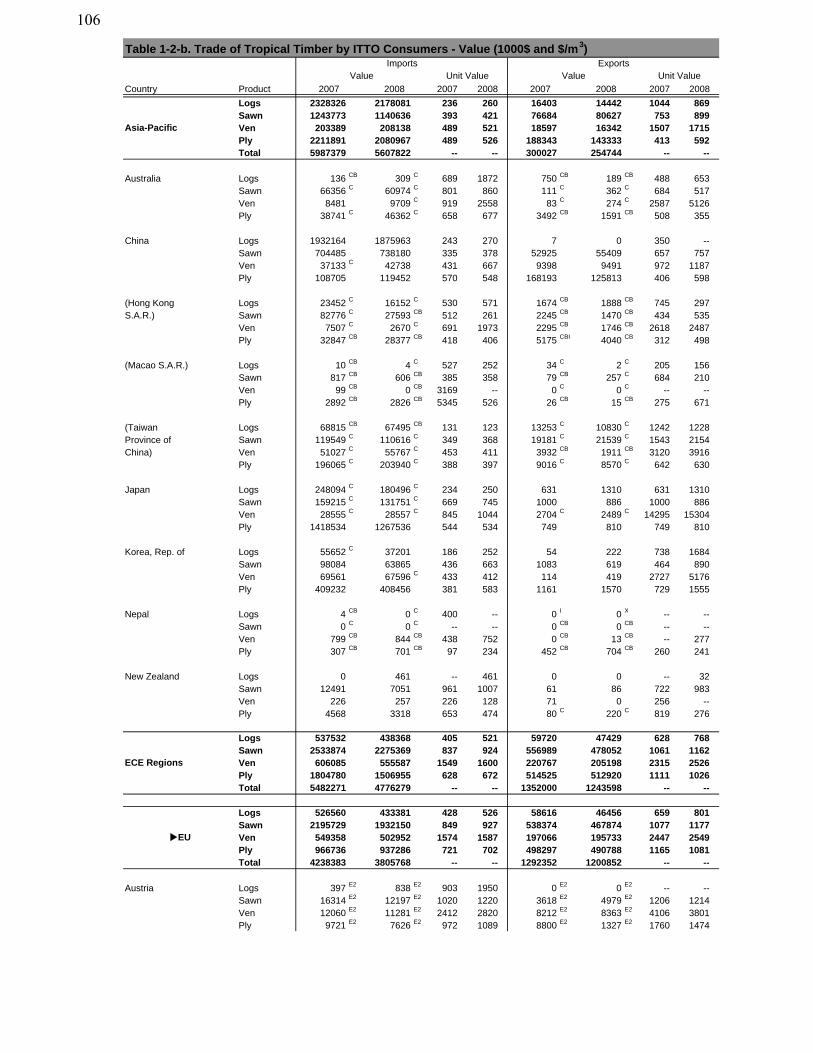
Table 1-2-b. Trade of Tropical Timber by ITTO Consumers - Value (1000$ and $/m3)
Country Product
Logs 2328326 2178081 236 260 16403 14442 1044 869Sawn 1243773 1140636 393 421 76684 80627 753 899Ven 203389 208138 489 521 18597 16342 1507 1715Ply 2211891 2080967 489 526 188343 143333 413 592Total 5987379 5607822 -- -- 300027 254744 -- --
Australia Logs 136 CB 309 C 689 1872 750 CB 189 CB 488 653Sawn 66356 C 60974 C 801 860 111 C 362 C 684 517Ven 8481 9709 C 919 2558 83 C 274 C 2587 5126Ply 38741 C 46362 C 658 677 3492 CB 1591 CB 508 355
China Logs 1932164 1875963 243 270 7 0 350 --Sawn 704485 738180 335 378 52925 55409 657 757Ven 37133 C 42738 431 667 9398 9491 972 1187Ply 108705 119452 570 548 168193 125813 406 598
(Hong Kong Logs 23452 C 16152 C 530 571 1674 CB 1888 CB 745 297S.A.R.) Sawn 82776 C 27593 CB 512 261 2245 CB 1470 CB 434 535
Ven 7507 C 2670 C 691 1973 2295 CB 1746 CB 2618 2487Ply 32847 CB 28377 CB 418 406 5175 CBI 4040 CB 312 498
(Macao S.A.R.) Logs 10 CB 4 C 527 252 34 C 2 C 205 156Sawn 817 CB 606 CB 385 358 79 CB 257 C 684 210Ven 99 CB 0 CB 3169 -- 0 C 0 C -- --Ply 2892 CB 2826 CB 5345 526 26 CB 15 CB 275 671
(Taiwan Logs 68815 CB 67495 CB 131 123 13253 C 10830 C 1242 1228Province of Sawn 119549 C 110616 C 349 368 19181 C 21539 C 1543 2154China) Ven 51027 C 55767 C 453 411 3932 CB 1911 CB 3120 3916
Ply 196065 C 203940 C 388 397 9016 C 8570 C 642 630
Japan Logs 248094 C 180496 C 234 250 631 1310 631 1310Sawn 159215 C 131751 C 669 745 1000 886 1000 886Ven 28555 C 28557 C 845 1044 2704 C 2489 C 14295 15304Ply 1418534 1267536 544 534 749 810 749 810
Korea, Rep. of Logs 55652 C 37201 186 252 54 222 738 1684Sawn 98084 63865 436 663 1083 619 464 890Ven 69561 67596 C 433 412 114 419 2727 5176Ply 409232 408456 381 583 1161 1570 729 1555
Nepal Logs 4 CB 0 C 400 -- 0 I 0 X -- --Sawn 0 C 0 C -- -- 0 CB 0 CB -- --Ven 799 CB 844 CB 438 752 0 CB 13 CB -- 277Ply 307 CB 701 CB 97 234 452 CB 704 CB 260 241
New Zealand Logs 0 461 -- 461 0 0 -- 32Sawn 12491 7051 961 1007 61 86 722 983Ven 226 257 226 128 71 0 256 --Ply 4568 3318 653 474 80 C 220 C 819 276
Logs 537532 438368 405 521 59720 47429 628 768Sawn 2533874 2275369 837 924 556989 478052 1061 1162Ven 606085 555587 1549 1600 220767 205198 2315 2526Ply 1804780 1506955 628 672 514525 512920 1111 1026Total 5482271 4776279 -- -- 1352000 1243598 -- --
Logs 526560 433381 428 526 58616 46456 659 801Sawn 2195729 1932150 849 927 538374 467874 1077 1177Ven 549358 502952 1574 1587 197066 195733 2447 2549Ply 966736 937286 721 702 498297 490788 1165 1081Total 4238383 3805768 -- -- 1292352 1200852 -- --
Austria Logs 397 E2 838 E2 903 1950 0 E2 0 E2 -- --Sawn 16314 E2 12197 E2 1020 1220 3618 E2 4979 E2 1206 1214Ven 12060 E2 11281 E2 2412 2820 8212 E2 8363 E2 4106 3801Ply 9721 E2 7626 E2 972 1089 8800 E2 1327 E2 1760 1474
2008
Imports Exports
2007
EU
Value
2008 20082007
Asia-Pacific
ECE Regions
Unit Value
2007 2008
Unit Value
2007
Value
106
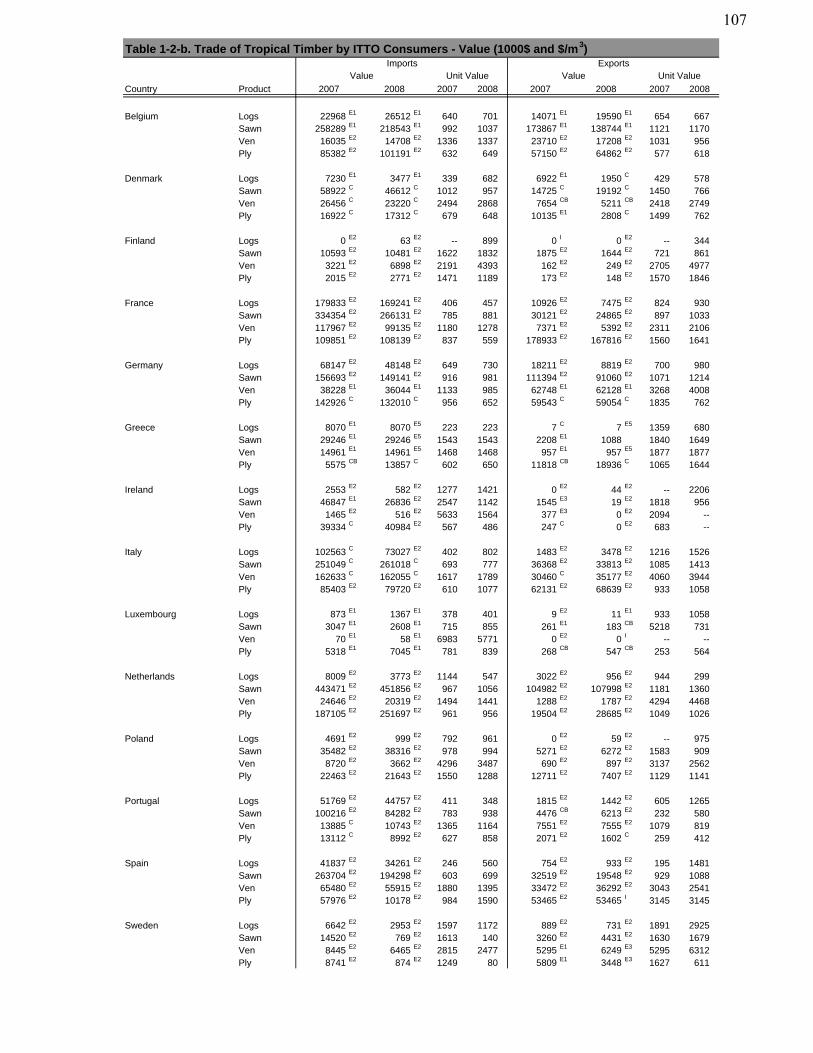
Table 1-2-b. Trade of Tropical Timber by ITTO Consumers - Value (1000$ and $/m3)
Country Product 2008
Imports Exports
2007
Value
2008 20082007
Unit Value
2007 2008
Unit Value
2007
Value
Belgium Logs 22968 E1 26512 E1 640 701 14071 E1 19590 E1 654 667Sawn 258289 E1 218543 E1 992 1037 173867 E1 138744 E1 1121 1170Ven 16035 E2 14708 E2 1336 1337 23710 E2 17208 E2 1031 956Ply 85382 E2 101191 E2 632 649 57150 E2 64862 E2 577 618
Denmark Logs 7230 E1 3477 E1 339 682 6922 E1 1950 C 429 578Sawn 58922 C 46612 C 1012 957 14725 C 19192 C 1450 766Ven 26456 C 23220 C 2494 2868 7654 CB 5211 CB 2418 2749Ply 16922 C 17312 C 679 648 10135 E1 2808 C 1499 762
Finland Logs 0 E2 63 E2 -- 899 0 I 0 E2 -- 344Sawn 10593 E2 10481 E2 1622 1832 1875 E2 1644 E2 721 861Ven 3221 E2 6898 E2 2191 4393 162 E2 249 E2 2705 4977Ply 2015 E2 2771 E2 1471 1189 173 E2 148 E2 1570 1846
France Logs 179833 E2 169241 E2 406 457 10926 E2 7475 E2 824 930Sawn 334354 E2 266131 E2 785 881 30121 E2 24865 E2 897 1033Ven 117967 E2 99135 E2 1180 1278 7371 E2 5392 E2 2311 2106Ply 109851 E2 108139 E2 837 559 178933 E2 167816 E2 1560 1641
Germany Logs 68147 E2 48148 E2 649 730 18211 E2 8819 E2 700 980Sawn 156693 E2 149141 E2 916 981 111394 E2 91060 E2 1071 1214Ven 38228 E1 36044 E1 1133 985 62748 E1 62128 E1 3268 4008Ply 142926 C 132010 C 956 652 59543 C 59054 C 1835 762
Greece Logs 8070 E1 8070 E5 223 223 7 C 7 E5 1359 680Sawn 29246 E1 29246 E5 1543 1543 2208 E1 1088 1840 1649Ven 14961 E1 14961 E5 1468 1468 957 E1 957 E5 1877 1877Ply 5575 CB 13857 C 602 650 11818 CB 18936 C 1065 1644
Ireland Logs 2553 E2 582 E2 1277 1421 0 E2 44 E2 -- 2206Sawn 46847 E1 26836 E2 2547 1142 1545 E3 19 E2 1818 956Ven 1465 E2 516 E2 5633 1564 377 E3 0 E2 2094 --Ply 39334 C 40984 E2 567 486 247 C 0 E2 683 --
Italy Logs 102563 C 73027 E2 402 802 1483 E2 3478 E2 1216 1526Sawn 251049 C 261018 C 693 777 36368 E2 33813 E2 1085 1413Ven 162633 C 162055 C 1617 1789 30460 C 35177 E2 4060 3944Ply 85403 E2 79720 E2 610 1077 62131 E2 68639 E2 933 1058
Luxembourg Logs 873 E1 1367 E1 378 401 9 E2 11 E1 933 1058Sawn 3047 E1 2608 E1 715 855 261 E1 183 CB 5218 731Ven 70 E1 58 E1 6983 5771 0 E2 0 I -- --Ply 5318 E1 7045 E1 781 839 268 CB 547 CB 253 564
Netherlands Logs 8009 E2 3773 E2 1144 547 3022 E2 956 E2 944 299Sawn 443471 E2 451856 E2 967 1056 104982 E2 107998 E2 1181 1360Ven 24646 E2 20319 E2 1494 1441 1288 E2 1787 E2 4294 4468Ply 187105 E2 251697 E2 961 956 19504 E2 28685 E2 1049 1026
Poland Logs 4691 E2 999 E2 792 961 0 E2 59 E2 -- 975Sawn 35482 E2 38316 E2 978 994 5271 E2 6272 E2 1583 909Ven 8720 E2 3662 E2 4296 3487 690 E2 897 E2 3137 2562Ply 22463 E2 21643 E2 1550 1288 12711 E2 7407 E2 1129 1141
Portugal Logs 51769 E2 44757 E2 411 348 1815 E2 1442 E2 605 1265Sawn 100216 E2 84282 E2 783 938 4476 CB 6213 E2 232 580Ven 13885 C 10743 E2 1365 1164 7551 E2 7555 E2 1079 819Ply 13112 C 8992 E2 627 858 2071 E2 1602 C 259 412
Spain Logs 41837 E2 34261 E2 246 560 754 E2 933 E2 195 1481Sawn 263704 E2 194298 E2 603 699 32519 E2 19548 E2 929 1088Ven 65480 E2 55915 E2 1880 1395 33472 E2 36292 E2 3043 2541Ply 57976 E2 10178 E2 984 1590 53465 E2 53465 I 3145 3145
Sweden Logs 6642 E2 2953 E2 1597 1172 889 E2 731 E2 1891 2925Sawn 14520 E2 769 E2 1613 140 3260 E2 4431 E2 1630 1679Ven 8445 E2 6465 E2 2815 2477 5295 E1 6249 E3 5295 6312Ply 8741 E2 874 E2 1249 80 5809 E1 3448 E3 1627 611
107
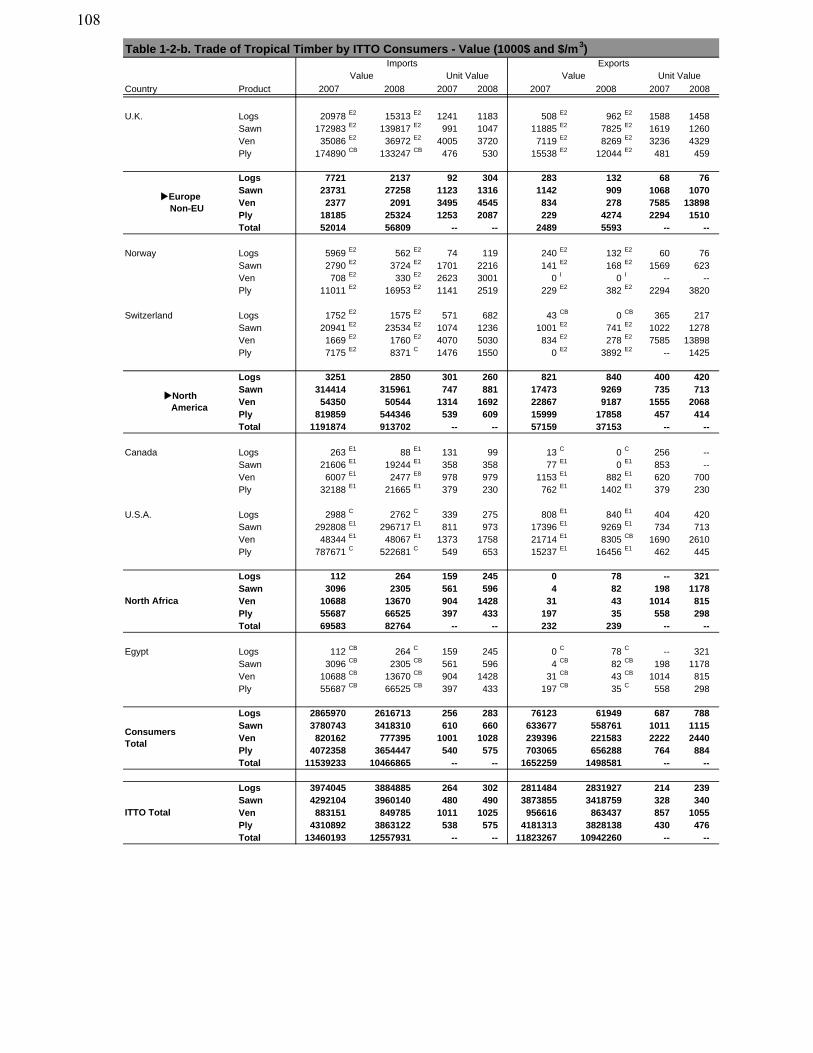
Table 1-2-b. Trade of Tropical Timber by ITTO Consumers - Value (1000$ and $/m3)
Country Product 2008
Imports Exports
2007
Value
2008 20082007
Unit Value
2007 2008
Unit Value
2007
Value
U.K. Logs 20978 E2 15313 E2 1241 1183 508 E2 962 E2 1588 1458Sawn 172983 E2 139817 E2 991 1047 11885 E2 7825 E2 1619 1260Ven 35086 E2 36972 E2 4005 3720 7119 E2 8269 E2 3236 4329Ply 174890 CB 133247 CB 476 530 15538 E2 12044 E2 481 459
Logs 7721 2137 92 304 283 132 68 76Sawn 23731 27258 1123 1316 1142 909 1068 1070Ven 2377 2091 3495 4545 834 278 7585 13898Ply 18185 25324 1253 2087 229 4274 2294 1510Total 52014 56809 -- -- 2489 5593 -- --
Norway Logs 5969 E2 562 E2 74 119 240 E2 132 E2 60 76Sawn 2790 E2 3724 E2 1701 2216 141 E2 168 E2 1569 623Ven 708 E2 330 E2 2623 3001 0 I 0 I -- --Ply 11011 E2 16953 E2 1141 2519 229 E2 382 E2 2294 3820
Switzerland Logs 1752 E2 1575 E2 571 682 43 CB 0 CB 365 217Sawn 20941 E2 23534 E2 1074 1236 1001 E2 741 E2 1022 1278Ven 1669 E2 1760 E2 4070 5030 834 E2 278 E2 7585 13898Ply 7175 E2 8371 C 1476 1550 0 E2 3892 E2 -- 1425
Logs 3251 2850 301 260 821 840 400 420Sawn 314414 315961 747 881 17473 9269 735 713Ven 54350 50544 1314 1692 22867 9187 1555 2068Ply 819859 544346 539 609 15999 17858 457 414Total 1191874 913702 -- -- 57159 37153 -- --
Canada Logs 263 E1 88 E1 131 99 13 C 0 C 256 --Sawn 21606 E1 19244 E1 358 358 77 E1 0 E1 853 --Ven 6007 E1 2477 E8 978 979 1153 E1 882 E1 620 700Ply 32188 E1 21665 E1 379 230 762 E1 1402 E1 379 230
U.S.A. Logs 2988 C 2762 C 339 275 808 E1 840 E1 404 420Sawn 292808 E1 296717 E1 811 973 17396 E1 9269 E1 734 713Ven 48344 E1 48067 E1 1373 1758 21714 E1 8305 CB 1690 2610Ply 787671 C 522681 C 549 653 15237 E1 16456 E1 462 445
Logs 112 264 159 245 0 78 -- 321Sawn 3096 2305 561 596 4 82 198 1178Ven 10688 13670 904 1428 31 43 1014 815Ply 55687 66525 397 433 197 35 558 298Total 69583 82764 -- -- 232 239 -- --
Egypt Logs 112 CB 264 C 159 245 0 C 78 C -- 321Sawn 3096 CB 2305 CB 561 596 4 CB 82 CB 198 1178Ven 10688 CB 13670 CB 904 1428 31 CB 43 CB 1014 815Ply 55687 CB 66525 CB 397 433 197 CB 35 C 558 298
Logs 2865970 2616713 256 283 76123 61949 687 788Sawn 3780743 3418310 610 660 633677 558761 1011 1115Ven 820162 777395 1001 1028 239396 221583 2222 2440Ply 4072358 3654447 540 575 703065 656288 764 884Total 11539233 10466865 -- -- 1652259 1498581 -- --
Logs 3974045 3884885 264 302 2811484 2831927 214 239Sawn 4292104 3960140 480 490 3873855 3418759 328 340Ven 883151 849785 1011 1025 956616 863437 857 1055Ply 4310892 3863122 538 575 4181313 3828138 430 476Total 13460193 12557931 -- -- 11823267 10942260 -- --
ITTO Total
ConsumersTotal
Europe Non-EU
North America
North Africa
108
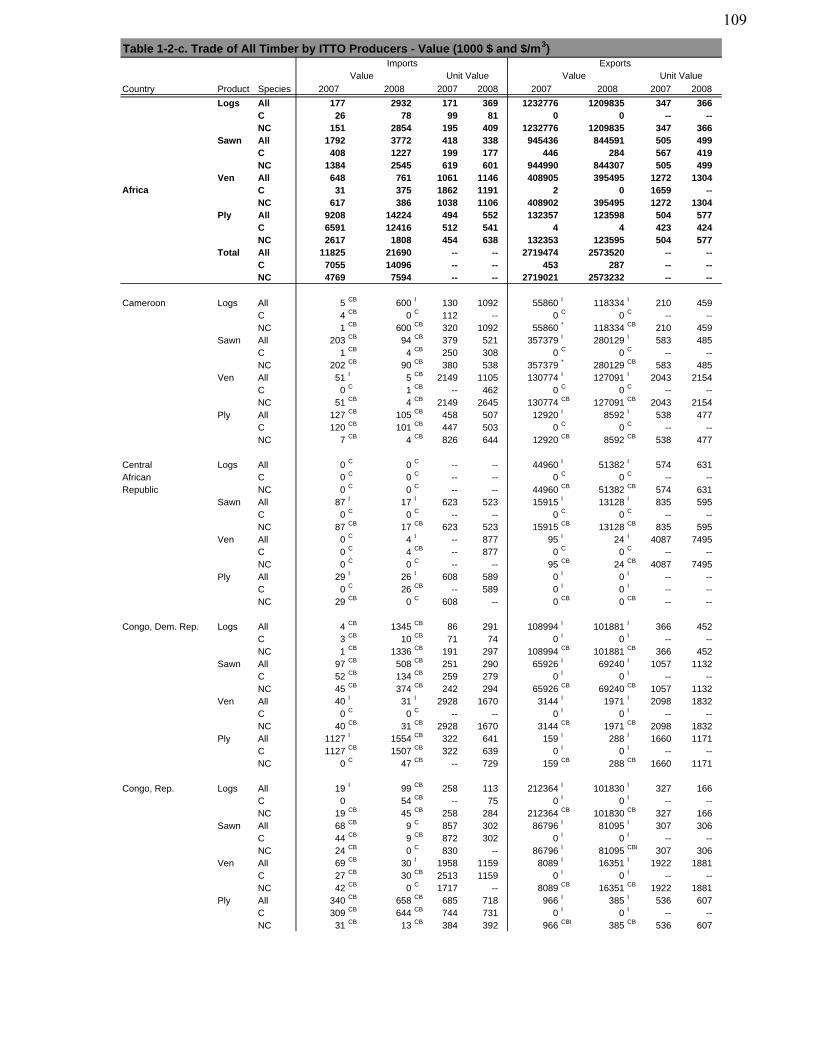
Country Product Species
Logs All 177 2932 171 369 1232776 1209835 347 366C 26 78 99 81 0 0 -- --NC 151 2854 195 409 1232776 1209835 347 366
Sawn All 1792 3772 418 338 945436 844591 505 499C 408 1227 199 177 446 284 567 419NC 1384 2545 619 601 944990 844307 505 499
Ven All 648 761 1061 1146 408905 395495 1272 1304C 31 375 1862 1191 2 0 1659 --NC 617 386 1038 1106 408902 395495 1272 1304
Ply All 9208 14224 494 552 132357 123598 504 577C 6591 12416 512 541 4 4 423 424NC 2617 1808 454 638 132353 123595 504 577
Total All 11825 21690 -- -- 2719474 2573520 -- --C 7055 14096 -- -- 453 287 -- --NC 4769 7594 -- -- 2719021 2573232 -- --
Cameroon Logs All 5 CB 600 I 130 1092 55860 I 118334 I 210 459C 4 CB 0 C 112 -- 0 C 0 C -- --NC 1 CB 600 CB 320 1092 55860 * 118334 CB 210 459
Sawn All 203 CB 94 CB 379 521 357379 I 280129 I 583 485C 1 CB 4 CB 250 308 0 C 0 C -- --NC 202 CB 90 CB 380 538 357379 * 280129 CB 583 485
Ven All 51 I 5 CB 2149 1105 130774 I 127091 I 2043 2154C 0 C 1 CB -- 462 0 C 0 C -- --NC 51 CB 4 CB 2149 2645 130774 CB 127091 CB 2043 2154
Ply All 127 CB 105 CB 458 507 12920 I 8592 I 538 477C 120 CB 101 CB 447 503 0 C 0 C -- --NC 7 CB 4 CB 826 644 12920 CB 8592 CB 538 477
Central Logs All 0 C 0 C -- -- 44960 I 51382 I 574 631African C 0 C 0 C -- -- 0 C 0 C -- --Republic NC 0 C 0 C -- -- 44960 CB 51382 CB 574 631
Sawn All 87 I 17 I 623 523 15915 I 13128 I 835 595C 0 C 0 C -- -- 0 C 0 C -- --NC 87 CB 17 CB 623 523 15915 CB 13128 CB 835 595
Ven All 0 C 4 I -- 877 95 I 24 I 4087 7495C 0 C 4 CB -- 877 0 C 0 C -- --NC 0 C 0 C -- -- 95 CB 24 CB 4087 7495
Ply All 29 I 26 I 608 589 0 I 0 I -- --C 0 C 26 CB -- 589 0 I 0 I -- --NC 29 CB 0 C 608 -- 0 CB 0 CB -- --
Congo, Dem. Rep. Logs All 4 CB 1345 CB 86 291 108994 I 101881 I 366 452C 3 CB 10 CB 71 74 0 I 0 I -- --NC 1 CB 1336 CB 191 297 108994 CB 101881 CB 366 452
Sawn All 97 CB 508 CB 251 290 65926 I 69240 I 1057 1132C 52 CB 134 CB 259 279 0 I 0 I -- --NC 45 CB 374 CB 242 294 65926 CB 69240 CB 1057 1132
Ven All 40 I 31 I 2928 1670 3144 I 1971 I 2098 1832C 0 C 0 C -- -- 0 I 0 I -- --NC 40 CB 31 CB 2928 1670 3144 CB 1971 CB 2098 1832
Ply All 1127 I 1554 CB 322 641 159 I 288 I 1660 1171C 1127 CB 1507 CB 322 639 0 I 0 I -- --NC 0 C 47 CB -- 729 159 CB 288 CB 1660 1171
Congo, Rep. Logs All 19 I 99 CB 258 113 212364 I 101830 I 327 166C 0 54 CB -- 75 0 I 0 I -- --NC 19 CB 45 CB 258 284 212364 CB 101830 CB 327 166
Sawn All 68 CB 9 C 857 302 86796 I 81095 I 307 306C 44 CB 9 CB 872 302 0 I 0 I -- --NC 24 CB 0 C 830 -- 86796 I 81095 CBI 307 306
Ven All 69 CB 30 I 1958 1159 8089 I 16351 I 1922 1881C 27 CB 30 CB 2513 1159 0 I 0 I -- --NC 42 CB 0 C 1717 -- 8089 CB 16351 CB 1922 1881
Ply All 340 CB 658 CB 685 718 966 I 385 I 536 607C 309 CB 644 CB 744 731 0 I 0 I -- --NC 31 CB 13 CB 384 392 966 CBI 385 CB 536 607
Imports Exports
2008 2007 2008
Value Unit Value Value
20072008
Table 1-2-c. Trade of All Timber by ITTO Producers - Value (1000 $ and $/m3)
2008
Unit Value
2007
Africa
2007
109
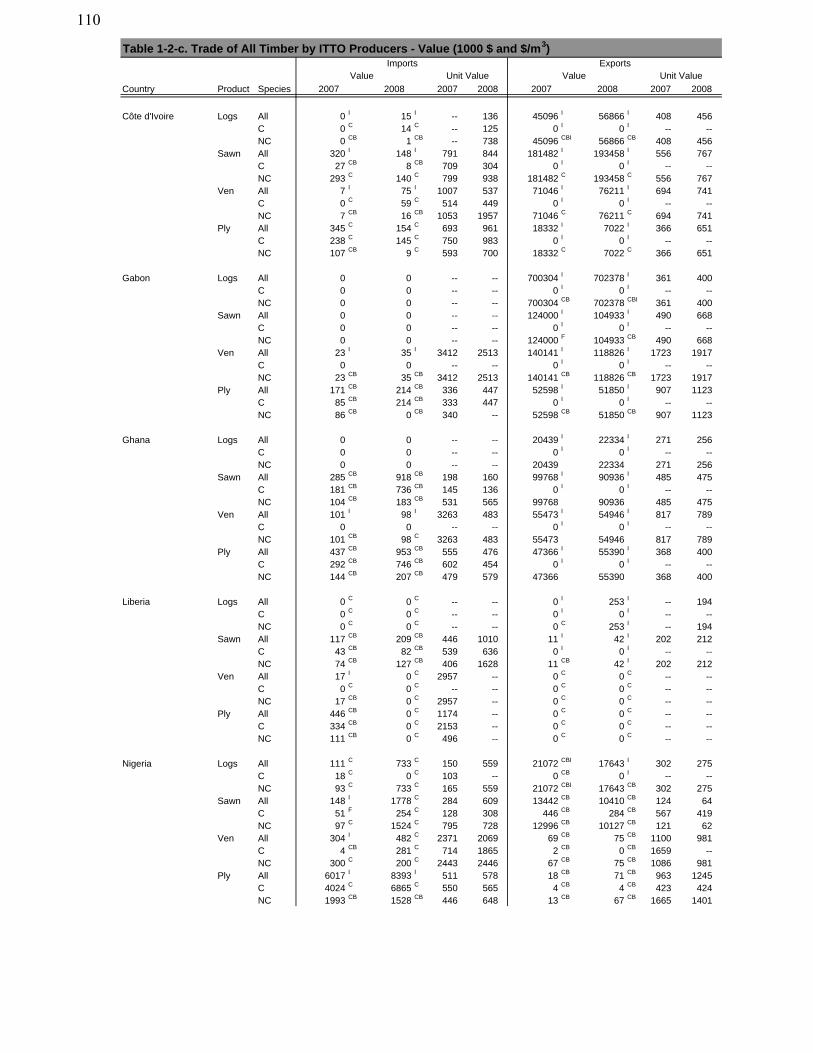
Country Product Species
Imports Exports
2008 2007 2008
Value Unit Value Value
20072008
Table 1-2-c. Trade of All Timber by ITTO Producers - Value (1000 $ and $/m3)
2008
Unit Value
20072007
Côte d'Ivoire Logs All 0 I 15 I -- 136 45096 I 56866 I 408 456C 0 C 14 C -- 125 0 I 0 I -- --NC 0 CB 1 CB -- 738 45096 CBI 56866 CB 408 456
Sawn All 320 I 148 I 791 844 181482 I 193458 I 556 767C 27 CB 8 CB 709 304 0 I 0 I -- --NC 293 C 140 C 799 938 181482 C 193458 C 556 767
Ven All 7 I 75 I 1007 537 71046 I 76211 I 694 741C 0 C 59 C 514 449 0 I 0 I -- --NC 7 CB 16 CB 1053 1957 71046 C 76211 C 694 741
Ply All 345 C 154 C 693 961 18332 I 7022 I 366 651C 238 C 145 C 750 983 0 I 0 I -- --NC 107 CB 9 C 593 700 18332 C 7022 C 366 651
Gabon Logs All 0 0 -- -- 700304 I 702378 I 361 400C 0 0 -- -- 0 I 0 I -- --NC 0 0 -- -- 700304 CB 702378 CBI 361 400
Sawn All 0 0 -- -- 124000 I 104933 I 490 668C 0 0 -- -- 0 I 0 I -- --NC 0 0 -- -- 124000 F 104933 CB 490 668
Ven All 23 I 35 I 3412 2513 140141 I 118826 I 1723 1917C 0 0 -- -- 0 I 0 I -- --NC 23 CB 35 CB 3412 2513 140141 CB 118826 CB 1723 1917
Ply All 171 CB 214 CB 336 447 52598 I 51850 I 907 1123C 85 CB 214 CB 333 447 0 I 0 I -- --NC 86 CB 0 CB 340 -- 52598 CB 51850 CB 907 1123
Ghana Logs All 0 0 -- -- 20439 I 22334 I 271 256C 0 0 -- -- 0 I 0 I -- --NC 0 0 -- -- 20439 22334 271 256
Sawn All 285 CB 918 CB 198 160 99768 I 90936 I 485 475C 181 CB 736 CB 145 136 0 I 0 I -- --NC 104 CB 183 CB 531 565 99768 90936 485 475
Ven All 101 I 98 I 3263 483 55473 I 54946 I 817 789C 0 0 -- -- 0 I 0 I -- --NC 101 CB 98 C 3263 483 55473 54946 817 789
Ply All 437 CB 953 CB 555 476 47366 I 55390 I 368 400C 292 CB 746 CB 602 454 0 I 0 I -- --NC 144 CB 207 CB 479 579 47366 55390 368 400
Liberia Logs All 0 C 0 C -- -- 0 I 253 I -- 194C 0 C 0 C -- -- 0 I 0 I -- --NC 0 C 0 C -- -- 0 C 253 I -- 194
Sawn All 117 CB 209 CB 446 1010 11 I 42 I 202 212C 43 CB 82 CB 539 636 0 I 0 I -- --NC 74 CB 127 CB 406 1628 11 CB 42 I 202 212
Ven All 17 I 0 C 2957 -- 0 C 0 C -- --C 0 C 0 C -- -- 0 C 0 C -- --NC 17 CB 0 C 2957 -- 0 C 0 C -- --
Ply All 446 CB 0 C 1174 -- 0 C 0 C -- --C 334 CB 0 C 2153 -- 0 C 0 C -- --NC 111 CB 0 C 496 -- 0 C 0 C -- --
Nigeria Logs All 111 C 733 C 150 559 21072 CBI 17643 I 302 275C 18 C 0 C 103 -- 0 CB 0 I -- --NC 93 C 733 C 165 559 21072 CBI 17643 CB 302 275
Sawn All 148 I 1778 C 284 609 13442 CB 10410 CB 124 64C 51 F 254 C 128 308 446 CB 284 CB 567 419NC 97 C 1524 C 795 728 12996 CB 10127 CB 121 62
Ven All 304 I 482 C 2371 2069 69 CB 75 CB 1100 981C 4 CB 281 C 714 1865 2 CB 0 CB 1659 --NC 300 C 200 C 2443 2446 67 CB 75 CB 1086 981
Ply All 6017 I 8393 I 511 578 18 CB 71 CB 963 1245C 4024 C 6865 C 550 565 4 CB 4 CB 423 424NC 1993 CB 1528 CB 446 648 13 CB 67 CB 1665 1401
110
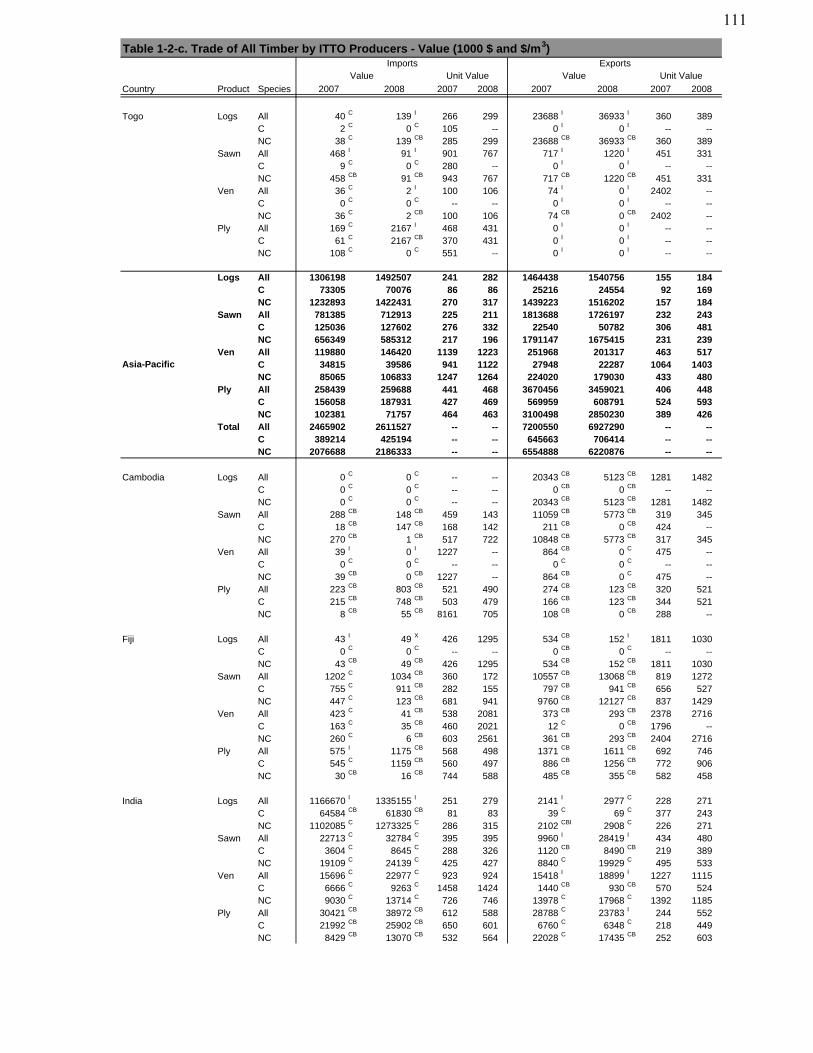
Country Product Species
Imports Exports
2008 2007 2008
Value Unit Value Value
20072008
Table 1-2-c. Trade of All Timber by ITTO Producers - Value (1000 $ and $/m3)
2008
Unit Value
20072007
Togo Logs All 40 C 139 I 266 299 23688 I 36933 I 360 389C 2 C 0 C 105 -- 0 I 0 I -- --NC 38 C 139 CB 285 299 23688 CB 36933 CB 360 389
Sawn All 468 I 91 I 901 767 717 I 1220 I 451 331C 9 C 0 C 280 -- 0 I 0 I -- --NC 458 CB 91 CB 943 767 717 CB 1220 CB 451 331
Ven All 36 C 2 I 100 106 74 I 0 I 2402 --C 0 C 0 C -- -- 0 I 0 I -- --NC 36 C 2 CB 100 106 74 CB 0 CB 2402 --
Ply All 169 C 2167 I 468 431 0 I 0 I -- --C 61 C 2167 CB 370 431 0 I 0 I -- --NC 108 C 0 C 551 -- 0 I 0 I -- --
Logs All 1306198 1492507 241 282 1464438 1540756 155 184C 73305 70076 86 86 25216 24554 92 169NC 1232893 1422431 270 317 1439223 1516202 157 184
Sawn All 781385 712913 225 211 1813688 1726197 232 243C 125036 127602 276 332 22540 50782 306 481NC 656349 585312 217 196 1791147 1675415 231 239
Ven All 119880 146420 1139 1223 251968 201317 463 517C 34815 39586 941 1122 27948 22287 1064 1403NC 85065 106833 1247 1264 224020 179030 433 480
Ply All 258439 259688 441 468 3670456 3459021 406 448C 156058 187931 427 469 569959 608791 524 593NC 102381 71757 464 463 3100498 2850230 389 426
Total All 2465902 2611527 -- -- 7200550 6927290 -- --C 389214 425194 -- -- 645663 706414 -- --NC 2076688 2186333 -- -- 6554888 6220876 -- --
Cambodia Logs All 0 C 0 C -- -- 20343 CB 5123 CB 1281 1482C 0 C 0 C -- -- 0 CB 0 CB -- --NC 0 C 0 C -- -- 20343 CB 5123 CB 1281 1482
Sawn All 288 CB 148 CB 459 143 11059 CB 5773 CB 319 345C 18 CB 147 CB 168 142 211 CB 0 CB 424 --NC 270 CB 1 CB 517 722 10848 CB 5773 CB 317 345
Ven All 39 I 0 I 1227 -- 864 CB 0 C 475 --C 0 C 0 C -- -- 0 C 0 C -- --NC 39 CB 0 CB 1227 -- 864 CB 0 C 475 --
Ply All 223 CB 803 CB 521 490 274 CB 123 CB 320 521C 215 CB 748 CB 503 479 166 CB 123 CB 344 521NC 8 CB 55 CB 8161 705 108 CB 0 CB 288 --
Fiji Logs All 43 I 49 X 426 1295 534 CB 152 I 1811 1030C 0 C 0 C -- -- 0 CB 0 C -- --NC 43 CB 49 CB 426 1295 534 CB 152 CB 1811 1030
Sawn All 1202 C 1034 CB 360 172 10557 CB 13068 CB 819 1272C 755 C 911 CB 282 155 797 CB 941 CB 656 527NC 447 C 123 CB 681 941 9760 CB 12127 CB 837 1429
Ven All 423 C 41 CB 538 2081 373 CB 293 CB 2378 2716C 163 C 35 CB 460 2021 12 C 0 CB 1796 --NC 260 C 6 CB 603 2561 361 CB 293 CB 2404 2716
Ply All 575 I 1175 CB 568 498 1371 CB 1611 CB 692 746C 545 C 1159 CB 560 497 886 CB 1256 CB 772 906NC 30 CB 16 CB 744 588 485 CB 355 CB 582 458
India Logs All 1166670 I 1335155 I 251 279 2141 I 2977 C 228 271C 64584 CB 61830 CB 81 83 39 C 69 C 377 243NC 1102085 C 1273325 C 286 315 2102 CBI 2908 C 226 271
Sawn All 22713 C 32784 C 395 395 9960 I 28419 I 434 480C 3604 C 8645 C 288 326 1120 CB 8490 CB 219 389NC 19109 C 24139 C 425 427 8840 C 19929 C 495 533
Ven All 15696 C 22977 C 923 924 15418 I 18899 I 1227 1115C 6666 C 9263 C 1458 1424 1440 CB 930 CB 570 524NC 9030 C 13714 C 726 746 13978 C 17968 C 1392 1185
Ply All 30421 CB 38972 CB 612 588 28788 C 23783 I 244 552C 21992 CB 25902 CB 650 601 6760 C 6348 C 218 449NC 8429 CB 13070 CB 532 564 22028 C 17435 CB 252 603
Asia-Pacific
111
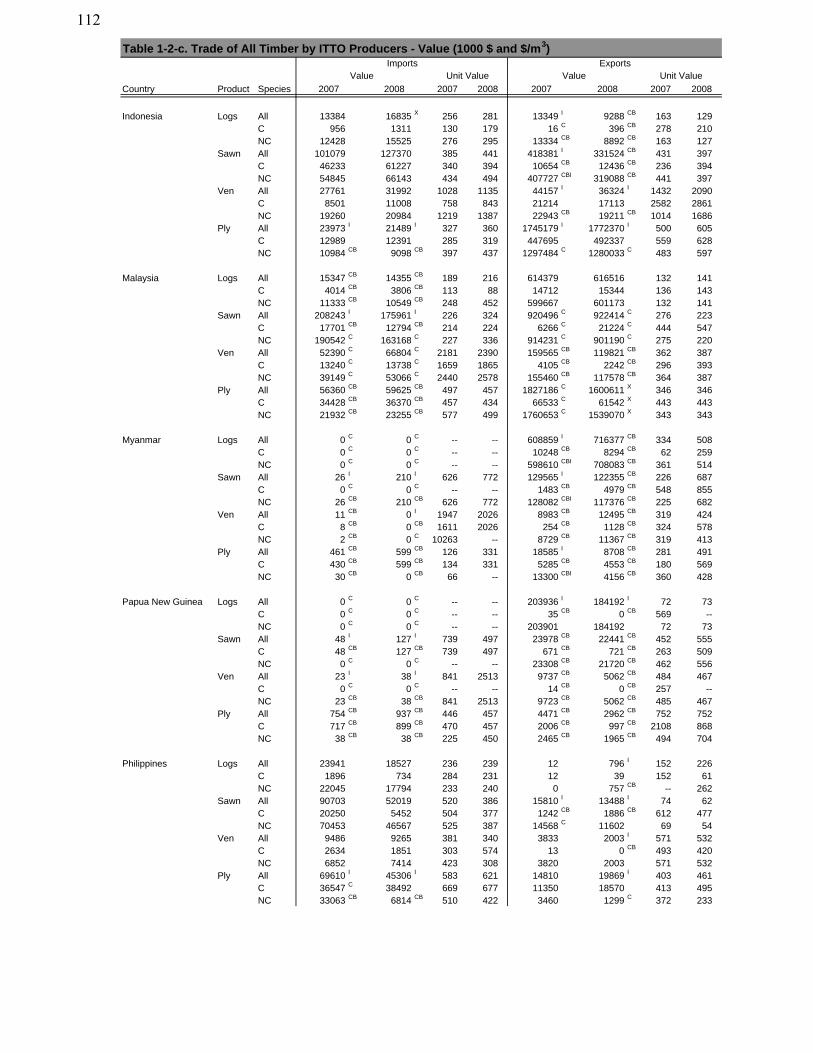
Country Product Species
Imports Exports
2008 2007 2008
Value Unit Value Value
20072008
Table 1-2-c. Trade of All Timber by ITTO Producers - Value (1000 $ and $/m3)
2008
Unit Value
20072007
Indonesia Logs All 13384 16835 X 256 281 13349 I 9288 CB 163 129C 956 1311 130 179 16 C 396 CB 278 210NC 12428 15525 276 295 13334 CB 8892 CB 163 127
Sawn All 101079 127370 385 441 418381 I 331524 CB 431 397C 46233 61227 340 394 10654 CB 12436 CB 236 394NC 54845 66143 434 494 407727 CBI 319088 CB 441 397
Ven All 27761 31992 1028 1135 44157 I 36324 I 1432 2090C 8501 11008 758 843 21214 17113 2582 2861NC 19260 20984 1219 1387 22943 CB 19211 CB 1014 1686
Ply All 23973 I 21489 I 327 360 1745179 I 1772370 I 500 605C 12989 12391 285 319 447695 492337 559 628NC 10984 CB 9098 CB 397 437 1297484 C 1280033 C 483 597
Malaysia Logs All 15347 CB 14355 CB 189 216 614379 616516 132 141C 4014 CB 3806 CB 113 88 14712 15344 136 143NC 11333 CB 10549 CB 248 452 599667 601173 132 141
Sawn All 208243 I 175961 I 226 324 920496 C 922414 C 276 223C 17701 CB 12794 CB 214 224 6266 C 21224 C 444 547NC 190542 C 163168 C 227 336 914231 C 901190 C 275 220
Ven All 52390 C 66804 C 2181 2390 159565 CB 119821 CB 362 387C 13240 C 13738 C 1659 1865 4105 CB 2242 CB 296 393NC 39149 C 53066 C 2440 2578 155460 CB 117578 CB 364 387
Ply All 56360 CB 59625 CB 497 457 1827186 C 1600611 X 346 346C 34428 CB 36370 CB 457 434 66533 C 61542 X 443 443NC 21932 CB 23255 CB 577 499 1760653 C 1539070 X 343 343
Myanmar Logs All 0 C 0 C -- -- 608859 I 716377 CB 334 508C 0 C 0 C -- -- 10248 CB 8294 CB 62 259NC 0 C 0 C -- -- 598610 CBI 708083 CB 361 514
Sawn All 26 I 210 I 626 772 129565 I 122355 CB 226 687C 0 C 0 C -- -- 1483 CB 4979 CB 548 855NC 26 CB 210 CB 626 772 128082 CBI 117376 CB 225 682
Ven All 11 CB 0 I 1947 2026 8983 CB 12495 CB 319 424C 8 CB 0 CB 1611 2026 254 CB 1128 CB 324 578NC 2 CB 0 C 10263 -- 8729 CB 11367 CB 319 413
Ply All 461 CB 599 CB 126 331 18585 I 8708 CB 281 491C 430 CB 599 CB 134 331 5285 CB 4553 CB 180 569NC 30 CB 0 CB 66 -- 13300 CBI 4156 CB 360 428
Papua New Guinea Logs All 0 C 0 C -- -- 203936 I 184192 I 72 73C 0 C 0 C -- -- 35 CB 0 CB 569 --NC 0 C 0 C -- -- 203901 184192 72 73
Sawn All 48 I 127 I 739 497 23978 CB 22441 CB 452 555C 48 CB 127 CB 739 497 671 CB 721 CB 263 509NC 0 C 0 C -- -- 23308 CB 21720 CB 462 556
Ven All 23 I 38 I 841 2513 9737 CB 5062 CB 484 467C 0 C 0 C -- -- 14 CB 0 CB 257 --NC 23 CB 38 CB 841 2513 9723 CB 5062 CB 485 467
Ply All 754 CB 937 CB 446 457 4471 CB 2962 CB 752 752C 717 CB 899 CB 470 457 2006 CB 997 CB 2108 868NC 38 CB 38 CB 225 450 2465 CB 1965 CB 494 704
Philippines Logs All 23941 18527 236 239 12 796 I 152 226C 1896 734 284 231 12 39 152 61NC 22045 17794 233 240 0 757 CB -- 262
Sawn All 90703 52019 520 386 15810 I 13488 I 74 62C 20250 5452 504 377 1242 CB 1886 CB 612 477NC 70453 46567 525 387 14568 C 11602 69 54
Ven All 9486 9265 381 340 3833 2003 I 571 532C 2634 1851 303 574 13 0 CB 493 420NC 6852 7414 423 308 3820 2003 571 532
Ply All 69610 I 45306 I 583 621 14810 19869 I 403 461C 36547 C 38492 669 677 11350 18570 413 495NC 33063 CB 6814 CB 510 422 3460 1299 C 372 233
112
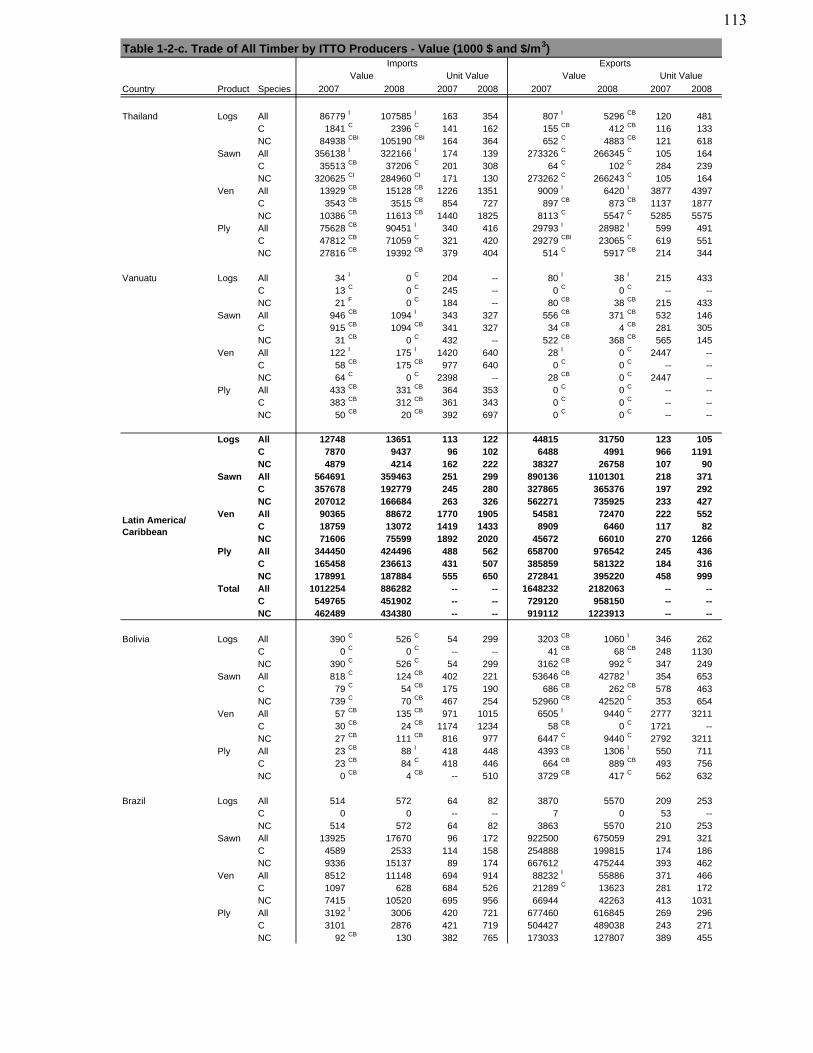
Country Product Species
Imports Exports
2008 2007 2008
Value Unit Value Value
20072008
Table 1-2-c. Trade of All Timber by ITTO Producers - Value (1000 $ and $/m3)
2008
Unit Value
20072007
Thailand Logs All 86779 I 107585 I 163 354 807 I 5296 CB 120 481C 1841 C 2396 C 141 162 155 CB 412 CB 116 133NC 84938 CBI 105190 CBI 164 364 652 C 4883 CB 121 618
Sawn All 356138 I 322166 I 174 139 273326 C 266345 C 105 164C 35513 CB 37206 C 201 308 64 C 102 C 284 239NC 320625 CI 284960 CI 171 130 273262 C 266243 C 105 164
Ven All 13929 CB 15128 CB 1226 1351 9009 I 6420 I 3877 4397C 3543 CB 3515 CB 854 727 897 CB 873 CB 1137 1877NC 10386 CB 11613 CB 1440 1825 8113 C 5547 C 5285 5575
Ply All 75628 CB 90451 I 340 416 29793 I 28982 I 599 491C 47812 CB 71059 C 321 420 29279 CBI 23065 C 619 551NC 27816 CB 19392 CB 379 404 514 C 5917 CB 214 344
Vanuatu Logs All 34 I 0 C 204 -- 80 I 38 I 215 433C 13 C 0 C 245 -- 0 C 0 C -- --NC 21 F 0 C 184 -- 80 CB 38 CB 215 433
Sawn All 946 CB 1094 I 343 327 556 CB 371 CB 532 146C 915 CB 1094 CB 341 327 34 CB 4 CB 281 305NC 31 CB 0 C 432 -- 522 CB 368 CB 565 145
Ven All 122 I 175 I 1420 640 28 I 0 C 2447 --C 58 CB 175 CB 977 640 0 C 0 C -- --NC 64 C 0 C 2398 -- 28 CB 0 C 2447 --
Ply All 433 CB 331 CB 364 353 0 C 0 C -- --C 383 CB 312 CB 361 343 0 C 0 C -- --NC 50 CB 20 CB 392 697 0 C 0 C -- --
Logs All 12748 13651 113 122 44815 31750 123 105C 7870 9437 96 102 6488 4991 966 1191NC 4879 4214 162 222 38327 26758 107 90
Sawn All 564691 359463 251 299 890136 1101301 218 371C 357678 192779 245 280 327865 365376 197 292NC 207012 166684 263 326 562271 735925 233 427
Ven All 90365 88672 1770 1905 54581 72470 222 552C 18759 13072 1419 1433 8909 6460 117 82NC 71606 75599 1892 2020 45672 66010 270 1266
Ply All 344450 424496 488 562 658700 976542 245 436C 165458 236613 431 507 385859 581322 184 316NC 178991 187884 555 650 272841 395220 458 999
Total All 1012254 886282 -- -- 1648232 2182063 -- --C 549765 451902 -- -- 729120 958150 -- --NC 462489 434380 -- -- 919112 1223913 -- --
Bolivia Logs All 390 C 526 C 54 299 3203 CB 1060 I 346 262C 0 C 0 C -- -- 41 CB 68 CB 248 1130NC 390 C 526 C 54 299 3162 CB 992 C 347 249
Sawn All 818 C 124 CB 402 221 53646 CB 42782 I 354 653C 79 C 54 CB 175 190 686 CB 262 CB 578 463NC 739 C 70 CB 467 254 52960 CB 42520 C 353 654
Ven All 57 CB 135 CB 971 1015 6505 I 9440 C 2777 3211C 30 CB 24 CB 1174 1234 58 CB 0 C 1721 --NC 27 CB 111 CB 816 977 6447 C 9440 C 2792 3211
Ply All 23 CB 88 I 418 448 4393 CB 1306 I 550 711C 23 CB 84 C 418 446 664 CB 889 CB 493 756NC 0 CB 4 CB -- 510 3729 CB 417 C 562 632
Brazil Logs All 514 572 64 82 3870 5570 209 253C 0 0 -- -- 7 0 53 --NC 514 572 64 82 3863 5570 210 253
Sawn All 13925 17670 96 172 922500 675059 291 321C 4589 2533 114 158 254888 199815 174 186NC 9336 15137 89 174 667612 475244 393 462
Ven All 8512 11148 694 914 88232 I 55886 371 466C 1097 628 684 526 21289 C 13623 281 172NC 7415 10520 695 956 66944 42263 413 1031
Ply All 3192 I 3006 420 721 677460 616845 269 296C 3101 2876 421 719 504427 489038 243 271NC 92 CB 130 382 765 173033 127807 389 455
Latin America/ Caribbean
113
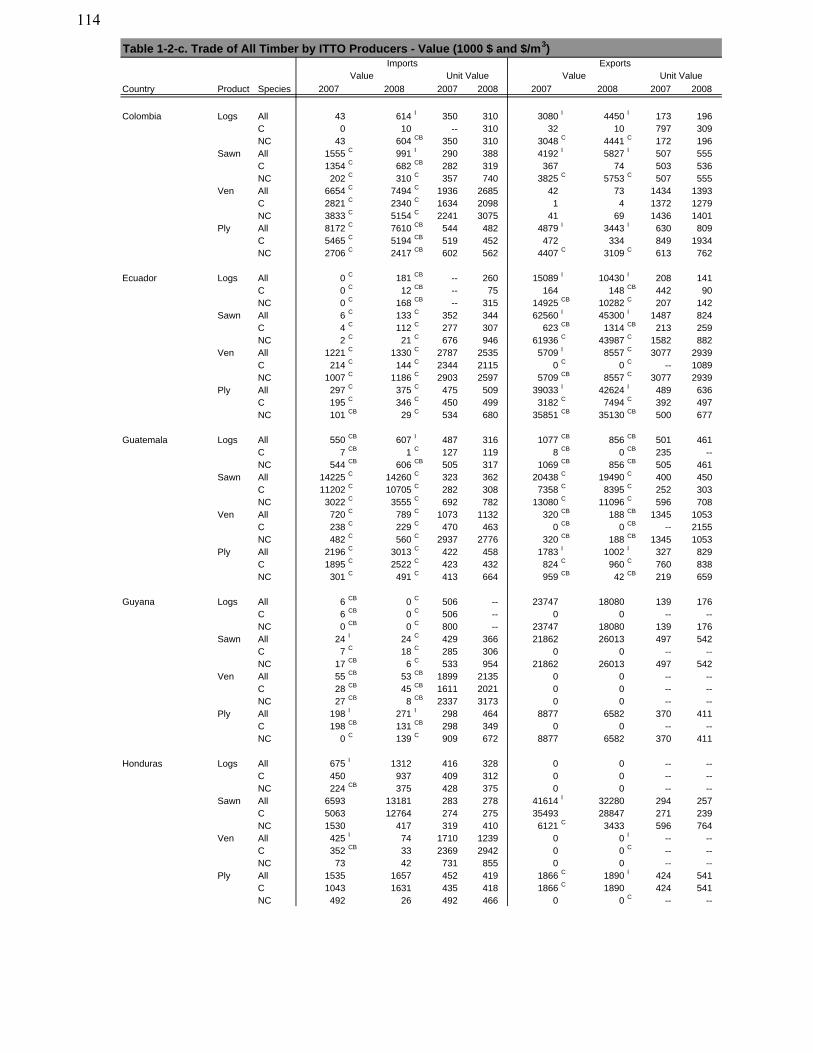
Country Product Species
Imports Exports
2008 2007 2008
Value Unit Value Value
20072008
Table 1-2-c. Trade of All Timber by ITTO Producers - Value (1000 $ and $/m3)
2008
Unit Value
20072007
Colombia Logs All 43 614 I 350 310 3080 I 4450 I 173 196C 0 10 -- 310 32 10 797 309NC 43 604 CB 350 310 3048 C 4441 C 172 196
Sawn All 1555 C 991 I 290 388 4192 I 5827 I 507 555C 1354 C 682 CB 282 319 367 74 503 536NC 202 C 310 C 357 740 3825 C 5753 C 507 555
Ven All 6654 C 7494 C 1936 2685 42 73 1434 1393C 2821 C 2340 C 1634 2098 1 4 1372 1279NC 3833 C 5154 C 2241 3075 41 69 1436 1401
Ply All 8172 C 7610 CB 544 482 4879 I 3443 I 630 809C 5465 C 5194 CB 519 452 472 334 849 1934NC 2706 C 2417 CB 602 562 4407 C 3109 C 613 762
Ecuador Logs All 0 C 181 CB -- 260 15089 I 10430 I 208 141C 0 C 12 CB -- 75 164 148 CB 442 90NC 0 C 168 CB -- 315 14925 CB 10282 C 207 142
Sawn All 6 C 133 C 352 344 62560 I 45300 I 1487 824C 4 C 112 C 277 307 623 CB 1314 CB 213 259NC 2 C 21 C 676 946 61936 C 43987 C 1582 882
Ven All 1221 C 1330 C 2787 2535 5709 I 8557 C 3077 2939C 214 C 144 C 2344 2115 0 C 0 C -- 1089NC 1007 C 1186 C 2903 2597 5709 CB 8557 C 3077 2939
Ply All 297 C 375 C 475 509 39033 I 42624 I 489 636C 195 C 346 C 450 499 3182 C 7494 C 392 497NC 101 CB 29 C 534 680 35851 CB 35130 CB 500 677
Guatemala Logs All 550 CB 607 I 487 316 1077 CB 856 CB 501 461C 7 CB 1 C 127 119 8 CB 0 CB 235 --NC 544 CB 606 CB 505 317 1069 CB 856 CB 505 461
Sawn All 14225 C 14260 C 323 362 20438 C 19490 C 400 450C 11202 C 10705 C 282 308 7358 C 8395 C 252 303NC 3022 C 3555 C 692 782 13080 C 11096 C 596 708
Ven All 720 C 789 C 1073 1132 320 CB 188 CB 1345 1053C 238 C 229 C 470 463 0 CB 0 CB -- 2155NC 482 C 560 C 2937 2776 320 CB 188 CB 1345 1053
Ply All 2196 C 3013 C 422 458 1783 I 1002 I 327 829C 1895 C 2522 C 423 432 824 C 960 C 760 838NC 301 C 491 C 413 664 959 CB 42 CB 219 659
Guyana Logs All 6 CB 0 C 506 -- 23747 18080 139 176C 6 CB 0 C 506 -- 0 0 -- --NC 0 CB 0 C 800 -- 23747 18080 139 176
Sawn All 24 I 24 C 429 366 21862 26013 497 542C 7 C 18 C 285 306 0 0 -- --NC 17 CB 6 C 533 954 21862 26013 497 542
Ven All 55 CB 53 CB 1899 2135 0 0 -- --C 28 CB 45 CB 1611 2021 0 0 -- --NC 27 CB 8 CB 2337 3173 0 0 -- --
Ply All 198 I 271 I 298 464 8877 6582 370 411C 198 CB 131 CB 298 349 0 0 -- --NC 0 C 139 C 909 672 8877 6582 370 411
Honduras Logs All 675 I 1312 416 328 0 0 -- --C 450 937 409 312 0 0 -- --NC 224 CB 375 428 375 0 0 -- --
Sawn All 6593 13181 283 278 41614 I 32280 294 257C 5063 12764 274 275 35493 28847 271 239NC 1530 417 319 410 6121 C 3433 596 764
Ven All 425 I 74 1710 1239 0 0 I -- --C 352 CB 33 2369 2942 0 0 C -- --NC 73 42 731 855 0 0 -- --
Ply All 1535 1657 452 419 1866 C 1890 I 424 541C 1043 1631 435 418 1866 C 1890 424 541NC 492 26 492 466 0 0 C -- --
114
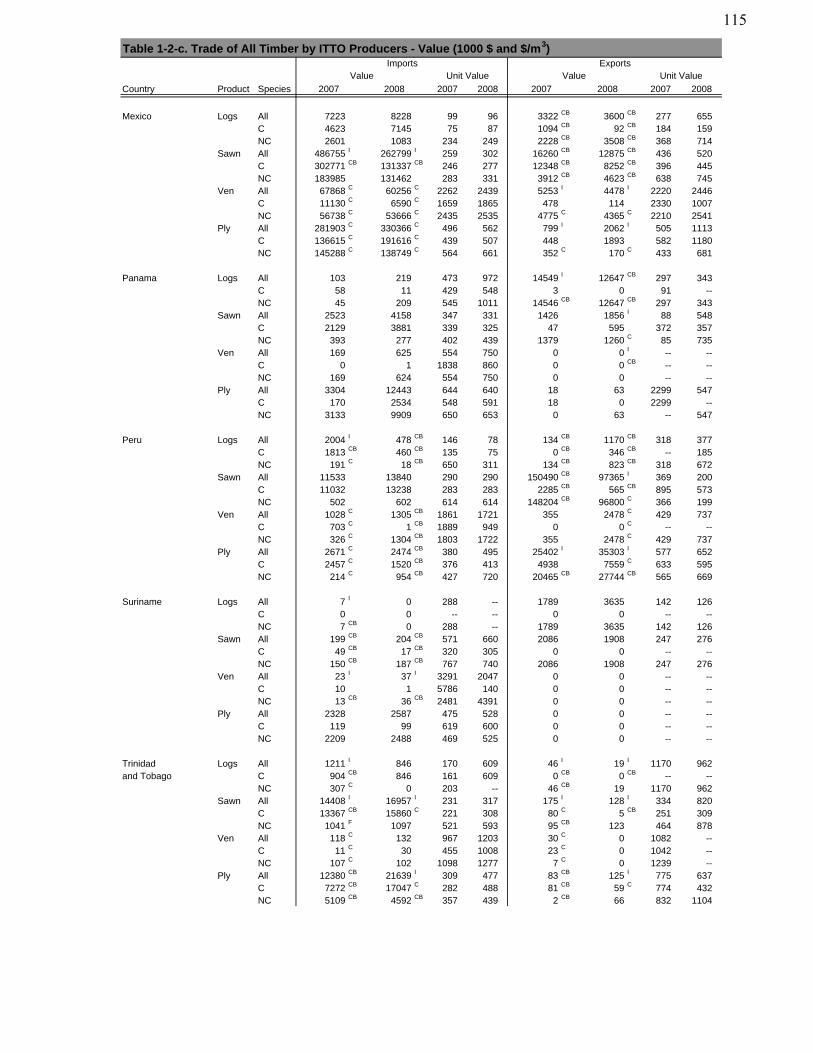
Country Product Species
Imports Exports
2008 2007 2008
Value Unit Value Value
20072008
Table 1-2-c. Trade of All Timber by ITTO Producers - Value (1000 $ and $/m3)
2008
Unit Value
20072007
Mexico Logs All 7223 8228 99 96 3322 CB 3600 CB 277 655C 4623 7145 75 87 1094 CB 92 CB 184 159NC 2601 1083 234 249 2228 CB 3508 CB 368 714
Sawn All 486755 I 262799 I 259 302 16260 CB 12875 CB 436 520C 302771 CB 131337 CB 246 277 12348 CB 8252 CB 396 445NC 183985 131462 283 331 3912 CB 4623 CB 638 745
Ven All 67868 C 60256 C 2262 2439 5253 I 4478 I 2220 2446C 11130 C 6590 C 1659 1865 478 114 2330 1007NC 56738 C 53666 C 2435 2535 4775 C 4365 C 2210 2541
Ply All 281903 C 330366 C 496 562 799 I 2062 I 505 1113C 136615 C 191616 C 439 507 448 1893 582 1180NC 145288 C 138749 C 564 661 352 C 170 C 433 681
Panama Logs All 103 219 473 972 14549 I 12647 CB 297 343C 58 11 429 548 3 0 91 --NC 45 209 545 1011 14546 CB 12647 CB 297 343
Sawn All 2523 4158 347 331 1426 1856 I 88 548C 2129 3881 339 325 47 595 372 357NC 393 277 402 439 1379 1260 C 85 735
Ven All 169 625 554 750 0 0 I -- --C 0 1 1838 860 0 0 CB -- --NC 169 624 554 750 0 0 -- --
Ply All 3304 12443 644 640 18 63 2299 547C 170 2534 548 591 18 0 2299 --NC 3133 9909 650 653 0 63 -- 547
Peru Logs All 2004 I 478 CB 146 78 134 CB 1170 CB 318 377C 1813 CB 460 CB 135 75 0 CB 346 CB -- 185NC 191 C 18 CB 650 311 134 CB 823 CB 318 672
Sawn All 11533 13840 290 290 150490 CB 97365 I 369 200C 11032 13238 283 283 2285 CB 565 CB 895 573NC 502 602 614 614 148204 CB 96800 C 366 199
Ven All 1028 C 1305 CB 1861 1721 355 2478 C 429 737C 703 C 1 CB 1889 949 0 0 C -- --NC 326 C 1304 CB 1803 1722 355 2478 C 429 737
Ply All 2671 C 2474 CB 380 495 25402 I 35303 I 577 652C 2457 C 1520 CB 376 413 4938 7559 C 633 595NC 214 C 954 CB 427 720 20465 CB 27744 CB 565 669
Suriname Logs All 7 I 0 288 -- 1789 3635 142 126C 0 0 -- -- 0 0 -- --NC 7 CB 0 288 -- 1789 3635 142 126
Sawn All 199 CB 204 CB 571 660 2086 1908 247 276C 49 CB 17 CB 320 305 0 0 -- --NC 150 CB 187 CB 767 740 2086 1908 247 276
Ven All 23 I 37 I 3291 2047 0 0 -- --C 10 1 5786 140 0 0 -- --NC 13 CB 36 CB 2481 4391 0 0 -- --
Ply All 2328 2587 475 528 0 0 -- --C 119 99 619 600 0 0 -- --NC 2209 2488 469 525 0 0 -- --
Trinidad Logs All 1211 I 846 170 609 46 I 19 I 1170 962and Tobago C 904 CB 846 161 609 0 CB 0 CB -- --
NC 307 C 0 203 -- 46 CB 19 1170 962Sawn All 14408 I 16957 I 231 317 175 I 128 I 334 820
C 13367 CB 15860 C 221 308 80 C 5 CB 251 309NC 1041 F 1097 521 593 95 CB 123 464 878
Ven All 118 C 132 967 1203 30 C 0 1082 --C 11 C 30 455 1008 23 C 0 1042 --NC 107 C 102 1098 1277 7 C 0 1239 --
Ply All 12380 CB 21639 I 309 477 83 CB 125 I 775 637C 7272 CB 17047 C 282 488 81 CB 59 C 774 432NC 5109 CB 4592 CB 357 439 2 CB 66 832 1104
115
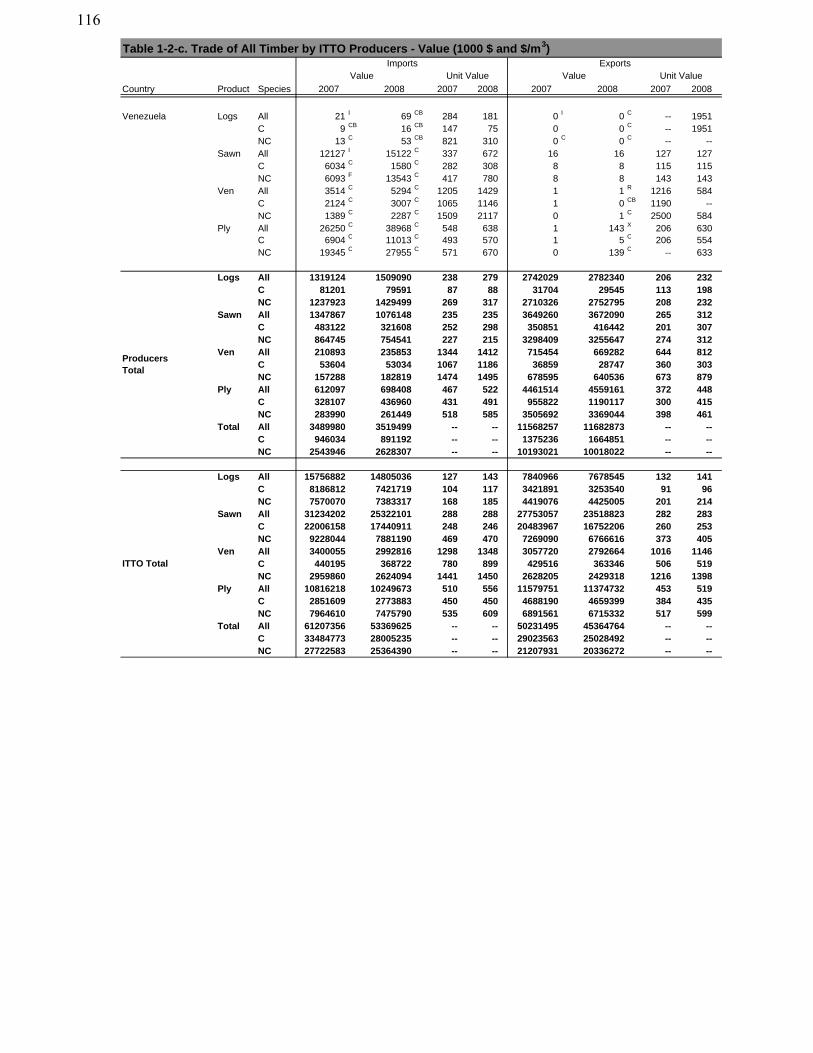
Country Product Species
Imports Exports
2008 2007 2008
Value Unit Value Value
20072008
Table 1-2-c. Trade of All Timber by ITTO Producers - Value (1000 $ and $/m3)
2008
Unit Value
20072007
Venezuela Logs All 21 I 69 CB 284 181 0 I 0 C -- 1951C 9 CB 16 CB 147 75 0 0 C -- 1951NC 13 C 53 CB 821 310 0 C 0 C -- --
Sawn All 12127 I 15122 C 337 672 16 16 127 127C 6034 C 1580 C 282 308 8 8 115 115NC 6093 F 13543 C 417 780 8 8 143 143
Ven All 3514 C 5294 C 1205 1429 1 1 R 1216 584C 2124 C 3007 C 1065 1146 1 0 CB 1190 --NC 1389 C 2287 C 1509 2117 0 1 C 2500 584
Ply All 26250 C 38968 C 548 638 1 143 X 206 630C 6904 C 11013 C 493 570 1 5 C 206 554NC 19345 C 27955 C 571 670 0 139 C -- 633
Logs All 1319124 1509090 238 279 2742029 2782340 206 232C 81201 79591 87 88 31704 29545 113 198NC 1237923 1429499 269 317 2710326 2752795 208 232
Sawn All 1347867 1076148 235 235 3649260 3672090 265 312C 483122 321608 252 298 350851 416442 201 307NC 864745 754541 227 215 3298409 3255647 274 312
Ven All 210893 235853 1344 1412 715454 669282 644 812C 53604 53034 1067 1186 36859 28747 360 303NC 157288 182819 1474 1495 678595 640536 673 879
Ply All 612097 698408 467 522 4461514 4559161 372 448C 328107 436960 431 491 955822 1190117 300 415NC 283990 261449 518 585 3505692 3369044 398 461
Total All 3489980 3519499 -- -- 11568257 11682873 -- --C 946034 891192 -- -- 1375236 1664851 -- --NC 2543946 2628307 -- -- 10193021 10018022 -- --
Logs All 15756882 14805036 127 143 7840966 7678545 132 141C 8186812 7421719 104 117 3421891 3253540 91 96NC 7570070 7383317 168 185 4419076 4425005 201 214
Sawn All 31234202 25322101 288 288 27753057 23518823 282 283C 22006158 17440911 248 246 20483967 16752206 260 253NC 9228044 7881190 469 470 7269090 6766616 373 405
Ven All 3400055 2992816 1298 1348 3057720 2792664 1016 1146C 440195 368722 780 899 429516 363346 506 519NC 2959860 2624094 1441 1450 2628205 2429318 1216 1398
Ply All 10816218 10249673 510 556 11579751 11374732 453 519C 2851609 2773883 450 450 4688190 4659399 384 435NC 7964610 7475790 535 609 6891561 6715332 517 599
Total All 61207356 53369625 -- -- 50231495 45364764 -- --C 33484773 28005235 -- -- 29023563 25028492 -- --NC 27722583 25364390 -- -- 21207931 20336272 -- --
ITTO Total
ProducersTotal
116
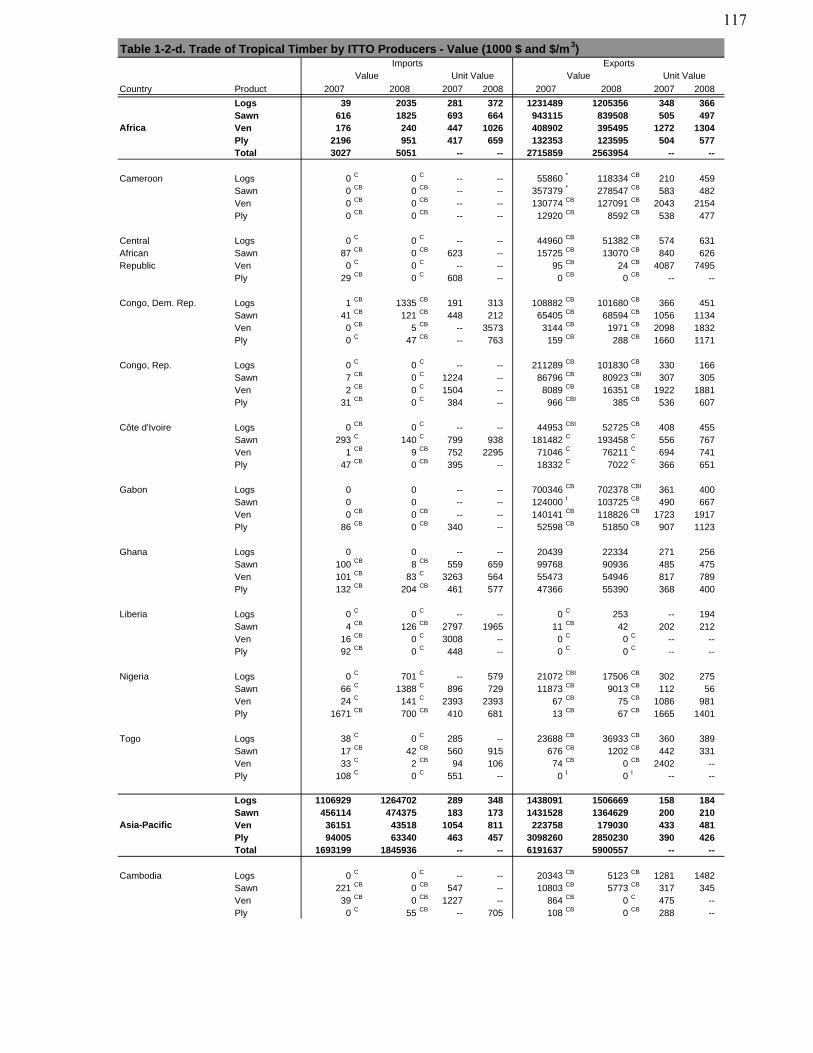
Table 1-2-d. Trade of Tropical Timber by ITTO Producers - Value (1000 $ and $/m3)
Country Product
Logs 39 2035 281 372 1231489 1205356 348 366Sawn 616 1825 693 664 943115 839508 505 497Ven 176 240 447 1026 408902 395495 1272 1304Ply 2196 951 417 659 132353 123595 504 577Total 3027 5051 -- -- 2715859 2563954 -- --
Cameroon Logs 0 C 0 C -- -- 55860 * 118334 CB 210 459Sawn 0 CB 0 CB -- -- 357379 * 278547 CB 583 482Ven 0 CB 0 CB -- -- 130774 CB 127091 CB 2043 2154Ply 0 CB 0 CB -- -- 12920 CB 8592 CB 538 477
Central Logs 0 C 0 C -- -- 44960 CB 51382 CB 574 631African Sawn 87 CB 0 CB 623 -- 15725 CB 13070 CB 840 626Republic Ven 0 C 0 C -- -- 95 CB 24 CB 4087 7495
Ply 29 CB 0 C 608 -- 0 CB 0 CB -- --
Congo, Dem. Rep. Logs 1 CB 1335 CB 191 313 108882 CB 101680 CB 366 451Sawn 41 CB 121 CB 448 212 65405 CB 68594 CB 1056 1134Ven 0 CB 5 CB -- 3573 3144 CB 1971 CB 2098 1832Ply 0 C 47 CB -- 763 159 CB 288 CB 1660 1171
Congo, Rep. Logs 0 C 0 C -- -- 211289 CB 101830 CB 330 166Sawn 7 CB 0 C 1224 -- 86796 CB 80923 CBI 307 305Ven 2 CB 0 C 1504 -- 8089 CB 16351 CB 1922 1881Ply 31 CB 0 C 384 -- 966 CBI 385 CB 536 607
Côte d'Ivoire Logs 0 CB 0 C -- -- 44953 CBI 52725 CB 408 455Sawn 293 C 140 C 799 938 181482 C 193458 C 556 767Ven 1 CB 9 CB 752 2295 71046 C 76211 C 694 741Ply 47 CB 0 CB 395 -- 18332 C 7022 C 366 651
Gabon Logs 0 0 -- -- 700346 CB 702378 CBI 361 400Sawn 0 0 -- -- 124000 I 103725 CB 490 667Ven 0 CB 0 CB -- -- 140141 CB 118826 CB 1723 1917Ply 86 CB 0 CB 340 -- 52598 CB 51850 CB 907 1123
Ghana Logs 0 0 -- -- 20439 22334 271 256Sawn 100 CB 8 CB 559 659 99768 90936 485 475Ven 101 CB 83 C 3263 564 55473 54946 817 789Ply 132 CB 204 CB 461 577 47366 55390 368 400
Liberia Logs 0 C 0 C -- -- 0 C 253 -- 194Sawn 4 CB 126 CB 2797 1965 11 CB 42 202 212Ven 16 CB 0 C 3008 -- 0 C 0 C -- --Ply 92 CB 0 C 448 -- 0 C 0 C -- --
Nigeria Logs 0 C 701 C -- 579 21072 CBI 17506 CB 302 275Sawn 66 C 1388 C 896 729 11873 CB 9013 CB 112 56Ven 24 C 141 C 2393 2393 67 CB 75 CB 1086 981Ply 1671 CB 700 CB 410 681 13 CB 67 CB 1665 1401
Togo Logs 38 C 0 C 285 -- 23688 CB 36933 CB 360 389Sawn 17 CB 42 CB 560 915 676 CB 1202 CB 442 331Ven 33 C 2 CB 94 106 74 CB 0 CB 2402 --Ply 108 C 0 C 551 -- 0 I 0 I -- --
Logs 1106929 1264702 289 348 1438091 1506669 158 184Sawn 456114 474375 183 173 1431528 1364629 200 210Ven 36151 43518 1054 811 223758 179030 433 481Ply 94005 63340 463 457 3098260 2850230 390 426Total 1693199 1845936 -- -- 6191637 5900557 -- --
Cambodia Logs 0 C 0 C -- -- 20343 CB 5123 CB 1281 1482Sawn 221 CB 0 CB 547 -- 10803 CB 5773 CB 317 345Ven 39 CB 0 CB 1227 -- 864 CB 0 C 475 --Ply 0 C 55 CB -- 705 108 CB 0 CB 288 --
20082007 2008 2007
Value Unit ValueExportsImports
Value
2008
Unit Value
2008 20072007
Africa
Asia-Pacific
117
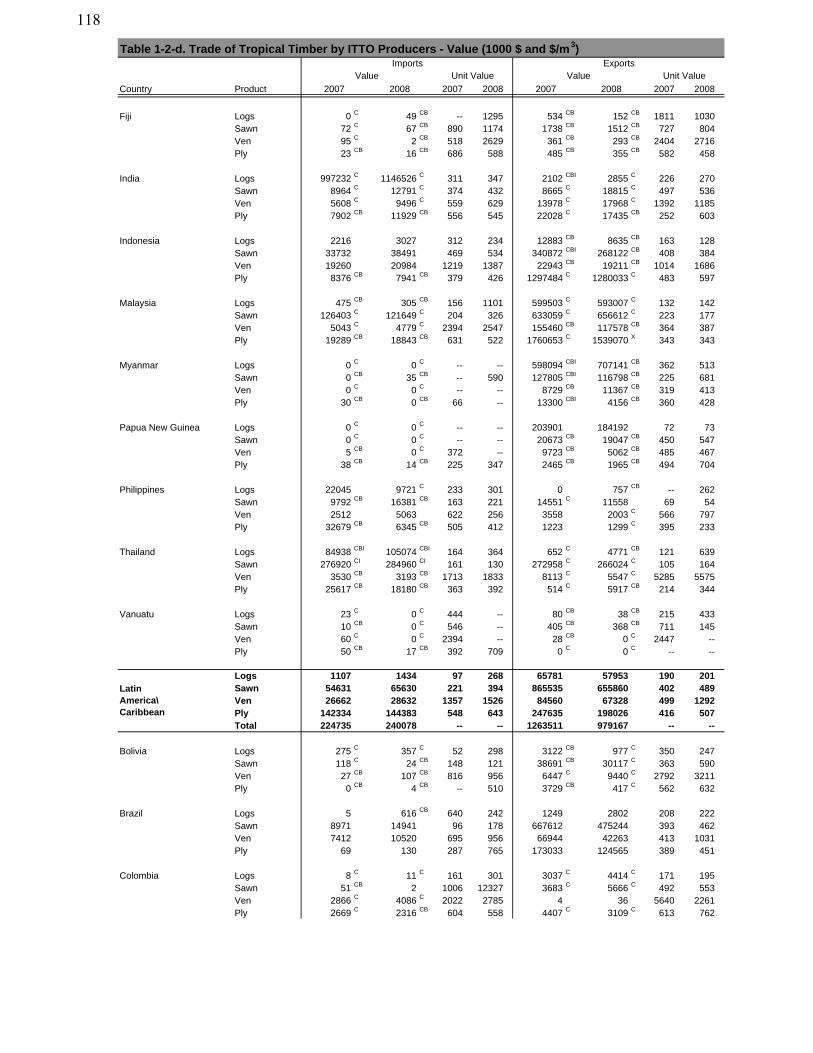
Table 1-2-d. Trade of Tropical Timber by ITTO Producers - Value (1000 $ and $/m3)
Country Product 20082007 2008 2007
Value Unit ValueExportsImports
Value
2008
Unit Value
2008 20072007
Fiji Logs 0 C 49 CB -- 1295 534 CB 152 CB 1811 1030Sawn 72 C 67 CB 890 1174 1738 CB 1512 CB 727 804Ven 95 C 2 CB 518 2629 361 CB 293 CB 2404 2716Ply 23 CB 16 CB 686 588 485 CB 355 CB 582 458
India Logs 997232 C 1146526 C 311 347 2102 CBI 2855 C 226 270Sawn 8964 C 12791 C 374 432 8665 C 18815 C 497 536Ven 5608 C 9496 C 559 629 13978 C 17968 C 1392 1185Ply 7902 CB 11929 CB 556 545 22028 C 17435 CB 252 603
Indonesia Logs 2216 3027 312 234 12883 CB 8635 CB 163 128Sawn 33732 38491 469 534 340872 CBI 268122 CB 408 384Ven 19260 20984 1219 1387 22943 CB 19211 CB 1014 1686Ply 8376 CB 7941 CB 379 426 1297484 C 1280033 C 483 597
Malaysia Logs 475 CB 305 CB 156 1101 599503 C 593007 C 132 142Sawn 126403 C 121649 C 204 326 633059 C 656612 C 223 177Ven 5043 C 4779 C 2394 2547 155460 CB 117578 CB 364 387Ply 19289 CB 18843 CB 631 522 1760653 C 1539070 X 343 343
Myanmar Logs 0 C 0 C -- -- 598094 CBI 707141 CB 362 513Sawn 0 CB 35 CB -- 590 127805 CBI 116798 CB 225 681Ven 0 C 0 C -- -- 8729 CB 11367 CB 319 413Ply 30 CB 0 CB 66 -- 13300 CBI 4156 CB 360 428
Papua New Guinea Logs 0 C 0 C -- -- 203901 184192 72 73Sawn 0 C 0 C -- -- 20673 CB 19047 CB 450 547Ven 5 CB 0 C 372 -- 9723 CB 5062 CB 485 467Ply 38 CB 14 CB 225 347 2465 CB 1965 CB 494 704
Philippines Logs 22045 9721 C 233 301 0 757 CB -- 262Sawn 9792 CB 16381 CB 163 221 14551 C 11558 69 54Ven 2512 5063 622 256 3558 2003 C 566 797Ply 32679 CB 6345 CB 505 412 1223 1299 C 395 233
Thailand Logs 84938 CBI 105074 CBI 164 364 652 C 4771 CB 121 639Sawn 276920 CI 284960 CI 161 130 272958 C 266024 C 105 164Ven 3530 CB 3193 CB 1713 1833 8113 C 5547 C 5285 5575Ply 25617 CB 18180 CB 363 392 514 C 5917 CB 214 344
Vanuatu Logs 23 C 0 C 444 -- 80 CB 38 CB 215 433Sawn 10 CB 0 C 546 -- 405 CB 368 CB 711 145Ven 60 C 0 C 2394 -- 28 CB 0 C 2447 --Ply 50 CB 17 CB 392 709 0 C 0 C -- --
Logs 1107 1434 97 268 65781 57953 190 201Sawn 54631 65630 221 394 865535 655860 402 489Ven 26662 28632 1357 1526 84560 67328 499 1292Ply 142334 144383 548 643 247635 198026 416 507Total 224735 240078 -- -- 1263511 979167 -- --
Bolivia Logs 275 C 357 C 52 298 3122 CB 977 C 350 247Sawn 118 C 24 CB 148 121 38691 CB 30117 C 363 590Ven 27 CB 107 CB 816 956 6447 C 9440 C 2792 3211Ply 0 CB 4 CB -- 510 3729 CB 417 C 562 632
Brazil Logs 5 616 CB 640 242 1249 2802 208 222Sawn 8971 14941 96 178 667612 475244 393 462Ven 7412 10520 695 956 66944 42263 413 1031Ply 69 130 287 765 173033 124565 389 451
Colombia Logs 8 C 11 C 161 301 3037 C 4414 C 171 195Sawn 51 CB 2 1006 12327 3683 C 5666 C 492 553Ven 2866 C 4086 C 2022 2785 4 36 5640 2261Ply 2669 C 2316 CB 604 558 4407 C 3109 C 613 762
LatinAmerica\Caribbean
118
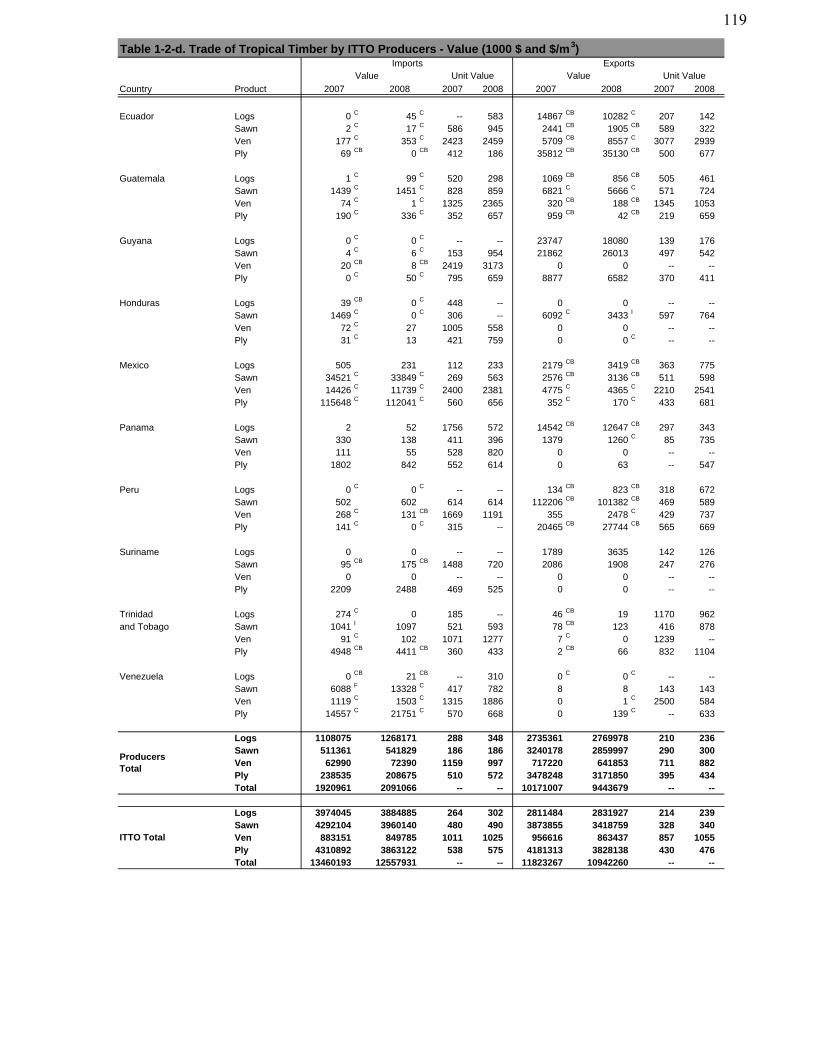
Table 1-2-d. Trade of Tropical Timber by ITTO Producers - Value (1000 $ and $/m3)
Country Product 20082007 2008 2007
Value Unit ValueExportsImports
Value
2008
Unit Value
2008 20072007
Ecuador Logs 0 C 45 C -- 583 14867 CB 10282 C 207 142Sawn 2 C 17 C 586 945 2441 CB 1905 CB 589 322Ven 177 C 353 C 2423 2459 5709 CB 8557 C 3077 2939Ply 69 CB 0 CB 412 186 35812 CB 35130 CB 500 677
Guatemala Logs 1 C 99 C 520 298 1069 CB 856 CB 505 461Sawn 1439 C 1451 C 828 859 6821 C 5666 C 571 724Ven 74 C 1 C 1325 2365 320 CB 188 CB 1345 1053Ply 190 C 336 C 352 657 959 CB 42 CB 219 659
Guyana Logs 0 C 0 C -- -- 23747 18080 139 176Sawn 4 C 6 C 153 954 21862 26013 497 542Ven 20 CB 8 CB 2419 3173 0 0 -- --Ply 0 C 50 C 795 659 8877 6582 370 411
Honduras Logs 39 CB 0 C 448 -- 0 0 -- --Sawn 1469 C 0 C 306 -- 6092 C 3433 I 597 764Ven 72 C 27 1005 558 0 0 -- --Ply 31 C 13 421 759 0 0 C -- --
Mexico Logs 505 231 112 233 2179 CB 3419 CB 363 775Sawn 34521 C 33849 C 269 563 2576 CB 3136 CB 511 598Ven 14426 C 11739 C 2400 2381 4775 C 4365 C 2210 2541Ply 115648 C 112041 C 560 656 352 C 170 C 433 681
Panama Logs 2 52 1756 572 14542 CB 12647 CB 297 343Sawn 330 138 411 396 1379 1260 C 85 735Ven 111 55 528 820 0 0 -- --Ply 1802 842 552 614 0 63 -- 547
Peru Logs 0 C 0 C -- -- 134 CB 823 CB 318 672Sawn 502 602 614 614 112206 CB 101382 CB 469 589Ven 268 C 131 CB 1669 1191 355 2478 C 429 737Ply 141 C 0 C 315 -- 20465 CB 27744 CB 565 669
Suriname Logs 0 0 -- -- 1789 3635 142 126Sawn 95 CB 175 CB 1488 720 2086 1908 247 276Ven 0 0 -- -- 0 0 -- --Ply 2209 2488 469 525 0 0 -- --
Trinidad Logs 274 C 0 185 -- 46 CB 19 1170 962and Tobago Sawn 1041 I 1097 521 593 78 CB 123 416 878
Ven 91 C 102 1071 1277 7 C 0 1239 --Ply 4948 CB 4411 CB 360 433 2 CB 66 832 1104
Venezuela Logs 0 CB 21 CB -- 310 0 C 0 C -- --Sawn 6088 F 13328 C 417 782 8 8 143 143Ven 1119 C 1503 C 1315 1886 0 1 C 2500 584Ply 14557 C 21751 C 570 668 0 139 C -- 633
Logs 1108075 1268171 288 348 2735361 2769978 210 236Sawn 511361 541829 186 186 3240178 2859997 290 300Ven 62990 72390 1159 997 717220 641853 711 882Ply 238535 208675 510 572 3478248 3171850 395 434Total 1920961 2091066 -- -- 10171007 9443679 -- --
Logs 3974045 3884885 264 302 2811484 2831927 214 239Sawn 4292104 3960140 480 490 3873855 3418759 328 340Ven 883151 849785 1011 1025 956616 863437 857 1055Ply 4310892 3863122 538 575 4181313 3828138 430 476Total 13460193 12557931 -- -- 11823267 10942260 -- --
ITTO Total
ProducersTotal
119

120
APPENDIX 2
Direction of Tradein Volume of Primary Tropical Timber Products
between Major ITTO Producers and Consumers in 2008
Table 2-1. Logs ......................................................................................................................... 123
Table 2-2. Sawnwood ................................................................................................................ 124
Table 2-3. Veneer ..................................................................................................................... 125
Table 2-4. Plywood ................................................................................................................... 126
N.B. Figures reported by importers are shown in bold typeface while those corresponding to export reports are in italics. Only major trading relationships (the top twelve importers and exporters for each category) are presented.
121

122
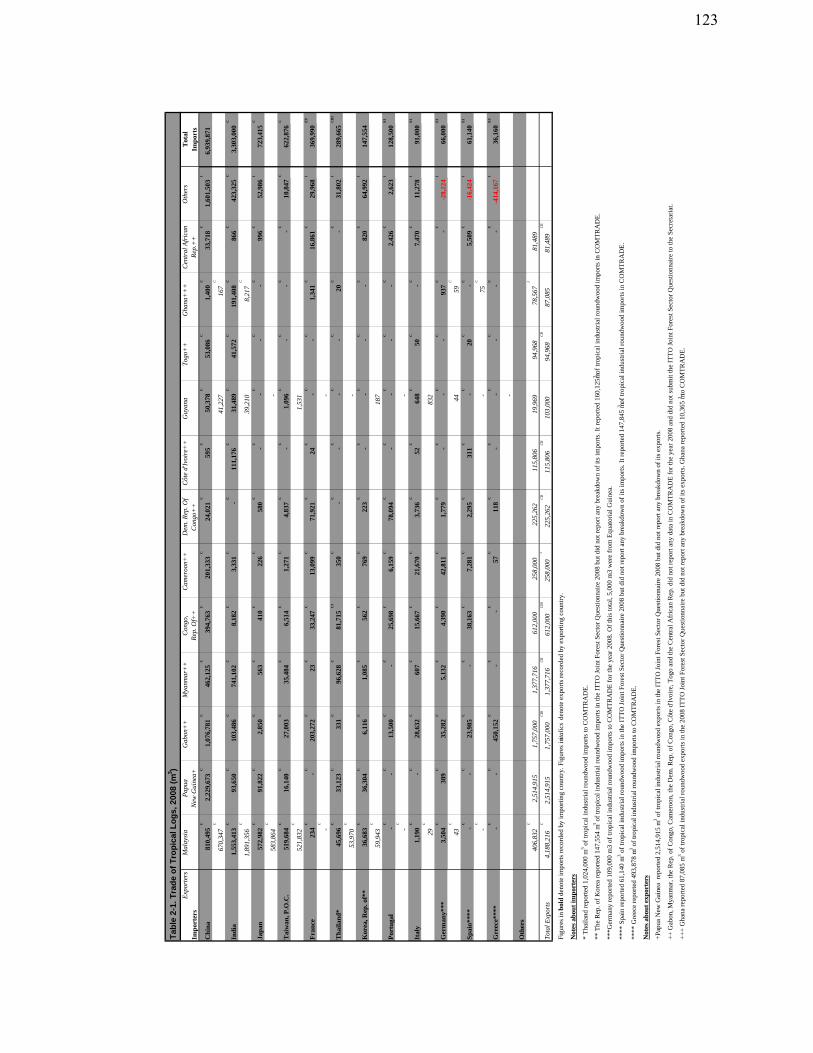
Expo
rter
sIm
por
ters
Ch
ina
810,
495
C
2,22
9,67
3C
1,07
6,78
1C
462,
125
C
394,
763
C
201,
333
C
24,0
21C
595
C
50,3
78C
53,0
86C
1,40
0C
33,7
18C
1,60
1,50
3I
6,93
9,87
1
670,
347
C
41,2
2716
7C
Ind
ia1,
553,
413
C
93,6
50C
103,
486
C
741,
102
C
8,18
2C
3,33
1C
-C
111,
176
C
31,4
89C
41,5
72C
191,
408
C
866
C
423,
325
C
3,30
3,00
0C
1,89
1,35
6C
39,2
108,
217
C
Jap
an57
2,98
2C
91,8
22C
2,85
0C
563
C
410
C
226
C
580
C
-C
-C
-C
-C
996
C
52,9
86I
723,
415
C
583,
864
C
-
Tai
wan
, P.O
.C.
519,
684
C
16,1
40C
27,0
03C
35,4
84C
6,51
4C
1,27
1C
4,83
7C
-C
1,09
6C
-C
-C
-C
10,8
47C
622,
876
C
521,
832
C
1,53
1
Fra
nce
234
C
-C
203,
272
C
23C
33,2
47C
13,0
99C
71,9
21C
24C
-C
-C
1,34
1C
16,8
61C
29,9
68I
369,
990
E9
-C
-
Th
aila
nd
*45
,696
C
33,1
23C
331
C
96,6
28C
81,7
15C
I
350
C
-C
-C
-C
-C
20C
-C
31,8
02I
289,
665
CB
I
53,9
70C
-
Kor
ea, R
ep. o
f**
36,6
83C
36,3
04C
6,11
6C
1,08
5C
562
C
769
C
223
C
-C
-C
-C
-C
820
C
64,9
92I
147,
554
59,9
43C
187
Por
tuga
l-
C
-C
13,5
00C
-C
25,6
98C
6,15
9C
78,0
94C
-C
-C
-C
-C
2,42
6C
2,62
3I
128,
500
E1
-C
-
Ital
y1,
190
C
-C
28,6
32C
607
C
15,6
67C
21,6
70C
3,73
6C
52C
648
C
50C
-C
7,47
0C
11,2
78I
91,0
00E
1
29C
832
Ger
man
y***
3,50
4C
389
C
35,2
82C
5,13
2C
4,39
0C
42,8
11C
1,77
9C
-C
-C
-C
937
C
-C
-28,
224
I
66,0
00E
1
43C
4459
C
Sp
ain
****
-C
-C
23,9
85C
-C
38,1
63C
7,28
1C
2,29
5C
311
C
-C
20C
-C
5,50
9C
-16,
424
I
61,1
40E
1
-C
-75
C
Gre
ece*
***
-C
-C
450,
152
C
-C
-C
57C
118
C
-C
-C
-C
-C
-C
-414
,167
I
36,1
60E
5
-
Oth
ers
406,
832
C
2,51
4,91
51,
757,
000
1,37
7,71
661
2,00
025
8,00
022
5,26
211
5,80
619
,969
94,9
6878
,567
I
81,4
89
Tota
l Exp
orts
4,18
8,21
6C
2,51
4,91
51,
757,
000
CBI
1,37
7,71
6C
B
612,
000
CBI
258,
000
*
225,
262
CB
115,
806
CB
103,
000
94,9
68C
B
87,0
8581
,489
CB
Fig
ures
in b
old
deno
te im
port
s re
cord
ed b
y im
port
ing
coun
try.
Fig
ures
in ita
lics
deno
te e
xpor
ts r
ecor
ded
by e
xpor
ting
cou
ntry
.
Not
es a
bou
t im
por
ters
** T
he R
ep. o
f K
orea
rep
orte
d 14
7,55
4 m
3 of
trop
ical
indu
stri
al r
ound
woo
d im
port
s in
the
ITT
O J
oint
For
est S
ecto
r Q
uest
ionn
aire
200
8 bu
t did
not
rep
ort a
ny b
reak
dow
n of
its
impo
rts.
It r
epor
ted
160,
125m
3 of
trop
ical
indu
stri
al r
ound
woo
d im
port
s in
CO
MT
RA
DE
.
***G
erm
any
repo
rted
109
,000
m3
of tr
opic
al in
dust
rial
rou
ndw
ood
impo
rts
to C
OM
TR
AD
E f
or th
e ye
ar 2
008.
Of
this
tota
l, 5,
000
m3
wer
e fr
om E
quat
oria
l Gui
nea.
Not
es a
bou
t ex
por
ters
+P
apua
New
Gui
nea
rep
orte
d 2,
514,
915
m3 o
f tr
opic
al in
dust
rial
rou
ndw
ood
expo
rts
in th
e IT
TO
Joi
nt F
ores
t Sec
tor
Que
stio
nnai
re 2
008
but d
id n
ot r
epor
t any
bre
akdo
wn
of it
s ex
port
s.
++
Gab
on, M
yanm
ar, t
he R
ep. o
f C
ongo
, Cam
eroo
n, th
e D
em. R
ep. o
f C
ongo
, Côt
e d'
Ivoi
re, T
ogo
and
the
Cen
tral
Afr
ican
Rep
. did
not
rep
ort a
ny d
ata
in C
OM
TR
AD
E f
or th
e ye
ar 2
008
and
did
not s
ubm
it th
e IT
TO
Joi
nt F
ores
t Sec
tor
Que
stio
nnai
re to
the
Sec
reta
riat
.
++
+ G
hana
rep
orte
d 87
,085
m3 o
f tr
opic
al in
dust
rial
rou
ndw
ood
expo
rts
in th
e 20
08 I
TT
O J
oint
For
est S
ecto
r Q
uest
ionn
aire
but
did
not
rep
ort a
ny b
reak
dow
n of
its
expo
rts.
Gha
na r
epor
ted
10,3
65 m3 to
CO
MT
RA
DE
.
Côt
e d'
Ivoi
re+
+D
em. R
ep. O
f C
ongo
++
Mya
nmar
++
****
Spa
in r
epor
ted
61,1
40 m
3 of
trop
ical
indu
stri
al r
ound
woo
d im
port
s in
the
ITT
O J
oint
For
est S
ecto
r Q
uest
ionn
aire
200
8 bu
t did
not
rep
ort a
ny b
reak
dow
n of
its
impo
rts.
It r
epor
ted
147,
845
m3 of
trop
ical
indu
stri
al r
ound
woo
d im
port
s in
CO
MT
RA
DE
.
* T
hail
and
repo
rted
1,0
24,0
00 m
3 of
trop
ical
indu
stri
al r
ound
woo
d im
port
s to
CO
MT
RA
DE
.
****
Gre
ece
repo
rted
493
,878
m3 o
f tr
opic
al in
dust
rial
rou
ndw
ood
impo
rts
to C
OM
TR
AD
E.
Togo
++
Imp
orts
Gha
na+
++
Tab
le 2
-1. T
rad
e o
f T
rop
ical
Lo
gs,
200
8 (m
3 )T
otal
Gab
on+
+M
alay
sia
Oth
ers
Cen
tral
Afr
ican
Re
p.+
+G
uyan
aPa
pua
New
Gui
nea+
Con
go,
Rep.
Of+
+C
amer
oon+
+
123
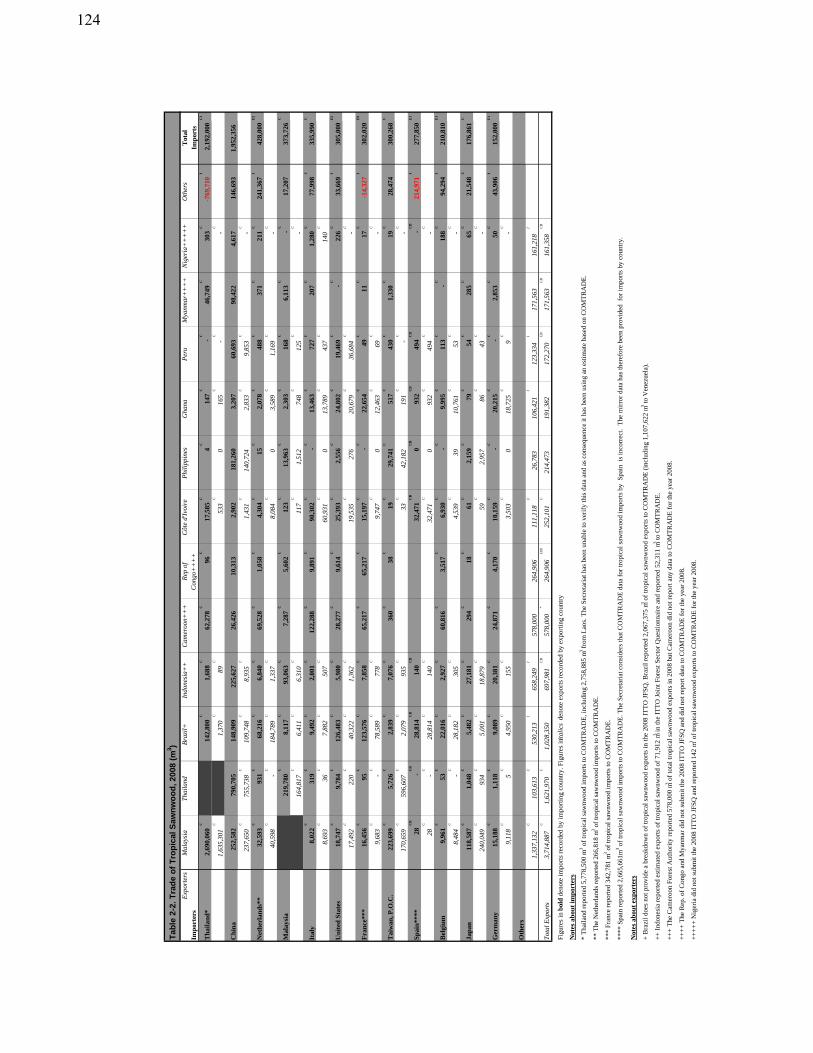
Expo
rter
sIm
por
ters
Th
aila
nd
*2,
690,
060
C
142,
800
C
1,68
8C
62,2
78C
96C
17,5
85C
4C
147
C
-C
46,7
49C
303
C
-769
,710
I
2,19
2,00
0C
I
1,63
5,30
1C
1,37
0C
89C
533
C
016
5C
-C
-C
Ch
ina
252,
582
790,
705
148,
909
225,
627
26,4
2610
,313
2,90
218
1,26
03,
207
60,6
9398
,422
4,61
714
6,69
31,
952,
356
237,
650
C
755,
738
C
109,
748
C
8,93
5C
1,43
1C
140,
724
2,83
3C
9,85
3C
-C
Net
her
lan
ds*
*32
,593
C
931
C
68,2
16C
6,84
0C
69,5
28C
1,05
8C
4,30
4C
15C
2,07
8C
488
C
371
C
211
C
241,
367
I
428,
000
E2
40,5
98C
-C
184,
789
C
1,33
7C
8,08
4C
03,
589
C
1,16
9C
-C
Mal
aysi
a21
9,78
0C
8,11
7C
93,0
63C
7,28
7C
5,60
2C
123
C
13,9
63C
2,30
3C
168
C
6,11
3C
-C
17,2
0737
3,72
6C
164,
817
C
6,41
1C
6,31
0C
117
C
1,51
274
8C
125
C
-C
Ital
y8,
022
C
319
C
9,49
2C
2,00
1C
122,
288
C
9,89
1C
90,3
02C
-C
13,4
63C
727
C
207
C
1,28
0C
77,9
98C
335,
990
C
8,69
3C
36C
7,88
2C
507
C
60,9
31C
013
,789
C
437
C
140
C
Un
ited
Sta
tes
18,7
47C
9,78
4C
126,
483
C
5,98
0C
28,2
77C
9,61
4C
25,3
93C
2,55
6C
24,8
02C
19,4
69C
-C
226
C
33,6
69I
305,
000
E2
17,4
92C
220
C
40,3
22C
1,36
2C
19,5
35C
276
20,6
79C
36,6
84C
-C
Fra
nce
***
16,4
56C
95C
123,
576
C
7,85
8C
65,2
17C
65,2
17C
15,1
97C
-C
22,6
54C
49C
11C
17C
-14,
327
I
302,
020
E9
9,68
3C
-C
78,5
89C
778
C
9,74
7C
012
,463
C
69C
-C
Tai
wan
, P.O
.C.
223,
699
C
5,72
6C
2,83
9C
7,07
6C
360
C
38C
19C
29,7
41C
517
C
430
C
1,33
0C
19C
28,4
7430
0,26
8C
170,
659
C
596,
607
C
2,07
9C
935
C
33C
42,1
8219
1C
-C
-C
Sp
ain
****
28C
B
-C
B
28,8
14C
B
140
CB
32,4
71C
B
0C
B
932
CB
494
CB
-C
B
214,
971
I
277,
850
E1
28C
-C
28,8
14C
140
C
32,4
71C
093
2C
494
C
-C
Bel
giu
m9,
961
C
53C
22,0
16C
2,92
7C
60,8
16C
3,51
7C
6,93
0C
-C
9,99
5C
113
C
-C
188
C
94,2
94I
210,
810
E1
8,48
4C
-C
28,1
82C
305
C
4,53
9C
3910
,761
C
53C
-C
Jap
an11
8,58
7C
1,04
8C
5,48
2C
27,1
81C
294
C
18C
61C
2,15
9C
79C
54C
285
C
65C
21,5
48C
176,
861
C
240,
049
C
934
C
5,00
1C
18,8
79C
59C
2,95
786
C
43C
-C
Ger
man
y15
,188
C
1,11
8C
9,08
9C
20,3
81C
24,8
71C
4,17
0C
10,1
59C
-C
20,2
15C
-C
2,85
3C
50C
43,9
06I
152,
000
E1
9,11
8C
5C
4,95
0C
155
C
3,50
3C
018
,725
C
9C
-C
Oth
ers
1,33
7,13
2C
103,
613
C
530,
213
I
658,
249
I
578,
000
264,
906
111,
118
C
26,7
8310
6,42
1I
123,
334
I
171,
563
161,
218
I
Tota
l Exp
orts
3,71
4,88
7C
1,62
1,97
0C
1,02
8,35
069
7,98
1C
B
578,
000
*
264,
906
CBI
252,
101
C
214,
473
191,
382
172,
270
CB
171,
563
CB
161,
358
CB
Fig
ures
in b
old
deno
te im
port
s re
cord
ed b
y im
port
ing
coun
try.
Fig
ures
in ita
lics
deno
te e
xpor
ts r
ecor
ded
by e
xpor
ting
cou
ntry
Not
es a
bou
t im
por
ters
* T
hail
and
repo
rted
5,7
78,5
00 m
3 of
trop
ical
saw
nwoo
d im
port
s to
CO
MT
RA
DE
, inc
ludi
ng 2
,758
,885
m3 f
rom
Lao
s. T
he S
ecre
tari
at h
as b
een
unab
le to
ver
ify
this
dat
a an
d as
con
sequ
ence
it h
as b
een
usin
g an
est
imat
e ba
sed
on C
OM
TR
AD
E.
** T
he N
ethe
rlan
ds r
epor
ted
266,
818
m3 o
f tr
opic
al s
awnw
ood
impo
rts
to C
OM
TR
AD
E.
***
Fra
nce
repo
rted
342
,781
m3 o
f tr
opic
al s
awnw
ood
impo
rts
to C
OM
TR
AD
E.
****
Spa
in r
epor
ted
2,66
5,66
1m3 o
f tr
opic
al s
awnw
ood
impo
rts
to C
OM
TR
AD
E. T
he S
ecre
tari
at c
onsi
ders
that
CO
MT
RA
DE
dat
a fo
r tr
opic
al s
awnw
ood
impo
rts
by S
pain
is
inco
rrec
t. T
he m
irro
r da
ta h
as th
eref
ore
been
pro
vide
d f
or im
port
s by
cou
ntry
.
Not
es a
bou
t ex
por
ters
+ B
razi
l doe
s no
t pro
vide
a b
reak
dow
n of
trop
ical
saw
nwoo
d ex
port
s in
the
2008
IT
TO
JF
SQ
. Bra
zil r
epor
ted
2,06
7,37
5 m3 o
f tr
opic
al s
awnw
ood
expo
rts
to C
OM
TR
AD
E (
incl
udin
g 1,
107,
622
m3 to
Ven
ezue
la).
++
Ind
ones
ia r
epor
ted
esti
mat
ed e
xpor
ts o
f tr
opic
al s
awnw
ood
of 7
1,91
2 m3 in
the
ITT
O J
oint
For
est S
ecto
r Q
uest
ionn
aire
and
rep
orte
d 52
,311
m3 to
CO
MT
RA
DE
.
++
+ T
he C
amer
oon
For
est A
utho
rity
rep
orte
d 57
8,00
0 m3 o
f to
tal t
ropi
cal s
awnw
ood
expo
rts
in 2
008
but C
amer
oon
did
not r
epor
t any
dat
a to
CO
MT
RA
DE
for
the
year
200
8.
++
++
The
Rep
. of
Con
go a
nd M
yanm
ar d
id n
ot s
ubm
it th
e 20
08 I
TT
O J
FS
Q a
nd d
id n
ot r
epor
t dat
a to
CO
MT
RA
DE
for
the
year
200
8.
++
++
+ N
iger
ia d
id n
ot s
ubm
it th
e 20
08 I
TT
O J
FS
Q a
nd r
epor
ted
142
m3 o
f tr
opic
al s
awnw
ood
expo
rts
to C
OM
TR
AD
E f
or th
e ye
ar 2
008.
Mya
nmar
++
++
Nig
eria
++
++
+O
ther
sT
otal
Côt
e d'
Ivoi
rePh
ilipp
ines
Gha
na
Tab
le 2
-2. T
rad
e o
f T
rop
ical
Saw
nw
oo
d, 2
008
(m3 )
Thai
land
Braz
il+In
done
sia+
+Im
por
tsM
alay
sia
Peru
Cam
eroo
n++
+Re
p of
C
ongo
++
++
124
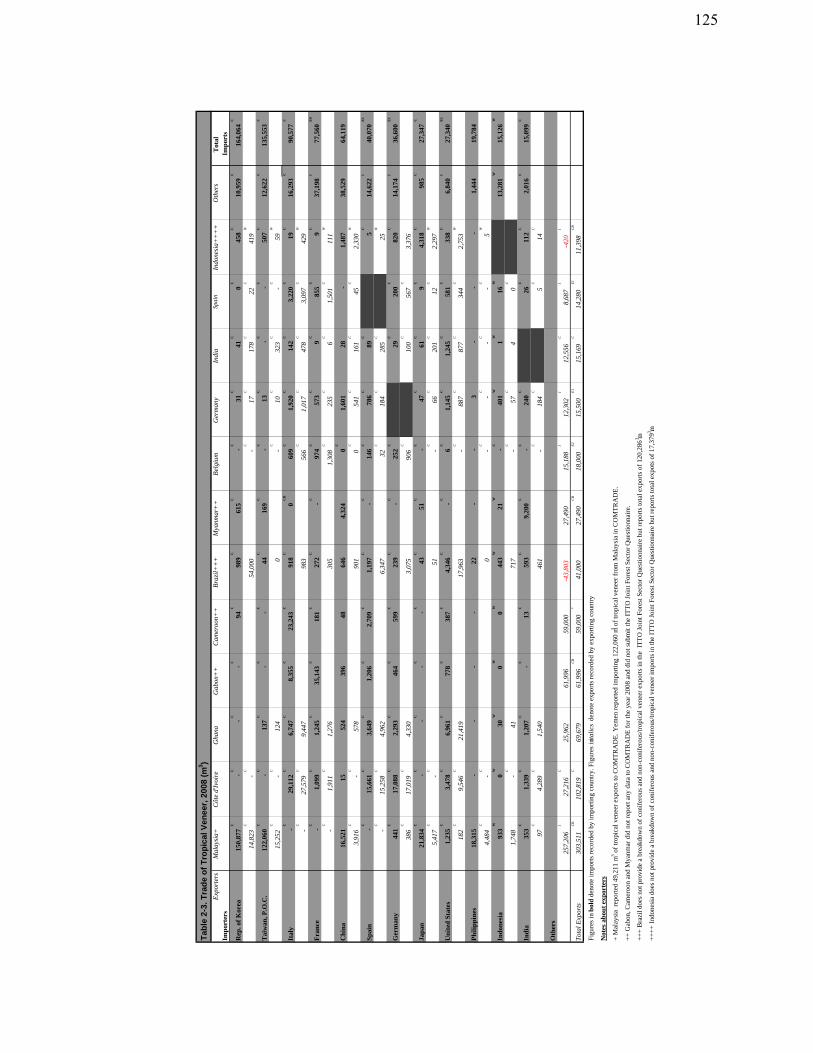
Expo
rter
sT
otal
Im
por
ters
Imp
orts
Rep
. of
Kor
ea15
0,87
7C
-C
-C
-C
94C
989
C
615
C
-C
31C
41C
0C
458
C
10,9
59C
164,
064
C
14,8
23C
-C
54,0
00-
C
17C
178
C
22C
419
W
Tai
wan
, P.O
.C.
122,
060
C
-C
137
C
-C
-C
44C
169
C
-C
13C
-C
-C
507
C
12,6
22C
135,
553
C
15,2
52C
-C
124
0-
C
10C
323
C
-C
59W
Ital
y-
C
29,1
12C
6,74
7C
8,35
5C
23,2
43C
918
C
0C
R
609
C
1,92
0C
142
C
3,22
0C
19C
16,2
93C
90,5
77C
-C
27,5
79C
9,44
798
356
6C
1,01
7C
478
C
3,09
7C
429
W
Fra
nce
-C
1,09
9C
1,24
5C
35,1
43C
181
C
272
C
-C
974
C
573
C
9C
855
C
9C
37,1
98I
77,5
60E
9
-C
1,91
1C
1,27
630
51,
308
C
235
C
6C
1,50
1C
111
W
Ch
ina
16,5
2115
524
396
4864
64,
324
0C
1,60
128
-1,
487
38,5
2964
,119
3,91
6C
-C
578
901
0C
541
C
161
C
45C
2,33
0W
Sp
ain
-C
15,6
61C
3,64
9C
1,20
6C
2,70
9C
1,19
7C
-C
146
C
786
C
89C
5C
14,6
22I
40,0
70E
1
-C
15,2
58C
4,96
26,
347
32C
184
C
285
C
25W
Ger
man
y44
1C
17,0
88C
2,29
3C
464
C
599
C
239
C
-C
252
C
29C
200
C
820
C
14,1
74I
36,6
00E
1
386
C
17,0
19C
4,33
03,
075
906
C
100
C
567
C
3,37
6
Jap
an21
,834
C
-C
-C
-C
-C
43C
51C
-C
47C
61C
9C
4,31
8C
985
C
27,3
47C
5,41
7C
-C
51-
C
66C
201
C
12C
2,29
7W
Un
ited
Sta
tes
1,23
5C
3,47
8C
6,96
1C
778
C
387
C
4,34
6C
-C
6C
1,14
5C
1,24
5C
581
C
338
C
6,84
0I
27,3
40E
1
182
C
9,54
6C
21,4
1917
,963
-C
887
C
877
C
344
C
2,75
3W
Ph
ilip
pin
es18
,315
--
--
22-
-3
--
-1,
444
19,7
84
4,48
4C
-C
0-
C
-C
-C
-C
5W
Ind
ones
ia93
3W
0W
30W
0W
0W
443
W
21W
-C
401
W
1W
16W
13,2
81W
15,1
26W
1,74
8-
C
4171
7-
C
57C
40
C
Ind
ia35
3C
1,33
9C
1,20
7C
-C
13C
593
C
9,20
0C
-C
240
C
26C
112
C
2,01
6C
15,0
99C
97C
4,28
9C
1,54
046
1-
C
184
C
5C
14C
Oth
ers
257,
206
I
27,2
16C
25,9
6261
,996
59,0
00-4
3,80
3 27
,490
15,1
88I
12,3
02I
12,5
56C
8,68
7I
-420
I
Tota
l Exp
orts
303,
511
CB
102,
819
C
69,6
7961
,996
CB
59,0
00*
41,0
0027
,490
CB
18,0
00E2
15,5
00E1
15,1
69C
14,2
80E1
11,3
98C
B
Fig
ures
in b
old
deno
te im
port
s re
cord
ed b
y im
port
ing
coun
try.
Fig
ures
in ita
lics
deno
te e
xpor
ts r
ecor
ded
by e
xpor
ting
cou
ntry
Not
es a
bou
t ex
por
ters
+ M
alay
sia
rep
orte
d 49
,211
m3 o
f tr
opic
al v
enee
r ex
port
s to
CO
MT
RA
DE
. Yem
en r
epor
ted
impo
rtin
g 12
2,06
0 m3 o
f tr
opic
al v
enee
r fr
om M
alay
sia
in C
OM
TR
AD
E.
++
Gab
on, C
amer
oon
and
Mya
nmar
did
not
rep
ort a
ny d
ata
to C
OM
TR
AD
E f
or th
e ye
ar 2
008
and
did
not s
ubm
it th
e IT
TO
Joi
nt F
ores
t Sec
tor
Que
stio
nnai
re.
++
+ B
razi
l doe
s no
t pro
vide
a b
reak
dow
n of
con
ifer
ous
and
non-
coni
fero
us/t
ropi
cal v
enee
r ex
port
s in
the
IT
TO
Joi
nt F
ores
t Sec
tor
Que
stio
nnai
re b
ut r
epor
ts to
tal e
xpor
ts o
f 12
0,28
6 m3 .
++
++
Ind
ones
ia d
oes
not p
rovi
de a
bre
akdo
wn
of c
onif
erou
s an
d no
n-co
nife
rous
/tro
pica
l ven
eer
impo
rts
in th
e IT
TO
Joi
nt F
ores
t Sec
tor
Que
stio
nnai
re b
ut r
epor
ts to
tal e
xpot
s of
17,
379
m3 .
Tab
le 2
-3. T
rad
e o
f T
rop
ical
Ven
eer,
200
8 (m
3 )M
alay
sia+
Côt
e d'
Ivoi
reG
hana
Gab
on+
+M
yanm
ar+
+In
dia
Cam
eroo
n++
Indo
nesi
a++
++
Spai
nO
ther
sBr
azil+
++
Belg
ium
Ger
man
y
125
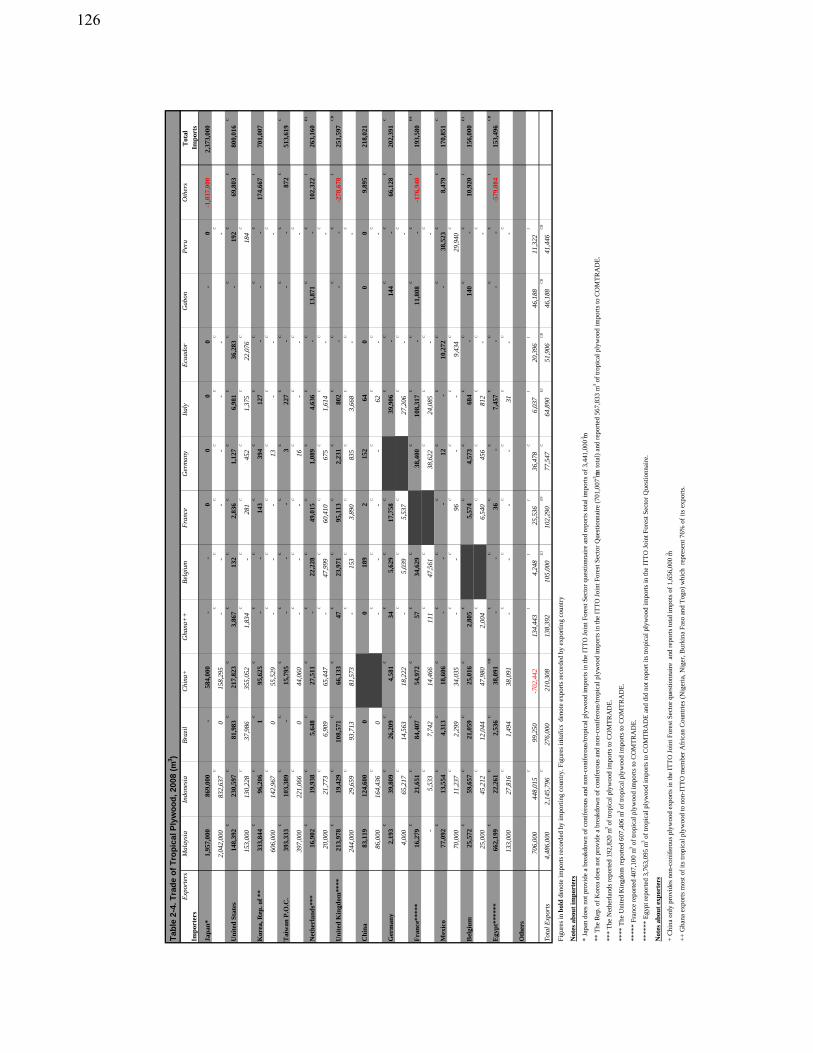
Expo
rter
sIm
por
ters
Jap
an*
1,95
7,00
086
9,00
0-
584,
000
--
00
00
-0
-1,0
37,0
002,
373,
000
2,04
2,00
083
2,63
7C
015
8,29
5-
C
-C
-C
-C
-C
-C
-C
Un
ited
Sta
tes
148,
392
C
230,
597
C
81,9
83C
217,
823
C
3,86
7C
132
C
2,83
6C
1,12
7C
6,98
1C
36,2
83C
-C
192
C
69,8
03C
800,
016
C
153,
000
130,
228
C
37,9
8635
5,05
21,
834
C
-C
281
C
452
C
1,37
5C
22,0
76C
184
C
Kor
ea, R
ep. o
f **
333,
844
C
96,2
06C
1C
95,6
25C
-C
-C
143
C
394
C
127
C
-C
-C
-C
174,
667
I
701,
007
606,
000
142,
967
C
055
,529
-C
-C
-C
13C
-C
-C
-C
Tai
wan
P.O
.C.
393,
333
C
103,
389
C
-C
15,7
95C
-C
-C
-C
3C
227
C
-C
-C
-C
872
C
513,
619
C
397,
000
221,
066
C
044
,060
-C
-C
-C
16C
-C
-C
-C
Net
her
lan
ds*
**16
,902
C
19,9
38C
5,64
8C
27,5
11C
-C
22,2
28C
49,0
15C
1,08
9C
4,63
6C
-C
13,8
71C
-C
102,
322
I
263,
160
E2
20,0
0021
,773
C
6,90
965
,447
-C
47,9
99C
60,4
10C
675
C
1,61
4C
-C
-C
Un
ited
Kin
gdom
****
213,
978
C
19,4
29C
108,
571
C
66,1
33C
47C
23,9
71C
95,1
13C
2,23
1C
802
C
-C
-C
-C
-278
,678
I
251,
597
CB
244,
000
29,6
59C
93,7
1381
,573
-C
153
C
3,89
0C
835
C
3,66
8C
-C
-C
Ch
ina
83,1
1912
4,60
00
018
92
152
640
00
9,89
521
8,02
1
86,0
0016
4,43
6C
0-
C
-C
-C
-C
62C
-C
-C
Ger
man
y2,
193
C
39,8
09C
26,2
09C
4,58
1C
34C
5,62
9C
17,7
58C
39,9
06C
-C
144
C
-C
66,1
28C
202,
391
C
4,00
065
,217
C
14,5
6318
,222
-C
5,03
9C
5,53
7C
27,2
06C
-C
-C
Fra
nce
****
*16
,279
C
21,6
51C
84,4
07C
54,9
72C
57C
34,6
29C
38,4
00C
108,
317
C
-C
11,8
08C
-C
-176
,940
I
193,
580
E9
-5,
533
C
7,74
214
,466
111
C
47,5
61C
38,6
22C
24,0
85C
-C
-C
Mex
ico
77,0
92C
13,5
54C
4,31
3C
18,6
06C
-C
-C
-C
12C
-C
10,2
72C
-C
38,5
23C
8,47
9C
170,
851
C
70,0
0011
,237
C
2,29
934
,035
-C
-C
96C
-C
-C
9,43
4C
29,9
40C
Bel
giu
m25
,572
C
59,6
57C
21,0
59C
25,0
16C
2,80
5C
5,57
4C
4,57
3C
684
C
-C
140
C
-C
10,9
20I
156,
000
E1
25,0
0045
,212
C
12,0
4447
,980
2,00
4C
6,54
0C
456
C
812
C
-C
-C
Egy
pt*
****
*66
2,19
9C
22,2
61C
2,53
6C
38,0
91C
B
-C
-C
36C
-C
7,45
7C
-C
-C
-C
-579
,084
I
153,
496
CB
133,
000
27,8
16C
1,49
438
,091
-C
-C
-C
-C
31C
-C
-C
Oth
ers
706,
000
448,
015
C
99,2
50-7
02,4
42
134,
443
I
4,24
8I
25,5
36I
36,4
78C
6,03
7I
20,3
96I
46,1
8811
,322
I
Tota
l Exp
orts
4,48
6,00
02,
145,
796
C
276,
000
210,
308
138,
392
105,
000
E1
102,
290
E9
77,5
47C
64,8
90E1
51,9
06C
B
46,1
88C
B
41,4
46C
B
Fig
ures
in b
old
deno
te im
port
s re
cord
ed b
y im
port
ing
coun
try.
Fig
ures
in ita
lics
deno
te e
xpor
ts r
ecor
ded
by e
xpor
ting
cou
ntry
Not
es a
bou
t im
por
ters
* Ja
pan
does
not
pro
vide
a b
reak
dow
n of
con
ifer
ous
and
non-
coni
fero
us/t
ropi
cal p
lyw
ood
impo
rts
in th
e IT
TO
Joi
nt F
ores
t Sec
tor
ques
tion
nair
e an
d re
port
s to
tal i
mpo
rts
of 3
,441
,000
m3.
** T
he R
ep. o
f K
orea
doe
s no
t pro
vide
a b
reak
dow
n of
con
ifer
ous
and
non-
coni
fero
us/t
ropi
cal p
lyw
ood
impo
rts
in th
e IT
TO
Joi
nt F
ores
t Sec
tor
Que
stio
nnai
re (
701,
007
m3 in to
tal)
and
rep
orte
d 56
7,83
3 m
3 of
trop
ical
ply
woo
d im
port
s to
CO
MT
RA
DE
.
***
The
Net
herl
ands
rep
orte
d 19
2,82
0 m
3 of
trop
ical
ply
woo
d im
port
s to
CO
MT
RA
DE
.
****
The
Uni
ted
Kin
gdom
rep
orte
d 60
7,40
6 m3 o
f tr
opic
al p
lyw
ood
impo
rts
to C
OM
TR
AD
E.
****
* F
ranc
e re
port
ed 4
07,1
00 m
3 of
trop
ical
ply
woo
d im
port
s to
CO
MT
RA
DE
.
****
** E
gypt
rep
orte
d 3,
763,
095
m3 o
f tr
opic
al p
lyw
ood
impo
rts
to C
OM
TR
AD
E a
nd d
id n
ot r
epor
t its
trop
ical
ply
woo
d im
port
s in
the
ITT
O J
oint
For
est S
ecto
r Q
uest
ionn
aire
.
Not
es a
bou
t ex
por
ters
+ C
hina
onl
y pr
ovid
es n
on-c
onif
erou
s pl
ywoo
d ex
port
s in
the
ITT
O J
oint
For
est S
ecto
r qu
esti
onna
ire
and
rep
orts
tota
l im
pots
of
1,65
6,00
0 m3.
++
Gha
na e
xpor
ts m
ost o
f it
s tr
opic
al p
lyw
ood
to n
on-I
TT
O m
embe
r A
fric
an C
ount
ries
(N
iger
ia, N
iger
, Bur
kina
Fas
o an
d T
ogo)
whi
ch r
epre
sent
76%
of
its
expo
rts.
Mal
aysi
aIn
done
sia
Belg
ium
Oth
ers
Ger
man
yEc
uado
rFr
ance
Tab
le 2
-4. T
rad
e o
f T
rop
ical
Ply
wo
od
, 200
8 (m
3 )G
abon
Italy
Tot
al
Imp
orts
Chi
na+
Peru
Braz
ilG
hana
++
126
127
APPENDIX 3
Major Tropical Species Traded in 2007 and 2008
Table 3-1-a. Log Imports ........................................................................................................... 129
Table 3-1-b. Sawnwood Imports ................................................................................................ 132
Table 3-1-c. Veneer Imports ...................................................................................................... 137
Table 3-1-d. Plywood Imports ................................................................................................... 140
Table 3-2-a. Log Exports ........................................................................................................... 143 Table 3-2-b. Sawnwood Exports ................................................................................................ 145
Table 3-2-c. Veneer Exports ...................................................................................................... 149
Table 3-2-d. Plywood Exports ................................................................................................... 151
Explanatory Note ...................................................................................................................... 155
N.B. Export values/prices are FOB; import values are CIF, unless otherwise stated.

128
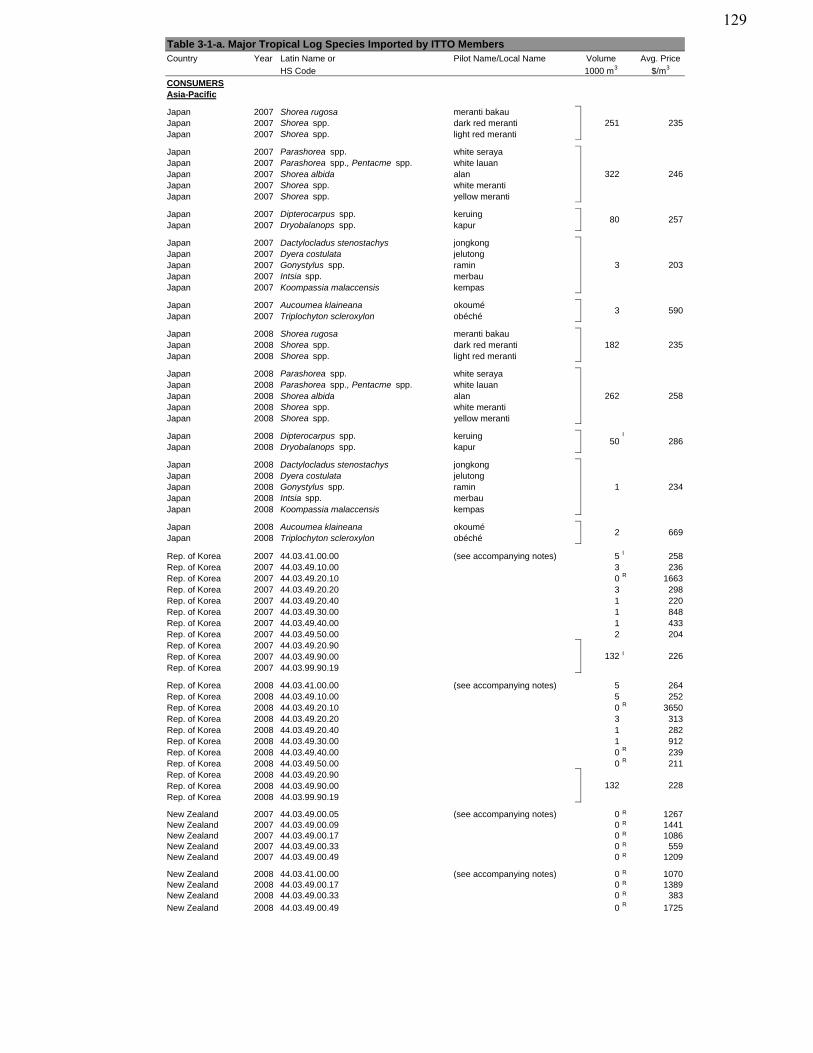
Country Year Latin Name or Pilot Name/Local Name Volume Avg. Price
HS Code 1000 m3 $/m3
CONSUMERSAsia-Pacific
Japan 2007 Shorea rugosa meranti bakauJapan 2007 Shorea spp. dark red merantiJapan 2007 Shorea spp. light red meranti
Japan 2007 Parashorea spp. white serayaJapan 2007 Parashorea spp., Pentacme spp. white lauanJapan 2007 Shorea albida alanJapan 2007 Shorea spp. white merantiJapan 2007 Shorea spp. yellow meranti
Japan 2007 Dipterocarpus spp. keruingJapan 2007 Dryobalanops spp. kapur
Japan 2007 Dactylocladus stenostachys jongkongJapan 2007 Dyera costulata jelutongJapan 2007 Gonystylus spp. raminJapan 2007 Intsia spp. merbauJapan 2007 Koompassia malaccensis kempas
Japan 2007 Aucoumea klaineana okouméJapan 2007 Triplochyton scleroxylon obéché
Japan 2008 Shorea rugosa meranti bakauJapan 2008 Shorea spp. dark red merantiJapan 2008 Shorea spp. light red meranti
Japan 2008 Parashorea spp. white serayaJapan 2008 Parashorea spp., Pentacme spp. white lauanJapan 2008 Shorea albida alanJapan 2008 Shorea spp. white merantiJapan 2008 Shorea spp. yellow meranti
Japan 2008 Dipterocarpus spp. keruing I
Japan 2008 Dryobalanops spp. kapur
Japan 2008 Dactylocladus stenostachys jongkongJapan 2008 Dyera costulata jelutongJapan 2008 Gonystylus spp. raminJapan 2008 Intsia spp. merbauJapan 2008 Koompassia malaccensis kempas
Japan 2008 Aucoumea klaineana okouméJapan 2008 Triplochyton scleroxylon obéché
Rep. of Korea 2007 44.03.41.00.00 (see accompanying notes) 5 I 258Rep. of Korea 2007 44.03.49.10.00 3 236Rep. of Korea 2007 44.03.49.20.10 0 R 1663Rep. of Korea 2007 44.03.49.20.20 3 298Rep. of Korea 2007 44.03.49.20.40 1 220Rep. of Korea 2007 44.03.49.30.00 1 848Rep. of Korea 2007 44.03.49.40.00 1 433Rep. of Korea 2007 44.03.49.50.00 2 204Rep. of Korea 2007 44.03.49.20.90Rep. of Korea 2007 44.03.49.90.00 I
Rep. of Korea 2007 44.03.99.90.19
Rep. of Korea 2008 44.03.41.00.00 (see accompanying notes) 5 264Rep. of Korea 2008 44.03.49.10.00 5 252Rep. of Korea 2008 44.03.49.20.10 0 R 3650Rep. of Korea 2008 44.03.49.20.20 3 313Rep. of Korea 2008 44.03.49.20.40 1 282Rep. of Korea 2008 44.03.49.30.00 1 912Rep. of Korea 2008 44.03.49.40.00 0 R 239Rep. of Korea 2008 44.03.49.50.00 0 R 211Rep. of Korea 2008 44.03.49.20.90Rep. of Korea 2008 44.03.49.90.00Rep. of Korea 2008 44.03.99.90.19
New Zealand 2007 44.03.49.00.05 (see accompanying notes) 0 R 1267New Zealand 2007 44.03.49.00.09 0 R 1441New Zealand 2007 44.03.49.00.17 0 R 1086New Zealand 2007 44.03.49.00.33 0 R 559New Zealand 2007 44.03.49.00.49 0 R 1209
New Zealand 2008 44.03.41.00.00 (see accompanying notes) 0 R 1070New Zealand 2008 44.03.49.00.17 0 R 1389New Zealand 2008 44.03.49.00.33 0 R 383
New Zealand 2008 44.03.49.00.49 0 R 1725
Table 3-1-a. Major Tropical Log Species Imported by ITTO Members
182 235
262 258
251 235
322 246
80 257
3 203
5903
132 226
50 286
1 234
2 669
132 228
129
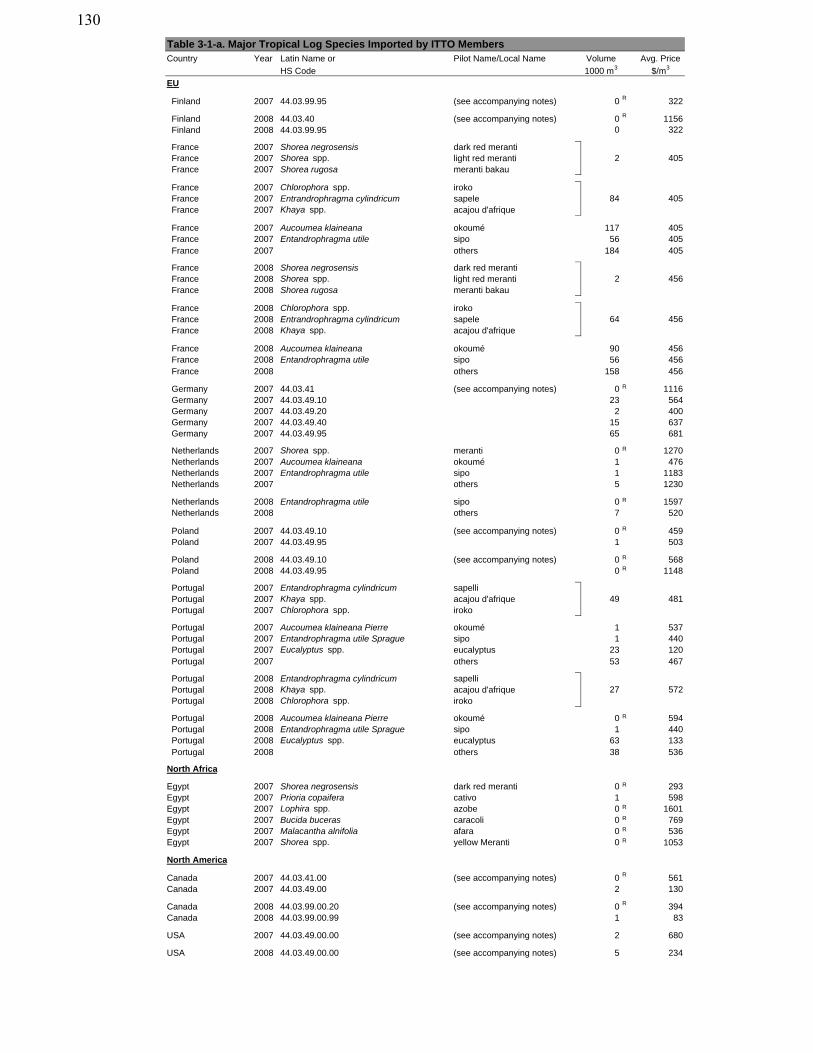
Country Year Latin Name or Pilot Name/Local Name Volume Avg. Price
HS Code 1000 m3 $/m3
Table 3-1-a. Major Tropical Log Species Imported by ITTO Members
EU
Finland 2007 44.03.99.95 (see accompanying notes) 0 R 322
Finland 2008 44.03.40 (see accompanying notes) 0 R 1156Finland 2008 44.03.99.95 0 322
France 2007 Shorea negrosensis dark red merantiFrance 2007 Shorea spp. light red merantiFrance 2007 Shorea rugosa meranti bakau
France 2007 Chlorophora spp. irokoFrance 2007 Entrandrophragma cylindricum sapeleFrance 2007 Khaya spp. acajou d'afrique
France 2007 Aucoumea klaineana okoumé 117 405France 2007 Entandrophragma utile sipo 56 405France 2007 others 184 405
France 2008 Shorea negrosensis dark red merantiFrance 2008 Shorea spp. light red merantiFrance 2008 Shorea rugosa meranti bakau
France 2008 Chlorophora spp. irokoFrance 2008 Entrandrophragma cylindricum sapeleFrance 2008 Khaya spp. acajou d'afrique
France 2008 Aucoumea klaineana okoumé 90 456France 2008 Entandrophragma utile sipo 56 456France 2008 others 158 456
Germany 2007 44.03.41 (see accompanying notes) 0 R 1116Germany 2007 44.03.49.10 23 564Germany 2007 44.03.49.20 2 400Germany 2007 44.03.49.40 15 637Germany 2007 44.03.49.95 65 681
Netherlands 2007 Shorea spp. meranti 0 R 1270Netherlands 2007 Aucoumea klaineana okoumé 1 476Netherlands 2007 Entandrophragma utile sipo 1 1183Netherlands 2007 others 5 1230
Netherlands 2008 Entandrophragma utile sipo 0 R 1597Netherlands 2008 others 7 520
Poland 2007 44.03.49.10 (see accompanying notes) 0 R 459Poland 2007 44.03.49.95 1 503
Poland 2008 44.03.49.10 (see accompanying notes) 0 R 568Poland 2008 44.03.49.95 0 R 1148
Portugal 2007 Entandrophragma cylindricum sapelliPortugal 2007 Khaya spp. acajou d'afriquePortugal 2007 Chlorophora spp. iroko
Portugal 2007 Aucoumea klaineana Pierre okoumé 1 537Portugal 2007 Entandrophragma utile Sprague sipo 1 440Portugal 2007 Eucalyptus spp. eucalyptus 23 120Portugal 2007 others 53 467
Portugal 2008 Entandrophragma cylindricum sapelliPortugal 2008 Khaya spp. acajou d'afriquePortugal 2008 Chlorophora spp. iroko
Portugal 2008 Aucoumea klaineana Pierre okoumé 0 R 594Portugal 2008 Entandrophragma utile Sprague sipo 1 440Portugal 2008 Eucalyptus spp. eucalyptus 63 133Portugal 2008 others 38 536
North Africa
Egypt 2007 Shorea negrosensis dark red meranti 0 R 293Egypt 2007 Prioria copaifera cativo 1 598Egypt 2007 Lophira spp. azobe 0 R 1601Egypt 2007 Bucida buceras caracoli 0 R 769Egypt 2007 Malacantha alnifolia afara 0 R 536Egypt 2007 Shorea spp. yellow Meranti 0 R 1053
North America
Canada 2007 44.03.41.00 (see accompanying notes) 0 R 561Canada 2007 44.03.49.00 2 130
Canada 2008 44.03.99.00.20 (see accompanying notes) 0 R 394Canada 2008 44.03.99.00.99 1 83
USA 2007 44.03.49.00.00 (see accompanying notes) 2 680
USA 2008 44.03.49.00.00 (see accompanying notes) 5 234
49 481
405
405
84
2
27 572
2 456
64 456
130
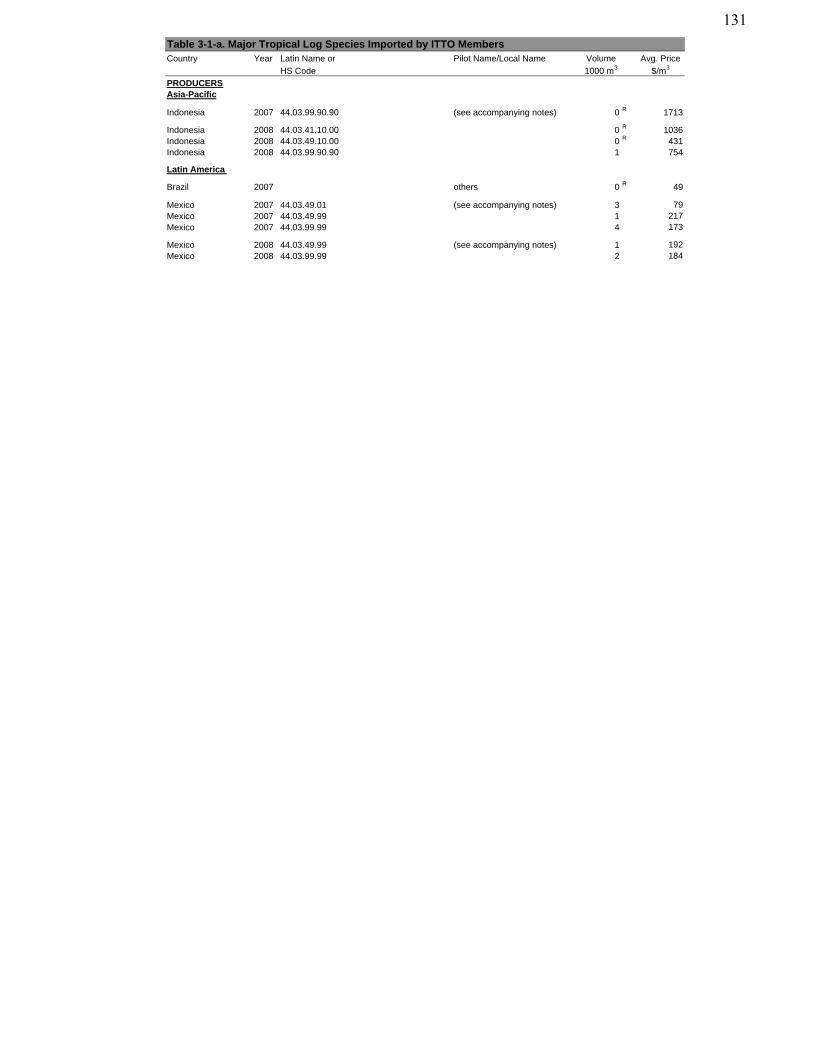
Country Year Latin Name or Pilot Name/Local Name Volume Avg. Price
HS Code 1000 m3 $/m3
Table 3-1-a. Major Tropical Log Species Imported by ITTO Members
PRODUCERSAsia-Pacific
Indonesia 2007 44.03.99.90.90 (see accompanying notes) 0 R 1713
Indonesia 2008 44.03.41.10.00 0 R 1036Indonesia 2008 44.03.49.10.00 0 R 431Indonesia 2008 44.03.99.90.90 1 754
Latin America
Brazil 2007 others 0 R 49
Mexico 2007 44.03.49.01 (see accompanying notes) 3 79Mexico 2007 44.03.49.99 1 217Mexico 2007 44.03.99.99 4 173
Mexico 2008 44.03.49.99 (see accompanying notes) 1 192Mexico 2008 44.03.99.99 2 184
131
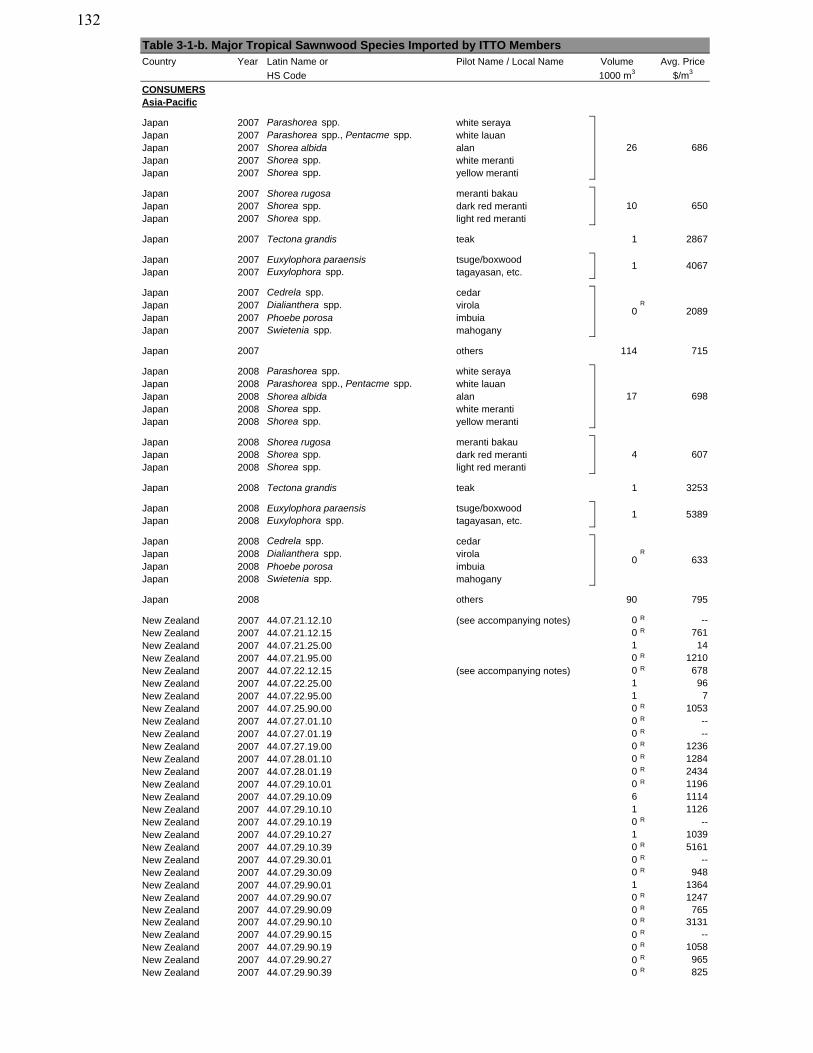
Country Year Latin Name or Pilot Name / Local Name Volume Avg. Price
HS Code 1000 m3 $/m3
CONSUMERSAsia-Pacific
Japan 2007 Parashorea spp. white serayaJapan 2007 Parashorea spp., Pentacme spp. white lauanJapan 2007 Shorea albida alanJapan 2007 Shorea spp. white merantiJapan 2007 Shorea spp. yellow meranti
Japan 2007 Shorea rugosa meranti bakauJapan 2007 Shorea spp. dark red merantiJapan 2007 Shorea spp. light red meranti
Japan 2007 Tectona grandis teak 1 2867
Japan 2007 Euxylophora paraensis tsuge/boxwoodJapan 2007 Euxylophora spp. tagayasan, etc.
Japan 2007 Cedrela spp. cedarJapan 2007 Dialianthera spp. virola R
Japan 2007 Phoebe porosa imbuiaJapan 2007 Swietenia spp. mahogany
Japan 2007 others 114 715
Japan 2008 Parashorea spp. white serayaJapan 2008 Parashorea spp., Pentacme spp. white lauanJapan 2008 Shorea albida alanJapan 2008 Shorea spp. white merantiJapan 2008 Shorea spp. yellow meranti
Japan 2008 Shorea rugosa meranti bakauJapan 2008 Shorea spp. dark red merantiJapan 2008 Shorea spp. light red meranti
Japan 2008 Tectona grandis teak 1 3253
Japan 2008 Euxylophora paraensis tsuge/boxwoodJapan 2008 Euxylophora spp. tagayasan, etc.
Japan 2008 Cedrela spp. cedarJapan 2008 Dialianthera spp. virola R
Japan 2008 Phoebe porosa imbuiaJapan 2008 Swietenia spp. mahogany
Japan 2008 others 90 795
New Zealand 2007 44.07.21.12.10 (see accompanying notes) 0 R --New Zealand 2007 44.07.21.12.15 0 R 761New Zealand 2007 44.07.21.25.00 1 14New Zealand 2007 44.07.21.95.00 0 R 1210New Zealand 2007 44.07.22.12.15 (see accompanying notes) 0 R 678New Zealand 2007 44.07.22.25.00 1 96New Zealand 2007 44.07.22.95.00 1 7New Zealand 2007 44.07.25.90.00 0 R 1053New Zealand 2007 44.07.27.01.10 0 R --New Zealand 2007 44.07.27.01.19 0 R --New Zealand 2007 44.07.27.19.00 0 R 1236New Zealand 2007 44.07.28.01.10 0 R 1284New Zealand 2007 44.07.28.01.19 0 R 2434New Zealand 2007 44.07.29.10.01 0 R 1196New Zealand 2007 44.07.29.10.09 6 1114New Zealand 2007 44.07.29.10.10 1 1126New Zealand 2007 44.07.29.10.19 0 R --New Zealand 2007 44.07.29.10.27 1 1039New Zealand 2007 44.07.29.10.39 0 R 5161New Zealand 2007 44.07.29.30.01 0 R --New Zealand 2007 44.07.29.30.09 0 R 948New Zealand 2007 44.07.29.90.01 1 1364New Zealand 2007 44.07.29.90.07 0 R 1247New Zealand 2007 44.07.29.90.09 0 R 765New Zealand 2007 44.07.29.90.10 0 R 3131New Zealand 2007 44.07.29.90.15 0 R --New Zealand 2007 44.07.29.90.19 0 R 1058New Zealand 2007 44.07.29.90.27 0 R 965New Zealand 2007 44.07.29.90.39 0 R 825
686
650
20890
Table 3-1-b. Major Tropical Sawnwood Species Imported by ITTO Members
26
10
1 4067
17 698
4 607
1 5389
0 633
132
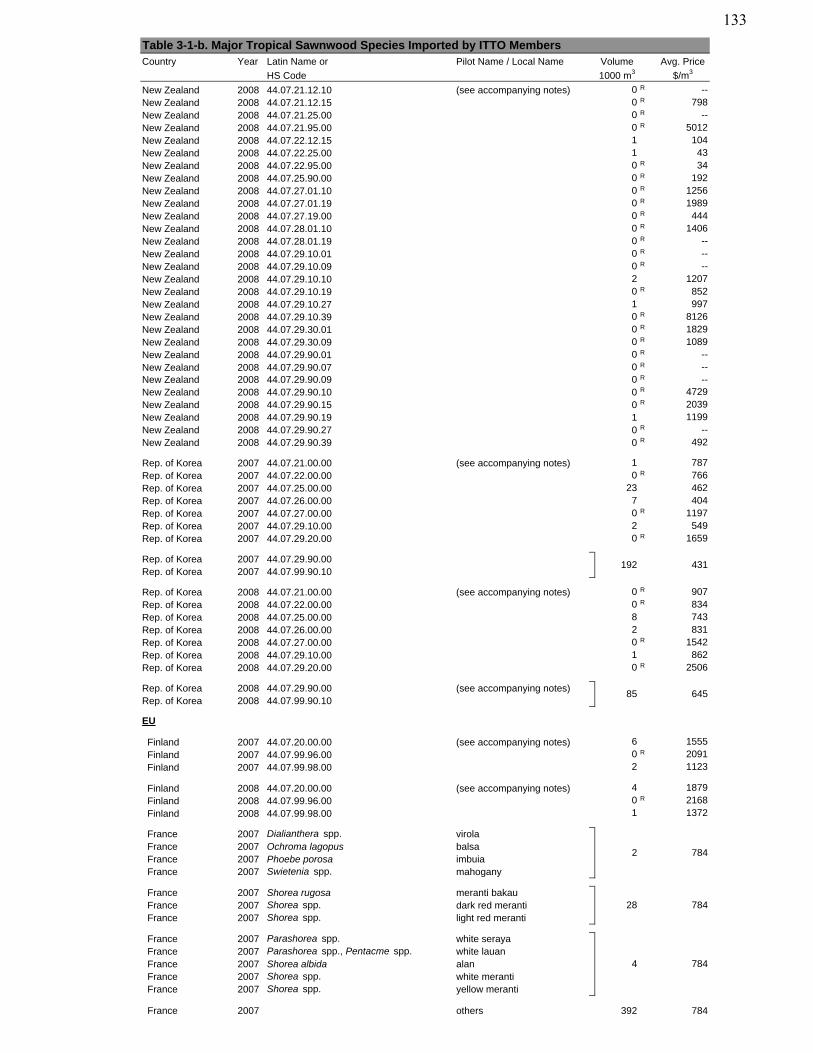
Country Year Latin Name or Pilot Name / Local Name Volume Avg. Price
HS Code 1000 m3 $/m3
Table 3-1-b. Major Tropical Sawnwood Species Imported by ITTO Members
New Zealand 2008 44.07.21.12.10 (see accompanying notes) 0 R --New Zealand 2008 44.07.21.12.15 0 R 798New Zealand 2008 44.07.21.25.00 0 R --New Zealand 2008 44.07.21.95.00 0 R 5012New Zealand 2008 44.07.22.12.15 1 104New Zealand 2008 44.07.22.25.00 1 43New Zealand 2008 44.07.22.95.00 0 R 34New Zealand 2008 44.07.25.90.00 0 R 192New Zealand 2008 44.07.27.01.10 0 R 1256New Zealand 2008 44.07.27.01.19 0 R 1989New Zealand 2008 44.07.27.19.00 0 R 444New Zealand 2008 44.07.28.01.10 0 R 1406New Zealand 2008 44.07.28.01.19 0 R --New Zealand 2008 44.07.29.10.01 0 R --New Zealand 2008 44.07.29.10.09 0 R --New Zealand 2008 44.07.29.10.10 2 1207New Zealand 2008 44.07.29.10.19 0 R 852New Zealand 2008 44.07.29.10.27 1 997New Zealand 2008 44.07.29.10.39 0 R 8126New Zealand 2008 44.07.29.30.01 0 R 1829New Zealand 2008 44.07.29.30.09 0 R 1089New Zealand 2008 44.07.29.90.01 0 R --New Zealand 2008 44.07.29.90.07 0 R --New Zealand 2008 44.07.29.90.09 0 R --New Zealand 2008 44.07.29.90.10 0 R 4729New Zealand 2008 44.07.29.90.15 0 R 2039New Zealand 2008 44.07.29.90.19 1 1199New Zealand 2008 44.07.29.90.27 0 R --New Zealand 2008 44.07.29.90.39 0 R 492
Rep. of Korea 2007 44.07.21.00.00 (see accompanying notes) 1 787Rep. of Korea 2007 44.07.22.00.00 0 R 766Rep. of Korea 2007 44.07.25.00.00 23 462Rep. of Korea 2007 44.07.26.00.00 7 404Rep. of Korea 2007 44.07.27.00.00 0 R 1197Rep. of Korea 2007 44.07.29.10.00 2 549Rep. of Korea 2007 44.07.29.20.00 0 R 1659
Rep. of Korea 2007 44.07.29.90.00Rep. of Korea 2007 44.07.99.90.10
Rep. of Korea 2008 44.07.21.00.00 (see accompanying notes) 0 R 907Rep. of Korea 2008 44.07.22.00.00 0 R 834Rep. of Korea 2008 44.07.25.00.00 8 743Rep. of Korea 2008 44.07.26.00.00 2 831Rep. of Korea 2008 44.07.27.00.00 0 R 1542Rep. of Korea 2008 44.07.29.10.00 1 862Rep. of Korea 2008 44.07.29.20.00 0 R 2506
Rep. of Korea 2008 44.07.29.90.00 (see accompanying notes)Rep. of Korea 2008 44.07.99.90.10
EU
Finland 2007 44.07.20.00.00 (see accompanying notes) 6 1555Finland 2007 44.07.99.96.00 0 R 2091Finland 2007 44.07.99.98.00 2 1123
Finland 2008 44.07.20.00.00 (see accompanying notes) 4 1879Finland 2008 44.07.99.96.00 0 R 2168Finland 2008 44.07.99.98.00 1 1372
France 2007 Dialianthera spp. virolaFrance 2007 Ochroma lagopus balsaFrance 2007 Phoebe porosa imbuiaFrance 2007 Swietenia spp. mahogany
France 2007 Shorea rugosa meranti bakauFrance 2007 Shorea spp. dark red merantiFrance 2007 Shorea spp. light red meranti
France 2007 Parashorea spp. white serayaFrance 2007 Parashorea spp., Pentacme spp. white lauanFrance 2007 Shorea albida alanFrance 2007 Shorea spp. white merantiFrance 2007 Shorea spp. yellow meranti
France 2007 others 392 784
4 784
28
2 784
784
192 431
85 645
133
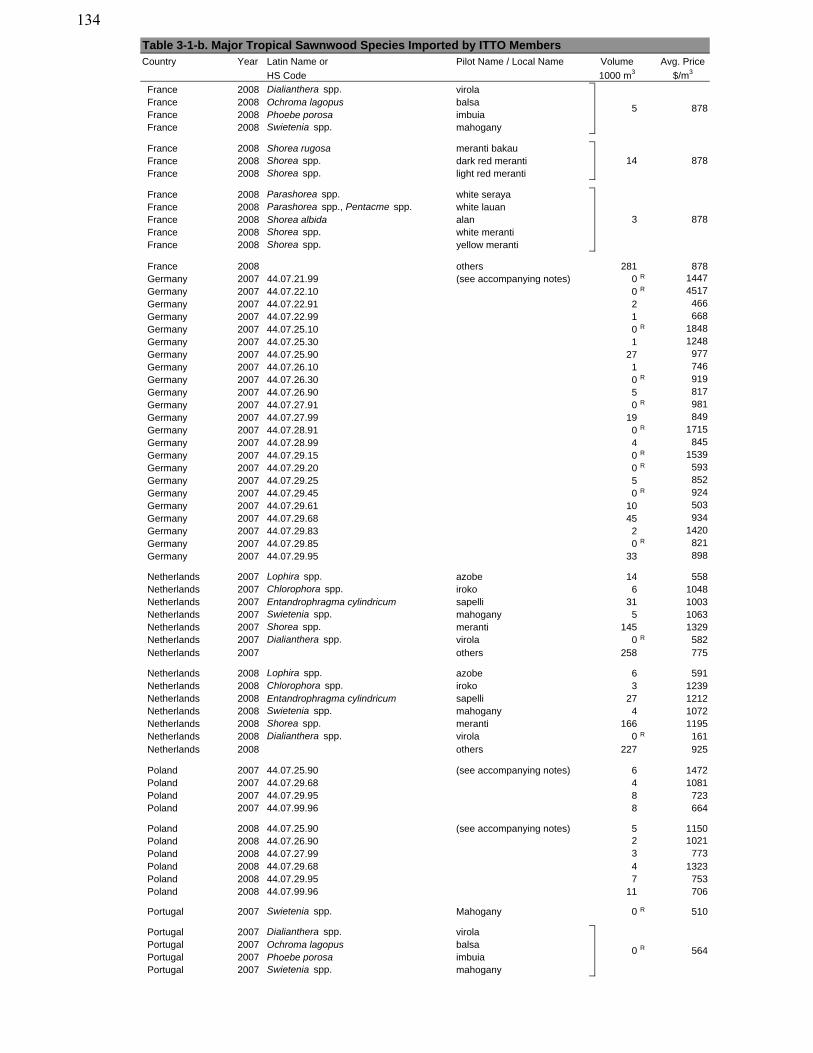
Country Year Latin Name or Pilot Name / Local Name Volume Avg. Price
HS Code 1000 m3 $/m3
Table 3-1-b. Major Tropical Sawnwood Species Imported by ITTO Members
France 2008 Dialianthera spp. virolaFrance 2008 Ochroma lagopus balsaFrance 2008 Phoebe porosa imbuiaFrance 2008 Swietenia spp. mahogany
France 2008 Shorea rugosa meranti bakauFrance 2008 Shorea spp. dark red merantiFrance 2008 Shorea spp. light red meranti
France 2008 Parashorea spp. white serayaFrance 2008 Parashorea spp., Pentacme spp. white lauanFrance 2008 Shorea albida alanFrance 2008 Shorea spp. white merantiFrance 2008 Shorea spp. yellow meranti
France 2008 others 281 878Germany 2007 44.07.21.99 (see accompanying notes) 0 R 1447Germany 2007 44.07.22.10 0 R 4517Germany 2007 44.07.22.91 2 466Germany 2007 44.07.22.99 1 668Germany 2007 44.07.25.10 0 R 1848Germany 2007 44.07.25.30 1 1248Germany 2007 44.07.25.90 27 977Germany 2007 44.07.26.10 1 746Germany 2007 44.07.26.30 0 R 919Germany 2007 44.07.26.90 5 817Germany 2007 44.07.27.91 0 R 981Germany 2007 44.07.27.99 19 849Germany 2007 44.07.28.91 0 R 1715Germany 2007 44.07.28.99 4 845Germany 2007 44.07.29.15 0 R 1539Germany 2007 44.07.29.20 0 R 593Germany 2007 44.07.29.25 5 852Germany 2007 44.07.29.45 0 R 924Germany 2007 44.07.29.61 10 503Germany 2007 44.07.29.68 45 934Germany 2007 44.07.29.83 2 1420Germany 2007 44.07.29.85 0 R 821Germany 2007 44.07.29.95 33 898
Netherlands 2007 Lophira spp. azobe 14 558Netherlands 2007 Chlorophora spp. iroko 6 1048Netherlands 2007 Entandrophragma cylindricum sapelli 31 1003Netherlands 2007 Swietenia spp. mahogany 5 1063Netherlands 2007 Shorea spp. meranti 145 1329Netherlands 2007 Dialianthera spp. virola 0 R 582Netherlands 2007 others 258 775
Netherlands 2008 Lophira spp. azobe 6 591Netherlands 2008 Chlorophora spp. iroko 3 1239Netherlands 2008 Entandrophragma cylindricum sapelli 27 1212Netherlands 2008 Swietenia spp. mahogany 4 1072Netherlands 2008 Shorea spp. meranti 166 1195Netherlands 2008 Dialianthera spp. virola 0 R 161Netherlands 2008 others 227 925
Poland 2007 44.07.25.90 (see accompanying notes) 6 1472Poland 2007 44.07.29.68 4 1081Poland 2007 44.07.29.95 8 723Poland 2007 44.07.99.96 8 664
Poland 2008 44.07.25.90 (see accompanying notes) 5 1150Poland 2008 44.07.26.90 2 1021Poland 2008 44.07.27.99 3 773Poland 2008 44.07.29.68 4 1323Poland 2008 44.07.29.95 7 753Poland 2008 44.07.99.96 11 706
Portugal 2007 Swietenia spp. Mahogany 0 R 510
Portugal 2007 Dialianthera spp. virolaPortugal 2007 Ochroma lagopus balsaPortugal 2007 Phoebe porosa imbuiaPortugal 2007 Swietenia spp. mahogany
0 R
5 878
564
14 878
3 878
134
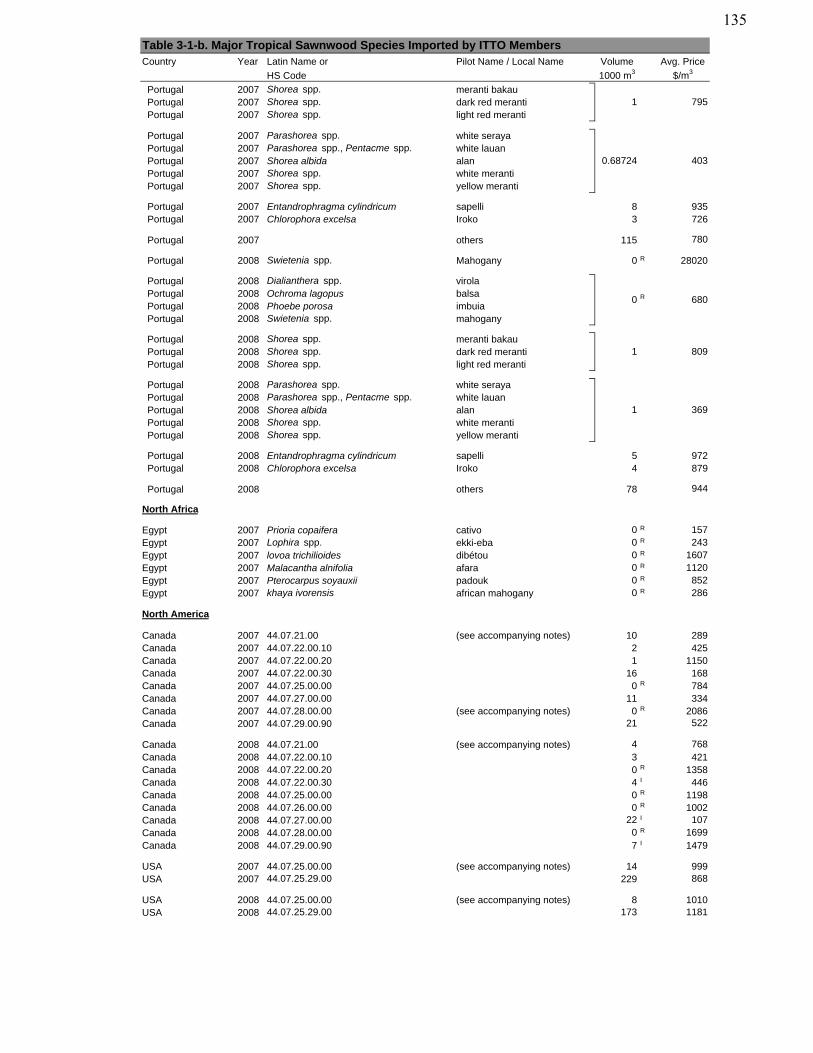
Country Year Latin Name or Pilot Name / Local Name Volume Avg. Price
HS Code 1000 m3 $/m3
Table 3-1-b. Major Tropical Sawnwood Species Imported by ITTO Members
Portugal 2007 Shorea spp. meranti bakauPortugal 2007 Shorea spp. dark red merantiPortugal 2007 Shorea spp. light red meranti
Portugal 2007 Parashorea spp. white serayaPortugal 2007 Parashorea spp., Pentacme spp. white lauanPortugal 2007 Shorea albida alanPortugal 2007 Shorea spp. white merantiPortugal 2007 Shorea spp. yellow meranti
Portugal 2007 Entandrophragma cylindricum sapelli 8 935Portugal 2007 Chlorophora excelsa Iroko 3 726
Portugal 2007 others 115 780
Portugal 2008 Swietenia spp. Mahogany 0 R 28020
Portugal 2008 Dialianthera spp. virolaPortugal 2008 Ochroma lagopus balsaPortugal 2008 Phoebe porosa imbuiaPortugal 2008 Swietenia spp. mahogany
Portugal 2008 Shorea spp. meranti bakauPortugal 2008 Shorea spp. dark red merantiPortugal 2008 Shorea spp. light red meranti
Portugal 2008 Parashorea spp. white serayaPortugal 2008 Parashorea spp., Pentacme spp. white lauanPortugal 2008 Shorea albida alanPortugal 2008 Shorea spp. white merantiPortugal 2008 Shorea spp. yellow meranti
Portugal 2008 Entandrophragma cylindricum sapelli 5 972Portugal 2008 Chlorophora excelsa Iroko 4 879
Portugal 2008 others 78 944
North Africa
Egypt 2007 Prioria copaifera cativo 0 R 157Egypt 2007 Lophira spp. ekki-eba 0 R 243Egypt 2007 lovoa trichilioides dibétou 0 R 1607Egypt 2007 Malacantha alnifolia afara 0 R 1120Egypt 2007 Pterocarpus soyauxii padouk 0 R 852Egypt 2007 khaya ivorensis african mahogany 0 R 286
North America
Canada 2007 44.07.21.00 (see accompanying notes) 10 289Canada 2007 44.07.22.00.10 2 425Canada 2007 44.07.22.00.20 1 1150Canada 2007 44.07.22.00.30 16 168Canada 2007 44.07.25.00.00 0 R 784Canada 2007 44.07.27.00.00 11 334Canada 2007 44.07.28.00.00 (see accompanying notes) 0 R 2086Canada 2007 44.07.29.00.90 21 522
Canada 2008 44.07.21.00 (see accompanying notes) 4 768Canada 2008 44.07.22.00.10 3 421Canada 2008 44.07.22.00.20 0 R 1358Canada 2008 44.07.22.00.30 4 I 446Canada 2008 44.07.25.00.00 0 R 1198Canada 2008 44.07.26.00.00 0 R 1002Canada 2008 44.07.27.00.00 22 I 107Canada 2008 44.07.28.00.00 0 R 1699Canada 2008 44.07.29.00.90 7 I 1479
USA 2007 44.07.25.00.00 (see accompanying notes) 14 999USA 2007 44.07.25.29.00 229 868
USA 2008 44.07.25.00.00 (see accompanying notes) 8 1010USA 2008 44.07.25.29.00 173 1181
R 680
1
1 809
795
403
0
0.68724
1 369
135
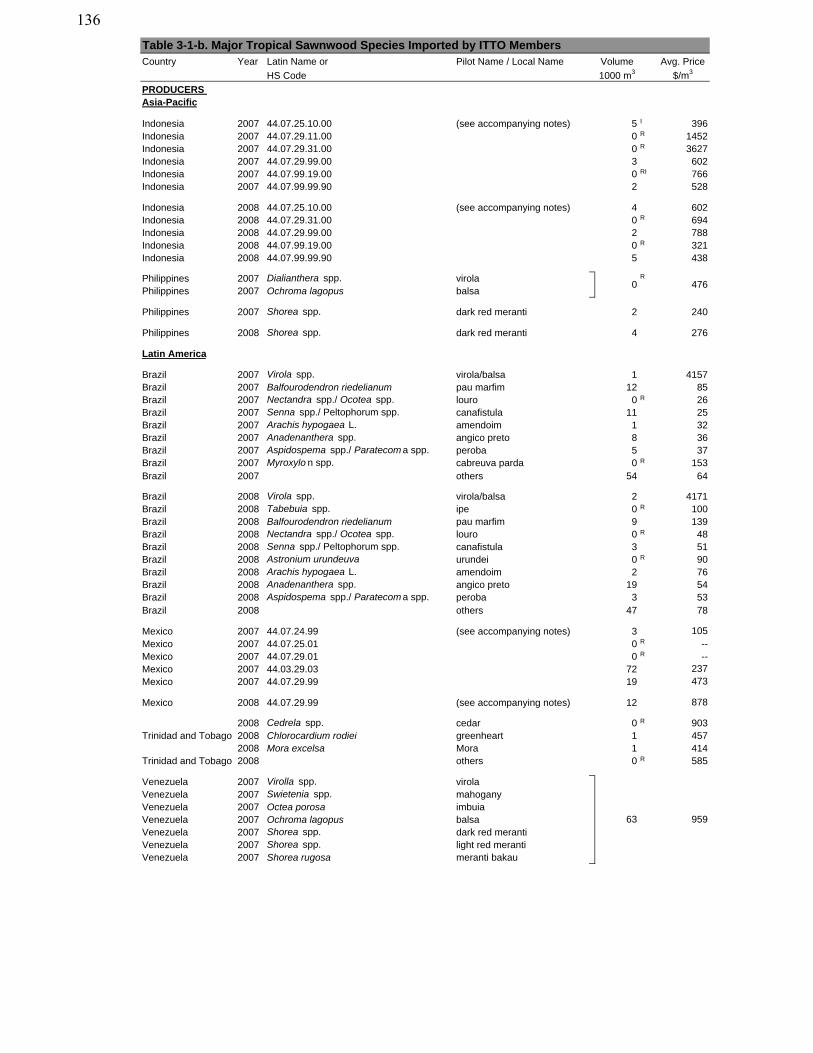
Country Year Latin Name or Pilot Name / Local Name Volume Avg. Price
HS Code 1000 m3 $/m3
Table 3-1-b. Major Tropical Sawnwood Species Imported by ITTO Members
PRODUCERS Asia-Pacific
Indonesia 2007 44.07.25.10.00 (see accompanying notes) 5 I 396Indonesia 2007 44.07.29.11.00 0 R 1452Indonesia 2007 44.07.29.31.00 0 R 3627Indonesia 2007 44.07.29.99.00 3 602Indonesia 2007 44.07.99.19.00 0 RI 766Indonesia 2007 44.07.99.99.90 2 528
Indonesia 2008 44.07.25.10.00 (see accompanying notes) 4 602Indonesia 2008 44.07.29.31.00 0 R 694Indonesia 2008 44.07.29.99.00 2 788Indonesia 2008 44.07.99.19.00 0 R 321Indonesia 2008 44.07.99.99.90 5 438
Philippines 2007 Dialianthera spp. virolaPhilippines 2007 Ochroma lagopus balsa
Philippines 2007 Shorea spp. dark red meranti 2 240
Philippines 2008 Shorea spp. dark red meranti 4 276
Latin America
Brazil 2007 Virola spp. virola/balsa 1 4157Brazil 2007 Balfourodendron riedelianum pau marfim 12 85Brazil 2007 Nectandra spp./ Ocotea spp. louro 0 R 26Brazil 2007 Senna spp./ Peltophorum spp. canafistula 11 25Brazil 2007 Arachis hypogaea L. amendoim 1 32Brazil 2007 Anadenanthera spp. angico preto 8 36Brazil 2007 Aspidospema spp./ Paratecom a spp. peroba 5 37Brazil 2007 Myroxylo n spp. cabreuva parda 0 R 153Brazil 2007 others 54 64
Brazil 2008 Virola spp. virola/balsa 2 4171Brazil 2008 Tabebuia spp. ipe 0 R 100Brazil 2008 Balfourodendron riedelianum pau marfim 9 139Brazil 2008 Nectandra spp./ Ocotea spp. louro 0 R 48Brazil 2008 Senna spp./ Peltophorum spp. canafistula 3 51Brazil 2008 Astronium urundeuva urundei 0 R 90Brazil 2008 Arachis hypogaea L. amendoim 2 76Brazil 2008 Anadenanthera spp. angico preto 19 54Brazil 2008 Aspidospema spp./ Paratecom a spp. peroba 3 53Brazil 2008 others 47 78
Mexico 2007 44.07.24.99 (see accompanying notes) 3 105Mexico 2007 44.07.25.01 0 R --Mexico 2007 44.07.29.01 0 R --Mexico 2007 44.03.29.03 72 237Mexico 2007 44.07.29.99 19 473
Mexico 2008 44.07.29.99 (see accompanying notes) 12 878
2008 Cedrela spp. cedar 0 R 9032008 Chlorocardium rodiei greenheart 1 4572008 Mora excelsa Mora 1 4142008 others 0 R 585
Venezuela 2007 Virolla spp. virolaVenezuela 2007 Swietenia spp. mahoganyVenezuela 2007 Octea porosa imbuiaVenezuela 2007 Ochroma lagopus balsaVenezuela 2007 Shorea spp. dark red merantiVenezuela 2007 Shorea spp. light red merantiVenezuela 2007 Shorea rugosa meranti bakau
Trinidad and Tobago
Trinidad and Tobago
R
63 959
0 476
136
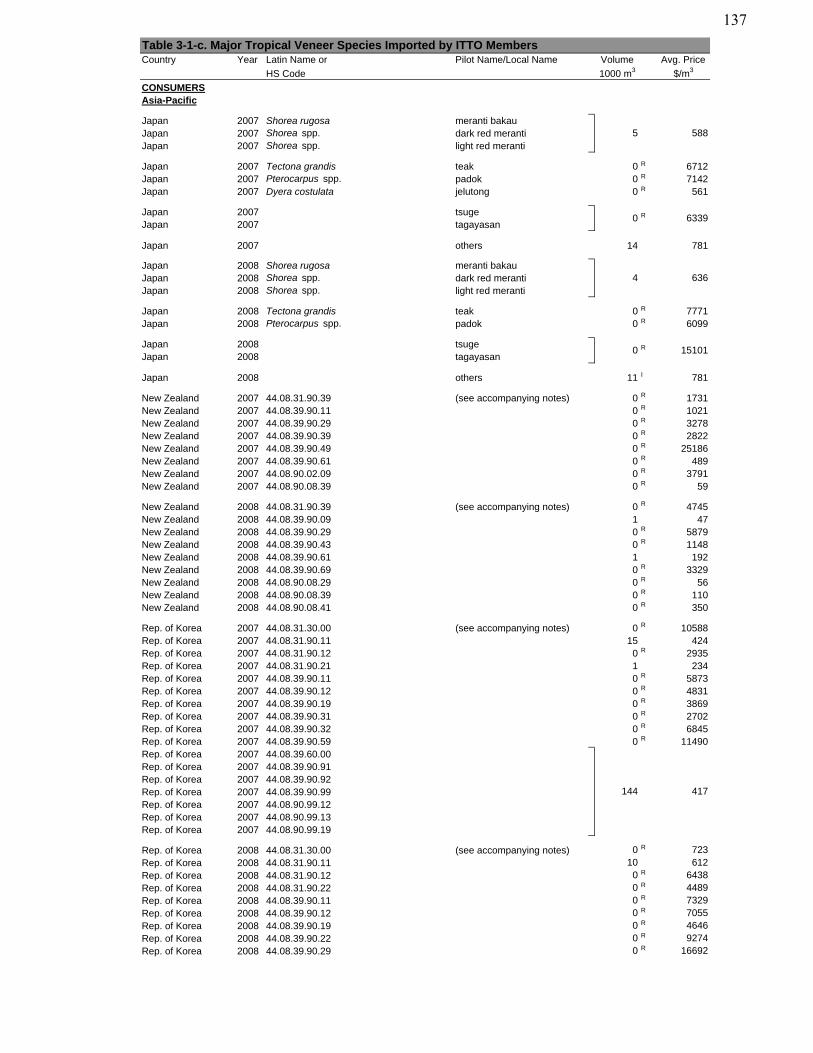
Country Year Latin Name or Pilot Name/Local Name Volume Avg. Price
HS Code 1000 m3 $/m3
CONSUMERSAsia-Pacific
Japan 2007 Shorea rugosa meranti bakauJapan 2007 Shorea spp. dark red merantiJapan 2007 Shorea spp. light red meranti
Japan 2007 Tectona grandis teak 0 R 6712Japan 2007 Pterocarpus spp. padok 0 R 7142Japan 2007 Dyera costulata jelutong 0 R 561
Japan 2007 tsugeJapan 2007 tagayasan
Japan 2007 others 14 781
Japan 2008 Shorea rugosa meranti bakauJapan 2008 Shorea spp. dark red merantiJapan 2008 Shorea spp. light red meranti
Japan 2008 Tectona grandis teak 0 R 7771Japan 2008 Pterocarpus spp. padok 0 R 6099
Japan 2008 tsugeJapan 2008 tagayasan
Japan 2008 others 11 I 781
New Zealand 2007 44.08.31.90.39 (see accompanying notes) 0 R 1731New Zealand 2007 44.08.39.90.11 0 R 1021New Zealand 2007 44.08.39.90.29 0 R 3278New Zealand 2007 44.08.39.90.39 0 R 2822New Zealand 2007 44.08.39.90.49 0 R 25186New Zealand 2007 44.08.39.90.61 0 R 489New Zealand 2007 44.08.90.02.09 0 R 3791New Zealand 2007 44.08.90.08.39 0 R 59
New Zealand 2008 44.08.31.90.39 (see accompanying notes) 0 R 4745New Zealand 2008 44.08.39.90.09 1 47New Zealand 2008 44.08.39.90.29 0 R 5879New Zealand 2008 44.08.39.90.43 0 R 1148New Zealand 2008 44.08.39.90.61 1 192New Zealand 2008 44.08.39.90.69 0 R 3329New Zealand 2008 44.08.90.08.29 0 R 56New Zealand 2008 44.08.90.08.39 0 R 110New Zealand 2008 44.08.90.08.41 0 R 350
Rep. of Korea 2007 44.08.31.30.00 (see accompanying notes) 0 R 10588Rep. of Korea 2007 44.08.31.90.11 15 424Rep. of Korea 2007 44.08.31.90.12 0 R 2935Rep. of Korea 2007 44.08.31.90.21 1 234Rep. of Korea 2007 44.08.39.90.11 0 R 5873Rep. of Korea 2007 44.08.39.90.12 0 R 4831Rep. of Korea 2007 44.08.39.90.19 0 R 3869Rep. of Korea 2007 44.08.39.90.31 0 R 2702Rep. of Korea 2007 44.08.39.90.32 0 R 6845Rep. of Korea 2007 44.08.39.90.59 0 R 11490Rep. of Korea 2007 44.08.39.60.00Rep. of Korea 2007 44.08.39.90.91Rep. of Korea 2007 44.08.39.90.92Rep. of Korea 2007 44.08.39.90.99Rep. of Korea 2007 44.08.90.99.12Rep. of Korea 2007 44.08.90.99.13Rep. of Korea 2007 44.08.90.99.19
Rep. of Korea 2008 44.08.31.30.00 (see accompanying notes) 0 R 723Rep. of Korea 2008 44.08.31.90.11 10 612Rep. of Korea 2008 44.08.31.90.12 0 R 6438Rep. of Korea 2008 44.08.31.90.22 0 R 4489Rep. of Korea 2008 44.08.39.90.11 0 R 7329Rep. of Korea 2008 44.08.39.90.12 0 R 7055Rep. of Korea 2008 44.08.39.90.19 0 R 4646Rep. of Korea 2008 44.08.39.90.22 0 R 9274Rep. of Korea 2008 44.08.39.90.29 0 R 16692
R 6339
5 588
0
4
Table 3-1-c. Major Tropical Veneer Species Imported by ITTO Members
144 417
636
0 R 15101
137
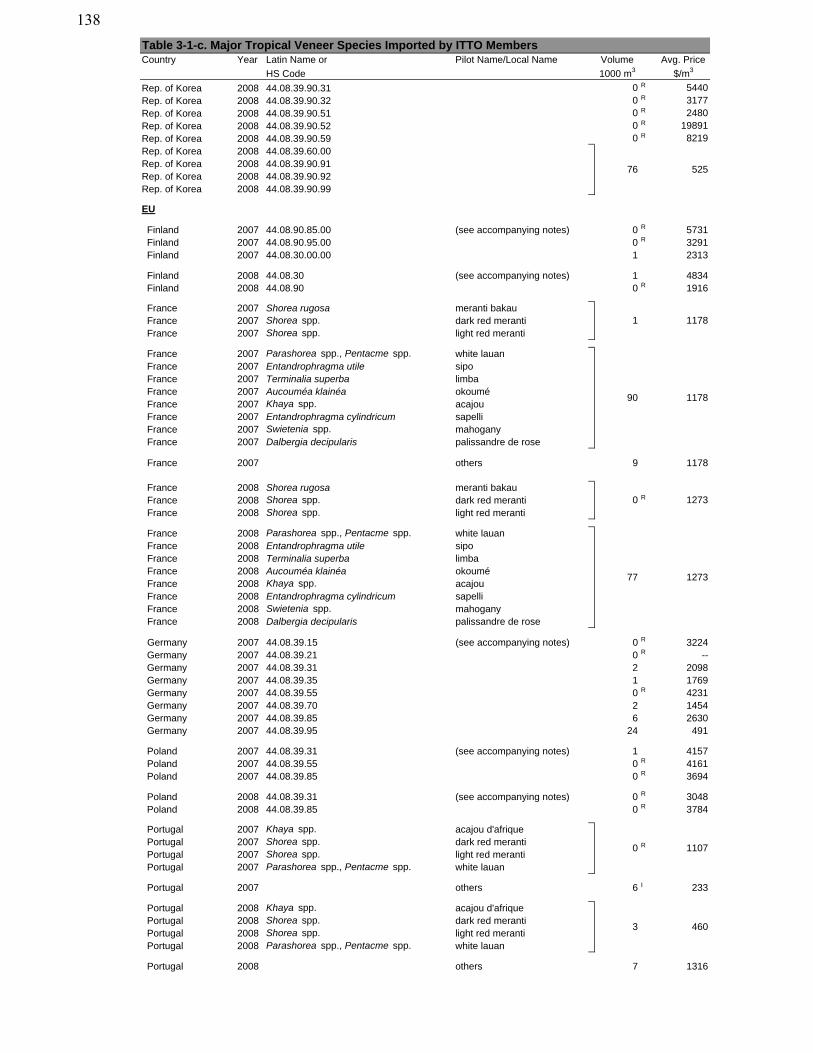
Country Year Latin Name or Pilot Name/Local Name Volume Avg. Price
HS Code 1000 m3 $/m3
Table 3-1-c. Major Tropical Veneer Species Imported by ITTO Members
Rep. of Korea 2008 44.08.39.90.31 0 R 5440Rep. of Korea 2008 44.08.39.90.32 0 R 3177Rep. of Korea 2008 44.08.39.90.51 0 R 2480Rep. of Korea 2008 44.08.39.90.52 0 R 19891Rep. of Korea 2008 44.08.39.90.59 0 R 8219Rep. of Korea 2008 44.08.39.60.00Rep. of Korea 2008 44.08.39.90.91Rep. of Korea 2008 44.08.39.90.92Rep. of Korea 2008 44.08.39.90.99
EU
Finland 2007 44.08.90.85.00 (see accompanying notes) 0 R 5731Finland 2007 44.08.90.95.00 0 R 3291Finland 2007 44.08.30.00.00 1 2313
Finland 2008 44.08.30 (see accompanying notes) 1 4834Finland 2008 44.08.90 0 R 1916
France 2007 Shorea rugosa meranti bakauFrance 2007 Shorea spp. dark red merantiFrance 2007 Shorea spp. light red meranti
France 2007 Parashorea spp., Pentacme spp. white lauanFrance 2007 Entandrophragma utile sipoFrance 2007 Terminalia superba limbaFrance 2007 Aucouméa klainéa okouméFrance 2007 Khaya spp. acajouFrance 2007 Entandrophragma cylindricum sapelliFrance 2007 Swietenia spp. mahoganyFrance 2007 Dalbergia decipularis palissandre de rose
France 2007 others 9 1178
France 2008 Shorea rugosa meranti bakauFrance 2008 Shorea spp. dark red merantiFrance 2008 Shorea spp. light red meranti
France 2008 Parashorea spp., Pentacme spp. white lauanFrance 2008 Entandrophragma utile sipoFrance 2008 Terminalia superba limbaFrance 2008 Aucouméa klainéa okouméFrance 2008 Khaya spp. acajouFrance 2008 Entandrophragma cylindricum sapelliFrance 2008 Swietenia spp. mahoganyFrance 2008 Dalbergia decipularis palissandre de rose
Germany 2007 44.08.39.15 (see accompanying notes) 0 R 3224Germany 2007 44.08.39.21 0 R --Germany 2007 44.08.39.31 2 2098Germany 2007 44.08.39.35 1 1769Germany 2007 44.08.39.55 0 R 4231Germany 2007 44.08.39.70 2 1454Germany 2007 44.08.39.85 6 2630Germany 2007 44.08.39.95 24 491
Poland 2007 44.08.39.31 (see accompanying notes) 1 4157Poland 2007 44.08.39.55 0 R 4161Poland 2007 44.08.39.85 0 R 3694
Poland 2008 44.08.39.31 (see accompanying notes) 0 R 3048Poland 2008 44.08.39.85 0 R 3784
Portugal 2007 Khaya spp. acajou d'afriquePortugal 2007 Shorea spp. dark red merantiPortugal 2007 Shorea spp. light red merantiPortugal 2007 Parashorea spp., Pentacme spp. white lauan
Portugal 2007 others 6 I 233
Portugal 2008 Khaya spp. acajou d'afriquePortugal 2008 Shorea spp. dark red merantiPortugal 2008 Shorea spp. light red merantiPortugal 2008 Parashorea spp., Pentacme spp. white lauan
Portugal 2008 others 7 1316
0 R 1273
1
90
3 460
1178
77 1273
76 525
1178
0 1107R
138
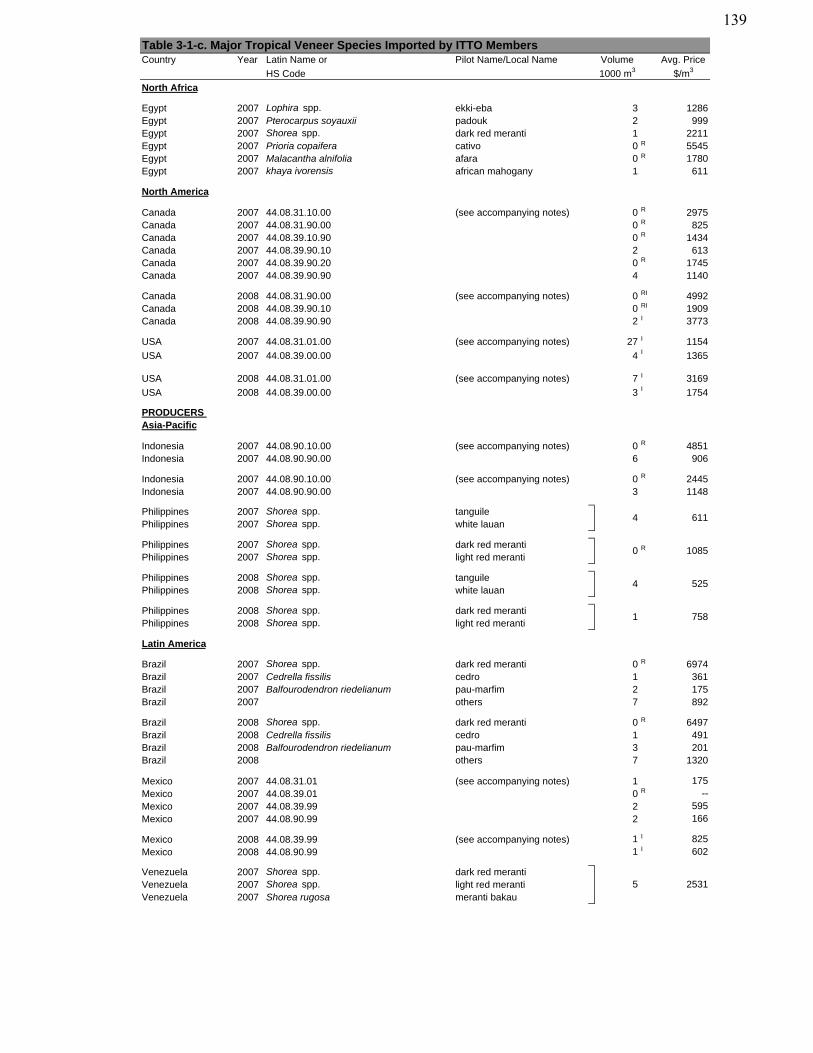
Country Year Latin Name or Pilot Name/Local Name Volume Avg. Price
HS Code 1000 m3 $/m3
Table 3-1-c. Major Tropical Veneer Species Imported by ITTO Members
North Africa
Egypt 2007 Lophira spp. ekki-eba 3 1286Egypt 2007 Pterocarpus soyauxii padouk 2 999Egypt 2007 Shorea spp. dark red meranti 1 2211Egypt 2007 Prioria copaifera cativo 0 R 5545Egypt 2007 Malacantha alnifolia afara 0 R 1780Egypt 2007 khaya ivorensis african mahogany 1 611
North America
Canada 2007 44.08.31.10.00 (see accompanying notes) 0 R 2975Canada 2007 44.08.31.90.00 0 R 825Canada 2007 44.08.39.10.90 0 R 1434Canada 2007 44.08.39.90.10 2 613Canada 2007 44.08.39.90.20 0 R 1745Canada 2007 44.08.39.90.90 4 1140
Canada 2008 44.08.31.90.00 (see accompanying notes) 0 RI 4992Canada 2008 44.08.39.90.10 0 RI 1909Canada 2008 44.08.39.90.90 2 I 3773
USA 2007 44.08.31.01.00 (see accompanying notes) 27 I 1154
USA 2007 44.08.39.00.00 4 I 1365
USA 2008 44.08.31.01.00 (see accompanying notes) 7 I 3169
USA 2008 44.08.39.00.00 3 I 1754
PRODUCERS Asia-Pacific
Indonesia 2007 44.08.90.10.00 (see accompanying notes) 0 R 4851Indonesia 2007 44.08.90.90.00 6 906
Indonesia 2007 44.08.90.10.00 (see accompanying notes) 0 R 2445Indonesia 2007 44.08.90.90.00 3 1148
Philippines 2007 Shorea spp. tanguilePhilippines 2007 Shorea spp. white lauan
Philippines 2007 Shorea spp. dark red merantiPhilippines 2007 Shorea spp. light red meranti
Philippines 2008 Shorea spp. tanguilePhilippines 2008 Shorea spp. white lauan
Philippines 2008 Shorea spp. dark red merantiPhilippines 2008 Shorea spp. light red meranti
Latin America
Brazil 2007 Shorea spp. dark red meranti 0 R 6974Brazil 2007 Cedrella fissilis cedro 1 361Brazil 2007 Balfourodendron riedelianum pau-marfim 2 175Brazil 2007 others 7 892
Brazil 2008 Shorea spp. dark red meranti 0 R 6497Brazil 2008 Cedrella fissilis cedro 1 491Brazil 2008 Balfourodendron riedelianum pau-marfim 3 201Brazil 2008 others 7 1320
Mexico 2007 44.08.31.01 (see accompanying notes) 1 175Mexico 2007 44.08.39.01 0 R --Mexico 2007 44.08.39.99 2 595Mexico 2007 44.08.90.99 2 166
Mexico 2008 44.08.39.99 (see accompanying notes) 1 I 825Mexico 2008 44.08.90.99 1 I 602
Venezuela 2007 Shorea spp. dark red merantiVenezuela 2007 Shorea spp. light red merantiVenezuela 2007 Shorea rugosa meranti bakau
5 2531
0 1085R
4 525
1 758
4 611
139
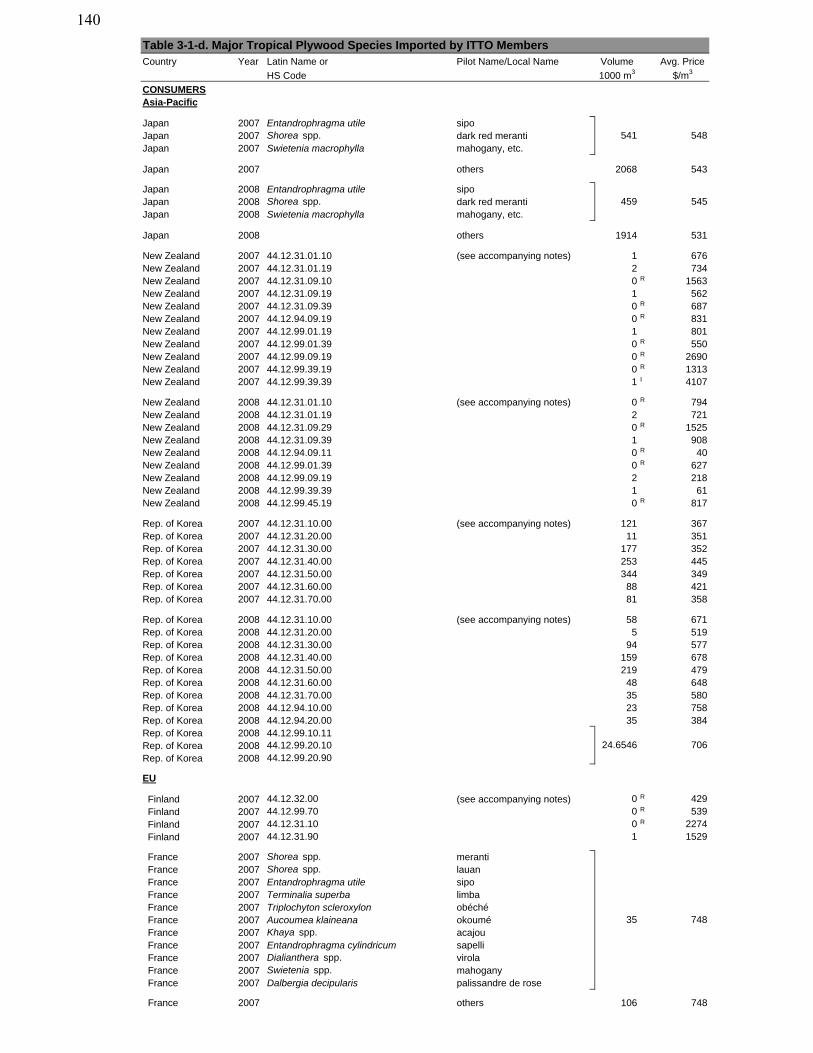
Country Year Latin Name or Pilot Name/Local Name Volume Avg. Price
HS Code 1000 m3 $/m3
CONSUMERSAsia-Pacific
Japan 2007 Entandrophragma utile sipoJapan 2007 Shorea spp. dark red merantiJapan 2007 Swietenia macrophylla mahogany, etc.
Japan 2007 others 2068 543
Japan 2008 Entandrophragma utile sipoJapan 2008 Shorea spp. dark red merantiJapan 2008 Swietenia macrophylla mahogany, etc.
Japan 2008 others 1914 531
New Zealand 2007 44.12.31.01.10 (see accompanying notes) 1 676New Zealand 2007 44.12.31.01.19 2 734New Zealand 2007 44.12.31.09.10 0 R 1563New Zealand 2007 44.12.31.09.19 1 562New Zealand 2007 44.12.31.09.39 0 R 687New Zealand 2007 44.12.94.09.19 0 R 831New Zealand 2007 44.12.99.01.19 1 801New Zealand 2007 44.12.99.01.39 0 R 550New Zealand 2007 44.12.99.09.19 0 R 2690New Zealand 2007 44.12.99.39.19 0 R 1313New Zealand 2007 44.12.99.39.39 1 I 4107
New Zealand 2008 44.12.31.01.10 (see accompanying notes) 0 R 794New Zealand 2008 44.12.31.01.19 2 721New Zealand 2008 44.12.31.09.29 0 R 1525New Zealand 2008 44.12.31.09.39 1 908New Zealand 2008 44.12.94.09.11 0 R 40New Zealand 2008 44.12.99.01.39 0 R 627New Zealand 2008 44.12.99.09.19 2 218New Zealand 2008 44.12.99.39.39 1 61New Zealand 2008 44.12.99.45.19 0 R 817
Rep. of Korea 2007 44.12.31.10.00 (see accompanying notes) 121 367Rep. of Korea 2007 44.12.31.20.00 11 351Rep. of Korea 2007 44.12.31.30.00 177 352Rep. of Korea 2007 44.12.31.40.00 253 445Rep. of Korea 2007 44.12.31.50.00 344 349Rep. of Korea 2007 44.12.31.60.00 88 421Rep. of Korea 2007 44.12.31.70.00 81 358
Rep. of Korea 2008 44.12.31.10.00 (see accompanying notes) 58 671Rep. of Korea 2008 44.12.31.20.00 5 519Rep. of Korea 2008 44.12.31.30.00 94 577Rep. of Korea 2008 44.12.31.40.00 159 678Rep. of Korea 2008 44.12.31.50.00 219 479Rep. of Korea 2008 44.12.31.60.00 48 648Rep. of Korea 2008 44.12.31.70.00 35 580Rep. of Korea 2008 44.12.94.10.00 23 758Rep. of Korea 2008 44.12.94.20.00 35 384Rep. of Korea 2008 44.12.99.10.11Rep. of Korea 2008 44.12.99.20.10Rep. of Korea 2008 44.12.99.20.90
EU
Finland 2007 44.12.32.00 (see accompanying notes) 0 R 429Finland 2007 44.12.99.70 0 R 539Finland 2007 44.12.31.10 0 R 2274Finland 2007 44.12.31.90 1 1529
France 2007 Shorea spp. merantiFrance 2007 Shorea spp. lauanFrance 2007 Entandrophragma utile sipoFrance 2007 Terminalia superba limbaFrance 2007 Triplochyton scleroxylon obéchéFrance 2007 Aucoumea klaineana okouméFrance 2007 Khaya spp. acajouFrance 2007 Entandrophragma cylindricum sapelliFrance 2007 Dialianthera spp. virolaFrance 2007 Swietenia spp. mahoganyFrance 2007 Dalbergia decipularis palissandre de rose
France 2007 others 106 748
545
24.6546 706
Table 3-1-d. Major Tropical Plywood Species Imported by ITTO Members
541 548
35 748
459
140
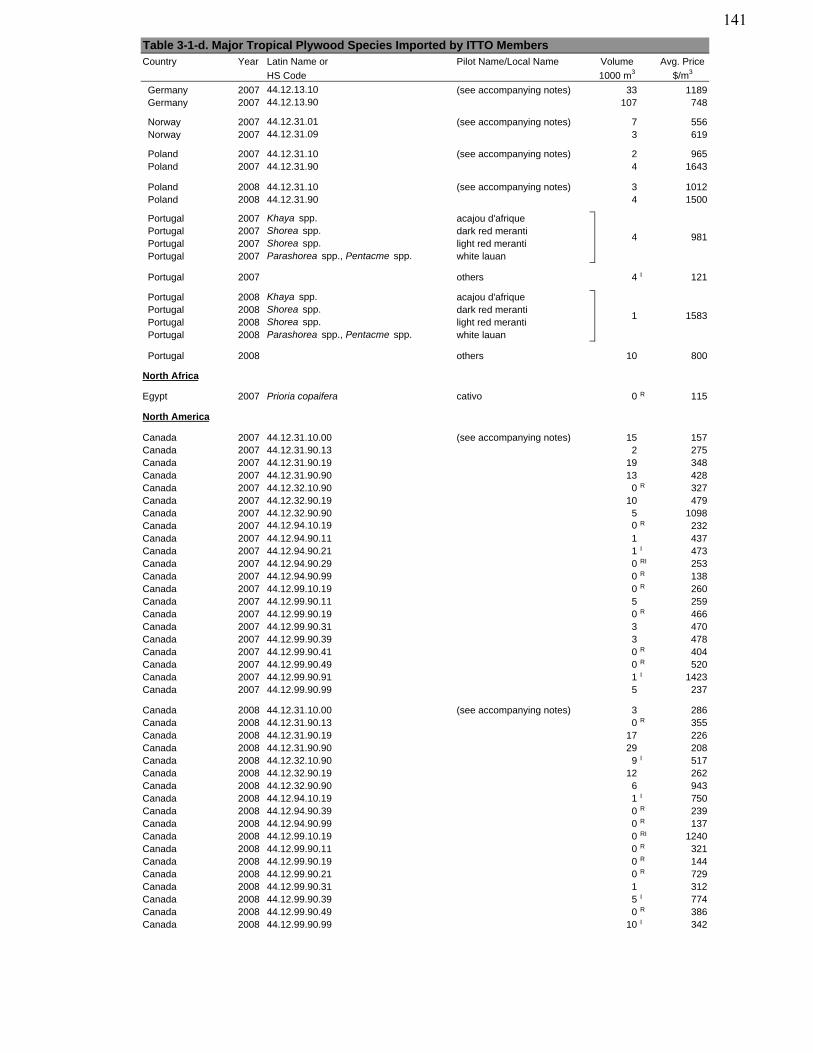
Country Year Latin Name or Pilot Name/Local Name Volume Avg. Price
HS Code 1000 m3 $/m3
Table 3-1-d. Major Tropical Plywood Species Imported by ITTO Members
Germany 2007 44.12.13.10 (see accompanying notes) 33 1189Germany 2007 44.12.13.90 107 748
Norway 2007 44.12.31.01 (see accompanying notes) 7 556Norway 2007 44.12.31.09 3 619
Poland 2007 44.12.31.10 (see accompanying notes) 2 965Poland 2007 44.12.31.90 4 1643
Poland 2008 44.12.31.10 (see accompanying notes) 3 1012Poland 2008 44.12.31.90 4 1500
Portugal 2007 Khaya spp. acajou d'afriquePortugal 2007 Shorea spp. dark red merantiPortugal 2007 Shorea spp. light red merantiPortugal 2007 Parashorea spp., Pentacme spp. white lauan
Portugal 2007 others 4 I 121
Portugal 2008 Khaya spp. acajou d'afriquePortugal 2008 Shorea spp. dark red merantiPortugal 2008 Shorea spp. light red merantiPortugal 2008 Parashorea spp., Pentacme spp. white lauan
Portugal 2008 others 10 800
North Africa
Egypt 2007 Prioria copaifera cativo 0 R 115
North America
Canada 2007 44.12.31.10.00 (see accompanying notes) 15 157Canada 2007 44.12.31.90.13 2 275Canada 2007 44.12.31.90.19 19 348Canada 2007 44.12.31.90.90 13 428Canada 2007 44.12.32.10.90 0 R 327Canada 2007 44.12.32.90.19 10 479Canada 2007 44.12.32.90.90 5 1098Canada 2007 44.12.94.10.19 0 R 232Canada 2007 44.12.94.90.11 1 437Canada 2007 44.12.94.90.21 1 I 473Canada 2007 44.12.94.90.29 0 RI 253Canada 2007 44.12.94.90.99 0 R 138Canada 2007 44.12.99.10.19 0 R 260Canada 2007 44.12.99.90.11 5 259Canada 2007 44.12.99.90.19 0 R 466Canada 2007 44.12.99.90.31 3 470Canada 2007 44.12.99.90.39 3 478Canada 2007 44.12.99.90.41 0 R 404Canada 2007 44.12.99.90.49 0 R 520Canada 2007 44.12.99.90.91 1 I 1423Canada 2007 44.12.99.90.99 5 237
Canada 2008 44.12.31.10.00 (see accompanying notes) 3 286Canada 2008 44.12.31.90.13 0 R 355Canada 2008 44.12.31.90.19 17 226Canada 2008 44.12.31.90.90 29 208Canada 2008 44.12.32.10.90 9 I 517Canada 2008 44.12.32.90.19 12 262Canada 2008 44.12.32.90.90 6 943Canada 2008 44.12.94.10.19 1 I 750Canada 2008 44.12.94.90.39 0 R 239Canada 2008 44.12.94.90.99 0 R 137Canada 2008 44.12.99.10.19 0 RI 1240Canada 2008 44.12.99.90.11 0 R 321Canada 2008 44.12.99.90.19 0 R 144Canada 2008 44.12.99.90.21 0 R 729Canada 2008 44.12.99.90.31 1 312Canada 2008 44.12.99.90.39 5 I 774Canada 2008 44.12.99.90.49 0 R 386Canada 2008 44.12.99.90.99 10 I 342
1 1583
4 981
141
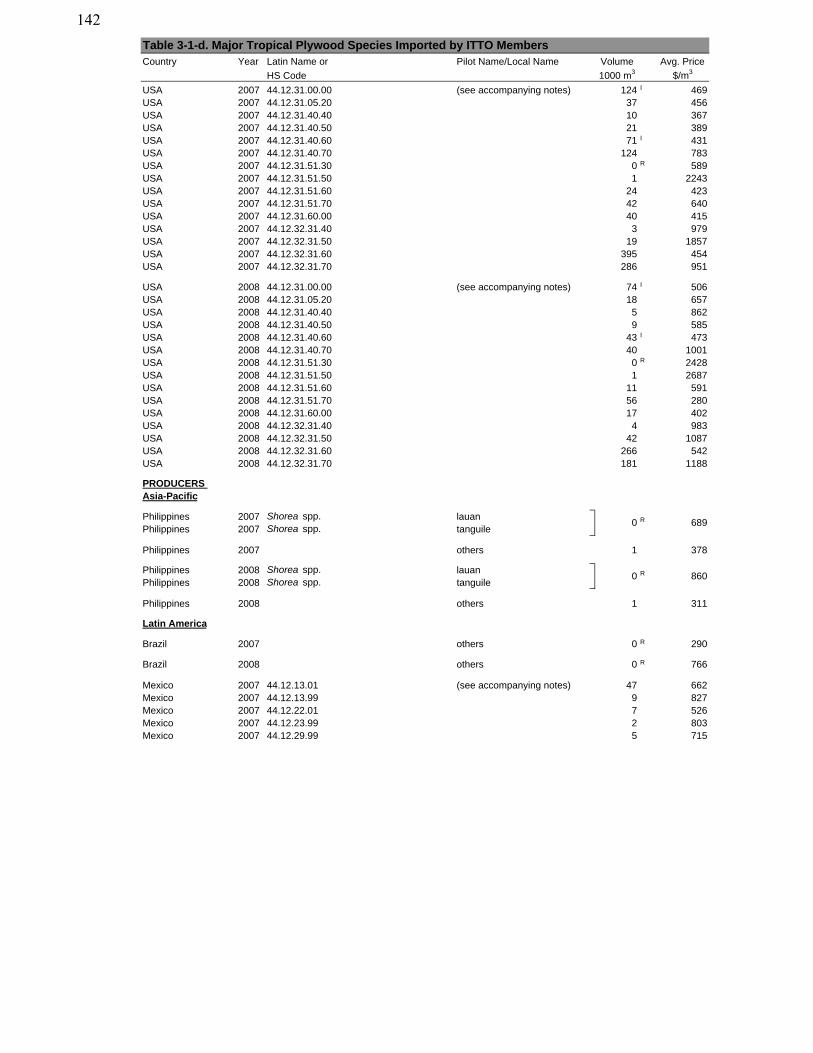
Country Year Latin Name or Pilot Name/Local Name Volume Avg. Price
HS Code 1000 m3 $/m3
Table 3-1-d. Major Tropical Plywood Species Imported by ITTO Members
USA 2007 44.12.31.00.00 (see accompanying notes) 124 I 469USA 2007 44.12.31.05.20 37 456USA 2007 44.12.31.40.40 10 367USA 2007 44.12.31.40.50 21 389USA 2007 44.12.31.40.60 71 I 431USA 2007 44.12.31.40.70 124 783USA 2007 44.12.31.51.30 0 R 589USA 2007 44.12.31.51.50 1 2243USA 2007 44.12.31.51.60 24 423USA 2007 44.12.31.51.70 42 640USA 2007 44.12.31.60.00 40 415USA 2007 44.12.32.31.40 3 979USA 2007 44.12.32.31.50 19 1857USA 2007 44.12.32.31.60 395 454USA 2007 44.12.32.31.70 286 951
USA 2008 44.12.31.00.00 (see accompanying notes) 74 I 506USA 2008 44.12.31.05.20 18 657USA 2008 44.12.31.40.40 5 862USA 2008 44.12.31.40.50 9 585USA 2008 44.12.31.40.60 43 I 473USA 2008 44.12.31.40.70 40 1001USA 2008 44.12.31.51.30 0 R 2428USA 2008 44.12.31.51.50 1 2687USA 2008 44.12.31.51.60 11 591USA 2008 44.12.31.51.70 56 280USA 2008 44.12.31.60.00 17 402USA 2008 44.12.32.31.40 4 983USA 2008 44.12.32.31.50 42 1087USA 2008 44.12.32.31.60 266 542USA 2008 44.12.32.31.70 181 1188
PRODUCERS Asia-Pacific
Philippines 2007 Shorea spp. lauanPhilippines 2007 Shorea spp. tanguile
Philippines 2007 others 1 378
Philippines 2008 Shorea spp. lauanPhilippines 2008 Shorea spp. tanguile
Philippines 2008 others 1 311
Latin America
Brazil 2007 others 0 R 290
Brazil 2008 others 0 R 766
Mexico 2007 44.12.13.01 (see accompanying notes) 47 662Mexico 2007 44.12.13.99 9 827Mexico 2007 44.12.22.01 7 526Mexico 2007 44.12.23.99 2 803Mexico 2007 44.12.29.99 5 715
0 R 860
0 R 689
142
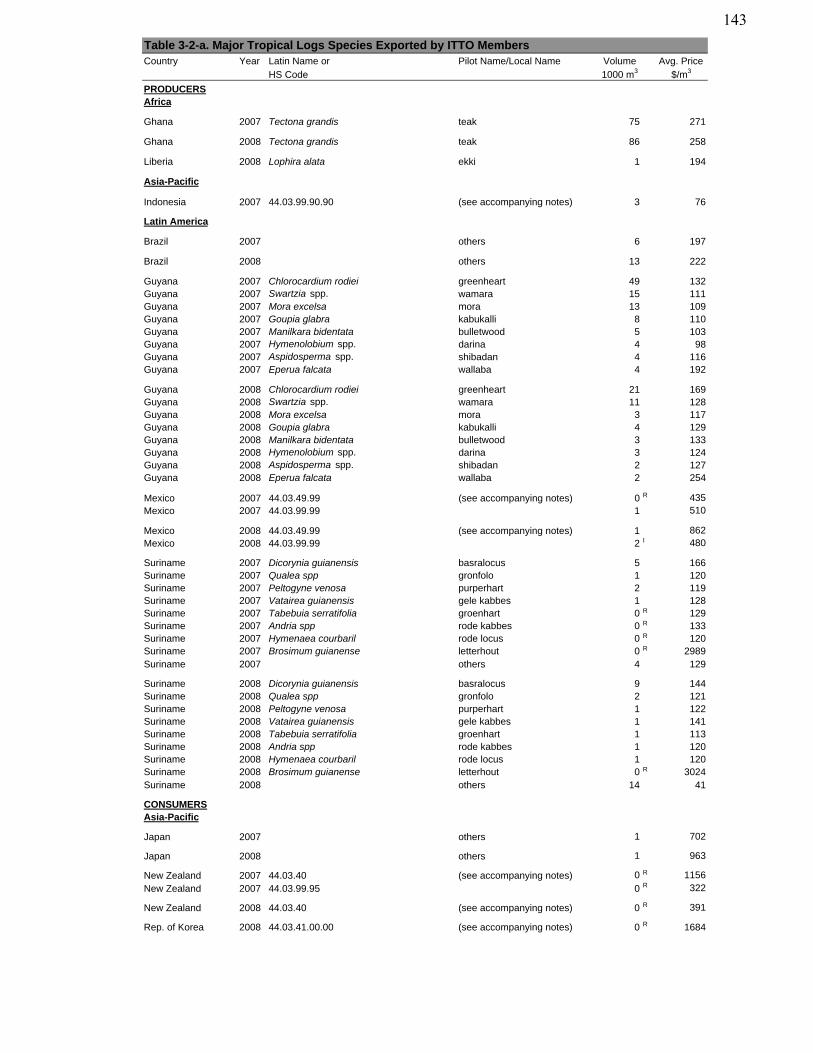
Country Year Latin Name or Pilot Name/Local Name Volume Avg. PriceHS Code 1000 m3 $/m3
PRODUCERSAfrica
Ghana 2007 Tectona grandis teak 75 271
Ghana 2008 Tectona grandis teak 86 258
Liberia 2008 Lophira alata ekki 1 194
Asia-Pacific
Indonesia 2007 44.03.99.90.90 (see accompanying notes) 3 76
Latin America
Brazil 2007 others 6 197
Brazil 2008 others 13 222
Guyana 2007 Chlorocardium rodiei greenheart 49 132Guyana 2007 Swartzia spp. wamara 15 111Guyana 2007 Mora excelsa mora 13 109Guyana 2007 Goupia glabra kabukalli 8 110Guyana 2007 Manilkara bidentata bulletwood 5 103Guyana 2007 Hymenolobium spp. darina 4 98Guyana 2007 Aspidosperma spp. shibadan 4 116Guyana 2007 Eperua falcata wallaba 4 192
Guyana 2008 Chlorocardium rodiei greenheart 21 169Guyana 2008 Swartzia spp. wamara 11 128Guyana 2008 Mora excelsa mora 3 117Guyana 2008 Goupia glabra kabukalli 4 129Guyana 2008 Manilkara bidentata bulletwood 3 133Guyana 2008 Hymenolobium spp. darina 3 124Guyana 2008 Aspidosperma spp. shibadan 2 127Guyana 2008 Eperua falcata wallaba 2 254
Mexico 2007 44.03.49.99 (see accompanying notes) 0 R 435Mexico 2007 44.03.99.99 1 510
Mexico 2008 44.03.49.99 (see accompanying notes) 1 862Mexico 2008 44.03.99.99 2 I 480
Suriname 2007 Dicorynia guianensis basralocus 5 166Suriname 2007 Qualea spp gronfolo 1 120Suriname 2007 Peltogyne venosa purperhart 2 119Suriname 2007 Vatairea guianensis gele kabbes 1 128Suriname 2007 Tabebuia serratifolia groenhart 0 R 129Suriname 2007 Andria spp rode kabbes 0 R 133Suriname 2007 Hymenaea courbaril rode locus 0 R 120Suriname 2007 Brosimum guianense letterhout 0 R 2989Suriname 2007 others 4 129
Suriname 2008 Dicorynia guianensis basralocus 9 144Suriname 2008 Qualea spp gronfolo 2 121Suriname 2008 Peltogyne venosa purperhart 1 122Suriname 2008 Vatairea guianensis gele kabbes 1 141Suriname 2008 Tabebuia serratifolia groenhart 1 113Suriname 2008 Andria spp rode kabbes 1 120Suriname 2008 Hymenaea courbaril rode locus 1 120Suriname 2008 Brosimum guianense letterhout 0 R 3024Suriname 2008 others 14 41
CONSUMERSAsia-Pacific
Japan 2007 others 1 702
Japan 2008 others 1 963
New Zealand 2007 44.03.40 (see accompanying notes) 0 R 1156New Zealand 2007 44.03.99.95 0 R 322
New Zealand 2008 44.03.40 (see accompanying notes) 0 R 391
Rep. of Korea 2008 44.03.41.00.00 (see accompanying notes) 0 R 1684
Table 3-2-a. Major Tropical Logs Species Exported by ITTO Members
143
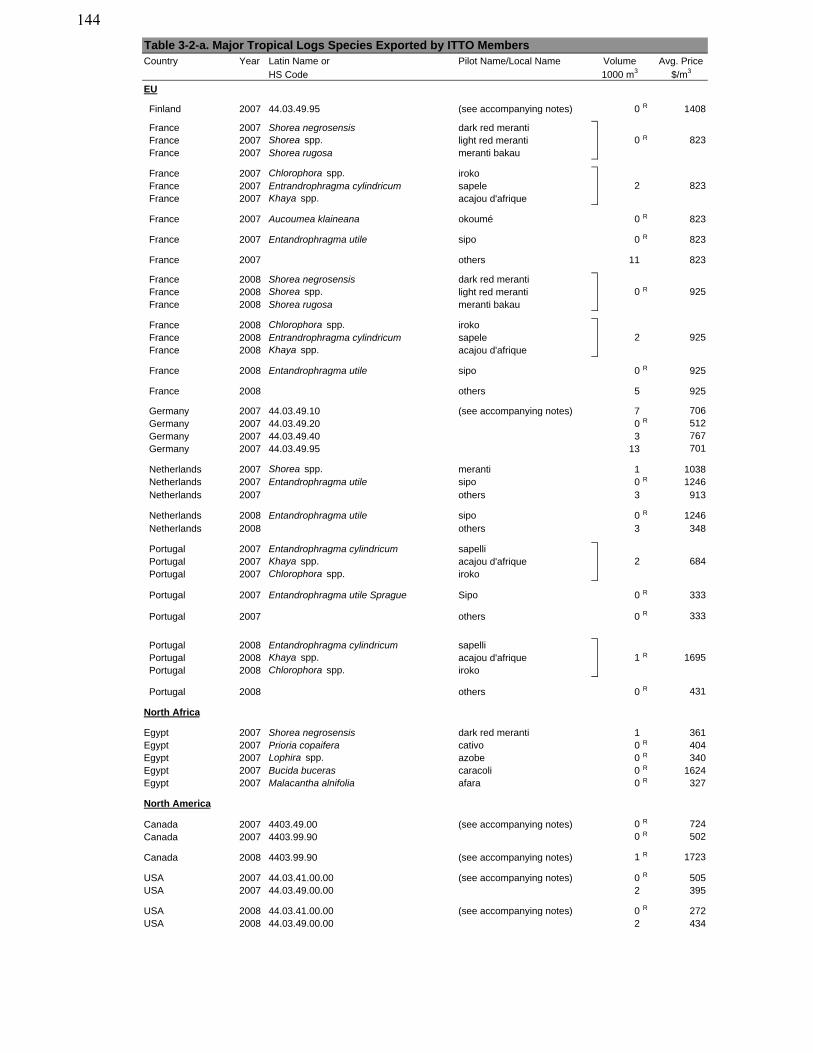
Country Year Latin Name or Pilot Name/Local Name Volume Avg. PriceHS Code 1000 m3 $/m3
Table 3-2-a. Major Tropical Logs Species Exported by ITTO Members
EU
Finland 2007 44.03.49.95 (see accompanying notes) 0 R 1408
France 2007 Shorea negrosensis dark red merantiFrance 2007 Shorea spp. light red meranti R
France 2007 Shorea rugosa meranti bakau
France 2007 Chlorophora spp. irokoFrance 2007 Entrandrophragma cylindricum sapeleFrance 2007 Khaya spp. acajou d'afrique
France 2007 Aucoumea klaineana okoumé 0 R 823
France 2007 Entandrophragma utile sipo 0 R 823
France 2007 others 11 823
France 2008 Shorea negrosensis dark red merantiFrance 2008 Shorea spp. light red meranti R
France 2008 Shorea rugosa meranti bakau
France 2008 Chlorophora spp. irokoFrance 2008 Entrandrophragma cylindricum sapeleFrance 2008 Khaya spp. acajou d'afrique
France 2008 Entandrophragma utile sipo 0 R 925
France 2008 others 5 925
Germany 2007 44.03.49.10 (see accompanying notes) 7 706Germany 2007 44.03.49.20 0 R 512Germany 2007 44.03.49.40 3 767Germany 2007 44.03.49.95 13 701
Netherlands 2007 Shorea spp. meranti 1 1038Netherlands 2007 Entandrophragma utile sipo 0 R 1246Netherlands 2007 others 3 913
Netherlands 2008 Entandrophragma utile sipo 0 R 1246Netherlands 2008 others 3 348
Portugal 2007 Entandrophragma cylindricum sapelliPortugal 2007 Khaya spp. acajou d'afriquePortugal 2007 Chlorophora spp. iroko
Portugal 2007 Entandrophragma utile Sprague Sipo 0 R 333
Portugal 2007 others 0 R 333
Portugal 2008 Entandrophragma cylindricum sapelliPortugal 2008 Khaya spp. acajou d'afrique R
Portugal 2008 Chlorophora spp. iroko
Portugal 2008 others 0 R 431
North Africa
Egypt 2007 Shorea negrosensis dark red meranti 1 361Egypt 2007 Prioria copaifera cativo 0 R 404Egypt 2007 Lophira spp. azobe 0 R 340Egypt 2007 Bucida buceras caracoli 0 R 1624Egypt 2007 Malacantha alnifolia afara 0 R 327
North America
Canada 2007 4403.49.00 (see accompanying notes) 0 R 724Canada 2007 4403.99.90 0 R 502
Canada 2008 4403.99.90 (see accompanying notes) 1 R 1723
USA 2007 44.03.41.00.00 (see accompanying notes) 0 R 505USA 2007 44.03.49.00.00 2 395
USA 2008 44.03.41.00.00 (see accompanying notes) 0 R 272USA 2008 44.03.49.00.00 2 434
823
2 925
1 1695
0 925
2 684
0 823
2
144
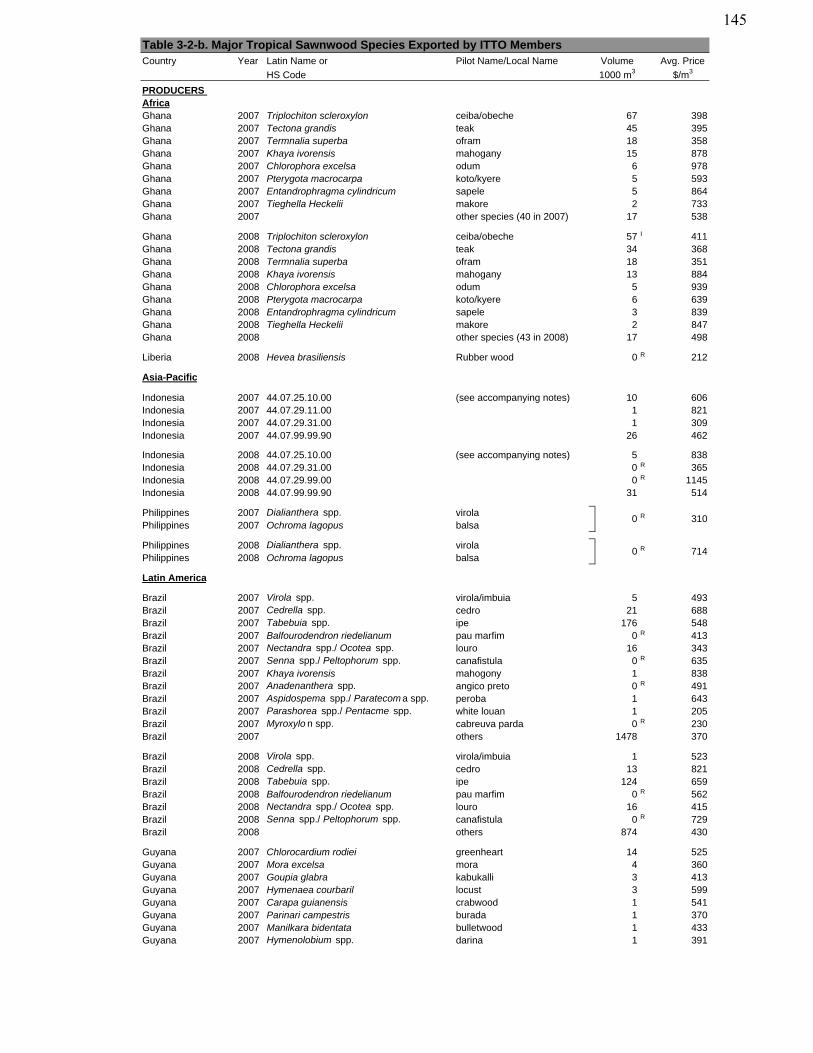
Country Year Latin Name or Pilot Name/Local Name Volume Avg. Price
HS Code 1000 m3 $/m3
PRODUCERS AfricaGhana 2007 Triplochiton scleroxylon ceiba/obeche 67 398Ghana 2007 Tectona grandis teak 45 395Ghana 2007 Termnalia superba ofram 18 358Ghana 2007 Khaya ivorensis mahogany 15 878Ghana 2007 Chlorophora excelsa odum 6 978Ghana 2007 Pterygota macrocarpa koto/kyere 5 593Ghana 2007 Entandrophragma cylindricum sapele 5 864Ghana 2007 Tieghella Heckelii makore 2 733Ghana 2007 other species (40 in 2007) 17 538
Ghana 2008 Triplochiton scleroxylon ceiba/obeche 57 I 411Ghana 2008 Tectona grandis teak 34 368Ghana 2008 Termnalia superba ofram 18 351Ghana 2008 Khaya ivorensis mahogany 13 884Ghana 2008 Chlorophora excelsa odum 5 939Ghana 2008 Pterygota macrocarpa koto/kyere 6 639Ghana 2008 Entandrophragma cylindricum sapele 3 839Ghana 2008 Tieghella Heckelii makore 2 847Ghana 2008 other species (43 in 2008) 17 498
Liberia 2008 Hevea brasiliensis Rubber wood 0 R 212
Asia-Pacific
Indonesia 2007 44.07.25.10.00 (see accompanying notes) 10 606Indonesia 2007 44.07.29.11.00 1 821Indonesia 2007 44.07.29.31.00 1 309Indonesia 2007 44.07.99.99.90 26 462
Indonesia 2008 44.07.25.10.00 (see accompanying notes) 5 838Indonesia 2008 44.07.29.31.00 0 R 365Indonesia 2008 44.07.29.99.00 0 R 1145Indonesia 2008 44.07.99.99.90 31 514
Philippines 2007 Dialianthera spp. virolaPhilippines 2007 Ochroma lagopus balsa
Philippines 2008 Dialianthera spp. virolaPhilippines 2008 Ochroma lagopus balsa
Latin America
Brazil 2007 Virola spp. virola/imbuia 5 493Brazil 2007 Cedrella spp. cedro 21 688Brazil 2007 Tabebuia spp. ipe 176 548Brazil 2007 Balfourodendron riedelianum pau marfim 0 R 413Brazil 2007 Nectandra spp./ Ocotea spp. louro 16 343Brazil 2007 Senna spp./ Peltophorum spp. canafistula 0 R 635Brazil 2007 Khaya ivorensis mahogony 1 838Brazil 2007 Anadenanthera spp. angico preto 0 R 491Brazil 2007 Aspidospema spp./ Paratecom a spp. peroba 1 643Brazil 2007 Parashorea spp./ Pentacme spp. white louan 1 205Brazil 2007 Myroxylo n spp. cabreuva parda 0 R 230Brazil 2007 others 1478 370
Brazil 2008 Virola spp. virola/imbuia 1 523Brazil 2008 Cedrella spp. cedro 13 821Brazil 2008 Tabebuia spp. ipe 124 659Brazil 2008 Balfourodendron riedelianum pau marfim 0 R 562Brazil 2008 Nectandra spp./ Ocotea spp. louro 16 415Brazil 2008 Senna spp./ Peltophorum spp. canafistula 0 R 729Brazil 2008 others 874 430
Guyana 2007 Chlorocardium rodiei greenheart 14 525Guyana 2007 Mora excelsa mora 4 360Guyana 2007 Goupia glabra kabukalli 3 413Guyana 2007 Hymenaea courbaril locust 3 599Guyana 2007 Carapa guianensis crabwood 1 541Guyana 2007 Parinari campestris burada 1 370Guyana 2007 Manilkara bidentata bulletwood 1 433Guyana 2007 Hymenolobium spp. darina 1 391
0 R 714
Table 3-2-b. Major Tropical Sawnwood Species Exported by ITTO Members
0 310R
145
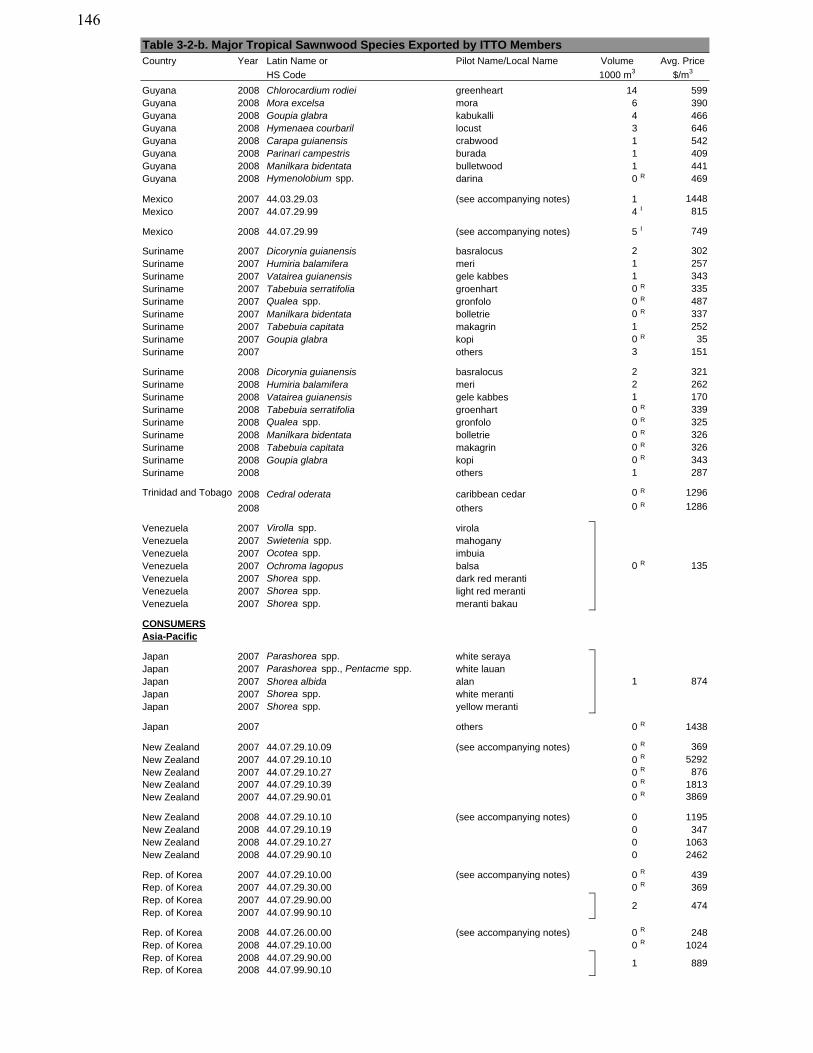
Country Year Latin Name or Pilot Name/Local Name Volume Avg. Price
HS Code 1000 m3 $/m3
Table 3-2-b. Major Tropical Sawnwood Species Exported by ITTO Members
Guyana 2008 Chlorocardium rodiei greenheart 14 599Guyana 2008 Mora excelsa mora 6 390Guyana 2008 Goupia glabra kabukalli 4 466Guyana 2008 Hymenaea courbaril locust 3 646Guyana 2008 Carapa guianensis crabwood 1 542Guyana 2008 Parinari campestris burada 1 409Guyana 2008 Manilkara bidentata bulletwood 1 441Guyana 2008 Hymenolobium spp. darina 0 R 469
Mexico 2007 44.03.29.03 (see accompanying notes) 1 1448Mexico 2007 44.07.29.99 4 I 815
Mexico 2008 44.07.29.99 (see accompanying notes) 5 I 749
Suriname 2007 Dicorynia guianensis basralocus 2 302Suriname 2007 Humiria balamifera meri 1 257Suriname 2007 Vatairea guianensis gele kabbes 1 343Suriname 2007 Tabebuia serratifolia groenhart 0 R 335Suriname 2007 Qualea spp. gronfolo 0 R 487Suriname 2007 Manilkara bidentata bolletrie 0 R 337Suriname 2007 Tabebuia capitata makagrin 1 252Suriname 2007 Goupia glabra kopi 0 R 35Suriname 2007 others 3 151
Suriname 2008 Dicorynia guianensis basralocus 2 321Suriname 2008 Humiria balamifera meri 2 262Suriname 2008 Vatairea guianensis gele kabbes 1 170Suriname 2008 Tabebuia serratifolia groenhart 0 R 339Suriname 2008 Qualea spp. gronfolo 0 R 325Suriname 2008 Manilkara bidentata bolletrie 0 R 326Suriname 2008 Tabebuia capitata makagrin 0 R 326Suriname 2008 Goupia glabra kopi 0 R 343Suriname 2008 others 1 287
2008 Cedral oderata caribbean cedar 0 R 1296
2008 others 0 R 1286
Venezuela 2007 Virolla spp. virolaVenezuela 2007 Swietenia spp. mahoganyVenezuela 2007 Ocotea spp. imbuiaVenezuela 2007 Ochroma lagopus balsaVenezuela 2007 Shorea spp. dark red merantiVenezuela 2007 Shorea spp. light red merantiVenezuela 2007 Shorea spp. meranti bakau
CONSUMERSAsia-Pacific
Japan 2007 Parashorea spp. white serayaJapan 2007 Parashorea spp., Pentacme spp. white lauanJapan 2007 Shorea albida alanJapan 2007 Shorea spp. white merantiJapan 2007 Shorea spp. yellow meranti
Japan 2007 others 0 R 1438
New Zealand 2007 44.07.29.10.09 (see accompanying notes) 0 R 369New Zealand 2007 44.07.29.10.10 0 R 5292New Zealand 2007 44.07.29.10.27 0 R 876New Zealand 2007 44.07.29.10.39 0 R 1813New Zealand 2007 44.07.29.90.01 0 R 3869
New Zealand 2008 44.07.29.10.10 (see accompanying notes) 0 1195New Zealand 2008 44.07.29.10.19 0 347New Zealand 2008 44.07.29.10.27 0 1063New Zealand 2008 44.07.29.90.10 0 2462
Rep. of Korea 2007 44.07.29.10.00 (see accompanying notes) 0 R 439Rep. of Korea 2007 44.07.29.30.00 0 R 369Rep. of Korea 2007 44.07.29.90.00 Rep. of Korea 2007 44.07.99.90.10
Rep. of Korea 2008 44.07.26.00.00 (see accompanying notes) 0 R 248Rep. of Korea 2008 44.07.29.10.00 0 R 1024Rep. of Korea 2008 44.07.29.90.00 Rep. of Korea 2008 44.07.99.90.10
Trinidad and Tobago
1350 R
1 874
2 474
1 889
146
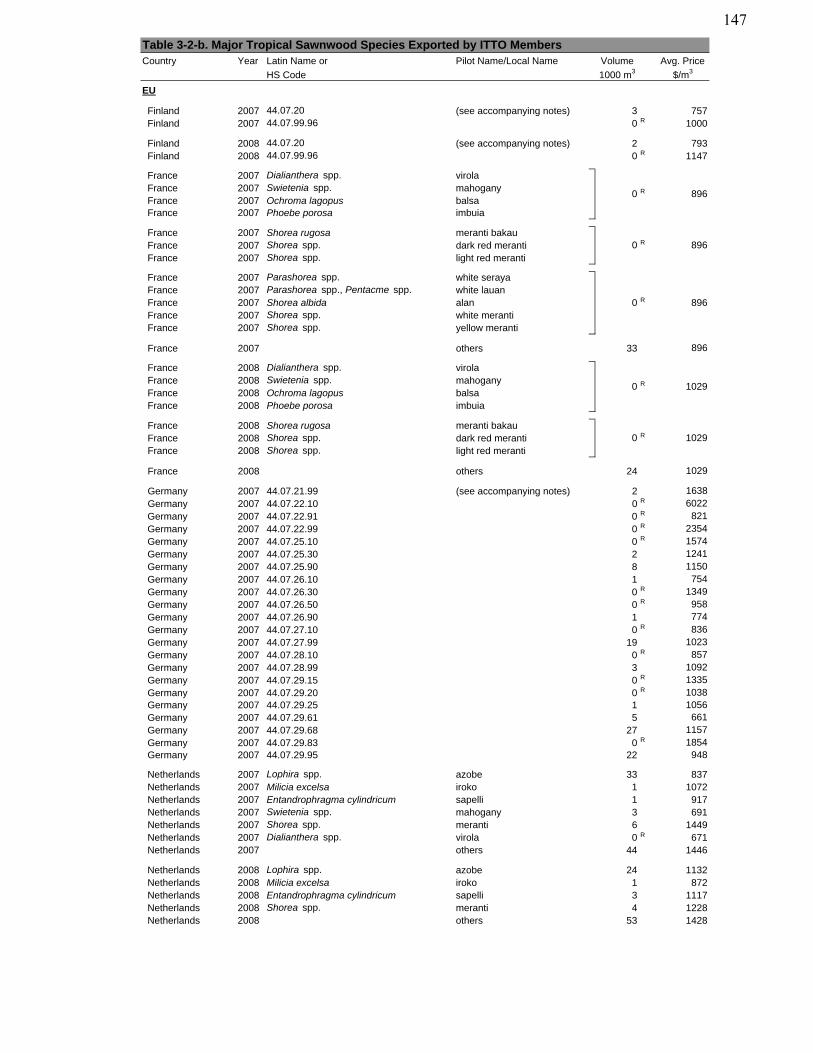
Country Year Latin Name or Pilot Name/Local Name Volume Avg. Price
HS Code 1000 m3 $/m3
Table 3-2-b. Major Tropical Sawnwood Species Exported by ITTO Members
EU
Finland 2007 44.07.20 (see accompanying notes) 3 757Finland 2007 44.07.99.96 0 R 1000
Finland 2008 44.07.20 (see accompanying notes) 2 793Finland 2008 44.07.99.96 0 R 1147
France 2007 Dialianthera spp. virolaFrance 2007 Swietenia spp. mahoganyFrance 2007 Ochroma lagopus balsaFrance 2007 Phoebe porosa imbuia
France 2007 Shorea rugosa meranti bakauFrance 2007 Shorea spp. dark red merantiFrance 2007 Shorea spp. light red meranti
France 2007 Parashorea spp. white serayaFrance 2007 Parashorea spp., Pentacme spp. white lauanFrance 2007 Shorea albida alanFrance 2007 Shorea spp. white merantiFrance 2007 Shorea spp. yellow meranti
France 2007 others 33 896
France 2008 Dialianthera spp. virolaFrance 2008 Swietenia spp. mahoganyFrance 2008 Ochroma lagopus balsaFrance 2008 Phoebe porosa imbuia
France 2008 Shorea rugosa meranti bakauFrance 2008 Shorea spp. dark red merantiFrance 2008 Shorea spp. light red meranti
France 2008 others 24 1029
Germany 2007 44.07.21.99 (see accompanying notes) 2 1638Germany 2007 44.07.22.10 0 R 6022Germany 2007 44.07.22.91 0 R 821Germany 2007 44.07.22.99 0 R 2354Germany 2007 44.07.25.10 0 R 1574Germany 2007 44.07.25.30 2 1241Germany 2007 44.07.25.90 8 1150Germany 2007 44.07.26.10 1 754Germany 2007 44.07.26.30 0 R 1349Germany 2007 44.07.26.50 0 R 958Germany 2007 44.07.26.90 1 774Germany 2007 44.07.27.10 0 R 836Germany 2007 44.07.27.99 19 1023Germany 2007 44.07.28.10 0 R 857Germany 2007 44.07.28.99 3 1092Germany 2007 44.07.29.15 0 R 1335Germany 2007 44.07.29.20 0 R 1038Germany 2007 44.07.29.25 1 1056Germany 2007 44.07.29.61 5 661Germany 2007 44.07.29.68 27 1157Germany 2007 44.07.29.83 0 R 1854Germany 2007 44.07.29.95 22 948
Netherlands 2007 Lophira spp. azobe 33 837Netherlands 2007 Milicia excelsa iroko 1 1072Netherlands 2007 Entandrophragma cylindricum sapelli 1 917Netherlands 2007 Swietenia spp. mahogany 3 691Netherlands 2007 Shorea spp. meranti 6 1449Netherlands 2007 Dialianthera spp. virola 0 R 671Netherlands 2007 others 44 1446
Netherlands 2008 Lophira spp. azobe 24 1132Netherlands 2008 Milicia excelsa iroko 1 872Netherlands 2008 Entandrophragma cylindricum sapelli 3 1117Netherlands 2008 Shorea spp. meranti 4 1228Netherlands 2008 others 53 1428
0 R
R
0 R 896
0
896
896
R 10290
0 R 1029
147
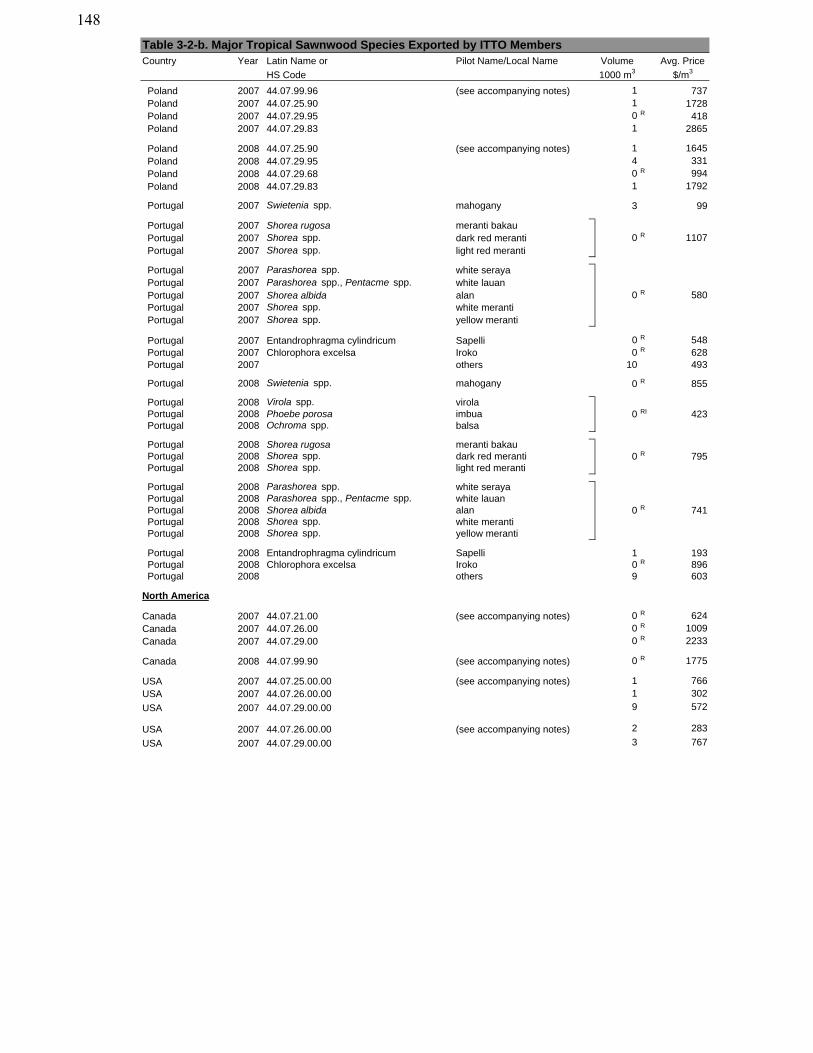
Country Year Latin Name or Pilot Name/Local Name Volume Avg. Price
HS Code 1000 m3 $/m3
Table 3-2-b. Major Tropical Sawnwood Species Exported by ITTO Members
Poland 2007 44.07.99.96 (see accompanying notes) 1 737Poland 2007 44.07.25.90 1 1728Poland 2007 44.07.29.95 0 R 418Poland 2007 44.07.29.83 1 2865
Poland 2008 44.07.25.90 (see accompanying notes) 1 1645Poland 2008 44.07.29.95 4 331Poland 2008 44.07.29.68 0 R 994Poland 2008 44.07.29.83 1 1792
Portugal 2007 Swietenia spp. mahogany 3 99
Portugal 2007 Shorea rugosa meranti bakauPortugal 2007 Shorea spp. dark red merantiPortugal 2007 Shorea spp. light red meranti
Portugal 2007 Parashorea spp. white serayaPortugal 2007 Parashorea spp., Pentacme spp. white lauanPortugal 2007 Shorea albida alanPortugal 2007 Shorea spp. white merantiPortugal 2007 Shorea spp. yellow meranti
Portugal 2007 Entandrophragma cylindricum Sapelli 0 R 548Portugal 2007 Chlorophora excelsa Iroko 0 R 628Portugal 2007 others 10 493
Portugal 2008 Swietenia spp. mahogany 0 R 855
Portugal 2008 Virola spp. virolaPortugal 2008 Phoebe porosa imbuaPortugal 2008 Ochroma spp. balsa
Portugal 2008 Shorea rugosa meranti bakauPortugal 2008 Shorea spp. dark red merantiPortugal 2008 Shorea spp. light red meranti
Portugal 2008 Parashorea spp. white serayaPortugal 2008 Parashorea spp., Pentacme spp. white lauanPortugal 2008 Shorea albida alanPortugal 2008 Shorea spp. white merantiPortugal 2008 Shorea spp. yellow meranti
Portugal 2008 Entandrophragma cylindricum Sapelli 1 193Portugal 2008 Chlorophora excelsa Iroko 0 R 896Portugal 2008 others 9 603
North America
Canada 2007 44.07.21.00 (see accompanying notes) 0 R 624Canada 2007 44.07.26.00 0 R 1009Canada 2007 44.07.29.00 0 R 2233
Canada 2008 44.07.99.90 (see accompanying notes) 0 R 1775
USA 2007 44.07.25.00.00 (see accompanying notes) 1 766USA 2007 44.07.26.00.00 1 302
USA 2007 44.07.29.00.00 9 572
USA 2007 44.07.26.00.00 (see accompanying notes) 2 283
USA 2007 44.07.29.00.00 3 767
0 R 580
0 R 1107
0 R 741
0 RI 423
0 R 795
148
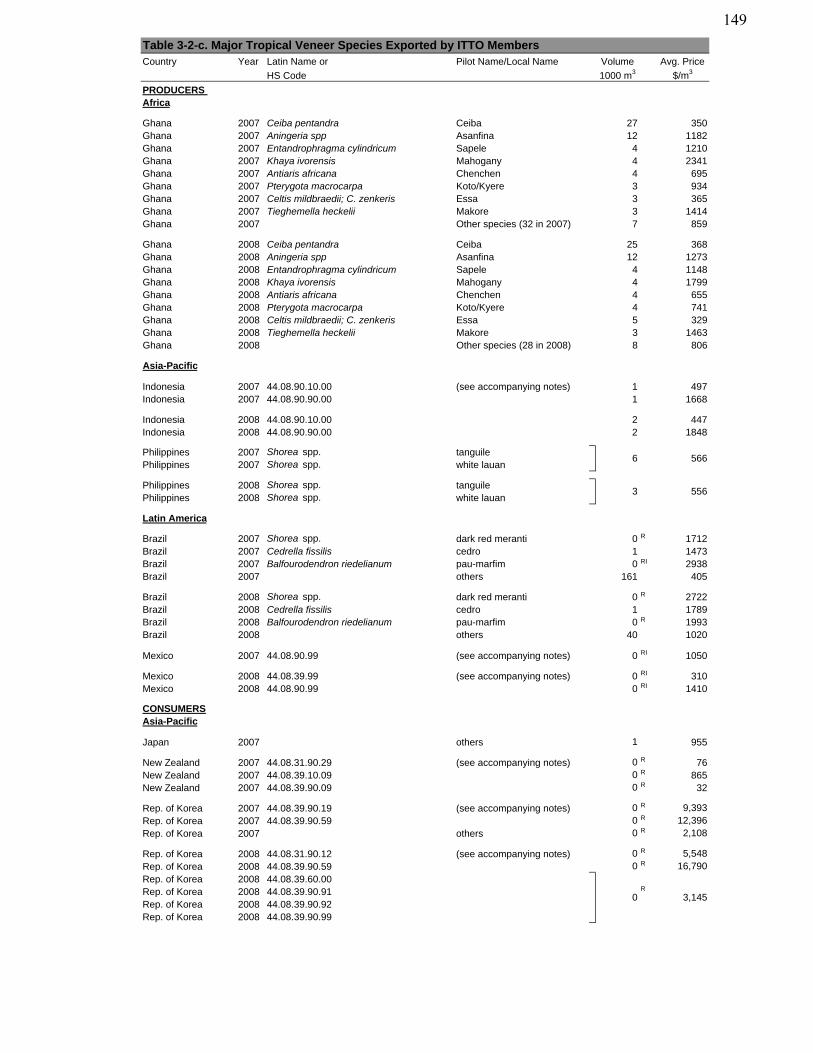
Country Year Latin Name or Pilot Name/Local Name Volume Avg. Price
HS Code 1000 m3 $/m3
PRODUCERS Africa
Ghana 2007 Ceiba pentandra Ceiba 27 350Ghana 2007 Aningeria spp Asanfina 12 1182Ghana 2007 Entandrophragma cylindricum Sapele 4 1210Ghana 2007 Khaya ivorensis Mahogany 4 2341Ghana 2007 Antiaris africana Chenchen 4 695Ghana 2007 Pterygota macrocarpa Koto/Kyere 3 934Ghana 2007 Celtis mildbraedii; C. zenkeris Essa 3 365Ghana 2007 Tieghemella heckelii Makore 3 1414Ghana 2007 Other species (32 in 2007) 7 859
Ghana 2008 Ceiba pentandra Ceiba 25 368Ghana 2008 Aningeria spp Asanfina 12 1273Ghana 2008 Entandrophragma cylindricum Sapele 4 1148Ghana 2008 Khaya ivorensis Mahogany 4 1799Ghana 2008 Antiaris africana Chenchen 4 655Ghana 2008 Pterygota macrocarpa Koto/Kyere 4 741Ghana 2008 Celtis mildbraedii; C. zenkeris Essa 5 329Ghana 2008 Tieghemella heckelii Makore 3 1463Ghana 2008 Other species (28 in 2008) 8 806
Asia-Pacific
Indonesia 2007 44.08.90.10.00 (see accompanying notes) 1 497Indonesia 2007 44.08.90.90.00 1 1668
Indonesia 2008 44.08.90.10.00 2 447Indonesia 2008 44.08.90.90.00 2 1848
Philippines 2007 Shorea spp. tanguilePhilippines 2007 Shorea spp. white lauan
Philippines 2008 Shorea spp. tanguilePhilippines 2008 Shorea spp. white lauan
Latin America
Brazil 2007 Shorea spp. dark red meranti 0 R 1712Brazil 2007 Cedrella fissilis cedro 1 1473Brazil 2007 Balfourodendron riedelianum pau-marfim 0 RI 2938Brazil 2007 others 161 405
Brazil 2008 Shorea spp. dark red meranti 0 R 2722Brazil 2008 Cedrella fissilis cedro 1 1789Brazil 2008 Balfourodendron riedelianum pau-marfim 0 R 1993Brazil 2008 others 40 1020
Mexico 2007 44.08.90.99 (see accompanying notes) 0 RI 1050
Mexico 2008 44.08.39.99 (see accompanying notes) 0 RI 310Mexico 2008 44.08.90.99 0 RI 1410
CONSUMERSAsia-Pacific
Japan 2007 others 1 955
New Zealand 2007 44.08.31.90.29 (see accompanying notes) 0 R 76New Zealand 2007 44.08.39.10.09 0 R 865New Zealand 2007 44.08.39.90.09 0 R 32
Rep. of Korea 2007 44.08.39.90.19 (see accompanying notes) 0 R 9,393Rep. of Korea 2007 44.08.39.90.59 0 R 12,396Rep. of Korea 2007 others 0 R 2,108
Rep. of Korea 2008 44.08.31.90.12 (see accompanying notes) 0 R 5,548Rep. of Korea 2008 44.08.39.90.59 0 R 16,790Rep. of Korea 2008 44.08.39.60.00Rep. of Korea 2008 44.08.39.90.91 R
Rep. of Korea 2008 44.08.39.90.92Rep. of Korea 2008 44.08.39.90.99
Table 3-2-c. Major Tropical Veneer Species Exported by ITTO Members
6 566
3 556
0 3,145
149
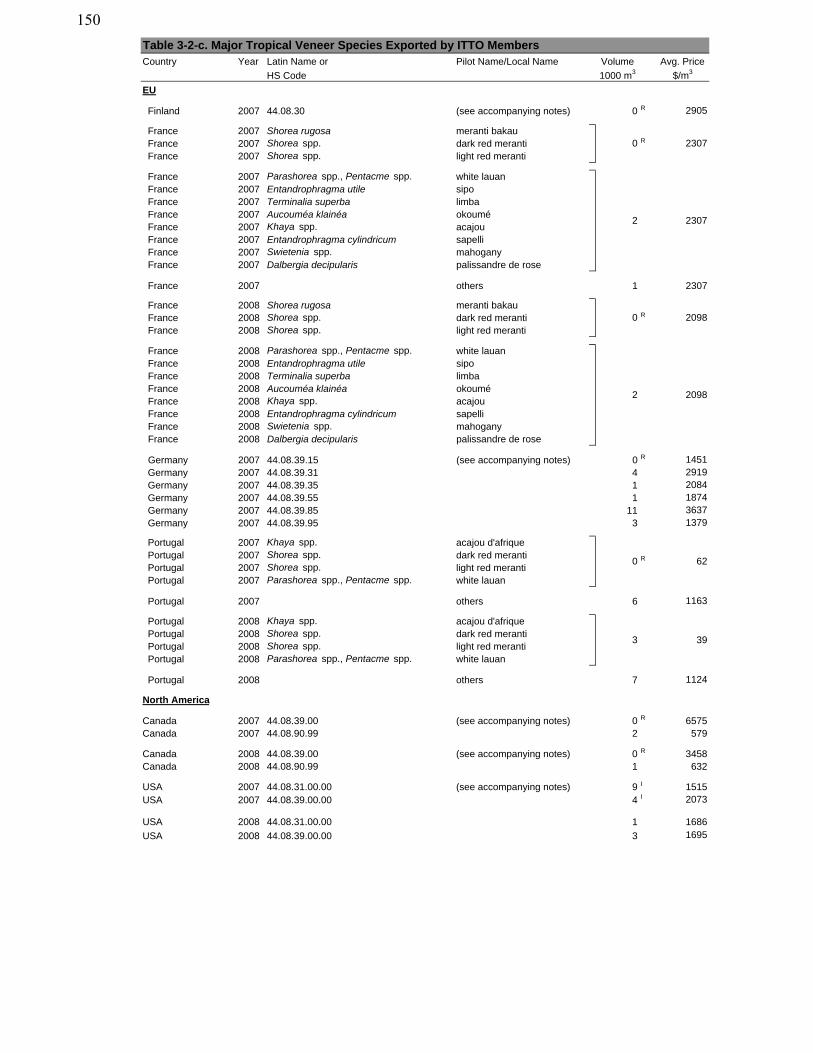
Country Year Latin Name or Pilot Name/Local Name Volume Avg. Price
HS Code 1000 m3 $/m3
Table 3-2-c. Major Tropical Veneer Species Exported by ITTO Members
EU
Finland 2007 44.08.30 (see accompanying notes) 0 R 2905
France 2007 Shorea rugosa meranti bakauFrance 2007 Shorea spp. dark red merantiFrance 2007 Shorea spp. light red meranti
France 2007 Parashorea spp., Pentacme spp. white lauanFrance 2007 Entandrophragma utile sipoFrance 2007 Terminalia superba limbaFrance 2007 Aucouméa klainéa okouméFrance 2007 Khaya spp. acajouFrance 2007 Entandrophragma cylindricum sapelliFrance 2007 Swietenia spp. mahoganyFrance 2007 Dalbergia decipularis palissandre de rose
France 2007 others 1 2307
France 2008 Shorea rugosa meranti bakauFrance 2008 Shorea spp. dark red merantiFrance 2008 Shorea spp. light red meranti
France 2008 Parashorea spp., Pentacme spp. white lauanFrance 2008 Entandrophragma utile sipoFrance 2008 Terminalia superba limbaFrance 2008 Aucouméa klainéa okouméFrance 2008 Khaya spp. acajouFrance 2008 Entandrophragma cylindricum sapelliFrance 2008 Swietenia spp. mahoganyFrance 2008 Dalbergia decipularis palissandre de rose
Germany 2007 44.08.39.15 (see accompanying notes) 0 R 1451Germany 2007 44.08.39.31 4 2919Germany 2007 44.08.39.35 1 2084Germany 2007 44.08.39.55 1 1874Germany 2007 44.08.39.85 11 3637Germany 2007 44.08.39.95 3 1379
Portugal 2007 Khaya spp. acajou d'afriquePortugal 2007 Shorea spp. dark red merantiPortugal 2007 Shorea spp. light red merantiPortugal 2007 Parashorea spp., Pentacme spp. white lauan
Portugal 2007 others 6 1163
Portugal 2008 Khaya spp. acajou d'afriquePortugal 2008 Shorea spp. dark red merantiPortugal 2008 Shorea spp. light red merantiPortugal 2008 Parashorea spp., Pentacme spp. white lauan
Portugal 2008 others 7 1124
North America
Canada 2007 44.08.39.00 (see accompanying notes) 0 R 6575Canada 2007 44.08.90.99 2 579
Canada 2008 44.08.39.00 (see accompanying notes) 0 R 3458Canada 2008 44.08.90.99 1 632
USA 2007 44.08.31.00.00 (see accompanying notes) 9 I 1515USA 2007 44.08.39.00.00 4 I 2073
USA 2008 44.08.31.00.00 1 1686
USA 2008 44.08.39.00.00 3 1695
2307
0 R 2307
2
20980 R
2 2098
3 39
0 62R
150
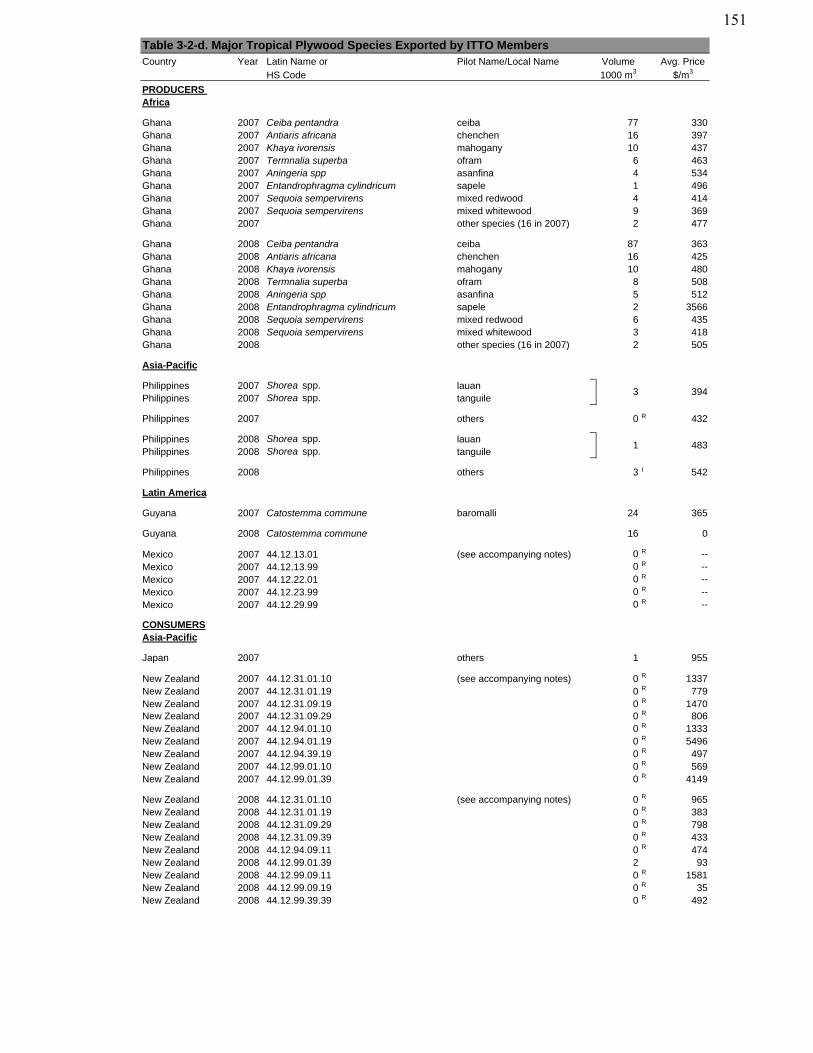
Country Year Latin Name or Pilot Name/Local Name Volume Avg. PriceHS Code 1000 m3 $/m3
PRODUCERS Africa
Ghana 2007 Ceiba pentandra ceiba 77 330Ghana 2007 Antiaris africana chenchen 16 397Ghana 2007 Khaya ivorensis mahogany 10 437Ghana 2007 Termnalia superba ofram 6 463Ghana 2007 Aningeria spp asanfina 4 534Ghana 2007 Entandrophragma cylindricum sapele 1 496Ghana 2007 Sequoia sempervirens mixed redwood 4 414Ghana 2007 Sequoia sempervirens mixed whitewood 9 369Ghana 2007 other species (16 in 2007) 2 477
Ghana 2008 Ceiba pentandra ceiba 87 363Ghana 2008 Antiaris africana chenchen 16 425Ghana 2008 Khaya ivorensis mahogany 10 480Ghana 2008 Termnalia superba ofram 8 508Ghana 2008 Aningeria spp asanfina 5 512Ghana 2008 Entandrophragma cylindricum sapele 2 3566Ghana 2008 Sequoia sempervirens mixed redwood 6 435Ghana 2008 Sequoia sempervirens mixed whitewood 3 418Ghana 2008 other species (16 in 2007) 2 505
Asia-Pacific
Philippines 2007 Shorea spp. lauanPhilippines 2007 Shorea spp. tanguile
Philippines 2007 others 0 R 432
Philippines 2008 Shorea spp. lauanPhilippines 2008 Shorea spp. tanguile
Philippines 2008 others 3 I 542
Latin America
Guyana 2007 Catostemma commune baromalli 24 365
Guyana 2008 Catostemma commune 16 0
Mexico 2007 44.12.13.01 (see accompanying notes) 0 R --Mexico 2007 44.12.13.99 0 R --Mexico 2007 44.12.22.01 0 R --Mexico 2007 44.12.23.99 0 R --Mexico 2007 44.12.29.99 0 R --
CONSUMERSAsia-Pacific
Japan 2007 others 1 955
New Zealand 2007 44.12.31.01.10 (see accompanying notes) 0 R 1337New Zealand 2007 44.12.31.01.19 0 R 779New Zealand 2007 44.12.31.09.19 0 R 1470New Zealand 2007 44.12.31.09.29 0 R 806New Zealand 2007 44.12.94.01.10 0 R 1333New Zealand 2007 44.12.94.01.19 0 R 5496New Zealand 2007 44.12.94.39.19 0 R 497New Zealand 2007 44.12.99.01.10 0 R 569New Zealand 2007 44.12.99.01.39 0 R 4149
New Zealand 2008 44.12.31.01.10 (see accompanying notes) 0 R 965New Zealand 2008 44.12.31.01.19 0 R 383New Zealand 2008 44.12.31.09.29 0 R 798New Zealand 2008 44.12.31.09.39 0 R 433New Zealand 2008 44.12.94.09.11 0 R 474New Zealand 2008 44.12.99.01.39 2 93New Zealand 2008 44.12.99.09.11 0 R 1581New Zealand 2008 44.12.99.09.19 0 R 35New Zealand 2008 44.12.99.39.39 0 R 492
394
Table 3-2-d. Major Tropical Plywood Species Exported by ITTO Members
3
1 483
151
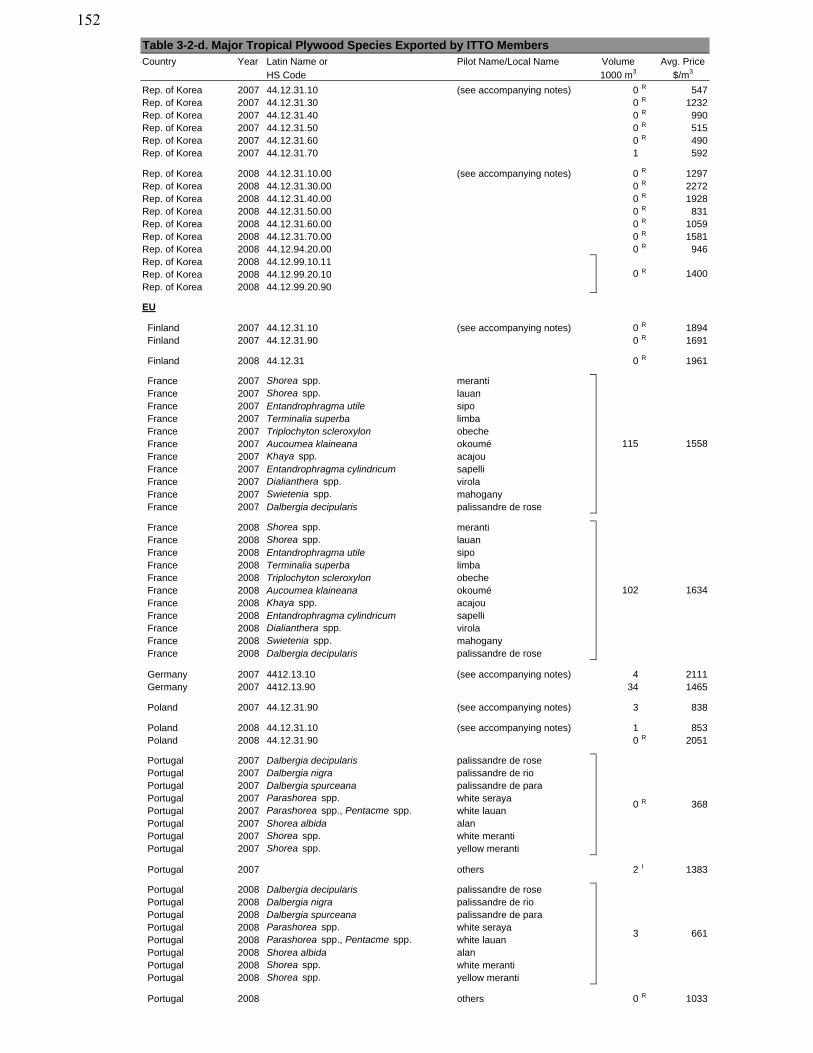
Country Year Latin Name or Pilot Name/Local Name Volume Avg. PriceHS Code 1000 m3 $/m3
Table 3-2-d. Major Tropical Plywood Species Exported by ITTO Members
Rep. of Korea 2007 44.12.31.10 (see accompanying notes) 0 R 547Rep. of Korea 2007 44.12.31.30 0 R 1232Rep. of Korea 2007 44.12.31.40 0 R 990Rep. of Korea 2007 44.12.31.50 0 R 515Rep. of Korea 2007 44.12.31.60 0 R 490Rep. of Korea 2007 44.12.31.70 1 592
Rep. of Korea 2008 44.12.31.10.00 (see accompanying notes) 0 R 1297Rep. of Korea 2008 44.12.31.30.00 0 R 2272Rep. of Korea 2008 44.12.31.40.00 0 R 1928Rep. of Korea 2008 44.12.31.50.00 0 R 831Rep. of Korea 2008 44.12.31.60.00 0 R 1059Rep. of Korea 2008 44.12.31.70.00 0 R 1581Rep. of Korea 2008 44.12.94.20.00 0 R 946Rep. of Korea 2008 44.12.99.10.11Rep. of Korea 2008 44.12.99.20.10Rep. of Korea 2008 44.12.99.20.90
EU
Finland 2007 44.12.31.10 (see accompanying notes) 0 R 1894Finland 2007 44.12.31.90 0 R 1691
Finland 2008 44.12.31 0 R 1961
France 2007 Shorea spp. merantiFrance 2007 Shorea spp. lauanFrance 2007 Entandrophragma utile sipoFrance 2007 Terminalia superba limbaFrance 2007 Triplochyton scleroxylon obecheFrance 2007 Aucoumea klaineana okouméFrance 2007 Khaya spp. acajouFrance 2007 Entandrophragma cylindricum sapelliFrance 2007 Dialianthera spp. virolaFrance 2007 Swietenia spp. mahoganyFrance 2007 Dalbergia decipularis palissandre de rose
France 2008 Shorea spp. merantiFrance 2008 Shorea spp. lauanFrance 2008 Entandrophragma utile sipoFrance 2008 Terminalia superba limbaFrance 2008 Triplochyton scleroxylon obecheFrance 2008 Aucoumea klaineana okouméFrance 2008 Khaya spp. acajouFrance 2008 Entandrophragma cylindricum sapelliFrance 2008 Dialianthera spp. virolaFrance 2008 Swietenia spp. mahoganyFrance 2008 Dalbergia decipularis palissandre de rose
Germany 2007 4412.13.10 (see accompanying notes) 4 2111Germany 2007 4412.13.90 34 1465
Poland 2007 44.12.31.90 (see accompanying notes) 3 838
Poland 2008 44.12.31.10 (see accompanying notes) 1 853Poland 2008 44.12.31.90 0 R 2051
Portugal 2007 Dalbergia decipularis palissandre de rosePortugal 2007 Dalbergia nigra palissandre de rioPortugal 2007 Dalbergia spurceana palissandre de paraPortugal 2007 Parashorea spp. white serayaPortugal 2007 Parashorea spp., Pentacme spp. white lauanPortugal 2007 Shorea albida alanPortugal 2007 Shorea spp. white merantiPortugal 2007 Shorea spp. yellow meranti
Portugal 2007 others 2 I 1383
Portugal 2008 Dalbergia decipularis palissandre de rosePortugal 2008 Dalbergia nigra palissandre de rioPortugal 2008 Dalbergia spurceana palissandre de paraPortugal 2008 Parashorea spp. white serayaPortugal 2008 Parashorea spp., Pentacme spp. white lauanPortugal 2008 Shorea albida alanPortugal 2008 Shorea spp. white merantiPortugal 2008 Shorea spp. yellow meranti
Portugal 2008 others 0 R 1033
0 R 1400
0 368
102 1634
R
3 661
115 1558
152
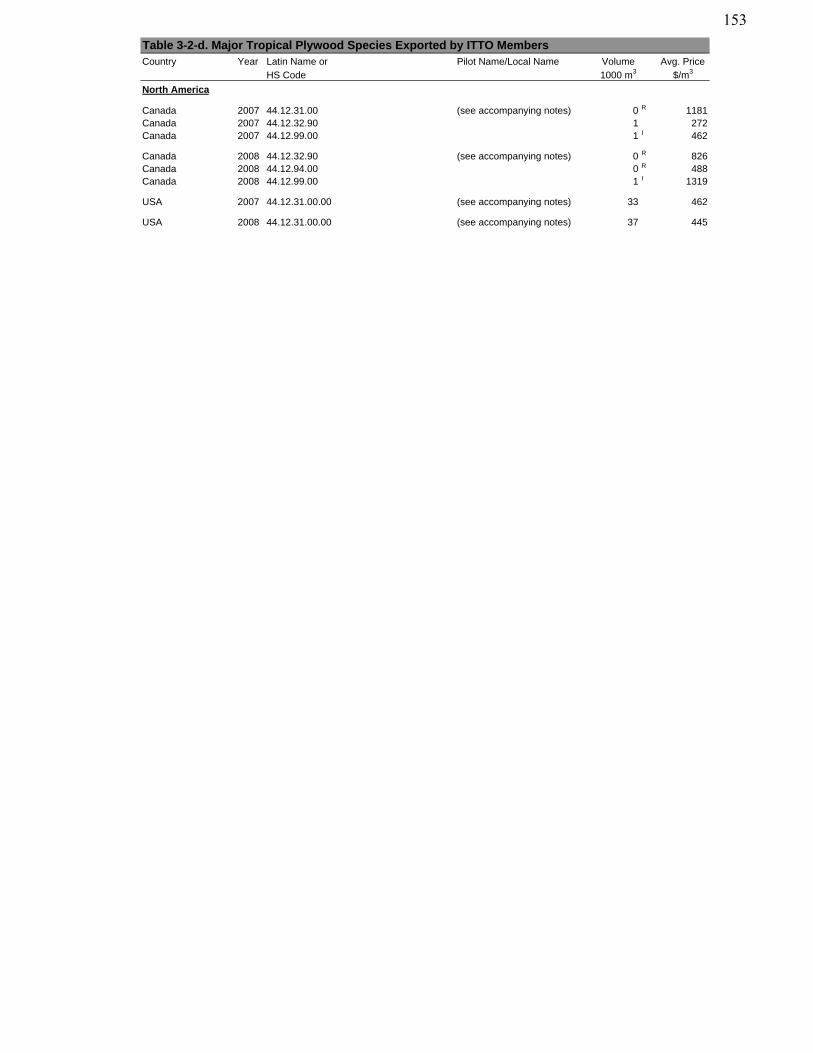
Country Year Latin Name or Pilot Name/Local Name Volume Avg. PriceHS Code 1000 m3 $/m3
Table 3-2-d. Major Tropical Plywood Species Exported by ITTO Members
North America
Canada 2007 44.12.31.00 (see accompanying notes) 0 R 1181Canada 2007 44.12.32.90 1 272Canada 2007 44.12.99.00 1 I 462
Canada 2008 44.12.32.90 (see accompanying notes) 0 R 826Canada 2008 44.12.94.00 0 R 488Canada 2008 44.12.99.00 1 I 1319
USA 2007 44.12.31.00.00 (see accompanying notes) 33 462
USA 2008 44.12.31.00.00 (see accompanying notes) 37 445
153

154
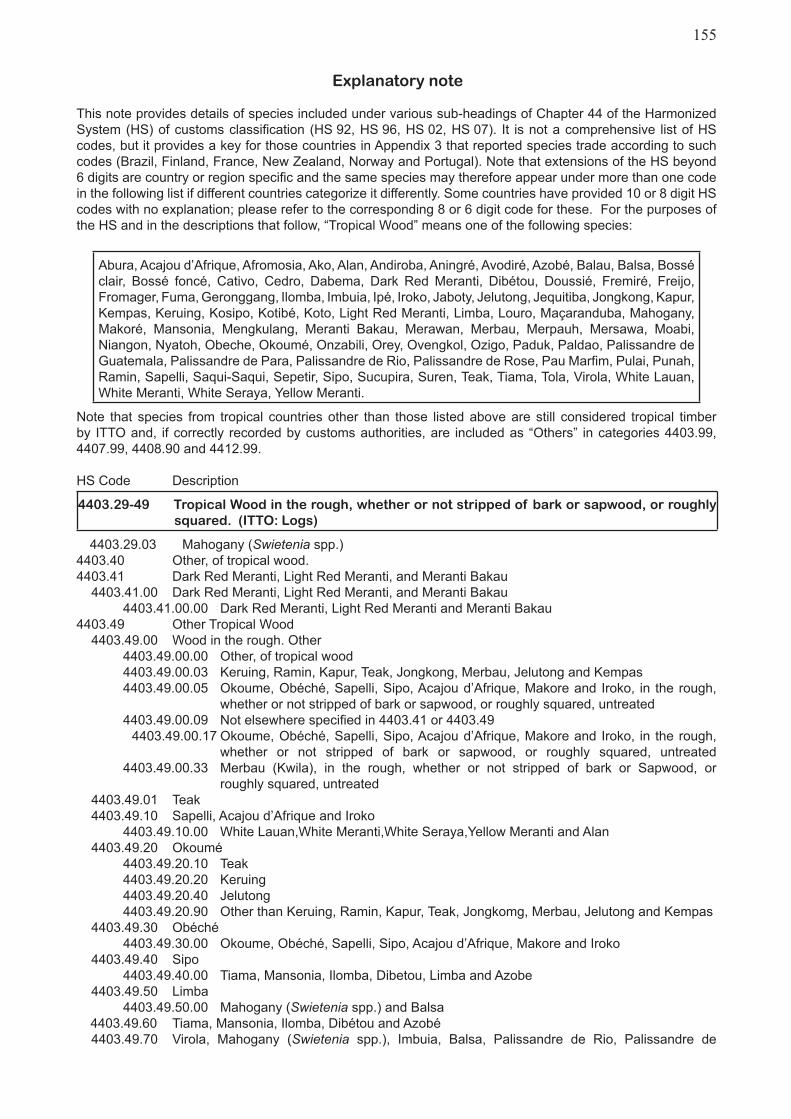
155
Explanatory note
This note provides details of species included under various sub-headings of Chapter 44 of the Harmonized System (HS) of customs classification (HS 92, HS 96, HS 02, HS 07). It is not a comprehensive list of HS codes, but it provides a key for those countries in Appendix 3 that reported species trade according to such codes (Brazil, Finland, France, New Zealand, Norway and Portugal). Note that extensions of the HS beyond 6 digits are country or region specific and the same species may therefore appear under more than one code in the following list if different countries categorize it differently. Some countries have provided 10 or 8 digit HS codes with no explanation; please refer to the corresponding 8 or 6 digit code for these. For the purposes of the HS and in the descriptions that follow, “Tropical Wood” means one of the following species:
Abura, Acajou d’Afrique, Afromosia, Ako, Alan, Andiroba, Aningré, Avodiré, Azobé, Balau, Balsa, Bossé clair, Bossé foncé, Cativo, Cedro, Dabema, Dark Red Meranti, Dibétou, Doussié, Fremiré, Freijo, Fromager, Fuma, Geronggang, Ilomba, Imbuia, Ipé, Iroko, Jaboty, Jelutong, Jequitiba, Jongkong, Kapur, Kempas, Keruing, Kosipo, Kotibé, Koto, Light Red Meranti, Limba, Louro, Maçaranduba, Mahogany, Makoré, Mansonia, Mengkulang, Meranti Bakau, Merawan, Merbau, Merpauh, Mersawa, Moabi, Niangon, Nyatoh, Obeche, Okoumé, Onzabili, Orey, Ovengkol, Ozigo, Paduk, Paldao, Palissandre de Guatemala, Palissandre de Para, Palissandre de Rio, Palissandre de Rose, Pau Marfim, Pulai, Punah, Ramin, Sapelli, Saqui-Saqui, Sepetir, Sipo, Sucupira, Suren, Teak, Tiama, Tola, Virola, White Lauan, White Meranti, White Seraya, Yellow Meranti.
Note that species from tropical countries other than those listed above are still considered tropical timber by ITTO and, if correctly recorded by customs authorities, are included as “Others” in categories 4403.99, 4407.99, 4408.90 and 4412.99.
HS Code Description
4403.29-49 Tropical Wood in the rough, whether or not stripped of bark or sapwood, or roughly squared. (ITTO: Logs)
4403.29.03 Mahogany (Swietenia spp.)4403.40 Other, of tropical wood.4403.41 Dark Red Meranti, Light Red Meranti, and Meranti Bakau 4403.41.00 Dark Red Meranti, Light Red Meranti, and Meranti Bakau 4403.41.00.00 Dark Red Meranti, Light Red Meranti and Meranti Bakau4403.49 Other Tropical Wood 4403.49.00 Wood in the rough. Other 4403.49.00.00 Other, of tropical wood 4403.49.00.03 Keruing, Ramin, Kapur, Teak, Jongkong, Merbau, Jelutong and Kempas 4403.49.00.05 Okoume, Obéché, Sapelli, Sipo, Acajou d’Afrique, Makore and Iroko, in the rough, whether or not stripped of bark or sapwood, or roughly squared, untreated 4403.49.00.09 Not elsewhere specified in 4403.41 or 4403.49 4403.49.00.17 Okoume, Obéché, Sapelli, Sipo, Acajou d’Afrique, Makore and Iroko, in the rough, whether or not stripped of bark or sapwood, or roughly squared, untreated 4403.49.00.33 Merbau (Kwila), in the rough, whether or not stripped of bark or Sapwood, or roughly squared, untreated 4403.49.01 Teak 4403.49.10 Sapelli, Acajou d’Afrique and Iroko 4403.49.10.00 White Lauan,White Meranti,White Seraya,Yellow Meranti and Alan 4403.49.20 Okoumé 4403.49.20.10 Teak 4403.49.20.20 Keruing 4403.49.20.40 Jelutong 4403.49.20.90 Other than Keruing, Ramin, Kapur, Teak, Jongkomg, Merbau, Jelutong and Kempas 4403.49.30 Obéché 4403.49.30.00 Okoume, Obéché, Sapelli, Sipo, Acajou d’Afrique, Makore and Iroko 4403.49.40 Sipo 4403.49.40.00 Tiama, Mansonia, Ilomba, Dibetou, Limba and Azobe 4403.49.50 Limba 4403.49.50.00 Mahogany (Swietenia spp.) and Balsa 4403.49.60 Tiama, Mansonia, Ilomba, Dibétou and Azobé 4403.49.70 Virola, Mahogany (Swietenia spp.), Imbuia, Balsa, Palissandre de Rio, Palissandre de
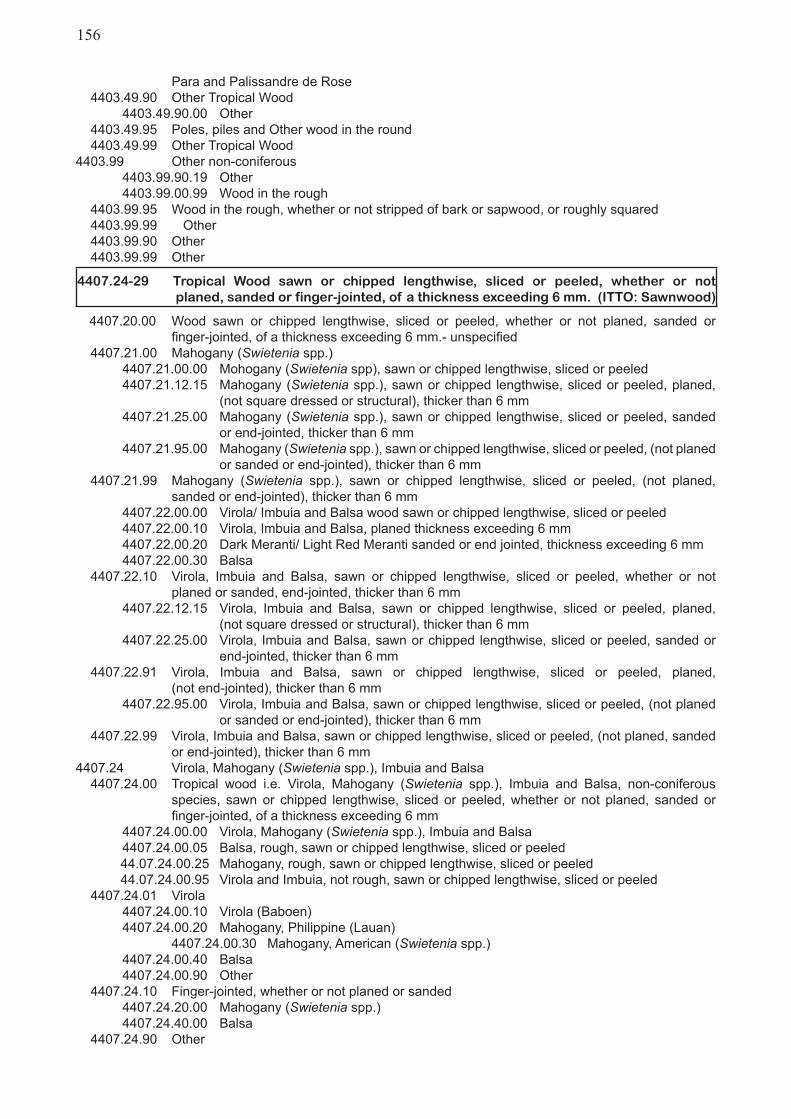
Para and Palissandre de Rose 4403.49.90 Other Tropical Wood 4403.49.90.00 Other 4403.49.95 Poles, piles and Other wood in the round 4403.49.99 Other Tropical Wood4403.99 Other non-coniferous 4403.99.90.19 Other 4403.99.00.99 Wood in the rough 4403.99.95 Wood in the rough, whether or not stripped of bark or sapwood, or roughly squared 4403.99.99 Other 4403.99.90 Other 4403.99.99 Other
4407.24-29 Tropical Wood sawn or chipped lengthwise, sliced or peeled, whether or not planed, sanded or finger-jointed, of a thickness exceeding 6 mm. (ITTO: Sawnwood)
4407.20.00 Wood sawn or chipped lengthwise, sliced or peeled, whether or not planed, sanded or finger-jointed, of a thickness exceeding 6 mm.- unspecified 4407.21.00 Mahogany (Swietenia spp.) 4407.21.00.00 Mohogany (Swietenia spp), sawn or chipped lengthwise, sliced or peeled 4407.21.12.15 Mahogany (Swietenia spp.), sawn or chipped lengthwise, sliced or peeled, planed, (not square dressed or structural), thicker than 6 mm 4407.21.25.00 Mahogany (Swietenia spp.), sawn or chipped lengthwise, sliced or peeled, sanded or end-jointed, thicker than 6 mm 4407.21.95.00 Mahogany (Swietenia spp.), sawn or chipped lengthwise, sliced or peeled, (not planed or sanded or end-jointed), thicker than 6 mm 4407.21.99 Mahogany (Swietenia spp.), sawn or chipped lengthwise, sliced or peeled, (not planed, sanded or end-jointed), thicker than 6 mm 4407.22.00.00 Virola/ Imbuia and Balsa wood sawn or chipped lengthwise, sliced or peeled 4407.22.00.10 Virola, Imbuia and Balsa, planed thickness exceeding 6 mm 4407.22.00.20 Dark Meranti/ Light Red Meranti sanded or end jointed, thickness exceeding 6 mm 4407.22.00.30 Balsa 4407.22.10 Virola, Imbuia and Balsa, sawn or chipped lengthwise, sliced or peeled, whether or not planed or sanded, end-jointed, thicker than 6 mm 4407.22.12.15 Virola, Imbuia and Balsa, sawn or chipped lengthwise, sliced or peeled, planed, (not square dressed or structural), thicker than 6 mm 4407.22.25.00 Virola, Imbuia and Balsa, sawn or chipped lengthwise, sliced or peeled, sanded or end-jointed, thicker than 6 mm 4407.22.91 Virola, Imbuia and Balsa, sawn or chipped lengthwise, sliced or peeled, planed, (not end-jointed), thicker than 6 mm 4407.22.95.00 Virola, Imbuia and Balsa, sawn or chipped lengthwise, sliced or peeled, (not planed or sanded or end-jointed), thicker than 6 mm 4407.22.99 Virola, Imbuia and Balsa, sawn or chipped lengthwise, sliced or peeled, (not planed, sanded or end-jointed), thicker than 6 mm 4407.24 Virola, Mahogany (Swietenia spp.), Imbuia and Balsa 4407.24.00 Tropical wood i.e. Virola, Mahogany (Swietenia spp.), Imbuia and Balsa, non-coniferous species, sawn or chipped lengthwise, sliced or peeled, whether or not planed, sanded or finger-jointed, of a thickness exceeding 6 mm 4407.24.00.00 Virola, Mahogany (Swietenia spp.), Imbuia and Balsa 4407.24.00.05 Balsa, rough, sawn or chipped lengthwise, sliced or peeled 44.07.24.00.25 Mahogany, rough, sawn or chipped lengthwise, sliced or peeled 44.07.24.00.95 Virola and Imbuia, not rough, sawn or chipped lengthwise, sliced or peeled 4407.24.01 Virola 4407.24.00.10 Virola (Baboen) 4407.24.00.20 Mahogany, Philippine (Lauan) 4407.24.00.30 Mahogany, American (Swietenia spp.) 4407.24.00.40 Balsa 4407.24.00.90 Other 4407.24.10 Finger-jointed, whether or not planed or sanded 4407.24.20.00 Mahogany (Swietenia spp.) 4407.24.40.00 Balsa 4407.24.90 Other
156
4407.24.90.00 Virola, Mahogany, Imbuia and Balsa sliced or peeled sawnwood not exclusively specified 4407.24.99 Spanish Cedar4407.25 Dark Red Meranti, Light Red Meranti, and Meranti Bakau 4407.25.00 Dark Red Meranti, Light Red Meranti and Meranti Bakau 4407.25.00.00 Dark Red Meranti, Light Red Meranti and Meranti Bakau 4407.25.01 Dark Light Red Meranti 4407.25.10 Dark Red Meranti, Light Red Meranti and Meranti Bakau, sawn or chipped lengthwise, sliced or peeled, whether or not planed or sanded, end-jointed, thicker than 6 mm 4407.25.30 Dark Red Meranti, Light Red Meranti and Meranti Bakau, sawn or chipped lengthwise, sliced or peeled, planed, (not end-jointed), thicker than 6 mm, 4407.25.31 Planed: Blocks, strips and friezes for parquet or wood block flooring, not assembled 4407.25.39 Planed: Other 4407.25.50 Sanded 4407.25.60 Other: Dark red Meranti and Light Red Meranti 4407.25.80 Other: Meranti Bakau 4407.25.90 Dark Red Meranti, Light Red Meranti and Meranti Bakau, sawn or chipped lengthwise, sliced or peeled, (not planed, sanded or end-jointed), thicker than 6 mm 4407.25.90.00 Dark Red Meranti, Light Red Meranti and Meranti Bakau, sawn or chipped lengthwise, sliced or peeled, (not planed or sanded or end-jointed), thicker than 6 mm4407.26 White Lauan, White Meranti, White Seraya, Yellow Meranti and Alan 4407.26.00 White Lauan, White Meranti, White Seraya, Yellow Meranti and Alan 4407.26.00.00 White Lauan, White Meranti, White Seraya, Yellow Meranti and Alan 4407.26.10 White Lauan, White Meranti, White Seraya, Yellow Meranti and Alan, sawn or chipped lengthwise, sliced or peeled or end-jointed, whether or not planed or sanded, thicker than 6 mm 4407.26.30 White Lauan, White Meranti, White Seraya, Yellow Meranti and Alan, sawn or chipped lengthwise, sliced or peeled, planed , (not end-jointed), thicker than 6 mm 4407.26.31 Planed: Blocks, strips and friezes for parquet or wood block flooring, not assembled 4407.26.39 Planed: Other 4407.26.50 Sanded 4407.26.70 Other: White Lauan and White Meranti 4407.26.80 Other: White Seraya, Yellow Meranti and Alan 4407.26.90 White Lauan, White Meranti, White Seraya, Yellow Meranti and Alan, sawn or chipped lengthwise, sliced or peeled, (not planed or sanded or end-jointed), thicker than 6 mm 4407.26.90.00 White Lauan, White Meranti, White Seraya, Yellow Meranti and Alan, sawn or chipped lengthwise, sliced or peeled, (not planed or sanded or end-jointed), thicker than 6 mm4407.27 Sapelli 4407.27.00.00 Sapelli, sawn or chipped lengthwise, sliced or peeled, whether/not planed, sanded or end-jointed 4407.27.10 Sapelli; Planed or sanded 4407.27.19.00 Sapelli, sawn or chipped lengthwise, sliced or peeled, (not planed or sanded or end-jointed), thicker than 6 mm 4407.27.91 Sapelli, sawn or chipped lengthwise, sliced or peeled, planed (not end-jointed), thicker than 6 mm 4407.27.99 Sapelli, sawn or chipped lengthwise, sliced or peeled, (not planed, sanded or end-jointed), thicker than 6 mm4407.28 Iroko 4407.28.00.00 Iroko, sawn or chipped lengthwise, sliced or peeled, whether/not planed, sanded or end-jointed 4407.28.01.10 Iroko, sawn or chipped lengthwise, sliced or peeled, planed, square dressed, structural, thicker than 6 mm 4407.28.01.19 Iroko, sawn or chipped lengthwise, sliced or peeled, planed, (not square dressed or structural), thicker than 6 mm 4407.28.10 Iroko: Planed or sanded 4407.28.91 Iroko, sawn or chipped lengthwise, sliced or peeled, planed, (not end-jointed), thicker than 6 mm 4407.28.99 Iroko, sawn or chipped lengthwise, sliced or peeled, (not planed, sanded or end-jointed), thicker than 6 mm
157
158
4407.29 Other Tropical Wood 4407.29.00 Tropical wood specified in chapter 44 subheading note 1, not elsewhere specified or indicated, sawn or chipped lengthwise, sliced or peeled, over 6 mm thick 4407.29.00.05 Teak, rough, sawn or chipped lengthwise, sliced or peeled 4407.29.00.10 Teak 4407.29.00.20 Other 4407.29.00.25 Keruing, rough, sawn or chipped lengthwise, sliced or peeled 4407.29.00.30 Keruing, not rough, sawn or chipped lengthwise, sliced or peeled 4407.29.00.90 Other tropical wood, rough, sawn or chipped lengthwise, sliced or peeled 4407.29.00.95 Other tropical wood, not rough, sawn or chipped lengthwise, sliced or peeled 4407.29.01 Khaya Ivorensis /Milicia Excelsa, Okubé / Iroco 4407.29.05 Other tropical, end-jointed, over 6 mm thick 4407.29.10 Finger-jointed, whether or not planed or sanded 4407.29.10.00 Keruing, Ramin, Kapur, Jonkong, Merbau, Jelutong and Kempas 4407.29.10.01 keruing, ramin, kapur, teak, jongkong, merbau, jelutong and kempas, sawn or chipped lengthwise, sliced or peeled, planed, square dressed, structural, thicker than 6 mm 4407.29.10.09 Keruing, Ramin, Kapur, Teak, Jongkong, Merbau, Jelutong and Kempas, sawn or chipped lengthwise, sliced or peeled, planed, (not square dressed or structural), thicker than 6 mm 4407.29.10.10 Merbau (Kwila), sawn or chipped lengthwise, sliced or peeled, planed, square dressed, structure, thicker than 6 mm 4407.29.10.27 Merbau (Kwila), sawn or chipped lengthwise, sliced or peeled, planed, (not square dressed or structural), thicker than 6 mm 4407.29.10.39 Keruing, Kapur, Teak, Jongkong, Jelutong and Kempas, sawn or chipped lengthwise, sliced or peeled, planed, (not square dressed or structural), thicker than 6 mm 4407.29.15 Keruing, Ramin, Kapur, Teak, Jongkong, Merbau, Jelutong, Kempas, Okoumé, Obeche, Sipo, Acajou d’Afrique, Makoré, Tiama, Mansonia, Ilomba, Dibétou, Limba, Azobé, Rio de Palissandre, Palissandre de Para, Palissandre en Rose, Abura, Afrormosia, Ako, Andiroba, Aningré, Avodiré, Balau, Bossé clair, Bossé foncé, Cativo, Cedro, Dabema, Doussié, Framiré, Freijo, Fromager, Fuma, Geronggang, Ipé, Jaboty, Jequitiba, Kosipo, Kotibé, Koto, Louro, Maçaranduba, Mandioqueira, Mengkulang, Merawan, Merpauh, Mersawa, Moabi, Niangon, Nyatoh, Onzabili, Orey, Ovengkol, Ozigo, Padauk, Paldao, Palissandre de Guatemala, Pau Amarelo, Pau marfim, Pulai, punah, Quaruba, Saqui-Saqui, Sepetir, Sucupira, Suren, Tauari and Tola, sawn or chipped lengthwise, sliced or peeled, end-jointed , whether or not planed, or sanded thicker than 6 mm 4407.29.20 Planed: Palissandre de Rio, Palissandre de Para and Palissandre de Rose 4407.29.20.00 Teak 4407.29.25 Keruing, Ramin, Kapur, Teak, Jongkong, Merbau, Jelutong, Kempas, Okoumé, Obeche, Sipo, Acajou d’Afrique, Makoré, Tiama, Mansonia, Ilomba, Dibétou, Limba and Azobé, sawn or chipped lengthwise, sliced or peeled, planed (not end-jointed), thicker than 6 mm 4407.29.30 Merbau 4407.29.30.00 Okoume, Obeche, Sapelli, Sipo, Acajou, d’afrique, Makore, Iroko, Tiama, Mansonia, Ilomba, Dibetou Limba and Azobe 4407.29.30.09 Wood, tropical; (as specified in subheading note 1, chapter 44 , customs tariff), n.e.c. in item no. 4407.2, sawn or chipped lengthwise, sliced or peeled, planed, (not square dressed or structural), thicker than 6 mm 4407.29.31 Other: Blocks, strips and friezes for parquet or wood block flooring, not assembled 4407.29.39 Other 4407.29.40.01 Keruing, Ramin, Kapur, Teak, Jongkong, Merbau, Jelutong and Kempas, sawn or chipped lengthwise, sliced or peeled, sanded or end-jointed, thicker than 6 mm 4407.29.40.09 Wood, tropical; (as specified in subheading note 1, chapter 44, customs tariff), n.e.c. in item no. 4407.2, sawn or chipped lengthwise, sliced or peeled, sanded or end-jointed, thicker than 6 mm 4407.29.45 Keruing, Ramin, Kapur, Teak, Jongkong, Merbau, Jelutong, Kempas, Okoumé, Obeche, Sipo, Acajou d’Afrique, Makoré, Tiama, Mansonia, Ilomba, Dibétou, Limba, Azobé, Palissandre en Rio de Para and Palissandre Palissandre en Rose, sawn or chipped lengthwise, sliced or peeled, (not end-jointed), sanded, thicker than 6 mm4407.29.50 Sanded 4407.29.61 Other: Azobé
159
4407.29.68 Keruing, Ramin, Kapur, Teak, Jongkong, Merbau, Jelutong, Kempas, Okoumé, Obeche, Sipo, Acajou d’Afrique, Makoré, Tiama, Mansonia, Ilomba, Dibétou, Limba, Palissandre en Rio de Para and Palissandre en Rose, sawn or chipped lengthwise, sliced or peeled, (not planed, sanded or end-jointed), thicker than 6 mm 4407.29.69 Other: Other 4407.29.70 Other: Finger-jointed, whether or not planed or sanded 4407.29.90.01 Wood, tropical; Keruing, Ramin, Kapur, Teak, Jongkong, Merbau, Jelutong and Kempas, sawn or chipped lengthwise, sliced or peeled, (not planed or sanded or finger-jointed), thicker than 6 mm 4407.29.90.09 Wood, tropical; Not elsewhere specified in item no.4407.29, sawn or chipped lengthwise, sliced or peeled, (not planed or sanded or finger-jointed), thicker than 6 mm 4407.29.83 Abura, Afrormosia, Ako, Andiroba, Aningré, Avodiré, Balau, Bossé clair, Bossé foncé, Cativo, Cedro, Dabema, Doussié, Framiré, Freijo, Fromager, Fuma, Geronggang, Ipé, Jaboty, Jequitiba, Kosipo, Kotibé,Koto, Louro, Maçaranduba, Mahogany (excl. “Swietenia spp.”) Mandioqueira, Mengkulang, Merawan,Merpauh, Mersawa, Moabi, Niangon, Nyatoh, Onzabili, Orey, Ovengkol, Ozigo, Padauk, Paldao, Palissandre de Guatemala, Pau Amarelo, Pau Marfim, Pulai, Punah, Quaruba, Saqui-Saqui, Sepetir, Sucupira, Suren, Tauari and Tola, in the sawn or chipped lengthwise, sliced or peeled, planed (not end-jointed) thicker than 6 mm 4407.29.85 Abura, Afrormosia, Ako, Andiroba, Aningré, Avodiré, Balau, Bossé clair, Bossé foncé, Cativo, Cedro, Dabema, Doussié, Framiré, Freijo, Fromager, Fuma, Geronggang, Ipé, Jaboty, Jequitiba, Kosipo, Kotibé, Koto, Louro, Maçaranduba, Mandioqueira, Mengkulang, Merawan, Merpauh, Mersawa, Moabi, Niangon, Nyatoh, Onzabili, Orey, Ovengkol, Ozigo, Padauk, Paldao, Palissandre de Guatemala, Pau Amarelo, Pau, Marfim, Pulai, Punah, Quaruba, Saqui-Saqui, Sepetir, Sucupira, Suren, Tauari and Tola, sawn or chipped lengthwise, sliced or peeled, sanded, (not end-jointed), thicker than 6 mm 4407.29.90.00 Other 4407.29.90.07 Okoume, Obeche, Sipo, Acajou d’Afrique, Makore, Tiama, Ilomba, Mansonia, Dibetou, Limba, Azobe, sawn or chipped lengthwise, sliced or peeled, (not planed or sanded or end-jointed), thicker than 6 mm 4407.29.90.10 Keruing, Kapur, Teak, Jongkong, Jelutong and Kempas, sawn or chipped lengthwise, sliced or peeled, (not planed or sanded or end-jointed), thicker than 6 mm 4407.29.90.19 Merbau (Kwila), sawn or chipped lengthwise, sliced or peeled, (not planed or sanded or end-jointed), thicker than 6 mm 4407.29.90.27 Ramin, sawn or chipped lengthwise, sliced or peeled, (not planed or sanded or end-jointed), thicker than 6 mm 4407.29.90.39 Ramin, sawn or chipped lengthwise, sliced or peeled, (not planed or sanded or end-jointed), thicker than 6 mm 4407.29.95 Abura, Afrormosia, Ako, Andiroba, Aningré, Avodiré, Balau, Bossé clair, Bossé foncé, Cativo, Cedro,Dabema, Doussié, Framiré, Freijo, Fromager, Fuma, Geronggang, Ipé, Jaboty, Jequitiba, Kosipo, Kotibé, Koto , Louro, Maçaranduba, Mandioqueira, Mengkulang, Merawan, Merpauh, Mersawa, Moabi, Niangon, Nyatoh, Onzabili, Orey, Ovengkol, Ozigo, Padauk, Paldao, Palissandre de Guatemala, Pau Amarelo , Pau marfim, Pulai, Punah, Quaruba, Saqui-Saqui, Sepetir, Sucupira, Suren, Tauari and Tola, sawn or chipped lengthwise, sliced or peeled, (not end-jointed, planed or sanded), thicker than 6 mm 4407.29.99 Other Tropical Wood4407.99 Other non-coniferous 4407.99.00.00 Other sawnwood or chipped lengthwise, sliced or peeled 4407.99.00.90 Other sawnwood or chipped lenghtwise, planed or sanded, thicker than 6 mm 4407.99.90 Other 4407.99.90.10 Other 4407.99.96 Other 4407.99.96.00 Tropical wood sawn lengthwise, sliced peeled, (not end-jointed, planed or sanded), thicker than 6 mm
4408.30-90 Veneer sheets and sheets for plywood (whether or not spliced) and other tropical wood sawn lengthwise, sliced or finger-jointed, of a thickness not exceeding 6 mm. (ITTO: Veneer)
4408.30.00 Other tropical wood4408.31 Dark Red Meranti, Light Red Meranti and Meranti Bakau
4408.31.00.00 Veneer or plywood sheets, Dark/Light Red Meranti and Meranti Bakau, not exceeding 6 mm 4408.31.01 Dark Red Meranti, Light Red Meranti and Meranti Bakau veneer sheets and sheets for plywood and other wood sawn/sliced/peeled, not over 6 mm thick 44.08.31.01.00 Veneer sheets and sheets for plywood of Dark Red Meranti, Light Red Meranti and Meranti Bakau wood sawn lengthwise, sliced or peeled, thickness not over 6 mm 4408.31.10.00 Dark Red Meranti and Light Red Meranti 4408.31.11 Finger-jointed, whether or not planed or sanded 4408.31.21 Planed 4408.31.25 Sanded 4408.31.30 Other 4408.31.30.00 Dark Red Meranti, Light Red Meranti and Meranti Bakau (for veneering obtained by slicing laminated wood or for other similar laminated wood) 4408.31.90 Other sheets of Dark/Light Red Meranti & Meranti Bakau, not elsewhere specified, thick ≤ 6 mm 4408.31.90.00 Veneer sheets, other 4408.31.90.11 Dark Red Meranti, Light Red Meranti (for manufacturing plywood) 4408.31.90.12 Dark Red Meranti, Light Red Meranti (patterned veneer) 4408.31.90.21 Meranti Bakau (for manufacturing plywood) 4408.31.90.29 Wood, tropical; Dark Red Meranti, Light Red Meranti, sheets for veneer or plywood, other wood sawn lengthwise, sliced, not planed, not thicker than 1 mm 4408.31.90.39 Dark Red Meranti, Light Red Meranti, sheets for veneer or plywood, other wood sawn lengthwise, sliced, not planed, over 1 mm but not over 6 mm thick4408.39 Other Tropical Wood 4408.39.00 Other Tropical Wood 4408.39.00.00 Veneer sheets and sheets for plywood and other wood sawn lengthwise, sliced or peeled, thickness not over 6 mm, other tropical wood, not elsewhere specified or indicated 4408.39.01 Jelutong 4408.39.00.10 Mahogany, Philippine (Lauan) 4408.39.00.20 Mahogany, African (Acajou d’Afrique) 4408.39.00.30 Mahogany, American (Swietenia spp.) 4408.39.00.90 Other 44.08.39.01.00 Veneer sheets and sheets for plywood and other wood sawn lengthwise, sliced or peeled, of a thickness not exceeding 6 mm, of tropical woods 4408.39.10.00 Teak 4408.39.10.09 Wood, tropical; (as in subheading note 1, chapter 44, customs tariff), n.e.c. in item no. 4408.3 sheets for veneer or plywood, other wood sawn lengthwise, sliced or peeled, planed, not thicker than 6 mm 4408.39.10.10 Sheets for veneering. Dark Red Meranti or Mahogany, African. 4408.39.10.90 Sheets for veneering. Dark Red Meranti or Mahogany, other. 4408.39.11-35 White Lauan, Sipo, Limba, Okoumé, Obeche, Acajou d’Afrique, Sapelli, Virola, Mahogany (Swietenia spp.), Palissandre de Rio, Palissandre de Para and Palissandre de Rose. 4408.39.11 Finger-jointed, whether or not planed or sanded 4408.39.15 Veneer sheets for plywood. Laminated wood, sawn lengthwise, sliced or peeled, of thickness not over 6 mm, sanded, and end-jointed, not planed, of White lauan, Sipo, Limba, Okoumé, Obeche, Acajou d’Afrique, Sapelli, Virola, Mahogany “Swietenia spp.” Palissandre de Rio, de Para and de Rose 4408.39.21 Planed 4408.39.25 Sanded 4408.39.31 Other: of a thickness not exceeding 1 mm 4408.39.31.00 Veneer (of a thickness not exceeding 1 mm) Of White Lauan, Mahogany, Sapeli... not exclusively specified in 4408.31.11-25 4408.39.35 Other: Of a thickness exceeding 1 mm 4408.39.51-99 Other 4408.39.55 Veneer sheets for plywood or similar. Laminated wood, sawn lengthwise, sliced or peeled, of a thickness not over 6 mm, planed, sanded or end-jointed, of Abura, Afrormosia, Ako, Alan, Andiroba, Aningré, Avodiré, Azobé, Balau, Balsa,Bossé clair, Bossé foncé, Cativo, Cedro, Dabema, Dibétou, Doussié, Framiré, Freijo, Fromager, Fuma, Geronggang, Ilomba, Imbuia, Ipé, Iroko, Jaboty, Jelutong, Jequitiba,Jongkong, Kapur, Kempas, Keruing, Kosipo,
160
Kotibé, Koto, Louro, Maçaranduba, Mahogany (excl. “Swietenia spp.”), Makoré, Mandioqueira, Mansonia, Mengkulang, Merawan, Merbau, Merpauh,Mersawa, Moabi, Niangon, Nyatoh, Onzabili, Orey, Ovengkol, Ozigo, Padauk, Paldao, Palissandre de Guatemala, Pau Amarelo, Pau Marfim, Pulai, Punah, Quaruba, Ramin, Saqui-Saqui, Sepetir, Sucupira, Suren, Tauari, Teak, Tiama, Tola, White Meranti, White and Yellow Meranti Seraya 4408.39.60.00 Other. For veneering obtained by slicing laminated wood or for other similar laminated wood 4408.39.70 Veneer for the manufacturing of pencils, of a thickness not over 6 mm of Abura, Afrormosia, Ako, Alan, Andiroba, Aningré, Avodiré, Azobé, Balau , Balsa, Bossé clair, Bossé foncé, Cativo, Cedro, Dabema,Dibétou, Doussié, Framiré, Freijo, Fromager, Fuma, Geronggang, Ilomba, Imbuia, Ipé, Iroko, Jaboty, Jelutong, Jequitiba, Jongkong, Kapur, Kempas, Keruing, Kosipo, Kotibé, Koto, Louro, Maçaranduba, Mahogany (excl. “Swietenia spp.”), Makoré, Mandioqueira, Mansonia, Mengkulang, Merawan, Merbau, Merpauh, Mersawa, Moabi, Niangon, Nyatoh, Onzabili, Orey, Ovengkol, Ozigo, Padauk, Paldao, Palissandre de Guatemala, Pau Amarelo, Pau Marfim, Pulai, Punah, Quaruba, Ramin, Saqui-Saqui, Sepetir, Sucupira, Suren, Tauari, Teak, Tiama, Tola, White Meranti, White and Yellow Meranti Seraya 4408.39.81 Other: of a thickness not exceeding 1 mm: Makoré, Iroko, Tiama, Mansonia, Ilomba, Dibétou, Azobé, White Meranti, White Seraya, Yellow Meranti, Alan, Keruing, Ramin, Kapur, Teak, Jongkong, Merbau, Jelutong, Kempas, Imbuia and Balsa 4408.39.85 Veneer sheets for plywood or similar. Laminated wood and other wood, sawn lengthwise, sliced or peeled also spliced, (not planed, sanded or end-jointed), of a thickness not over 1 mm of Abura, Afrormosia, Ako, Alan, Andiroba, Aningré, Avodiré, Azobé, Balau, Balsa, Bossé clair, Bossé foncé, Cativo, Cedro, Dabema, Dibétou, Doussié, Framiré, Freijo, Fromager, Fuma, Geronggang, Ilomba,Imbuia, Ipé, Iroko, Jaboty, Jelutong, Jequitiba, Jongkong, Kapur, Kempas, Keruing, Kosipo, Kotibé, Koto, Louro, Maçaranduba, Mahogany (excl “Swietenia spp.”) Makoré, Mandioqueira, Mansonia, Mengkulang, Merawan, Merbau, Merpauh, Mersawa, Moabi, Niangon, Nyatoh, Onzabili, Orey, Ovengkol, Ozigo, Padauk , Paldao, Palissandre de Guatemala, Pau Amarelo, Pau marfim, Pulai, Punah, Quaruba, Ramin, Saqui-Saqui, Sepetir, Sucupira, Suren, Tauari, Teak, Tiama, Tola,White Meranti, White Seraya and Yellow Meranti 4408.39.85.00 Veneer of a thickness not exceeding 1 mm 4408.39.89 Other 4408.39.90 Other specified tropical wood sheets, not elsewhere specified, thick ≤ 6 mm 4408.39.90.00 Jelutong 4408.39.90.09 White Lauan, Sipo, Limba, Okoumé, Obeche, Acajou d’Afrique, Sapelli, Mahogany (Swietenia spp.), sheets for veneer or plywood, other wood sawn lengthwise, sliced or peeled, rotary, not planed, over 1 mm but not over 6 mm thick 4408.39.90.10 Sheets for veneering. Other. Mahogany, African. 4408.39.90.11 Teak (for manufacturing plywood) 4408.39.90.12 Teak (patterned veneer) 4408.39.90.19 Teak (other) 4408.39.90.20 Sheets for veneering not exceeding 6 mm in thickness. Of tropical wood. Dark Red Meranti, Mahogany, African 4408.39.90.29 White Lauan, Sipo, Limba, Okoume, Obeche, Acajou d’Afrique, Sapelli, Mahogany (Swietenia spp.), sheets for veneer or plywood, other wood sawn lengthwise, sliced, not planed, over 1 mm but not over 6 mm thick 4408.39.90.31 Sipo, Okoume, Obeche, Acajou d’Afrique and Sapelli (for manufacturing plywood) 4408.39.90.32 Sipo, Okoume, Obeche, Acajou d’afrique and Sapelli (patterned veneer) 4408.39.90.39 Wood, tropical; (as in subheading note 1, chapter 44, customs tariff), n.e.c. in item no.4408.3, sheets for veneer or plywood, other wood sawn lengthwise, sliced, not planed, 1 mm thick or less 4408.39.90.49 Wood, tropical; (as in subheading note 1, chapter 44, customs tariff), n.e.c. in item no. 4408.3, sheets for veneer or plywood, other wood sawn lengthwise, sliced, not planed, over 1 mm but not over 6 mm thick 4408.39.90.50 Mahogany (Swietenia spp) 4408.39.90.59 Mahogany (Other), sheets for veneer or plywood, other wood sawn lengthwise, peeled, rotary, not planed, 1 mm thick or less 4408.39.90.61 Wood, tropical; (as specified in subheading note 1, chapter 44, customs tariff), n.e.c. in item no. 4408.3, sheets for veneer or plywood, other wood sawn lengthwise, sliced, not planed,1 mm thick or less 4408.39.90.90 Sheets for veneering, etc. Of tropical wood, etc. Dark Red Meranti, etc. Mahogany, African. Mahogany, other.
161
4408.39.90.91-99 Other 4408.39.91 Of a thickness exceeding 1 mm: Makoré, Iroko, Tiama, Mansonia, Ilomba, Dibétou, Azobé, White Meranti, White Seraya, Yellow Meranti, Alan, Keruing, Ramin, Kapur, Teak, Jongkong, Merbau, Jelutong, Kempas, Imbuia and Balsa 4408.39.95 Veneer sheets for plywood or similar. Laminated wood and other wood, sawn lengthwise, sliced or peeled, also spliced, (not planed, sanded or end-jointed), with a thickness exceeding 1 mm but not exceeding 6 mm, of Abura, Afrormosia, Ako, Alan, Andiroba, Aningré, Avodiré, Azobé, Balau, Balsa, Bossé clair, Bossé foncé, Cativo, Cedro, Dabema, Dibétou, Doussié, Framiré, Freijo, Fromager, Fuma, Geronggang, Ilomba, Imbuia, Ipé, Iroko, Jaboty, Jelutong, Iequitiba, Jongkong, Kapur, Kempas,Keruing, Kosipo, Kotibé, Koto, Louro, Maçaranduba, Mahogany (excl. “Swietenia spp.”) Makoré, Mandioqueira, Mansonia, Mengkulang, Merawan, Merbau, Merpauh, Mersawa, Moabi, Niangon, Nyatoh, Onzabili, Orey, Ovengkol, Ozigo, Padauk, Paldao, Palissandre de Guatemala, Pau Amarelo, Pau Marfim, Pulai, Punah, Quaruba, Ramin, Saqui-Saqui, Sepetir, Sucupira, Suren, Tauari, Teak, Tiama, Tola, White Meranti, White Seraya and Yellow meranti 4408.39.99 Other4408.90 Other non-coniferous 4408.90.00.00 Other sheets for veneering of thickness not exceeding 6 mm 4408.90.02.09 Wood; tropical hardwoods, n.e.c. in heading no. 4408, sheets for veneer or plywood, other wood sawn lengthwise, sliced or peeled, planed, not thicker than 6 mm 4408.90.08.31 Wood; tropical hardwoods, n.e.c. in heading no. 4408, sheets for veneer or plywood, other wood sawn lengthwise, sliced or peeled, rotary, not planed, not thicker than 1 mm 4408.90.08.39 Wood; tropical hardwoods, n.e.c. in heading no. 4408, sheets for veneer or plywood, other wood sawn lengthwise, sliced, not planed, not thicker than 1 mm 4408.90.08.41 Tropical hardwoods, not elsewhere specified in heading no. 4408, sheets for veneer or plywood, other wood sawn lengthwise, sliced or peeled, rotary, not planed, over 1 mm but not over 6 mm thick 4408.90.10.29 Other. Sheets for veneering, etc. including those obtained by slicing laminated wood. Other, not reinforced or backed: Other. 4408.90.85.00 Of a thickness not exceeding 1 mm. 4408.90.90.29 Other. Sheets for veneering, etc. including those obtained by slicing laminated wood. Other, not reinforced or backed: Other. 4408.90.90.30 Other. Sheets for veneering, etc. including those obtained by slicing laminated wood. Reinforced or backed 4408.90.95.00 Of a thickness exceeding 1 mm. 4408.90.99 Other wood sheets, nes, of a thickness not exceeding 6 mm 4408.90.99.12 Other wood sheets, nes, of a thickness not exceeding 6 mm 4408.90.99.13 Other wood sheets, nes, of a thickness not exceeding 6 mm 4408.90.99.19 Other wood sheets, nes, of a thickness not exceeding 6 mm
4412.13-99 Plywood, veneered panels and similar laminated wood. (ITTO: Plywood)
4412.10.01.00 Plywood; of bamboo, consisting solely of sheets of wood, each ply 6 mm or thinner 4412.10.29.00 Plywood; of bamboo, consisting solely of sheets of wood, each ply thicker than 6 mm4412.13 Plys all wood, each ≤ 6 mm, with at least one outer ply of tropical wood 4412.13.01 Plywood consisting solely of sheets of wood, each ply not exceeding 6 mm in thickness, with at least one outer ply of tropical wood 4412.13.05.20 Birch plywood, panels <= 3.6 mm thick, <=1.2 m width, 2.2 m length, sheets <= 6 mm, one ply tropical, not surface covered 4412.13.09 Plywood consisting only of sheets of wood of a thickness not exceeding 6 mm each and at least one outer ply of tropical wood 4412.13.10 Whether or not painted, edge- or face-worked, but not otherwise worked or surface covered. With at least one outer ply of the following tropical woods:Dark Red Meranti, Light Red Meranti, White Lauan, Sipo, Limba, Okoume, Obeche, Acajou d’Afrique, Sapelli or Mahogany (Swietenia spp.) 4412.13.10.00 Unfinished, interior grade Lauan Mahogany plywood panels, thickness not exceeding 6.35 mm and width of 1.1 m or more, whether or not edge-trimmed 4412.13.10.01 Plywood; wood only, each ply 6 mm or thinner, at least 1 outer ply tropical, either Dark or Light Red Meranti, White Lauan, Sipo, Sapelli, Limba, Okoumé, Obeche, Mahogany (Swietenia spp.) or Acajou d’Afrique, overlaid, including veneered 4412.13.10.09 Plywood; wood only, each ply 6 mm or thinner, at least 1 outer ply tropical, either Dark
162
or Light Red Meranti, White Lauan, Sipo, Sapelli, Limba, Okoumé, Obeche, Mahogany (Swietenia spp.) or Acajou d’Afrique, not overlaid, or veneered 4412.13.10.19 Doorskins of Mahogany, other than Philippine 4412.13.10.20 Teak 4412.13.10.30 Other, Philippine Mahogany (Lauan) 4412.13.10.80 Other, Mahogany 4412.13.10.90 Other 4412.13.11 Okoumé 4412.13.19 Dark Red Meranti, Light Red Meranti, White Lauan, Sipo, Limba, Obeche, Acajou d’Afrique, Sapelli, Virola, Mahogany (Swietenia spp.), Palissandre de Rio, Palissandre de Para and Palissandre de Rose 4412.13.20.00 Of a thickness less than 4 mm but not less than 3.2 mm 4412.13.30.00 Of a thickness not more than 6 mm but not less than 4 mm 4412.13.40.00 Of a thickness less than 12 mm but not less than 6 mm 4412.13.40.40 Mahogany plywood, sheets <= 6 mm, one ply tropical, clear covered or not surface covered 4412.13.40.50 other plywood, panels not exceeding 3.6 mm thick, 1.2 m width, 2.2 m length, sheets <= 6 mm, one ply tropical, clear covered or not surface covered 4412.13.40.60 Other plywood, sheets <= 6 mm, one ply tropical, not surface covered 4412.13.40.70 Other plywood, sheets <= 6 mm, one ply tropical, clear covered 4412.13.50.00 Of a thickness less than 15 mm but not less than 12 mm 4412.13.51.30 Plywood with a face ply of sen, at least one outer ply of tropical wood, solely sheets of wood, not/or surface covered with a clear material, not over 6 mm thick 4412.13.51.50 Plywood panels with at least one outer ply of tropical wood, not/or surface covered with a clear material, not over 3.6 mm thick, 1.2 m wide, 2.2 m long, not elsewhere specified or indicated 4412.13.51.60 Plywood with at least one outer ply of tropical wood, not over 6 mm thick, not surface covered, not elsewhere specified or indicated 4412.13.51.70 Plywood with at least one outer ply of tropical wood, consisting solely of sheets of wood, not over 6 mm thick, surface covered with a clear material, not elsewhere specified or indicated 4412.13.60.00 Dark/Light Red Meranti, White Lauan, Sipo, Limba, etc, plywood, sheets <= 6 mm, one ply tropical, clear covered or not surface covered 4412.13.90 With at least one outer ply of other tropical wood. Other 4412.13.90.13 Whether or not painted, edge- or face-worked, but not otherwise worked or surface-covered: Other, of mahogany. 4412.13.90.19 Doorskins of Mahogany, other than Philippine 4412.13.90.01 Other 4412.13.90.02 Other 4412.13.90.90 Other 4412.13.99 Other4412.14 Plys all wood, each ≤ 6 mm with at least one outer ply of non-coniferous wood 4412.14.10 Plywood of Baboen, Palissandre du Bresil or Bois de Rose femelle 4412.14.10.90 Plywood consisting solely of sheets of wood, with at least one outer ply of non-coniferous wood, each ply not exceeding 6 mm in thickness 4412.14.31.40 Plywood, face ply of mahogany, at least one outer ply of non-coniferous wood, solely of sheets of wood, not/or surface covered with a clear material 4412.14.90 Other 4412.14.90.19 Other. Whether or not painted, edge- or face-worked, but not otherwise worked or surface-covered. Other. 4412.14.90.90 Plywood consisting solely of sheets of wood, with at least one outer ply of non-coniferous, other than tropical wood, each ply not exceeding 6 mm in thickness4412.22 Plys not all wood and/or at least one ply > 6 mm, with at least one outer ply of tropical wood 4412.22.01 Swietenia Macrophylla 4412.22.10 Containing at least one layer of particle board 4412.22.10.00 Whether or not painted, edge- or face-worked, but not otherwise worked or surface-covered 4412.22.31.40 Plywood with a face ply of mahogany, with at least one ply of tropical wood, not surface covered or surface covered with a clear material 4412.22.31.50 Plywood with at least one ply of tropical wood, panels not exceeding 3.6 mm thick,
163
1.2 m wide, 2.2 mm long, not/or surface covered with a clear material 4412.22.31.60 Plywood with at least one ply of tropical wood, over 3.6 mm thick 1.2 mm wide and 2.2 mm long, not surface covered, not elsewhere specified or indicated 4412.22.31.70 Plywood with at least one ply of tropical wood, not elsewhere specified or indicated 4412.22.41.00 Plywood with at least one outer ply of tropical wood, surface if covered, not elsewhere specified or indicated 4412.22.90.00 Other 4412.22.90.10 Other, with at least one outer ply of non-coniferous wood: Other. Whether or not painted, edge-or face-worked, but not otherwise worked or surface-covered. 4412.22.91 Blockboard, laminboard and battenboard 4412.22.99 Veneered wood Other, w/one outer ply of Tropical4412.23 Plys not all wood and/or at least one ply > 6 mm, at least one outer ply non-coniferous, at least one layer of particleboard 4412.23.01 Other. With at least one ply of non-coniferous wood. Containing at least one layer of particle board 4412.23.01.00 Plywood with at least one outer ply of tropical wood, solely of sheets of wood not >= 6 mm thickness 4412.23.99 Other 4412.29.00.10 Whether or not painted, edge- or face-worked, but not otherwise worked or surface covered 4412.29.00.90 Other 4412.29.36.40 Plywood with a face ply of Mahogany, with at least one outer ply of non-coniferous wood, not surface covered or surface covered with a clear material4412.29 Other with at least one outer ply of non-coniferous wood: Other 4412.29.99 Other4412.31 With at least one outer ply of other tropical wood 4412.31.01 Meranti 4412.31.01.10 Plywood; consisting only of sheets of wood (not bamboo), each ply 6 mm or thinner, with at least one outer ply of Dark or Light Red Meranti, White Lauan, Sipo, Sapelli, Limba, Okoume, Obeche, Mahogany or Acajou d’Afrique, overlaid, including veneered 4412.31.01.19 Plywood; consisting only of sheets of wood (not bamboo), each ply 6 mm or thinner, with at least one outer ply of Dark or Light Red Meranti, White Lauan, Sipo, Sapelli, Limba, Okoume, Obeche, Mahogany or Acajou d’Afrique, not overlaid or veneered 4412.31.09.10 Plywood; consisting only of sheets of wood (not bamboo), each ply 6 mm or thinner, not containing an outer ply of non-coniferous or tropical wood, overlaid, including veneered 4412.31.09.19 Plywood; consisting only of sheets of wood (not bamboo), each ply 6 mm or thinner, not containing an outer ply of non-coniferous or tropical wood, not overlaid or veneered 4412.31.09.29 Plywood; consisting only of sheets of wood (not bamboo), each ply 6 mm or thinner, with at least one outer ply of tropical wood (as specified in subheading note 1, chapter 44, customs tariff) n.e.c. in item no.4412.31.09, overlaid, including veneered 4412.31.10 Decorative plywood 4412.31.10.00 Unfinished, interior grade Lauan Mahogany plywood panels, of a thickness not exceeding 6.35 mm and of a width of 1.1m or more, whether or not edge trimmed etc. 4412.31.20.00 Of a thickness less than 4mm but not less than 3.2 mm 4412.31.30.00 Of a thickness not more than 6mm but not less than 4 mm 4412.31.40.00 Of a thickness less than 10mm but not less than 6 mm 4412.31.50.00 Of a thickness less than 12mm but not less than 10 mm 4412.31.60.00 Of a thickness less than 15mm but not less than 12 mm 4412.31.70.00 Of a thickness not less than 15 mm 4412.31.90 Other 4412.31.90.13 Other. Whether or not painted, edge or face worked, but not otherwise worked or surface covered: Other, of Mahogany. 4412.31.90.19 Other. Whether or not painted, edge or face worked, but not otherwise worked or surface covered: Other. 4412.31.90.90 Other. Other. 4412.32.00 Other, with at least one outer ply of non-coniferous wood 4412.32.10.90 At least one surface is a temperate non-coniferous wood plywood sheet
164

4412.32.90 5-ply and 7-ply hardwood plywood for use as backing in the manufacture of hardwood plywood panels for flooring. Other wood 4412.32.90.19 Other. Whether or not painted, edge or face worked, but not otherwise worked or surface covered: Other4412.92 Plys not all wood and/or at least one ply > 6 mm, both outer plys coniferous with at least one ply of tropical wood 4412.92.10.00 Whether or not painted, edge- or face-worked, but not otherwise worked or surface-covered 4412.92.90.00 Other 4412.92.99 Other4412.99 Other 4412.99.70 Okoume
165
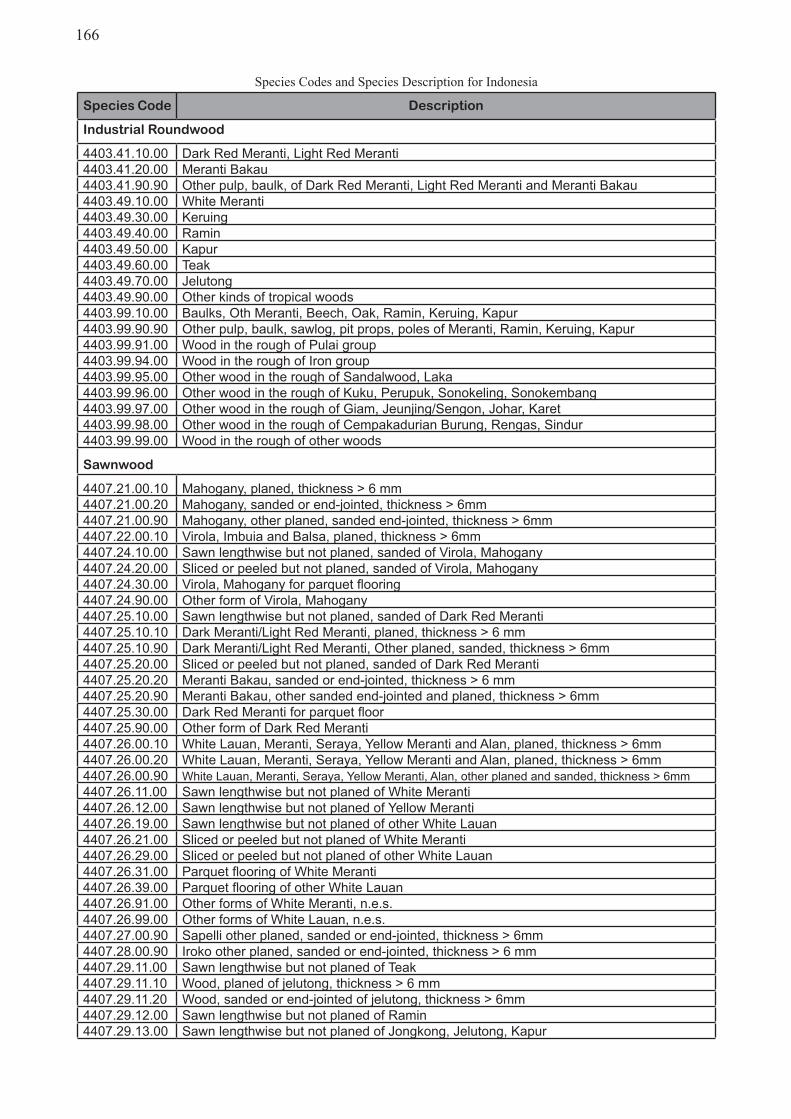
166
Species Codes and Species Description for Indonesia
Species Code Description
Industrial Roundwood
4403.41.10.00 Dark Red Meranti, Light Red Meranti4403.41.20.00 Meranti Bakau4403.41.90.90 Other pulp, baulk, of Dark Red Meranti, Light Red Meranti and Meranti Bakau4403.49.10.00 White Meranti4403.49.30.00 Keruing4403.49.40.00 Ramin4403.49.50.00 Kapur4403.49.60.00 Teak4403.49.70.00 Jelutong4403.49.90.00 Other kinds of tropical woods4403.99.10.00 Baulks, Oth Meranti, Beech, Oak, Ramin, Keruing, Kapur4403.99.90.90 Other pulp, baulk, sawlog, pit props, poles of Meranti, Ramin, Keruing, Kapur4403.99.91.00 Wood in the rough of Pulai group4403.99.94.00 Wood in the rough of Iron group4403.99.95.00 Other wood in the rough of Sandalwood, Laka4403.99.96.00 Other wood in the rough of Kuku, Perupuk, Sonokeling, Sonokembang4403.99.97.00 Other wood in the rough of Giam, Jeunjing/Sengon, Johar, Karet4403.99.98.00 Other wood in the rough of Cempakadurian Burung, Rengas, Sindur4403.99.99.00 Wood in the rough of other woods
Sawnwood
4407.21.00.10 Mahogany, planed, thickness > 6 mm4407.21.00.20 Mahogany, sanded or end-jointed, thickness > 6mm4407.21.00.90 Mahogany, other planed, sanded end-jointed, thickness > 6mm4407.22.00.10 Virola, Imbuia and Balsa, planed, thickness > 6mm4407.24.10.00 Sawn lengthwise but not planed, sanded of Virola, Mahogany4407.24.20.00 Sliced or peeled but not planed, sanded of Virola, Mahogany4407.24.30.00 Virola, Mahogany for parquet flooring4407.24.90.00 Other form of Virola, Mahogany4407.25.10.00 Sawn lengthwise but not planed, sanded of Dark Red Meranti4407.25.10.10 Dark Meranti/Light Red Meranti, planed, thickness > 6 mm4407.25.10.90 Dark Meranti/Light Red Meranti, Other planed, sanded, thickness > 6mm4407.25.20.00 Sliced or peeled but not planed, sanded of Dark Red Meranti4407.25.20.20 Meranti Bakau, sanded or end-jointed, thickness > 6 mm4407.25.20.90 Meranti Bakau, other sanded end-jointed and planed, thickness > 6mm4407.25.30.00 Dark Red Meranti for parquet floor4407.25.90.00 Other form of Dark Red Meranti4407.26.00.10 White Lauan, Meranti, Seraya, Yellow Meranti and Alan, planed, thickness > 6mm4407.26.00.20 White Lauan, Meranti, Seraya, Yellow Meranti and Alan, planed, thickness > 6mm4407.26.00.90 White Lauan, Meranti, Seraya, Yellow Meranti, Alan, other planed and sanded, thickness > 6mm4407.26.11.00 Sawn lengthwise but not planed of White Meranti4407.26.12.00 Sawn lengthwise but not planed of Yellow Meranti4407.26.19.00 Sawn lengthwise but not planed of other White Lauan4407.26.21.00 Sliced or peeled but not planed of White Meranti4407.26.29.00 Sliced or peeled but not planed of other White Lauan4407.26.31.00 Parquet flooring of White Meranti4407.26.39.00 Parquet flooring of other White Lauan4407.26.91.00 Other forms of White Meranti, n.e.s.4407.26.99.00 Other forms of White Lauan, n.e.s.4407.27.00.90 Sapelli other planed, sanded or end-jointed, thickness > 6mm4407.28.00.90 Iroko other planed, sanded or end-jointed, thickness > 6 mm4407.29.11.00 Sawn lengthwise but not planed of Teak4407.29.11.10 Wood, planed of jelutong, thickness > 6 mm4407.29.11.20 Wood, sanded or end-jointed of jelutong, thickness > 6mm4407.29.12.00 Sawn lengthwise but not planed of Ramin4407.29.13.00 Sawn lengthwise but not planed of Jongkong, Jelutong, Kapur
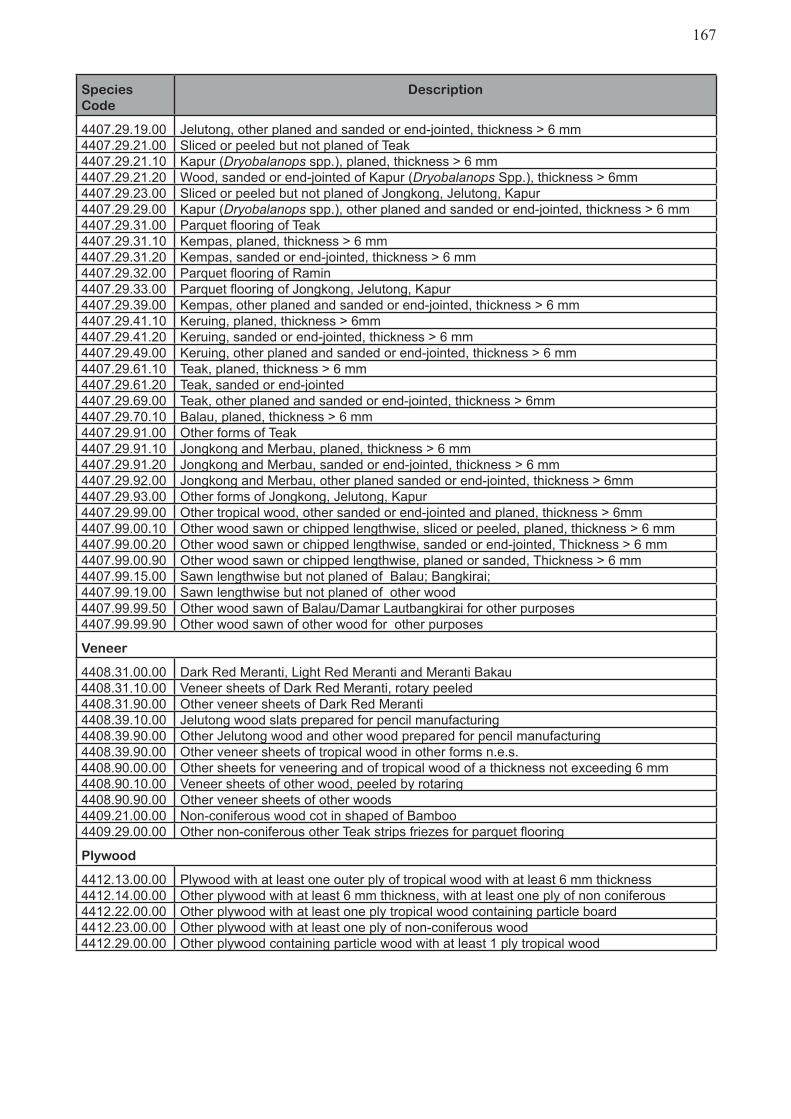
Species Code
Description
4407.29.19.00 Jelutong, other planed and sanded or end-jointed, thickness > 6 mm4407.29.21.00 Sliced or peeled but not planed of Teak4407.29.21.10 Kapur (Dryobalanops spp.), planed, thickness > 6 mm4407.29.21.20 Wood, sanded or end-jointed of Kapur (Dryobalanops Spp.), thickness > 6mm4407.29.23.00 Sliced or peeled but not planed of Jongkong, Jelutong, Kapur4407.29.29.00 Kapur (Dryobalanops spp.), other planed and sanded or end-jointed, thickness > 6 mm4407.29.31.00 Parquet flooring of Teak4407.29.31.10 Kempas, planed, thickness > 6 mm4407.29.31.20 Kempas, sanded or end-jointed, thickness > 6 mm4407.29.32.00 Parquet flooring of Ramin4407.29.33.00 Parquet flooring of Jongkong, Jelutong, Kapur4407.29.39.00 Kempas, other planed and sanded or end-jointed, thickness > 6 mm4407.29.41.10 Keruing, planed, thickness > 6mm4407.29.41.20 Keruing, sanded or end-jointed, thickness > 6 mm4407.29.49.00 Keruing, other planed and sanded or end-jointed, thickness > 6 mm4407.29.61.10 Teak, planed, thickness > 6 mm4407.29.61.20 Teak, sanded or end-jointed4407.29.69.00 Teak, other planed and sanded or end-jointed, thickness > 6mm4407.29.70.10 Balau, planed, thickness > 6 mm4407.29.91.00 Other forms of Teak4407.29.91.10 Jongkong and Merbau, planed, thickness > 6 mm4407.29.91.20 Jongkong and Merbau, sanded or end-jointed, thickness > 6 mm4407.29.92.00 Jongkong and Merbau, other planed sanded or end-jointed, thickness > 6mm4407.29.93.00 Other forms of Jongkong, Jelutong, Kapur4407.29.99.00 Other tropical wood, other sanded or end-jointed and planed, thickness > 6mm4407.99.00.10 Other wood sawn or chipped lengthwise, sliced or peeled, planed, thickness > 6 mm4407.99.00.20 Other wood sawn or chipped lengthwise, sanded or end-jointed, Thickness > 6 mm4407.99.00.90 Other wood sawn or chipped lengthwise, planed or sanded, Thickness > 6 mm4407.99.15.00 Sawn lengthwise but not planed of Balau; Bangkirai;4407.99.19.00 Sawn lengthwise but not planed of other wood4407.99.99.50 Other wood sawn of Balau/Damar Lautbangkirai for other purposes4407.99.99.90 Other wood sawn of other wood for other purposes
Veneer
4408.31.00.00 Dark Red Meranti, Light Red Meranti and Meranti Bakau4408.31.10.00 Veneer sheets of Dark Red Meranti, rotary peeled4408.31.90.00 Other veneer sheets of Dark Red Meranti4408.39.10.00 Jelutong wood slats prepared for pencil manufacturing4408.39.90.00 Other Jelutong wood and other wood prepared for pencil manufacturing4408.39.90.00 Other veneer sheets of tropical wood in other forms n.e.s.4408.90.00.00 Other sheets for veneering and of tropical wood of a thickness not exceeding 6 mm4408.90.10.00 Veneer sheets of other wood, peeled by rotaring4408.90.90.00 Other veneer sheets of other woods4409.21.00.00 Non-coniferous wood cot in shaped of Bamboo4409.29.00.00 Other non-coniferous other Teak strips friezes for parquet flooring
Plywood
4412.13.00.00 Plywood with at least one outer ply of tropical wood with at least 6 mm thickness4412.14.00.00 Other plywood with at least 6 mm thickness, with at least one ply of non coniferous4412.22.00.00 Other plywood with at least one ply tropical wood containing particle board4412.23.00.00 Other plywood with at least one ply of non-coniferous wood4412.29.00.00 Other plywood containing particle wood with at least 1 ply tropical wood
167

168
169
APPENDIX 4
Prices of Major Topical Timber and Selected Competing Softwood Products
4-1. Logs .................................................................................................................................. 171
4-2. Sawnwood ......................................................................................................................... 175
4-3. Plywood ............................................................................................................................. 178
4-4. Secondary Processed Wood Products ............................................................................... 182
N.B. Export values/prices are FOB; import values are CIF, unless otherwise stated.

170
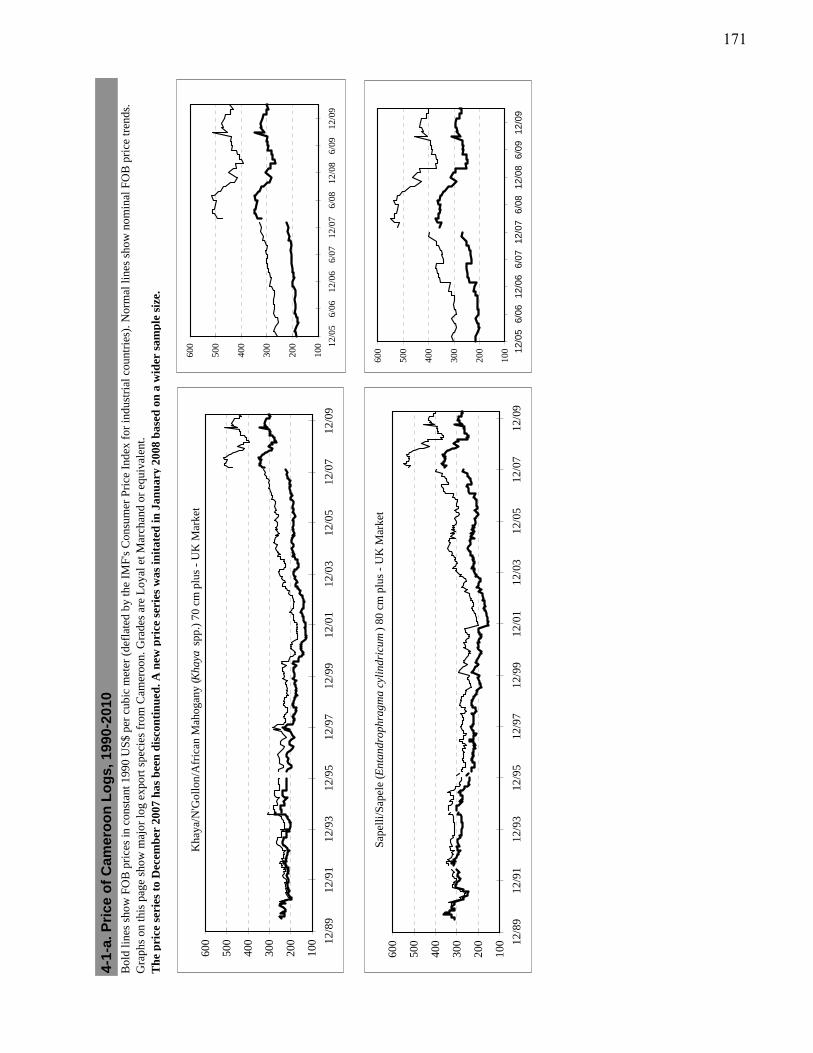
Bol
d li
nes
show
FO
B p
rice
s in
con
stan
t 199
0 U
S$
per
cubi
c m
eter
(de
flat
ed b
y th
e IM
F's
Con
sum
er P
rice
Ind
ex f
or in
dust
rial
cou
ntri
es).
Nor
mal
line
s sh
ow n
omin
al F
OB
pri
ce tr
ends
. G
raph
s on
this
pag
e sh
ow m
ajor
log
expo
rt s
peci
es f
rom
Cam
eroo
n. G
rade
s ar
e L
oyal
et M
arch
and
or e
quiv
alen
t. T
he
pri
ce s
erie
s to
Dec
emb
er 2
007
has
bee
n d
isco
nti
nu
ed. A
new
pri
ce s
erie
s w
as in
itat
ed in
Jan
uar
y 20
08 b
ased
on
a w
ider
sam
ple
siz
e.
4-1-
a. P
rice
of
Cam
ero
on
Lo
gs,
199
0-20
10
Kha
ya/N
'Gol
lon/
Afr
ican
Mah
ogan
y (K
haya
spp
.) 7
0 cm
plu
s -
UK
Mar
ket
100
200
300
400
500
600 12
/89
12/9
112
/93
12/9
512
/97
12/9
912
/01
12/0
312
/05
12/0
712
/09
Sap
elli
/Sap
ele
(Ent
andr
ophr
agm
a cy
lindr
icum
) 80
cm
plu
s -
UK
Mar
ket
100
200
300
400
500
600 12
/89
12/9
112
/93
12/9
512
/97
12/9
912
/01
12/0
312
/05
12/0
712
/09
100
200
300
400
500
600 12
/05
6/06
12/0
66/
0712
/07
6/08
12/0
86/
0912
/09
100
200
300
400
500
600 12
/05
6/06
12/0
66/
0712
/07
6/08
12/0
86/
0912
/09
171
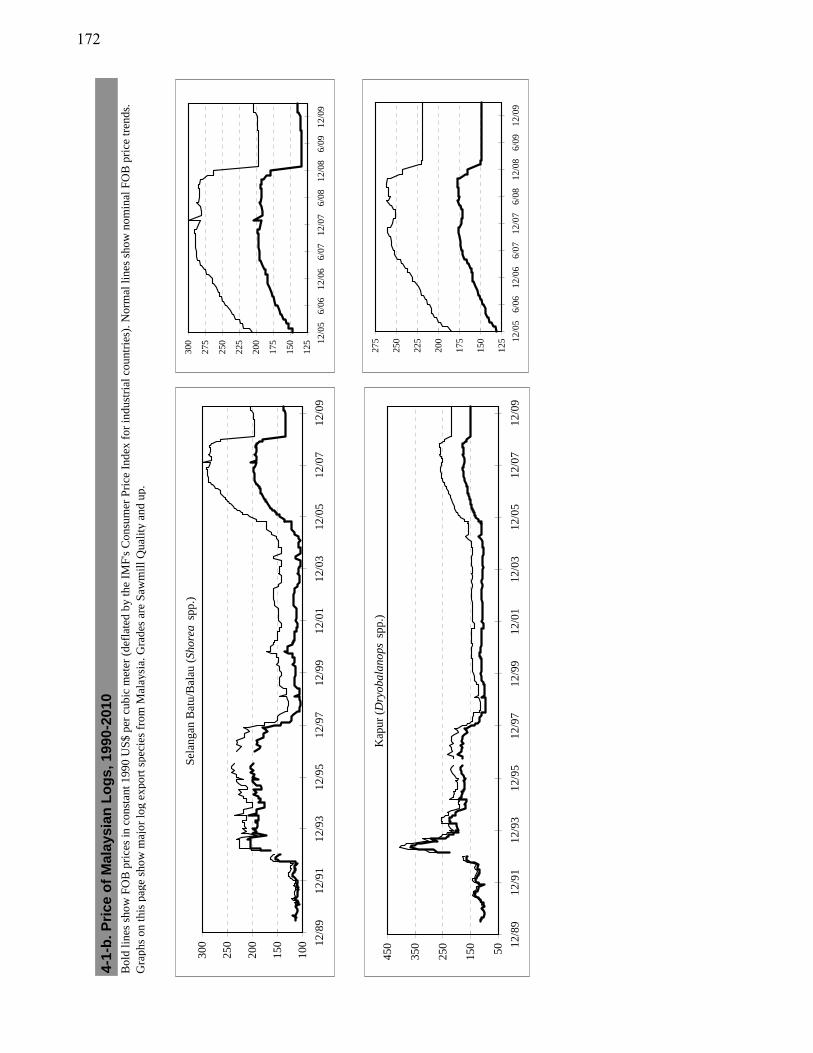
Bol
d li
nes
show
FO
B p
rice
s in
con
stan
t 199
0 U
S$
per
cubi
c m
eter
(de
flat
ed b
y th
e IM
F's
Con
sum
er P
rice
Ind
ex f
or in
dust
rial
cou
ntri
es).
Nor
mal
line
s sh
ow n
omin
al F
OB
pri
ce tr
ends
. G
raph
s on
this
pag
e sh
ow m
ajor
log
expo
rt s
peci
es f
rom
Mal
aysi
a. G
rade
s ar
e S
awm
ill Q
uali
ty a
nd u
p.
4-1-
b. P
rice
of
Mal
aysi
an L
og
s, 1
990-
2010
Sel
anga
n B
atu/
Bal
au (
Shor
ea s
pp.)
100
150
200
250
300 12
/89
12/9
112
/93
12/9
512
/97
12/9
912
/01
12/0
312
/05
12/0
712
/09
Kap
ur (
Dry
obal
anop
s sp
p.)
50150
250
350
450 12
/89
12/9
112
/93
12/9
512
/97
12/9
912
/01
12/0
312
/05
12/0
712
/09
125
150
175
200
225
250
275
300 12
/05
6/06
12/0
66/
0712
/07
6/08
12/0
86/
0912
/09
125
150
175
200
225
250
275 12
/05
6/06
12/0
66/
0712
/07
6/08
12/0
86/
0912
/09
172
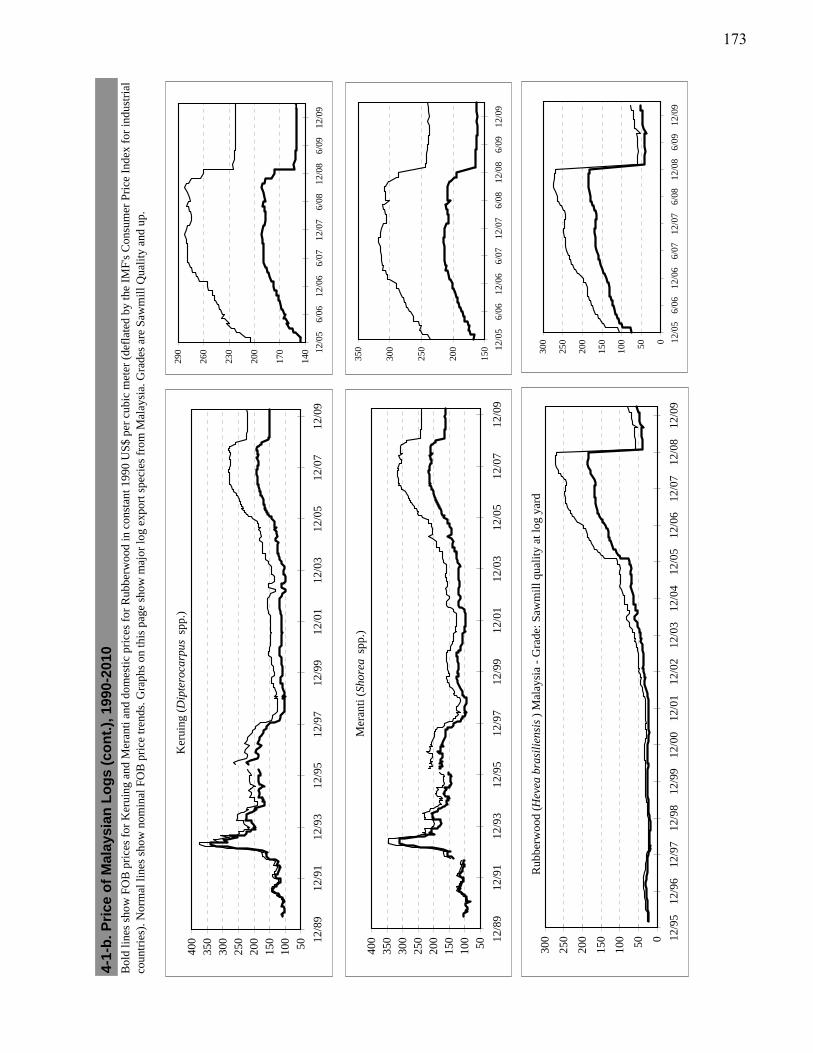
Bol
d li
nes
show
FO
B p
rice
s fo
r K
erui
ng a
nd M
eran
ti a
nd d
omes
tic
pric
es f
or R
ubbe
rwoo
d in
con
stan
t 199
0 U
S$
per
cubi
c m
eter
(de
flat
ed b
y th
e IM
F's
Con
sum
er P
rice
Ind
ex f
or in
dust
rial
co
untr
ies)
. Nor
mal
line
s sh
ow n
omin
al F
OB
pri
ce tr
ends
. Gra
phs
on th
is p
age
show
maj
or lo
g ex
port
spe
cies
fro
m M
alay
sia.
Gra
des
are
Saw
mil
l Qua
lity
and
up.
4-1-
b. P
rice
of
Mal
aysi
an L
og
s (c
on
t.),
199
0-20
10
Ker
uing
(D
ipte
roca
rpus
spp
.)
50100
150
200
250
300
350
400 12
/89
12/9
112
/93
12/9
512
/97
12/9
912
/01
12/0
312
/05
12/0
712
/09
Mer
anti
(Sh
orea
spp
.)
50100
150
200
250
300
350
400 12
/89
12/9
112
/93
12/9
512
/97
12/9
912
/01
12/0
312
/05
12/0
712
/09
140
170
200
230
260
290 12
/05
6/06
12/0
66/
0712
/07
6/08
12/0
86/
0912
/09
150
200
250
300
350 12
/05
6/06
12/0
66/
0712
/07
6/08
12/0
86/
0912
/09
Rub
berw
ood
(Hev
ea b
rasi
liens
is)
Mal
aysi
a -
Gra
de: S
awm
ill q
uali
ty a
t log
yar
d
050100
150
200
250
300 12
/95
12/9
612
/97
12/9
812
/99
12/0
012
/01
12/0
212
/03
12/0
412
/05
12/0
612
/07
12/0
812
/09
050100
150
200
250
300 12
/05
6/06
12/0
66/
0712
/07
6/08
12/0
86/
0912
/09
173
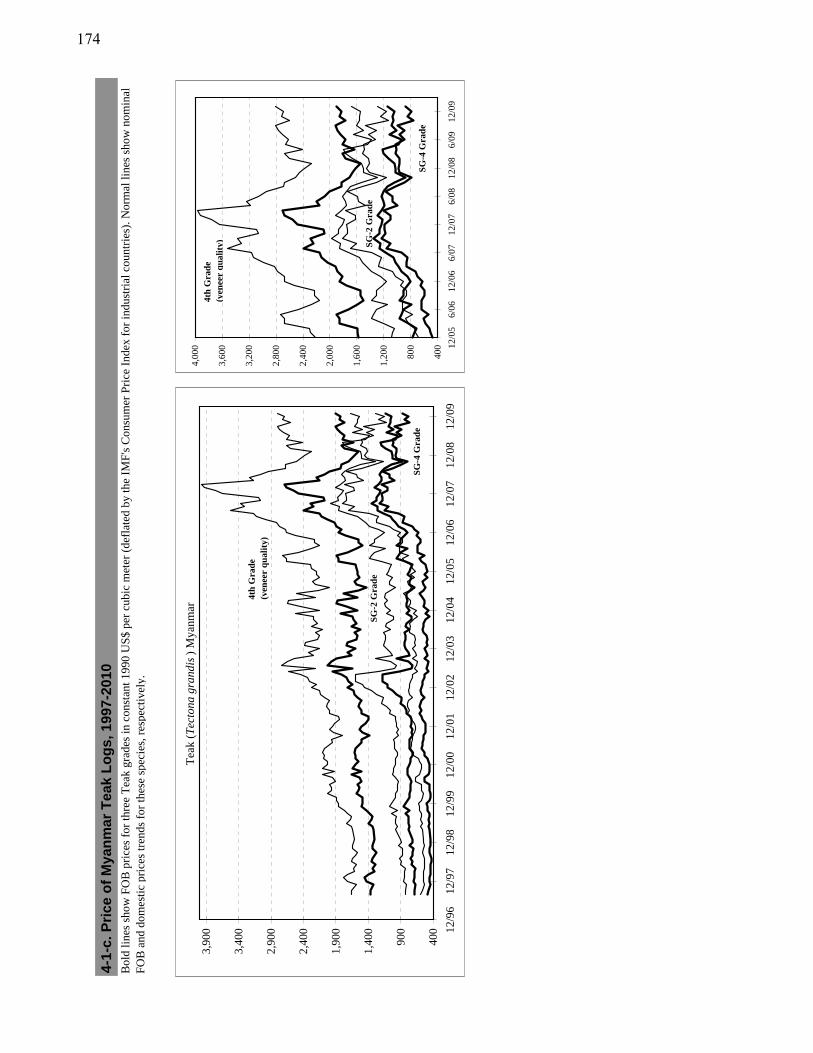
Bol
d li
nes
show
FO
B p
rice
s fo
r th
ree
Tea
k gr
ades
in c
onst
ant 1
990
US
$ pe
r cu
bic
met
er (
defl
ated
by
the
IMF
's C
onsu
mer
Pri
ce I
ndex
for
indu
stri
al c
ount
ries
). N
orm
al li
nes
show
nom
inal
F
OB
and
dom
esti
c pr
ices
tren
ds f
or th
ese
spec
ies,
res
pect
ivel
y.
4-1-
c. P
rice
of
Mya
nm
ar T
eak
Lo
gs,
199
7-20
10
Tea
k (T
ecto
na g
rand
is)
Mya
nmar
400
900
1,40
0
1,90
0
2,40
0
2,90
0
3,40
0
3,90
0 12/9
612
/97
12/9
812
/99
12/0
012
/01
12/0
212
/03
12/0
412
/05
12/0
612
/07
12/0
812
/09
4th
Gra
de
(ven
eer
qu
alit
y)
SG
-2 G
rad
e
SG
-4 G
rad
e
400
800
1,20
0
1,60
0
2,00
0
2,40
0
2,80
0
3,20
0
3,60
0
4,00
0 12/0
56/
0612
/06
6/07
12/0
76/
0812
/08
6/09
12/0
9
4th
Gra
de
(ven
eer
qu
alit
y) SG
-2 G
rad
e
SG
-4 G
rad
e
174
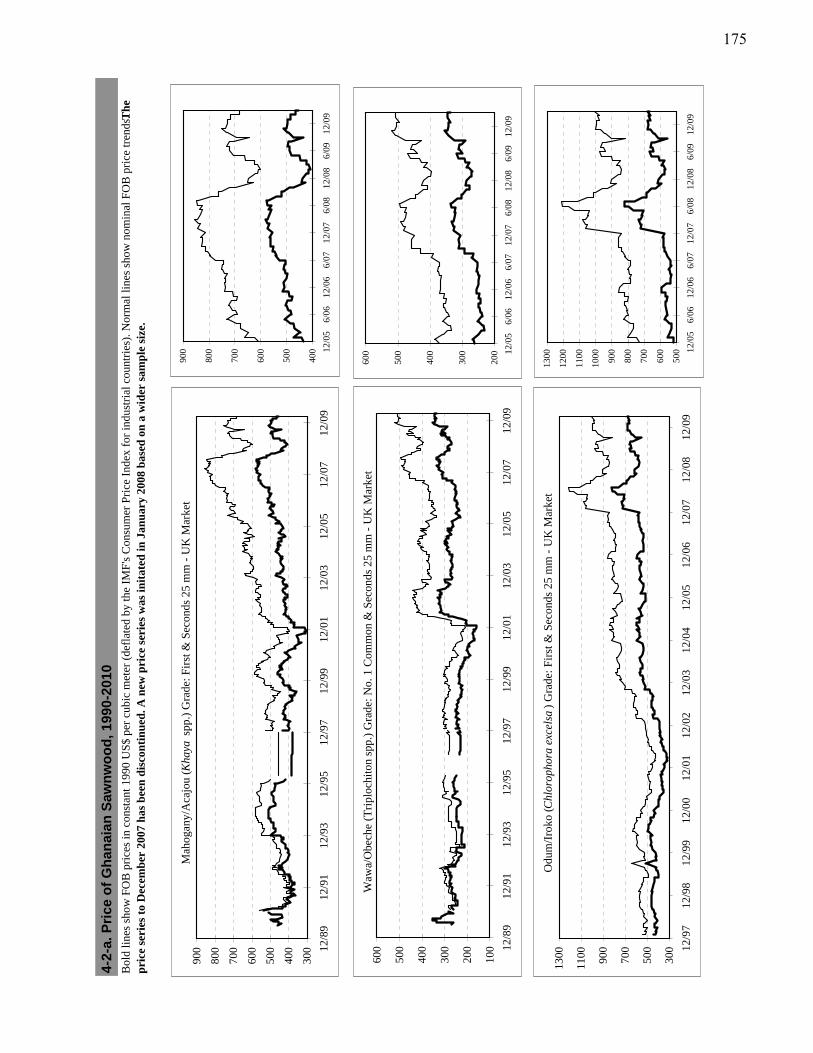
4-2-
a. P
rice
of
Gh
anai
an S
awn
wo
od
, 199
0-20
10B
old
line
s sh
ow F
OB
pri
ces
in c
onst
ant 1
990
US
$ pe
r cu
bic
met
er (
defl
ated
by
the
IMF
's C
onsu
mer
Pri
ce I
ndex
for
indu
stri
al c
ount
ries
). N
orm
al li
nes
show
nom
inal
FO
B p
rice
tren
ds. T
he
pri
ce s
erie
s to
Dec
emb
er 2
007
has
bee
n d
isco
nti
nu
ed. A
new
pri
ce s
erie
s w
as in
itat
ed in
Jan
uar
y 20
08 b
ased
on
a w
ider
sam
ple
siz
e.
Mah
ogan
y/A
cajo
u (K
haya
spp
.) G
rade
: Fir
st &
Sec
onds
25
mm
- U
K M
arke
t
300
400
500
600
700
800
900 12
/89
12/9
112
/93
12/9
512
/97
12/9
912
/01
12/0
312
/05
12/0
712
/09
200
300
400
500
600 12
/05
6/06
12/0
66/
0712
/07
6/08
12/0
86/
0912
/09
Odu
m/I
roko
(Chl
orop
hora
exc
elsa
) G
rade
: Fir
st &
Sec
onds
25
mm
- U
K M
arke
t
300
500
700
900
1100
1300
12/9
712
/98
12/9
912
/00
12/0
112
/02
12/0
312
/04
12/0
512
/06
12/0
712
/08
12/0
9
400
500
600
700
800
900 12
/05
6/06
12/0
66/
0712
/07
6/08
12/0
86/
0912
/09
Waw
a/O
bech
e (T
ripl
ochi
ton
spp.
) G
rade
: No.
1 C
omm
on &
Sec
onds
25
mm
- U
K M
arke
t
100
200
300
400
500
600 12
/89
12/9
112
/93
12/9
512
/97
12/9
912
/01
12/0
312
/05
12/0
712
/09
500
600
700
800
900
1000
1100
1200
1300
12/0
56/
0612
/06
6/07
12/0
76/
0812
/08
6/09
12/0
9
175
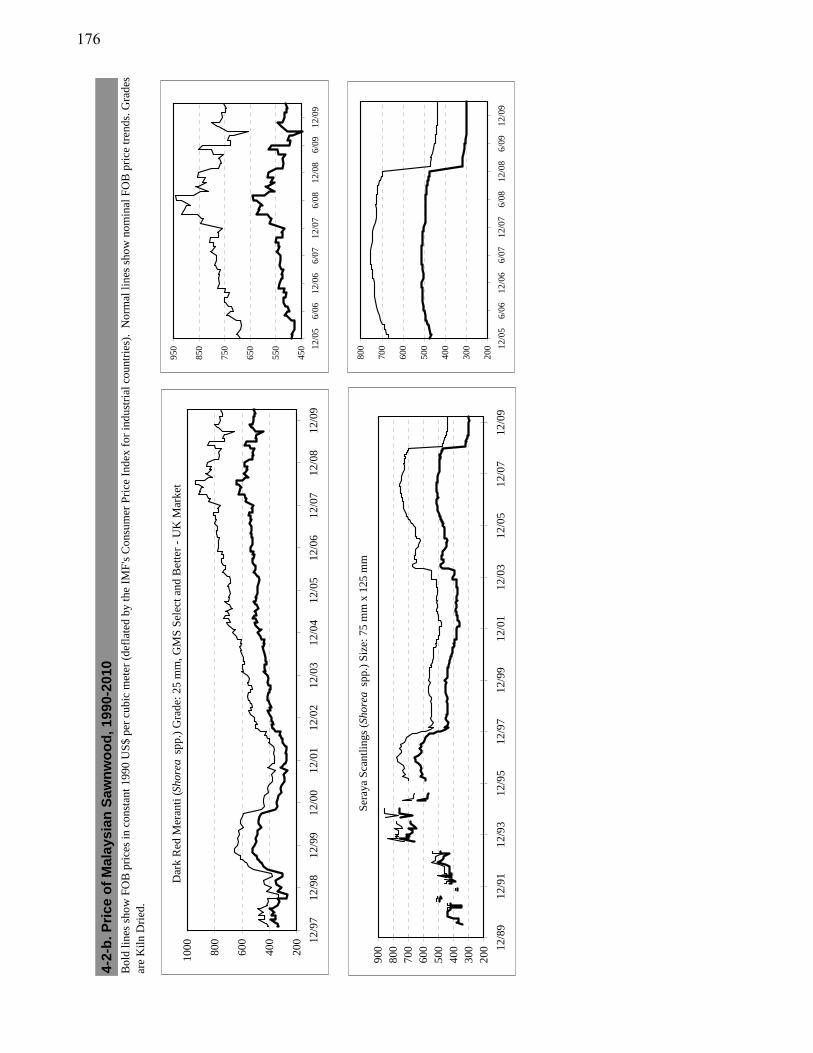
Bol
d li
nes
show
FO
B p
rice
s in
con
stan
t 199
0 U
S$
per
cubi
c m
eter
(de
flat
ed b
y th
e IM
F's
Con
sum
er P
rice
Ind
ex f
or in
dust
rial
cou
ntri
es).
Nor
mal
line
s sh
ow n
omin
al F
OB
pri
ce tr
ends
. Gra
des
are
Kil
n D
ried
.
4-2-
b. P
rice
of
Mal
aysi
an S
awn
wo
od
, 199
0-20
10
Dar
k R
ed M
eran
ti (S
hore
a sp
p.)
Gra
de: 2
5 m
m, G
MS
Sel
ect a
nd B
ette
r -
UK
Mar
ket
200
400
600
800
1000
12/9
712
/98
12/9
912
/00
12/0
112
/02
12/0
312
/04
12/0
512
/06
12/0
712
/08
12/0
9
Ser
aya
Sca
ntli
ngs
(Sho
rea
spp.
) S
ize:
75
mm
x 1
25 m
m
200
300
400
500
600
700
800
900 12
/89
12/9
112
/93
12/9
512
/97
12/9
912
/01
12/0
312
/05
12/0
712
/09
450
550
650
750
850
950 12
/05
6/06
12/0
66/
0712
/07
6/08
12/0
86/
0912
/09
200
300
400
500
600
700
800 12
/05
6/06
12/0
66/
0712
/07
6/08
12/0
86/
0912
/09
176
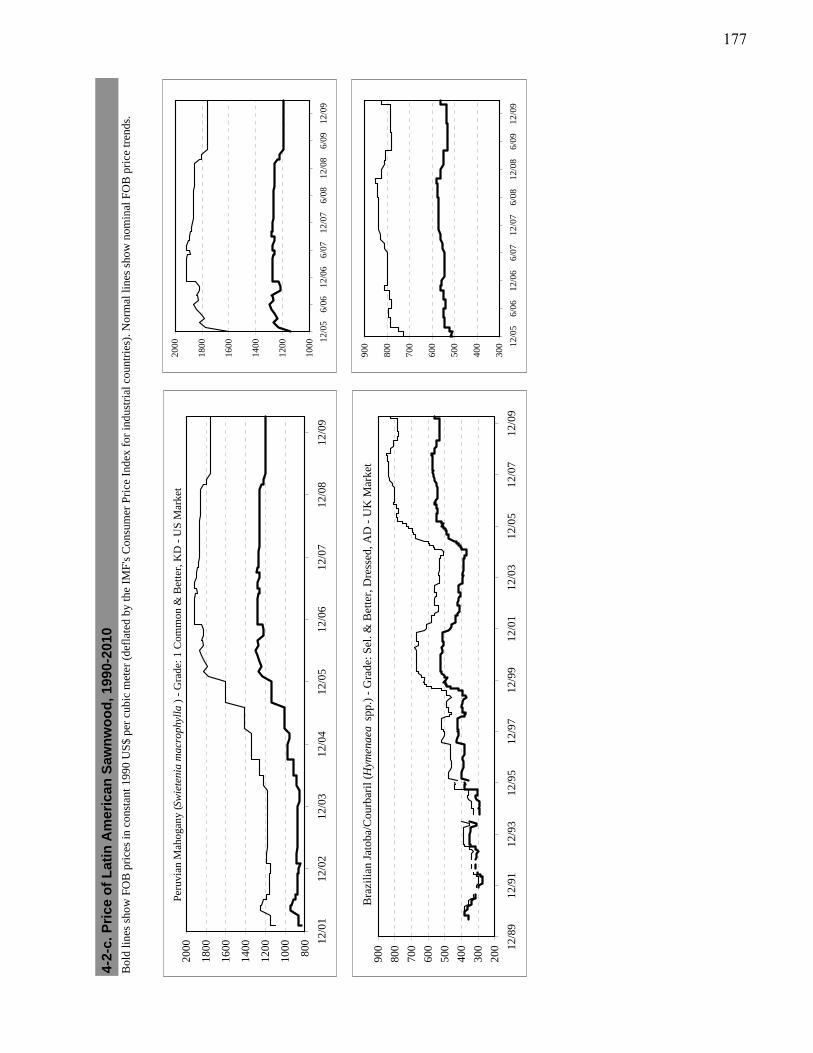
Bol
d li
nes
show
FO
B p
rice
s in
con
stan
t 199
0 U
S$
per
cubi
c m
eter
(de
flat
ed b
y th
e IM
F's
Con
sum
er P
rice
Ind
ex f
or in
dust
rial
cou
ntri
es).
Nor
mal
line
s sh
ow n
omin
al F
OB
pri
ce tr
ends
.
4-2-
c. P
rice
of
Lat
in A
mer
ican
Saw
nw
oo
d, 1
990-
2010
Bra
zili
an J
atob
a/C
ourb
aril
(Hym
enae
a sp
p.)
- G
rade
: Sel
. & B
ette
r, D
ress
ed, A
D -
UK
Mar
ket
200
300
400
500
600
700
800
900 12
/89
12/9
112
/93
12/9
512
/97
12/9
912
/01
12/0
312
/05
12/0
712
/09
300
400
500
600
700
800
900 12
/05
6/06
12/0
66/
0712
/07
6/08
12/0
86/
0912
/09
Per
uvia
n M
ahog
any
(Sw
iete
nia
mac
roph
ylla
) -
Gra
de: 1
Com
mon
& B
ette
r, K
D -
US
Mar
ket
800
1000
1200
1400
1600
1800
2000
12/0
112
/02
12/0
312
/04
12/0
512
/06
12/0
712
/08
12/0
910
00
1200
1400
1600
1800
2000
12/0
56/
0612
/06
6/07
12/0
76/
0812
/08
6/09
12/0
9
177
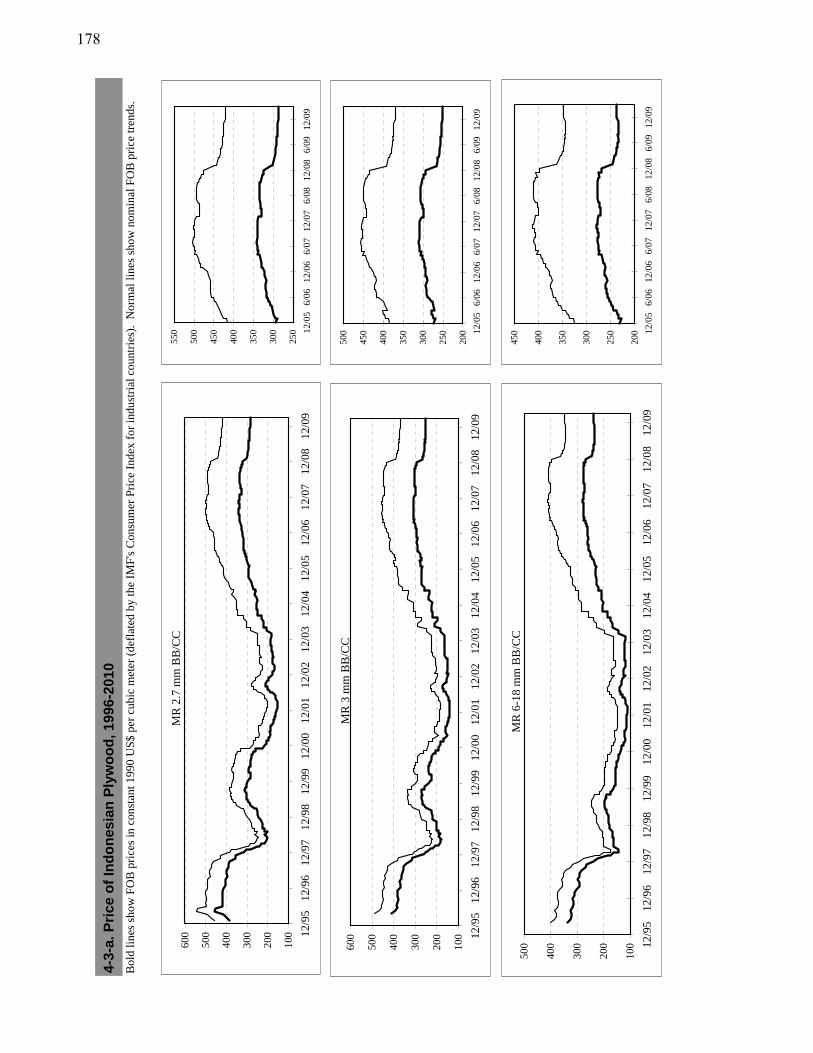
4-3-
a. P
rice
of
Ind
on
esia
n P
lyw
oo
d, 1
996-
2010
Bol
d li
nes
show
FO
B p
rice
s in
con
stan
t 199
0 U
S$
per
cubi
c m
eter
(de
flat
ed b
y th
e IM
F's
Con
sum
er P
rice
Ind
ex f
or in
dust
rial
cou
ntri
es).
Nor
mal
line
s sh
ow n
omin
al F
OB
pri
ce tr
ends
.
MR
2.7
mm
BB
/CC
100
200
300
400
500
600 12
/95
12/9
612
/97
12/9
812
/99
12/0
012
/01
12/0
212
/03
12/0
412
/05
12/0
612
/07
12/0
812
/09
MR
3 m
m B
B/C
C
100
200
300
400
500
600 12
/95
12/9
612
/97
12/9
812
/99
12/0
012
/01
12/0
212
/03
12/0
412
/05
12/0
612
/07
12/0
812
/09
MR
6-1
8 m
m B
B/C
C
100
200
300
400
500 12
/95
12/9
612
/97
12/9
812
/99
12/0
012
/01
12/0
212
/03
12/0
412
/05
12/0
612
/07
12/0
812
/09
250
300
350
400
450
500
550 12
/05
6/06
12/0
66/
0712
/07
6/08
12/0
86/
0912
/09
200
250
300
350
400
450
500 12
/05
6/06
12/0
66/
0712
/07
6/08
12/0
86/
0912
/09
200
250
300
350
400
450 12
/05
6/06
12/0
66/
0712
/07
6/08
12/0
86/
0912
/09
178
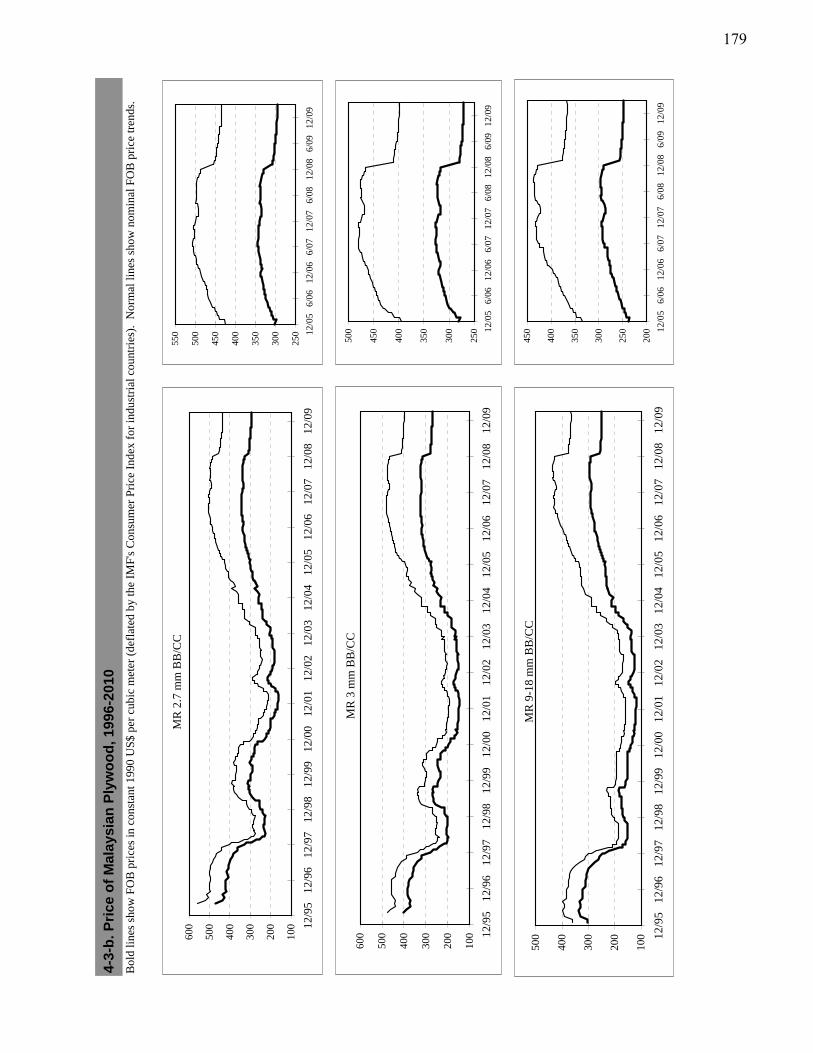
4-3-
b. P
rice
of
Mal
aysi
an P
lyw
oo
d, 1
996-
2010
Bol
d li
nes
show
FO
B p
rice
s in
con
stan
t 199
0 U
S$
per
cubi
c m
eter
(de
flat
ed b
y th
e IM
F's
Con
sum
er P
rice
Ind
ex f
or in
dust
rial
cou
ntri
es).
Nor
mal
line
s sh
ow n
omin
al F
OB
pri
ce tr
ends
.
MR
2.7
mm
BB
/CC
100
200
300
400
500
600 12
/95
12/9
612
/97
12/9
812
/99
12/0
012
/01
12/0
212
/03
12/0
412
/05
12/0
612
/07
12/0
812
/09
MR
3 m
m B
B/C
C
100
200
300
400
500
600 12
/95
12/9
612
/97
12/9
812
/99
12/0
012
/01
12/0
212
/03
12/0
412
/05
12/0
612
/07
12/0
812
/09
MR
9-1
8 m
m B
B/C
C
100
200
300
400
500 12
/95
12/9
612
/97
12/9
812
/99
12/0
012
/01
12/0
212
/03
12/0
412
/05
12/0
612
/07
12/0
812
/09
250
300
350
400
450
500
550 12
/05
6/06
12/0
66/
0712
/07
6/08
12/0
86/
0912
/09
250
300
350
400
450
500 12
/05
6/06
12/0
66/
0712
/07
6/08
12/0
86/
0912
/09
200
250
300
350
400
450 12
/05
6/06
12/0
66/
0712
/07
6/08
12/0
86/
0912
/09
179
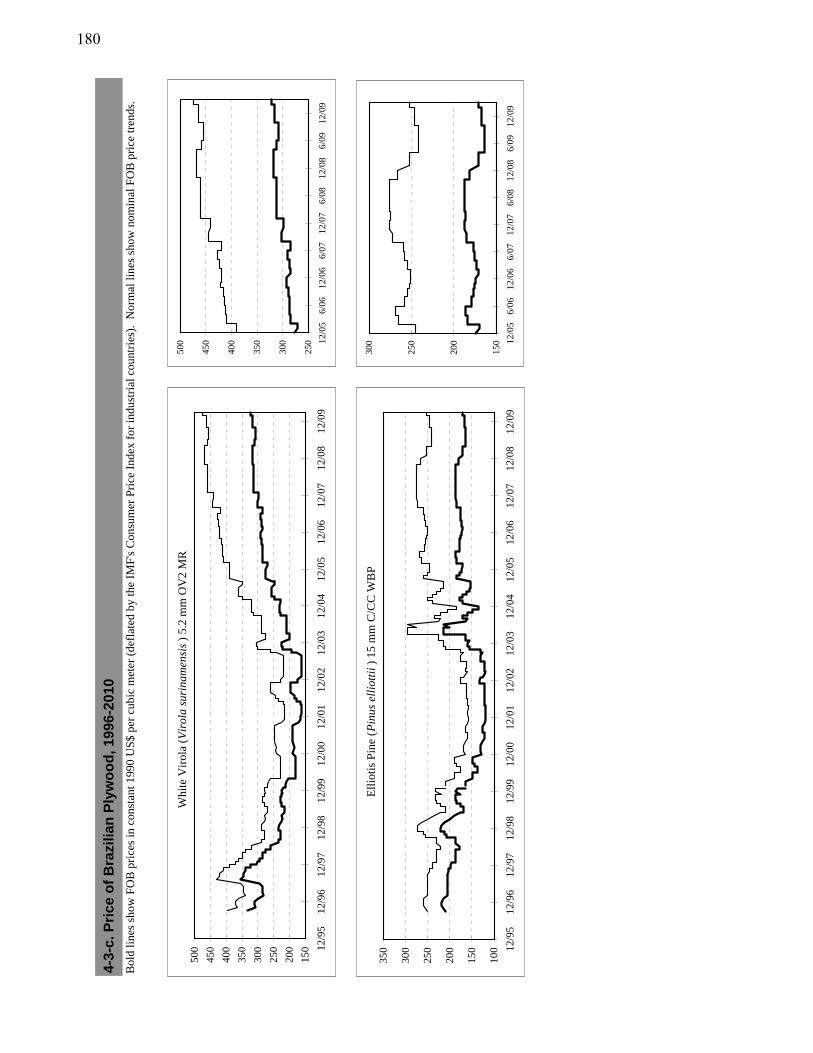
4-3-
c. P
rice
of
Bra
zilia
n P
lyw
oo
d, 1
996-
2010
Bol
d li
nes
show
FO
B p
rice
s in
con
stan
t 199
0 U
S$
per
cubi
c m
eter
(de
flat
ed b
y th
e IM
F's
Con
sum
er P
rice
Ind
ex f
or in
dust
rial
cou
ntri
es).
Nor
mal
line
s sh
ow n
omin
al F
OB
pri
ce tr
ends
.
Whi
te V
irol
a (V
irol
a su
rina
men
sis)
5.2
mm
OV
2 M
R
150
200
250
300
350
400
450
500 12
/95
12/9
612
/97
12/9
812
/99
12/0
012
/01
12/0
212
/03
12/0
412
/05
12/0
612
/07
12/0
812
/09
250
300
350
400
450
500 12
/05
6/06
12/0
66/
0712
/07
6/08
12/0
86/
0912
/09
Ell
ioti
s P
ine
(Pin
us e
lliot
tii)
15 m
m C
/CC
WB
P
100
150
200
250
300
350 12
/95
12/9
612
/97
12/9
812
/99
12/0
012
/01
12/0
212
/03
12/0
412
/05
12/0
612
/07
12/0
812
/09
150
200
250
300 12
/05
6/06
12/0
66/
0712
/07
6/08
12/0
86/
0912
/09
180
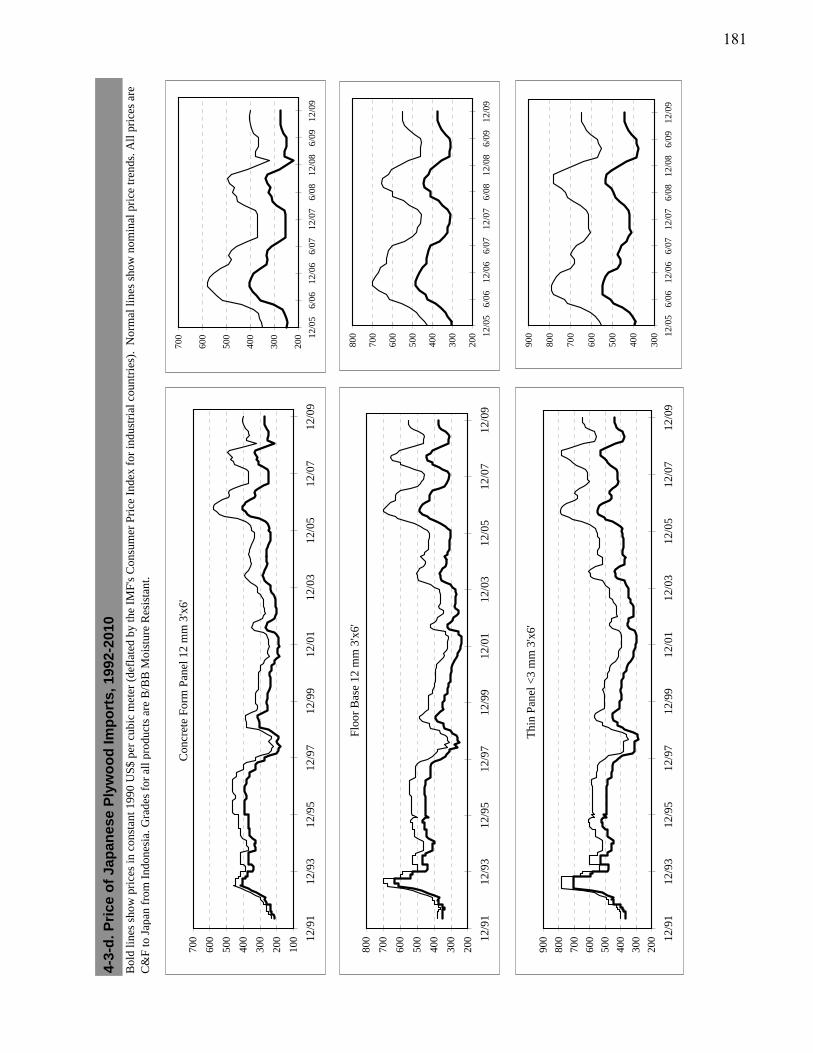
Bol
d li
nes
show
pri
ces
in c
onst
ant 1
990
US
$ pe
r cu
bic
met
er (
defl
ated
by
the
IMF
's C
onsu
mer
Pri
ce I
ndex
for
indu
stri
al c
ount
ries
). N
orm
al li
nes
show
nom
inal
pri
ce tr
ends
. All
pri
ces
are
C&
F to
Ja p
an f
rom
Ind
ones
ia. G
rade
s fo
r al
l pro
duct
s ar
e B
/BB
Moi
stur
e R
esis
tant
.
4-3-
d. P
rice
of
Jap
anes
e P
lyw
oo
d Im
po
rts,
199
2-20
10
Con
cret
e F
orm
Pan
el 1
2 m
m 3
'x6'
100
200
300
400
500
600
700 12
/91
12/9
312
/95
12/9
712
/99
12/0
112
/03
12/0
512
/07
12/0
9
Flo
or B
ase
12 m
m 3
'x6'
200
300
400
500
600
700
800 12
/91
12/9
312
/95
12/9
712
/99
12/0
112
/03
12/0
512
/07
12/0
9
Thi
n P
anel
<3
mm
3'x
6'
200
300
400
500
600
700
800
900 12
/91
12/9
312
/95
12/9
712
/99
12/0
112
/03
12/0
512
/07
12/0
9
200
300
400
500
600
700
800 12
/05
6/06
12/0
66/
0712
/07
6/08
12/0
86/
0912
/09
300
400
500
600
700
800
900 12
/05
6/06
12/0
66/
0712
/07
6/08
12/0
86/
0912
/09
200
300
400
500
600
700 12
/05
6/06
12/0
66/
0712
/07
6/08
12/0
86/
0912
/09
181
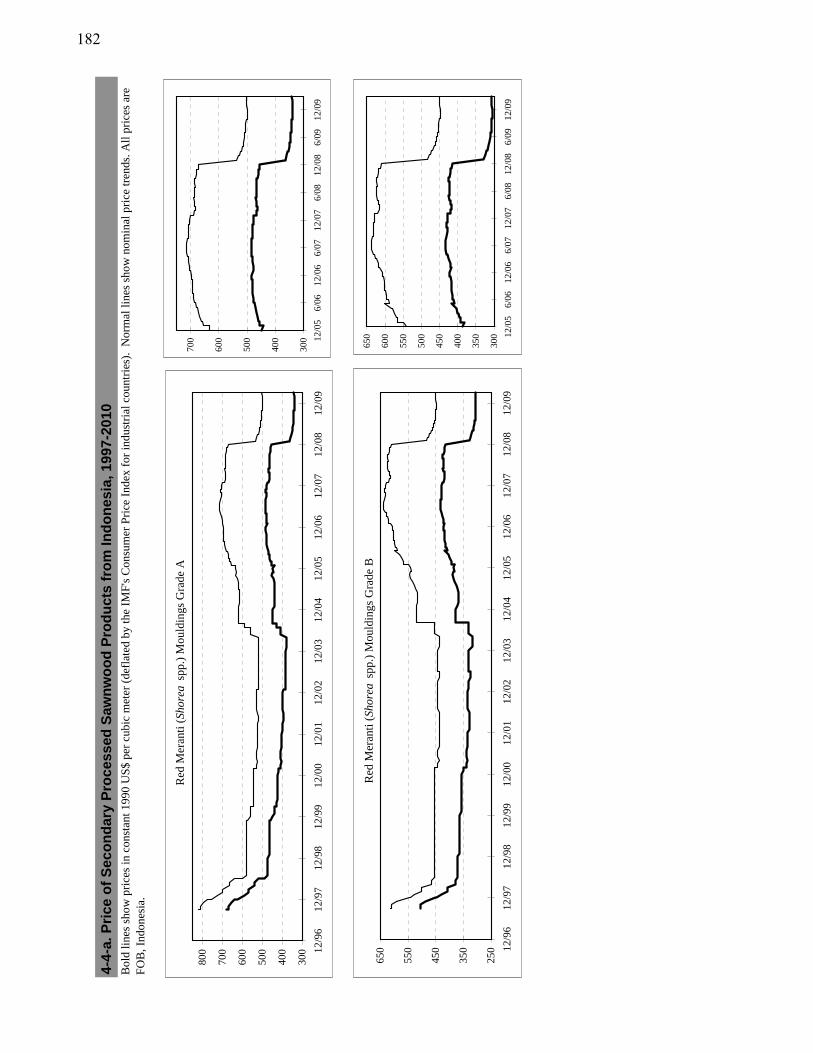
Bol
d li
nes
show
pri
ces
in c
onst
ant 1
990
US
$ pe
r cu
bic
met
er (
defl
ated
by
the
IMF
's C
onsu
mer
Pri
ce I
ndex
for
indu
stri
al c
ount
ries
). N
orm
al li
nes
show
nom
inal
pri
ce tr
ends
. All
pri
ces
are
FO
B, I
ndon
esia
.
4-4-
a. P
rice
of
Sec
on
dar
y P
roce
ssed
Saw
nw
oo
d P
rod
uct
s fr
om
Ind
on
esia
, 199
7-20
10
Red
Mer
anti
(Sh
orea
spp
.) M
ould
ings
Gra
de A
300
400
500
600
700
800 12
/96
12/9
712
/98
12/9
912
/00
12/0
112
/02
12/0
312
/04
12/0
512
/06
12/0
712
/08
12/0
9
Red
Mer
anti
(Sh
orea
spp
.) M
ould
ings
Gra
de B
250
350
450
550
650 12
/96
12/9
712
/98
12/9
912
/00
12/0
112
/02
12/0
312
/04
12/0
512
/06
12/0
712
/08
12/0
9
300
400
500
600
700 12
/05
6/06
12/0
66/
0712
/07
6/08
12/0
86/
0912
/09
300
350
400
450
500
550
600
650 12
/05
6/06
12/0
66/
0712
/07
6/08
12/0
86/
0912
/09
182
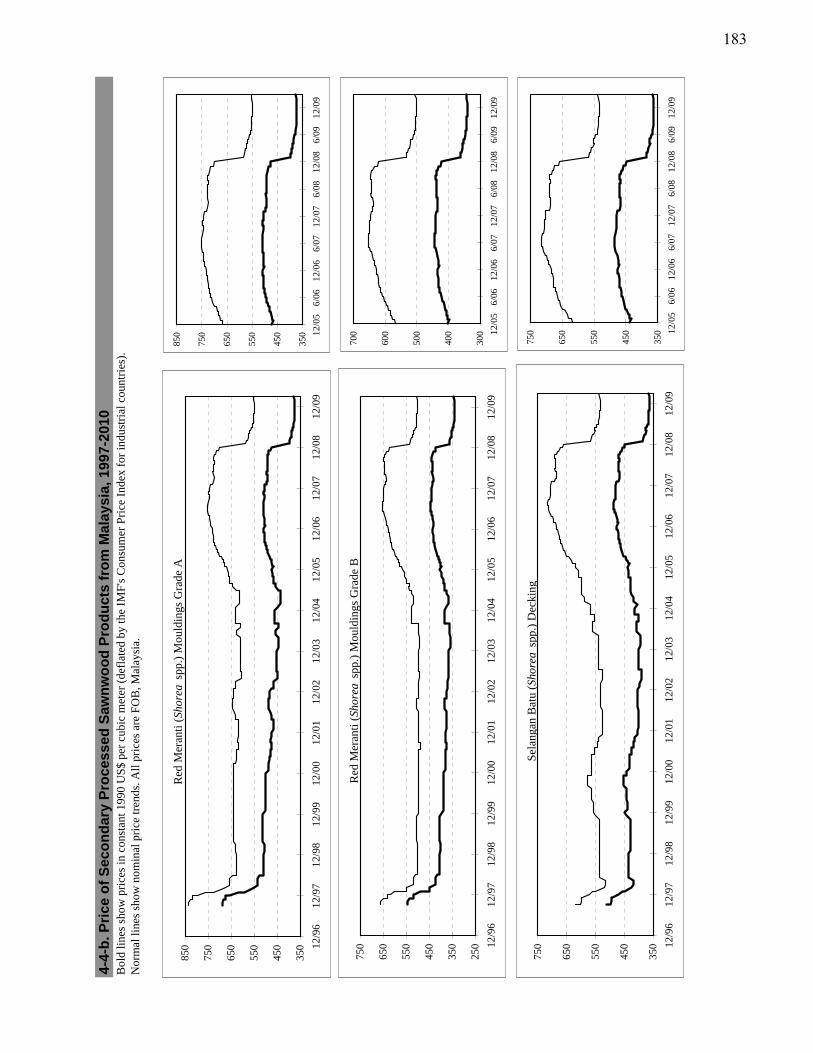
Bol
d li
nes
show
pri
ces
in c
onst
ant 1
990
US
$ pe
r cu
bic
met
er (
defl
ated
by
the
IMF
's C
onsu
mer
Pri
ce I
ndex
for
indu
stri
al c
ount
ries
).N
orm
al li
nes
show
nom
inal
pri
ce tr
ends
. All
pri
ces
are
FO
B, M
alay
sia.
4-4-
b. P
rice
of
Sec
on
dar
y P
roce
ssed
Saw
nw
oo
d P
rod
uct
s fr
om
Mal
aysi
a, 1
997-
2010
Sel
anga
n B
atu
(Sho
rea
spp.
) D
ecki
ng
350
450
550
650
750 12
/96
12/9
712
/98
12/9
912
/00
12/0
112
/02
12/0
312
/04
12/0
512
/06
12/0
712
/08
12/0
9
Red
Mer
anti
(Sh
orea
spp
.) M
ould
ings
Gra
de A
350
450
550
650
750
850 12
/96
12/9
712
/98
12/9
912
/00
12/0
112
/02
12/0
312
/04
12/0
512
/06
12/0
712
/08
12/0
9
Red
Mer
anti
(Sh
orea
spp
.) M
ould
ings
Gra
de B
250
350
450
550
650
750 12
/96
12/9
712
/98
12/9
912
/00
12/0
112
/02
12/0
312
/04
12/0
512
/06
12/0
712
/08
12/0
9
350
450
550
650
750
850 12
/05
6/06
12/0
66/
0712
/07
6/08
12/0
86/
0912
/09
300
400
500
600
700 12
/05
6/06
12/0
66/
0712
/07
6/08
12/0
86/
0912
/09
350
450
550
650
750 12
/05
6/06
12/0
66/
0712
/07
6/08
12/0
86/
0912
/09
183
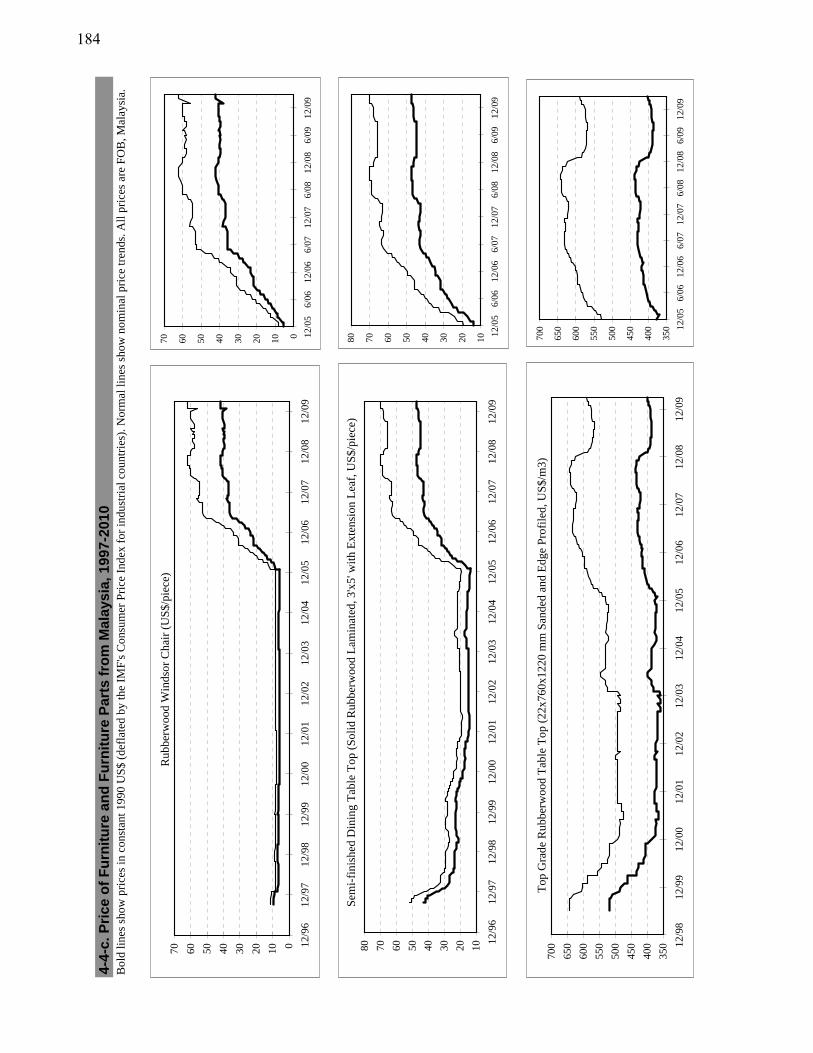
Bol
d li
nes
show
pri
ces
in c
onst
ant 1
990
US
$ (d
efla
ted
by th
e IM
F's
Con
sum
er P
rice
Ind
ex f
or in
dust
rial
cou
ntri
es).
Nor
mal
line
s sh
ow n
omin
al p
rice
tren
ds. A
ll p
rice
s ar
e F
OB
, Mal
aysi
a.4-
4-c.
Pri
ce o
f F
urn
itu
re a
nd
Fu
rnit
ure
Par
ts f
rom
Mal
aysi
a, 1
997-
2010
1020304050607080
12/9
612
/97
12/9
812
/99
12/0
012
/01
12/0
212
/03
12/0
412
/05
12/0
612
/07
12/0
812
/09
Sem
i-fi
nish
ed D
inin
g T
able
Top
(S
olid
Rub
berw
ood
Lam
inat
ed, 3
'x5'
wit
h E
xten
sion
Lea
f, U
S$/
piec
e)
Top
Gra
de R
ubbe
rwoo
d T
able
Top
(22
x760
x122
0 m
m S
ande
d an
d E
dge
Pro
file
d, U
S$/
m3)
350
400
450
500
550
600
650
700 12
/98
12/9
912
/00
12/0
112
/02
12/0
312
/04
12/0
512
/06
12/0
712
/08
12/0
9
Rub
berw
ood
Win
dsor
Cha
ir (
US
$/pi
ece)
010203040506070
12/9
612
/97
12/9
812
/99
12/0
012
/01
12/0
212
/03
12/0
412
/05
12/0
612
/07
12/0
812
/09
010203040506070
12/0
56/
0612
/06
6/07
12/0
76/
0812
/08
6/09
12/0
9
1020304050607080
12/0
56/
0612
/06
6/07
12/0
76/
0812
/08
6/09
12/0
9
350
400
450
500
550
600
650
700 12
/05
6/06
12/0
66/
0712
/07
6/08
12/0
86/
0912
/09
184
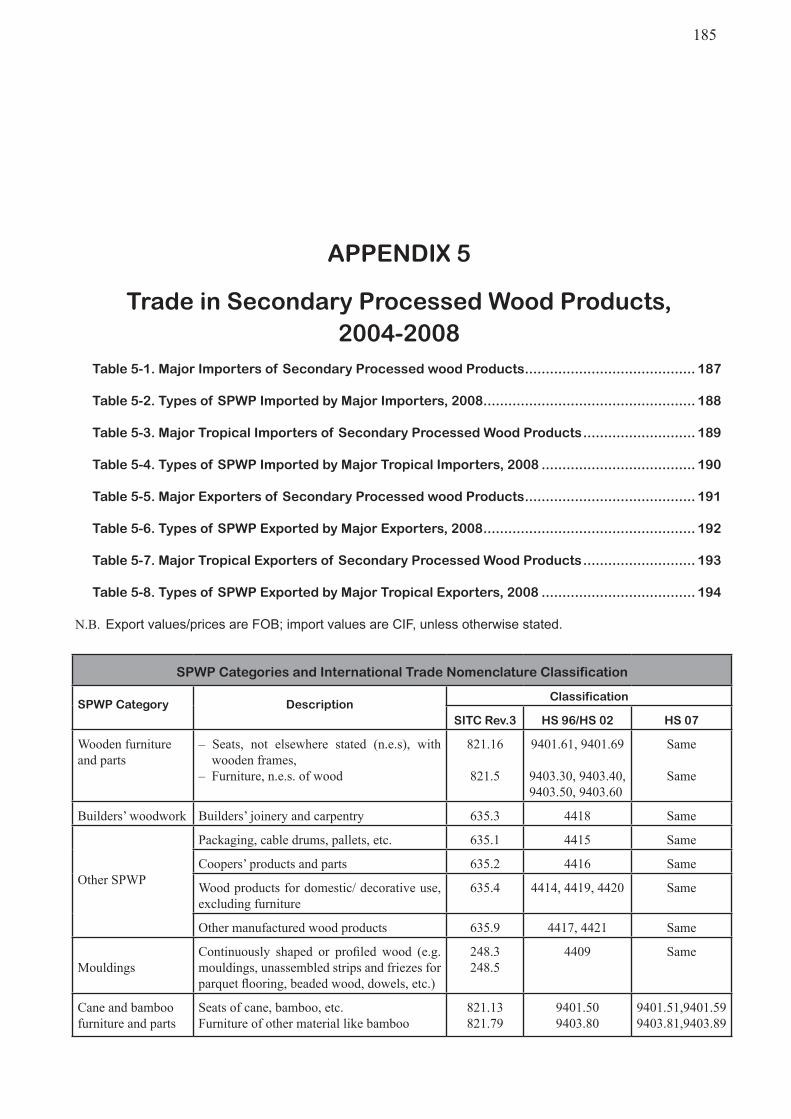
185
APPENDIX 5
Trade in Secondary Processed Wood Products, 2004-2008
Table 5-1. Major Importers of Secondary Processed wood Products ......................................... 187
Table 5-2. Types of SPWP Imported by Major Importers, 2008 ................................................... 188
Table 5-3. Major Tropical Importers of Secondary Processed Wood Products ........................... 189
Table 5-4. Types of SPWP Imported by Major Tropical Importers, 2008 ..................................... 190
Table 5-5. Major Exporters of Secondary Processed wood Products ......................................... 191 Table 5-6. Types of SPWP Exported by Major Exporters, 2008 ................................................... 192
Table 5-7. Major Tropical Exporters of Secondary Processed Wood Products ........................... 193
Table 5-8. Types of SPWP Exported by Major Tropical Exporters, 2008 ..................................... 194
N.B. Export values/prices are FOB; import values are CIF, unless otherwise stated.
SPWP Categories and International Trade Nomenclature Classification
SPWP Category DescriptionClassification
SITC Rev.3 HS 96/HS 02 HS 07
Wooden furniture and parts
– Seats, not elsewhere stated (n.e.s), with wooden frames,– Furniture, n.e.s. of wood
821.16
821.5
9401.61, 9401.69
9403.30, 9403.40, 9403.50, 9403.60
Same
Same
Builders’ woodwork Builders’ joinery and carpentry 635.3 4418 Same
Other SPWP
Packaging, cable drums, pallets, etc. 635.1 4415 Same
Coopers’ products and parts 635.2 4416 Same
Wood products for domestic/ decorative use, excluding furniture
635.4 4414, 4419, 4420 Same
Other manufactured wood products 635.9 4417, 4421 Same
MouldingsContinuously shaped or profiled wood (e.g. mouldings, unassembled strips and friezes for parquet flooring, beaded wood, dowels, etc.)
248.3248.5
4409 Same
Cane and bamboo furniture and parts
Seats of cane, bamboo, etc. Furniture of other material like bamboo
821.13821.79
9401.509403.80
9401.51,9401.599403.81,9403.89

186
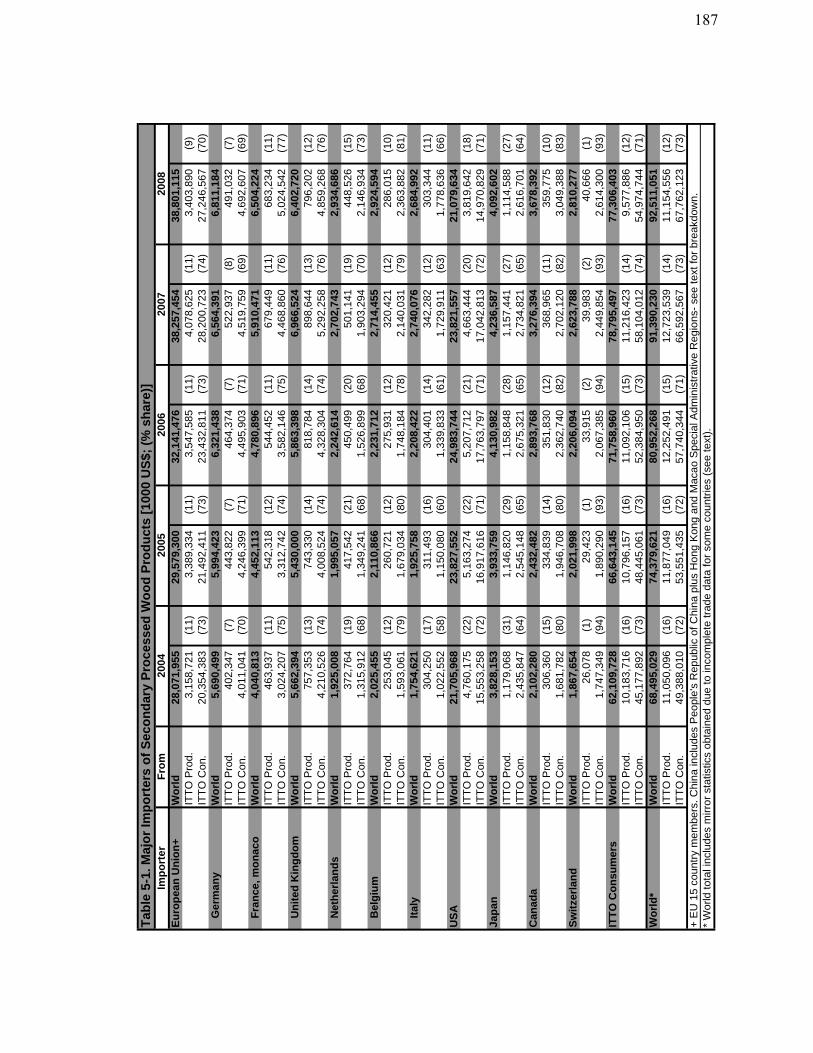
Imp
ort
erF
rom
Eu
rop
ean
Un
ion
+W
orl
d28
,071
,955
29,5
79,3
00
32
,141
,476
38,2
57,4
54
38
,801
,115
ITT
O P
rod.
3,15
8,72
1
(11)
3,38
9,33
4
(11)
3,54
7,58
5
(11)
4,07
8,62
5
(11)
3,40
3,89
0
(9)
ITT
O C
on.
20,3
54,3
83
(73)
21,4
92,4
11
(73)
23,4
32,8
11
(73)
28,2
00,7
23
(74)
27,2
46,5
67
(70)
Ger
man
yW
orl
d5,
690,
499
5,99
4,42
3
6,
321,
438
6,56
4,39
1
6,
811,
184
ITT
O P
rod.
402,
347
(7)
443,
822
(7)
464,
374
(7)
522,
937
(8)
491,
032
(7)
ITT
O C
on.
4,01
1,04
1
(70)
4,24
6,39
9
(71)
4,49
5,90
3
(71)
4,51
9,75
9
(69)
4,69
2,60
7
(69)
Fra
nce
, mo
nac
oW
orl
d4,
040,
813
4,45
2,11
3
4,
780,
896
5,91
0,47
1
6,
504,
224
ITT
O P
rod.
463,
937
(11)
542,
318
(12)
544,
452
(11)
679,
449
(11)
683,
234
(11)
ITT
O C
on.
3,02
4,20
7
(75)
3,31
2,74
2
(74)
3,58
2,14
6
(75)
4,46
8,86
0
(76)
5,02
4,54
2
(77)
Un
ited
Kin
gd
om
Wo
rld
5,66
2,39
4
5,
430,
000
5,86
3,39
8
6,
966,
524
6,40
2,72
0
IT
TO
Pro
d.75
7,35
3
(1
3)74
3,33
0
(1
4)81
8,78
4
(1
4)89
8,64
4
(1
3)79
6,20
2
(1
2)IT
TO
Con
.4,
210,
526
(7
4)4,
008,
524
(7
4)4,
328,
304
(7
4)5,
292,
258
(7
6)4,
859,
268
(7
6)N
eth
erla
nd
sW
orl
d1,
925,
008
1,99
5,05
7
2,
242,
614
2,70
2,74
3
2,
934,
686
ITT
O P
rod.
372,
764
(19)
417,
542
(21)
450,
499
(20)
501,
141
(19)
448,
526
(15)
ITT
O C
on.
1,31
5,91
2
(68)
1,34
9,24
1
(68)
1,52
6,89
9
(68)
1,90
3,29
4
(70)
2,14
6,93
4
(73)
Bel
giu
mW
orl
d2,
025,
455
2,11
0,86
6
2,
231,
712
2,71
4,45
5
2,
924,
594
ITT
O P
rod.
253,
045
(12)
260,
721
(12)
275,
931
(12)
320,
421
(12)
286,
015
(10)
ITT
O C
on.
1,59
3,06
1
(79)
1,67
9,03
4
(80)
1,74
8,18
4
(78)
2,14
0,03
1
(79)
2,36
3,88
2
(81)
Ital
yW
orl
d1,
754,
621
1,92
5,75
8
2,
208,
422
2,74
0,07
6
2,
684,
992
ITT
O P
rod.
304,
250
(17)
311,
493
(16)
304,
401
(14)
342,
282
(12)
303,
344
(11)
ITT
O C
on.
1,02
2,55
2
(58)
1,15
0,08
0
(60)
1,33
9,83
3
(61)
1,72
9,91
1
(63)
1,77
8,63
6
(66)
US
AW
orl
d21
,705
,968
23,8
27,5
52
24
,983
,744
23,8
21,5
57
21
,079
,634
ITT
O P
rod.
4,76
0,17
5
(22)
5,16
3,27
4
(22)
5,20
7,71
2
(21)
4,66
3,44
4
(20)
3,81
9,64
2
(18)
ITT
O C
on.
15,5
53,2
58
(72)
16,9
17,6
16
(71)
17,7
63,7
97
(71)
17,0
42,8
13
(72)
14,9
70,8
29
(71)
Jap
anW
orl
d3,
828,
153
3,93
3,75
9
4,
130,
982
4,23
6,58
7
4,
092,
602
ITT
O P
rod.
1,17
9,06
8
(31)
1,14
6,82
0
(29)
1,15
8,84
8
(28)
1,15
7,44
1
(27)
1,11
4,58
8
(27)
ITT
O C
on.
2,43
5,84
7
(64)
2,54
5,14
8
(65)
2,67
5,32
1
(65)
2,73
4,82
1
(65)
2,61
6,70
1
(64)
Can
ada
Wo
rld
2,10
2,28
0
2,
432,
482
2,89
3,76
8
3,
276,
394
3,67
8,39
2
IT
TO
Pro
d.30
6,36
0
(1
5)33
4,83
9
(1
4)35
1,83
0
(1
2)36
8,96
5
(1
1)35
9,77
5
(1
0)IT
TO
Con
.1,
681,
782
(8
0)1,
946,
708
(8
0)2,
362,
740
(8
2)2,
702,
120
(8
2)3,
049,
388
(8
3)S
wit
zerl
and
Wo
rld
1,86
7,65
4
2,
021,
998
2,20
6,09
4
2,
623,
788
2,81
0,27
7
IT
TO
Pro
d.26
,078
(1
)29
,423
(1
)33
,915
(2
)39
,983
(2
)40
,666
(1
)IT
TO
Con
.1,
747,
349
(9
4)1,
890,
290
(9
3)2,
067,
385
(9
4)2,
449,
854
(9
3)2,
614,
300
(9
3)IT
TO
Co
nsu
mer
sW
orl
d62
,109
,728
66,6
43,1
45
71
,758
,960
78,7
95,4
97
77
,306
,403
ITT
O P
rod.
10,1
83,7
16
(16)
10,7
96,1
57
(16)
11,0
92,1
06
(15)
11,2
16,4
23
(14)
9,57
7,88
6
(12)
ITT
O C
on.
45,1
77,8
92
(73)
48,4
45,0
61
(73)
52,3
84,9
50
(73)
58,1
04,0
12
(74)
54,9
74,7
44
(71)
Wo
rld
*W
orl
d68
,495
,029
74,3
79,6
21
80
,952
,268
91,3
90,2
30
92
,511
,051
ITT
O P
rod.
11,0
50,0
96
(16)
11,8
77,0
49
(16)
12,2
52,4
91
(15)
12,7
23,5
39
(14)
11,1
54,5
56
(12)
ITT
O C
on.
49,3
88,0
10
(72)
53,5
51,4
35
(72)
57,7
40,3
44
(71)
66,5
92,5
67
(73)
67,7
62,1
23
(73)
Tab
le 5
-1. M
ajo
r Im
po
rter
s o
f S
eco
nd
ary
Pro
cess
ed W
oo
d P
rod
uct
s [1
000
US
$; (
% s
har
e)]
+ E
U 1
5 co
untr
y m
embe
rs. C
hina
incl
udes
Peo
ple'
s R
epub
lic o
f Chi
na p
lus
Hon
g K
ong
and
Mac
ao S
peci
al A
dmin
istr
ativ
e R
egio
ns-
see
text
for
brea
kdow
n.*
Wor
ld to
tal i
nclu
des
mirr
or s
tatis
tics
obta
ined
due
to in
com
plet
e tr
ade
data
for
som
e co
untr
ies
(see
text
).
2004
2005
2006
2007
2008
187
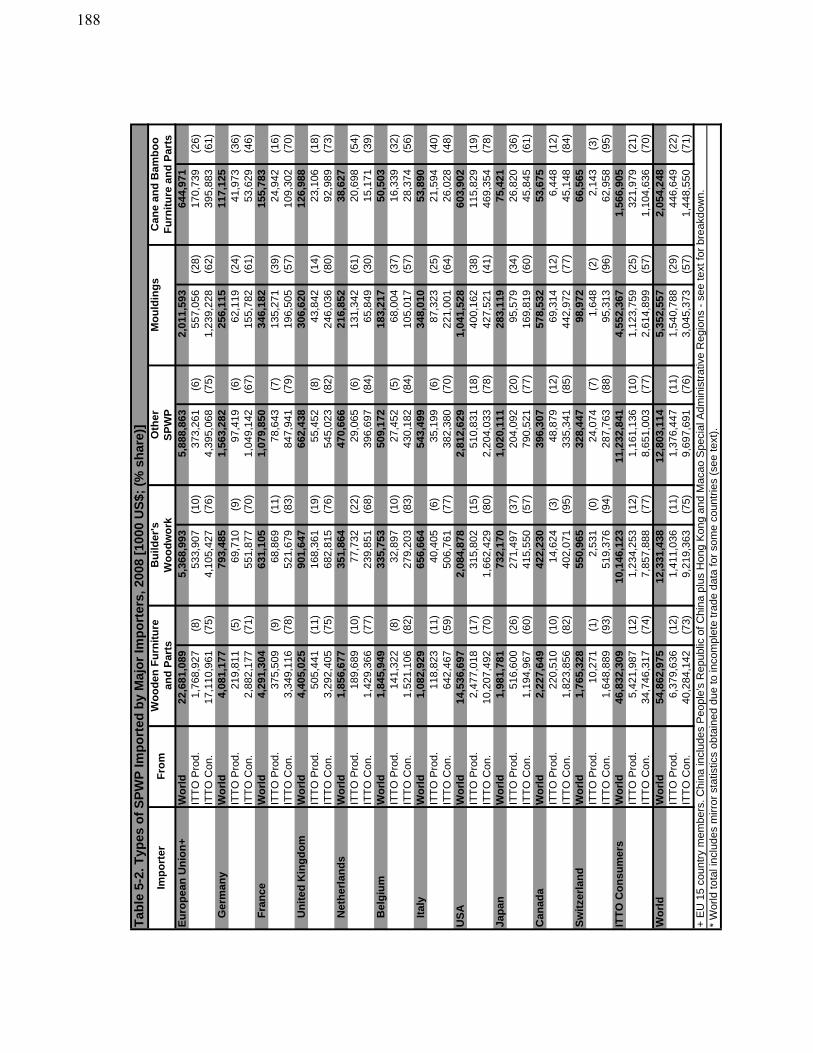
Eu
rop
ean
Un
ion
+W
orl
d22
,681
,089
5,36
8,99
3
5,
888,
863
2,01
1,59
3
64
4,97
1
ITT
O P
rod.
1,76
8,92
7
(8)
533,
907
(10)
373,
261
(6)
557,
056
(28)
170,
739
(26)
ITT
O C
on.
17,1
10,9
61
(75)
4,10
5,42
7
(76)
4,39
5,06
8
(75)
1,23
9,22
8
(62)
395,
883
(61)
Ger
man
yW
orl
d4,
081,
177
793,
485
1,
563,
282
256,
115
11
7,12
5
ITT
O P
rod.
219,
811
(5)
69,7
10
(9)
97,4
19
(6)
62,1
19
(24)
41,9
73
(36)
ITT
O C
on.
2,88
2,17
7
(71)
551,
877
(70)
1,04
9,14
2
(67)
155,
782
(61)
53,6
29
(46)
Fra
nce
Wo
rld
4,29
1,30
4
63
1,10
5
1,07
9,85
0
34
6,18
2
155,
783
IT
TO
Pro
d.37
5,50
9
(9
)68
,869
(1
1)78
,643
(7
)13
5,27
1
(3
9)24
,942
(1
6)IT
TO
Con
.3,
349,
116
(7
8)52
1,67
9
(8
3)84
7,94
1
(7
9)19
6,50
5
(5
7)10
9,30
2
(7
0)U
nit
ed K
ing
do
mW
orl
d4,
405,
025
901,
647
66
2,43
8
306,
620
12
6,98
8
ITT
O P
rod.
505,
441
(11)
168,
361
(19)
55,4
52
(8)
43,8
42
(14)
23,1
06
(18)
ITT
O C
on.
3,29
2,40
5
(75)
682,
815
(76)
545,
023
(82)
246,
036
(80)
92,9
89
(73)
Net
her
lan
ds
Wo
rld
1,85
6,67
7
35
1,86
4
470,
666
21
6,85
2
38,6
27
IT
TO
Pro
d.18
9,68
9
(1
0)77
,732
(2
2)29
,065
(6
)13
1,34
2
(6
1)20
,698
(5
4)IT
TO
Con
.1,
429,
366
(7
7)23
9,85
1
(6
8)39
6,69
7
(8
4)65
,849
(3
0)15
,171
(3
9)B
elg
ium
Wo
rld
1,84
5,94
9
33
5,75
3
509,
172
18
3,21
7
50,5
03
IT
TO
Pro
d.14
1,32
2
(8
)32
,897
(1
0)27
,452
(5
)68
,004
(3
7)16
,339
(3
2)IT
TO
Con
.1,
521,
106
(8
2)27
9,20
3
(8
3)43
0,18
2
(8
4)10
5,01
7
(5
7)28
,374
(5
6)It
aly
Wo
rld
1,08
2,92
9
65
6,66
4
543,
499
34
8,01
0
53,8
90
IT
TO
Pro
d.11
8,82
3
(1
1)40
,405
(6
)35
,199
(6
)87
,323
(2
5)21
,594
(4
0)IT
TO
Con
.64
2,46
7
(5
9)50
6,76
1
(7
7)38
2,38
0
(7
0)22
1,00
1
(6
4)26
,028
(4
8)U
SA
Wo
rld
14,5
36,6
97
2,
084,
878
2,81
2,62
9
1,
041,
528
603,
902
IT
TO
Pro
d.2,
477,
018
(1
7)31
5,80
2
(1
5)51
0,83
1
(1
8)40
0,16
2
(3
8)11
5,82
9
(1
9)IT
TO
Con
.10
,207
,492
(7
0)1,
662,
429
(8
0)2,
204,
033
(7
8)42
7,52
1
(4
1)46
9,35
4
(7
8)Ja
pan
Wo
rld
1,98
1,78
1
73
2,17
0
1,02
0,11
1
28
3,11
9
75,4
21
IT
TO
Pro
d.51
6,60
0
(2
6)27
1,49
7
(3
7)20
4,09
2
(2
0)95
,579
(3
4)26
,820
(3
6)IT
TO
Con
.1,
194,
967
(6
0)41
5,55
0
(5
7)79
0,52
1
(7
7)16
9,81
9
(6
0)45
,845
(6
1)C
anad
aW
orl
d2,
227,
649
422,
230
39
6,30
7
578,
532
53
,675
ITT
O P
rod.
220,
510
(10)
14,6
24
(3)
48,8
79
(12)
69,3
14
(12)
6,44
8
(1
2)IT
TO
Con
.1,
823,
856
(8
2)40
2,07
1
(9
5)33
5,34
1
(8
5)44
2,97
2
(7
7)45
,148
(8
4)S
wit
zerl
and
Wo
rld
1,76
5,32
8
55
0,96
5
328,
447
98
,972
66,5
65
IT
TO
Pro
d.10
,271
(1
)2,
531
(0)
24,0
74
(7)
1,64
8
(2
)2,
143
(3)
ITT
O C
on.
1,64
8,88
9
(93)
519,
376
(94)
287,
763
(88)
95,3
13
(96)
62,9
58
(95)
ITT
O C
on
sum
ers
Wo
rld
46,8
32,3
09
10
,146
,123
11,2
32,8
41
4,
552,
367
1,56
6,90
5
IT
TO
Pro
d.5,
421,
987
(1
2)1,
234,
253
(1
2)1,
161,
136
(1
0)1,
123,
759
(2
5)32
1,97
9
(2
1)IT
TO
Con
.34
,746
,317
(7
4)7,
857,
888
(7
7)8,
651,
003
(7
7)2,
614,
899
(5
7)1,
104,
636
(7
0)W
orl
dW
orl
d54
,862
,975
12,3
31,4
38
12
,803
,114
5,35
2,55
7
2,
054,
248
ITT
O P
rod.
6,37
9,63
6
(12)
1,41
1,03
6
(11)
1,37
6,44
7
(11)
1,54
0,78
8
(29)
446,
649
(22)
ITT
O C
on.
40,2
84,1
42
(73)
9,21
9,36
3
(75)
9,69
7,69
1
(76)
3,04
5,37
3
(57)
1,44
8,55
0
(71)
Tab
le 5
-2. T
ypes
of
SP
WP
Imp
ort
ed b
y M
ajo
r Im
po
rter
s, 2
008
[100
0 U
S$;
(%
sh
are)
]W
oo
den
Fu
rnit
ure
Bu
ilder
'sO
ther
Mo
uld
ing
sC
ane
and
Bam
bo
o
* W
orld
tota
l inc
lude
s m
irror
sta
tistic
s ob
tain
ed d
ue to
inco
mpl
ete
trad
e da
ta fo
r so
me
coun
trie
s (s
ee te
xt).
+ E
U 1
5 co
untr
y m
embe
rs. C
hina
incl
udes
Peo
ple'
s R
epub
lic o
f Chi
na p
lus
Hon
g K
ong
and
Mac
ao S
peci
al A
dmin
istr
ativ
e R
egio
ns -
se
e te
xt fo
r br
eakd
own.
Fro
mIm
po
rter
and
Par
tsW
oo
dw
ork
SP
WP
Fu
rnit
ure
an
d P
arts
188
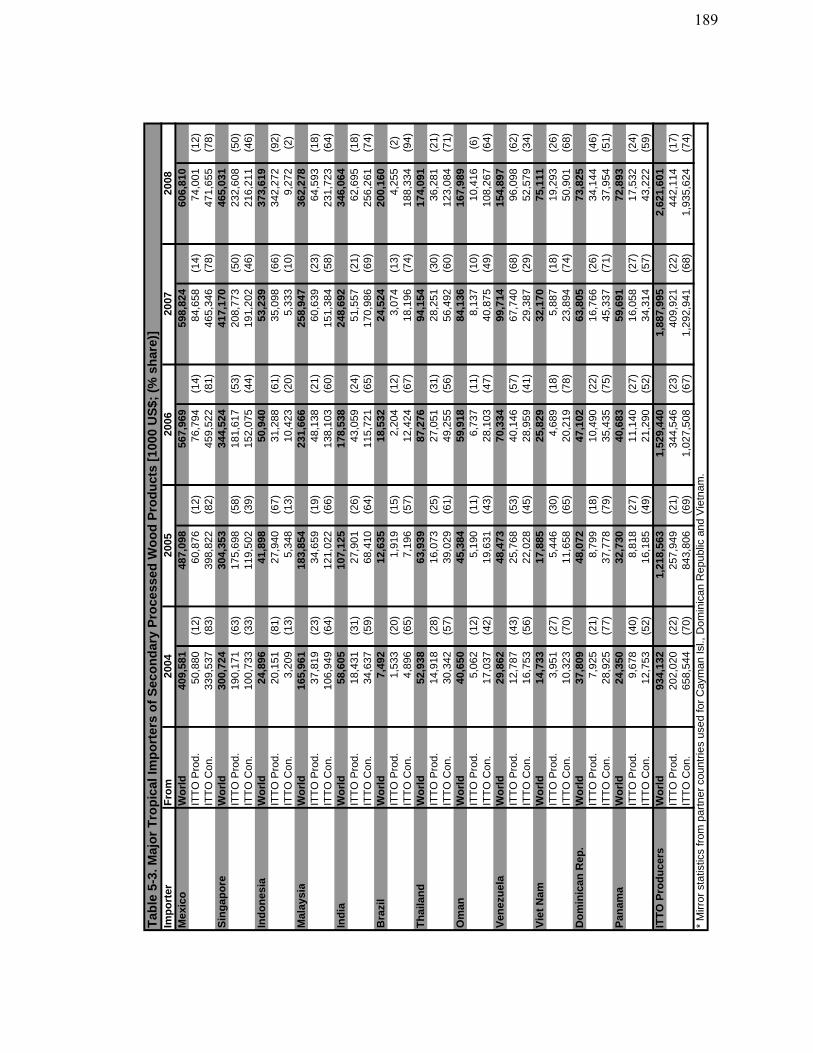
Imp
ort
erF
rom
Mex
ico
Wo
rld
409,
581
48
7,09
8
567,
969
59
8,82
4
606,
810
IT
TO
Pro
d.50
,880
(1
2)60
,876
(1
2)76
,794
(1
4)84
,658
(1
4)74
,001
(1
2)IT
TO
Con
.33
9,53
7
(8
3)39
8,82
2
(8
2)45
9,52
2
(8
1)46
5,34
6
(7
8)47
1,65
5
(7
8)S
ing
apo
reW
orl
d30
0,72
4
304,
353
34
4,52
4
417,
170
46
5,03
1
ITT
O P
rod.
190,
171
(63)
175,
698
(58)
181,
617
(53)
208,
773
(50)
232,
608
(50)
ITT
O C
on.
100,
733
(33)
119,
502
(39)
152,
075
(44)
191,
202
(46)
216,
211
(46)
Ind
on
esia
Wo
rld
24,8
96
41
,898
50,9
40
53,2
39
37
3,61
9
ITT
O P
rod.
20,1
51
(81)
27,9
40
(67)
31,2
88
(61)
35,0
98
(66)
342,
272
(92)
ITT
O C
on.
3,20
9
(1
3)5,
348
(13)
10,4
23
(20)
5,33
3
(1
0)9,
272
(2)
Mal
aysi
aW
orl
d16
5,96
1
183,
854
23
1,66
6
258,
947
36
2,27
8
ITT
O P
rod.
37,8
19
(23)
34,6
59
(19)
48,1
38
(21)
60,6
39
(23)
64,5
93
(18)
ITT
O C
on.
106,
949
(64)
121,
022
(66)
138,
103
(60)
151,
384
(58)
231,
723
(64)
Ind
iaW
orl
d58
,605
107,
125
17
8,53
8
248,
692
34
6,06
4
ITT
O P
rod.
18,4
31
(31)
27,9
01
(26)
43,0
59
(24)
51,5
57
(21)
62,6
95
(18)
ITT
O C
on.
34,6
37
(59)
68,4
10
(64)
115,
721
(65)
170,
986
(69)
256,
261
(74)
Bra
zil
Wo
rld
7,49
2
12,6
35
18
,532
24
,524
200,
160
IT
TO
Pro
d.1,
533
(20)
1,91
9
(1
5)2,
204
(12)
3,07
4
(1
3)4,
255
(2)
ITT
O C
on.
4,89
6
(6
5)7,
196
(57)
12,4
24
(67)
18,1
96
(74)
188,
334
(94)
Th
aila
nd
Wo
rld
52,9
38
63
,939
87,2
76
94,1
54
17
4,09
1
ITT
O P
rod.
14,9
18
(28)
16,0
73
(25)
27,0
51
(31)
28,2
51
(30)
36,2
81
(21)
ITT
O C
on.
30,3
42
(57)
39,0
29
(61)
49,2
55
(56)
56,4
92
(60)
123,
084
(71)
Om
anW
orl
d40
,650
45,3
84
59
,918
84
,136
167,
989
IT
TO
Pro
d.5,
062
(12)
5,19
0
(1
1)6,
737
(11)
8,13
7
(1
0)10
,416
(6
)IT
TO
Con
.17
,037
(4
2)19
,631
(4
3)28
,103
(4
7)40
,875
(4
9)10
8,26
7
(6
4)V
enez
uel
aW
orl
d29
,862
48,4
73
70
,334
99
,714
154,
897
IT
TO
Pro
d.12
,787
(4
3)25
,768
(5
3)40
,146
(5
7)67
,740
(6
8)96
,098
(6
2)IT
TO
Con
.16
,753
(5
6)22
,028
(4
5)28
,959
(4
1)29
,387
(2
9)52
,579
(3
4)V
iet
Nam
Wo
rld
14,7
33
17
,885
25,8
29
32,1
70
75
,111
ITT
O P
rod.
3,95
1
(2
7)5,
446
(30)
4,68
9
(1
8)5,
887
(18)
19,2
93
(26)
ITT
O C
on.
10,3
23
(70)
11,6
58
(65)
20,2
19
(78)
23,8
94
(74)
50,9
01
(68)
Do
min
ican
Rep
.W
orl
d37
,809
48,0
72
47
,102
63
,805
73,8
25
IT
TO
Pro
d.7,
925
(21)
8,79
9
(1
8)10
,490
(2
2)16
,766
(2
6)34
,144
(4
6)IT
TO
Con
.28
,925
(7
7)37
,778
(7
9)35
,435
(7
5)45
,337
(7
1)37
,954
(5
1)P
anam
aW
orl
d24
,350
32,7
30
40
,683
59
,691
72,8
93
IT
TO
Pro
d.9,
678
(40)
8,81
8
(2
7)11
,140
(2
7)16
,058
(2
7)17
,532
(2
4)IT
TO
Con
.12
,753
(5
2)16
,185
(4
9)21
,290
(5
2)34
,314
(5
7)43
,222
(5
9)IT
TO
Pro
du
cers
Wo
rld
934,
132
1,
218,
563
1,52
9,44
0
1,
887,
995
2,62
1,60
1
IT
TO
Pro
d.20
2,02
0
(2
2)25
7,94
9
(2
1)34
4,54
6
(2
3)40
9,92
1
(2
2)44
2,11
4
(1
7)IT
TO
Con
.65
8,54
4
(7
0)84
3,80
6
(6
9)1,
027,
508
(6
7)1,
292,
941
(6
8)1,
935,
624
(7
4)*
Mirr
or s
tatis
tics
from
par
tner
cou
ntrie
s us
ed fo
r C
aym
an Is
l., D
omin
ican
Rep
ublic
and
Vie
tnam
.
Tab
le 5
-3. M
ajo
r T
rop
ical
Imp
ort
ers
of
Sec
on
dar
y P
roce
ssed
Wo
od
Pro
du
cts
[100
0 U
S$;
(%
sh
are)
]20
0420
0520
0620
0720
08
189
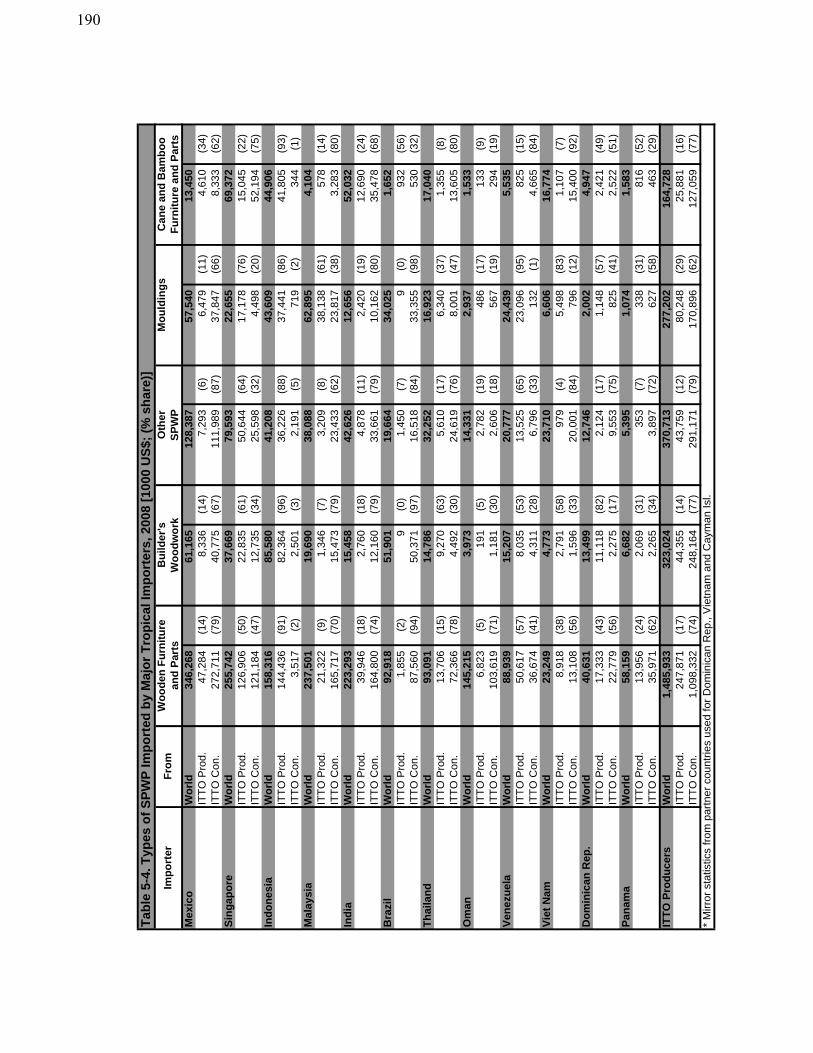
Mex
ico
Wo
rld
346,
268
61
,165
128,
387
57
,540
13,4
50
IT
TO
Pro
d.47
,284
(1
4)8,
336
(14)
7,29
3
(6
)6,
479
(11)
4,61
0
(3
4)IT
TO
Con
.27
2,71
1
(7
9)40
,775
(6
7)11
1,98
9
(8
7)37
,847
(6
6)8,
333
(62)
Sin
gap
ore
Wo
rld
255,
742
37
,669
79,5
93
22,6
55
69
,372
ITT
O P
rod.
126,
906
(50)
22,8
35
(61)
50,6
44
(64)
17,1
78
(76)
15,0
45
(22)
ITT
O C
on.
121,
184
(47)
12,7
35
(34)
25,5
98
(32)
4,49
8
(2
0)52
,194
(7
5)In
do
nes
iaW
orl
d15
8,31
6
85,5
80
41
,208
43
,609
44,9
06
IT
TO
Pro
d.14
4,43
6
(9
1)82
,364
(9
6)36
,226
(8
8)37
,441
(8
6)41
,805
(9
3)IT
TO
Con
.3,
517
(2)
2,50
1
(3
)2,
191
(5)
719
(2
)34
4
(1)
Mal
aysi
aW
orl
d23
7,50
1
19,6
90
38
,088
62
,895
4,10
4
ITT
O P
rod.
21,3
22
(9)
1,34
6
(7
)3,
209
(8)
38,1
38
(61)
578
(1
4)IT
TO
Con
.16
5,71
7
(7
0)15
,473
(7
9)23
,433
(6
2)23
,817
(3
8)3,
283
(80)
Ind
iaW
orl
d22
3,29
3
15,4
58
42
,626
12
,656
52,0
32
IT
TO
Pro
d.39
,946
(1
8)2,
760
(18)
4,87
8
(1
1)2,
420
(19)
12,6
90
(24)
ITT
O C
on.
164,
800
(74)
12,1
60
(79)
33,6
61
(79)
10,1
62
(80)
35,4
78
(68)
Bra
zil
Wo
rld
92,9
18
51
,901
19,6
64
34,0
25
1,
652
IT
TO
Pro
d.1,
855
(2)
9
(0
)1,
450
(7)
9
(0
)93
2
(56)
ITT
O C
on.
87,5
60
(94)
50,3
71
(97)
16,5
18
(84)
33,3
55
(98)
530
(3
2)T
hai
lan
dW
orl
d93
,091
14,7
86
32
,252
16
,923
17,0
40
IT
TO
Pro
d.13
,706
(1
5)9,
270
(63)
5,61
0
(1
7)6,
340
(37)
1,35
5
(8
)IT
TO
Con
.72
,366
(7
8)4,
492
(30)
24,6
19
(76)
8,00
1
(4
7)13
,605
(8
0)O
man
Wo
rld
145,
215
3,
973
14
,331
2,
937
1,
533
IT
TO
Pro
d.6,
823
(5)
191
(5
)2,
782
(19)
486
(1
7)13
3
(9)
ITT
O C
on.
103,
619
(71)
1,18
1
(3
0)2,
606
(18)
567
(1
9)29
4
(19)
Ven
ezu
ela
Wo
rld
88,9
39
15
,207
20,7
77
24,4
39
5,
535
IT
TO
Pro
d.50
,617
(5
7)8,
035
(53)
13,5
25
(65)
23,0
96
(95)
825
(1
5)IT
TO
Con
.36
,674
(4
1)4,
311
(28)
6,79
6
(3
3)13
2
(1)
4,66
5
(8
4)V
iet
Nam
Wo
rld
23,2
49
4,
773
23
,710
6,
606
16
,774
ITT
O P
rod.
8,91
8
(3
8)2,
791
(58)
979
(4
)5,
498
(83)
1,10
7
(7
)IT
TO
Con
.13
,108
(5
6)1,
596
(33)
20,0
01
(84)
796
(1
2)15
,400
(9
2)D
om
inic
an R
ep.
Wo
rld
40,6
31
13
,499
12,7
46
2,00
2
4,94
7
ITT
O P
rod.
17,3
33
(43)
11,1
18
(82)
2,12
4
(1
7)1,
148
(57)
2,42
1
(4
9)IT
TO
Con
.22
,779
(5
6)2,
275
(17)
9,55
3
(7
5)82
5
(41)
2,52
2
(5
1)P
anam
aW
orl
d58
,159
6,68
2
5,39
5
1,07
4
1,58
3
ITT
O P
rod.
13,9
56
(24)
2,06
9
(3
1)35
3
(7)
338
(3
1)81
6
(52)
ITT
O C
on.
35,9
71
(62)
2,26
5
(3
4)3,
897
(72)
627
(5
8)46
3
(29)
ITT
O P
rod
uce
rsW
orl
d1,
485,
933
323,
024
37
0,71
3
277,
202
16
4,72
8
ITT
O P
rod.
247,
871
(17)
44,3
55
(14)
43,7
59
(12)
80,2
48
(29)
25,8
81
(16)
ITT
O C
on.
1,09
8,33
2
(74)
248,
164
(77)
291,
171
(79)
170,
896
(62)
127,
059
(77)
* M
irror
sta
tistic
s fr
om p
artn
er c
ount
ries
used
for
Dom
inic
an R
ep.,
Vie
tnam
and
Cay
man
Isl.
Tab
le 5
-4. T
ypes
of
SP
WP
Imp
ort
ed b
y M
ajo
r T
rop
ical
Imp
ort
ers,
200
8 [1
000
US
$; (
% s
har
e)]
Wo
od
en F
urn
itu
reB
uild
er's
Oth
erM
ou
ldin
gs
Can
e an
d B
amb
oo
Imp
ort
erF
rom
and
Par
tsW
oo
dw
ork
SP
WP
Fu
rnit
ure
an
d P
arts
190
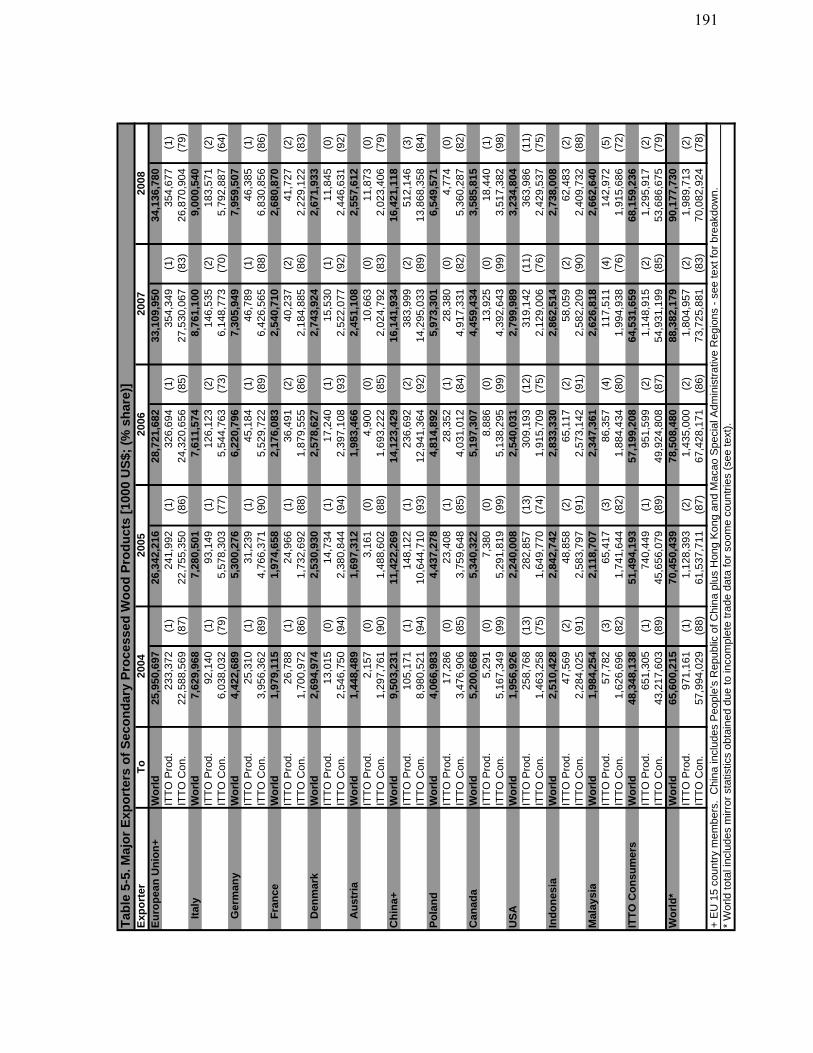
Exp
ort
erT
oE
uro
pea
n U
nio
n+
Wo
rld
25,9
50,6
97
26
,342
,216
28,7
21,6
82
33
,109
,950
34,1
36,7
80
IT
TO
Pro
d.23
3,37
2
(1
)24
1,99
2
(1
)32
6,69
4
(1
)35
4,34
9
(1
)35
4,67
7
(1
)IT
TO
Con
.22
,588
,569
(8
7)22
,755
,350
(8
6)24
,320
,656
(8
5)27
,530
,067
(8
3)26
,870
,904
(7
9)It
aly
Wo
rld
7,62
9,96
8
7,
280,
501
7,61
1,57
4
8,
761,
100
9,00
0,54
0
IT
TO
Pro
d.92
,140
(1
)93
,149
(1
)12
6,12
3
(2
)14
6,53
5
(2
)18
3,57
1
(2
)IT
TO
Con
.6,
038,
032
(7
9)5,
578,
303
(7
7)5,
544,
763
(7
3)6,
148,
773
(7
0)5,
792,
887
(6
4)G
erm
any
Wo
rld
4,42
2,68
9
5,
300,
276
6,22
0,79
6
7,
305,
949
7,95
9,50
7
IT
TO
Pro
d.25
,310
(1
)31
,239
(1
)45
,184
(1
)46
,789
(1
)46
,385
(1
)IT
TO
Con
.3,
956,
362
(8
9)4,
766,
371
(9
0)5,
529,
722
(8
9)6,
426,
565
(8
8)6,
830,
856
(8
6)F
ran
ceW
orl
d1,
979,
115
1,97
4,65
8
2,
176,
083
2,54
0,71
0
2,
680,
870
ITT
O P
rod.
26,7
88
(1)
24,9
66
(1)
36,4
91
(2)
40,2
37
(2)
41,7
27
(2)
ITT
O C
on.
1,70
0,97
2
(86)
1,73
2,69
2
(88)
1,87
9,55
5
(86)
2,18
4,88
5
(86)
2,22
9,12
2
(83)
Den
mar
kW
orl
d2,
694,
974
2,53
0,93
0
2,
578,
627
2,74
3,92
4
2,
671,
933
ITT
O P
rod.
13,0
15
(0)
14,7
34
(1)
17,2
40
(1)
15,5
30
(1)
11,8
45
(0)
ITT
O C
on.
2,54
6,75
0
(94)
2,38
0,84
4
(94)
2,39
7,10
8
(93)
2,52
2,07
7
(92)
2,44
6,63
1
(92)
Au
stri
aW
orl
d1,
448,
489
1,69
7,31
2
1,
983,
466
2,45
1,10
8
2,
557,
612
ITT
O P
rod.
2,15
7
(0
)3,
161
(0)
4,90
0
(0
)10
,663
(0
)11
,873
(0
)IT
TO
Con
.1,
297,
761
(9
0)1,
488,
602
(8
8)1,
693,
222
(8
5)2,
024,
792
(8
3)2,
023,
406
(7
9)C
hin
a+W
orl
d9,
503,
231
11,4
22,2
69
14
,123
,429
16,1
41,9
34
16
,421
,118
ITT
O P
rod.
105,
171
(1)
148,
122
(1)
236,
692
(2)
383,
999
(2)
512,
146
(3)
ITT
O C
on.
8,98
0,52
1
(94)
10,6
44,7
10
(93)
12,9
41,3
64
(92)
14,2
95,0
33
(89)
13,8
68,3
58
(84)
Po
lan
dW
orl
d4,
066,
983
4,43
7,27
8
4,
814,
892
5,97
3,30
1
6,
549,
571
ITT
O P
rod.
17,2
86
(0)
23,4
08
(1)
28,3
52
(1)
28,3
80
(0)
4,77
4
(0
)IT
TO
Con
.3,
476,
906
(8
5)3,
759,
648
(8
5)4,
031,
012
(8
4)4,
917,
331
(8
2)5,
360,
287
(8
2)C
anad
aW
orl
d5,
200,
668
5,34
0,32
2
5,
197,
307
4,45
9,43
4
3,
585,
815
ITT
O P
rod.
5,29
1
(0
)7,
380
(0)
8,88
6
(0
)13
,925
(0
)18
,440
(1
)IT
TO
Con
.5,
167,
349
(9
9)5,
291,
819
(9
9)5,
138,
295
(9
9)4,
392,
643
(9
9)3,
517,
382
(9
8)U
SA
Wo
rld
1,95
6,92
6
2,
240,
008
2,54
0,03
1
2,
799,
989
3,23
4,80
4
IT
TO
Pro
d.25
8,76
8
(1
3)28
2,85
7
(1
3)30
9,19
3
(1
2)31
9,14
2
(1
1)36
3,98
6
(1
1)IT
TO
Con
.1,
463,
258
(7
5)1,
649,
770
(7
4)1,
915,
709
(7
5)2,
129,
006
(7
6)2,
429,
537
(7
5)In
do
nes
iaW
orl
d2,
510,
428
2,84
2,74
2
2,
833,
330
2,86
2,51
4
2,
738,
008
ITT
O P
rod.
47,5
69
(2)
48,8
58
(2)
65,1
17
(2)
58,0
59
(2)
62,4
83
(2)
ITT
O C
on.
2,28
4,02
5
(91)
2,58
3,79
7
(91)
2,57
3,14
2
(91)
2,58
2,20
9
(90)
2,40
9,73
2
(88)
Mal
aysi
aW
orl
d1,
984,
254
2,11
8,70
7
2,
347,
361
2,62
6,81
8
2,
662,
640
ITT
O P
rod.
57,7
82
(3)
65,4
17
(3)
86,3
57
(4)
117,
511
(4)
142,
972
(5)
ITT
O C
on.
1,62
6,69
6
(82)
1,74
1,64
4
(82)
1,88
4,43
4
(80)
1,99
4,93
8
(76)
1,91
5,68
6
(72)
ITT
O C
on
sum
ers
Wo
rld
48,3
48,1
38
51
,494
,193
57,1
99,2
08
64
,531
,659
68,1
59,2
36
IT
TO
Pro
d.65
1,30
5
(1
)74
0,44
9
(1
)95
1,59
9
(2
)1,
148,
915
(2
)1,
295,
917
(2
)IT
TO
Con
.43
,217
,603
(8
9)45
,656
,079
(8
9)49
,924
,808
(8
7)54
,931
,199
(8
5)53
,686
,675
(7
9)W
orl
d*
Wo
rld
65,6
00,2
15
70
,450
,439
78,5
08,4
80
88
,382
,179
90,1
77,7
30
IT
TO
Pro
d.97
1,16
1
(1
)1,
128,
393
(2
)1,
435,
000
(2
)1,
804,
957
(2
)1,
989,
713
(2
)IT
TO
Con
.57
,994
,029
(8
8)61
,537
,711
(8
7)67
,428
,171
(8
6)73
,725
,881
(8
3)70
,082
,924
(7
8)
* W
orld
tota
l inc
lude
s m
irror
sta
tistic
s ob
tain
ed d
ue to
inco
mpl
ete
trad
e da
ta fo
r so
ome
coun
trie
s (s
ee te
xt).
+ E
U 1
5 co
untr
y m
embe
rs.
Chi
na in
clud
es P
eopl
e's
Rep
ublic
of C
hina
plu
s H
ong
Kon
g an
d M
acao
Spe
cial
Adm
inis
trat
ive
Reg
ions
- s
ee te
xt fo
r br
eakd
own.
Tab
le 5
-5. M
ajo
r E
xpo
rter
s o
f S
eco
nd
ary
Pro
cess
ed W
oo
d P
rod
uct
s [1
000
US
$; (
% s
har
e)]
2004
2005
2006
2007
2008
191
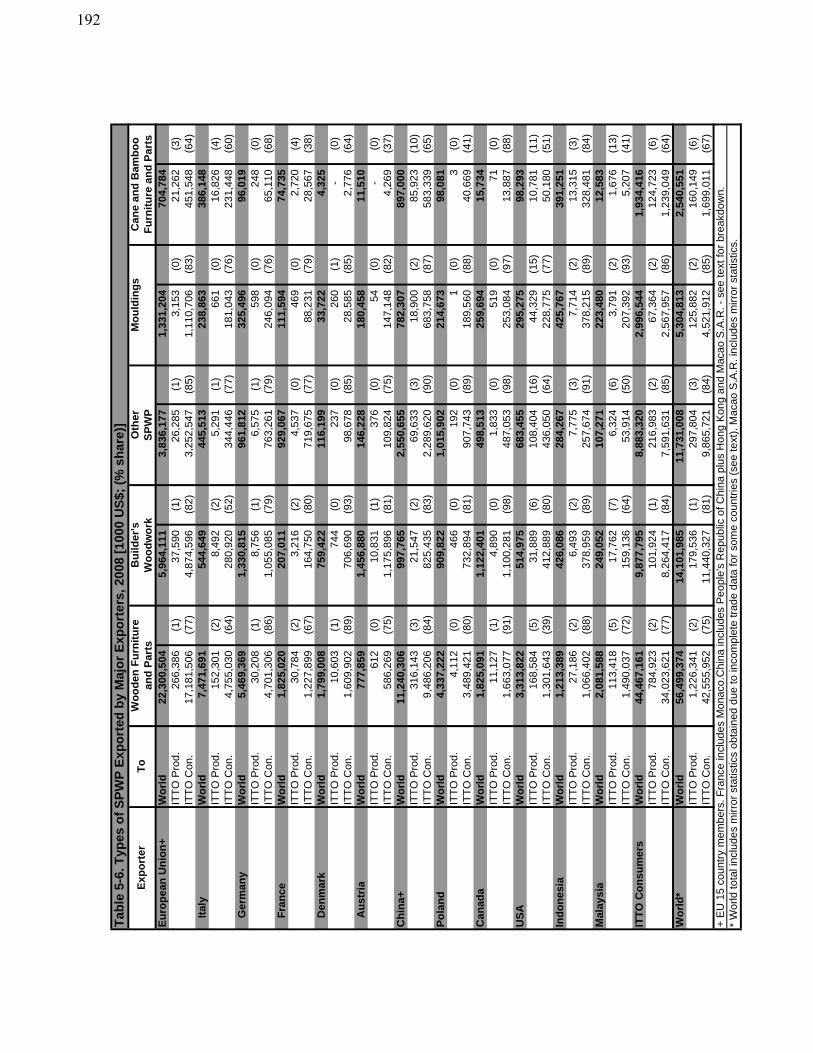
Eu
rop
ean
Un
ion
+W
orl
d22
,300
,504
5,96
4,11
1
3,
836,
177
1,33
1,20
4
70
4,78
4
ITT
O P
rod.
266,
386
(1)
37,5
90
(1)
26,2
85
(1)
3,15
3
(0
)21
,262
(3
)IT
TO
Con
.17
,181
,506
(7
7)4,
874,
596
(8
2)3,
252,
547
(8
5)1,
110,
706
(8
3)45
1,54
8
(6
4)It
aly
Wo
rld
7,47
1,69
1
54
4,64
9
445,
513
23
8,86
3
386,
148
IT
TO
Pro
d.15
2,30
1
(2
)8,
492
(2)
5,29
1
(1
)66
1
(0)
16,8
26
(4)
ITT
O C
on.
4,75
5,03
0
(64)
280,
920
(52)
344,
446
(77)
181,
043
(76)
231,
448
(60)
Ger
man
yW
orl
d5,
469,
369
1,33
0,81
5
96
1,81
2
325,
496
96
,019
ITT
O P
rod.
30,2
08
(1)
8,75
6
(1
)6,
575
(1)
598
(0
)24
8
(0)
ITT
O C
on.
4,70
1,30
6
(86)
1,05
5,08
5
(79)
763,
261
(79)
246,
094
(76)
65,1
10
(68)
Fra
nce
Wo
rld
1,82
5,02
0
20
7,01
1
929,
067
11
1,59
4
74,7
35
IT
TO
Pro
d.30
,784
(2
)3,
216
(2)
4,53
7
(0
)46
9
(0)
2,72
0
(4
)IT
TO
Con
.1,
227,
899
(6
7)16
4,75
0
(8
0)71
9,67
5
(7
7)88
,231
(7
9)28
,567
(3
8)D
enm
ark
Wo
rld
1,79
9,00
8
75
9,42
2
116,
199
33
,722
4,32
5
ITT
O P
rod.
10,6
03
(1)
744
(0
)23
7
(0)
260
(1
)-
(0
)IT
TO
Con
.1,
609,
902
(8
9)70
6,69
0
(9
3)98
,678
(8
5)28
,585
(8
5)2,
776
(64)
Au
stri
aW
orl
d77
7,85
9
1,45
6,88
0
14
6,22
8
180,
458
11
,510
ITT
O P
rod.
612
(0
)10
,831
(1
)37
6
(0)
54
(0)
-
(0)
ITT
O C
on.
586,
269
(75)
1,17
5,89
6
(81)
109,
824
(75)
147,
148
(82)
4,26
9
(3
7)C
hin
a+W
orl
d11
,240
,306
997,
765
2,
550,
655
782,
307
89
7,00
0
ITT
O P
rod.
316,
143
(3)
21,5
47
(2)
69,6
33
(3)
18,9
00
(2)
85,9
23
(10)
ITT
O C
on.
9,48
6,20
6
(84)
825,
435
(83)
2,28
9,62
0
(90)
683,
758
(87)
583,
339
(65)
Po
lan
dW
orl
d4,
337,
222
909,
822
1,
015,
902
214,
673
98
,081
ITT
O P
rod.
4,11
2
(0
)46
6
(0)
192
(0
)1
(0)
3
(0
)IT
TO
Con
.3,
489,
421
(8
0)73
2,89
4
(8
1)90
7,74
3
(8
9)18
9,56
0
(8
8)40
,669
(4
1)C
anad
aW
orl
d1,
825,
091
1,12
2,40
1
49
8,51
3
259,
694
15
,734
ITT
O P
rod.
11,1
27
(1)
4,89
0
(0
)1,
833
(0)
519
(0
)71
(0
)IT
TO
Con
.1,
663,
077
(9
1)1,
100,
281
(9
8)48
7,05
3
(9
8)25
3,08
4
(9
7)13
,887
(8
8)U
SA
Wo
rld
3,31
3,82
2
51
4,97
5
683,
455
29
5,27
5
98,2
93
IT
TO
Pro
d.16
8,58
4
(5
)31
,889
(6
)10
8,40
4
(1
6)44
,329
(1
5)10
,781
(1
1)IT
TO
Con
.1,
301,
643
(3
9)41
2,88
9
(8
0)43
6,05
0
(6
4)22
8,77
5
(7
7)50
,180
(5
1)In
do
nes
iaW
orl
d1,
213,
389
426,
086
28
4,26
7
425,
767
39
1,25
1
ITT
O P
rod.
27,1
86
(2)
6,49
3
(2
)7,
775
(3)
7,71
4
(2
)13
,315
(3
)IT
TO
Con
.1,
066,
402
(8
8)37
8,95
9
(8
9)25
7,67
4
(9
1)37
8,21
5
(8
9)32
8,48
1
(8
4)M
alay
sia
Wo
rld
2,08
1,58
8
24
9,05
2
107,
271
22
3,48
0
12,5
83
IT
TO
Pro
d.11
3,41
8
(5
)17
,762
(7
)6,
324
(6)
3,79
1
(2
)1,
676
(13)
ITT
O C
on.
1,49
0,03
7
(72)
159,
136
(64)
53,9
14
(50)
207,
392
(93)
5,20
7
(4
1)IT
TO
Co
nsu
mer
sW
orl
d44
,467
,161
9,87
7,79
5
8,
883,
320
2,99
6,54
4
1,
934,
416
ITT
O P
rod.
784,
923
(2)
101,
924
(1)
216,
983
(2)
67,3
64
(2)
124,
723
(6)
ITT
O C
on.
34,0
23,6
21
(77)
8,26
4,41
7
(84)
7,59
1,63
1
(85)
2,56
7,95
7
(86)
1,23
9,04
9
(64)
Wo
rld
*W
orl
d56
,499
,374
14,1
01,9
85
11
,731
,008
5,30
4,81
3
2,
540,
551
ITT
O P
rod.
1,22
6,34
1
(2)
179,
536
(1)
297,
804
(3)
125,
882
(2)
160,
149
(6)
ITT
O C
on.
42,5
55,9
52
(75)
11,4
40,3
27
(81)
9,86
5,72
1
(84)
4,52
1,91
2
(85)
1,69
9,01
1
(67)
+ E
U 1
5 co
untr
y m
embe
rs. F
ranc
e in
clud
es M
onac
o.C
hina
incl
udes
Peo
ple'
s R
epub
lic o
f Chi
na p
lus
Hon
g K
ong
and
Mac
ao S
.A.R
. - s
ee te
xt fo
r br
eakd
own.
* W
orld
tota
l inc
lude
s m
irror
sta
tistic
s ob
tain
ed d
ue to
inco
mpl
ete
trad
e da
ta fo
r so
me
coun
trie
s (s
ee te
xt).
Mac
ao S
.A.R
. inc
lude
s m
irror
sta
tistic
s.
Tab
le 5
-6. T
ypes
of
SP
WP
Exp
ort
ed b
y M
ajo
r E
xpo
rter
s, 2
008
[100
0 U
S$;
(%
sh
are)
]
Exp
ort
erT
oC
ane
and
Bam
bo
oan
d P
arts
Wo
od
wo
rkS
PW
PF
urn
itu
re a
nd
Par
tsW
oo
den
Fu
rnit
ure
Bu
ilder
'sO
ther
Mo
uld
ing
s
192
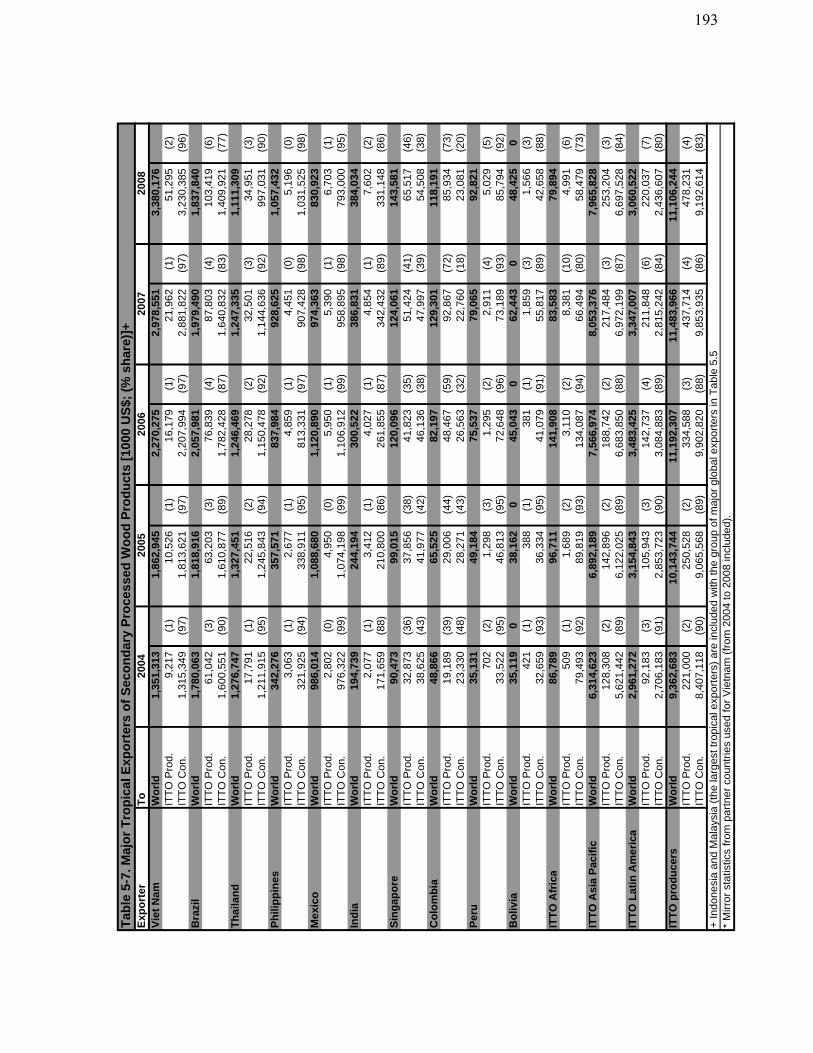
Exp
ort
erT
oV
iet
Nam
Wo
rld
1,35
1,31
3
1,
862,
945
2,27
0,27
5
2,
978,
551
3,38
0,17
6
IT
TO
Pro
d.9,
217
(1)
10,5
26
(1)
16,1
79
(1)
21,9
62
(1)
51,2
95
(2)
ITT
O C
on.
1,31
5,34
9
(97)
1,81
3,62
1
(97)
2,20
7,99
4
(97)
2,88
1,82
2
(97)
3,23
0,38
5
(96)
Bra
zil
Wo
rld
1,78
0,06
3
1,
818,
916
2,05
7,98
1
1,
979,
490
1,83
7,84
0
IT
TO
Pro
d.61
,042
(3
)63
,203
(3
)76
,839
(4
)87
,803
(4
)10
3,41
9
(6
)IT
TO
Con
.1,
600,
551
(9
0)1,
610,
877
(8
9)1,
782,
428
(8
7)1,
640,
832
(8
3)1,
409,
921
(7
7)T
hai
lan
dW
orl
d1,
276,
747
1,32
7,45
1
1,
246,
469
1,24
7,33
5
1,
111,
309
ITT
O P
rod.
17,7
91
(1)
22,5
16
(2)
28,2
78
(2)
32,5
01
(3)
34,9
51
(3)
ITT
O C
on.
1,21
1,91
5
(95)
1,24
5,84
3
(94)
1,15
0,47
8
(92)
1,14
4,63
6
(92)
997,
031
(90)
Ph
ilip
pin
esW
orl
d34
2,27
6
357,
571
83
7,98
4
928,
625
1,
057,
432
ITT
O P
rod.
3,06
3
(1
)2,
677
(1)
4,85
9
(1
)4,
451
(0)
5,19
6
(0
)IT
TO
Con
.32
1,92
5
(9
4)33
8,91
1
(9
5)81
3,33
1
(9
7)90
7,42
8
(9
8)1,
031,
525
(9
8)M
exic
oW
orl
d98
6,01
4
1,08
8,68
0
1,
120,
890
974,
363
83
0,92
3
ITT
O P
rod.
2,80
2
(0
)4,
950
(0)
5,95
0
(1
)5,
390
(1)
6,70
3
(1
)IT
TO
Con
.97
6,32
2
(9
9)1,
074,
198
(9
9)1,
106,
912
(9
9)95
8,89
5
(9
8)79
3,00
0
(9
5)In
dia
Wo
rld
194,
739
24
4,19
4
300,
522
38
6,83
1
384,
034
IT
TO
Pro
d.2,
077
(1)
3,41
2
(1
)4,
027
(1)
4,85
4
(1
)7,
602
(2)
ITT
O C
on.
171,
659
(88)
210,
800
(86)
261,
855
(87)
342,
432
(89)
331,
148
(86)
Sin
gap
ore
Wo
rld
90,4
73
99
,015
120,
096
12
4,06
1
143,
581
IT
TO
Pro
d.32
,873
(3
6)37
,856
(3
8)41
,823
(3
5)51
,424
(4
1)65
,517
(4
6)IT
TO
Con
.38
,625
(4
3)41
,977
(4
2)46
,136
(3
8)47
,997
(3
9)54
,508
(3
8)C
olo
mb
iaW
orl
d48
,866
65,5
25
82
,197
12
9,30
1
118,
191
IT
TO
Pro
d.19
,189
(3
9)29
,006
(4
4)48
,467
(5
9)92
,867
(7
2)85
,934
(7
3)IT
TO
Con
.23
,330
(4
8)28
,271
(4
3)26
,563
(3
2)22
,760
(1
8)23
,081
(2
0)P
eru
Wo
rld
35,1
31
49
,184
75,5
37
79,0
65
92
,821
ITT
O P
rod.
702
(2
)1,
298
(3)
1,29
5
(2
)2,
911
(4)
5,02
9
(5
)IT
TO
Con
.33
,522
(9
5)46
,813
(9
5)72
,648
(9
6)73
,189
(9
3)85
,794
(9
2)B
oliv
iaW
orl
d35
,119
038
,162
045
,043
0
62,4
43
0
48,4
25
0
ITT
O P
rod.
421
(1
)38
8
(1)
381
(1
)1,
859
(3)
1,56
6
(3
)IT
TO
Con
.32
,659
(9
3)36
,334
(9
5)41
,079
(9
1)55
,817
(8
9)42
,658
(8
8)IT
TO
Afr
ica
Wo
rld
86,7
89
96
,711
141,
908
83
,583
79,8
94
IT
TO
Pro
d.50
9
(1)
1,68
9
(2
)3,
110
(2)
8,38
1
(1
0)4,
991
(6)
ITT
O C
on.
79,4
93
(92)
89,8
19
(93)
134,
087
(94)
66,4
94
(80)
58,4
79
(73)
ITT
O A
sia
Pac
ific
Wo
rld
6,31
4,62
3
6,
892,
189
7,56
6,97
4
8,
053,
376
7,96
5,82
8
IT
TO
Pro
d.12
8,30
8
(2
)14
2,89
6
(2
)18
8,74
2
(2
)21
7,48
4
(3
)25
3,20
4
(3
)IT
TO
Con
.5,
621,
442
(8
9)6,
122,
025
(8
9)6,
683,
850
(8
8)6,
972,
199
(8
7)6,
697,
528
(8
4)IT
TO
Lat
in A
mer
ica
Wo
rld
2,96
1,27
2
3,
154,
843
3,48
3,42
5
3,
347,
007
3,06
0,52
2
IT
TO
Pro
d.92
,183
(3
)10
5,94
3
(3
)14
2,73
7
(4
)21
1,84
8
(6
)22
0,03
7
(7
)IT
TO
Con
.2,
706,
183
(9
1)2,
853,
723
(9
0)3,
084,
883
(8
9)2,
815,
242
(8
4)2,
436,
607
(8
0)IT
TO
pro
du
cers
Wo
rld
9,36
2,68
3
10
,143
,744
11,1
92,3
07
11
,483
,966
11,1
06,2
44
IT
TO
Pro
d.22
1,00
0
(2
)25
0,52
8
(2
)33
4,58
8
(3
)43
7,71
4
(4
)47
8,23
1
(4
)IT
TO
Con
.8,
407,
118
(9
0)9,
065,
568
(8
9)9,
902,
820
(8
8)9,
853,
935
(8
6)9,
192,
614
(8
3)+
Indo
nesi
a an
d M
alay
sia
(the
larg
est t
ropi
cal e
xpor
ters
) ar
e in
clud
ed w
ith th
e gr
oup
of m
ajor
glo
bal e
xpor
ters
in T
able
5.5
* M
irror
sta
tistic
s fr
om p
artn
er c
ount
ries
used
for
Vie
tnam
(fr
om 2
004
to 2
008
incl
uded
).
Tab
le 5
-7. M
ajo
r T
rop
ical
Exp
ort
ers
of
Sec
on
dar
y P
roce
ssed
Wo
od
Pro
du
cts
[100
0 U
S$;
(%
sh
are)
]+20
0420
0520
0620
0720
08
193
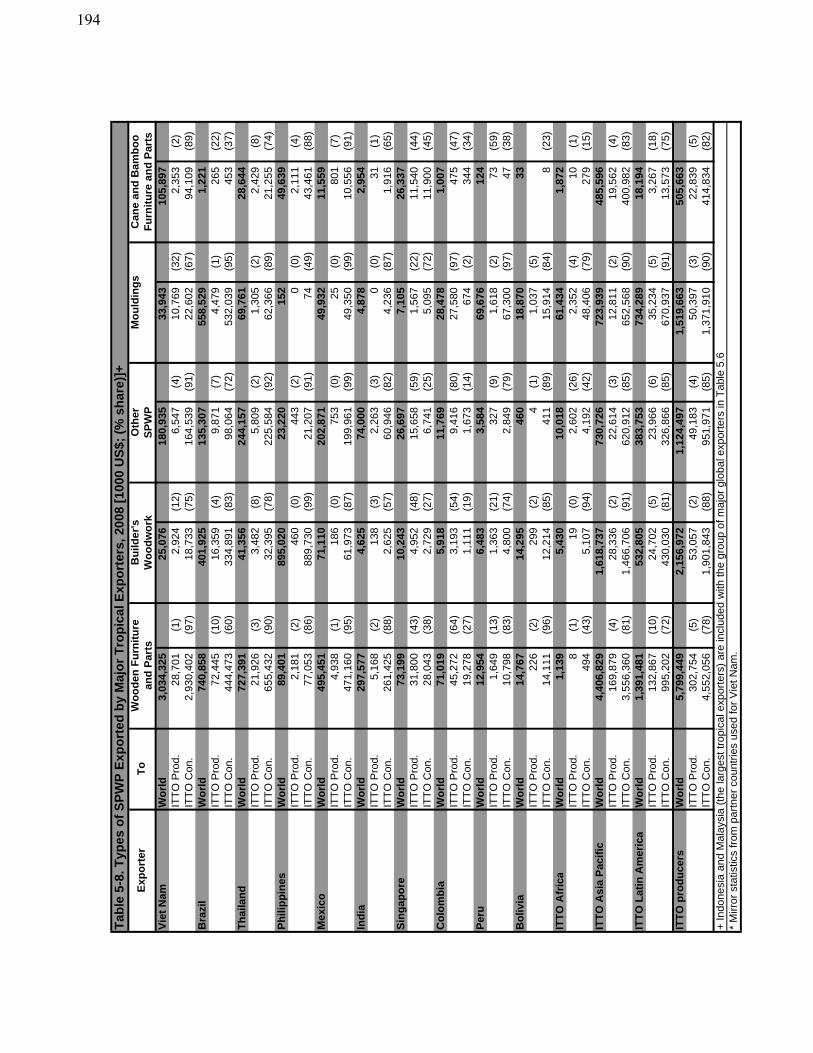
Vie
t N
amW
orl
d3,
034,
325
25,0
76
18
0,93
5
33,9
43
10
5,89
7
ITT
O P
rod.
28,7
01
(1)
2,92
4
(1
2)6,
547
(4)
10,7
69
(32)
2,35
3
(2
)IT
TO
Con
.2,
930,
402
(9
7)18
,733
(7
5)16
4,53
9
(9
1)22
,602
(6
7)94
,109
(8
9)B
razi
lW
orl
d74
0,85
8
401,
925
13
5,30
7
558,
529
1,
221
IT
TO
Pro
d.72
,445
(1
0)16
,359
(4
)9,
871
(7)
4,47
9
(1
)26
5
(22)
ITT
O C
on.
444,
473
(60)
334,
891
(83)
98,0
64
(72)
532,
039
(95)
453
(3
7)T
hai
lan
dW
orl
d72
7,39
1
41,3
56
24
4,15
7
69,7
61
28
,644
ITT
O P
rod.
21,9
26
(3)
3,48
2
(8
)5,
809
(2)
1,30
5
(2
)2,
429
(8)
ITT
O C
on.
655,
432
(90)
32,3
95
(78)
225,
584
(92)
62,3
66
(89)
21,2
55
(74)
Ph
ilip
pin
esW
orl
d89
,401
895,
020
23
,220
15
2
49
,639
ITT
O P
rod.
2,18
1
(2
)46
0
(0)
443
(2
)0
(0)
2,11
1
(4
)IT
TO
Con
.77
,053
(8
6)88
9,73
0
(9
9)21
,207
(9
1)74
(4
9)43
,461
(8
8)M
exic
oW
orl
d49
5,45
1
71,1
10
20
2,87
1
49,9
32
11
,559
ITT
O P
rod.
4,93
8
(1
)18
6
(0)
753
(0
)25
(0
)80
1
(7)
ITT
O C
on.
471,
160
(95)
61,9
73
(87)
199,
961
(99)
49,3
50
(99)
10,5
56
(91)
Ind
iaW
orl
d29
7,57
7
4,62
5
74,0
00
4,87
8
2,95
4
ITT
O P
rod.
5,16
8
(2
)13
8
(3)
2,26
3
(3
)0
(0)
31
(1)
ITT
O C
on.
261,
425
(88)
2,62
5
(5
7)60
,946
(8
2)4,
236
(87)
1,91
6
(6
5)S
ing
apo
reW
orl
d73
,199
10,2
43
26
,697
7,
105
26
,337
ITT
O P
rod.
31,8
00
(43)
4,95
2
(4
8)15
,658
(5
9)1,
567
(22)
11,5
40
(44)
ITT
O C
on.
28,0
43
(38)
2,72
9
(2
7)6,
741
(25)
5,09
5
(7
2)11
,900
(4
5)C
olo
mb
iaW
orl
d71
,019
5,91
8
11,7
69
28,4
78
1,
007
IT
TO
Pro
d.45
,272
(6
4)3,
193
(54)
9,41
6
(8
0)27
,580
(9
7)47
5
(47)
ITT
O C
on.
19,2
78
(27)
1,11
1
(1
9)1,
673
(14)
674
(2
)34
4
(34)
Per
uW
orl
d12
,954
6,48
3
3,58
4
69,6
76
12
4
IT
TO
Pro
d.1,
649
(13)
1,36
3
(2
1)32
7
(9)
1,61
8
(2
)73
(5
9)IT
TO
Con
.10
,798
(8
3)4,
800
(74)
2,84
9
(7
9)67
,300
(9
7)47
(3
8)B
oliv
iaW
orl
d14
,767
14,2
95
46
0
18
,870
33
IT
TO
Pro
d.22
6
(2)
299
(2
)4
(1)
1,03
7
(5
)IT
TO
Con
.14
,111
(9
6)12
,214
(8
5)41
1
(89)
15,9
14
(84)
8
(2
3)IT
TO
Afr
ica
Wo
rld
1,13
9
5,43
0
10,0
18
61,4
34
1,
872
IT
TO
Pro
d.8
(1)
19
(0)
2,60
2
(2
6)2,
352
(4)
10
(1)
ITT
O C
on.
494
(4
3)5,
107
(94)
4,19
2
(4
2)48
,406
(7
9)27
9
(15)
ITT
O A
sia
Pac
ific
Wo
rld
4,40
6,82
9
1,
618,
737
730,
726
72
3,93
9
485,
596
IT
TO
Pro
d.16
9,87
9
(4
)28
,336
(2
)22
,614
(3
)12
,811
(2
)19
,562
(4
)IT
TO
Con
.3,
556,
360
(8
1)1,
466,
706
(9
1)62
0,91
2
(8
5)65
2,56
8
(9
0)40
0,98
2
(8
3)IT
TO
Lat
in A
mer
ica
Wo
rld
1,39
1,48
1
53
2,80
5
383,
753
73
4,28
9
18,1
94
IT
TO
Pro
d.13
2,86
7
(1
0)24
,702
(5
)23
,966
(6
)35
,234
(5
)3,
267
(18)
ITT
O C
on.
995,
202
(72)
430,
030
(81)
326,
866
(85)
670,
937
(91)
13,5
73
(75)
ITT
O p
rod
uce
rsW
orl
d5,
799,
449
2,15
6,97
2
1,
124,
497
1,51
9,66
3
50
5,66
3
ITT
O P
rod.
302,
754
(5)
53,0
57
(2)
49,1
83
(4)
50,3
97
(3)
22,8
39
(5)
ITT
O C
on.
4,55
2,05
6
(78)
1,90
1,84
3
(88)
951,
971
(85)
1,37
1,91
0
(90)
414,
834
(82)
* M
irror
sta
tistic
s fr
om p
artn
er c
ount
ries
used
for
Vie
t Nam
.
Tab
le 5
-8. T
ypes
of
SP
WP
Exp
ort
ed b
y M
ajo
r T
rop
ical
Exp
ort
ers,
200
8 [1
000
US
$; (
% s
har
e)]+
Exp
ort
erT
o
+ In
done
sia
and
Mal
aysi
a (t
he la
rges
t tro
pica
l exp
orte
rs)
are
incl
uded
with
the
grou
p of
maj
or g
loba
l exp
orte
rs in
Tab
le 5
.6
Can
e an
d B
amb
oo
and
Par
tsW
oo
dw
ork
SP
WP
Fu
rnit
ure
an
d P
arts
Wo
od
en F
urn
itu
reB
uild
er's
Oth
erM
ou
ldin
gs
194
195
APPENDIX 6
UNECE Timber Committee Statement on Forest Products Markets in 2009 and Prospects for 2010

196
197
UNECE Timber Committee Statement on Forest Products Marketsin 2009 and 2010
The UNECE Timber Committee adopted the entire official text below on 16 October 2009. The Committee reviewed developments in forest products markets as reported in the Forest Products Annual Market Review, 2008-2009, as well as experts’ presentations, country market statements and forecasts. The theme of the discussions was “The UNECE regions’ forest products markets in a global economic crisis.”
I. Overview of forest products mar-kets in 2009 and 2010 The forest sector in the UNECE region suffered the greatest decline in consumption since the oil crisis in the 1970s, dropping 8.5% overall from 2007 to 2008. The housing crash in the United States, which spread to other countries, was the main cause for the downturn, as housing starts fell from over 2 million in 2005 to possibly below one-half million in 2009. Without this main driver for wood products, all forest products markets fell in 2008, and were forecast to fall again in 2009, with one major exception: wood energy which was buoyed by Governments’ policies for renewable energy sources for a green economy. Profitability in 2008 and 2009 was low, or absent, and prices for most products fell with demand.
The Timber Committee forecast an upturn in most wood products market sectors in 2010. However, it is far too early to speak about a recovery. Even when market strength returns, the production capacity will not be immediately available since many plants have shut down, with disastrous effects on their labour force.
Policies.affecting.forest.products.marketsPolicy developments encompass responses to the economic and financial crisis, to mitigate climate change and to assure the legality of timber imports. The US Government has attempted to spur the housing market by various measures, including a first-time homebuyer tax credit. The economic crisis had a negative impact on the R&D capacity of industry, and the funding of university research, important for continued innovation and competitiveness of wood and paper products.
In responding to climate change, EU legislation is most ambitious, with policies to reduce, by 2020, the percentage of greenhouse gas emissions by 20%, to increase the share of renewable energy to 20% and increase energy efficiency by 20%. There have been significant investments throughout the EU in biorefineries and biofuels usage. A carbon tax in Sweden gives incentives for the mobilization of wood as a renewable energy source. In the US the states have been active in addressing climate change. At the federal level, climate change legislation is being debated in the
Congress and the Environmental Protection Agency is considering regulating greenhouse gases. The controversies surrounding biofuels are likely to lead to future changes in policies.
Sustainable.and.legal.wood.tradeThe US government decided in 2008 to prohibit the trade of illegally sourced wood under the Lacey Act Amendment. An EU proposal for a Due Diligence Regulation requires the first operators who place products on the EU markets to have systems that minimize the risk of trading illegally sourced wood and wood products. This regulation is expected to be adopted by the end of 2010. Both of these measures have serious implications for the trade of wood and paper products, and companies, trade associations and countries are attempting to conform to the new requirements. For example, the Swiss parliament has adopted a motion based on the obligation of declaring the origin and species of wood and displaying this information to consumers. Legislation to prevent the trade of illegal wood also raises issues of technical barriers to trade. Many questions remain regarding: the efficiency of such systems; the responsibility of operators; the burden of the proof of legality or illegality; the costs for compliance, especially for small operators; and role of public procurement. An international exchange of information would help countries implement effective policies to combat illegal logging. The animated discussions led the Committee to call for a multi-stakeholder workshop in 2010 dedicated to tariff and non-tariff trade barriers and emerging trade regulations on timber.
Certified.forest.productsCertified forest area is still increasing, but at a slower pace, and has reached about 320 million hectares worldwide in mid-2009. It is concentrated mostly in North America and Europe and this equates to 97% of the certified roundwood supply. Certificated forest area potential exists in Russia, where currently only 20 million hectares are certified. Chain-of-custody certificates increased sharply, by 41% in the last year, indicating strong market activity for certified forest products. According to a recent study, obstacles to market development for certified wood products are the fragmentation in trade and consuming sectors, as well as consumers’ lack of awareness and willingness to pay premiums. The economic recession has widened the gap between “green operators” and others who might avoid the costs of good practices and certification. It has also driven some purchasers towards the less-expensive, legally verified products. The future progress of certification schemes will depend on their possible role in ensuring compliance with the new US and EU policies designed to combat illegal logging, as
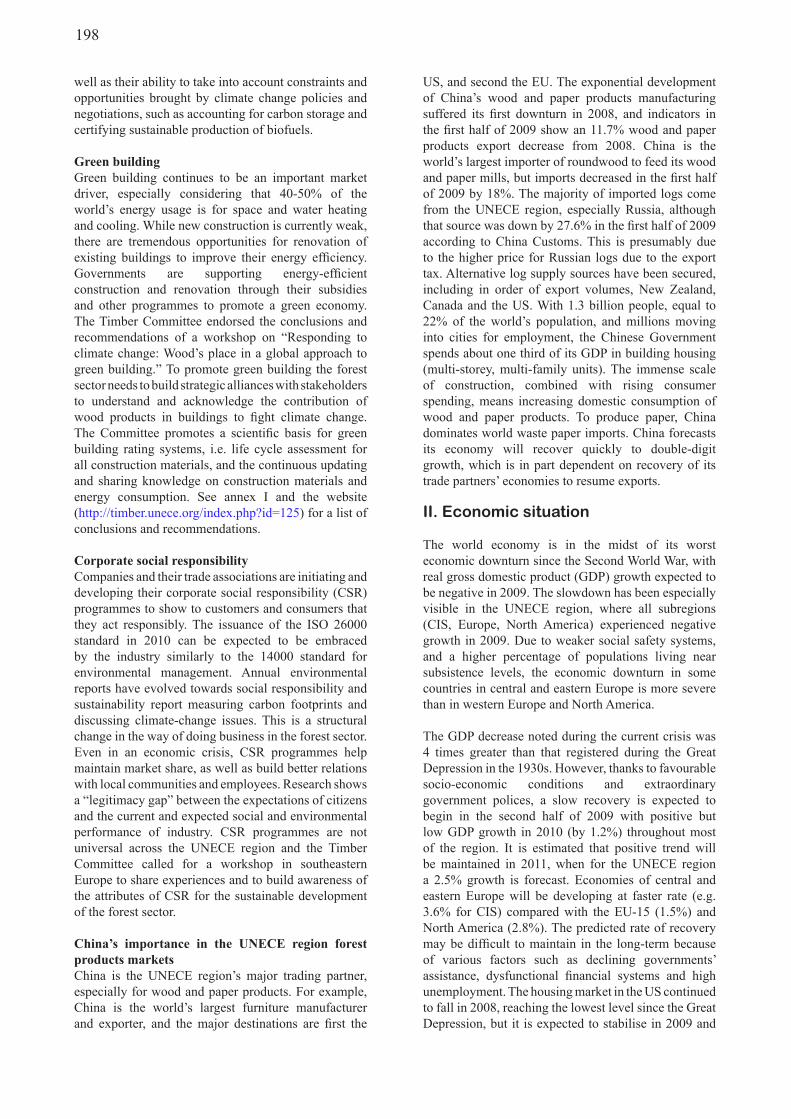
well as their ability to take into account constraints and opportunities brought by climate change policies and negotiations, such as accounting for carbon storage and certifying sustainable production of biofuels.
Green.buildingGreen building continues to be an important market driver, especially considering that 40-50% of the world’s energy usage is for space and water heating and cooling. While new construction is currently weak, there are tremendous opportunities for renovation of existing buildings to improve their energy efficiency. Governments are supporting energy-efficient construction and renovation through their subsidies and other programmes to promote a green economy. The Timber Committee endorsed the conclusions and recommendations of a workshop on “Responding to climate change: Wood’s place in a global approach to green building.” To promote green building the forest sector needs to build strategic alliances with stakeholders to understand and acknowledge the contribution of wood products in buildings to fight climate change. The Committee promotes a scientific basis for green building rating systems, i.e. life cycle assessment for all construction materials, and the continuous updating and sharing knowledge on construction materials and energy consumption. See annex I and the website (http://timber.unece.org/index.php?id=125) for a list of conclusions and recommendations.
Corporate.social.responsibilityCompanies and their trade associations are initiating and developing their corporate social responsibility (CSR) programmes to show to customers and consumers that they act responsibly. The issuance of the ISO 26000 standard in 2010 can be expected to be embraced by the industry similarly to the 14000 standard for environmental management. Annual environmental reports have evolved towards social responsibility and sustainability report measuring carbon footprints and discussing climate-change issues. This is a structural change in the way of doing business in the forest sector. Even in an economic crisis, CSR programmes help maintain market share, as well as build better relations with local communities and employees. Research shows a “legitimacy gap” between the expectations of citizens and the current and expected social and environmental performance of industry. CSR programmes are not universal across the UNECE region and the Timber Committee called for a workshop in southeastern Europe to share experiences and to build awareness of the attributes of CSR for the sustainable development of the forest sector.
China’s. importance. in. the. UNECE. region. forest.products.marketsChina is the UNECE region’s major trading partner, especially for wood and paper products. For example, China is the world’s largest furniture manufacturer and exporter, and the major destinations are first the
US, and second the EU. The exponential development of China’s wood and paper products manufacturing suffered its first downturn in 2008, and indicators in the first half of 2009 show an 11.7% wood and paper products export decrease from 2008. China is the world’s largest importer of roundwood to feed its wood and paper mills, but imports decreased in the first half of 2009 by 18%. The majority of imported logs come from the UNECE region, especially Russia, although that source was down by 27.6% in the first half of 2009 according to China Customs. This is presumably due to the higher price for Russian logs due to the export tax. Alternative log supply sources have been secured, including in order of export volumes, New Zealand, Canada and the US. With 1.3 billion people, equal to 22% of the world’s population, and millions moving into cities for employment, the Chinese Government spends about one third of its GDP in building housing (multi-storey, multi-family units). The immense scale of construction, combined with rising consumer spending, means increasing domestic consumption of wood and paper products. To produce paper, China dominates world waste paper imports. China forecasts its economy will recover quickly to double-digit growth, which is in part dependent on recovery of its trade partners’ economies to resume exports..
II. Economic situation
The world economy is in the midst of its worst economic downturn since the Second World War, with real gross domestic product (GDP) growth expected to be negative in 2009. The slowdown has been especially visible in the UNECE region, where all subregions (CIS, Europe, North America) experienced negative growth in 2009. Due to weaker social safety systems, and a higher percentage of populations living near subsistence levels, the economic downturn in some countries in central and eastern Europe is more severe than in western Europe and North America.
The GDP decrease noted during the current crisis was 4 times greater than that registered during the Great Depression in the 1930s. However, thanks to favourable socio-economic conditions and extraordinary government polices, a slow recovery is expected to begin in the second half of 2009 with positive but low GDP growth in 2010 (by 1.2%) throughout most of the region. It is estimated that positive trend will be maintained in 2011, when for the UNECE region a 2.5% growth is forecast. Economies of central and eastern Europe will be developing at faster rate (e.g. 3.6% for CIS) compared with the EU-15 (1.5%) and North America (2.8%). The predicted rate of recovery may be difficult to maintain in the long-term because of various factors such as declining governments’ assistance, dysfunctional financial systems and high unemployment. The housing market in the US continued to fall in 2008, reaching the lowest level since the Great Depression, but it is expected to stabilise in 2009 and
198
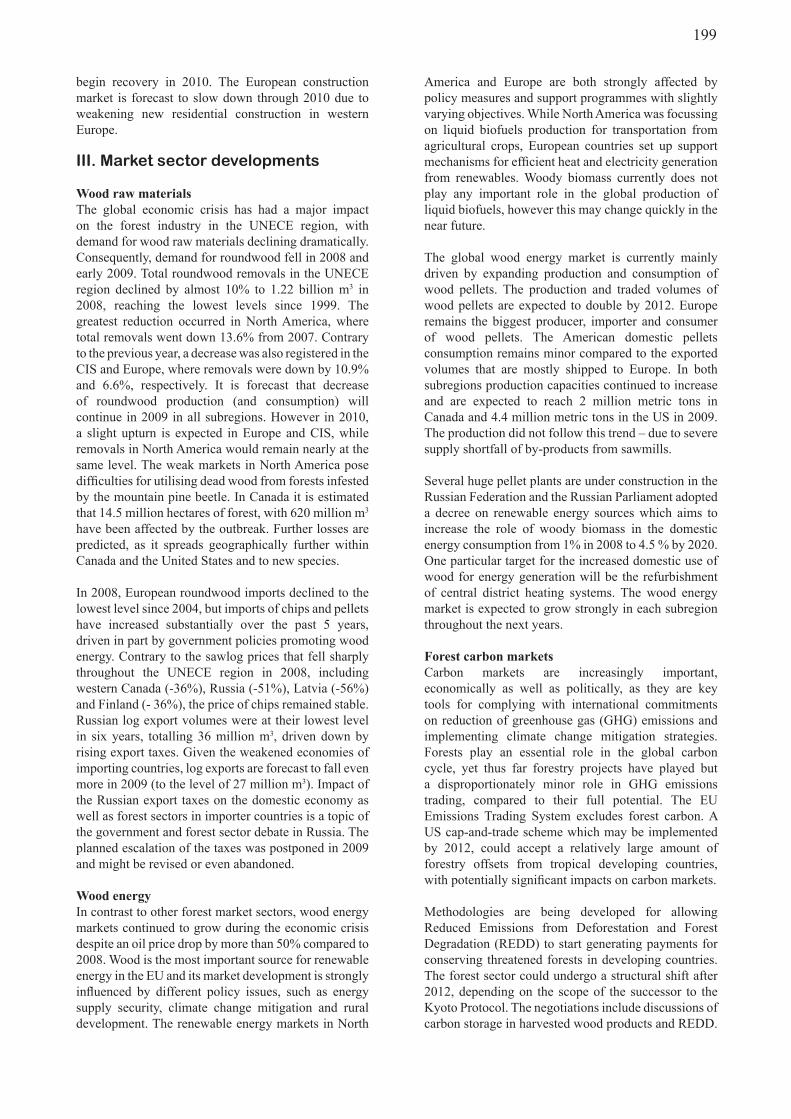
begin recovery in 2010. The European construction market is forecast to slow down through 2010 due to weakening new residential construction in western Europe.
III. Market sector developments
Wood.raw.materialsThe global economic crisis has had a major impact on the forest industry in the UNECE region, with demand for wood raw materials declining dramatically. Consequently, demand for roundwood fell in 2008 and early 2009. Total roundwood removals in the UNECE region declined by almost 10% to 1.22 billion m3 in 2008, reaching the lowest levels since 1999. The greatest reduction occurred in North America, where total removals went down 13.6% from 2007. Contrary to the previous year, a decrease was also registered in the CIS and Europe, where removals were down by 10.9% and 6.6%, respectively. It is forecast that decrease of roundwood production (and consumption) will continue in 2009 in all subregions. However in 2010, a slight upturn is expected in Europe and CIS, while removals in North America would remain nearly at the same level. The weak markets in North America pose difficulties for utilising dead wood from forests infested by the mountain pine beetle. In Canada it is estimated that 14.5 million hectares of forest, with 620 million m3 have been affected by the outbreak. Further losses are predicted, as it spreads geographically further within Canada and the United States and to new species.
In 2008, European roundwood imports declined to the lowest level since 2004, but imports of chips and pellets have increased substantially over the past 5 years, driven in part by government policies promoting wood energy. Contrary to the sawlog prices that fell sharply throughout the UNECE region in 2008, including western Canada (-36%), Russia (-51%), Latvia (-56%) and Finland (- 36%), the price of chips remained stable. Russian log export volumes were at their lowest level in six years, totalling 36 million m3, driven down by rising export taxes. Given the weakened economies of importing countries, log exports are forecast to fall even more in 2009 (to the level of 27 million m3). Impact of the Russian export taxes on the domestic economy as well as forest sectors in importer countries is a topic of the government and forest sector debate in Russia. The planned escalation of the taxes was postponed in 2009 and might be revised or even abandoned. Wood.energyIn contrast to other forest market sectors, wood energy markets continued to grow during the economic crisis despite an oil price drop by more than 50% compared to 2008. Wood is the most important source for renewable energy in the EU and its market development is strongly influenced by different policy issues, such as energy supply security, climate change mitigation and rural development. The renewable energy markets in North
America and Europe are both strongly affected by policy measures and support programmes with slightly varying objectives. While North America was focussing on liquid biofuels production for transportation from agricultural crops, European countries set up support mechanisms for efficient heat and electricity generation from renewables. Woody biomass currently does not play any important role in the global production of liquid biofuels, however this may change quickly in the near future.
The global wood energy market is currently mainly driven by expanding production and consumption of wood pellets. The production and traded volumes of wood pellets are expected to double by 2012. Europe remains the biggest producer, importer and consumer of wood pellets. The American domestic pellets consumption remains minor compared to the exported volumes that are mostly shipped to Europe. In both subregions production capacities continued to increase and are expected to reach 2 million metric tons in Canada and 4.4 million metric tons in the US in 2009. The production did not follow this trend – due to severe supply shortfall of by-products from sawmills.
Several huge pellet plants are under construction in the Russian Federation and the Russian Parliament adopted a decree on renewable energy sources which aims to increase the role of woody biomass in the domestic energy consumption from 1% in 2008 to 4.5 % by 2020. One particular target for the increased domestic use of wood for energy generation will be the refurbishment of central district heating systems. The wood energy market is expected to grow strongly in each subregion throughout the next years.
Forest.carbon.marketsCarbon markets are increasingly important, economically as well as politically, as they are key tools for complying with international commitments on reduction of greenhouse gas (GHG) emissions and implementing climate change mitigation strategies. Forests play an essential role in the global carbon cycle, yet thus far forestry projects have played but a disproportionately minor role in GHG emissions trading, compared to their full potential. The EU Emissions Trading System excludes forest carbon. A US cap-and-trade scheme which may be implemented by 2012, could accept a relatively large amount of forestry offsets from tropical developing countries, with potentially significant impacts on carbon markets.
Methodologies are being developed for allowing Reduced Emissions from Deforestation and Forest Degradation (REDD) to start generating payments for conserving threatened forests in developing countries. The forest sector could undergo a structural shift after 2012, depending on the scope of the successor to the Kyoto Protocol. The negotiations include discussions of carbon storage in harvested wood products and REDD.
199
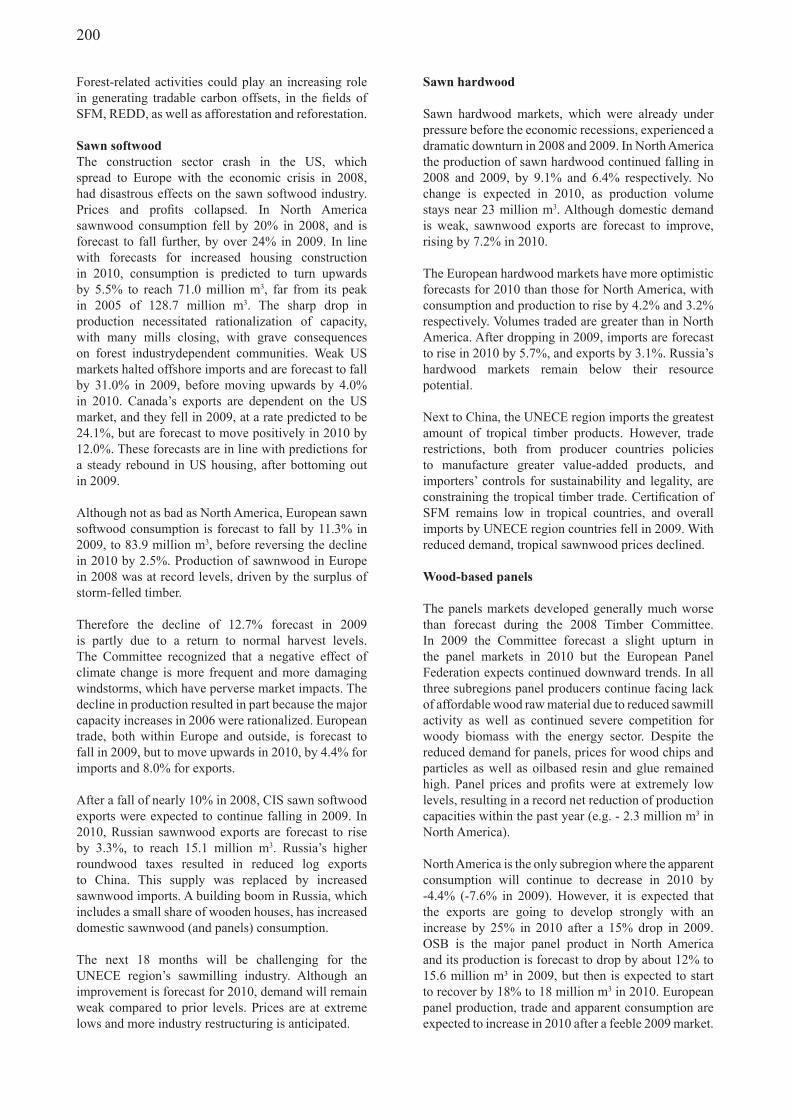
Forest-related activities could play an increasing role in generating tradable carbon offsets, in the fields of SFM, REDD, as well as afforestation and reforestation.
Sawn.softwoodThe construction sector crash in the US, which spread to Europe with the economic crisis in 2008, had disastrous effects on the sawn softwood industry. Prices and profits collapsed. In North America sawnwood consumption fell by 20% in 2008, and is forecast to fall further, by over 24% in 2009. In line with forecasts for increased housing construction in 2010, consumption is predicted to turn upwards by 5.5% to reach 71.0 million m3, far from its peak in 2005 of 128.7 million m3. The sharp drop in production necessitated rationalization of capacity, with many mills closing, with grave consequences on forest industrydependent communities. Weak US markets halted offshore imports and are forecast to fall by 31.0% in 2009, before moving upwards by 4.0% in 2010. Canada’s exports are dependent on the US market, and they fell in 2009, at a rate predicted to be 24.1%, but are forecast to move positively in 2010 by 12.0%. These forecasts are in line with predictions for a steady rebound in US housing, after bottoming out in 2009.
Although not as bad as North America, European sawn softwood consumption is forecast to fall by 11.3% in 2009, to 83.9 million m3, before reversing the decline in 2010 by 2.5%. Production of sawnwood in Europe in 2008 was at record levels, driven by the surplus of storm-felled timber.
Therefore the decline of 12.7% forecast in 2009 is partly due to a return to normal harvest levels. The Committee recognized that a negative effect of climate change is more frequent and more damaging windstorms, which have perverse market impacts. The decline in production resulted in part because the major capacity increases in 2006 were rationalized. European trade, both within Europe and outside, is forecast to fall in 2009, but to move upwards in 2010, by 4.4% for imports and 8.0% for exports.
After a fall of nearly 10% in 2008, CIS sawn softwood exports were expected to continue falling in 2009. In 2010, Russian sawnwood exports are forecast to rise by 3.3%, to reach 15.1 million m3. Russia’s higher roundwood taxes resulted in reduced log exports to China. This supply was replaced by increased sawnwood imports. A building boom in Russia, which includes a small share of wooden houses, has increased domestic sawnwood (and panels) consumption.
The next 18 months will be challenging for the UNECE region’s sawmilling industry. Although an improvement is forecast for 2010, demand will remain weak compared to prior levels. Prices are at extreme lows and more industry restructuring is anticipated.
Sawn.hardwood
Sawn hardwood markets, which were already under pressure before the economic recessions, experienced a dramatic downturn in 2008 and 2009. In North America the production of sawn hardwood continued falling in 2008 and 2009, by 9.1% and 6.4% respectively. No change is expected in 2010, as production volume stays near 23 million m3. Although domestic demand is weak, sawnwood exports are forecast to improve, rising by 7.2% in 2010.
The European hardwood markets have more optimistic forecasts for 2010 than those for North America, with consumption and production to rise by 4.2% and 3.2% respectively. Volumes traded are greater than in North America. After dropping in 2009, imports are forecast to rise in 2010 by 5.7%, and exports by 3.1%. Russia’s hardwood markets remain below their resource potential.
Next to China, the UNECE region imports the greatest amount of tropical timber products. However, trade restrictions, both from producer countries policies to manufacture greater value-added products, and importers’ controls for sustainability and legality, are constraining the tropical timber trade. Certification of SFM remains low in tropical countries, and overall imports by UNECE region countries fell in 2009. With reduced demand, tropical sawnwood prices declined.
Wood-based.panels
The panels markets developed generally much worse than forecast during the 2008 Timber Committee. In 2009 the Committee forecast a slight upturn in the panel markets in 2010 but the European Panel Federation expects continued downward trends. In all three subregions panel producers continue facing lack of affordable wood raw material due to reduced sawmill activity as well as continued severe competition for woody biomass with the energy sector. Despite the reduced demand for panels, prices for wood chips and particles as well as oilbased resin and glue remained high. Panel prices and profits were at extremely low levels, resulting in a record net reduction of production capacities within the past year (e.g. - 2.3 million m3 in North America).
North America is the only subregion where the apparent consumption will continue to decrease in 2010 by -4.4% (-7.6% in 2009). However, it is expected that the exports are going to develop strongly with an increase by 25% in 2010 after a 15% drop in 2009. OSB is the major panel product in North America and its production is forecast to drop by about 12% to 15.6 million m³ in 2009, but then is expected to start to recover by 18% to 18 million m3 in 2010. European panel production, trade and apparent consumption are expected to increase in 2010 after a feeble 2009 market.
200
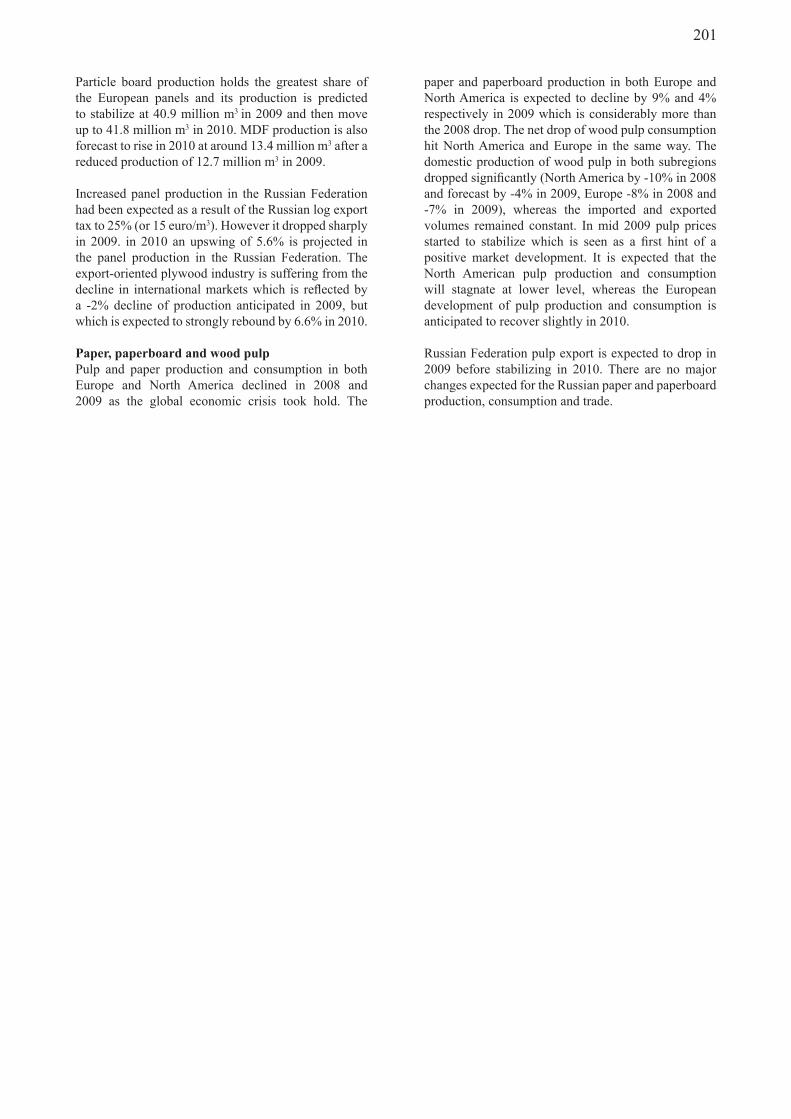
Particle board production holds the greatest share of the European panels and its production is predicted to stabilize at 40.9 million m3 in 2009 and then move up to 41.8 million m3 in 2010. MDF production is also forecast to rise in 2010 at around 13.4 million m3 after a reduced production of 12.7 million m3 in 2009.
Increased panel production in the Russian Federation had been expected as a result of the Russian log export tax to 25% (or 15 euro/m3). However it dropped sharply in 2009. in 2010 an upswing of 5.6% is projected in the panel production in the Russian Federation. The export-oriented plywood industry is suffering from the decline in international markets which is reflected by a -2% decline of production anticipated in 2009, but which is expected to strongly rebound by 6.6% in 2010.
Paper,.paperboard.and.wood.pulp.Pulp and paper production and consumption in both Europe and North America declined in 2008 and 2009 as the global economic crisis took hold. The
paper and paperboard production in both Europe and North America is expected to decline by 9% and 4% respectively in 2009 which is considerably more than the 2008 drop. The net drop of wood pulp consumption hit North America and Europe in the same way. The domestic production of wood pulp in both subregions dropped significantly (North America by -10% in 2008 and forecast by -4% in 2009, Europe -8% in 2008 and -7% in 2009), whereas the imported and exported volumes remained constant. In mid 2009 pulp prices started to stabilize which is seen as a first hint of a positive market development. It is expected that the North American pulp production and consumption will stagnate at lower level, whereas the European development of pulp production and consumption is anticipated to recover slightly in 2010.
Russian Federation pulp export is expected to drop in 2009 before stabilizing in 2010. There are no major changes expected for the Russian paper and paperboard production, consumption and trade.
201

202