Embed Size (px)
Citation preview
International Trade Through North Carolina Gateways
This includes both airports and port movements
What is a Gateway
• Flows through an airport or port• Can include cargo from other regional
markets as well as from State markets• Slides Include
– Total Flows– Top Destinations (exports)/Sources (imports) 2010– Top 5 Destinations 2003-2010– Top Commodities 2010– Top 5 Commodities 2003-2010
• Order – Total Trade, Exports, Imports
Colors
• Trade Partner information is in blue• Commodity Information is in brown• Domestic Source for exports are in red
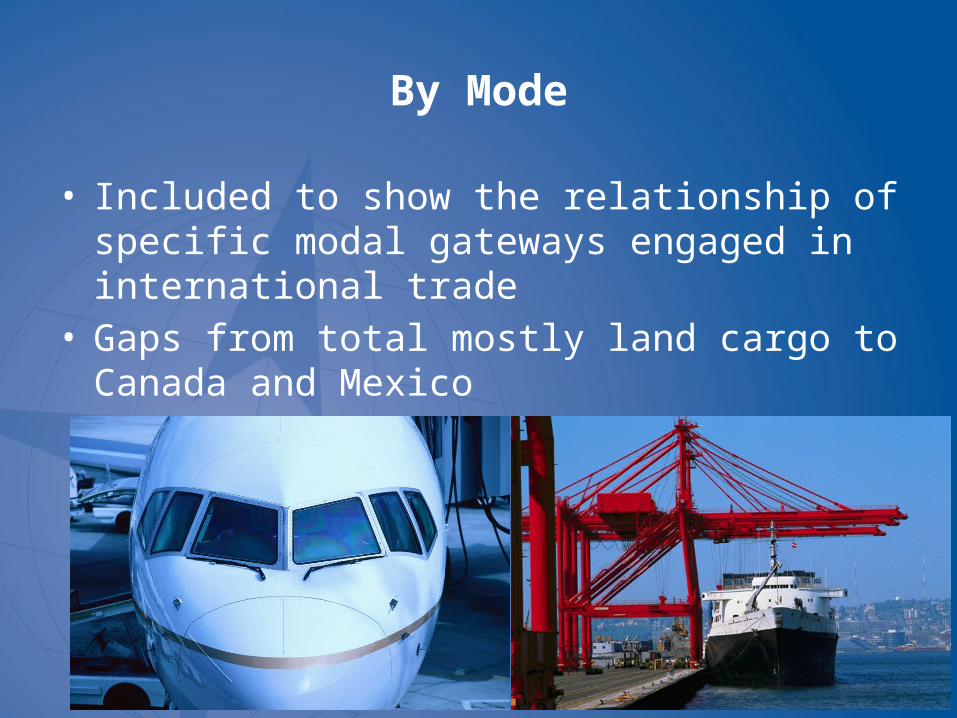
By Mode
• Included to show the relationship of specific modal gateways engaged in international trade
• Gaps from total mostly land cargo to Canada and Mexico
More Information
• Prepared by ITTS for anyone to use to discuss state based trade
• Source: Wisertrade data complied and assembled by ITTS
• For more information, visit• Ittsresearch.org
Total Trade Through North Carolina Gateways
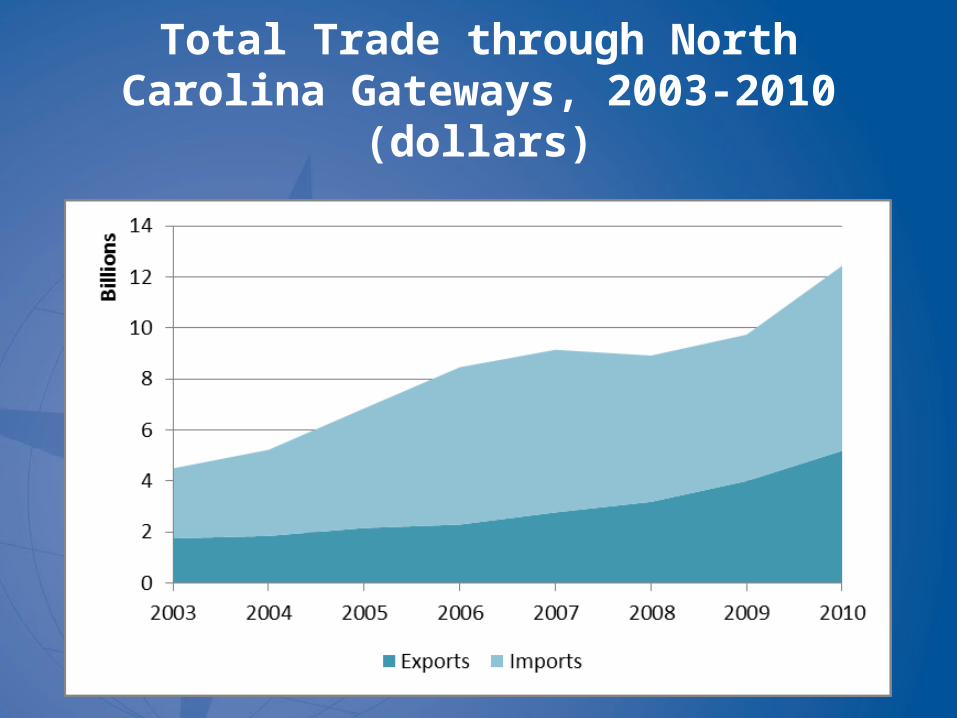
Total Trade through North Carolina Gateways, 2003-2010 (dollars)
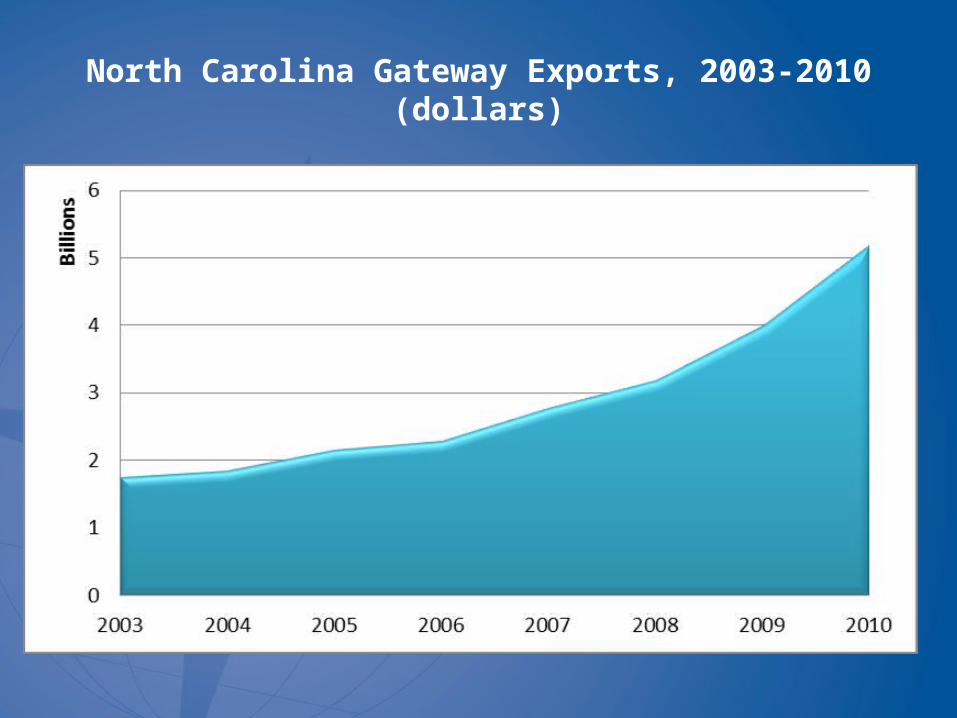
North Carolina Gateway Exports, 2003-2010 (dollars)
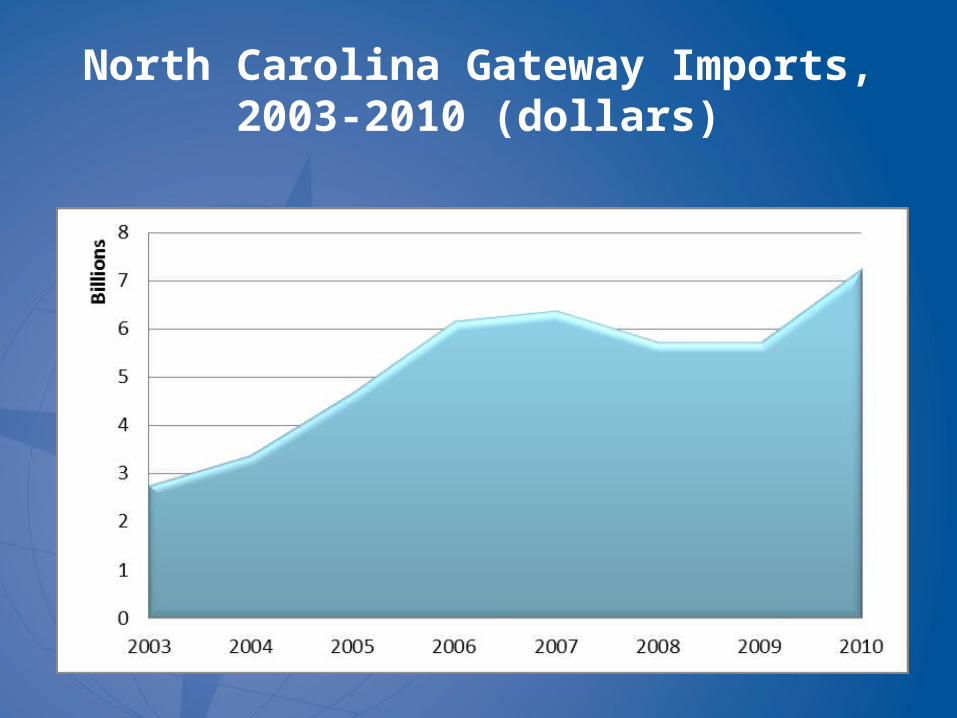
North Carolina Gateway Imports, 2003-2010 (dollars)

Top Trading Partners for the State’s Gateways
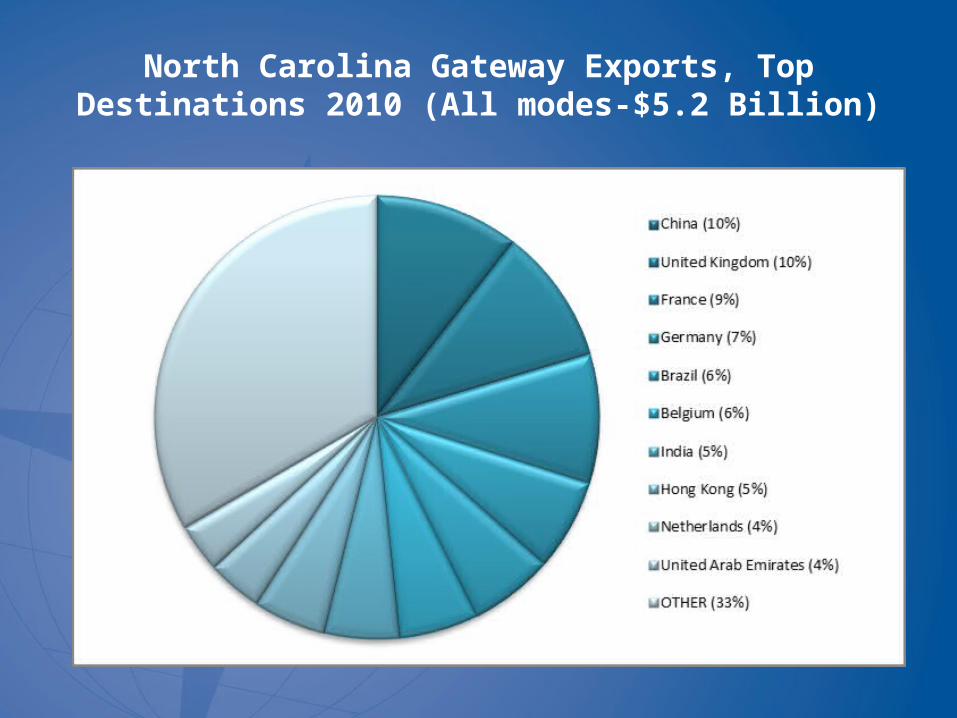
North Carolina Gateway Exports, Top Destinations 2010 (All modes-$5.2 Billion)
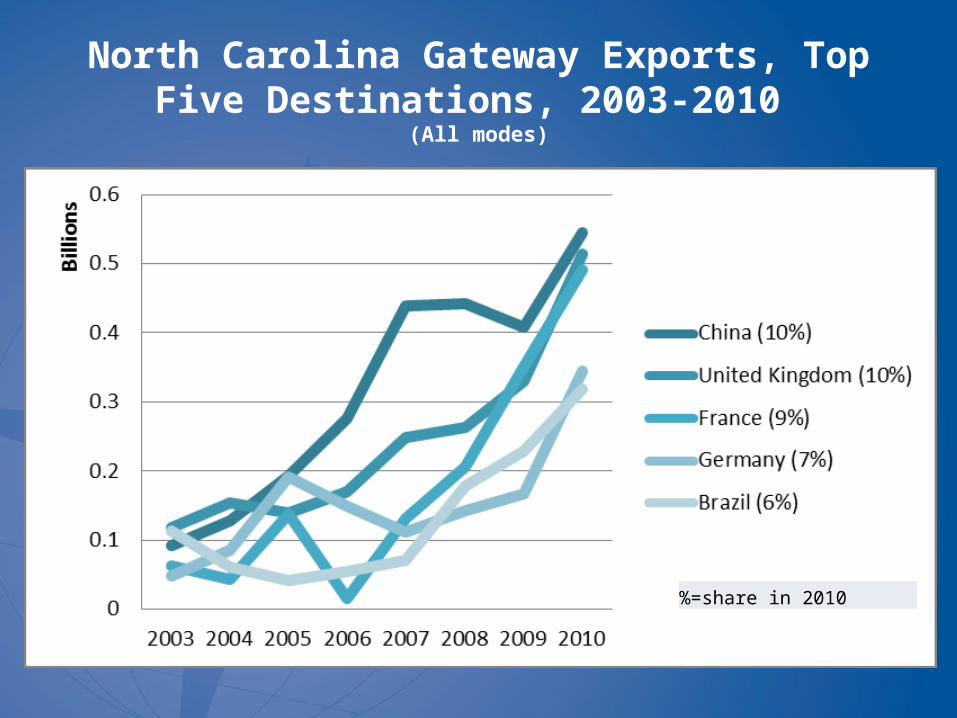
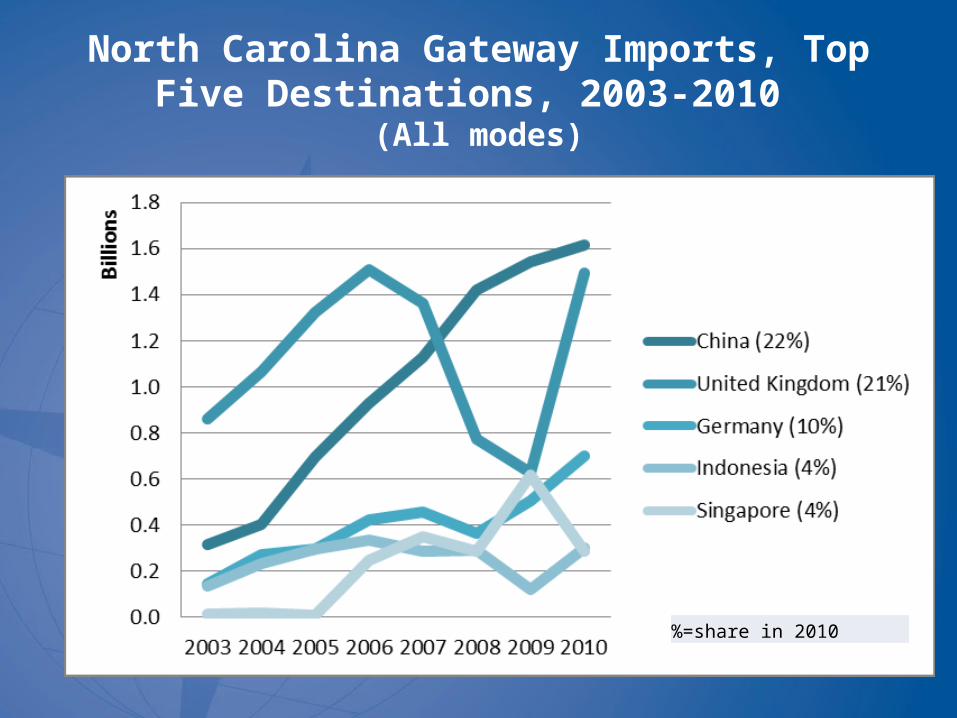
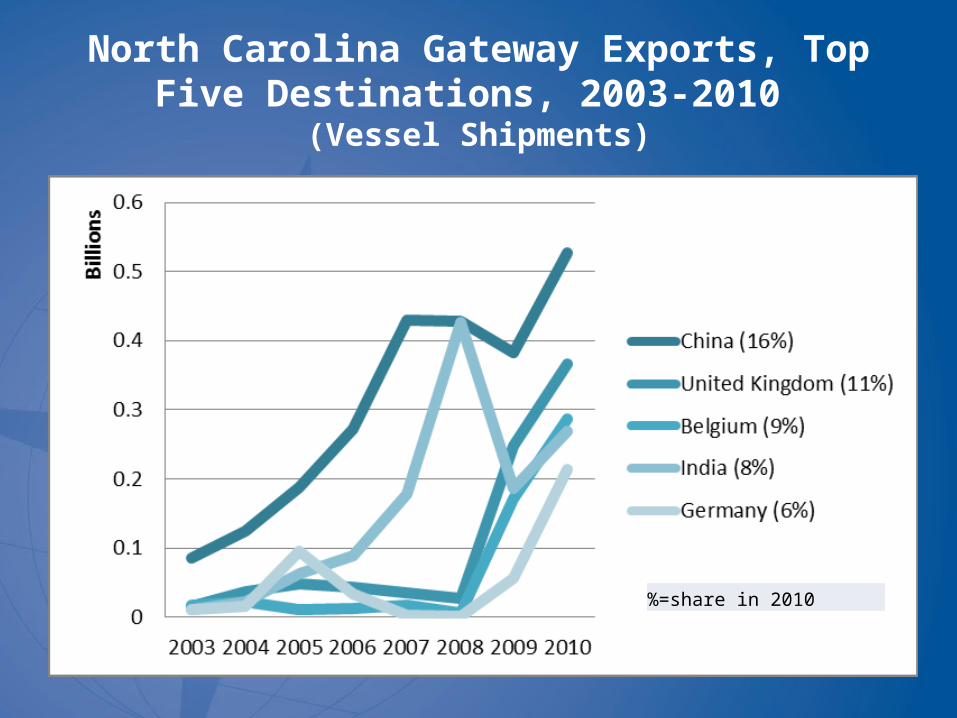
North Carolina Gateway Exports, Top Five Destinations, 2003-2010
(All modes)
%=share in 2010
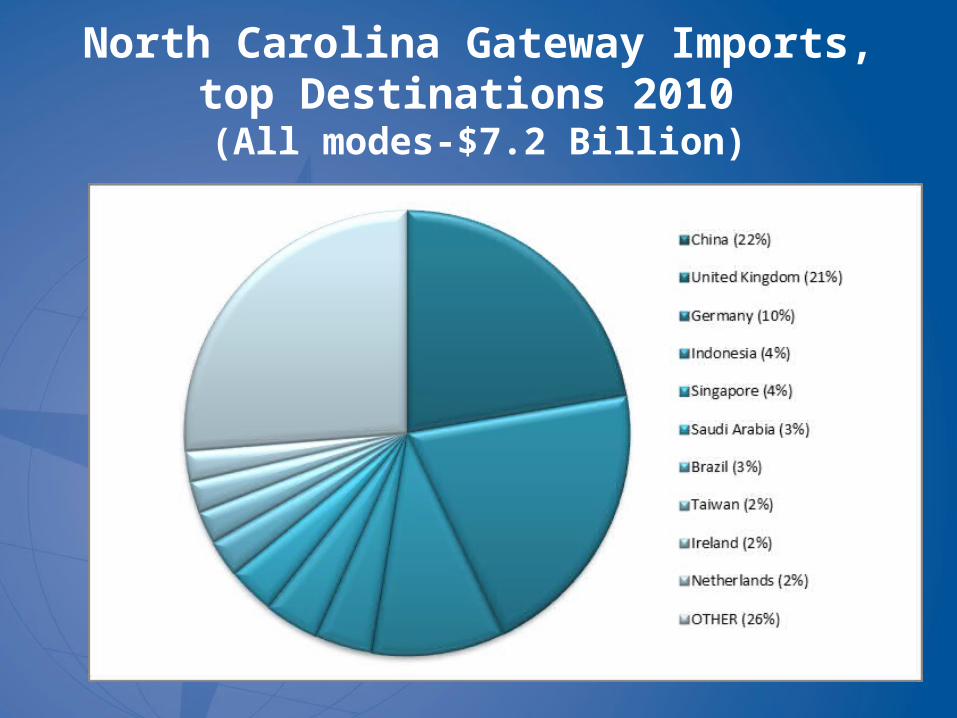
North Carolina Gateway Imports, top Destinations 2010
(All modes-$7.2 Billion)
North Carolina Gateway Imports, Top Five Destinations, 2003-2010
(All modes)
%=share in 2010

Modal Split
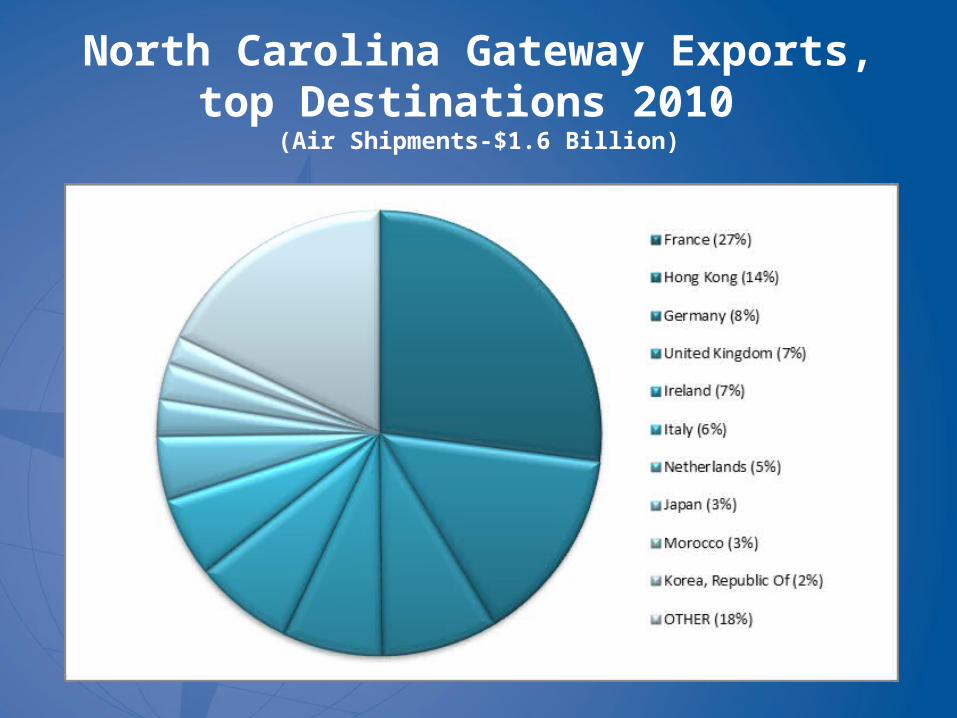
North Carolina Gateway Exports, top Destinations 2010
(Air Shipments-$1.6 Billion)
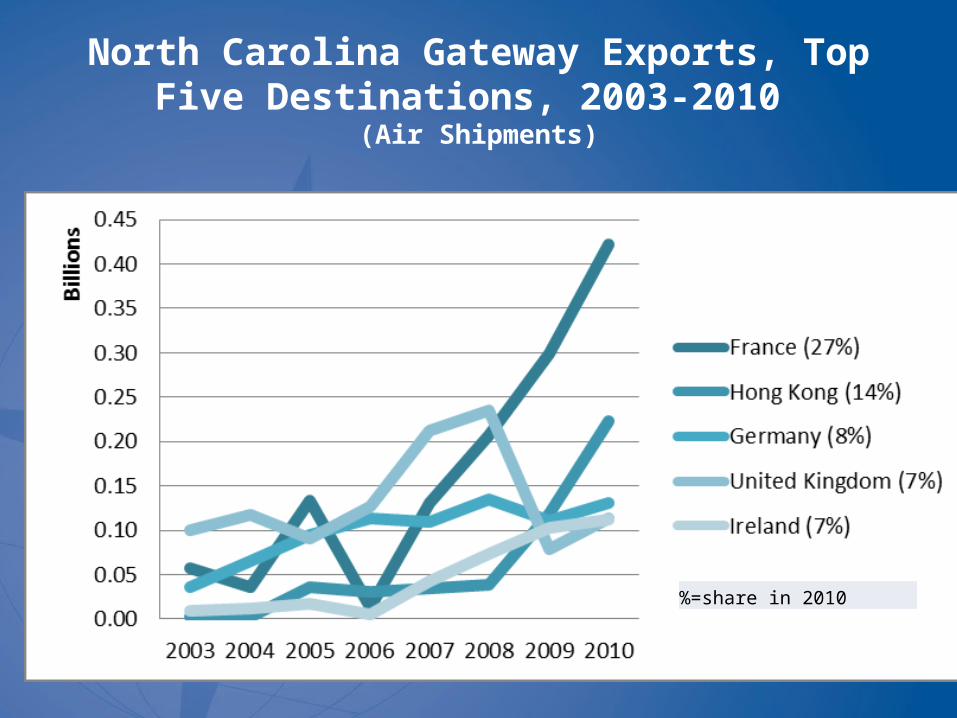
North Carolina Gateway Exports, Top Five Destinations, 2003-2010
(Air Shipments)
%=share in 2010
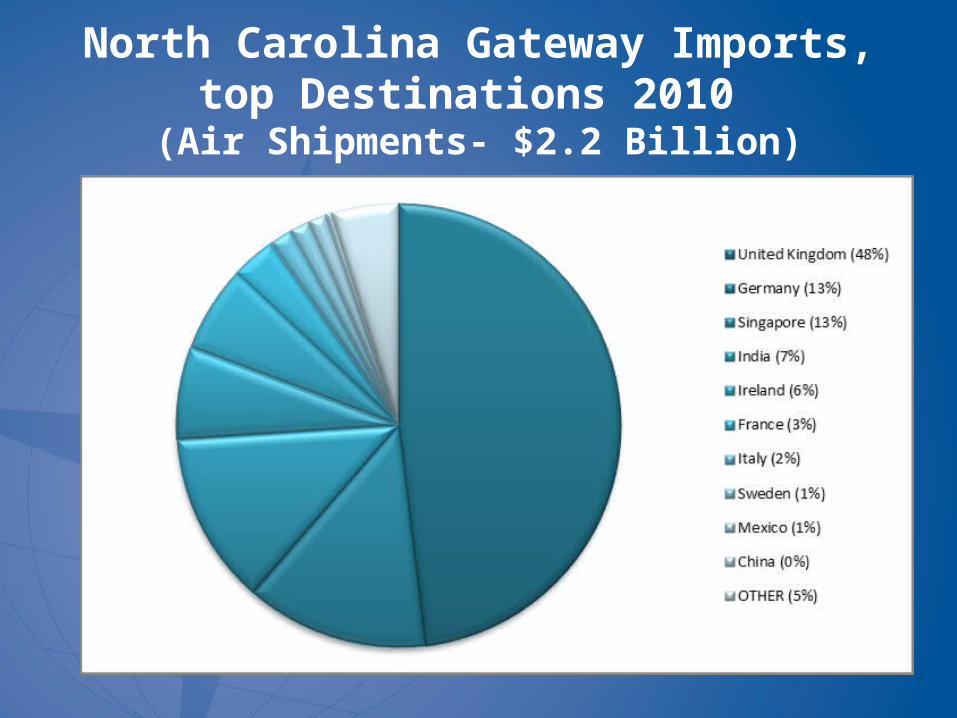
North Carolina Gateway Imports, top Destinations 2010
(Air Shipments- $2.2 Billion)
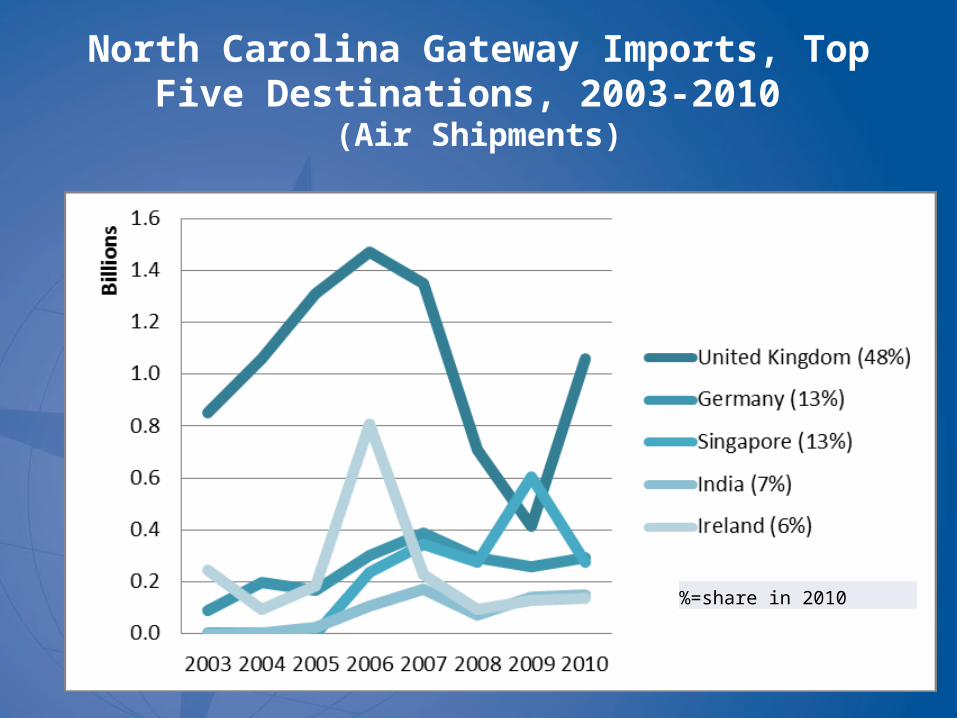
North Carolina Gateway Imports, Top Five Destinations, 2003-2010
(Air Shipments)
%=share in 2010
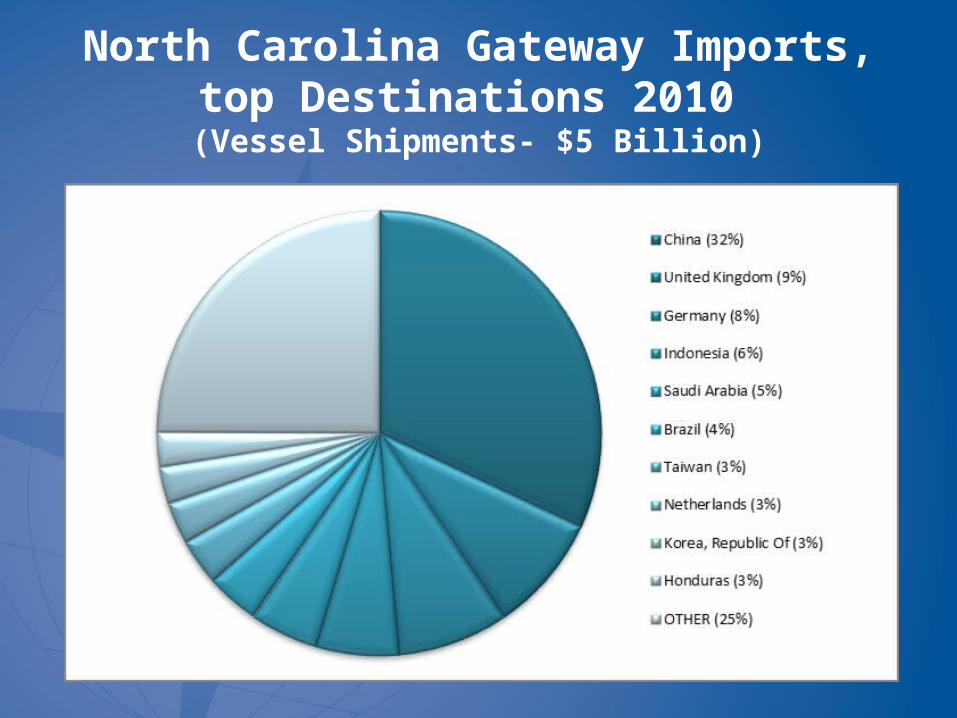
North Carolina Gateway Imports, top Destinations 2010 (Vessel Shipments- $5 Billion)
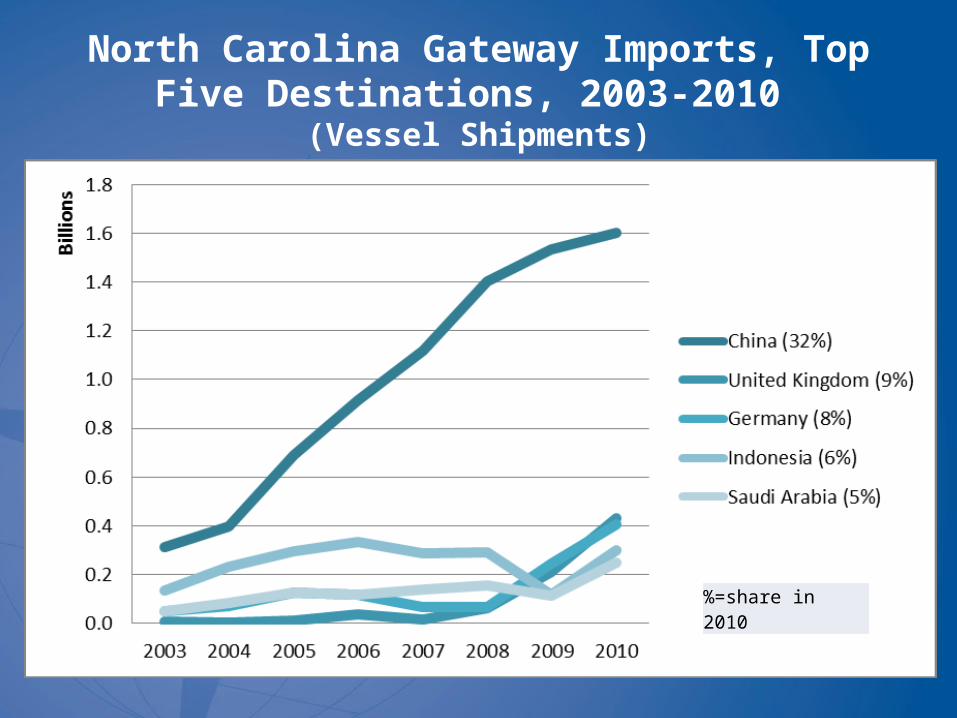
North Carolina Gateway Imports, Top Five Destinations, 2003-2010
(Vessel Shipments)
%=share in 2010
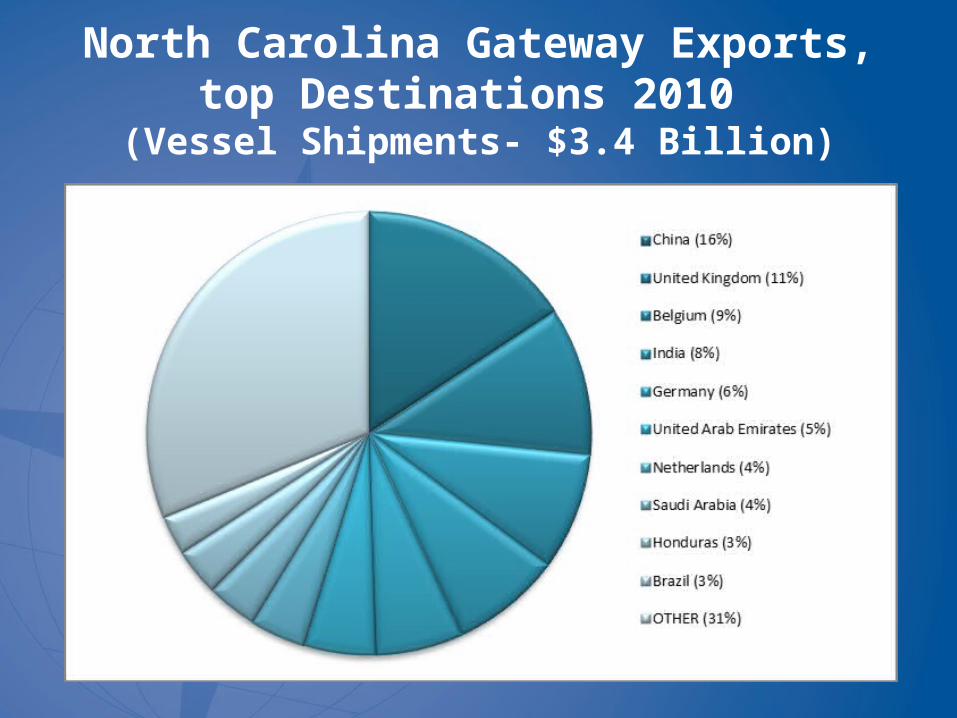
North Carolina Gateway Exports, top Destinations 2010
(Vessel Shipments- $3.4 Billion)
North Carolina Gateway Exports, Top Five Destinations, 2003-2010
(Vessel Shipments)
%=share in 2010

Top Commodities Traded Through the State’s Gateways
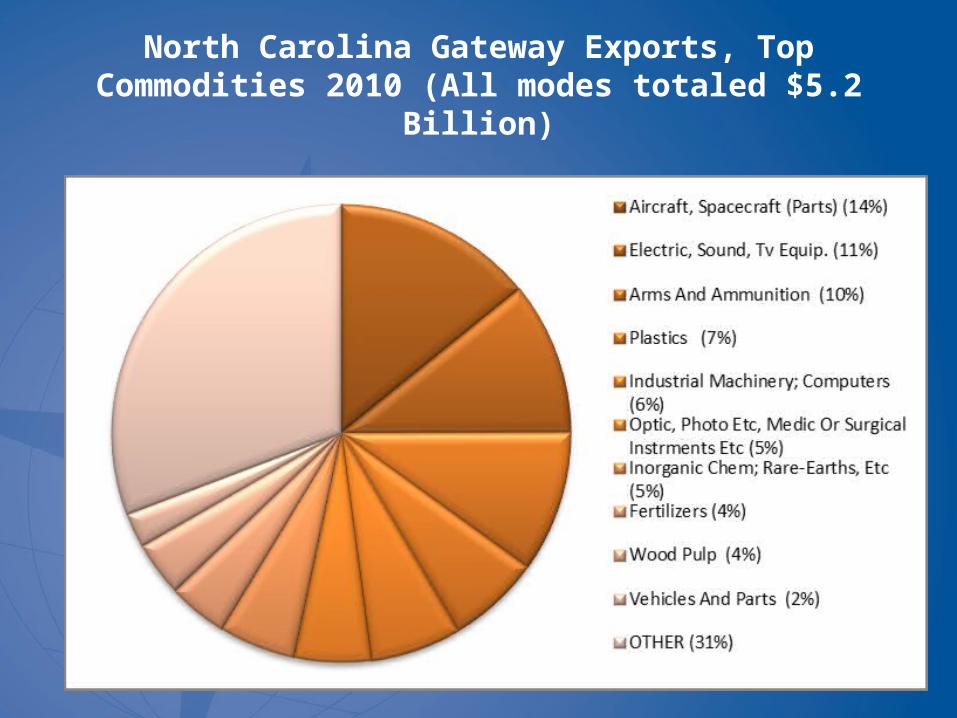
North Carolina Gateway Exports, Top Commodities 2010 (All modes totaled $5.2
Billion)
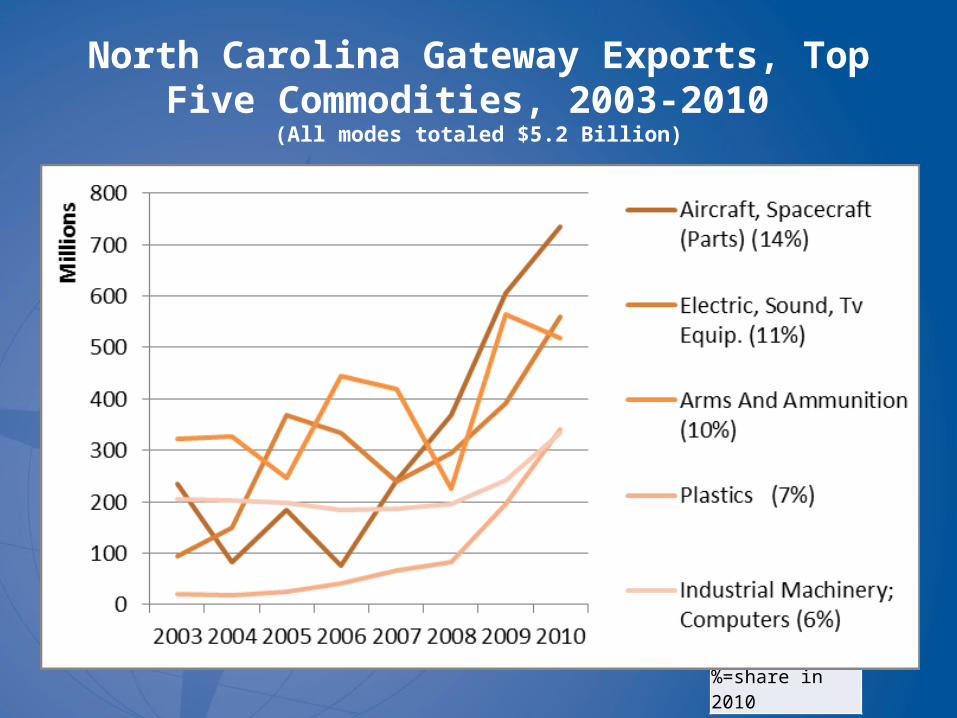
North Carolina Gateway Exports, Top Five Commodities, 2003-2010
(All modes totaled $5.2 Billion)
%=share in 2010
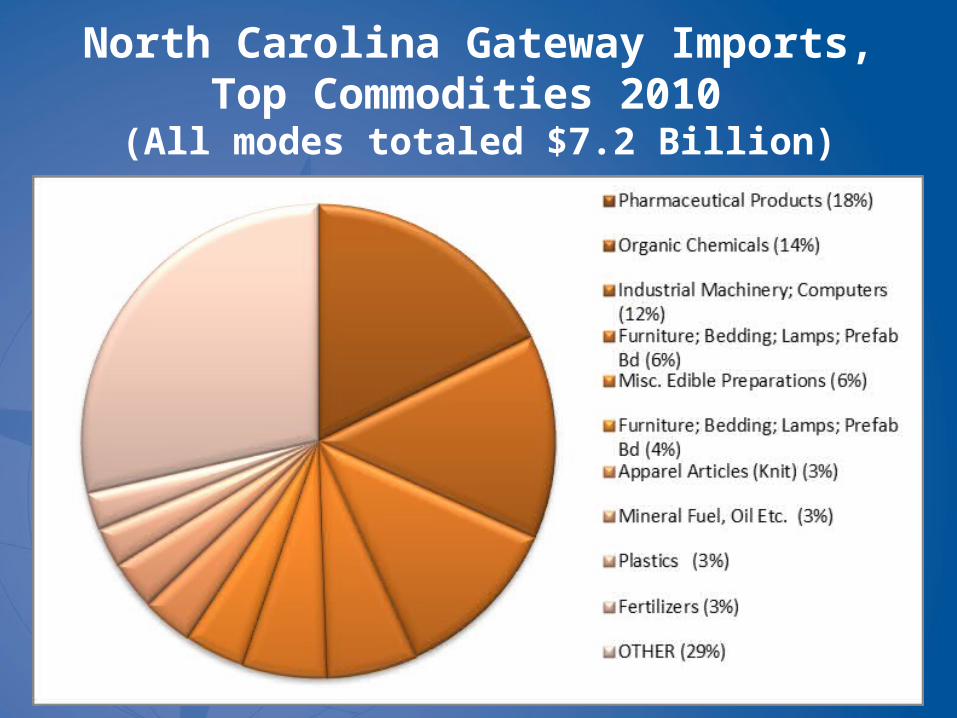
North Carolina Gateway Imports, Top Commodities 2010
(All modes totaled $7.2 Billion)
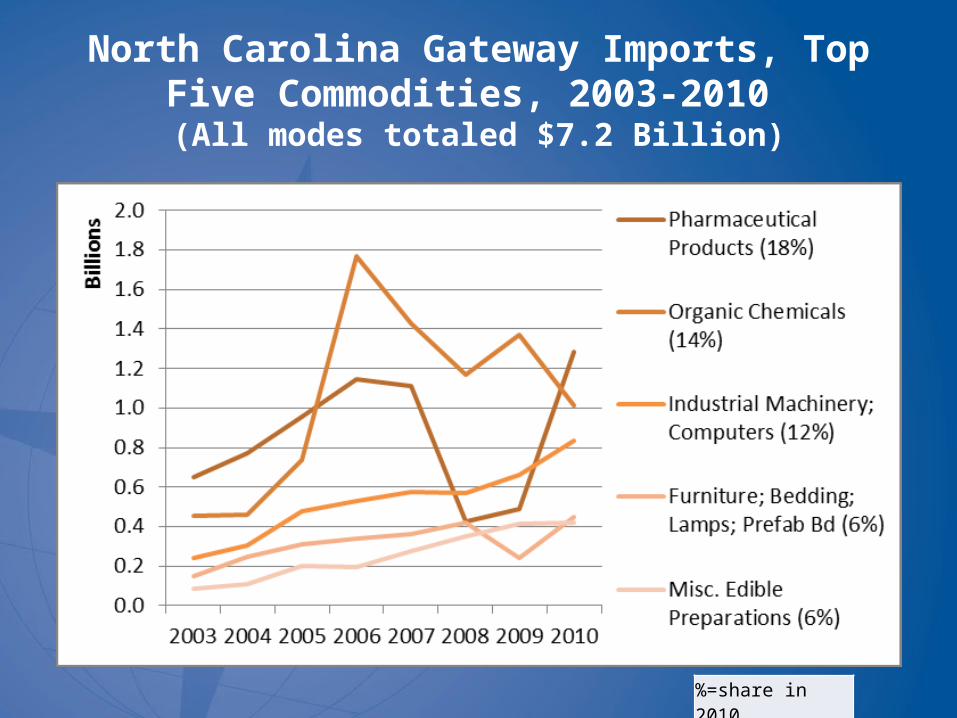
North Carolina Gateway Imports, Top Five Commodities, 2003-2010
(All modes totaled $7.2 Billion)
%=share in 2010

Modal Split
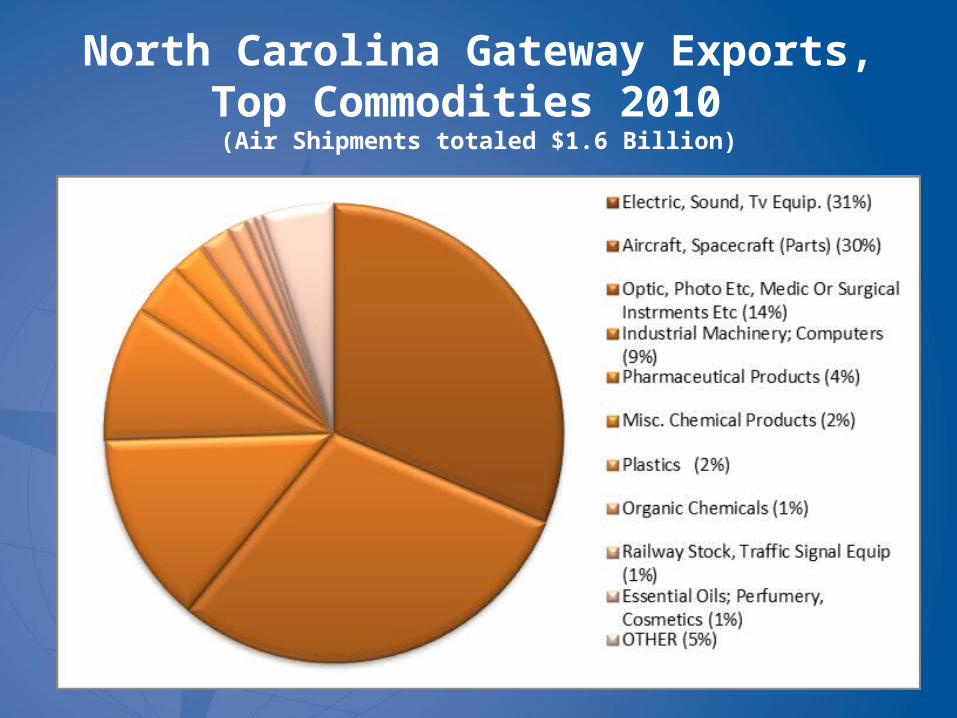
North Carolina Gateway Exports, Top Commodities 2010
(Air Shipments totaled $1.6 Billion)
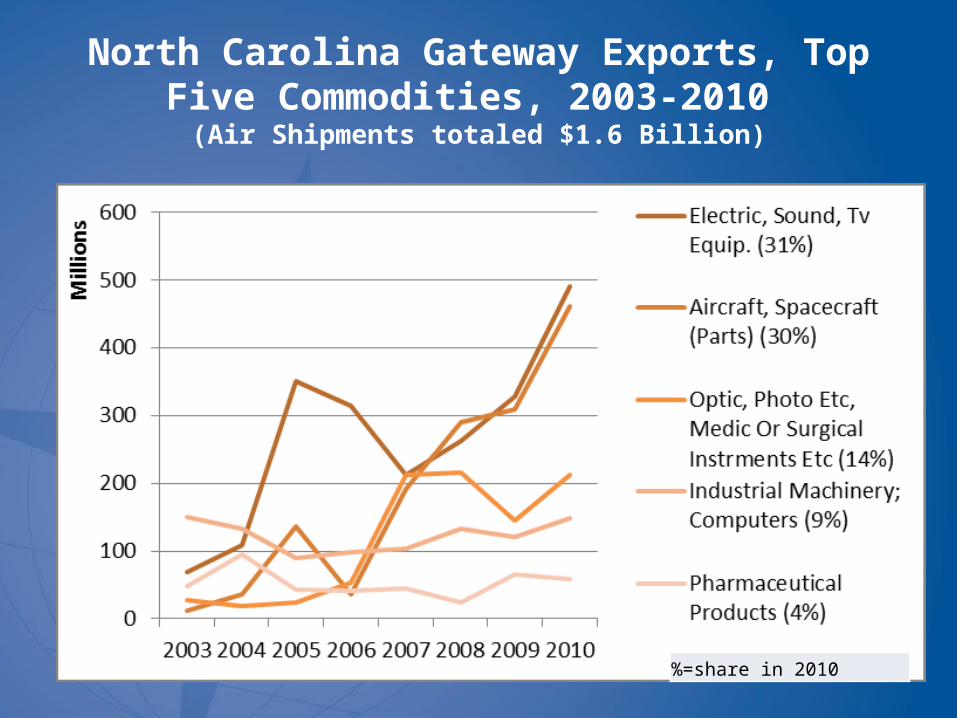
North Carolina Gateway Exports, Top Five Commodities, 2003-2010
(Air Shipments totaled $1.6 Billion)
%=share in 2010
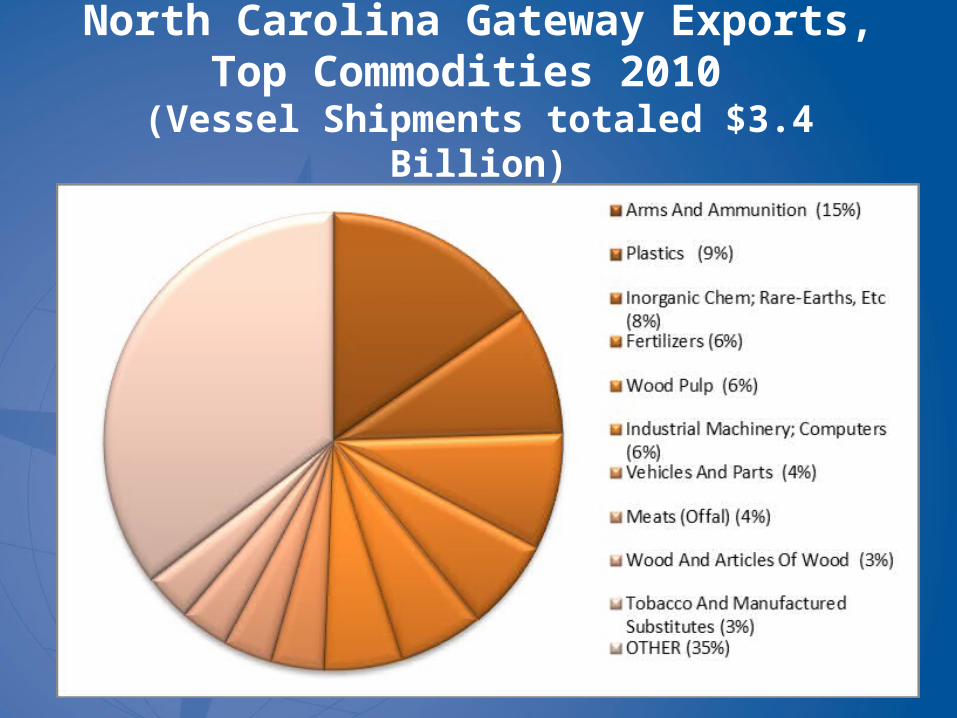
North Carolina Gateway Exports, Top Commodities 2010
(Vessel Shipments totaled $3.4 Billion)
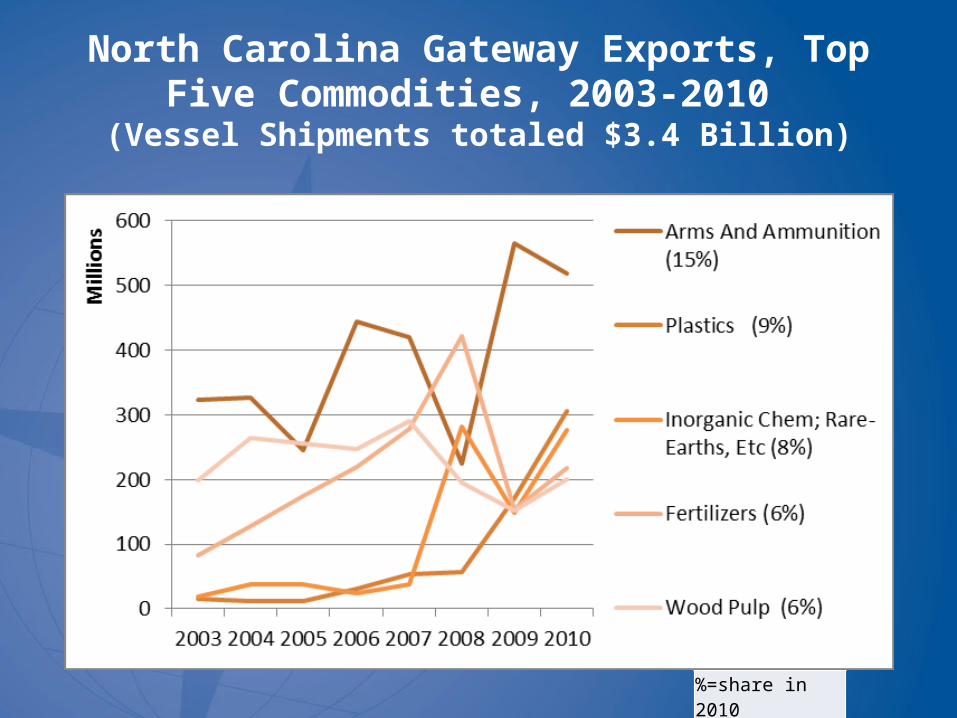
North Carolina Gateway Exports, Top Five Commodities, 2003-2010
(Vessel Shipments totaled $3.4 Billion)
%=share in 2010
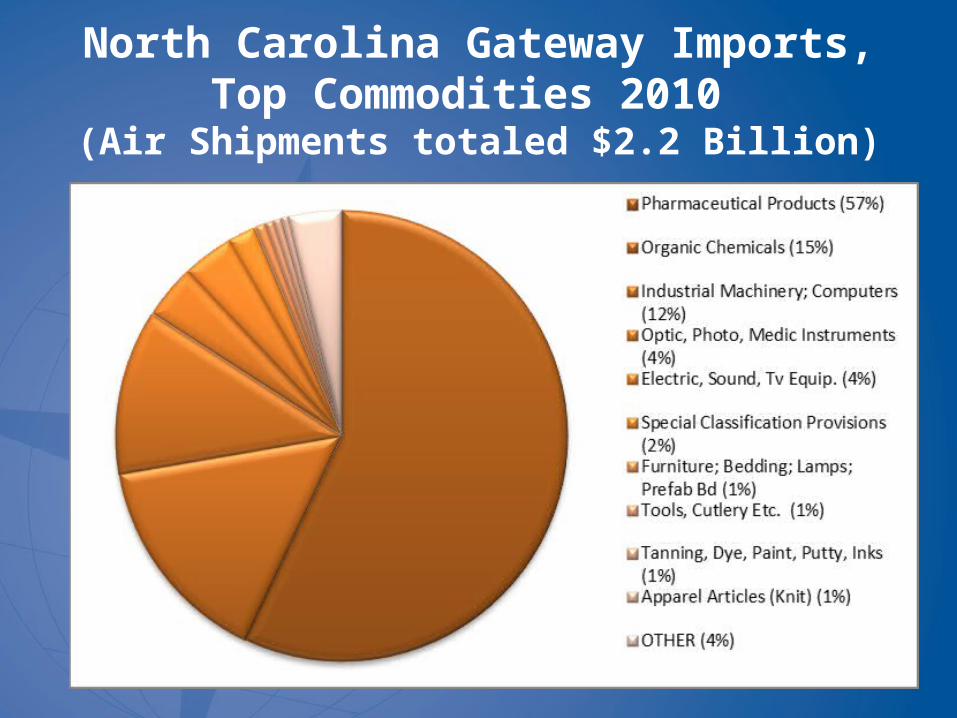
North Carolina Gateway Imports, Top Commodities 2010
(Air Shipments totaled $2.2 Billion)
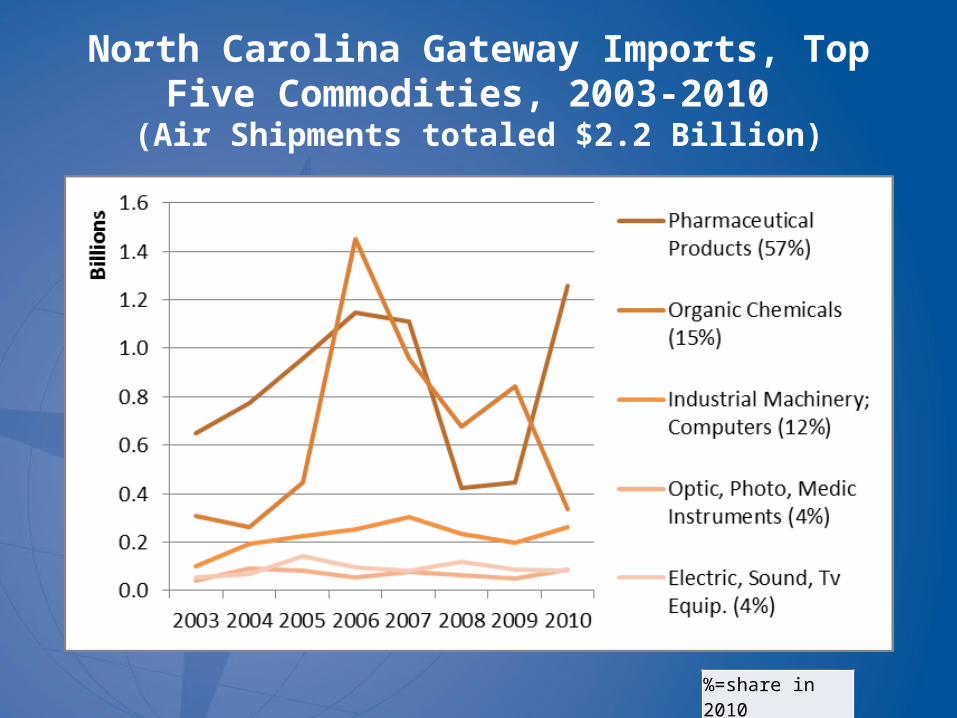
North Carolina Gateway Imports, Top Five Commodities, 2003-2010 (Air Shipments totaled $2.2 Billion)
%=share in 2010
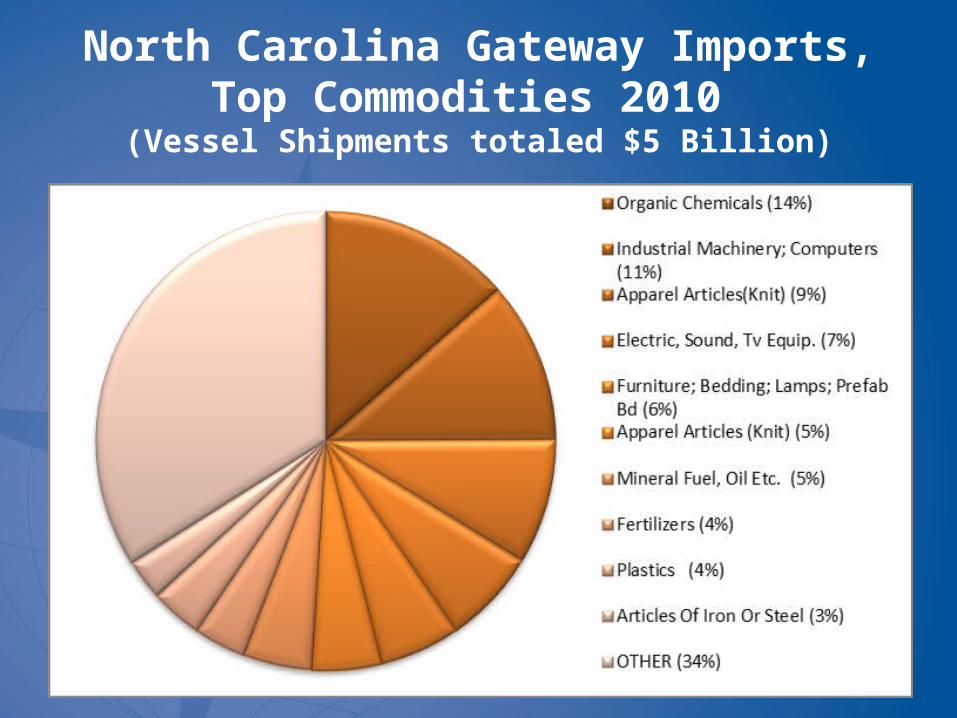
North Carolina Gateway Imports, Top Commodities 2010
(Vessel Shipments totaled $5 Billion)
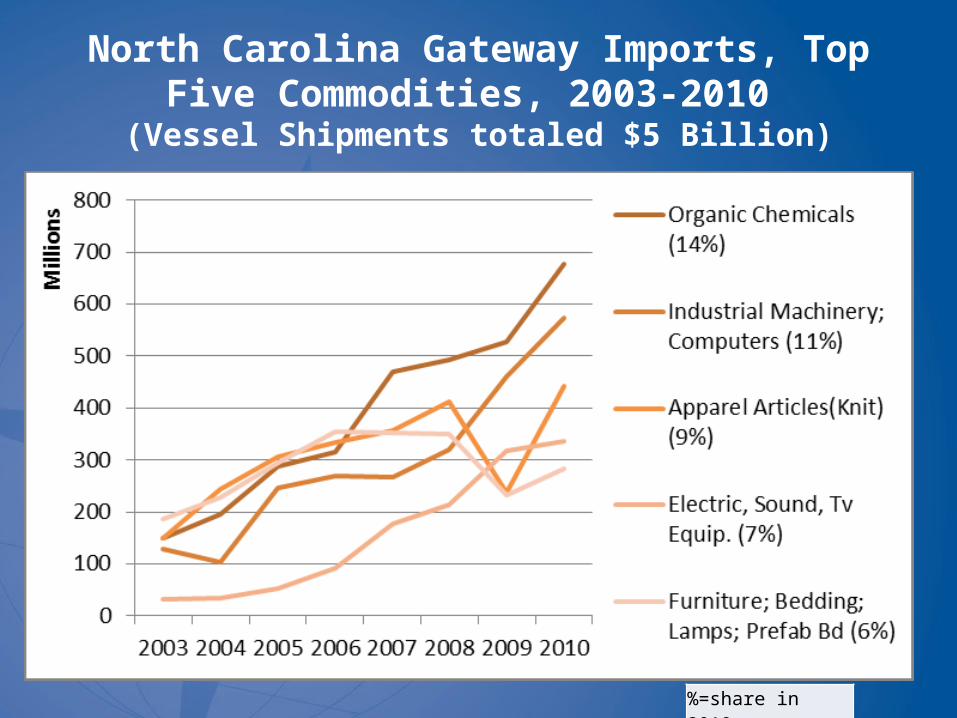
North Carolina Gateway Imports, Top Five Commodities, 2003-2010
(Vessel Shipments totaled $5 Billion)
%=share in 2010
Top Domestic Sources Shipped Through the State’s Gateways
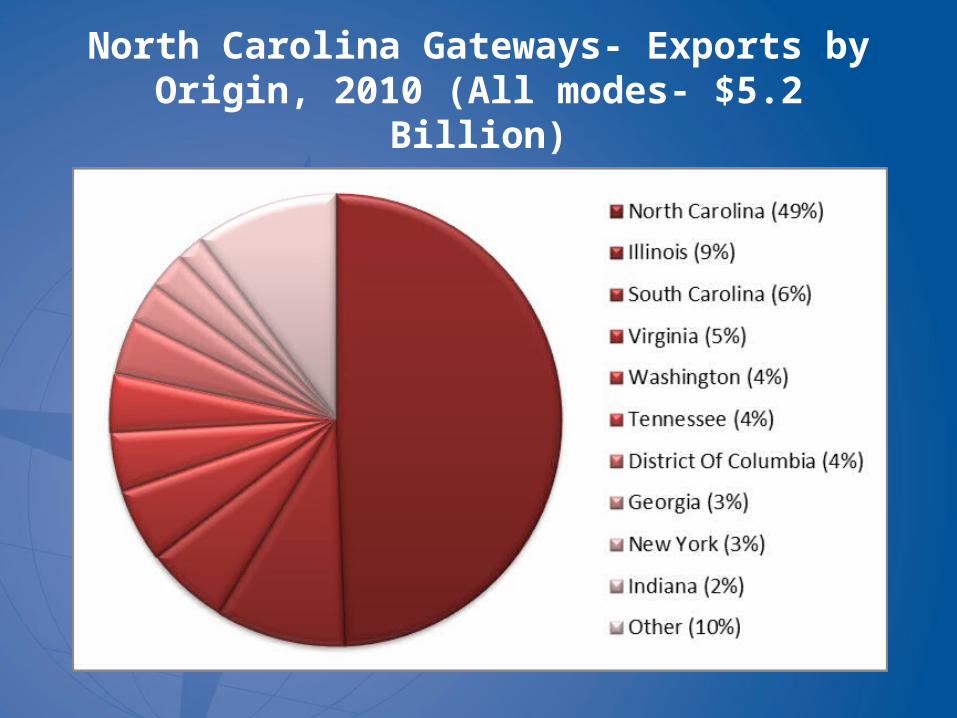
North Carolina Gateways- Exports by Origin, 2010 (All modes- $5.2 Billion)
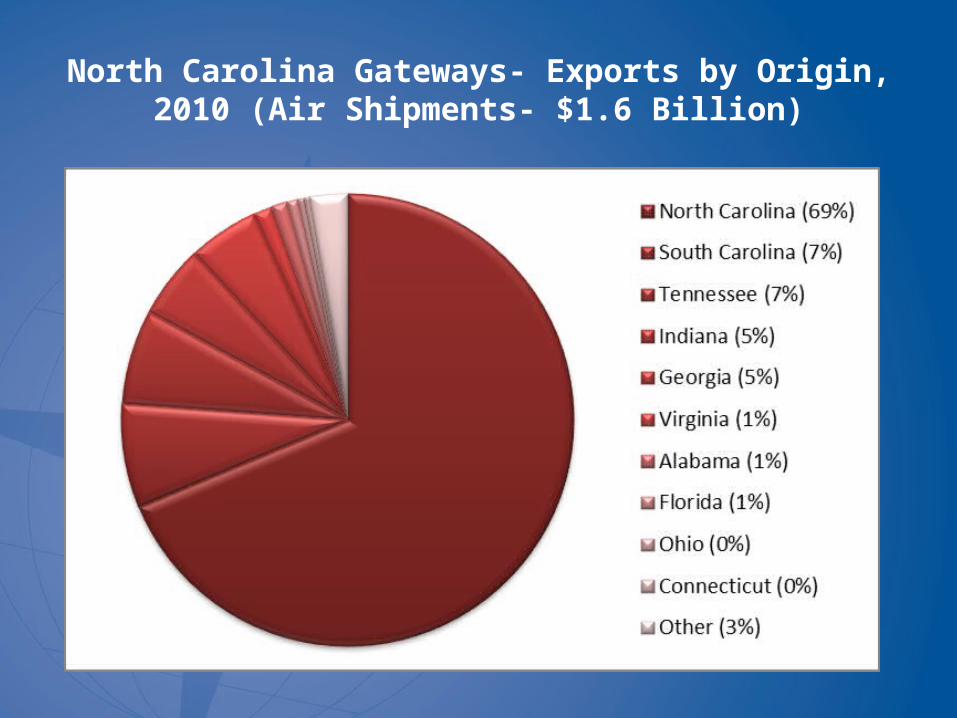
North Carolina Gateways- Exports by Origin, 2010 (Air Shipments- $1.6 Billion)
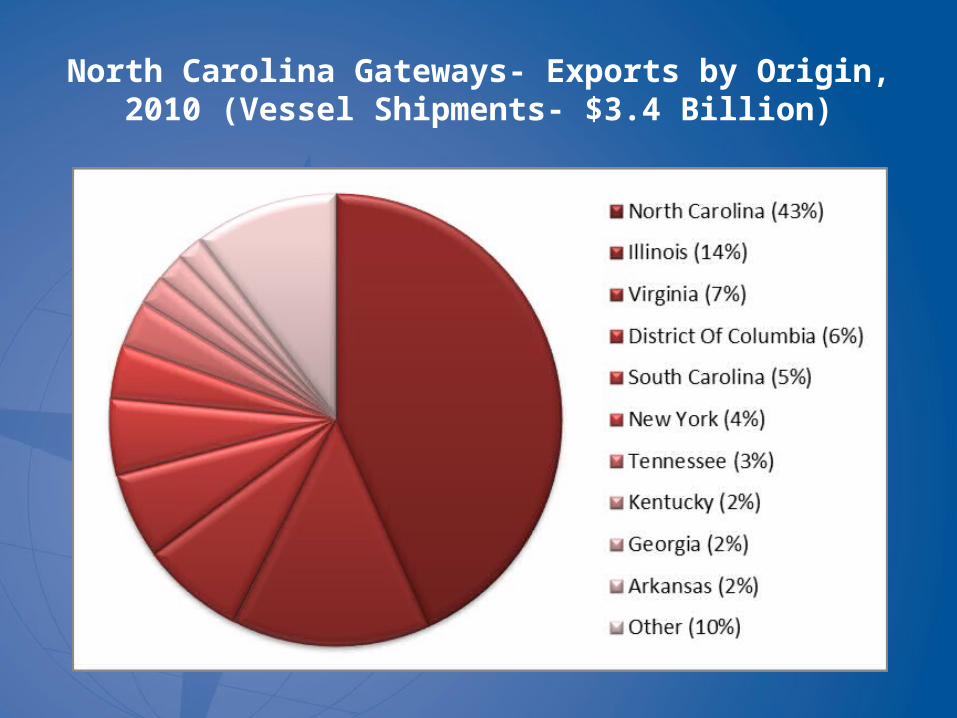
North Carolina Gateways- Exports by Origin, 2010 (Vessel Shipments- $3.4 Billion)