Embed Size (px)
Citation preview
International Trade
Balance of Payments
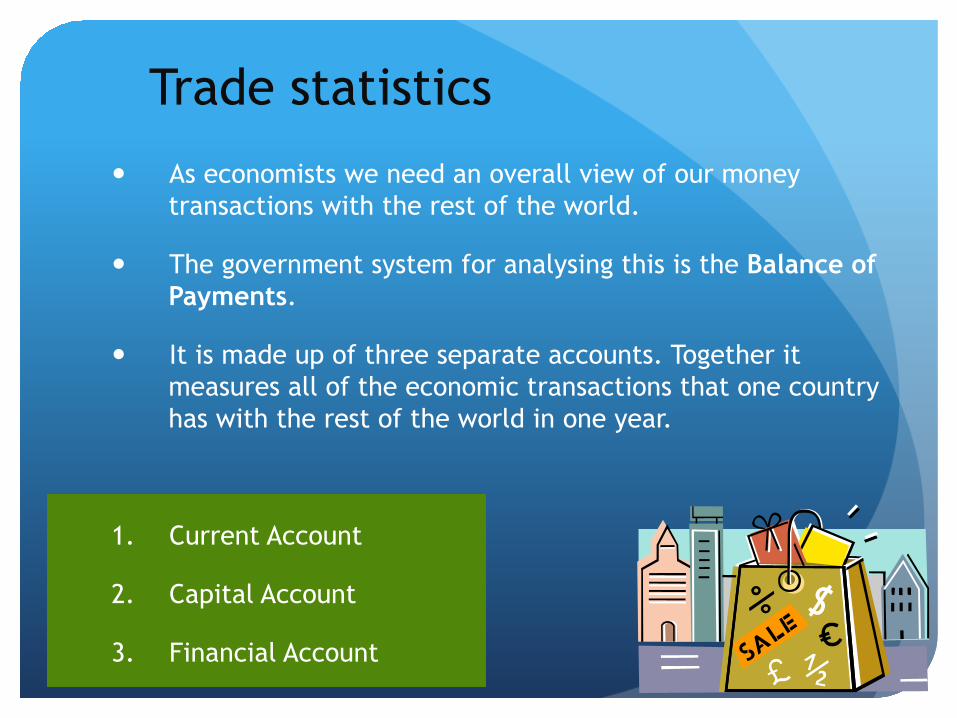
Trade statistics
� As economists we need an overall view of our money transactions with the rest of the world.
� The government system for analysing this is the Balance of Payments.
� It is made up of three separate accounts. Together it measures all of the economic transactions that one country has with the rest of the world in one year.
1. Current Account
2. Capital Account
3. Financial Account
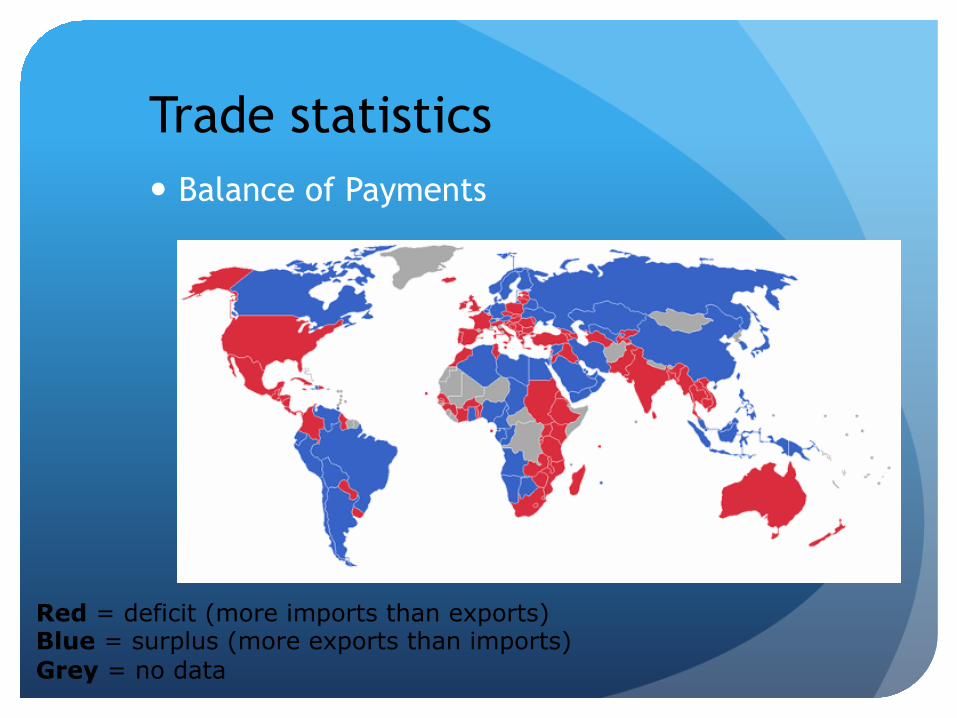
Trade statistics � Balance of Payments
Red = deficit (more imports than exports) Blue = surplus (more exports than imports) Grey = no data
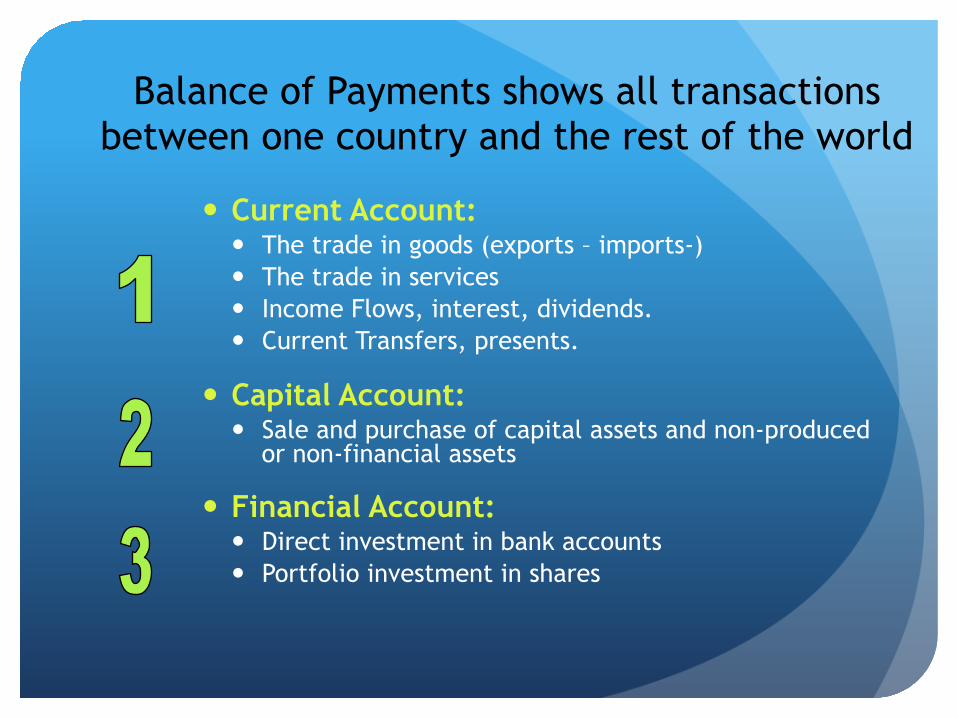
Balance of Payments shows all transactions between one country and the rest of the world
� Current Account: � The trade in goods (exports – imports-) � The trade in services � Income Flows, interest, dividends. � Current Transfers, presents.
� Capital Account: � Sale and purchase of capital assets and non-produced
or non-financial assets
� Financial Account: � Direct investment in bank accounts � Portfolio investment in shares
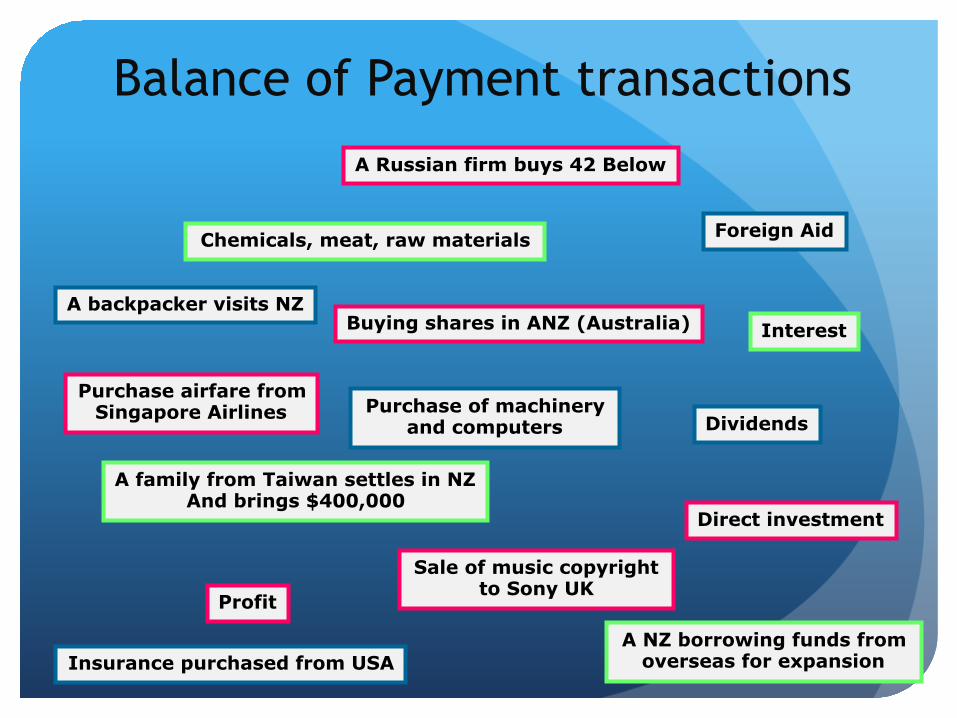
Balance of Payment transactions
Foreign Aid
Purchase of machinery and computers
Interest
Chemicals, meat, raw materials
Dividends
Profit
Direct investment
A family from Taiwan settles in NZ And brings $400,000
A backpacker visits NZ Buying shares in ANZ (Australia)
A NZ borrowing funds from overseas for expansion
Sale of music copyright to Sony UK
Insurance purchased from USA
Purchase airfare from Singapore Airlines
A Russian firm buys 42 Below
Balance of Payments
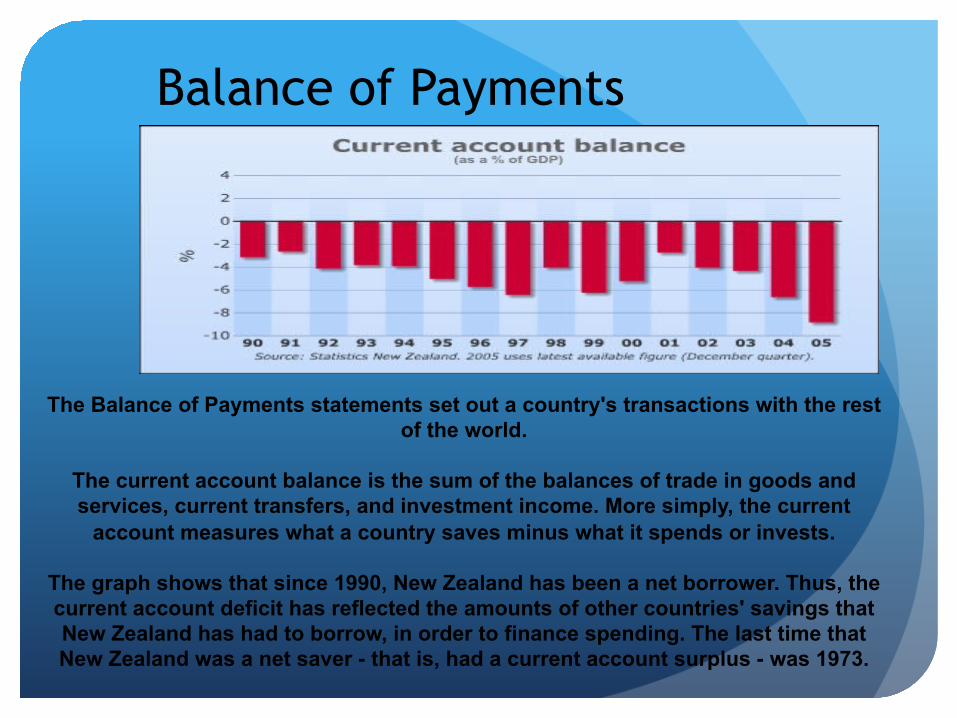
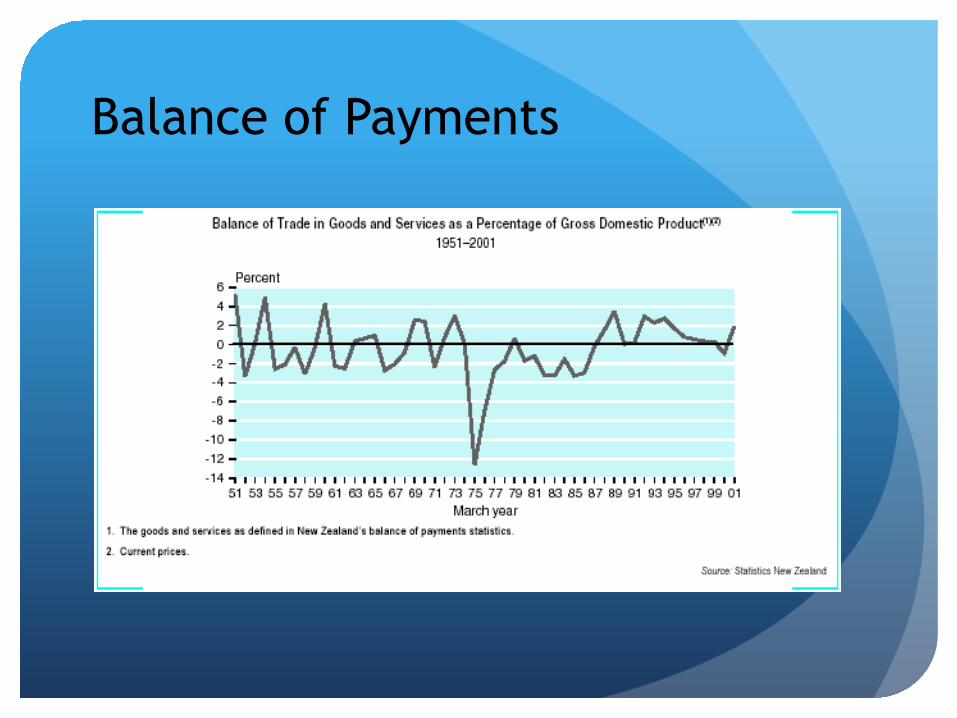
The Balance of Payments statements set out a country's transactions with the rest of the world.
The current account balance is the sum of the balances of trade in goods and services, current transfers, and investment income. More simply, the current
account measures what a country saves minus what it spends or invests.
The graph shows that since 1990, New Zealand has been a net borrower. Thus, the current account deficit has reflected the amounts of other countries' savings that New Zealand has had to borrow, in order to finance spending. The last time that New Zealand was a net saver - that is, had a current account surplus - was 1973.
Balance of Payments
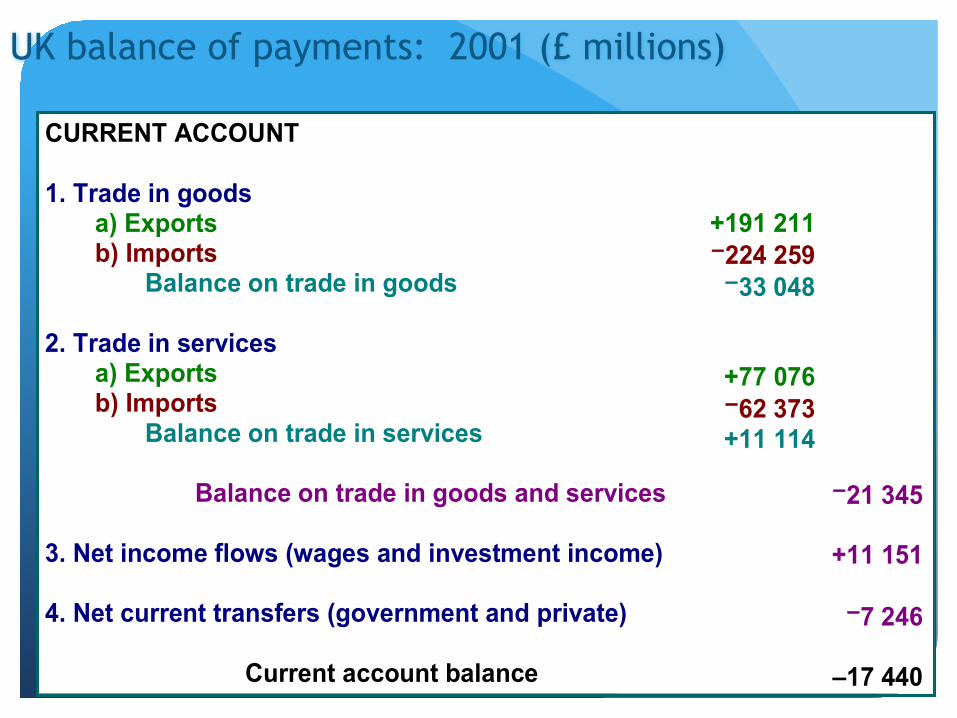
CURRENT ACCOUNT
1. Trade in goodsa) Exportsb) Imports
Balance on trade in goods
2. Trade in servicesa) Exportsb) Imports
Balance on trade in services
Balance on trade in goods and services
3. Net income flows (wages and investment income)
4. Net current transfers (government and private)
Current account balance
+191 211−224 259−33 048
+77 076−62 373+11 114
−21 345
+11 151
−7 246
–17 440
UK balance of payments: 2001 (£ millions)
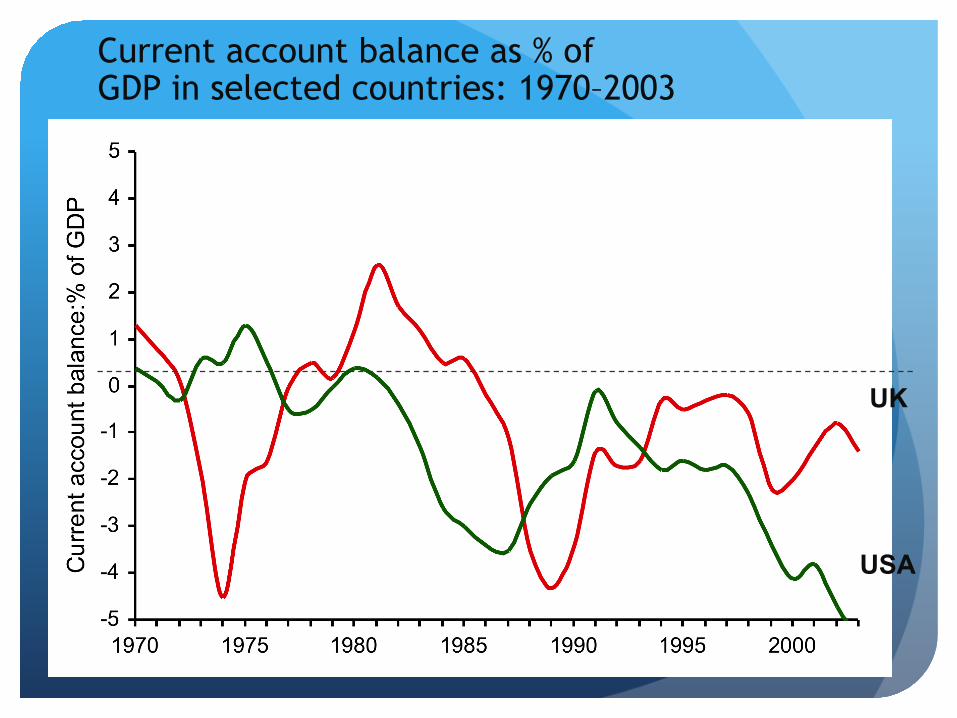
Current account balance as % of GDP in selected countries: 1970–2003
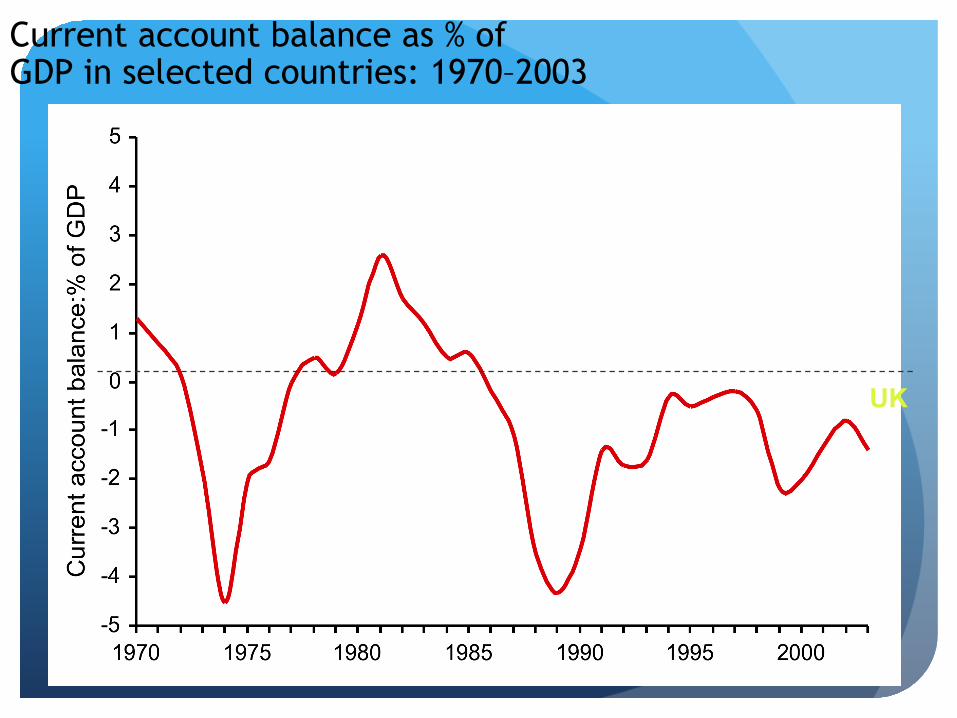
Current account balance as % of GDP in selected countries: 1970–2003
UK
Current account balance as % of GDP in selected countries: 1970–2003
UK
USA
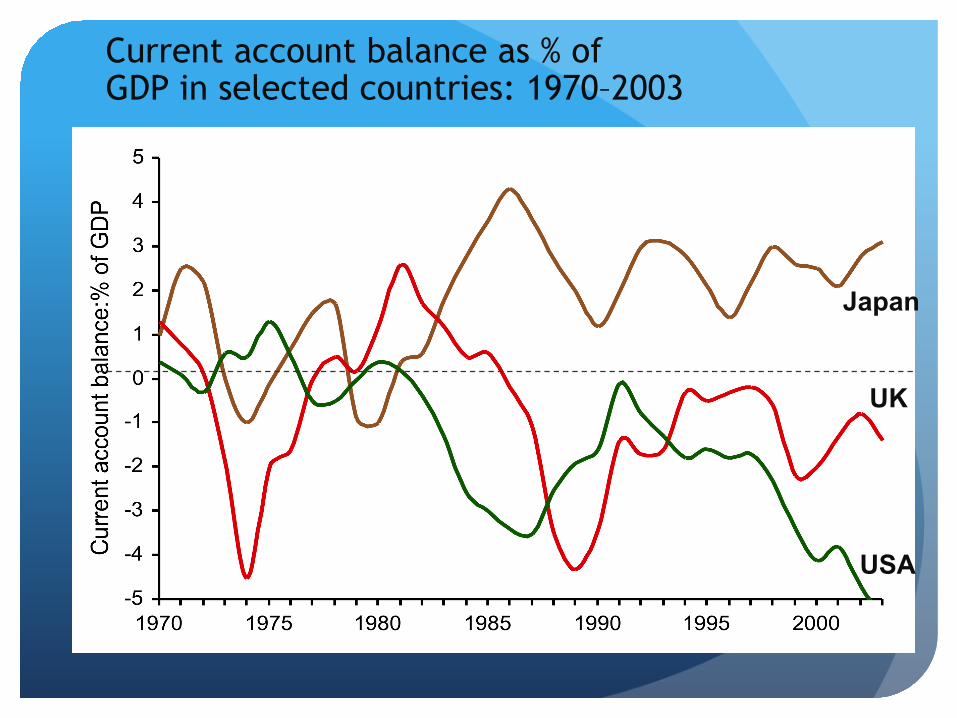
USA
Japan
UK
Current account balance as % of GDP in selected countries: 1970–2003
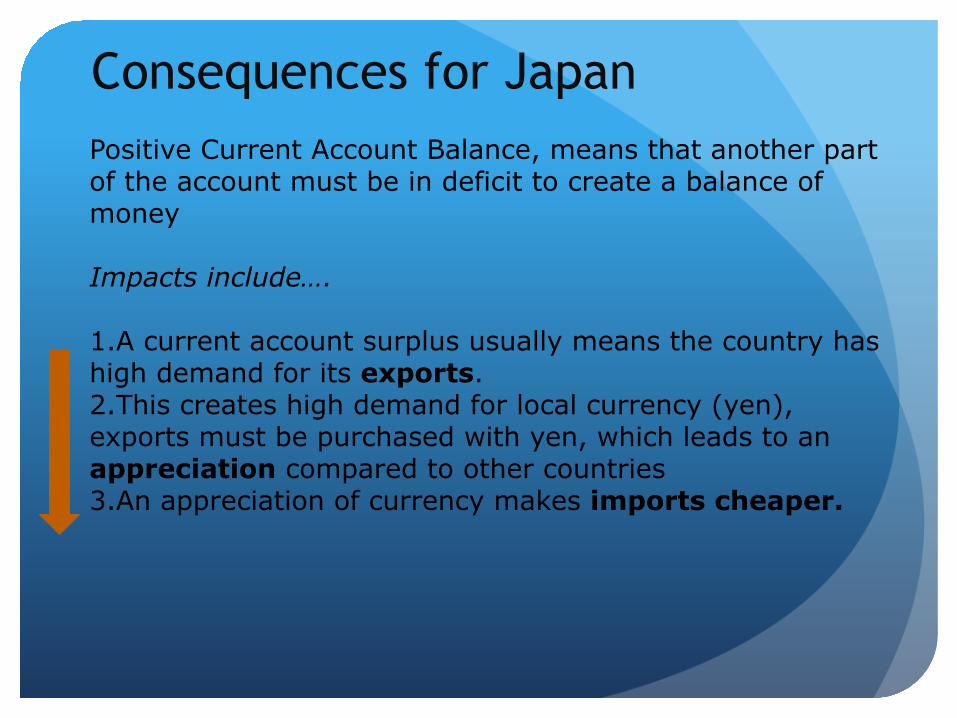
Consequences for Japan Positive Current Account Balance, means that another part of the account must be in deficit to create a balance of money Impacts include…. 1. A current account surplus usually means the country has high demand for its exports. 2. This creates high demand for local currency (yen), exports must be purchased with yen, which leads to an appreciation compared to other countries 3. An appreciation of currency makes imports cheaper.
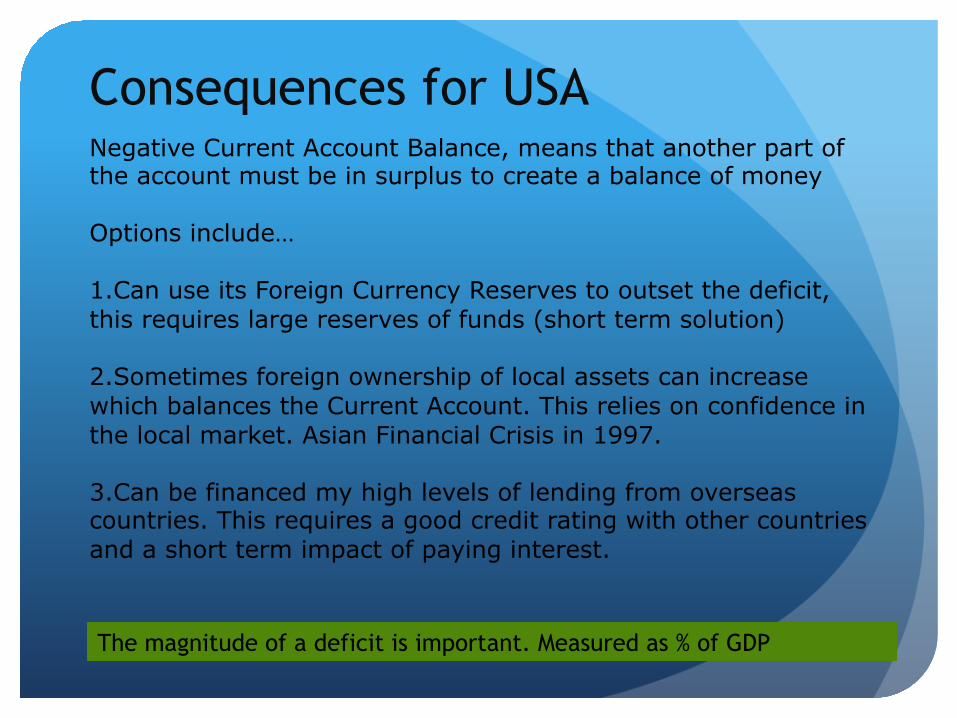
Consequences for USA Negative Current Account Balance, means that another part of the account must be in surplus to create a balance of money Options include… 1. Can use its Foreign Currency Reserves to outset the deficit, this requires large reserves of funds (short term solution)
2. Sometimes foreign ownership of local assets can increase which balances the Current Account. This relies on confidence in the local market. Asian Financial Crisis in 1997.
3. Can be financed my high levels of lending from overseas countries. This requires a good credit rating with other countries and a short term impact of paying interest.
The magnitude of a deficit is important. Measured as % of GDP
How do you fix a country with a large Current Account deficit?
� Encouraging people to buy locally produced products.
� Attempt to devalue currency to make imported products more expensive and exports more attractive to overseas buyer.
� Broader expenditure reduction policies – reducing aggregate demand.
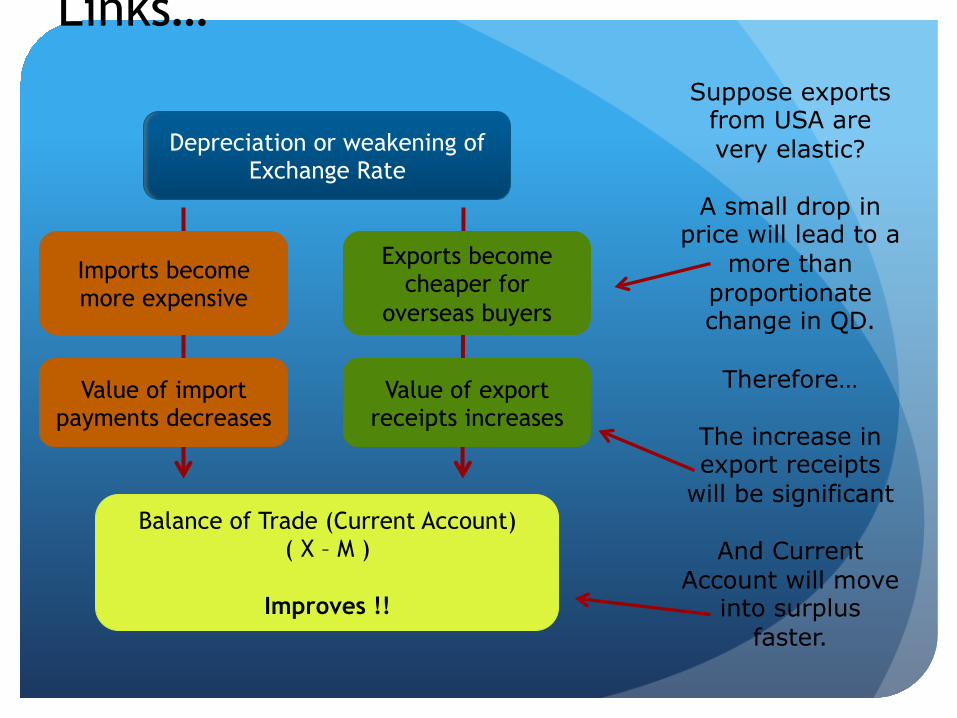
Links…
Balance of Trade (Current Account) ( X – M )
Improves !!
Depreciation or weakening of Exchange Rate
Value of export receipts increases
Value of import payments decreases
Imports become more expensive
Exports become cheaper for
overseas buyers
Suppose exports from USA are very elastic?
A small drop in
price will lead to a more than
proportionate change in QD.
Therefore…
The increase in export receipts
will be significant
And Current Account will move
into surplus faster.
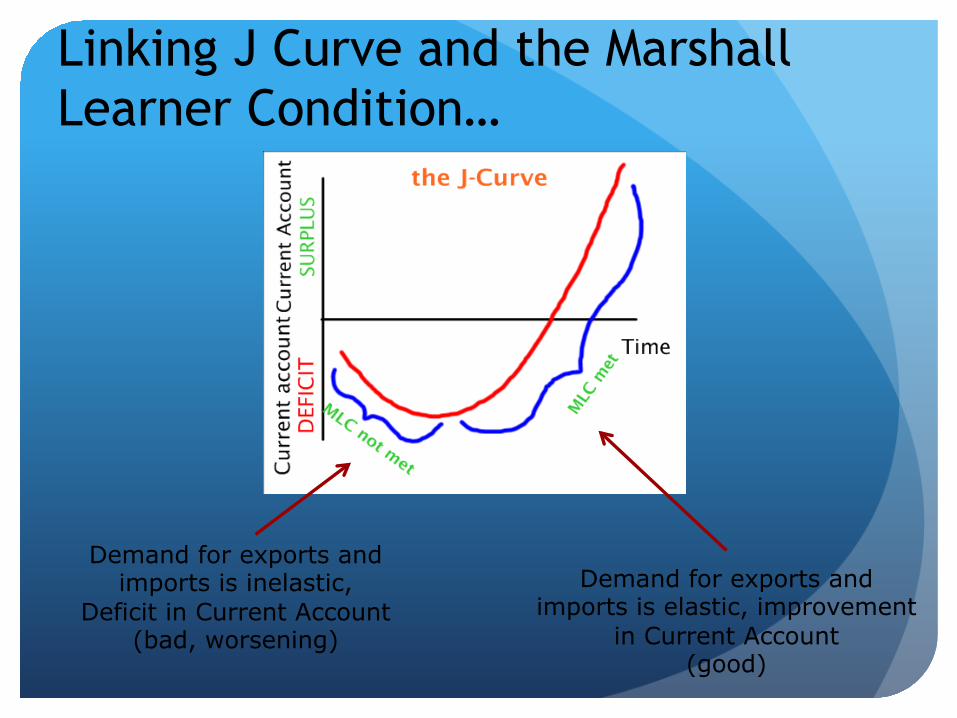
Linking J Curve and the Marshall Learner Condition…
Demand for exports and imports is elastic, improvement
in Current Account (good)
Demand for exports and imports is inelastic,
Deficit in Current Account (bad, worsening)
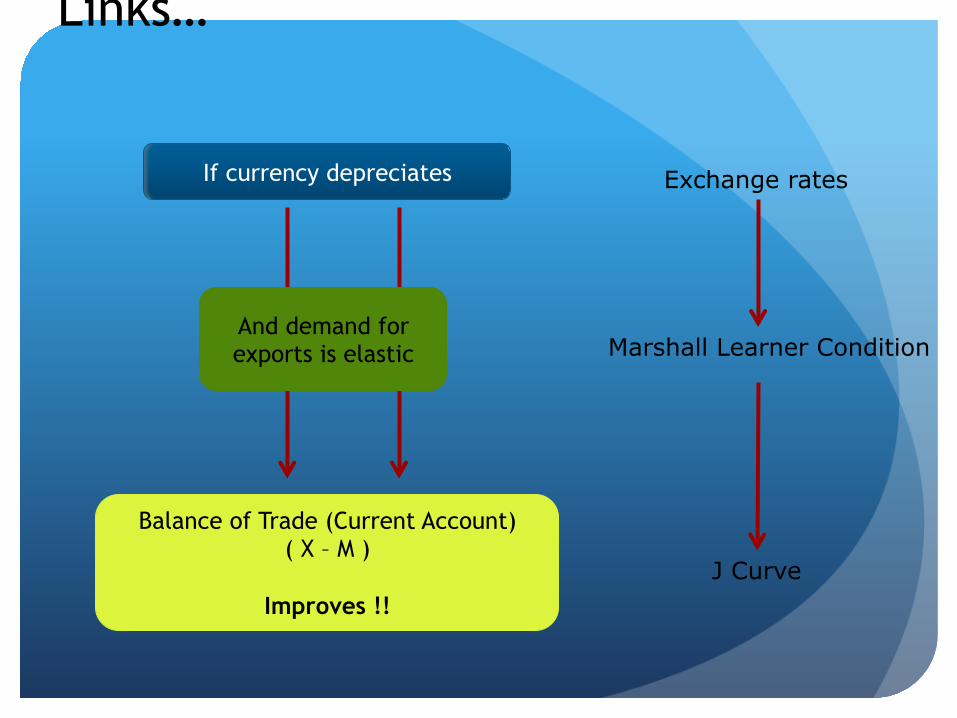
Links…
Balance of Trade (Current Account) ( X – M )
Improves !!
If currency depreciates
And demand for exports is elastic
Exchange rates
Marshall Learner Condition
J Curve
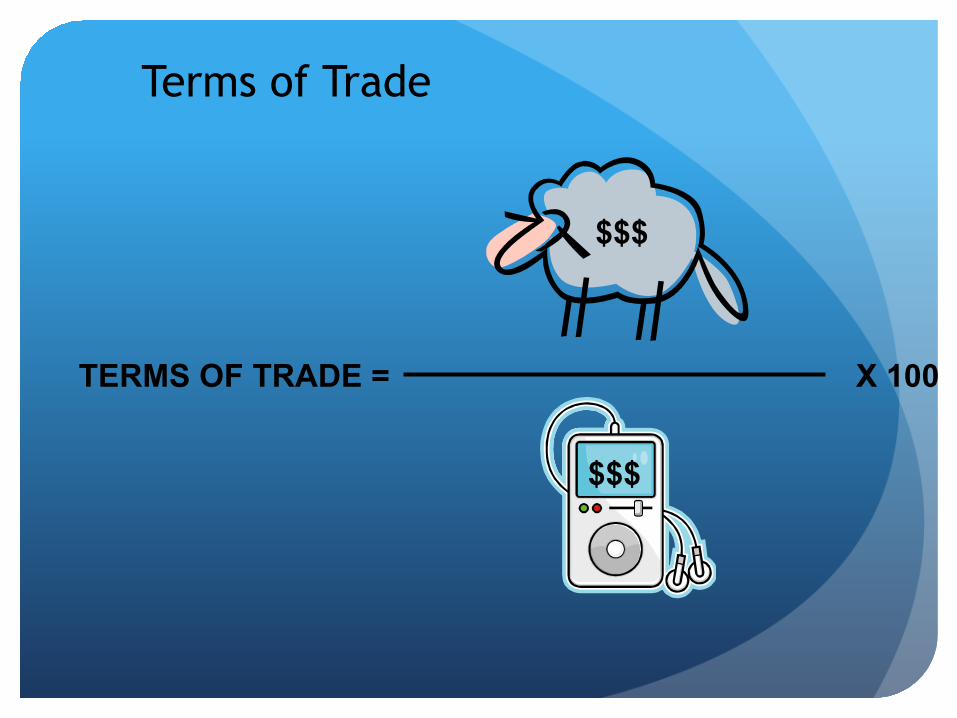
Terms of Trade
TERMS OF TRADE = X 100
$$$
$$$
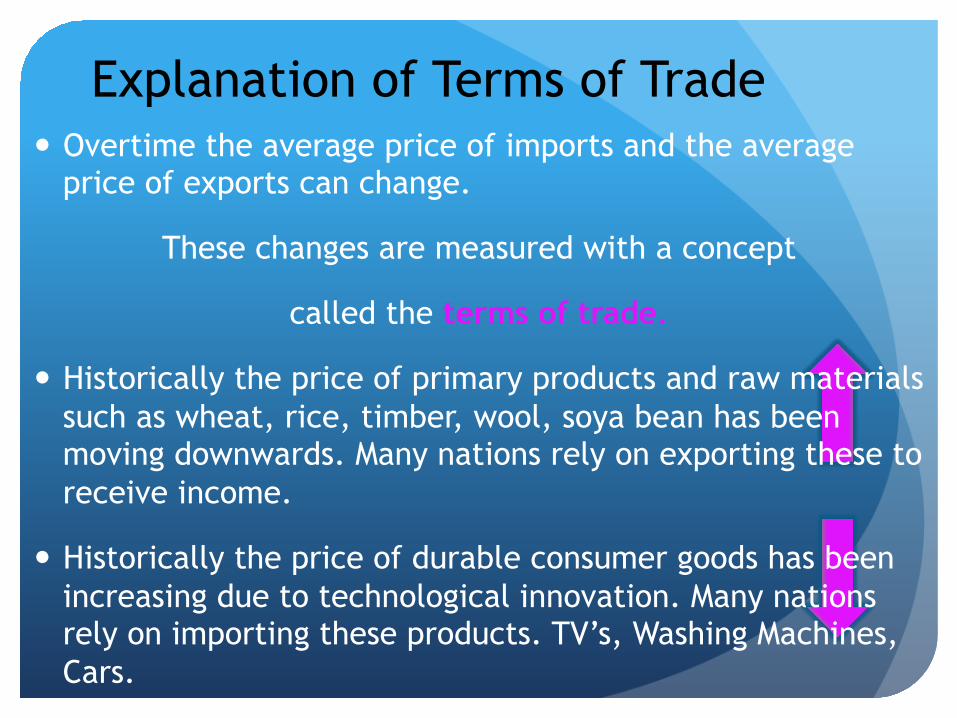
Explanation of Terms of Trade � Overtime the average price of imports and the average
price of exports can change.
These changes are measured with a concept
called the terms of trade.
� Historically the price of primary products and raw materials such as wheat, rice, timber, wool, soya bean has been moving downwards. Many nations rely on exporting these to receive income.
� Historically the price of durable consumer goods has been increasing due to technological innovation. Many nations rely on importing these products. TV’s, Washing Machines, Cars.
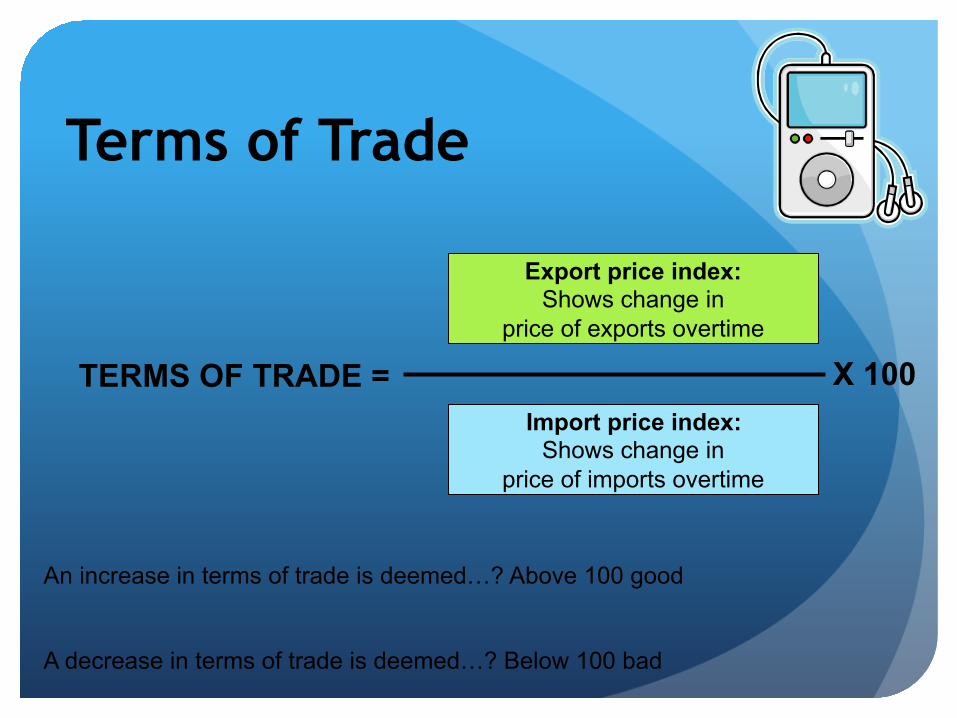
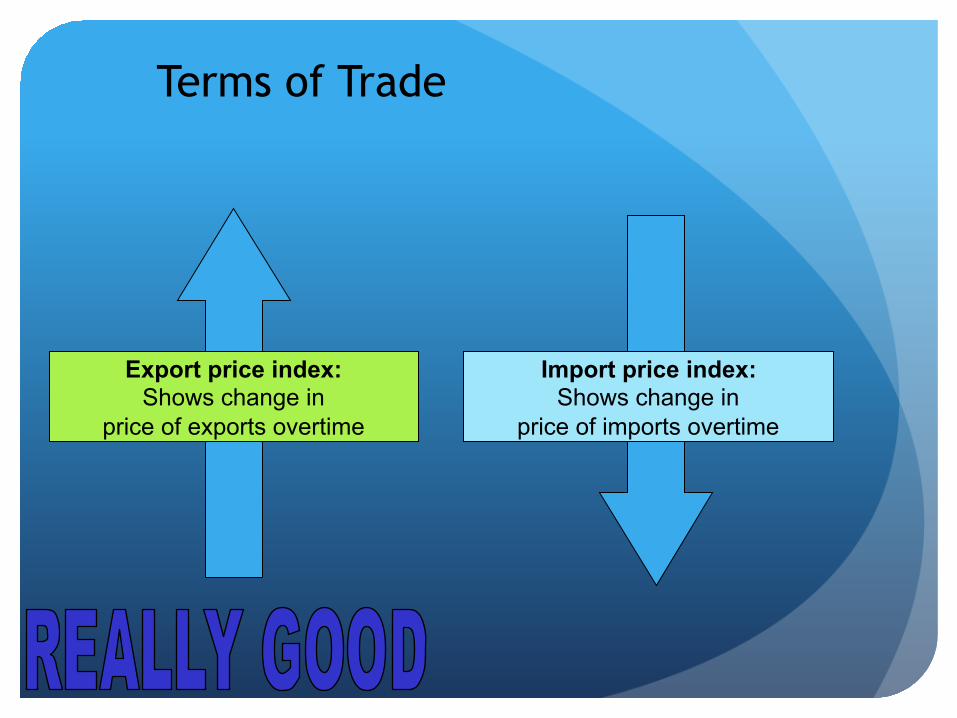
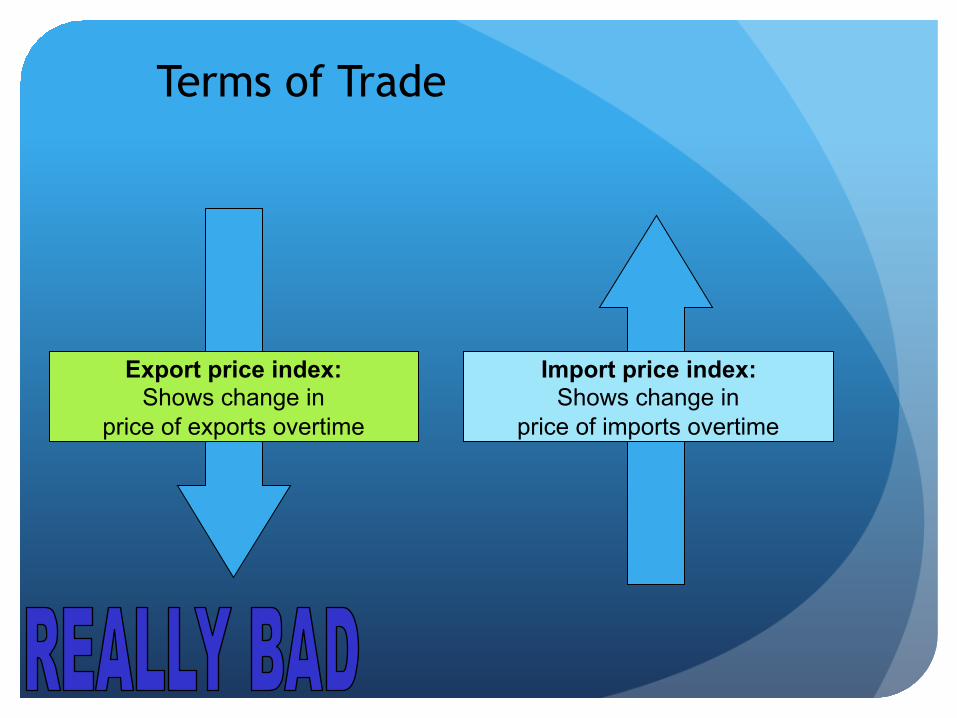
Terms of Trade
Export price index: Shows change in
price of exports overtime
Import price index: Shows change in
price of imports overtime
TERMS OF TRADE = X 100
An increase in terms of trade is deemed…? Above 100 good A decrease in terms of trade is deemed…? Below 100 bad
Terms of Trade
Export price index: Shows change in
price of exports overtime Import price index: Shows change in
price of imports overtime
Terms of Trade
Export price index: Shows change in
price of exports overtime
Import price index: Shows change in
price of imports overtime
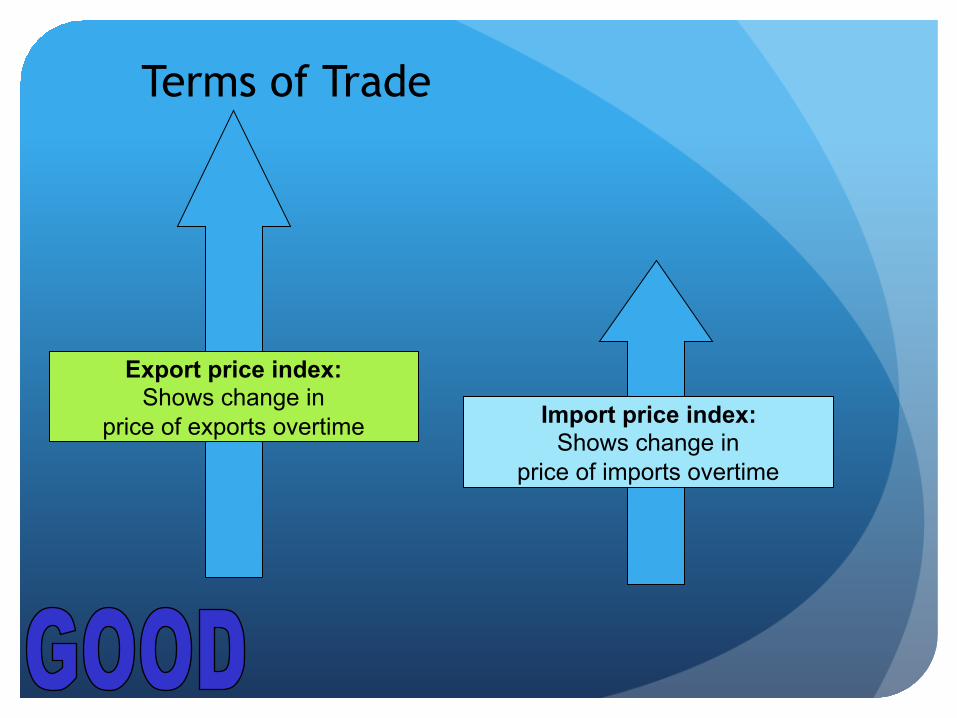
Terms of Trade
Export price index: Shows change in
price of exports overtime
Import price index: Shows change in
price of imports overtime

Exporters Appreciation = Bad Depreciation = Good
NZ$1 = US$0.80
NZ$1 = US$0.70
NZ$1 = US$0.60
US$2.40
US$2.10
US$1.80
APPRECIATION
DEPRECIATION
NZ$3.00
NZ$3.00
NZ$3.00 Sell Buy
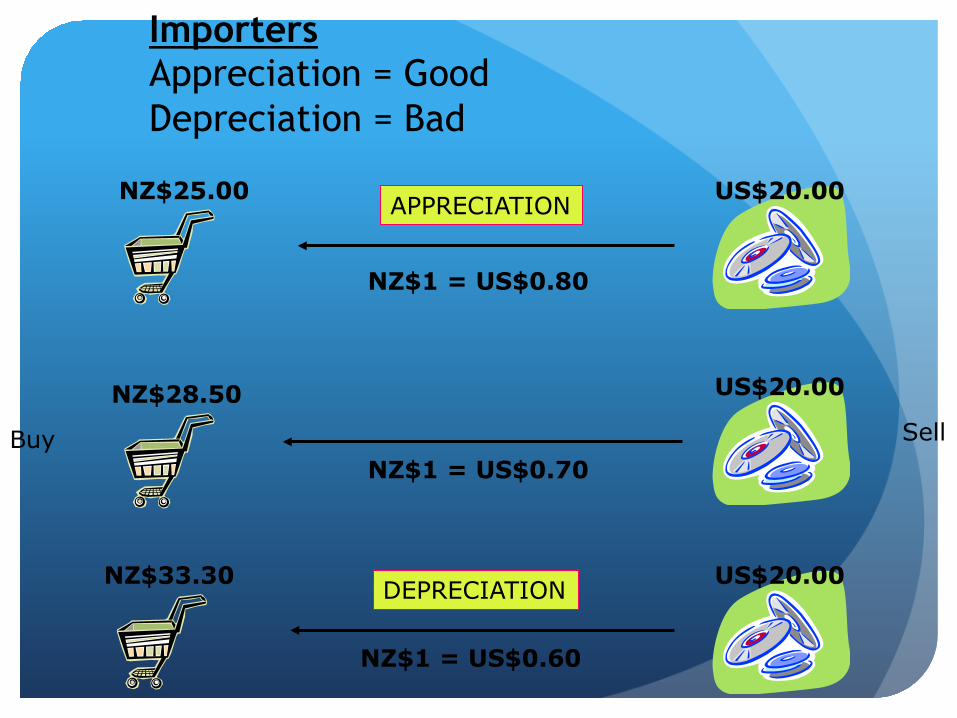
Importers Appreciation = Good Depreciation = Bad
NZ$1 = US$0.80
NZ$1 = US$0.70
NZ$1 = US$0.60
NZ$25.00
NZ$28.50
NZ$33.30
US$20.00
US$20.00
US$20.00
APPRECIATION
DEPRECIATION
Buy Sell
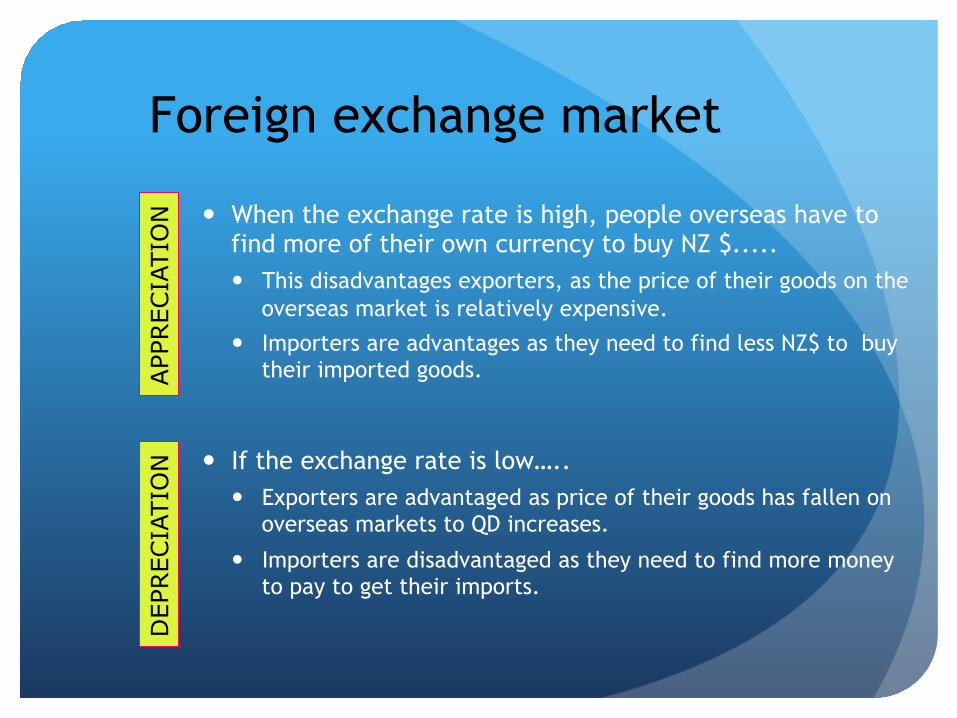
Foreign exchange market
� When the exchange rate is high, people overseas have to find more of their own currency to buy NZ $..... � This disadvantages exporters, as the price of their goods on the
overseas market is relatively expensive.
� Importers are advantages as they need to find less NZ$ to buy their imported goods.
� If the exchange rate is low….. � Exporters are advantaged as price of their goods has fallen on
overseas markets to QD increases.
� Importers are disadvantaged as they need to find more money to pay to get their imports.
APP
REC
IATI
ON
D
EPREC
IATI
ON
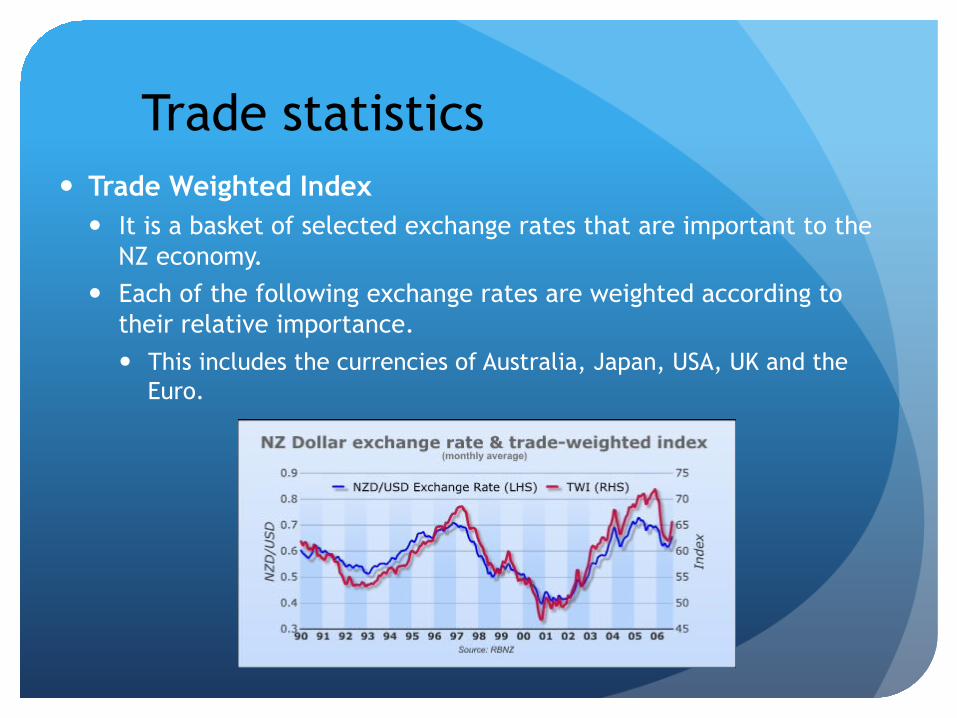
Trade statistics � Trade Weighted Index
� It is a basket of selected exchange rates that are important to the NZ economy.
� Each of the following exchange rates are weighted according to their relative importance. � This includes the currencies of Australia, Japan, USA, UK and the
Euro.
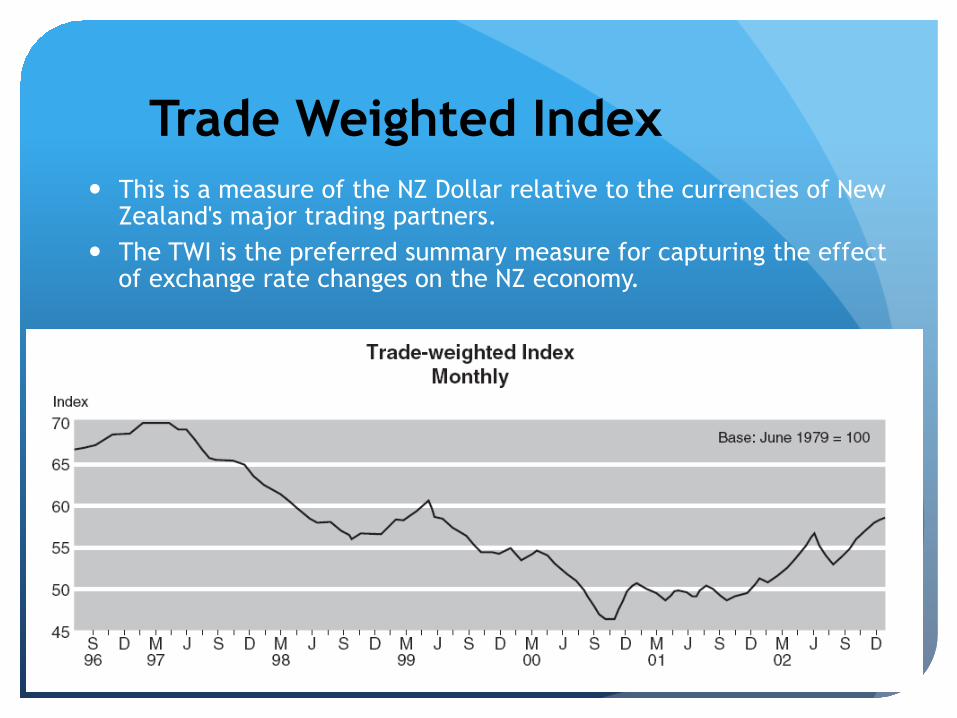
Trade Weighted Index � This is a measure of the NZ Dollar relative to the currencies of New
Zealand's major trading partners. � The TWI is the preferred summary measure for capturing the effect
of exchange rate changes on the NZ economy.
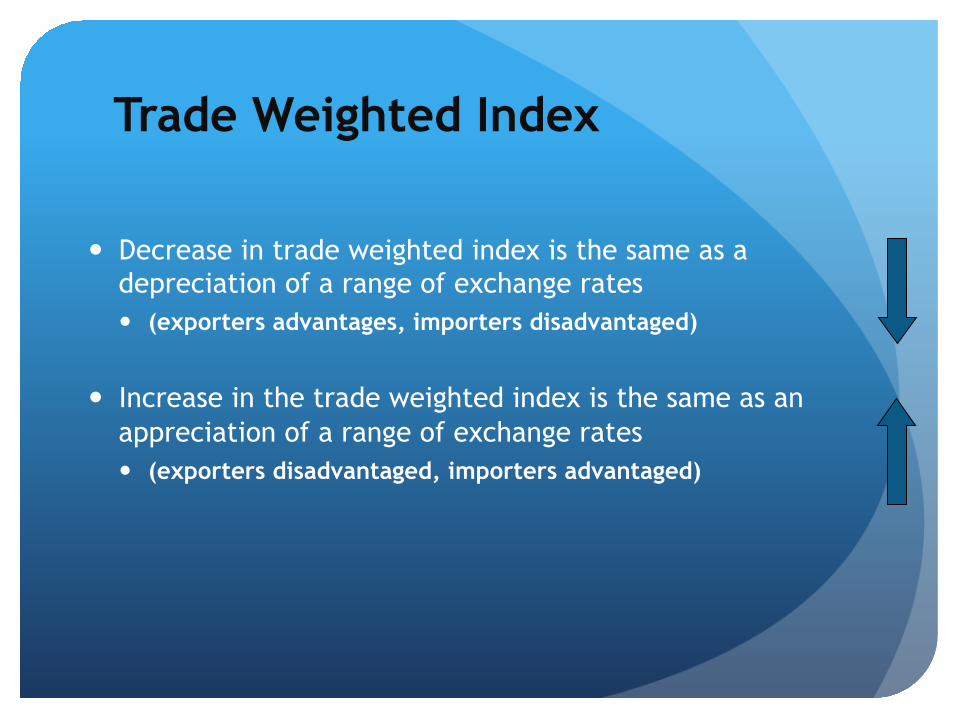
Trade Weighted Index
� Decrease in trade weighted index is the same as a depreciation of a range of exchange rates � (exporters advantages, importers disadvantaged)
� Increase in the trade weighted index is the same as an appreciation of a range of exchange rates � (exporters disadvantaged, importers advantaged)