Embed Size (px)
Citation preview
STATISTICAL APPENDIXECONOMIC SURVEY 2011-12
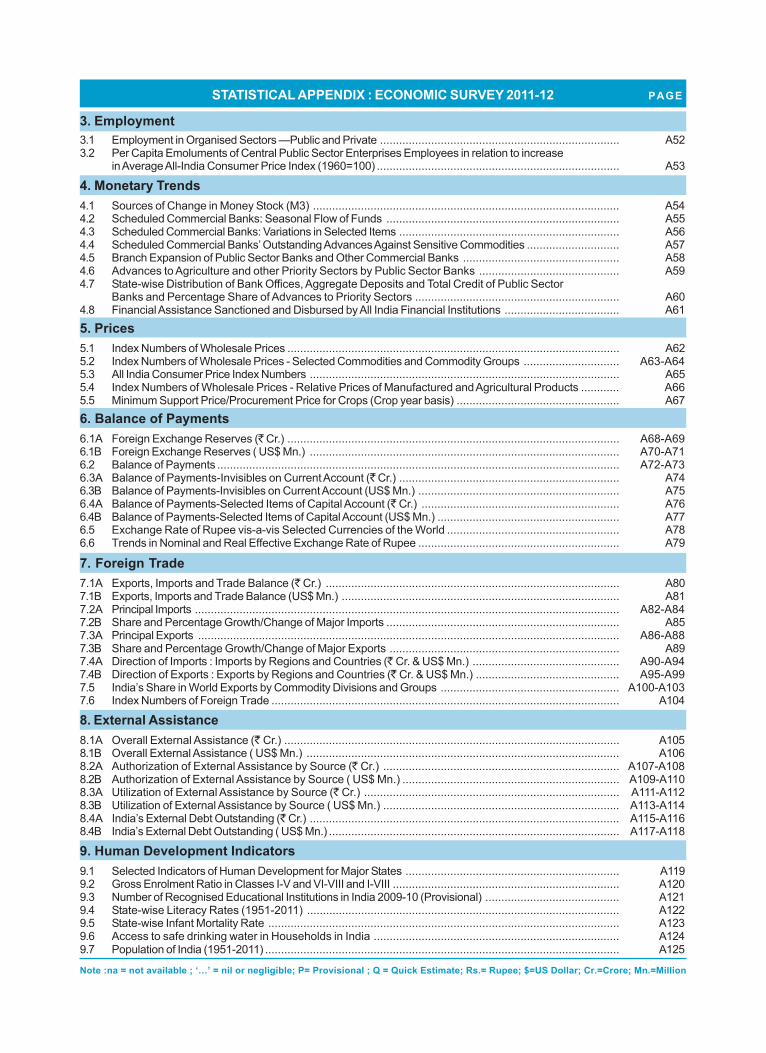
STATISTICAL APPENDIX : ECONOMIC SURVEY 2011-2012 PAGE
0.1 Select Indicators: 1950-51 to 2010-11 ..................................................................................................... A1-A2
1. National Income and Production1.1 Gross National Product and Net National Product .................................................................................... A31.2 Annual Growth Rate of Gross National Product and Net National Product ............................................... A41.3 A Gross Domestic Product at Factor Cost by Industry of Origin at Constant Prices ..................................... A51.3 B Gross Domestic Product at Factor Cost by Industry of Origin at Current Prices ....................................... A61.4 Annual Growth Rates of Real Gross Domestic Product at Factor Cost by Industry of Origin . .................. A71.5 Gross Domestic Saving and Gross Domestic Capital Formation ............................................................... A8-A91.6 Gross Domestic Saving and Gross Domestic Capital Formation as per cent of GDP at
Current Market Prices ............................................................................................................................ A10-A111.7 Net State Domestic Product at Current Prices .......................................................................................... A121.8 Per Capita Net State Domestic Product at Current Prices ......................................................................... A131.9 Index Numbers of Agricultural Production ................................................................................................ A141.10 Index Numbers of Area under Principal Crops ......................................................................................... A151.11 Index Numbers of Yield of Principal Crops .............................................................................................. A161.12 Production of Major Crops ...................................................................................................................... A171.13 Gross Area Under Major Crops ............................................................................................................... A181.14 Yield per Hectare of Major Crops ............................................................................................................ A191.15 Production of important crops in three largest producing states in 2009-10 ............................................. A201.16 Irrigated Area Under Different Crops ....................................................................................................... A211.17 Net Availability of Cereals and Pulses ..................................................................................................... A221.18 Net Availability, Procurement and Public Distribution of Foodgrains .......................................................... A231.19 Per Capita Availability of Certain Important Articles of Consumption ......................................................... A241.20 Production, Imports and Consumption of Fertilizers ................................................................................. A251.21 Production of Major Livestock Products and Fish .................................................................................... A251.22 Production of Coal and Lignite ................................................................................................................ A261.23 Production of Fabrics ............................................................................................................................. A261.24 Progress of Electricity Supply (Utilities & Non-Utilities)
(A) : Installed Plant Capacity ................................................................................................................... A27(B) : Energy Generated (Gross) ............................................................................................................. A27
1.25 Pattern of Electricity Consumption (Utilities) ............................................................................................. A281.26 Operations of Indian Railways ................................................................................................................ A281.27 Revenue Earning Goods Traffic on Indian Railways
(A) : Traffic Originating ........................................................................................................................... A29(B) : Goods Carried ................................................................................................................................ A29
1.28 Operations of Road Transport ................................................................................................................ A301.29 Growth of Civil Aviation .......................................................................................................................... A301.30 Commodity Balance of Petroleum and Petroleum Products ....................................................................... A311.31 Production of Selected Industries ........................................................................................................... A32-A341.32 Index of Industrial Production .................................................................................................................. A351.33 State-wise/Utilitywise average rate of electricity for domestic and industrial consumers ......................... A36
2. Budgetary Transactions2.1 Gross Capital Formation from Budgetary Resources of the Central Government ..................................... A372.2 Budgetary Transactions of the Central and State Governments and Union Territories .............................. A382.3 Total Expenditure of the Central Government ........................................................................................... A392.4 Plan Outlay by Heads of Development: Centre, States and Union Territories, 1961-80 .............................. A402.5 Sixth Plan Outlay by Heads of Development: Centre, States and Union Territories, 1980-85 ..................... A412.6 Plan Outlay by Heads of Developement: Centre, States and Union Territories, 1985-92 ............................ A422.7 Eighth Plan Outlay by Heads of Development: Centre, States and Union Territories, 1992-97 . ................. A432.8 Ninth Plan Outlay by Heads of Development: Centre, States and Union Territories, 1997-98 to 2001-02 ... A442.9 Tenth Plan Outlay by Heads of Development: Centre, States and Union Territories, 2002-07
and Annual Plans 2002-03 to 2006-07 ..................................................................................................... A452.10 Eleventh Plan (2007-2012) Outlay by Heads of Development : Centre, States and Union Territories ......... A462.11 Financing for Central and State Annual Plans 2010-11(RE/LE) and 2011-12 (BE/AP) ................................ A472.12 Overall Financing Pattern of the Public Sector Plan outlay during the Ninth Plan : 1997-2002 .................... A482.13 Overall Financing Pattern of the Public Sector Plan outlay during the Tenth Plan : 2002-2007. .................. A482.14 Overall Financing Pattern of the Public Sector Plan outlay during the Eleventh Plan : 2007-2012 .............. A492.15 Financial Performance of Indian Railways ............................................................................................... A502.16 Financial Performance of the Department of Posts .................................................................................. A512.17 Financial Performance of the Department of Telecommunications ............................................................ A51
STATISTICAL APPENDIX : ECONOMIC SURVEY 2011-12 PAGE
3. Employment3.1 Employment in Organised Sectors —Public and Private ........................................................................... A523.2 Per Capita Emoluments of Central Public Sector Enterprises Employees in relation to increase
in Average All-India Consumer Price Index (1960=100) ............................................................................ A53
4. Monetary Trends4.1 Sources of Change in Money Stock (M3) ................................................................................................ A544.2 Scheduled Commercial Banks: Seasonal Flow of Funds ......................................................................... A554.3 Scheduled Commercial Banks: Variations in Selected Items ..................................................................... A564.4 Scheduled Commercial Banks’ Outstanding Advances Against Sensitive Commodities ............................. A574.5 Branch Expansion of Public Sector Banks and Other Commercial Banks ................................................. A584.6 Advances to Agriculture and other Priority Sectors by Public Sector Banks ............................................ A594.7 State-wise Distribution of Bank Offices, Aggregate Deposits and Total Credit of Public Sector
Banks and Percentage Share of Advances to Priority Sectors ................................................................ A604.8 Financial Assistance Sanctioned and Disbursed by All India Financial Institutions .................................... A615. Prices5.1 Index Numbers of Wholesale Prices ........................................................................................................ A625.2 Index Numbers of Wholesale Prices - Selected Commodities and Commodity Groups .............................. A63-A645.3 All India Consumer Price Index Numbers ................................................................................................. A655.4 Index Numbers of Wholesale Prices - Relative Prices of Manufactured and Agricultural Products ............ A665.5 Minimum Support Price/Procurement Price for Crops (Crop year basis) ................................................... A676. Balance of Payments6.1A Foreign Exchange Reserves (` Cr.) ........................................................................................................ A68-A696.1B Foreign Exchange Reserves ( US$ Mn.) ................................................................................................. A70-A716.2 Balance of Payments .............................................................................................................................. A72-A736.3A Balance of Payments-Invisibles on Current Account (` Cr.) ..................................................................... A746.3B Balance of Payments-Invisibles on Current Account (US$ Mn.) ............................................................... A756.4A Balance of Payments-Selected Items of Capital Account (` Cr.) .............................................................. A766.4B Balance of Payments-Selected Items of Capital Account (US$ Mn.) ......................................................... A776.5 Exchange Rate of Rupee vis-a-vis Selected Currencies of the World ...................................................... A786.6 Trends in Nominal and Real Effective Exchange Rate of Rupee ............................................................... A79
7. Foreign Trade7.1A Exports, Imports and Trade Balance (` Cr.) ............................................................................................ A807.1B Exports, Imports and Trade Balance (US$ Mn.) ....................................................................................... A817.2A Principal Imports ..................................................................................................................................... A82-A847.2B Share and Percentage Growth/Change of Major Imports ......................................................................... A857.3A Principal Exports .................................................................................................................................... A86-A887.3B Share and Percentage Growth/Change of Major Exports ........................................................................ A897.4A Direction of Imports : Imports by Regions and Countries (` Cr. & US$ Mn.) .............................................. A90-A947.4B Direction of Exports : Exports by Regions and Countries (` Cr. & US$ Mn.) ............................................. A95-A997.5 India’s Share in World Exports by Commodity Divisions and Groups ........................................................ A100-A1037.6 Index Numbers of Foreign Trade ............................................................................................................. A104
8. External Assistance8.1A Overall External Assistance (` Cr.) ......................................................................................................... A1058.1B Overall External Assistance ( US$ Mn.) .................................................................................................. A1068.2A Authorization of External Assistance by Source (` Cr.) .......................................................................... A107-A1088.2B Authorization of External Assistance by Source ( US$ Mn.) .................................................................... A109-A1108.3A Utilization of External Assistance by Source (` Cr.) ................................................................................ A111-A1128.3B Utilization of External Assistance by Source ( US$ Mn.) .......................................................................... A113-A1148.4A India’s External Debt Outstanding (` Cr.) ................................................................................................. A115-A1168.4B India’s External Debt Outstanding ( US$ Mn.) ........................................................................................... A117-A118
9. Human Development Indicators9.1 Selected Indicators of Human Development for Major States ................................................................... A1199.2 Gross Enrolment Ratio in Classes I-V and VI-VIII and I-VIII ....................................................................... A1209.3 Number of Recognised Educational Institutions in India 2009-10 (Provisional) .......................................... A1219.4 State-wise Literacy Rates (1951-2011) .................................................................................................. A1229.5 State-wise Infant Mortality Rate .............................................................................................................. A1239.6 Access to safe drinking water in Households in India ............................................................................. A1249.7 Population of India (1951-2011) ............................................................................................................... A125
Note :na = not available ; ‘…’ = nil or negligible; P= Provisional ; Q = Quick Estimate; Rs.= Rupee; $=US Dollar; Cr.=Crore; Mn.=Million
Contd....
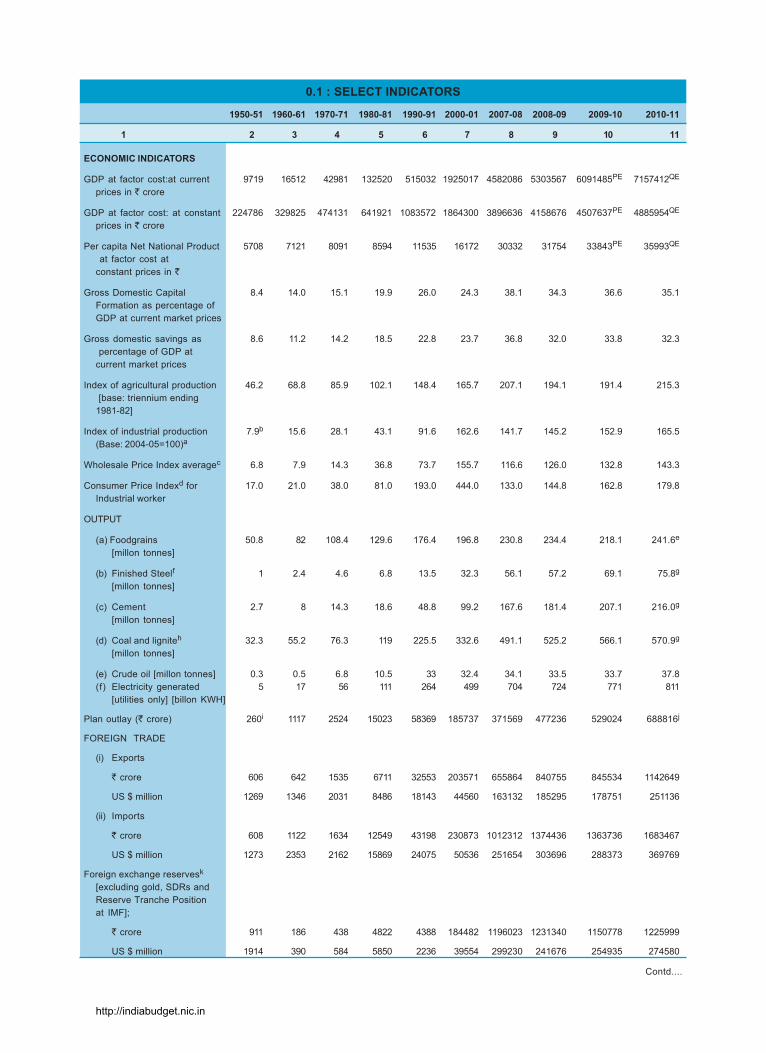
0.1 : SELECT INDICATORS
1950-51 1960-61 1970-71 1980-81 1990-91 2000-01 2007-08 2008-09 2009-10 2010-11
1 2 3 4 5 6 7 8 9 10 11
ECONOMIC INDICATORS
GDP at factor cost:at current 9719 16512 42981 132520 515032 1925017 4582086 5303567 6091485PE 7157412QE
prices in ` crore
GDP at factor cost: at constant 224786 329825 474131 641921 1083572 1864300 3896636 4158676 4507637PE 4885954QE
prices in ` crore
Per capita Net National Product 5708 7121 8091 8594 11535 16172 30332 31754 33843PE 35993QE
at factor cost atconstant prices in `
Gross Domestic Capital 8.4 14.0 15.1 19.9 26.0 24.3 38.1 34.3 36.6 35.1Formation as percentage ofGDP at current market prices
Gross domestic savings as 8.6 11.2 14.2 18.5 22.8 23.7 36.8 32.0 33.8 32.3 percentage of GDP atcurrent market prices
Index of agricultural production 46.2 68.8 85.9 102.1 148.4 165.7 207.1 194.1 191.4 215.3 [base: triennium ending1981-82]
Index of industrial production 7.9b 15.6 28.1 43.1 91.6 162.6 141.7 145.2 152.9 165.5(Base: 2004-05=100)a
Wholesale Price Index averagec 6.8 7.9 14.3 36.8 73.7 155.7 116.6 126.0 132.8 143.3
Consumer Price Indexd for 17.0 21.0 38.0 81.0 193.0 444.0 133.0 144.8 162.8 179.8Industrial worker
OUTPUT
(a) Foodgrains 50.8 82 108.4 129.6 176.4 196.8 230.8 234.4 218.1 241.6e
[millon tonnes]
(b) Finished Steelf 1 2.4 4.6 6.8 13.5 32.3 56.1 57.2 69.1 75.8g
[millon tonnes]
(c) Cement 2.7 8 14.3 18.6 48.8 99.2 167.6 181.4 207.1 216.0g
[millon tonnes]
(d) Coal and ligniteh 32.3 55.2 76.3 119 225.5 332.6 491.1 525.2 566.1 570.9g
[millon tonnes]
(e) Crude oil [millon tonnes] 0.3 0.5 6.8 10.5 33 32.4 34.1 33.5 33.7 37.8(f) Electricity generated 5 17 56 111 264 499 704 724 771 811
[utilities only] [billon KWH]
Plan outlay (` crore) 260i 1117 2524 15023 58369 185737 371569 477236 529024 688816j
FOREIGN TRADE
(i) Exports
` crore 606 642 1535 6711 32553 203571 655864 840755 845534 1142649
US $ million 1269 1346 2031 8486 18143 44560 163132 185295 178751 251136
(ii) Imports
` crore 608 1122 1634 12549 43198 230873 1012312 1374436 1363736 1683467
US $ million 1273 2353 2162 15869 24075 50536 251654 303696 288373 369769
Foreign exchange reservesk
[excluding gold, SDRs andReserve Tranche Positionat IMF];
` crore 911 186 438 4822 4388 184482 1196023 1231340 1150778 1225999
US $ million 1914 390 584 5850 2236 39554 299230 241676 254935 274580
http://indiabudget.nic.in
A—2
A2 Economic Survey 2011-12
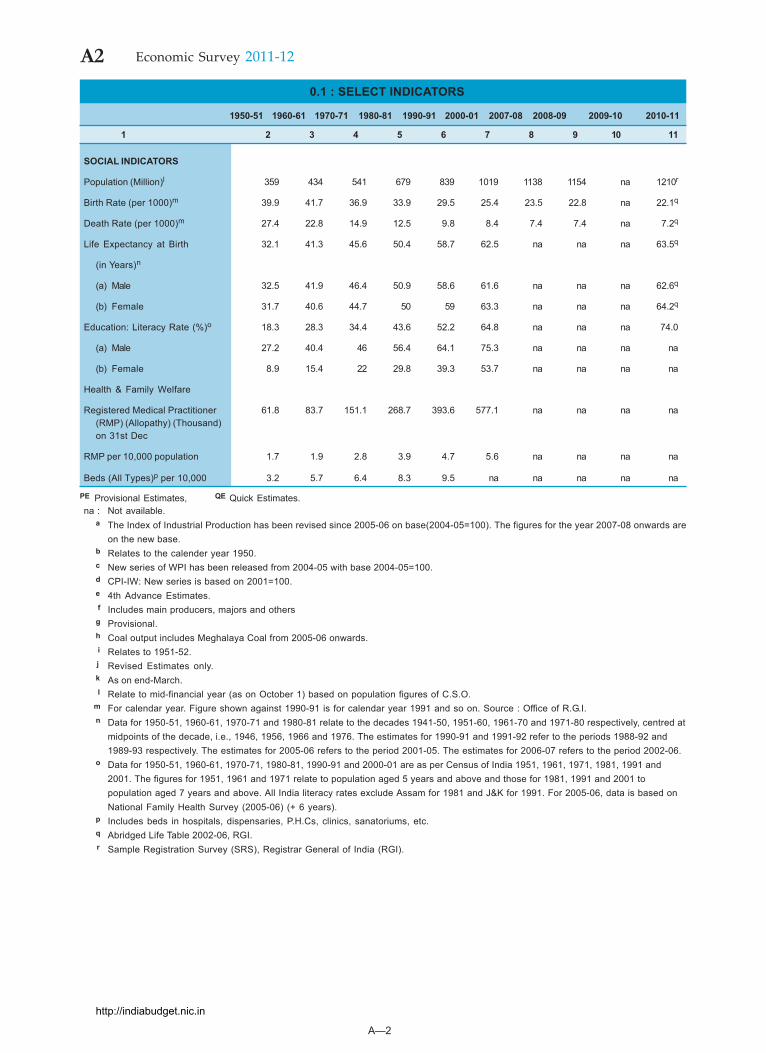
0.1 : SELECT INDICATORS
1950-51 1960-61 1970-71 1980-81 1990-91 2000-01 2007-08 2008-09 2009-10 2010-11
1 2 3 4 5 6 7 8 9 10 11
SOCIAL INDICATORS
Population (Million)l 359 434 541 679 839 1019 1138 1154 na 1210r
Birth Rate (per 1000)m 39.9 41.7 36.9 33.9 29.5 25.4 23.5 22.8 na 22.1q
Death Rate (per 1000)m 27.4 22.8 14.9 12.5 9.8 8.4 7.4 7.4 na 7.2q
Life Expectancy at Birth 32.1 41.3 45.6 50.4 58.7 62.5 na na na 63.5q
(in Years)n
(a) Male 32.5 41.9 46.4 50.9 58.6 61.6 na na na 62.6q
(b) Female 31.7 40.6 44.7 50 59 63.3 na na na 64.2q
Education: Literacy Rate (%)o 18.3 28.3 34.4 43.6 52.2 64.8 na na na 74.0
(a) Male 27.2 40.4 46 56.4 64.1 75.3 na na na na
(b) Female 8.9 15.4 22 29.8 39.3 53.7 na na na na
Health & Family Welfare
Registered Medical Practitioner 61.8 83.7 151.1 268.7 393.6 577.1 na na na na(RMP) (Allopathy) (Thousand)on 31st Dec
RMP per 10,000 population 1.7 1.9 2.8 3.9 4.7 5.6 na na na na
Beds (All Types)p per 10,000 3.2 5.7 6.4 8.3 9.5 na na na na na
PE Provisional Estimates, QE Quick Estimates.na : Not available.
a The Index of Industrial Production has been revised since 2005-06 on base(2004-05=100). The figures for the year 2007-08 onwards areon the new base.
b Relates to the calender year 1950.c New series of WPI has been released from 2004-05 with base 2004-05=100.d CPI-IW: New series is based on 2001=100.e 4th Advance Estimates.f Includes main producers, majors and others
g Provisional.h Coal output includes Meghalaya Coal from 2005-06 onwards.i Relates to 1951-52.j Revised Estimates only.k As on end-March.l Relate to mid-financial year (as on October 1) based on population figures of C.S.O.
m For calendar year. Figure shown against 1990-91 is for calendar year 1991 and so on. Source : Office of R.G.I.n Data for 1950-51, 1960-61, 1970-71 and 1980-81 relate to the decades 1941-50, 1951-60, 1961-70 and 1971-80 respectively, centred at
midpoints of the decade, i.e., 1946, 1956, 1966 and 1976. The estimates for 1990-91 and 1991-92 refer to the periods 1988-92 and1989-93 respectively. The estimates for 2005-06 refers to the period 2001-05. The estimates for 2006-07 refers to the period 2002-06.
o Data for 1950-51, 1960-61, 1970-71, 1980-81, 1990-91 and 2000-01 are as per Census of India 1951, 1961, 1971, 1981, 1991 and2001. The figures for 1951, 1961 and 1971 relate to population aged 5 years and above and those for 1981, 1991 and 2001 topopulation aged 7 years and above. All India literacy rates exclude Assam for 1981 and J&K for 1991. For 2005-06, data is based onNational Family Health Survey (2005-06) (+ 6 years).
p Includes beds in hospitals, dispensaries, P.H.Cs, clinics, sanatoriums, etc.q Abridged Life Table 2002-06, RGI.r Sample Registration Survey (SRS), Registrar General of India (RGI).
http://indiabudget.nic.in
A—3
A3Economic Survey 2011-12
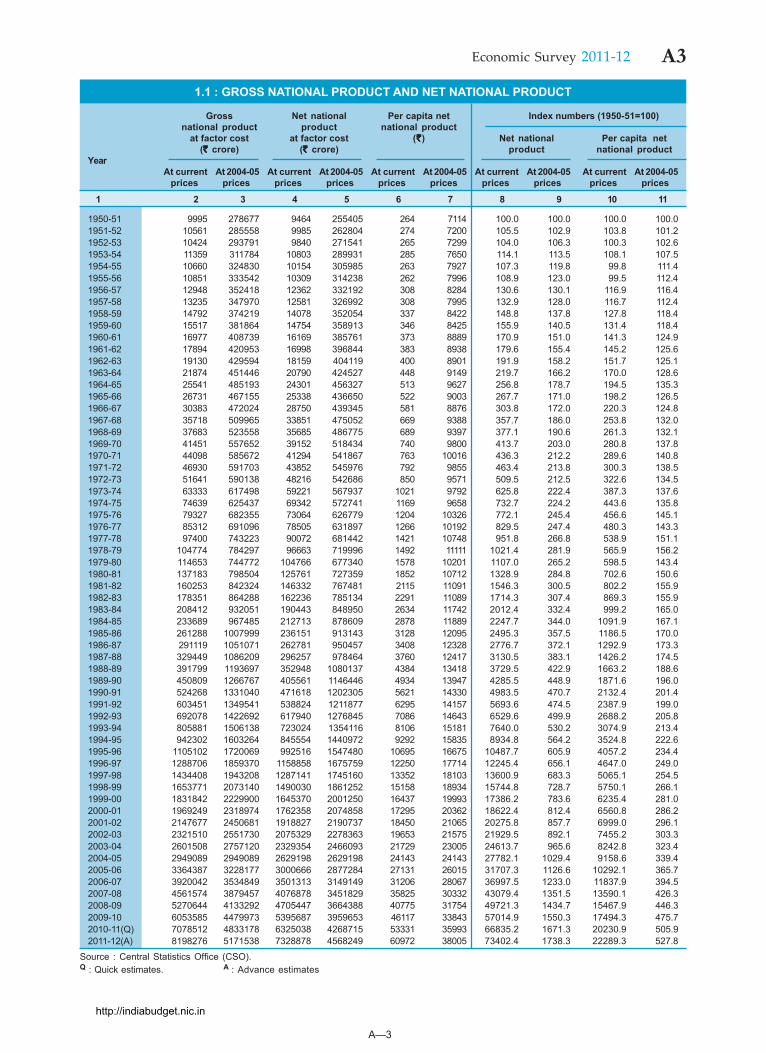
1.1 : GROSS NATIONAL PRODUCT AND NET NATIONAL PRODUCT
Gross Net national Per capita net Index numbers (1950-51=100)national product product national product
at factor cost at factor cost ( `̀̀̀̀) Net national Per capita net(`̀̀̀̀ crore) (`̀̀̀̀ crore) product national product
YearAt current At 2004-05 At current At 2004-05 At current At 2004-05 At current At 2004-05 At current At 2004-05
prices prices prices prices prices prices prices prices prices prices
1 2 3 4 5 6 7 8 9 10 11
1950-51 9995 278677 9464 255405 264 7114 100.0 100.0 100.0 100.01951-52 10561 285558 9985 262804 274 7200 105.5 102.9 103.8 101.21952-53 10424 293791 9840 271541 265 7299 104.0 106.3 100.3 102.61953-54 11359 311784 10803 289931 285 7650 114.1 113.5 108.1 107.51954-55 10660 324830 10154 305985 263 7927 107.3 119.8 99.8 111.41955-56 10851 333542 10309 314238 262 7996 108.9 123.0 99.5 112.41956-57 12948 352418 12362 332192 308 8284 130.6 130.1 116.9 116.41957-58 13235 347970 12581 326992 308 7995 132.9 128.0 116.7 112.41958-59 14792 374219 14078 352054 337 8422 148.8 137.8 127.8 118.41959-60 15517 381864 14754 358913 346 8425 155.9 140.5 131.4 118.41960-61 16977 408739 16169 385761 373 8889 170.9 151.0 141.3 124.91961-62 17894 420953 16998 396844 383 8938 179.6 155.4 145.2 125.61962-63 19130 429594 18159 404119 400 8901 191.9 158.2 151.7 125.11963-64 21874 451446 20790 424527 448 9149 219.7 166.2 170.0 128.61964-65 25541 485193 24301 456327 513 9627 256.8 178.7 194.5 135.31965-66 26731 467155 25338 436650 522 9003 267.7 171.0 198.2 126.51966-67 30383 472024 28750 439345 581 8876 303.8 172.0 220.3 124.81967-68 35718 509965 33851 475052 669 9388 357.7 186.0 253.8 132.01968-69 37683 523558 35685 486775 689 9397 377.1 190.6 261.3 132.11969-70 41451 557652 39152 518434 740 9800 413.7 203.0 280.8 137.81970-71 44098 585672 41294 541867 763 10016 436.3 212.2 289.6 140.81971-72 46930 591703 43852 545976 792 9855 463.4 213.8 300.3 138.51972-73 51641 590138 48216 542686 850 9571 509.5 212.5 322.6 134.51973-74 63333 617498 59221 567937 1021 9792 625.8 222.4 387.3 137.61974-75 74639 625437 69342 572741 1169 9658 732.7 224.2 443.6 135.81975-76 79327 682355 73064 626779 1204 10326 772.1 245.4 456.6 145.11976-77 85312 691096 78505 631897 1266 10192 829.5 247.4 480.3 143.31977-78 97400 743223 90072 681442 1421 10748 951.8 266.8 538.9 151.11978-79 104774 784297 96663 719996 1492 11111 1021.4 281.9 565.9 156.21979-80 114653 744772 104766 677340 1578 10201 1107.0 265.2 598.5 143.41980-81 137183 798504 125761 727359 1852 10712 1328.9 284.8 702.6 150.61981-82 160253 842324 146332 767481 2115 11091 1546.3 300.5 802.2 155.91982-83 178351 864288 162236 785134 2291 11089 1714.3 307.4 869.3 155.91983-84 208412 932051 190443 848950 2634 11742 2012.4 332.4 999.2 165.01984-85 233689 967485 212713 878609 2878 11889 2247.7 344.0 1091.9 167.11985-86 261288 1007999 236151 913143 3128 12095 2495.3 357.5 1186.5 170.01986-87 291119 1051071 262781 950457 3408 12328 2776.7 372.1 1292.9 173.31987-88 329449 1086209 296257 978464 3760 12417 3130.5 383.1 1426.2 174.51988-89 391799 1193697 352948 1080137 4384 13418 3729.5 422.9 1663.2 188.61989-90 450809 1266767 405561 1146446 4934 13947 4285.5 448.9 1871.6 196.01990-91 524268 1331040 471618 1202305 5621 14330 4983.5 470.7 2132.4 201.41991-92 603451 1349541 538824 1211877 6295 14157 5693.6 474.5 2387.9 199.01992-93 692078 1422692 617940 1276845 7086 14643 6529.6 499.9 2688.2 205.81993-94 805881 1506138 723024 1354116 8106 15181 7640.0 530.2 3074.9 213.41994-95 942302 1603264 845554 1440972 9292 15835 8934.8 564.2 3524.8 222.61995-96 1105102 1720069 992516 1547480 10695 16675 10487.7 605.9 4057.2 234.41996-97 1288706 1859370 1158858 1675759 12250 17714 12245.4 656.1 4647.0 249.01997-98 1434408 1943208 1287141 1745160 13352 18103 13600.9 683.3 5065.1 254.51998-99 1653771 2073140 1490030 1861252 15158 18934 15744.8 728.7 5750.1 266.11999-00 1831842 2229900 1645370 2001250 16437 19993 17386.2 783.6 6235.4 281.02000-01 1969249 2318974 1762358 2074858 17295 20362 18622.4 812.4 6560.8 286.22001-02 2147677 2450681 1918827 2190737 18450 21065 20275.8 857.7 6999.0 296.12002-03 2321510 2551730 2075329 2278363 19653 21575 21929.5 892.1 7455.2 303.32003-04 2601508 2757120 2329354 2466093 21729 23005 24613.7 965.6 8242.8 323.42004-05 2949089 2949089 2629198 2629198 24143 24143 27782.1 1029.4 9158.6 339.42005-06 3364387 3228177 3000666 2877284 27131 26015 31707.3 1126.6 10292.1 365.72006-07 3920042 3534849 3501313 3149149 31206 28067 36997.5 1233.0 11837.9 394.52007-08 4561574 3879457 4076878 3451829 35825 30332 43079.4 1351.5 13590.1 426.32008-09 5270644 4133292 4705447 3664388 40775 31754 49721.3 1434.7 15467.9 446.32009-10 6053585 4479973 5395687 3959653 46117 33843 57014.9 1550.3 17494.3 475.72010-11(Q) 7078512 4833178 6325038 4268715 53331 35993 66835.2 1671.3 20230.9 505.92011-12(A) 8198276 5171538 7328878 4568249 60972 38005 73402.4 1738.3 22289.3 527.8
Source : Central Statistics Office (CSO).Q : Quick estimates. A : Advance estimates
http://indiabudget.nic.in
A—4
A4 Economic Survey 2011-12
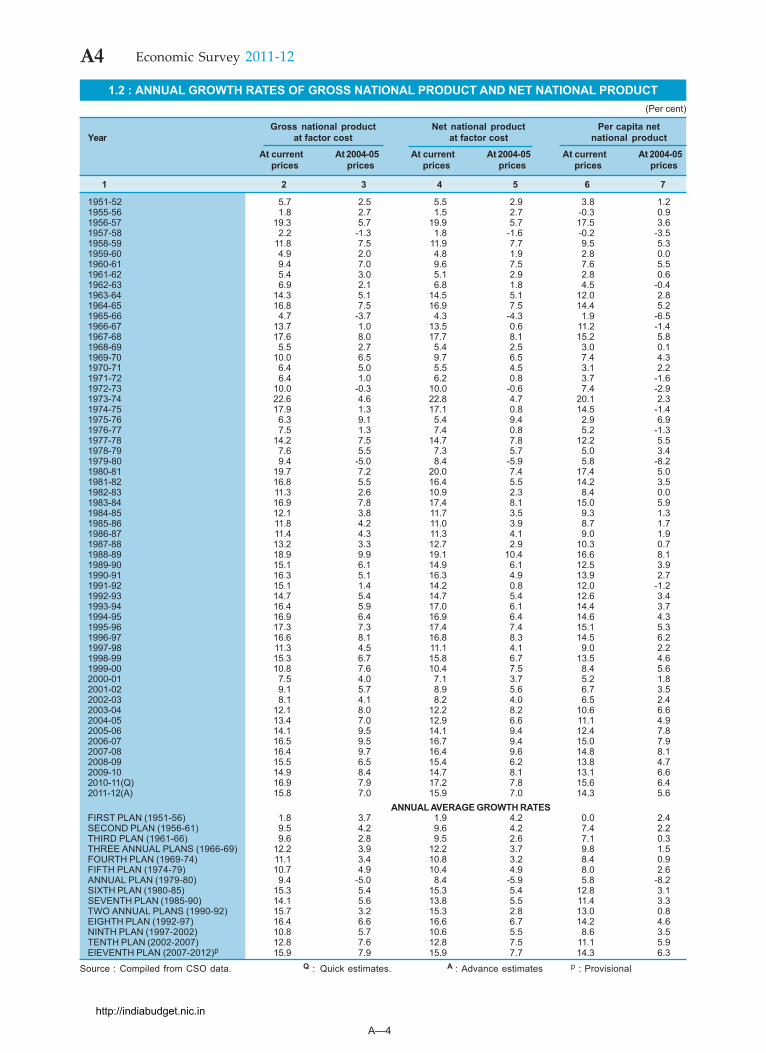
1.2 : ANNUAL GROWTH RATES OF GROSS NATIONAL PRODUCT AND NET NATIONAL PRODUCT(Per cent)
Gross national product Net national product Per capita netYear at factor cost at factor cost national product
At current At 2004-05 At current At 2004-05 At current At 2004-05 prices prices prices prices prices prices
1 2 3 4 5 6 7
1951-52 5.7 2.5 5.5 2.9 3.8 1.21955-56 1.8 2.7 1.5 2.7 -0.3 0.91956-57 19.3 5.7 19.9 5.7 17.5 3.61957-58 2.2 -1.3 1.8 -1.6 -0.2 -3.51958-59 11.8 7.5 11.9 7.7 9.5 5.31959-60 4.9 2.0 4.8 1.9 2.8 0.01960-61 9.4 7.0 9.6 7.5 7.6 5.51961-62 5.4 3.0 5.1 2.9 2.8 0.61962-63 6.9 2.1 6.8 1.8 4.5 -0.41963-64 14.3 5.1 14.5 5.1 12.0 2.81964-65 16.8 7.5 16.9 7.5 14.4 5.21965-66 4.7 -3.7 4.3 -4.3 1.9 -6.51966-67 13.7 1.0 13.5 0.6 11.2 -1.41967-68 17.6 8.0 17.7 8.1 15.2 5.81968-69 5.5 2.7 5.4 2.5 3.0 0.11969-70 10.0 6.5 9.7 6.5 7.4 4.31970-71 6.4 5.0 5.5 4.5 3.1 2.21971-72 6.4 1.0 6.2 0.8 3.7 -1.61972-73 10.0 -0.3 10.0 -0.6 7.4 -2.91973-74 22.6 4.6 22.8 4.7 20.1 2.31974-75 17.9 1.3 17.1 0.8 14.5 -1.41975-76 6.3 9.1 5.4 9.4 2.9 6.91976-77 7.5 1.3 7.4 0.8 5.2 -1.31977-78 14.2 7.5 14.7 7.8 12.2 5.51978-79 7.6 5.5 7.3 5.7 5.0 3.41979-80 9.4 -5.0 8.4 -5.9 5.8 -8.21980-81 19.7 7.2 20.0 7.4 17.4 5.01981-82 16.8 5.5 16.4 5.5 14.2 3.51982-83 11.3 2.6 10.9 2.3 8.4 0.01983-84 16.9 7.8 17.4 8.1 15.0 5.91984-85 12.1 3.8 11.7 3.5 9.3 1.31985-86 11.8 4.2 11.0 3.9 8.7 1.71986-87 11.4 4.3 11.3 4.1 9.0 1.91987-88 13.2 3.3 12.7 2.9 10.3 0.71988-89 18.9 9.9 19.1 10.4 16.6 8.11989-90 15.1 6.1 14.9 6.1 12.5 3.91990-91 16.3 5.1 16.3 4.9 13.9 2.71991-92 15.1 1.4 14.2 0.8 12.0 -1.21992-93 14.7 5.4 14.7 5.4 12.6 3.41993-94 16.4 5.9 17.0 6.1 14.4 3.71994-95 16.9 6.4 16.9 6.4 14.6 4.31995-96 17.3 7.3 17.4 7.4 15.1 5.31996-97 16.6 8.1 16.8 8.3 14.5 6.21997-98 11.3 4.5 11.1 4.1 9.0 2.21998-99 15.3 6.7 15.8 6.7 13.5 4.61999-00 10.8 7.6 10.4 7.5 8.4 5.62000-01 7.5 4.0 7.1 3.7 5.2 1.82001-02 9.1 5.7 8.9 5.6 6.7 3.52002-03 8.1 4.1 8.2 4.0 6.5 2.42003-04 12.1 8.0 12.2 8.2 10.6 6.62004-05 13.4 7.0 12.9 6.6 11.1 4.92005-06 14.1 9.5 14.1 9.4 12.4 7.82006-07 16.5 9.5 16.7 9.4 15.0 7.92007-08 16.4 9.7 16.4 9.6 14.8 8.12008-09 15.5 6.5 15.4 6.2 13.8 4.72009-10 14.9 8.4 14.7 8.1 13.1 6.62010-11(Q) 16.9 7.9 17.2 7.8 15.6 6.42011-12(A) 15.8 7.0 15.9 7.0 14.3 5.6
ANNUAL AVERAGE GROWTH RATESFIRST PLAN (1951-56) 1.8 3.7 1.9 4.2 0.0 2.4SECOND PLAN (1956-61) 9.5 4.2 9.6 4.2 7.4 2.2THIRD PLAN (1961-66) 9.6 2.8 9.5 2.6 7.1 0.3THREE ANNUAL PLANS (1966-69) 12.2 3.9 12.2 3.7 9.8 1.5FOURTH PLAN (1969-74) 11.1 3.4 10.8 3.2 8.4 0.9FIFTH PLAN (1974-79) 10.7 4.9 10.4 4.9 8.0 2.6ANNUAL PLAN (1979-80) 9.4 -5.0 8.4 -5.9 5.8 -8.2SIXTH PLAN (1980-85) 15.3 5.4 15.3 5.4 12.8 3.1SEVENTH PLAN (1985-90) 14.1 5.6 13.8 5.5 11.4 3.3TWO ANNUAL PLANS (1990-92) 15.7 3.2 15.3 2.8 13.0 0.8EIGHTH PLAN (1992-97) 16.4 6.6 16.6 6.7 14.2 4.6NINTH PLAN (1997-2002) 10.8 5.7 10.6 5.5 8.6 3.5TENTH PLAN (2002-2007) 12.8 7.6 12.8 7.5 11.1 5.9ElEVENTH PLAN (2007-2012)p 15.9 7.9 15.9 7.7 14.3 6.3
Source : Compiled from CSO data. Q : Quick estimates. A : Advance estimates p : Provisional
http://indiabudget.nic.in
A—5
A5Economic Survey 2011-12
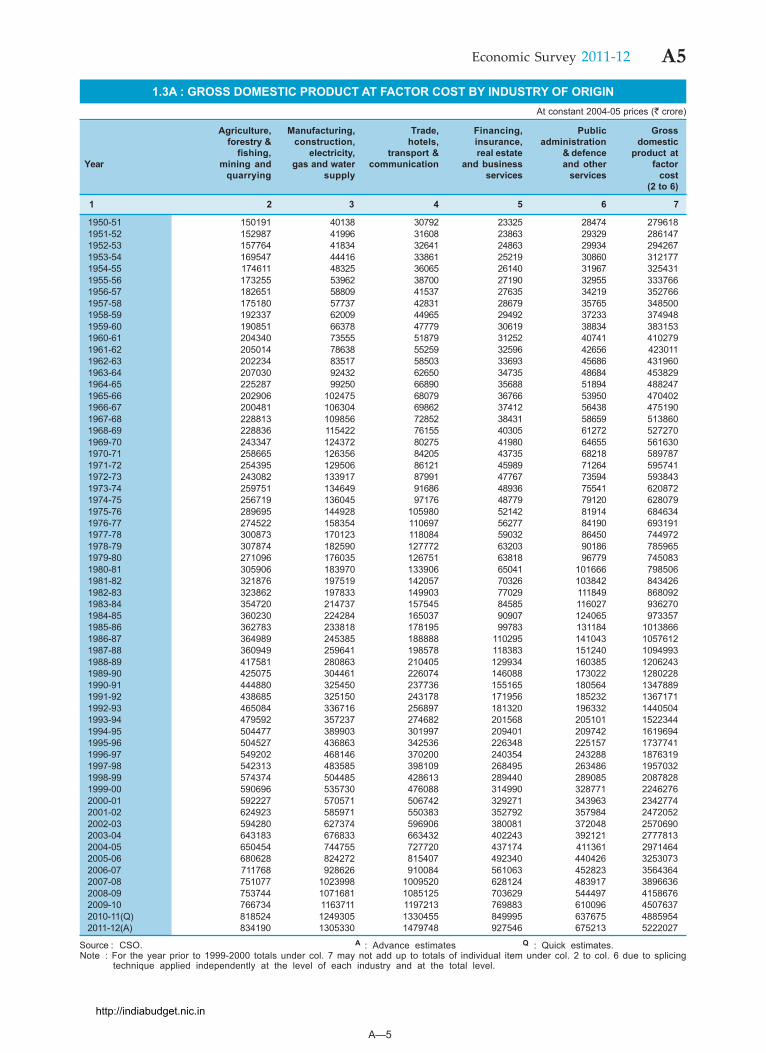
1.3A : GROSS DOMESTIC PRODUCT AT FACTOR COST BY INDUSTRY OF ORIGINAt constant 2004-05 prices (` crore)
Agriculture, Manufacturing, Trade, Financing, Public Grossforestry & construction, hotels, insurance, administration domestic
fishing, electricity, transport & real estate & defence product atYear mining and gas and water communication and business and other factor
quarrying supply services services cost(2 to 6)
1 2 3 4 5 6 7
1950-51 150191 40138 30792 23325 28474 2796181951-52 152987 41996 31608 23863 29329 2861471952-53 157764 41834 32641 24863 29934 2942671953-54 169547 44416 33861 25219 30860 3121771954-55 174611 48325 36065 26140 31967 3254311955-56 173255 53962 38700 27190 32955 3337661956-57 182651 58809 41537 27635 34219 3527661957-58 175180 57737 42831 28679 35765 3485001958-59 192337 62009 44965 29492 37233 3749481959-60 190851 66378 47779 30619 38834 3831531960-61 204340 73555 51879 31252 40741 4102791961-62 205014 78638 55259 32596 42656 4230111962-63 202234 83517 58503 33693 45686 4319601963-64 207030 92432 62650 34735 48684 4538291964-65 225287 99250 66890 35688 51894 4882471965-66 202906 102475 68079 36766 53950 4704021966-67 200481 106304 69862 37412 56438 4751901967-68 228813 109856 72852 38431 58659 5138601968-69 228836 115422 76155 40305 61272 5272701969-70 243347 124372 80275 41980 64655 5616301970-71 258665 126356 84205 43735 68218 5897871971-72 254395 129506 86121 45989 71264 5957411972-73 243082 133917 87991 47767 73594 5938431973-74 259751 134649 91686 48936 75541 6208721974-75 256719 136045 97176 48779 79120 6280791975-76 289695 144928 105980 52142 81914 6846341976-77 274522 158354 110697 56277 84190 6931911977-78 300873 170123 118084 59032 86450 7449721978-79 307874 182590 127772 63203 90186 7859651979-80 271096 176035 126751 63818 96779 7450831980-81 305906 183970 133906 65041 101666 7985061981-82 321876 197519 142057 70326 103842 8434261982-83 323862 197833 149903 77029 111849 8680921983-84 354720 214737 157545 84585 116027 9362701984-85 360230 224284 165037 90907 124065 9733571985-86 362783 233818 178195 99783 131184 10138661986-87 364989 245385 188888 110295 141043 10576121987-88 360949 259641 198578 118383 151240 10949931988-89 417581 280863 210405 129934 160385 12062431989-90 425075 304461 226074 146088 173022 12802281990-91 444880 325450 237736 155165 180564 13478891991-92 438685 325150 243178 171956 185232 13671711992-93 465084 336716 256897 181320 196332 14405041993-94 479592 357237 274682 201568 205101 15223441994-95 504477 389903 301997 209401 209742 16196941995-96 504527 436863 342536 226348 225157 17377411996-97 549202 468146 370200 240354 243288 18763191997-98 542313 483585 398109 268495 263486 19570321998-99 574374 504485 428613 289440 289085 20878281999-00 590696 535730 476088 314990 328771 22462762000-01 592227 570571 506742 329271 343963 23427742001-02 624923 585971 550383 352792 357984 24720522002-03 594280 627374 596906 380081 372048 25706902003-04 643183 676833 663432 402243 392121 27778132004-05 650454 744755 727720 437174 411361 29714642005-06 680628 824272 815407 492340 440426 32530732006-07 711768 928626 910084 561063 452823 35643642007-08 751077 1023998 1009520 628124 483917 38966362008-09 753744 1071681 1085125 703629 544497 41586762009-10 766734 1163711 1197213 769883 610096 45076372010-11(Q) 818524 1249305 1330455 849995 637675 48859542011-12(A) 834190 1305330 1479748 927546 675213 5222027
Source : CSO. A : Advance estimates Q : Quick estimates.Note : For the year prior to 1999-2000 totals under col. 7 may not add up to totals of individual item under col. 2 to col. 6 due to splicing
technique applied independently at the level of each industry and at the total level.
http://indiabudget.nic.in
A—6
A6 Economic Survey 2011-12
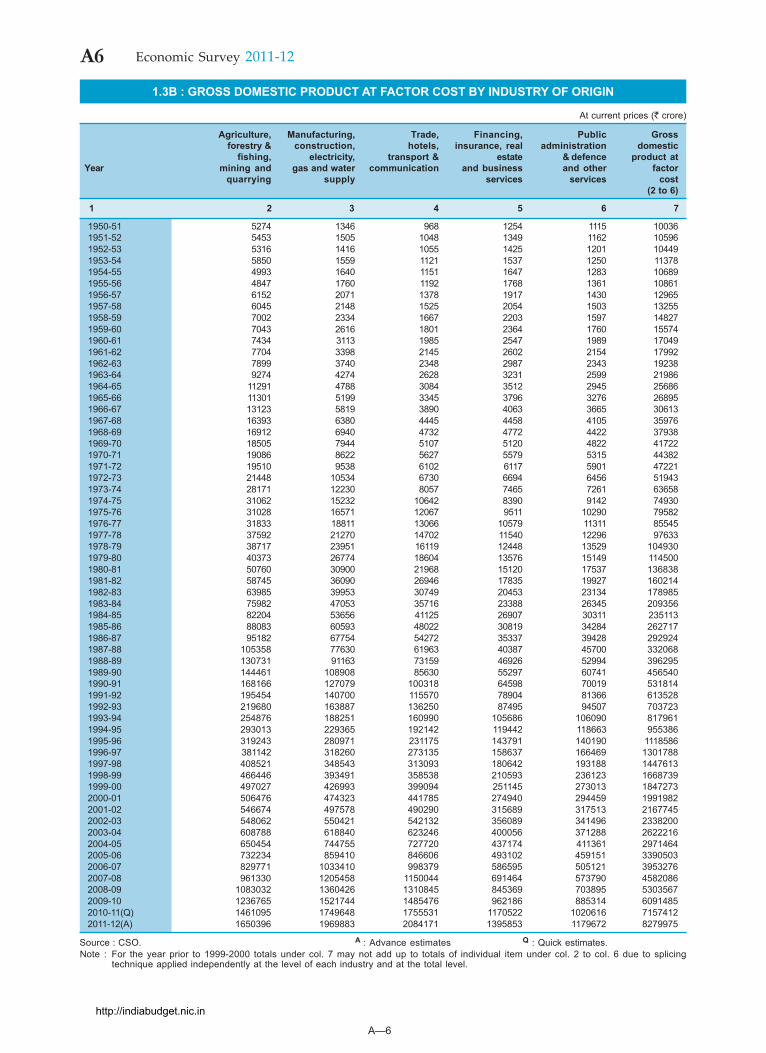
1.3B : GROSS DOMESTIC PRODUCT AT FACTOR COST BY INDUSTRY OF ORIGIN
At current prices (` crore)
Agriculture, Manufacturing, Trade, Financing, Public Grossforestry & construction, hotels, insurance, real administration domestic
fishing, electricity, transport & estate & defence product atYear mining and gas and water communication and business and other factor
quarrying supply services services cost(2 to 6)
1 2 3 4 5 6 7
1950-51 5274 1346 968 1254 1115 100361951-52 5453 1505 1048 1349 1162 105961952-53 5316 1416 1055 1425 1201 104491953-54 5850 1559 1121 1537 1250 113781954-55 4993 1640 1151 1647 1283 106891955-56 4847 1760 1192 1768 1361 108611956-57 6152 2071 1378 1917 1430 129651957-58 6045 2148 1525 2054 1503 132551958-59 7002 2334 1667 2203 1597 148271959-60 7043 2616 1801 2364 1760 155741960-61 7434 3113 1985 2547 1989 170491961-62 7704 3398 2145 2602 2154 179921962-63 7899 3740 2348 2987 2343 192381963-64 9274 4274 2628 3231 2599 219861964-65 11291 4788 3084 3512 2945 256861965-66 11301 5199 3345 3796 3276 268951966-67 13123 5819 3890 4063 3665 306131967-68 16393 6380 4445 4458 4105 359761968-69 16912 6940 4732 4772 4422 379381969-70 18505 7944 5107 5120 4822 417221970-71 19086 8622 5627 5579 5315 443821971-72 19510 9538 6102 6117 5901 472211972-73 21448 10534 6730 6694 6456 519431973-74 28171 12230 8057 7465 7261 636581974-75 31062 15232 10642 8390 9142 749301975-76 31028 16571 12067 9511 10290 795821976-77 31833 18811 13066 10579 11311 855451977-78 37592 21270 14702 11540 12296 976331978-79 38717 23951 16119 12448 13529 1049301979-80 40373 26774 18604 13576 15149 1145001980-81 50760 30900 21968 15120 17537 1368381981-82 58745 36090 26946 17835 19927 1602141982-83 63985 39953 30749 20453 23134 1789851983-84 75982 47053 35716 23388 26345 2093561984-85 82204 53656 41125 26907 30311 2351131985-86 88083 60593 48022 30819 34284 2627171986-87 95182 67754 54272 35337 39428 2929241987-88 105358 77630 61963 40387 45700 3320681988-89 130731 91163 73159 46926 52994 3962951989-90 144461 108908 85630 55297 60741 4565401990-91 168166 127079 100318 64598 70019 5318141991-92 195454 140700 115570 78904 81366 6135281992-93 219680 163887 136250 87495 94507 7037231993-94 254876 188251 160990 105686 106090 8179611994-95 293013 229365 192142 119442 118663 9553861995-96 319243 280971 231175 143791 140190 11185861996-97 381142 318260 273135 158637 166469 13017881997-98 408521 348543 313093 180642 193188 14476131998-99 466446 393491 358538 210593 236123 16687391999-00 497027 426993 399094 251145 273013 18472732000-01 506476 474323 441785 274940 294459 19919822001-02 546674 497578 490290 315689 317513 21677452002-03 548062 550421 542132 356089 341496 23382002003-04 608788 618840 623246 400056 371288 26222162004-05 650454 744755 727720 437174 411361 29714642005-06 732234 859410 846606 493102 459151 33905032006-07 829771 1033410 998379 586595 505121 39532762007-08 961330 1205458 1150044 691464 573790 45820862008-09 1083032 1360426 1310845 845369 703895 53035672009-10 1236765 1521744 1485476 962186 885314 60914852010-11(Q) 1461095 1749648 1755531 1170522 1020616 71574122011-12(A) 1650396 1969883 2084171 1395853 1179672 8279975
Source : CSO. A : Advance estimates Q : Quick estimates.Note : For the year prior to 1999-2000 totals under col. 7 may not add up to totals of individual item under col. 2 to col. 6 due to splicing
technique applied independently at the level of each industry and at the total level.
http://indiabudget.nic.in
A—7
A7Economic Survey 2011-12
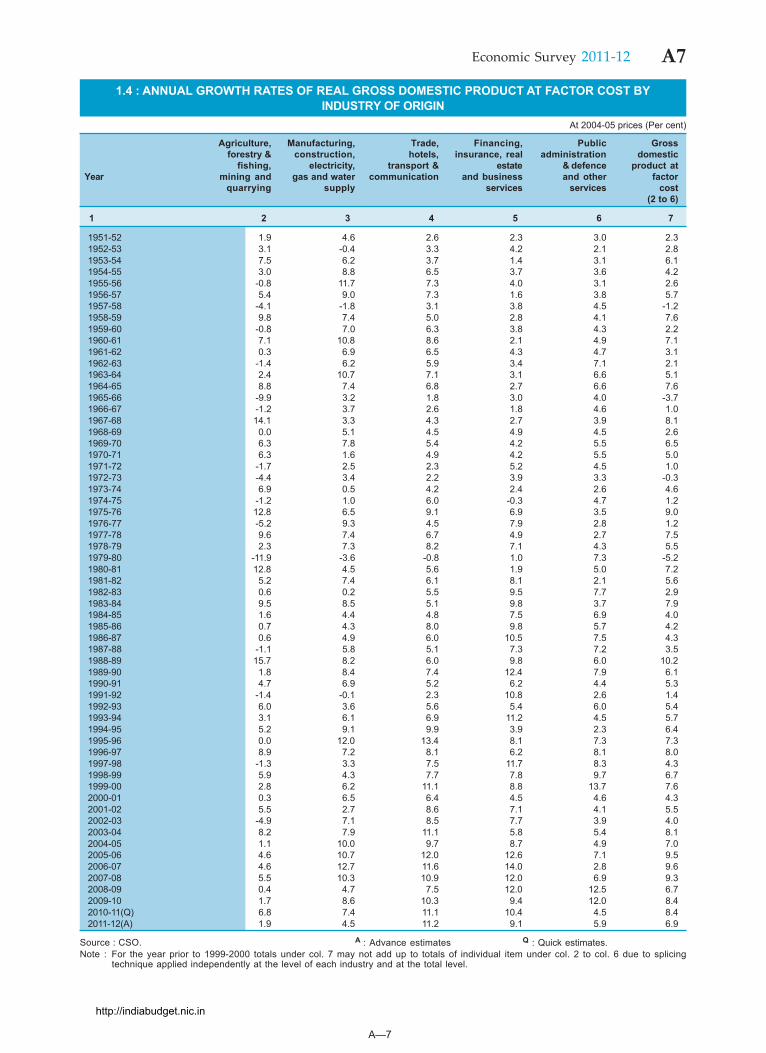
1.4 : ANNUAL GROWTH RATES OF REAL GROSS DOMESTIC PRODUCT AT FACTOR COST BYINDUSTRY OF ORIGIN
At 2004-05 prices (Per cent)
Agriculture, Manufacturing, Trade, Financing, Public Grossforestry & construction, hotels, insurance, real administration domestic
fishing, electricity, transport & estate & defence product atYear mining and gas and water communication and business and other factor
quarrying supply services services cost(2 to 6)
1 2 3 4 5 6 7
1951-52 1.9 4.6 2.6 2.3 3.0 2.31952-53 3.1 -0.4 3.3 4.2 2.1 2.81953-54 7.5 6.2 3.7 1.4 3.1 6.11954-55 3.0 8.8 6.5 3.7 3.6 4.21955-56 -0.8 11.7 7.3 4.0 3.1 2.61956-57 5.4 9.0 7.3 1.6 3.8 5.71957-58 -4.1 -1.8 3.1 3.8 4.5 -1.21958-59 9.8 7.4 5.0 2.8 4.1 7.61959-60 -0.8 7.0 6.3 3.8 4.3 2.21960-61 7.1 10.8 8.6 2.1 4.9 7.11961-62 0.3 6.9 6.5 4.3 4.7 3.11962-63 -1.4 6.2 5.9 3.4 7.1 2.11963-64 2.4 10.7 7.1 3.1 6.6 5.11964-65 8.8 7.4 6.8 2.7 6.6 7.61965-66 -9.9 3.2 1.8 3.0 4.0 -3.71966-67 -1.2 3.7 2.6 1.8 4.6 1.01967-68 14.1 3.3 4.3 2.7 3.9 8.11968-69 0.0 5.1 4.5 4.9 4.5 2.61969-70 6.3 7.8 5.4 4.2 5.5 6.51970-71 6.3 1.6 4.9 4.2 5.5 5.01971-72 -1.7 2.5 2.3 5.2 4.5 1.01972-73 -4.4 3.4 2.2 3.9 3.3 -0.31973-74 6.9 0.5 4.2 2.4 2.6 4.61974-75 -1.2 1.0 6.0 -0.3 4.7 1.21975-76 12.8 6.5 9.1 6.9 3.5 9.01976-77 -5.2 9.3 4.5 7.9 2.8 1.21977-78 9.6 7.4 6.7 4.9 2.7 7.51978-79 2.3 7.3 8.2 7.1 4.3 5.51979-80 -11.9 -3.6 -0.8 1.0 7.3 -5.21980-81 12.8 4.5 5.6 1.9 5.0 7.21981-82 5.2 7.4 6.1 8.1 2.1 5.61982-83 0.6 0.2 5.5 9.5 7.7 2.91983-84 9.5 8.5 5.1 9.8 3.7 7.91984-85 1.6 4.4 4.8 7.5 6.9 4.01985-86 0.7 4.3 8.0 9.8 5.7 4.21986-87 0.6 4.9 6.0 10.5 7.5 4.31987-88 -1.1 5.8 5.1 7.3 7.2 3.51988-89 15.7 8.2 6.0 9.8 6.0 10.21989-90 1.8 8.4 7.4 12.4 7.9 6.11990-91 4.7 6.9 5.2 6.2 4.4 5.31991-92 -1.4 -0.1 2.3 10.8 2.6 1.41992-93 6.0 3.6 5.6 5.4 6.0 5.41993-94 3.1 6.1 6.9 11.2 4.5 5.71994-95 5.2 9.1 9.9 3.9 2.3 6.41995-96 0.0 12.0 13.4 8.1 7.3 7.31996-97 8.9 7.2 8.1 6.2 8.1 8.01997-98 -1.3 3.3 7.5 11.7 8.3 4.31998-99 5.9 4.3 7.7 7.8 9.7 6.71999-00 2.8 6.2 11.1 8.8 13.7 7.62000-01 0.3 6.5 6.4 4.5 4.6 4.32001-02 5.5 2.7 8.6 7.1 4.1 5.52002-03 -4.9 7.1 8.5 7.7 3.9 4.02003-04 8.2 7.9 11.1 5.8 5.4 8.12004-05 1.1 10.0 9.7 8.7 4.9 7.02005-06 4.6 10.7 12.0 12.6 7.1 9.52006-07 4.6 12.7 11.6 14.0 2.8 9.62007-08 5.5 10.3 10.9 12.0 6.9 9.32008-09 0.4 4.7 7.5 12.0 12.5 6.72009-10 1.7 8.6 10.3 9.4 12.0 8.42010-11(Q) 6.8 7.4 11.1 10.4 4.5 8.42011-12(A) 1.9 4.5 11.2 9.1 5.9 6.9
Source : CSO. A : Advance estimates Q : Quick estimates.Note : For the year prior to 1999-2000 totals under col. 7 may not add up to totals of individual item under col. 2 to col. 6 due to splicing
technique applied independently at the level of each industry and at the total level.
http://indiabudget.nic.in
A—8
A8 Economic Survey 2011-12
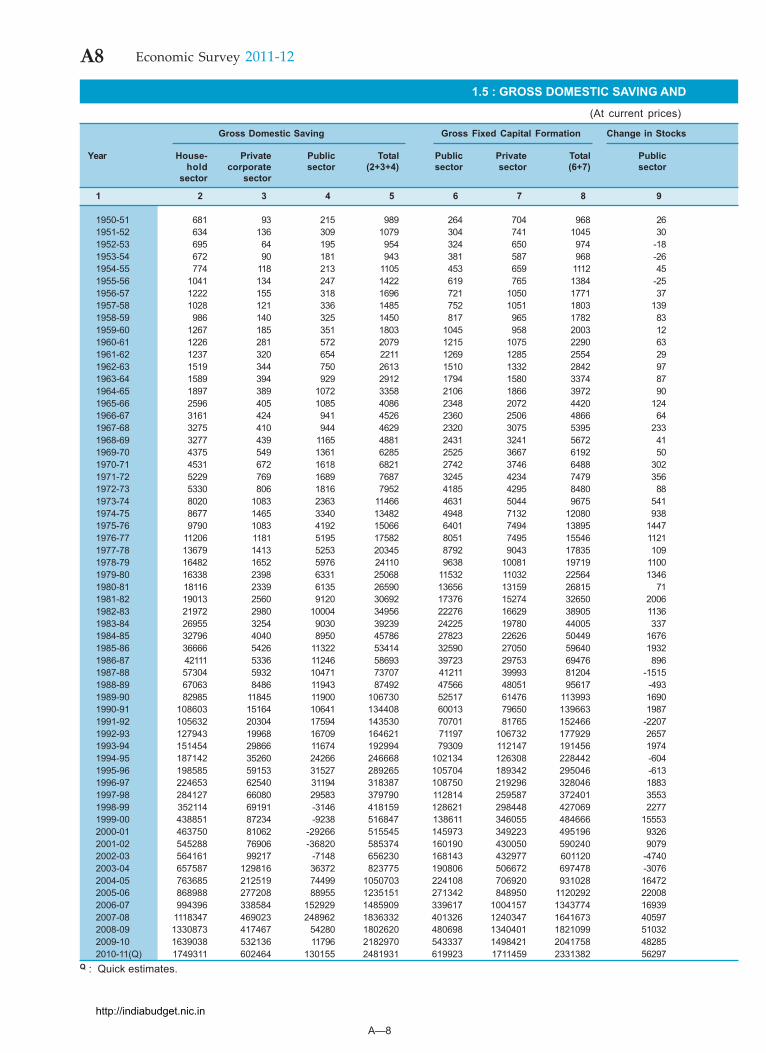
1.5 : GROSS DOMESTIC SAVING AND
(At current prices)
Gross Domestic Saving Gross Fixed Capital Formation Change in Stocks
Year House- Private Public Total Public Private Total Publichold corporate sector (2+3+4) sector sector (6+7) sector
sector sector
1 2 3 4 5 6 7 8 9
1950-51 681 93 215 989 264 704 968 261951-52 634 136 309 1079 304 741 1045 301952-53 695 64 195 954 324 650 974 -181953-54 672 90 181 943 381 587 968 -261954-55 774 118 213 1105 453 659 1112 451955-56 1041 134 247 1422 619 765 1384 -251956-57 1222 155 318 1696 721 1050 1771 371957-58 1028 121 336 1485 752 1051 1803 1391958-59 986 140 325 1450 817 965 1782 831959-60 1267 185 351 1803 1045 958 2003 121960-61 1226 281 572 2079 1215 1075 2290 631961-62 1237 320 654 2211 1269 1285 2554 291962-63 1519 344 750 2613 1510 1332 2842 971963-64 1589 394 929 2912 1794 1580 3374 871964-65 1897 389 1072 3358 2106 1866 3972 901965-66 2596 405 1085 4086 2348 2072 4420 1241966-67 3161 424 941 4526 2360 2506 4866 641967-68 3275 410 944 4629 2320 3075 5395 2331968-69 3277 439 1165 4881 2431 3241 5672 411969-70 4375 549 1361 6285 2525 3667 6192 501970-71 4531 672 1618 6821 2742 3746 6488 3021971-72 5229 769 1689 7687 3245 4234 7479 3561972-73 5330 806 1816 7952 4185 4295 8480 881973-74 8020 1083 2363 11466 4631 5044 9675 5411974-75 8677 1465 3340 13482 4948 7132 12080 9381975-76 9790 1083 4192 15066 6401 7494 13895 14471976-77 11206 1181 5195 17582 8051 7495 15546 11211977-78 13679 1413 5253 20345 8792 9043 17835 1091978-79 16482 1652 5976 24110 9638 10081 19719 11001979-80 16338 2398 6331 25068 11532 11032 22564 13461980-81 18116 2339 6135 26590 13656 13159 26815 711981-82 19013 2560 9120 30692 17376 15274 32650 20061982-83 21972 2980 10004 34956 22276 16629 38905 11361983-84 26955 3254 9030 39239 24225 19780 44005 3371984-85 32796 4040 8950 45786 27823 22626 50449 16761985-86 36666 5426 11322 53414 32590 27050 59640 19321986-87 42111 5336 11246 58693 39723 29753 69476 8961987-88 57304 5932 10471 73707 41211 39993 81204 -15151988-89 67063 8486 11943 87492 47566 48051 95617 -4931989-90 82985 11845 11900 106730 52517 61476 113993 16901990-91 108603 15164 10641 134408 60013 79650 139663 19871991-92 105632 20304 17594 143530 70701 81765 152466 -22071992-93 127943 19968 16709 164621 71197 106732 177929 26571993-94 151454 29866 11674 192994 79309 112147 191456 19741994-95 187142 35260 24266 246668 102134 126308 228442 -6041995-96 198585 59153 31527 289265 105704 189342 295046 -6131996-97 224653 62540 31194 318387 108750 219296 328046 18831997-98 284127 66080 29583 379790 112814 259587 372401 35531998-99 352114 69191 -3146 418159 128621 298448 427069 22771999-00 438851 87234 -9238 516847 138611 346055 484666 155532000-01 463750 81062 -29266 515545 145973 349223 495196 93262001-02 545288 76906 -36820 585374 160190 430050 590240 90792002-03 564161 99217 -7148 656230 168143 432977 601120 -47402003-04 657587 129816 36372 823775 190806 506672 697478 -30762004-05 763685 212519 74499 1050703 224108 706920 931028 164722005-06 868988 277208 88955 1235151 271342 848950 1120292 220082006-07 994396 338584 152929 1485909 339617 1004157 1343774 169392007-08 1118347 469023 248962 1836332 401326 1240347 1641673 405972008-09 1330873 417467 54280 1802620 480698 1340401 1821099 510322009-10 1639038 532136 11796 2182970 543337 1498421 2041758 482852010-11(Q) 1749311 602464 130155 2481931 619923 1711459 2331382 56297
Q : Quick estimates.
http://indiabudget.nic.in
A—9
A9Economic Survey 2011-12
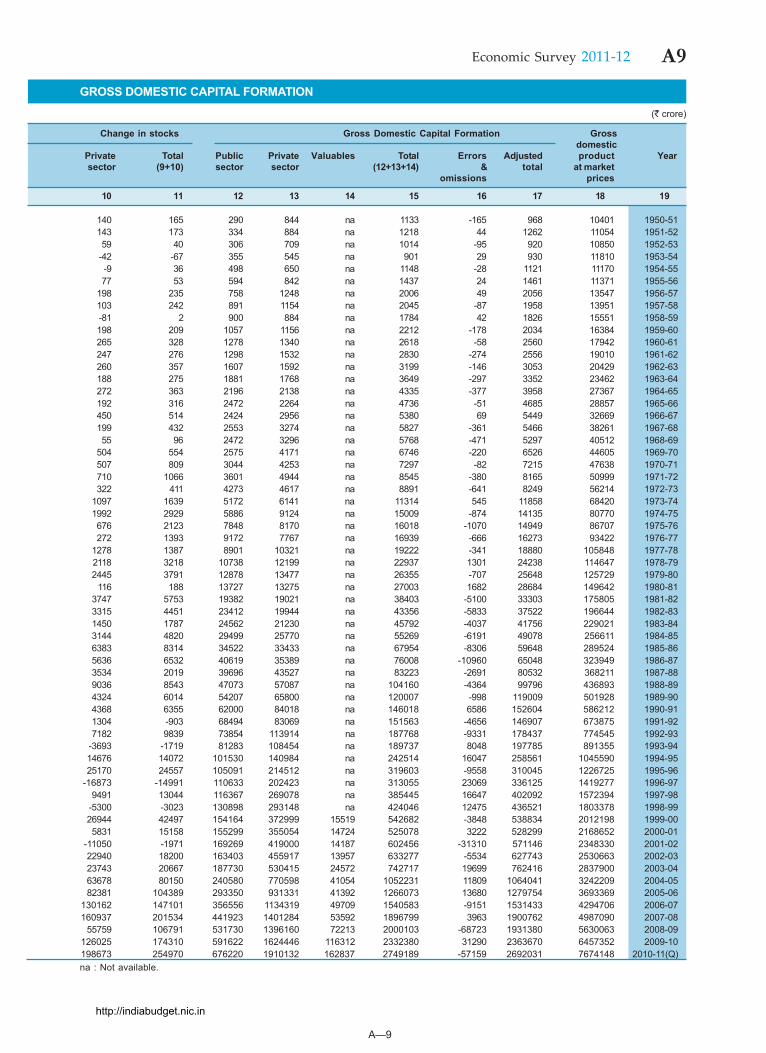
GROSS DOMESTIC CAPITAL FORMATION
(` crore)
Change in stocks Gross Domestic Capital Formation Grossdomestic
Private Total Public Private Valuables Total Errors Adjusted product Yearsector (9+10) sector sector (12+13+14) & total at market
omissions prices
10 11 12 13 14 15 16 17 18 19
140 165 290 844 na 1133 -165 968 10401 1950-51143 173 334 884 na 1218 44 1262 11054 1951-5259 40 306 709 na 1014 -95 920 10850 1952-53
-42 -67 355 545 na 901 29 930 11810 1953-54-9 36 498 650 na 1148 -28 1121 11170 1954-5577 53 594 842 na 1437 24 1461 11371 1955-56
198 235 758 1248 na 2006 49 2056 13547 1956-57103 242 891 1154 na 2045 -87 1958 13951 1957-58-81 2 900 884 na 1784 42 1826 15551 1958-59198 209 1057 1156 na 2212 -178 2034 16384 1959-60265 328 1278 1340 na 2618 -58 2560 17942 1960-61247 276 1298 1532 na 2830 -274 2556 19010 1961-62260 357 1607 1592 na 3199 -146 3053 20429 1962-63188 275 1881 1768 na 3649 -297 3352 23462 1963-64272 363 2196 2138 na 4335 -377 3958 27367 1964-65192 316 2472 2264 na 4736 -51 4685 28857 1965-66450 514 2424 2956 na 5380 69 5449 32669 1966-67199 432 2553 3274 na 5827 -361 5466 38261 1967-6855 96 2472 3296 na 5768 -471 5297 40512 1968-69
504 554 2575 4171 na 6746 -220 6526 44605 1969-70507 809 3044 4253 na 7297 -82 7215 47638 1970-71710 1066 3601 4944 na 8545 -380 8165 50999 1971-72322 411 4273 4617 na 8891 -641 8249 56214 1972-73
1097 1639 5172 6141 na 11314 545 11858 68420 1973-741992 2929 5886 9124 na 15009 -874 14135 80770 1974-75676 2123 7848 8170 na 16018 -1070 14949 86707 1975-76272 1393 9172 7767 na 16939 -666 16273 93422 1976-77
1278 1387 8901 10321 na 19222 -341 18880 105848 1977-782118 3218 10738 12199 na 22937 1301 24238 114647 1978-792445 3791 12878 13477 na 26355 -707 25648 125729 1979-80
116 188 13727 13275 na 27003 1682 28684 149642 1980-813747 5753 19382 19021 na 38403 -5100 33303 175805 1981-823315 4451 23412 19944 na 43356 -5833 37522 196644 1982-831450 1787 24562 21230 na 45792 -4037 41756 229021 1983-843144 4820 29499 25770 na 55269 -6191 49078 256611 1984-856383 8314 34522 33433 na 67954 -8306 59648 289524 1985-865636 6532 40619 35389 na 76008 -10960 65048 323949 1986-873534 2019 39696 43527 na 83223 -2691 80532 368211 1987-889036 8543 47073 57087 na 104160 -4364 99796 436893 1988-894324 6014 54207 65800 na 120007 -998 119009 501928 1989-904368 6355 62000 84018 na 146018 6586 152604 586212 1990-911304 -903 68494 83069 na 151563 -4656 146907 673875 1991-927182 9839 73854 113914 na 187768 -9331 178437 774545 1992-93
-3693 -1719 81283 108454 na 189737 8048 197785 891355 1993-9414676 14072 101530 140984 na 242514 16047 258561 1045590 1994-9525170 24557 105091 214512 na 319603 -9558 310045 1226725 1995-96
-16873 -14991 110633 202423 na 313055 23069 336125 1419277 1996-979491 13044 116367 269078 na 385445 16647 402092 1572394 1997-98
-5300 -3023 130898 293148 na 424046 12475 436521 1803378 1998-9926944 42497 154164 372999 15519 542682 -3848 538834 2012198 1999-005831 15158 155299 355054 14724 525078 3222 528299 2168652 2000-01
-11050 -1971 169269 419000 14187 602456 -31310 571146 2348330 2001-0222940 18200 163403 455917 13957 633277 -5534 627743 2530663 2002-0323743 20667 187730 530415 24572 742717 19699 762416 2837900 2003-0463678 80150 240580 770598 41054 1052231 11809 1064041 3242209 2004-0582381 104389 293350 931331 41392 1266073 13680 1279754 3693369 2005-06
130162 147101 356556 1134319 49709 1540583 -9151 1531433 4294706 2006-07160937 201534 441923 1401284 53592 1896799 3963 1900762 4987090 2007-08
55759 106791 531730 1396160 72213 2000103 -68723 1931380 5630063 2008-09126025 174310 591622 1624446 116312 2332380 31290 2363670 6457352 2009-10198673 254970 676220 1910132 162837 2749189 -57159 2692031 7674148 2010-11(Q)na : Not available.
http://indiabudget.nic.in
A—10
A10 Economic Survey 2011-12
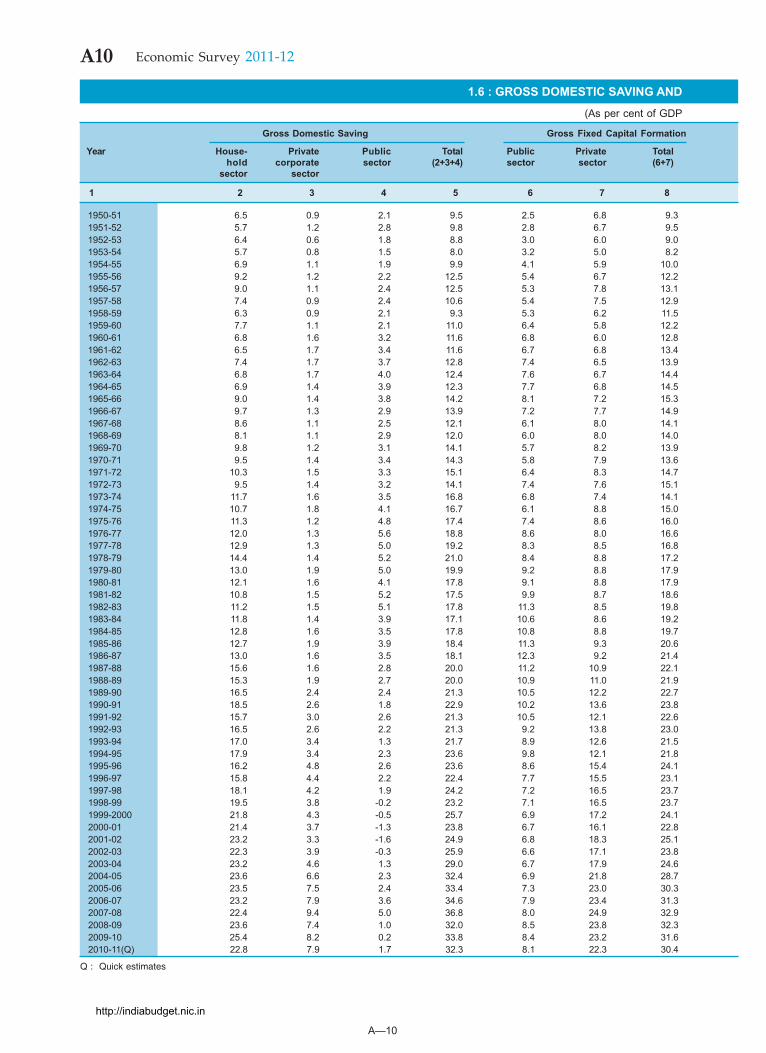
1.6 : GROSS DOMESTIC SAVING AND
(As per cent of GDP
Gross Domestic Saving Gross Fixed Capital Formation
Year House- Private Public Total Public Private Totalhold corporate sector (2+3+4) sector sector (6+7)
sector sector
1 2 3 4 5 6 7 8
1950-51 6.5 0.9 2.1 9.5 2.5 6.8 9.31951-52 5.7 1.2 2.8 9.8 2.8 6.7 9.51952-53 6.4 0.6 1.8 8.8 3.0 6.0 9.01953-54 5.7 0.8 1.5 8.0 3.2 5.0 8.21954-55 6.9 1.1 1.9 9.9 4.1 5.9 10.01955-56 9.2 1.2 2.2 12.5 5.4 6.7 12.21956-57 9.0 1.1 2.4 12.5 5.3 7.8 13.11957-58 7.4 0.9 2.4 10.6 5.4 7.5 12.91958-59 6.3 0.9 2.1 9.3 5.3 6.2 11.51959-60 7.7 1.1 2.1 11.0 6.4 5.8 12.21960-61 6.8 1.6 3.2 11.6 6.8 6.0 12.81961-62 6.5 1.7 3.4 11.6 6.7 6.8 13.41962-63 7.4 1.7 3.7 12.8 7.4 6.5 13.91963-64 6.8 1.7 4.0 12.4 7.6 6.7 14.41964-65 6.9 1.4 3.9 12.3 7.7 6.8 14.51965-66 9.0 1.4 3.8 14.2 8.1 7.2 15.31966-67 9.7 1.3 2.9 13.9 7.2 7.7 14.91967-68 8.6 1.1 2.5 12.1 6.1 8.0 14.11968-69 8.1 1.1 2.9 12.0 6.0 8.0 14.01969-70 9.8 1.2 3.1 14.1 5.7 8.2 13.91970-71 9.5 1.4 3.4 14.3 5.8 7.9 13.61971-72 10.3 1.5 3.3 15.1 6.4 8.3 14.71972-73 9.5 1.4 3.2 14.1 7.4 7.6 15.11973-74 11.7 1.6 3.5 16.8 6.8 7.4 14.11974-75 10.7 1.8 4.1 16.7 6.1 8.8 15.01975-76 11.3 1.2 4.8 17.4 7.4 8.6 16.01976-77 12.0 1.3 5.6 18.8 8.6 8.0 16.61977-78 12.9 1.3 5.0 19.2 8.3 8.5 16.81978-79 14.4 1.4 5.2 21.0 8.4 8.8 17.21979-80 13.0 1.9 5.0 19.9 9.2 8.8 17.91980-81 12.1 1.6 4.1 17.8 9.1 8.8 17.91981-82 10.8 1.5 5.2 17.5 9.9 8.7 18.61982-83 11.2 1.5 5.1 17.8 11.3 8.5 19.81983-84 11.8 1.4 3.9 17.1 10.6 8.6 19.21984-85 12.8 1.6 3.5 17.8 10.8 8.8 19.71985-86 12.7 1.9 3.9 18.4 11.3 9.3 20.61986-87 13.0 1.6 3.5 18.1 12.3 9.2 21.41987-88 15.6 1.6 2.8 20.0 11.2 10.9 22.11988-89 15.3 1.9 2.7 20.0 10.9 11.0 21.91989-90 16.5 2.4 2.4 21.3 10.5 12.2 22.71990-91 18.5 2.6 1.8 22.9 10.2 13.6 23.81991-92 15.7 3.0 2.6 21.3 10.5 12.1 22.61992-93 16.5 2.6 2.2 21.3 9.2 13.8 23.01993-94 17.0 3.4 1.3 21.7 8.9 12.6 21.51994-95 17.9 3.4 2.3 23.6 9.8 12.1 21.81995-96 16.2 4.8 2.6 23.6 8.6 15.4 24.11996-97 15.8 4.4 2.2 22.4 7.7 15.5 23.11997-98 18.1 4.2 1.9 24.2 7.2 16.5 23.71998-99 19.5 3.8 -0.2 23.2 7.1 16.5 23.71999-2000 21.8 4.3 -0.5 25.7 6.9 17.2 24.12000-01 21.4 3.7 -1.3 23.8 6.7 16.1 22.82001-02 23.2 3.3 -1.6 24.9 6.8 18.3 25.12002-03 22.3 3.9 -0.3 25.9 6.6 17.1 23.82003-04 23.2 4.6 1.3 29.0 6.7 17.9 24.62004-05 23.6 6.6 2.3 32.4 6.9 21.8 28.72005-06 23.5 7.5 2.4 33.4 7.3 23.0 30.32006-07 23.2 7.9 3.6 34.6 7.9 23.4 31.32007-08 22.4 9.4 5.0 36.8 8.0 24.9 32.92008-09 23.6 7.4 1.0 32.0 8.5 23.8 32.32009-10 25.4 8.2 0.2 33.8 8.4 23.2 31.62010-11(Q) 22.8 7.9 1.7 32.3 8.1 22.3 30.4
Q : Quick estimates
http://indiabudget.nic.in
A—11
A11Economic Survey 2011-12
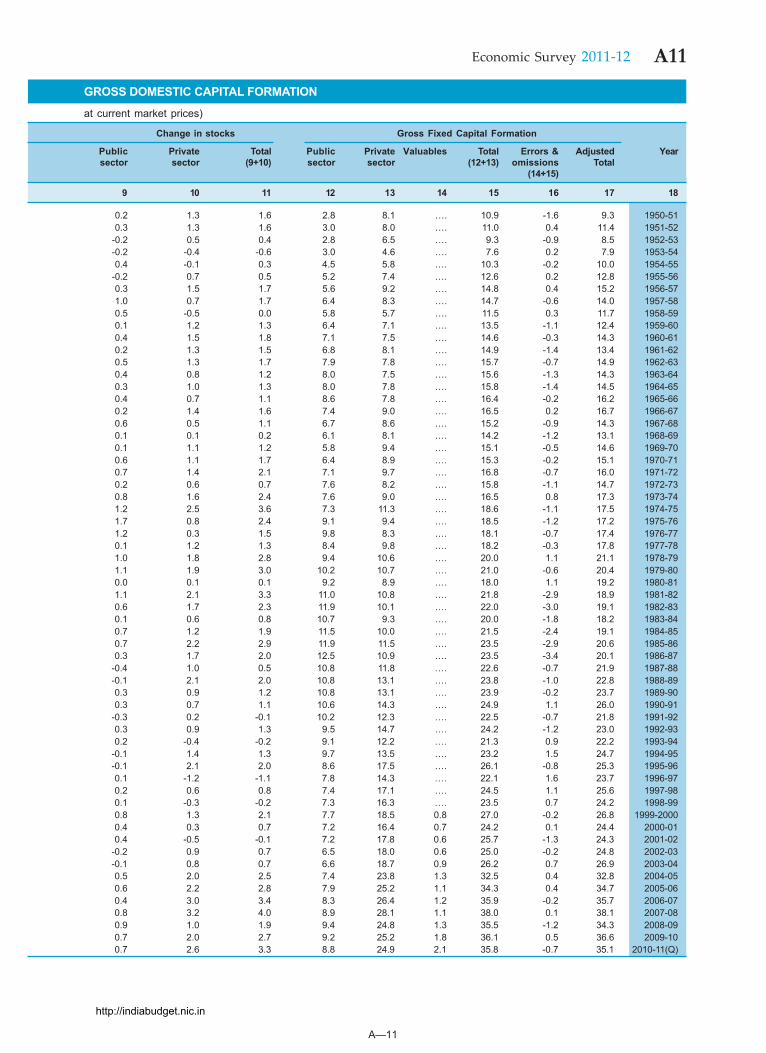
GROSS DOMESTIC CAPITAL FORMATION
at current market prices)
Change in stocks Gross Fixed Capital Formation
Public Private Total Public Private Valuables Total Errors & Adjusted Yearsector sector (9+10) sector sector (12+13) omissions Total
(14+15)
9 10 11 12 13 14 15 16 17 18
0.2 1.3 1.6 2.8 8.1 …. 10.9 -1.6 9.3 1950-510.3 1.3 1.6 3.0 8.0 …. 11.0 0.4 11.4 1951-52
-0.2 0.5 0.4 2.8 6.5 …. 9.3 -0.9 8.5 1952-53-0.2 -0.4 -0.6 3.0 4.6 …. 7.6 0.2 7.9 1953-540.4 -0.1 0.3 4.5 5.8 …. 10.3 -0.2 10.0 1954-55
-0.2 0.7 0.5 5.2 7.4 …. 12.6 0.2 12.8 1955-560.3 1.5 1.7 5.6 9.2 …. 14.8 0.4 15.2 1956-571.0 0.7 1.7 6.4 8.3 …. 14.7 -0.6 14.0 1957-580.5 -0.5 0.0 5.8 5.7 …. 11.5 0.3 11.7 1958-590.1 1.2 1.3 6.4 7.1 …. 13.5 -1.1 12.4 1959-600.4 1.5 1.8 7.1 7.5 …. 14.6 -0.3 14.3 1960-610.2 1.3 1.5 6.8 8.1 …. 14.9 -1.4 13.4 1961-620.5 1.3 1.7 7.9 7.8 …. 15.7 -0.7 14.9 1962-630.4 0.8 1.2 8.0 7.5 …. 15.6 -1.3 14.3 1963-640.3 1.0 1.3 8.0 7.8 …. 15.8 -1.4 14.5 1964-650.4 0.7 1.1 8.6 7.8 …. 16.4 -0.2 16.2 1965-660.2 1.4 1.6 7.4 9.0 …. 16.5 0.2 16.7 1966-670.6 0.5 1.1 6.7 8.6 …. 15.2 -0.9 14.3 1967-680.1 0.1 0.2 6.1 8.1 …. 14.2 -1.2 13.1 1968-690.1 1.1 1.2 5.8 9.4 …. 15.1 -0.5 14.6 1969-700.6 1.1 1.7 6.4 8.9 …. 15.3 -0.2 15.1 1970-710.7 1.4 2.1 7.1 9.7 …. 16.8 -0.7 16.0 1971-720.2 0.6 0.7 7.6 8.2 …. 15.8 -1.1 14.7 1972-730.8 1.6 2.4 7.6 9.0 …. 16.5 0.8 17.3 1973-741.2 2.5 3.6 7.3 11.3 …. 18.6 -1.1 17.5 1974-751.7 0.8 2.4 9.1 9.4 …. 18.5 -1.2 17.2 1975-761.2 0.3 1.5 9.8 8.3 …. 18.1 -0.7 17.4 1976-770.1 1.2 1.3 8.4 9.8 …. 18.2 -0.3 17.8 1977-781.0 1.8 2.8 9.4 10.6 …. 20.0 1.1 21.1 1978-791.1 1.9 3.0 10.2 10.7 …. 21.0 -0.6 20.4 1979-800.0 0.1 0.1 9.2 8.9 …. 18.0 1.1 19.2 1980-811.1 2.1 3.3 11.0 10.8 …. 21.8 -2.9 18.9 1981-820.6 1.7 2.3 11.9 10.1 …. 22.0 -3.0 19.1 1982-830.1 0.6 0.8 10.7 9.3 …. 20.0 -1.8 18.2 1983-840.7 1.2 1.9 11.5 10.0 …. 21.5 -2.4 19.1 1984-850.7 2.2 2.9 11.9 11.5 …. 23.5 -2.9 20.6 1985-860.3 1.7 2.0 12.5 10.9 …. 23.5 -3.4 20.1 1986-87
-0.4 1.0 0.5 10.8 11.8 …. 22.6 -0.7 21.9 1987-88-0.1 2.1 2.0 10.8 13.1 …. 23.8 -1.0 22.8 1988-890.3 0.9 1.2 10.8 13.1 …. 23.9 -0.2 23.7 1989-900.3 0.7 1.1 10.6 14.3 …. 24.9 1.1 26.0 1990-91
-0.3 0.2 -0.1 10.2 12.3 …. 22.5 -0.7 21.8 1991-920.3 0.9 1.3 9.5 14.7 …. 24.2 -1.2 23.0 1992-930.2 -0.4 -0.2 9.1 12.2 …. 21.3 0.9 22.2 1993-94
-0.1 1.4 1.3 9.7 13.5 …. 23.2 1.5 24.7 1994-95-0.1 2.1 2.0 8.6 17.5 …. 26.1 -0.8 25.3 1995-960.1 -1.2 -1.1 7.8 14.3 …. 22.1 1.6 23.7 1996-970.2 0.6 0.8 7.4 17.1 …. 24.5 1.1 25.6 1997-980.1 -0.3 -0.2 7.3 16.3 …. 23.5 0.7 24.2 1998-990.8 1.3 2.1 7.7 18.5 0.8 27.0 -0.2 26.8 1999-20000.4 0.3 0.7 7.2 16.4 0.7 24.2 0.1 24.4 2000-010.4 -0.5 -0.1 7.2 17.8 0.6 25.7 -1.3 24.3 2001-02
-0.2 0.9 0.7 6.5 18.0 0.6 25.0 -0.2 24.8 2002-03-0.1 0.8 0.7 6.6 18.7 0.9 26.2 0.7 26.9 2003-040.5 2.0 2.5 7.4 23.8 1.3 32.5 0.4 32.8 2004-050.6 2.2 2.8 7.9 25.2 1.1 34.3 0.4 34.7 2005-060.4 3.0 3.4 8.3 26.4 1.2 35.9 -0.2 35.7 2006-070.8 3.2 4.0 8.9 28.1 1.1 38.0 0.1 38.1 2007-080.9 1.0 1.9 9.4 24.8 1.3 35.5 -1.2 34.3 2008-090.7 2.0 2.7 9.2 25.2 1.8 36.1 0.5 36.6 2009-100.7 2.6 3.3 8.8 24.9 2.1 35.8 -0.7 35.1 2010-11(Q)
http://indiabudget.nic.in
A—12
A12 Economic Survey 2011-12
(% G
row
th o
ver
prev
ious
yea
r)(
`̀̀̀̀ cr
ore)
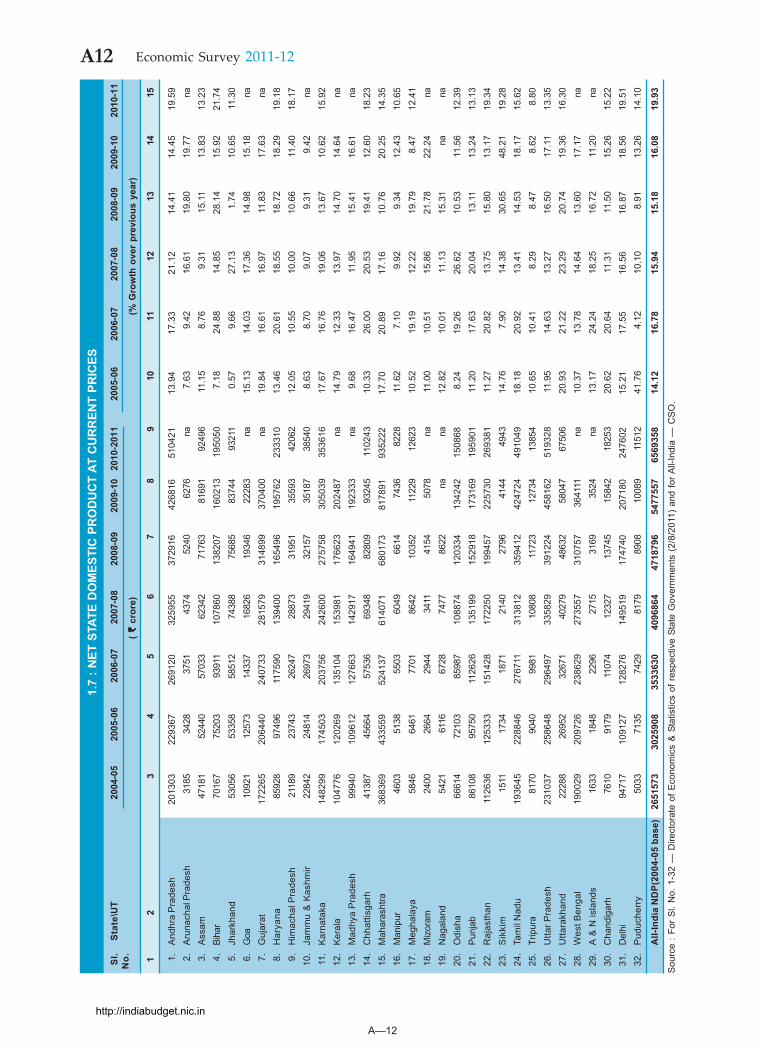
1.7
: NET
STA
TE D
OM
ESTI
C P
RO
DU
CT
AT C
UR
REN
T PR
ICES
Sl.
Sta
te\U
T20
04-0
520
05-0
620
06-0
720
07-0
820
08-0
920
09-1
020
10-2
011
2005
-06
2006
-07
2007
-08
2008
-09
2009
-10
2010
-11
No. 1
23
45
67
89
1011
1213
1415
1.A
ndhr
a P
rade
sh20
1303
2293
6726
9120
3259
5537
2916
4268
1651
0421
13.9
417
.33
21.1
214
.41
14.4
519
.59
2.
Aru
nach
al P
rade
sh31
8534
2837
5143
7452
4062
76na
7.63
9.42
16.6
119
.80
19.7
7na
3.
Ass
am47
181
5244
057
033
6234
271
763
8169
192
496
11.1
58.
769.
3115
.11
13.8
313
.23
4.
Biha
r70
167
7520
393
911
1078
6013
8207
1602
1319
5050
7.18
24.8
814
.85
28.1
415
.92
21.7
4 5
.Jh
arkh
and
5305
653
358
5851
274
388
7568
583
744
9321
10.
579.
6627
.13
1.74
10.6
511
.30
6.
Goa
1092
112
573
1433
716
826
1934
622
283
na15
.13
14.0
317
.36
14.9
815
.18
na 7
.G
ujar
at17
2265
2064
4024
0733
2815
7931
4899
3704
00na
19.8
416
.61
16.9
711
.83
17.6
3na
8.
Har
yana
8592
897
496
1175
9013
9400
1654
9619
5762
2333
1013
.46
20.6
118
.55
18.7
218
.29
19.1
8 9
.H
imac
hal P
rade
sh21
189
2374
326
247
2887
331
951
3559
342
062
12.0
510
.55
10.0
010
.66
11.4
018
.17
10.
Jam
mu
& K
ashm
ir22
842
2481
426
973
2941
932
157
3518
738
540
8.63
8.70
9.07
9.31
9.42
na11
.K
arna
taka
1482
9917
4503
2037
5624
2600
2757
5830
5039
3536
1617
.67
16.7
619
.06
13.6
710
.62
15.9
212
.Ke
rala
1047
7612
0269
1351
0415
3981
1766
2320
2487
na14
.79
12.3
313
.97
14.7
014
.64
na13
.M
adhy
a P
rade
sh99
940
1096
1212
7663
1429
1716
4941
1923
33na
9.68
16.4
711
.95
15.4
116
.61
na14
.C
hhat
tisga
rh41
387
4566
457
536
6934
882
809
9324
511
0243
10.3
326
.00
20.5
319
.41
12.6
018
.23
15.
Mah
aras
htra
3683
6943
3559
5241
3761
4071
6801
7381
7891
9352
2217
.70
20.8
917
.16
10.7
620
.25
14.3
516
.M
anip
ur46
0351
3855
0360
4966
1474
3682
2811
.62
7.10
9.92
9.34
12.4
310
.65
17.
Meg
hala
ya58
4664
6177
0186
4210
352
1122
912
623
10.5
219
.19
12.2
219
.79
8.47
12.4
118
.M
izor
am24
0026
6429
4434
1141
5450
78na
11.0
010
.51
15.8
621
.78
22.2
4na
19.
Nag
alan
d54
2161
1667
2874
7786
22na
na12
.82
10.0
111
.13
15.3
1na
na20
.O
dish
a66
614
7210
385
987
1088
7412
0334
1342
4215
0868
8.24
19.2
626
.62
10.5
311
.56
12.3
921
.Pu
njab
8610
895
750
1126
2613
5199
1529
1817
3169
1959
0111
.20
17.6
320
.04
13.1
113
.24
13.1
322
.R
ajas
than
1126
3612
5333
1514
2817
2250
1994
5722
5730
2693
8111
.27
20.8
213
.75
15.8
013
.17
19.3
423
.S
ikki
m15
1117
3418
7121
4027
9641
4449
4314
.76
7.90
14.3
830
.65
48.2
119
.28
24.
Tam
il N
adu
1936
4522
8846
2767
1131
3812
3594
1242
4724
4910
4918
.18
20.9
213
.41
14.5
318
.17
15.6
225
.Tr
ipur
a81
7090
4099
8110
808
1172
312
734
1385
410
.65
10.4
18.
298.
478.
628.
8026
.U
ttar P
rade
sh23
1037
2586
4829
6497
3358
2939
1224
4581
6251
9328
11.9
514
.63
13.2
716
.50
17.1
113
.35
27.
Utta
rakh
and
2228
826
952
3267
140
279
4863
258
047
6750
620
.93
21.2
223
.29
20.7
419
.36
16.3
028
.W
est B
enga
l19
0029
2097
2623
8629
2735
5731
0757
3641
11na
10.3
713
.78
14.6
413
.60
17.1
7na
29.
A &
N is
land
s16
3318
4822
9627
1531
6935
24na
13.1
724
.24
18.2
516
.72
11.2
0na
30.
Cha
ndig
arh
7610
9179
1107
412
327
1374
515
842
1825
320
.62
20.6
411
.31
11.5
015
.26
15.2
231
.D
elhi
9471
710
9127
1282
7614
9519
1747
4020
7180
2476
0215
.21
17.5
516
.56
16.8
718
.56
19.5
132
.P
uduc
herr
y50
3371
3574
2981
7989
0810
089
1151
241
.76
4.12
10.1
08.
9113
.26
14.1
0
All-
Indi
a N
DP(
2004
-05
base
)26
5157
330
2590
835
3363
040
9686
447
1879
654
7755
765
6935
814
.12
16.7
815
.94
15.1
816
.08
19.9
3
Sou
rce
: For
Sl.
No.
1-3
2 —
Dire
ctor
ate
of E
cono
mic
s &
Sta
tistic
s of
res
pect
ive
Stat
e G
over
nmen
ts (
2/8/
2011
) an
d fo
r All-
Indi
a —
CS
O.
http://indiabudget.nic.in
A—13
A13Economic Survey 2011-12
(% G
row
th o
ver
prev
ious
yea
r)(
`̀̀̀̀ )
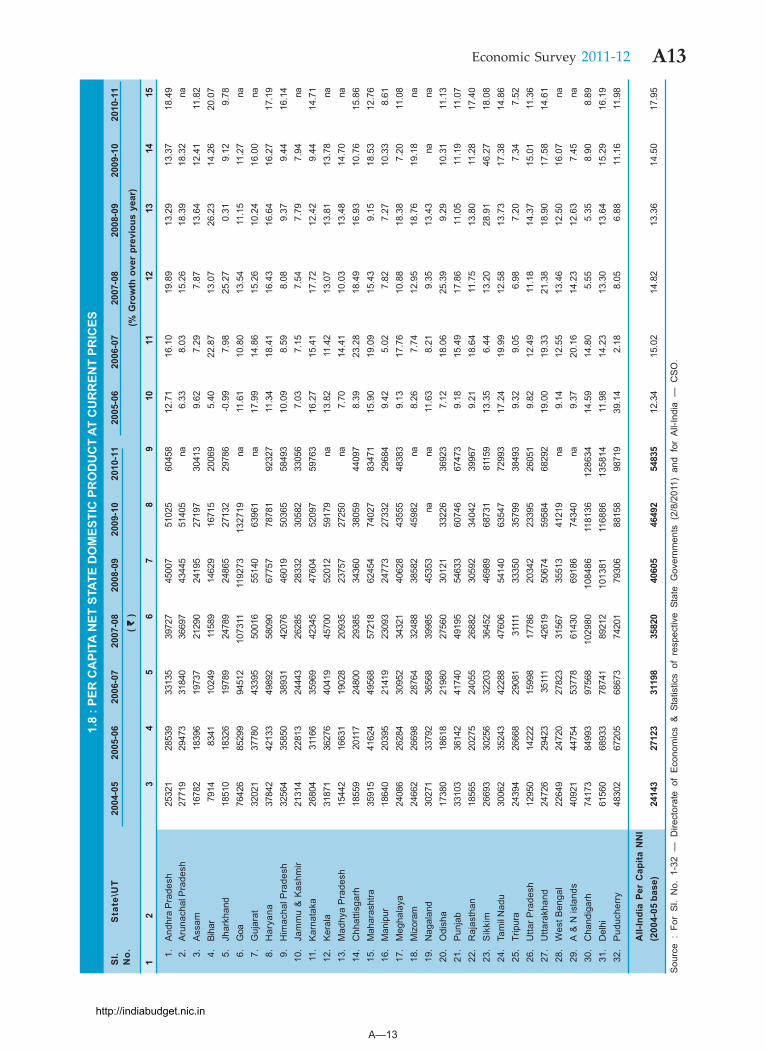
1.8
: PER
CA
PITA
NET
STA
TE D
OM
ESTI
C P
RO
DU
CT
AT C
UR
REN
T PR
ICES
Sl.
Sta
te\U
T20
04-0
520
05-0
620
06-0
720
07-0
820
08-0
920
09-1
020
10-1
120
05-0
620
06-0
720
07-0
820
08-0
920
09-1
020
10-1
1N
o.
12
34
56
78
910
1112
1314
15
1.A
ndhr
a P
rade
sh25
321
2853
933
135
3972
745
007
5102
560
458
12.7
116
.10
19.8
913
.29
13.3
718
.49
2.
Aru
nach
al P
rade
sh27
719
2947
331
840
3669
743
445
5140
5na
6.33
8.03
15.2
618
.39
18.3
2na
3.
Ass
am16
782
1839
619
737
2129
024
195
2719
730
413
9.62
7.29
7.87
13.6
412
.41
11.8
2 4
.Bi
har
7914
8341
1024
911
589
1462
916
715
2006
95.
4022
.87
13.0
726
.23
14.2
620
.07
5.
Jhar
khan
d18
510
1832
619
789
2478
924
865
2713
229
786
-0.9
97.
9825
.27
0.31
9.12
9.78
6.
Goa
7642
685
299
9451
210
7311
1192
7313
2719
na11
.61
10.8
013
.54
11.1
511
.27
na 7
.G
ujar
at32
021
3778
043
395
5001
655
140
6396
1na
17.9
914
.86
15.2
610
.24
16.0
0na
8.
Har
yana
3784
242
133
4989
258
090
6775
778
781
9232
711
.34
18.4
116
.43
16.6
416
.27
17.1
9 9
.H
imac
hal P
rade
sh32
564
3585
038
931
4207
646
019
5036
558
493
10.0
98.
598.
089.
379.
4416
.14
10.
Jam
mu
& K
ashm
ir21
314
2281
324
443
2628
528
332
3058
233
056
7.03
7.15
7.54
7.79
7.94
na11
.K
arna
taka
2680
431
166
3596
942
345
4760
452
097
5976
316
.27
15.4
117
.72
12.4
29.
4414
.71
12.
Ker
ala
3187
136
276
4041
945
700
5201
259
179
na13
.82
11.4
213
.07
13.8
113
.78
na13
.M
adhy
a P
rade
sh15
442
1663
119
028
2093
523
757
2725
0na
7.70
14.4
110
.03
13.4
814
.70
na14
.C
hhat
tisga
rh18
559
2011
724
800
2938
534
360
3805
944
097
8.39
23.2
818
.49
16.9
310
.76
15.8
615
.M
ahar
asht
ra35
915
4162
449
568
5721
862
454
7402
783
471
15.9
019
.09
15.4
39.
1518
.53
12.7
616
.M
anip
ur18
640
2039
521
419
2309
324
773
2733
229
684
9.42
5.02
7.82
7.27
10.3
38.
6117
.M
egha
laya
2408
626
284
3095
234
321
4062
843
555
4838
39.
1317
.76
10.8
818
.38
7.20
11.0
818
.M
izor
am24
662
2669
828
764
3248
838
582
4598
2na
8.26
7.74
12.9
518
.76
19.1
8na
19.
Nag
alan
d30
271
3379
236
568
3998
545
353
nana
11.6
38.
219.
3513
.43
nana
20.
Odi
sha
1738
018
618
2198
027
560
3012
133
226
3692
37.
1218
.06
25.3
99.
2910
.31
11.1
321
.Pu
njab
3310
336
142
4174
049
195
5463
360
746
6747
39.
1815
.49
17.8
611
.05
11.1
911
.07
22.
Raj
asth
an18
565
2027
524
055
2688
230
592
3404
239
967
9.21
18.6
411
.75
13.8
011
.28
17.4
023
.S
ikki
m26
693
3025
632
203
3645
246
989
6873
181
159
13.3
56.
4413
.20
28.9
146
.27
18.0
824
.Ta
mil
Nad
u30
062
3524
342
288
4760
654
140
6354
772
993
17.2
419
.99
12.5
813
.73
17.3
814
.86
25.
Trip
ura
2439
426
668
2908
131
111
3335
035
799
3849
39.
329.
056.
987.
207.
347.
5226
.U
ttar P
rade
sh12
950
1422
215
998
1778
620
342
2339
526
051
9.82
12.4
911
.18
14.3
715
.01
11.3
627
.U
ttara
khan
d24
726
2942
335
111
4261
950
674
5958
468
292
19.0
019
.33
21.3
818
.90
17.5
814
.61
28.
Wes
t Ben
gal
2264
924
720
2782
331
567
3551
341
219
na9.
1412
.55
13.4
612
.50
16.0
7na
29.
A &
N is
land
s40
921
4475
453
778
6143
069
186
7434
0na
9.37
20.1
614
.23
12.6
37.
45na
30.
Cha
ndig
arh
7417
384
993
9756
810
2980
1084
8611
8136
1286
3414
.59
14.8
05.
555.
358.
908.
8931
.D
elhi
6156
068
933
7874
189
212
1013
8111
6886
1358
1411
.98
14.2
313
.30
13.6
415
.29
16.1
932
.P
uduc
herr
y48
302
6720
568
673
7420
179
306
8815
898
719
39.1
42.
188.
056.
8811
.16
11.9
8
All-
Indi
a Pe
r C
apita
NN
I(2
004-
05 b
ase)
2414
327
123
3119
835
820
4060
546
492
5483
512
.34
15.0
214
.82
13.3
614
.50
17.9
5
Sou
rce
: Fo
r S
l. N
o. 1
-32
— D
irect
orat
e of
Eco
nom
ics
& S
tatis
tics
of r
espe
ctiv
e St
ate
Gov
ernm
ents
(2/
8/20
11)
and
for
All-
Indi
a —
CS
O.
http://indiabudget.nic.in
A—14
A14 Economic Survey 2011-12
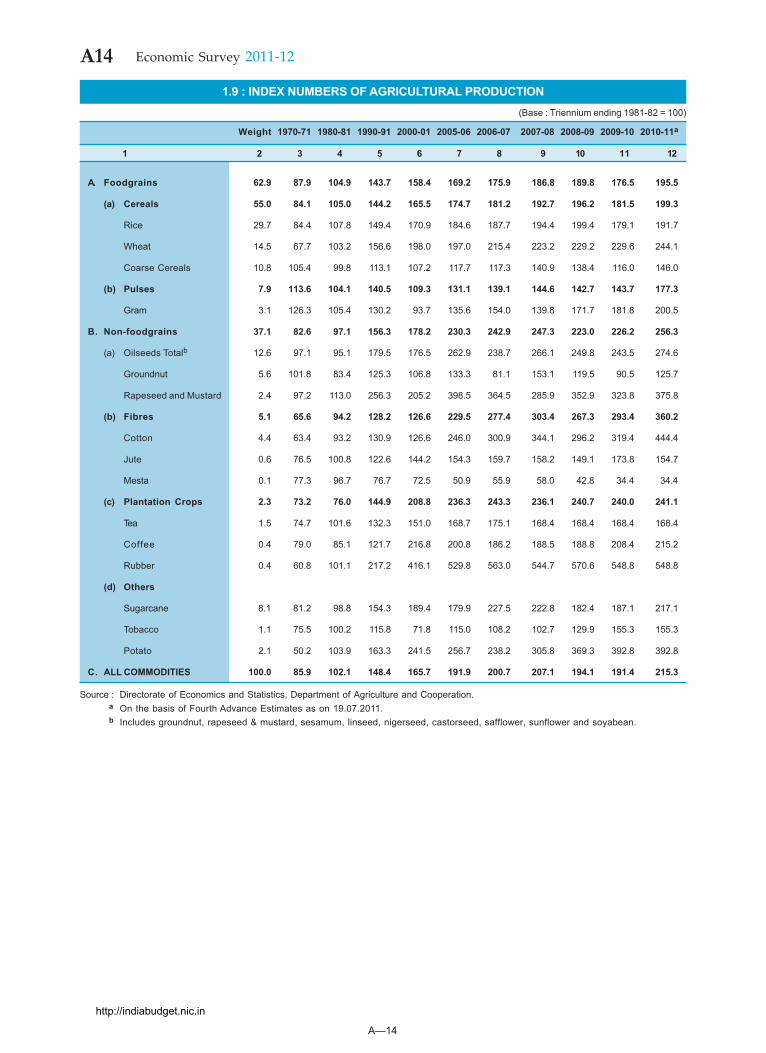
1.9 : INDEX NUMBERS OF AGRICULTURAL PRODUCTION(Base : Triennium ending 1981-82 = 100)
Weight 1970-71 1980-81 1990-91 2000-01 2005-06 2006-07 2007-08 2008-09 2009-10 2010-11a
1 2 3 4 5 6 7 8 9 10 11 12
A. Foodgrains 62.9 87.9 104.9 143.7 158.4 169.2 175.9 186.8 189.8 176.5 195.5
(a) Cereals 55.0 84.1 105.0 144.2 165.5 174.7 181.2 192.7 196.2 181.5 199.3
Rice 29.7 84.4 107.8 149.4 170.9 184.6 187.7 194.4 199.4 179.1 191.7
Wheat 14.5 67.7 103.2 156.6 198.0 197.0 215.4 223.2 229.2 229.6 244.1
Coarse Cereals 10.8 105.4 99.8 113.1 107.2 117.7 117.3 140.9 138.4 116.0 146.0
(b) Pulses 7.9 113.6 104.1 140.5 109.3 131.1 139.1 144.6 142.7 143.7 177.3
Gram 3.1 126.3 105.4 130.2 93.7 135.6 154.0 139.8 171.7 181.8 200.5
B. Non-foodgrains 37.1 82.6 97.1 156.3 178.2 230.3 242.9 247.3 223.0 226.2 256.3
(a) Oilseeds Totalb 12.6 97.1 95.1 179.5 176.5 262.9 238.7 266.1 249.8 243.5 274.6
Groundnut 5.6 101.8 83.4 125.3 106.8 133.3 81.1 153.1 119.5 90.5 125.7
Rapeseed and Mustard 2.4 97.2 113.0 256.3 205.2 398.5 364.5 285.9 352.9 323.8 375.8
(b) Fibres 5.1 65.6 94.2 128.2 126.6 229.5 277.4 303.4 267.3 293.4 360.2
Cotton 4.4 63.4 93.2 130.9 126.6 246.0 300.9 344.1 296.2 319.4 444.4
Jute 0.6 76.5 100.8 122.6 144.2 154.3 159.7 158.2 149.1 173.8 154.7
Mesta 0.1 77.3 96.7 76.7 72.5 50.9 55.9 58.0 42.8 34.4 34.4
(c) Plantation Crops 2.3 73.2 76.0 144.9 208.8 236.3 243.3 236.1 240.7 240.0 241.1
Tea 1.5 74.7 101.6 132.3 151.0 168.7 175.1 168.4 168.4 168.4 168.4
Coffee 0.4 79.0 85.1 121.7 216.8 200.8 186.2 188.5 188.8 208.4 215.2
Rubber 0.4 60.8 101.1 217.2 416.1 529.8 563.0 544.7 570.6 548.8 548.8
(d) Others
Sugarcane 8.1 81.2 98.8 154.3 189.4 179.9 227.5 222.8 182.4 187.1 217.1
Tobacco 1.1 75.5 100.2 115.8 71.8 115.0 108.2 102.7 129.9 155.3 155.3
Potato 2.1 50.2 103.9 163.3 241.5 256.7 238.2 305.8 369.3 392.8 392.8
C. ALL COMMODITIES 100.0 85.9 102.1 148.4 165.7 191.9 200.7 207.1 194.1 191.4 215.3
Source : Directorate of Economics and Statistics, Department of Agriculture and Cooperation.a On the basis of Fourth Advance Estimates as on 19.07.2011.b Includes groundnut, rapeseed & mustard, sesamum, linseed, nigerseed, castorseed, safflower, sunflower and soyabean.
http://indiabudget.nic.in
A—15
A15Economic Survey 2011-12
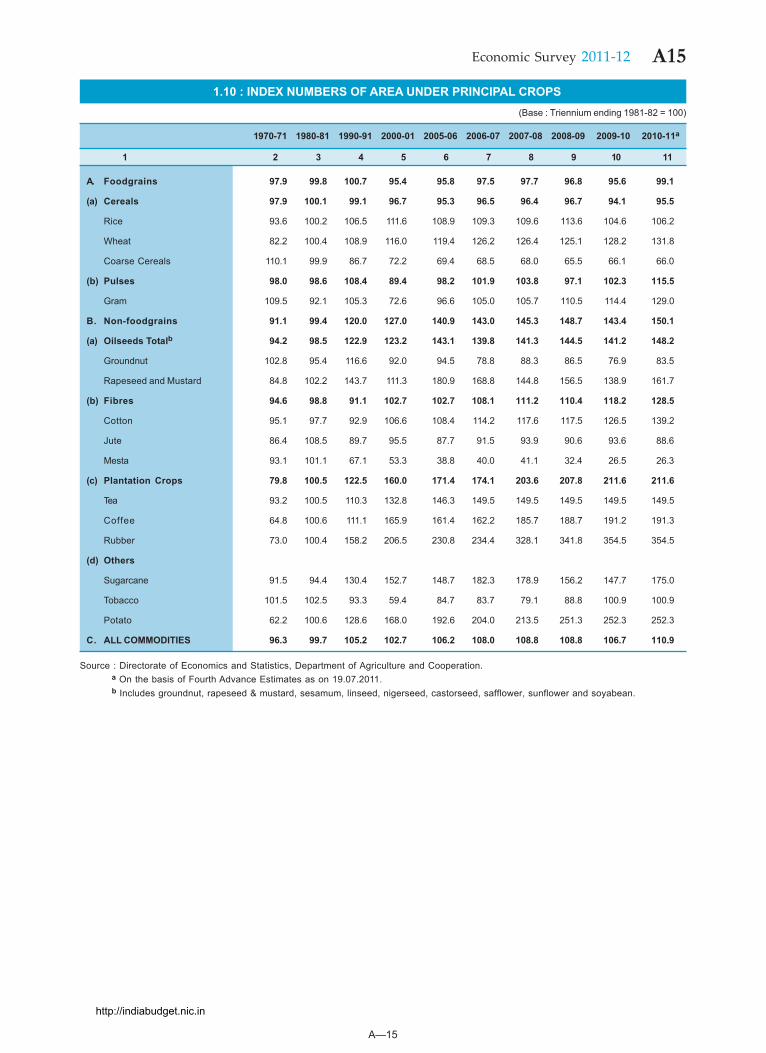
1.10 : INDEX NUMBERS OF AREA UNDER PRINCIPAL CROPS(Base : Triennium ending 1981-82 = 100)
1970-71 1980-81 1990-91 2000-01 2005-06 2006-07 2007-08 2008-09 2009-10 2010-11a
1 2 3 4 5 6 7 8 9 10 11
A. Foodgrains 97.9 99.8 100.7 95.4 95.8 97.5 97.7 96.8 95.6 99.1
(a) Cereals 97.9 100.1 99.1 96.7 95.3 96.5 96.4 96.7 94.1 95.5
Rice 93.6 100.2 106.5 111.6 108.9 109.3 109.6 113.6 104.6 106.2
Wheat 82.2 100.4 108.9 116.0 119.4 126.2 126.4 125.1 128.2 131.8
Coarse Cereals 110.1 99.9 86.7 72.2 69.4 68.5 68.0 65.5 66.1 66.0
(b) Pulses 98.0 98.6 108.4 89.4 98.2 101.9 103.8 97.1 102.3 115.5
Gram 109.5 92.1 105.3 72.6 96.6 105.0 105.7 110.5 114.4 129.0
B. Non-foodgrains 91.1 99.4 120.0 127.0 140.9 143.0 145.3 148.7 143.4 150.1
(a) Oilseeds Totalb 94.2 98.5 122.9 123.2 143.1 139.8 141.3 144.5 141.2 148.2
Groundnut 102.8 95.4 116.6 92.0 94.5 78.8 88.3 86.5 76.9 83.5
Rapeseed and Mustard 84.8 102.2 143.7 111.3 180.9 168.8 144.8 156.5 138.9 161.7
(b) Fibres 94.6 98.8 91.1 102.7 102.7 108.1 111.2 110.4 118.2 128.5
Cotton 95.1 97.7 92.9 106.6 108.4 114.2 117.6 117.5 126.5 139.2
Jute 86.4 108.5 89.7 95.5 87.7 91.5 93.9 90.6 93.6 88.6
Mesta 93.1 101.1 67.1 53.3 38.8 40.0 41.1 32.4 26.5 26.3
(c) Plantation Crops 79.8 100.5 122.5 160.0 171.4 174.1 203.6 207.8 211.6 211.6
Tea 93.2 100.5 110.3 132.8 146.3 149.5 149.5 149.5 149.5 149.5
Coffee 64.8 100.6 111.1 165.9 161.4 162.2 185.7 188.7 191.2 191.3
Rubber 73.0 100.4 158.2 206.5 230.8 234.4 328.1 341.8 354.5 354.5
(d) Others
Sugarcane 91.5 94.4 130.4 152.7 148.7 182.3 178.9 156.2 147.7 175.0
Tobacco 101.5 102.5 93.3 59.4 84.7 83.7 79.1 88.8 100.9 100.9
Potato 62.2 100.6 128.6 168.0 192.6 204.0 213.5 251.3 252.3 252.3
C. ALL COMMODITIES 96.3 99.7 105.2 102.7 106.2 108.0 108.8 108.8 106.7 110.9
Source : Directorate of Economics and Statistics, Department of Agriculture and Cooperation.a On the basis of Fourth Advance Estimates as on 19.07.2011.b Includes groundnut, rapeseed & mustard, sesamum, linseed, nigerseed, castorseed, safflower, sunflower and soyabean.
http://indiabudget.nic.in
A—16
A16 Economic Survey 2011-12
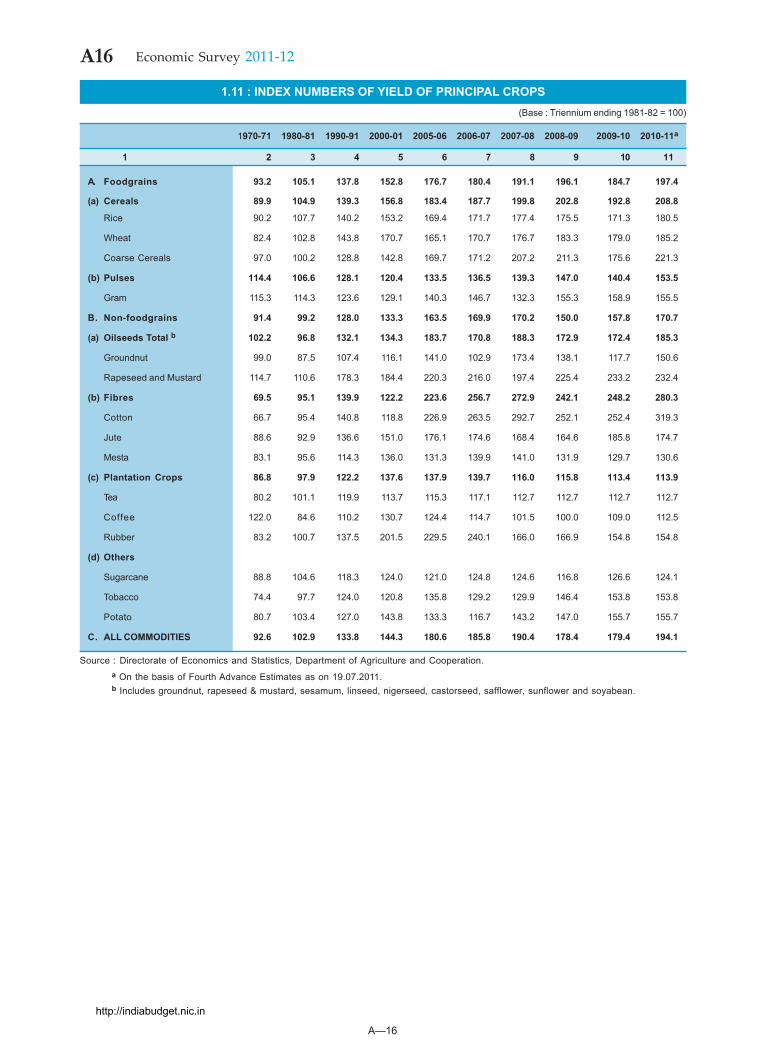
1.11 : INDEX NUMBERS OF YIELD OF PRINCIPAL CROPS(Base : Triennium ending 1981-82 = 100)
1970-71 1980-81 1990-91 2000-01 2005-06 2006-07 2007-08 2008-09 2009-10 2010-11a
1 2 3 4 5 6 7 8 9 10 11
A. Foodgrains 93.2 105.1 137.8 152.8 176.7 180.4 191.1 196.1 184.7 197.4
(a) Cereals 89.9 104.9 139.3 156.8 183.4 187.7 199.8 202.8 192.8 208.8
Rice 90.2 107.7 140.2 153.2 169.4 171.7 177.4 175.5 171.3 180.5
Wheat 82.4 102.8 143.8 170.7 165.1 170.7 176.7 183.3 179.0 185.2
Coarse Cereals 97.0 100.2 128.8 142.8 169.7 171.2 207.2 211.3 175.6 221.3
(b) Pulses 114.4 106.6 128.1 120.4 133.5 136.5 139.3 147.0 140.4 153.5
Gram 115.3 114.3 123.6 129.1 140.3 146.7 132.3 155.3 158.9 155.5
B. Non-foodgrains 91.4 99.2 128.0 133.3 163.5 169.9 170.2 150.0 157.8 170.7
(a) Oilseeds Total b 102.2 96.8 132.1 134.3 183.7 170.8 188.3 172.9 172.4 185.3
Groundnut 99.0 87.5 107.4 116.1 141.0 102.9 173.4 138.1 117.7 150.6
Rapeseed and Mustard 114.7 110.6 178.3 184.4 220.3 216.0 197.4 225.4 233.2 232.4
(b) Fibres 69.5 95.1 139.9 122.2 223.6 256.7 272.9 242.1 248.2 280.3
Cotton 66.7 95.4 140.8 118.8 226.9 263.5 292.7 252.1 252.4 319.3
Jute 88.6 92.9 136.6 151.0 176.1 174.6 168.4 164.6 185.8 174.7
Mesta 83.1 95.6 114.3 136.0 131.3 139.9 141.0 131.9 129.7 130.6
(c) Plantation Crops 86.8 97.9 122.2 137.6 137.9 139.7 116.0 115.8 113.4 113.9
Tea 80.2 101.1 119.9 113.7 115.3 117.1 112.7 112.7 112.7 112.7
Coffee 122.0 84.6 110.2 130.7 124.4 114.7 101.5 100.0 109.0 112.5
Rubber 83.2 100.7 137.5 201.5 229.5 240.1 166.0 166.9 154.8 154.8
(d) Others
Sugarcane 88.8 104.6 118.3 124.0 121.0 124.8 124.6 116.8 126.6 124.1
Tobacco 74.4 97.7 124.0 120.8 135.8 129.2 129.9 146.4 153.8 153.8
Potato 80.7 103.4 127.0 143.8 133.3 116.7 143.2 147.0 155.7 155.7
C. ALL COMMODITIES 92.6 102.9 133.8 144.3 180.6 185.8 190.4 178.4 179.4 194.1
Source : Directorate of Economics and Statistics, Department of Agriculture and Cooperation.a On the basis of Fourth Advance Estimates as on 19.07.2011.b Includes groundnut, rapeseed & mustard, sesamum, linseed, nigerseed, castorseed, safflower, sunflower and soyabean.
http://indiabudget.nic.in
A—17
A17Economic Survey 2011-12
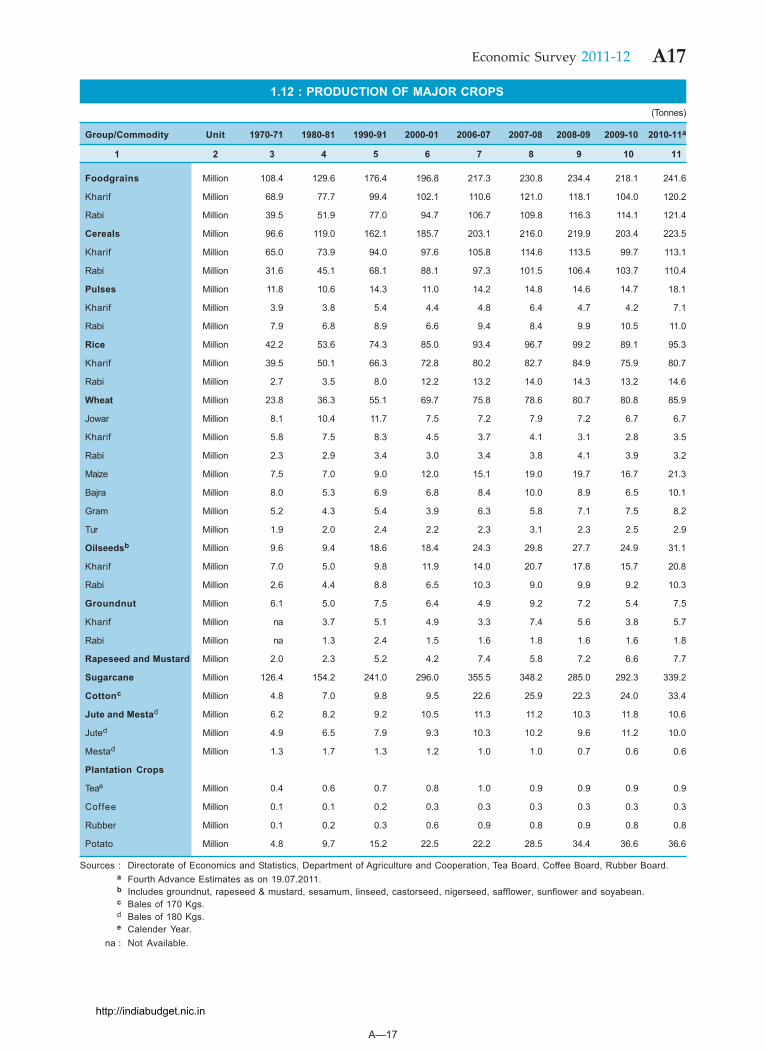
1.12 : PRODUCTION OF MAJOR CROPS(Tonnes)
Group/Commodity Unit 1970-71 1980-81 1990-91 2000-01 2006-07 2007-08 2008-09 2009-10 2010-11a
1 2 3 4 5 6 7 8 9 10 11
Foodgrains Million 108.4 129.6 176.4 196.8 217.3 230.8 234.4 218.1 241.6
Kharif Million 68.9 77.7 99.4 102.1 110.6 121.0 118.1 104.0 120.2
Rabi Million 39.5 51.9 77.0 94.7 106.7 109.8 116.3 114.1 121.4
Cereals Million 96.6 119.0 162.1 185.7 203.1 216.0 219.9 203.4 223.5
Kharif Million 65.0 73.9 94.0 97.6 105.8 114.6 113.5 99.7 113.1
Rabi Million 31.6 45.1 68.1 88.1 97.3 101.5 106.4 103.7 110.4
Pulses Million 11.8 10.6 14.3 11.0 14.2 14.8 14.6 14.7 18.1
Kharif Million 3.9 3.8 5.4 4.4 4.8 6.4 4.7 4.2 7.1
Rabi Million 7.9 6.8 8.9 6.6 9.4 8.4 9.9 10.5 11.0
Rice Million 42.2 53.6 74.3 85.0 93.4 96.7 99.2 89.1 95.3
Kharif Million 39.5 50.1 66.3 72.8 80.2 82.7 84.9 75.9 80.7
Rabi Million 2.7 3.5 8.0 12.2 13.2 14.0 14.3 13.2 14.6
Wheat Million 23.8 36.3 55.1 69.7 75.8 78.6 80.7 80.8 85.9
Jowar Million 8.1 10.4 11.7 7.5 7.2 7.9 7.2 6.7 6.7
Kharif Million 5.8 7.5 8.3 4.5 3.7 4.1 3.1 2.8 3.5
Rabi Million 2.3 2.9 3.4 3.0 3.4 3.8 4.1 3.9 3.2
Maize Million 7.5 7.0 9.0 12.0 15.1 19.0 19.7 16.7 21.3
Bajra Million 8.0 5.3 6.9 6.8 8.4 10.0 8.9 6.5 10.1
Gram Million 5.2 4.3 5.4 3.9 6.3 5.8 7.1 7.5 8.2
Tur Million 1.9 2.0 2.4 2.2 2.3 3.1 2.3 2.5 2.9
Oilseedsb Million 9.6 9.4 18.6 18.4 24.3 29.8 27.7 24.9 31.1
Kharif Million 7.0 5.0 9.8 11.9 14.0 20.7 17.8 15.7 20.8
Rabi Million 2.6 4.4 8.8 6.5 10.3 9.0 9.9 9.2 10.3
Groundnut Million 6.1 5.0 7.5 6.4 4.9 9.2 7.2 5.4 7.5
Kharif Million na 3.7 5.1 4.9 3.3 7.4 5.6 3.8 5.7
Rabi Million na 1.3 2.4 1.5 1.6 1.8 1.6 1.6 1.8
Rapeseed and Mustard Million 2.0 2.3 5.2 4.2 7.4 5.8 7.2 6.6 7.7
Sugarcane Million 126.4 154.2 241.0 296.0 355.5 348.2 285.0 292.3 339.2
Cottonc Million 4.8 7.0 9.8 9.5 22.6 25.9 22.3 24.0 33.4
Jute and Mestad Million 6.2 8.2 9.2 10.5 11.3 11.2 10.3 11.8 10.6
Juted Million 4.9 6.5 7.9 9.3 10.3 10.2 9.6 11.2 10.0
Mestad Million 1.3 1.7 1.3 1.2 1.0 1.0 0.7 0.6 0.6
Plantation Crops
Teae Million 0.4 0.6 0.7 0.8 1.0 0.9 0.9 0.9 0.9
Coffee Million 0.1 0.1 0.2 0.3 0.3 0.3 0.3 0.3 0.3
Rubber Million 0.1 0.2 0.3 0.6 0.9 0.8 0.9 0.8 0.8
Potato Million 4.8 9.7 15.2 22.5 22.2 28.5 34.4 36.6 36.6
Sources : Directorate of Economics and Statistics, Department of Agriculture and Cooperation, Tea Board, Coffee Board, Rubber Board.a Fourth Advance Estimates as on 19.07.2011.b Includes groundnut, rapeseed & mustard, sesamum, linseed, castorseed, nigerseed, safflower, sunflower and soyabean.c Bales of 170 Kgs.d Bales of 180 Kgs.e Calender Year.
na : Not Available.
http://indiabudget.nic.in
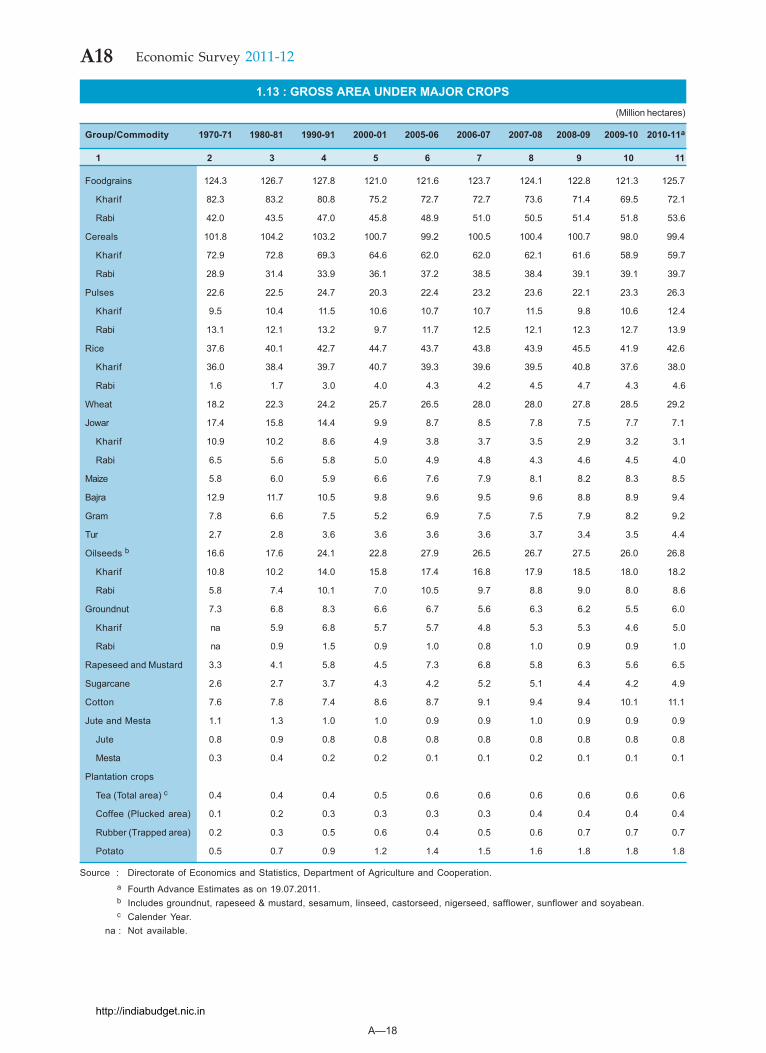
A—18
A18 Economic Survey 2011-12
1.13 : GROSS AREA UNDER MAJOR CROPS(Million hectares)
Group/Commodity 1970-71 1980-81 1990-91 2000-01 2005-06 2006-07 2007-08 2008-09 2009-10 2010-11a
1 2 3 4 5 6 7 8 9 10 11
Foodgrains 124.3 126.7 127.8 121.0 121.6 123.7 124.1 122.8 121.3 125.7
Kharif 82.3 83.2 80.8 75.2 72.7 72.7 73.6 71.4 69.5 72.1
Rabi 42.0 43.5 47.0 45.8 48.9 51.0 50.5 51.4 51.8 53.6
Cereals 101.8 104.2 103.2 100.7 99.2 100.5 100.4 100.7 98.0 99.4
Kharif 72.9 72.8 69.3 64.6 62.0 62.0 62.1 61.6 58.9 59.7
Rabi 28.9 31.4 33.9 36.1 37.2 38.5 38.4 39.1 39.1 39.7
Pulses 22.6 22.5 24.7 20.3 22.4 23.2 23.6 22.1 23.3 26.3
Kharif 9.5 10.4 11.5 10.6 10.7 10.7 11.5 9.8 10.6 12.4
Rabi 13.1 12.1 13.2 9.7 11.7 12.5 12.1 12.3 12.7 13.9
Rice 37.6 40.1 42.7 44.7 43.7 43.8 43.9 45.5 41.9 42.6
Kharif 36.0 38.4 39.7 40.7 39.3 39.6 39.5 40.8 37.6 38.0
Rabi 1.6 1.7 3.0 4.0 4.3 4.2 4.5 4.7 4.3 4.6
Wheat 18.2 22.3 24.2 25.7 26.5 28.0 28.0 27.8 28.5 29.2
Jowar 17.4 15.8 14.4 9.9 8.7 8.5 7.8 7.5 7.7 7.1
Kharif 10.9 10.2 8.6 4.9 3.8 3.7 3.5 2.9 3.2 3.1
Rabi 6.5 5.6 5.8 5.0 4.9 4.8 4.3 4.6 4.5 4.0
Maize 5.8 6.0 5.9 6.6 7.6 7.9 8.1 8.2 8.3 8.5
Bajra 12.9 11.7 10.5 9.8 9.6 9.5 9.6 8.8 8.9 9.4
Gram 7.8 6.6 7.5 5.2 6.9 7.5 7.5 7.9 8.2 9.2
Tur 2.7 2.8 3.6 3.6 3.6 3.6 3.7 3.4 3.5 4.4
Oilseeds b 16.6 17.6 24.1 22.8 27.9 26.5 26.7 27.5 26.0 26.8
Kharif 10.8 10.2 14.0 15.8 17.4 16.8 17.9 18.5 18.0 18.2
Rabi 5.8 7.4 10.1 7.0 10.5 9.7 8.8 9.0 8.0 8.6
Groundnut 7.3 6.8 8.3 6.6 6.7 5.6 6.3 6.2 5.5 6.0
Kharif na 5.9 6.8 5.7 5.7 4.8 5.3 5.3 4.6 5.0
Rabi na 0.9 1.5 0.9 1.0 0.8 1.0 0.9 0.9 1.0
Rapeseed and Mustard 3.3 4.1 5.8 4.5 7.3 6.8 5.8 6.3 5.6 6.5
Sugarcane 2.6 2.7 3.7 4.3 4.2 5.2 5.1 4.4 4.2 4.9
Cotton 7.6 7.8 7.4 8.6 8.7 9.1 9.4 9.4 10.1 11.1
Jute and Mesta 1.1 1.3 1.0 1.0 0.9 0.9 1.0 0.9 0.9 0.9
Jute 0.8 0.9 0.8 0.8 0.8 0.8 0.8 0.8 0.8 0.8
Mesta 0.3 0.4 0.2 0.2 0.1 0.1 0.2 0.1 0.1 0.1
Plantation crops
Tea (Total area) c 0.4 0.4 0.4 0.5 0.6 0.6 0.6 0.6 0.6 0.6
Coffee (Plucked area) 0.1 0.2 0.3 0.3 0.3 0.3 0.4 0.4 0.4 0.4
Rubber (Trapped area) 0.2 0.3 0.5 0.6 0.4 0.5 0.6 0.7 0.7 0.7
Potato 0.5 0.7 0.9 1.2 1.4 1.5 1.6 1.8 1.8 1.8
Source : Directorate of Economics and Statistics, Department of Agriculture and Cooperation.a Fourth Advance Estimates as on 19.07.2011.b Includes groundnut, rapeseed & mustard, sesamum, linseed, castorseed, nigerseed, safflower, sunflower and soyabean.c Calender Year.
na : Not available.
http://indiabudget.nic.in
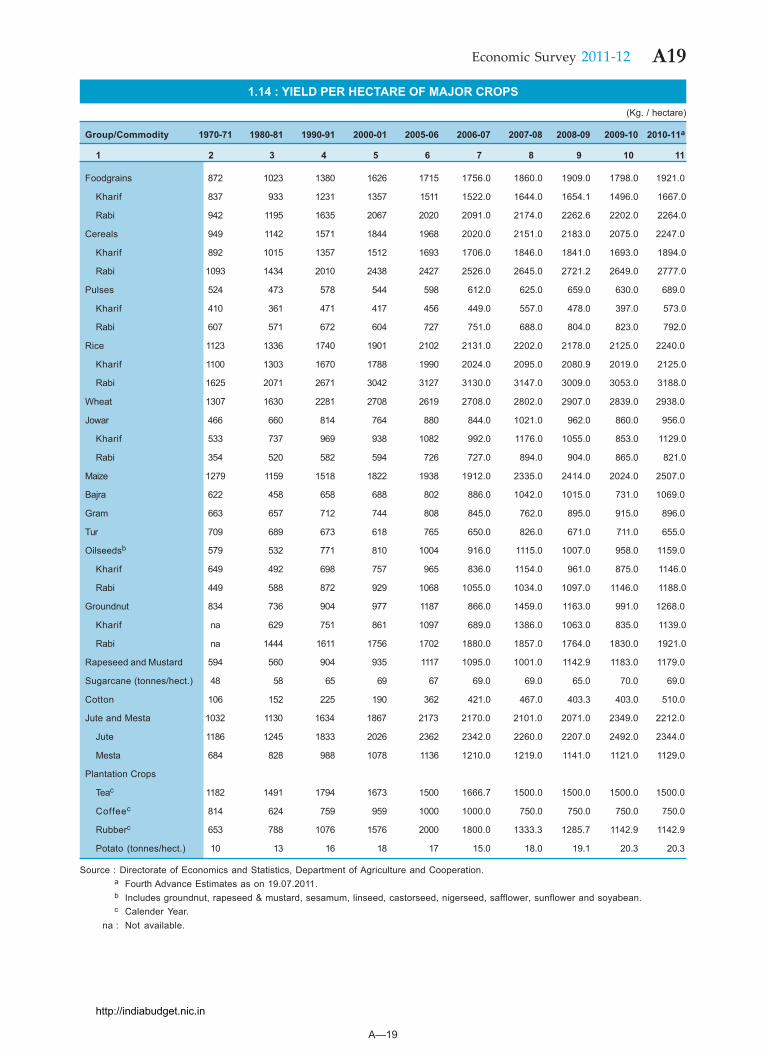
A—19
A19Economic Survey 2011-12
1.14 : YIELD PER HECTARE OF MAJOR CROPS(Kg. / hectare)
Group/Commodity 1970-71 1980-81 1990-91 2000-01 2005-06 2006-07 2007-08 2008-09 2009-10 2010-11a
1 2 3 4 5 6 7 8 9 10 11
Foodgrains 872 1023 1380 1626 1715 1756.0 1860.0 1909.0 1798.0 1921.0
Kharif 837 933 1231 1357 1511 1522.0 1644.0 1654.1 1496.0 1667.0
Rabi 942 1195 1635 2067 2020 2091.0 2174.0 2262.6 2202.0 2264.0
Cereals 949 1142 1571 1844 1968 2020.0 2151.0 2183.0 2075.0 2247.0
Kharif 892 1015 1357 1512 1693 1706.0 1846.0 1841.0 1693.0 1894.0
Rabi 1093 1434 2010 2438 2427 2526.0 2645.0 2721.2 2649.0 2777.0
Pulses 524 473 578 544 598 612.0 625.0 659.0 630.0 689.0
Kharif 410 361 471 417 456 449.0 557.0 478.0 397.0 573.0
Rabi 607 571 672 604 727 751.0 688.0 804.0 823.0 792.0
Rice 1123 1336 1740 1901 2102 2131.0 2202.0 2178.0 2125.0 2240.0
Kharif 1100 1303 1670 1788 1990 2024.0 2095.0 2080.9 2019.0 2125.0
Rabi 1625 2071 2671 3042 3127 3130.0 3147.0 3009.0 3053.0 3188.0
Wheat 1307 1630 2281 2708 2619 2708.0 2802.0 2907.0 2839.0 2938.0
Jowar 466 660 814 764 880 844.0 1021.0 962.0 860.0 956.0
Kharif 533 737 969 938 1082 992.0 1176.0 1055.0 853.0 1129.0
Rabi 354 520 582 594 726 727.0 894.0 904.0 865.0 821.0
Maize 1279 1159 1518 1822 1938 1912.0 2335.0 2414.0 2024.0 2507.0
Bajra 622 458 658 688 802 886.0 1042.0 1015.0 731.0 1069.0
Gram 663 657 712 744 808 845.0 762.0 895.0 915.0 896.0
Tur 709 689 673 618 765 650.0 826.0 671.0 711.0 655.0
Oilseedsb 579 532 771 810 1004 916.0 1115.0 1007.0 958.0 1159.0
Kharif 649 492 698 757 965 836.0 1154.0 961.0 875.0 1146.0
Rabi 449 588 872 929 1068 1055.0 1034.0 1097.0 1146.0 1188.0
Groundnut 834 736 904 977 1187 866.0 1459.0 1163.0 991.0 1268.0
Kharif na 629 751 861 1097 689.0 1386.0 1063.0 835.0 1139.0
Rabi na 1444 1611 1756 1702 1880.0 1857.0 1764.0 1830.0 1921.0
Rapeseed and Mustard 594 560 904 935 1117 1095.0 1001.0 1142.9 1183.0 1179.0
Sugarcane (tonnes/hect.) 48 58 65 69 67 69.0 69.0 65.0 70.0 69.0
Cotton 106 152 225 190 362 421.0 467.0 403.3 403.0 510.0
Jute and Mesta 1032 1130 1634 1867 2173 2170.0 2101.0 2071.0 2349.0 2212.0
Jute 1186 1245 1833 2026 2362 2342.0 2260.0 2207.0 2492.0 2344.0
Mesta 684 828 988 1078 1136 1210.0 1219.0 1141.0 1121.0 1129.0
Plantation Crops
Teac 1182 1491 1794 1673 1500 1666.7 1500.0 1500.0 1500.0 1500.0
Coffeec 814 624 759 959 1000 1000.0 750.0 750.0 750.0 750.0
Rubberc 653 788 1076 1576 2000 1800.0 1333.3 1285.7 1142.9 1142.9
Potato (tonnes/hect.) 10 13 16 18 17 15.0 18.0 19.1 20.3 20.3
Source : Directorate of Economics and Statistics, Department of Agriculture and Cooperation.a Fourth Advance Estimates as on 19.07.2011.b Includes groundnut, rapeseed & mustard, sesamum, linseed, castorseed, nigerseed, safflower, sunflower and soyabean.c Calender Year.
na : Not available.
http://indiabudget.nic.in
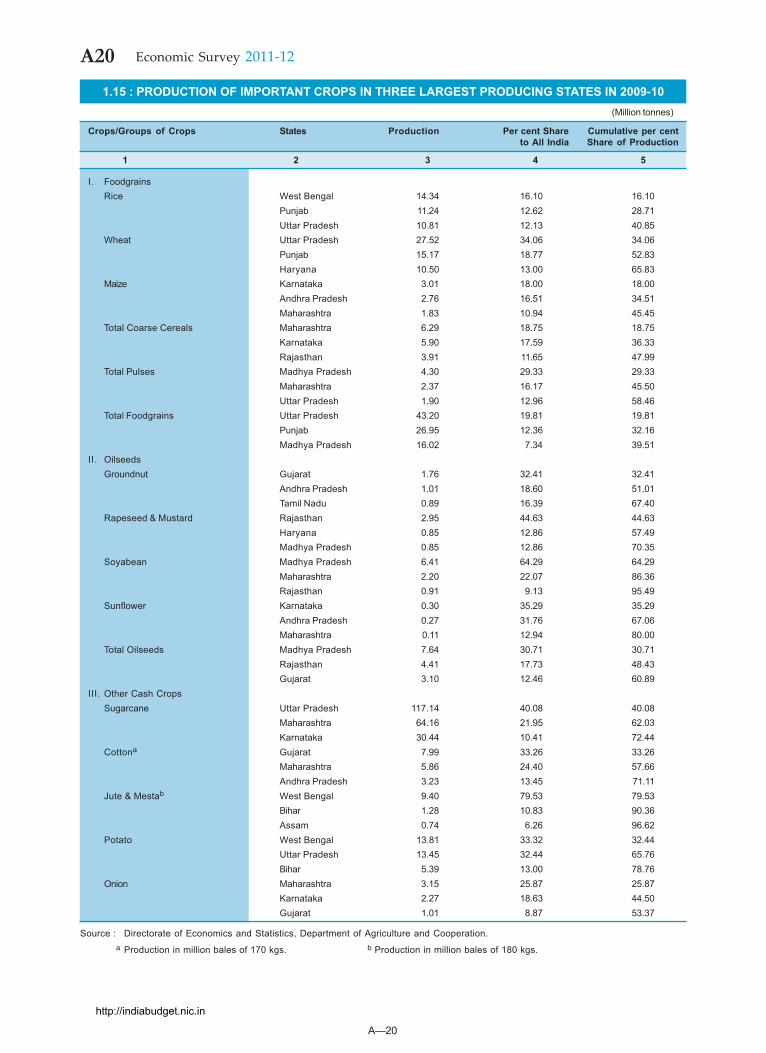
A—20
A20 Economic Survey 2011-12
1.15 : PRODUCTION OF IMPORTANT CROPS IN THREE LARGEST PRODUCING STATES IN 2009-10(Million tonnes)
Crops/Groups of Crops States Production Per cent Share Cumulative per centto All India Share of Production
1 2 3 4 5
I. FoodgrainsRice West Bengal 14.34 16.10 16.10
Punjab 11.24 12.62 28.71Uttar Pradesh 10.81 12.13 40.85
Wheat Uttar Pradesh 27.52 34.06 34.06Punjab 15.17 18.77 52.83Haryana 10.50 13.00 65.83
Maize Karnataka 3.01 18.00 18.00Andhra Pradesh 2.76 16.51 34.51Maharashtra 1.83 10.94 45.45
Total Coarse Cereals Maharashtra 6.29 18.75 18.75Karnataka 5.90 17.59 36.33Rajasthan 3.91 11.65 47.99
Total Pulses Madhya Pradesh 4.30 29.33 29.33Maharashtra 2.37 16.17 45.50Uttar Pradesh 1.90 12.96 58.46
Total Foodgrains Uttar Pradesh 43.20 19.81 19.81Punjab 26.95 12.36 32.16Madhya Pradesh 16.02 7.34 39.51
II. OilseedsGroundnut Gujarat 1.76 32.41 32.41
Andhra Pradesh 1.01 18.60 51.01Tamil Nadu 0.89 16.39 67.40
Rapeseed & Mustard Rajasthan 2.95 44.63 44.63Haryana 0.85 12.86 57.49Madhya Pradesh 0.85 12.86 70.35
Soyabean Madhya Pradesh 6.41 64.29 64.29Maharashtra 2.20 22.07 86.36Rajasthan 0.91 9.13 95.49
Sunflower Karnataka 0.30 35.29 35.29Andhra Pradesh 0.27 31.76 67.06Maharashtra 0.11 12.94 80.00
Total Oilseeds Madhya Pradesh 7.64 30.71 30.71Rajasthan 4.41 17.73 48.43Gujarat 3.10 12.46 60.89
III. Other Cash CropsSugarcane Uttar Pradesh 117.14 40.08 40.08
Maharashtra 64.16 21.95 62.03Karnataka 30.44 10.41 72.44
Cottona Gujarat 7.99 33.26 33.26Maharashtra 5.86 24.40 57.66Andhra Pradesh 3.23 13.45 71.11
Jute & Mestab West Bengal 9.40 79.53 79.53Bihar 1.28 10.83 90.36Assam 0.74 6.26 96.62
Potato West Bengal 13.81 33.32 32.44Uttar Pradesh 13.45 32.44 65.76Bihar 5.39 13.00 78.76
Onion Maharashtra 3.15 25.87 25.87Karnataka 2.27 18.63 44.50Gujarat 1.01 8.87 53.37
Source : Directorate of Economics and Statistics, Department of Agriculture and Cooperation.a Production in million bales of 170 kgs. b Production in million bales of 180 kgs.
http://indiabudget.nic.in
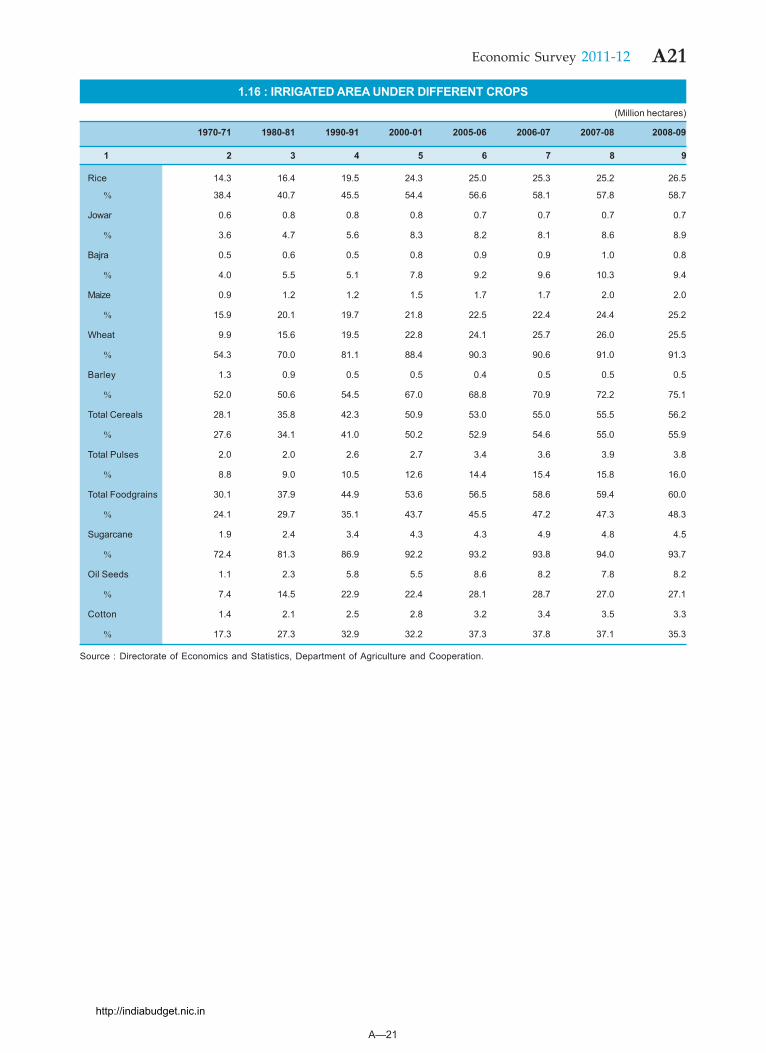
A—21
A21Economic Survey 2011-12
1.16 : IRRIGATED AREA UNDER DIFFERENT CROPS(Million hectares)
1970-71 1980-81 1990-91 2000-01 2005-06 2006-07 2007-08 2008-09
1 2 3 4 5 6 7 8 9
Rice 14.3 16.4 19.5 24.3 25.0 25.3 25.2 26.5
% 38.4 40.7 45.5 54.4 56.6 58.1 57.8 58.7
Jowar 0.6 0.8 0.8 0.8 0.7 0.7 0.7 0.7
% 3.6 4.7 5.6 8.3 8.2 8.1 8.6 8.9
Bajra 0.5 0.6 0.5 0.8 0.9 0.9 1.0 0.8
% 4.0 5.5 5.1 7.8 9.2 9.6 10.3 9.4
Maize 0.9 1.2 1.2 1.5 1.7 1.7 2.0 2.0
% 15.9 20.1 19.7 21.8 22.5 22.4 24.4 25.2
Wheat 9.9 15.6 19.5 22.8 24.1 25.7 26.0 25.5
% 54.3 70.0 81.1 88.4 90.3 90.6 91.0 91.3
Barley 1.3 0.9 0.5 0.5 0.4 0.5 0.5 0.5
% 52.0 50.6 54.5 67.0 68.8 70.9 72.2 75.1
Total Cereals 28.1 35.8 42.3 50.9 53.0 55.0 55.5 56.2
% 27.6 34.1 41.0 50.2 52.9 54.6 55.0 55.9
Total Pulses 2.0 2.0 2.6 2.7 3.4 3.6 3.9 3.8
% 8.8 9.0 10.5 12.6 14.4 15.4 15.8 16.0
Total Foodgrains 30.1 37.9 44.9 53.6 56.5 58.6 59.4 60.0
% 24.1 29.7 35.1 43.7 45.5 47.2 47.3 48.3
Sugarcane 1.9 2.4 3.4 4.3 4.3 4.9 4.8 4.5
% 72.4 81.3 86.9 92.2 93.2 93.8 94.0 93.7
Oil Seeds 1.1 2.3 5.8 5.5 8.6 8.2 7.8 8.2
% 7.4 14.5 22.9 22.4 28.1 28.7 27.0 27.1
Cotton 1.4 2.1 2.5 2.8 3.2 3.4 3.5 3.3
% 17.3 27.3 32.9 32.2 37.3 37.8 37.1 35.3
Source : Directorate of Economics and Statistics, Department of Agriculture and Cooperation.
http://indiabudget.nic.in
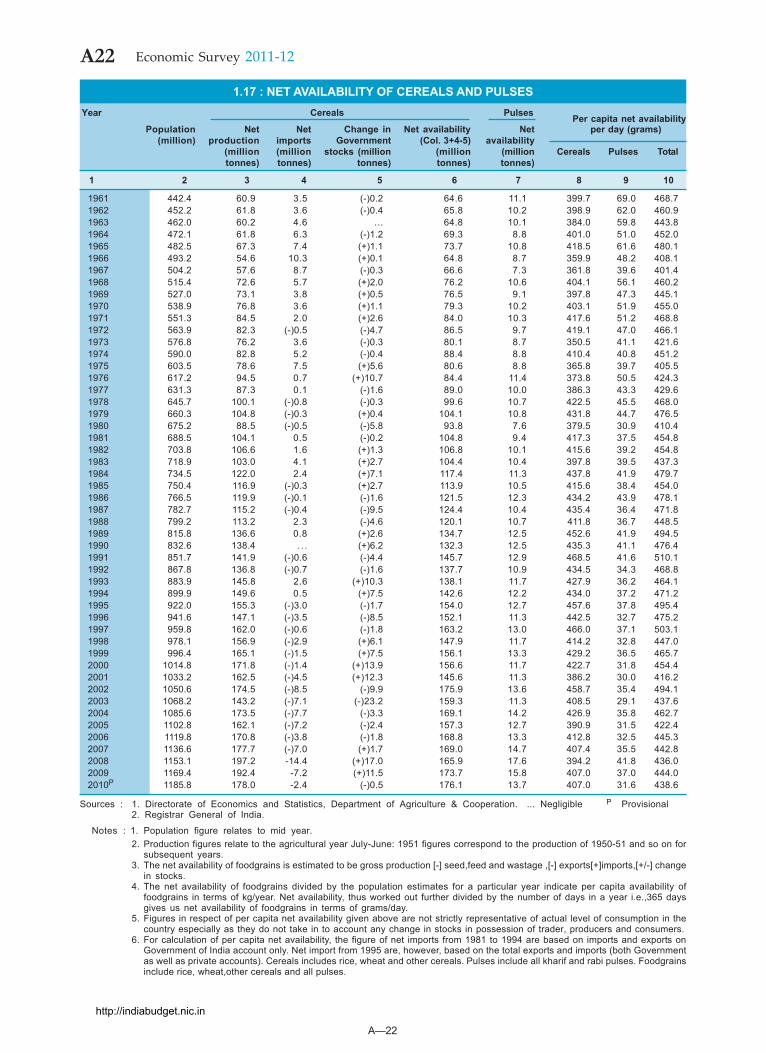
A—22
A22 Economic Survey 2011-12
1.17 : NET AVAILABILITY OF CEREALS AND PULSES Year Cereals Pulses
Population Net Net Change in Net availability Net per day (grams)(million) production imports Government (Col. 3+4-5) availability
(million (million stocks (million (million (million Cereals Pulses Totaltonnes) tonnes) tonnes) tonnes) tonnes)
1 2 3 4 5 6 7 8 9 10
1961 442.4 60.9 3.5 (-)0.2 64.6 11.1 399.7 69.0 468.71962 452.2 61.8 3.6 (-)0.4 65.8 10.2 398.9 62.0 460.91963 462.0 60.2 4.6 … 64.8 10.1 384.0 59.8 443.81964 472.1 61.8 6.3 (-)1.2 69.3 8.8 401.0 51.0 452.01965 482.5 67.3 7.4 (+)1.1 73.7 10.8 418.5 61.6 480.11966 493.2 54.6 10.3 (+)0.1 64.8 8.7 359.9 48.2 408.11967 504.2 57.6 8.7 (-)0.3 66.6 7.3 361.8 39.6 401.41968 515.4 72.6 5.7 (+)2.0 76.2 10.6 404.1 56.1 460.21969 527.0 73.1 3.8 (+)0.5 76.5 9.1 397.8 47.3 445.11970 538.9 76.8 3.6 (+)1.1 79.3 10.2 403.1 51.9 455.01971 551.3 84.5 2.0 (+)2.6 84.0 10.3 417.6 51.2 468.81972 563.9 82.3 (-)0.5 (-)4.7 86.5 9.7 419.1 47.0 466.11973 576.8 76.2 3.6 (-)0.3 80.1 8.7 350.5 41.1 421.61974 590.0 82.8 5.2 (-)0.4 88.4 8.8 410.4 40.8 451.21975 603.5 78.6 7.5 (+)5.6 80.6 8.8 365.8 39.7 405.51976 617.2 94.5 0.7 (+)10.7 84.4 11.4 373.8 50.5 424.31977 631.3 87.3 0.1 (-)1.6 89.0 10.0 386.3 43.3 429.61978 645.7 100.1 (-)0.8 (-)0.3 99.6 10.7 422.5 45.5 468.01979 660.3 104.8 (-)0.3 (+)0.4 104.1 10.8 431.8 44.7 476.51980 675.2 88.5 (-)0.5 (-)5.8 93.8 7.6 379.5 30.9 410.41981 688.5 104.1 0.5 (-)0.2 104.8 9.4 417.3 37.5 454.81982 703.8 106.6 1.6 (+)1.3 106.8 10.1 415.6 39.2 454.81983 718.9 103.0 4.1 (+)2.7 104.4 10.4 397.8 39.5 437.31984 734.5 122.0 2.4 (+)7.1 117.4 11.3 437.8 41.9 479.71985 750.4 116.9 (-)0.3 (+)2.7 113.9 10.5 415.6 38.4 454.01986 766.5 119.9 (-)0.1 (-)1.6 121.5 12.3 434.2 43.9 478.11987 782.7 115.2 (-)0.4 (-)9.5 124.4 10.4 435.4 36.4 471.81988 799.2 113.2 2.3 (-)4.6 120.1 10.7 411.8 36.7 448.51989 815.8 136.6 0.8 (+)2.6 134.7 12.5 452.6 41.9 494.51990 832.6 138.4 . . . (+)6.2 132.3 12.5 435.3 41.1 476.41991 851.7 141.9 (-)0.6 (-)4.4 145.7 12.9 468.5 41.6 510.11992 867.8 136.8 (-)0.7 (-)1.6 137.7 10.9 434.5 34.3 468.81993 883.9 145.8 2.6 (+)10.3 138.1 11.7 427.9 36.2 464.11994 899.9 149.6 0.5 (+)7.5 142.6 12.2 434.0 37.2 471.21995 922.0 155.3 (-)3.0 (-)1.7 154.0 12.7 457.6 37.8 495.41996 941.6 147.1 (-)3.5 (-)8.5 152.1 11.3 442.5 32.7 475.21997 959.8 162.0 (-)0.6 (-)1.8 163.2 13.0 466.0 37.1 503.11998 978.1 156.9 (-)2.9 (+)6.1 147.9 11.7 414.2 32.8 447.01999 996.4 165.1 (-)1.5 (+)7.5 156.1 13.3 429.2 36.5 465.72000 1014.8 171.8 (-)1.4 (+)13.9 156.6 11.7 422.7 31.8 454.42001 1033.2 162.5 (-)4.5 (+)12.3 145.6 11.3 386.2 30.0 416.22002 1050.6 174.5 (-)8.5 (-)9.9 175.9 13.6 458.7 35.4 494.12003 1068.2 143.2 (-)7.1 (-)23.2 159.3 11.3 408.5 29.1 437.62004 1085.6 173.5 (-)7.7 (-)3.3 169.1 14.2 426.9 35.8 462.72005 1102.8 162.1 (-)7.2 (-)2.4 157.3 12.7 390.9 31.5 422.42006 1119.8 170.8 (-)3.8 (-)1.8 168.8 13.3 412.8 32.5 445.32007 1136.6 177.7 (-)7.0 (+)1.7 169.0 14.7 407.4 35.5 442.82008 1153.1 197.2 -14.4 (+)17.0 165.9 17.6 394.2 41.8 436.02009 1169.4 192.4 -7.2 (+)11.5 173.7 15.8 407.0 37.0 444.02010P 1185.8 178.0 -2.4 (-)0.5 176.1 13.7 407.0 31.6 438.6
Sources : 1. Directorate of Economics and Statistics, Department of Agriculture & Cooperation. ... Negligible P Provisional2. Registrar General of India.
Notes : 1. Population figure relates to mid year.2. Production figures relate to the agricultural year July-June: 1951 figures correspond to the production of 1950-51 and so on for
subsequent years.3. The net availability of foodgrains is estimated to be gross production [-] seed,feed and wastage ,[-] exports[+]imports,[+/-] change
in stocks.4. The net availability of foodgrains divided by the population estimates for a particular year indicate per capita availability of
foodgrains in terms of kg/year. Net availability, thus worked out further divided by the number of days in a year i.e.,365 daysgives us net availability of foodgrains in terms of grams/day.
5. Figures in respect of per capita net availability given above are not strictly representative of actual level of consumption in thecountry especially as they do not take in to account any change in stocks in possession of trader, producers and consumers.
6. For calculation of per capita net availability, the figure of net imports from 1981 to 1994 are based on imports and exports onGovernment of India account only. Net import from 1995 are, however, based on the total exports and imports (both Governmentas well as private accounts). Cereals includes rice, wheat and other cereals. Pulses include all kharif and rabi pulses. Foodgrainsinclude rice, wheat,other cereals and all pulses.
Per capita net availability
http://indiabudget.nic.in
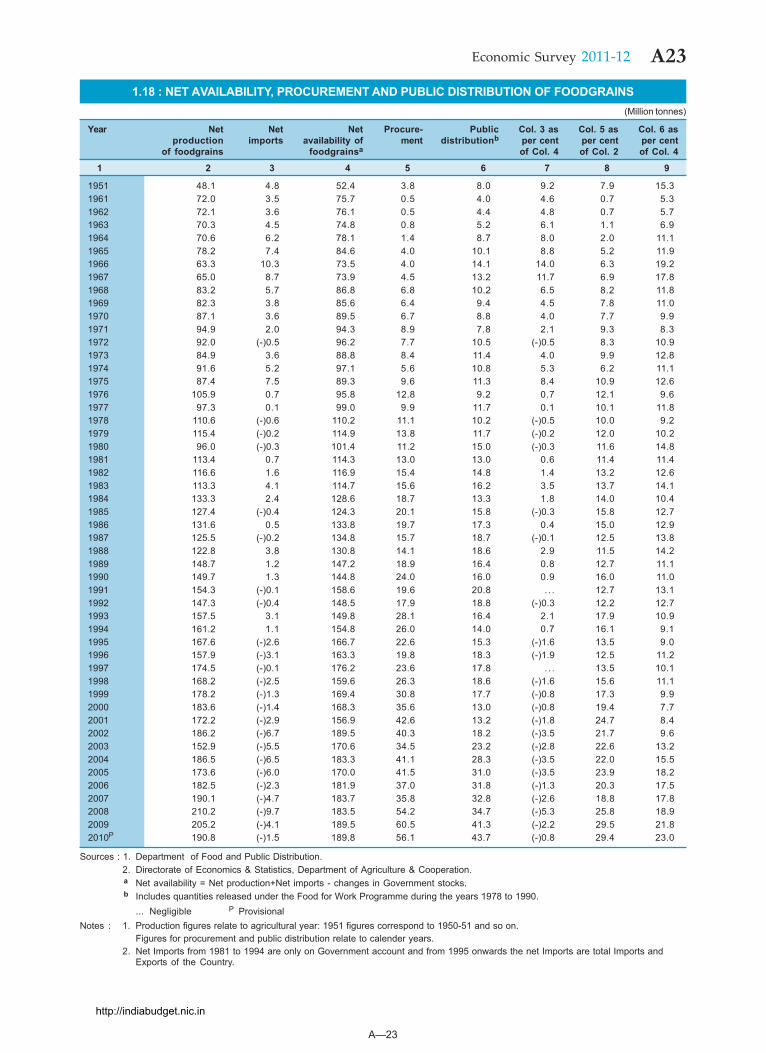
A—23
A23Economic Survey 2011-12
1.18 : NET AVAILABILITY, PROCUREMENT AND PUBLIC DISTRIBUTION OF FOODGRAINS(Million tonnes)
Year Net Net Net Procure- Public Col. 3 as Col. 5 as Col. 6 asproduction imports availability of ment distributionb per cent per cent per cent
of foodgrains foodgrainsa of Col. 4 of Col. 2 of Col. 4
1 2 3 4 5 6 7 8 9
1951 48.1 4.8 52.4 3.8 8.0 9.2 7.9 15.31961 72.0 3.5 75.7 0.5 4.0 4.6 0.7 5.31962 72.1 3.6 76.1 0.5 4.4 4.8 0.7 5.71963 70.3 4.5 74.8 0.8 5.2 6.1 1.1 6.91964 70.6 6.2 78.1 1.4 8.7 8.0 2.0 11.11965 78.2 7.4 84.6 4.0 10.1 8.8 5.2 11.91966 63.3 10.3 73.5 4.0 14.1 14.0 6.3 19.21967 65.0 8.7 73.9 4.5 13.2 11.7 6.9 17.81968 83.2 5.7 86.8 6.8 10.2 6.5 8.2 11.81969 82.3 3.8 85.6 6.4 9.4 4.5 7.8 11.01970 87.1 3.6 89.5 6.7 8.8 4.0 7.7 9.91971 94.9 2.0 94.3 8.9 7.8 2.1 9.3 8.31972 92.0 (-)0.5 96.2 7.7 10.5 (-)0.5 8.3 10.91973 84.9 3.6 88.8 8.4 11.4 4.0 9.9 12.81974 91.6 5.2 97.1 5.6 10.8 5.3 6.2 11.11975 87.4 7.5 89.3 9.6 11.3 8.4 10.9 12.61976 105.9 0.7 95.8 12.8 9.2 0.7 12.1 9.61977 97.3 0.1 99.0 9.9 11.7 0.1 10.1 11.81978 110.6 (-)0.6 110.2 11.1 10.2 (-)0.5 10.0 9.21979 115.4 (-)0.2 114.9 13.8 11.7 (-)0.2 12.0 10.21980 96.0 (-)0.3 101.4 11.2 15.0 (-)0.3 11.6 14.81981 113.4 0.7 114.3 13.0 13.0 0.6 11.4 11.41982 116.6 1.6 116.9 15.4 14.8 1.4 13.2 12.61983 113.3 4.1 114.7 15.6 16.2 3.5 13.7 14.11984 133.3 2.4 128.6 18.7 13.3 1.8 14.0 10.41985 127.4 (-)0.4 124.3 20.1 15.8 (-)0.3 15.8 12.71986 131.6 0.5 133.8 19.7 17.3 0.4 15.0 12.91987 125.5 (-)0.2 134.8 15.7 18.7 (-)0.1 12.5 13.81988 122.8 3.8 130.8 14.1 18.6 2.9 11.5 14.21989 148.7 1.2 147.2 18.9 16.4 0.8 12.7 11.11990 149.7 1.3 144.8 24.0 16.0 0.9 16.0 11.01991 154.3 (-)0.1 158.6 19.6 20.8 . . . 12.7 13.11992 147.3 (-)0.4 148.5 17.9 18.8 (-)0.3 12.2 12.71993 157.5 3.1 149.8 28.1 16.4 2.1 17.9 10.91994 161.2 1.1 154.8 26.0 14.0 0.7 16.1 9.11995 167.6 (-)2.6 166.7 22.6 15.3 (-)1.6 13.5 9.01996 157.9 (-)3.1 163.3 19.8 18.3 (-)1.9 12.5 11.21997 174.5 (-)0.1 176.2 23.6 17.8 . . . 13.5 10.11998 168.2 (-)2.5 159.6 26.3 18.6 (-)1.6 15.6 11.11999 178.2 (-)1.3 169.4 30.8 17.7 (-)0.8 17.3 9.92000 183.6 (-)1.4 168.3 35.6 13.0 (-)0.8 19.4 7.72001 172.2 (-)2.9 156.9 42.6 13.2 (-)1.8 24.7 8.42002 186.2 (-)6.7 189.5 40.3 18.2 (-)3.5 21.7 9.62003 152.9 (-)5.5 170.6 34.5 23.2 (-)2.8 22.6 13.22004 186.5 (-)6.5 183.3 41.1 28.3 (-)3.5 22.0 15.52005 173.6 (-)6.0 170.0 41.5 31.0 (-)3.5 23.9 18.22006 182.5 (-)2.3 181.9 37.0 31.8 (-)1.3 20.3 17.52007 190.1 (-)4.7 183.7 35.8 32.8 (-)2.6 18.8 17.82008 210.2 (-)9.7 183.5 54.2 34.7 (-)5.3 25.8 18.92009 205.2 (-)4.1 189.5 60.5 41.3 (-)2.2 29.5 21.82010P 190.8 (-)1.5 189.8 56.1 43.7 (-)0.8 29.4 23.0
Sources : 1. Department of Food and Public Distribution.2. Directorate of Economics & Statistics, Department of Agriculture & Cooperation.a Net availability = Net production+Net imports - changes in Government stocks.b Includes quantities released under the Food for Work Programme during the years 1978 to 1990.
... Negligible P ProvisionalNotes : 1. Production figures relate to agricultural year: 1951 figures correspond to 1950-51 and so on.
Figures for procurement and public distribution relate to calender years.2. Net Imports from 1981 to 1994 are only on Government account and from 1995 onwards the net Imports are total Imports and
Exports of the Country.
http://indiabudget.nic.in
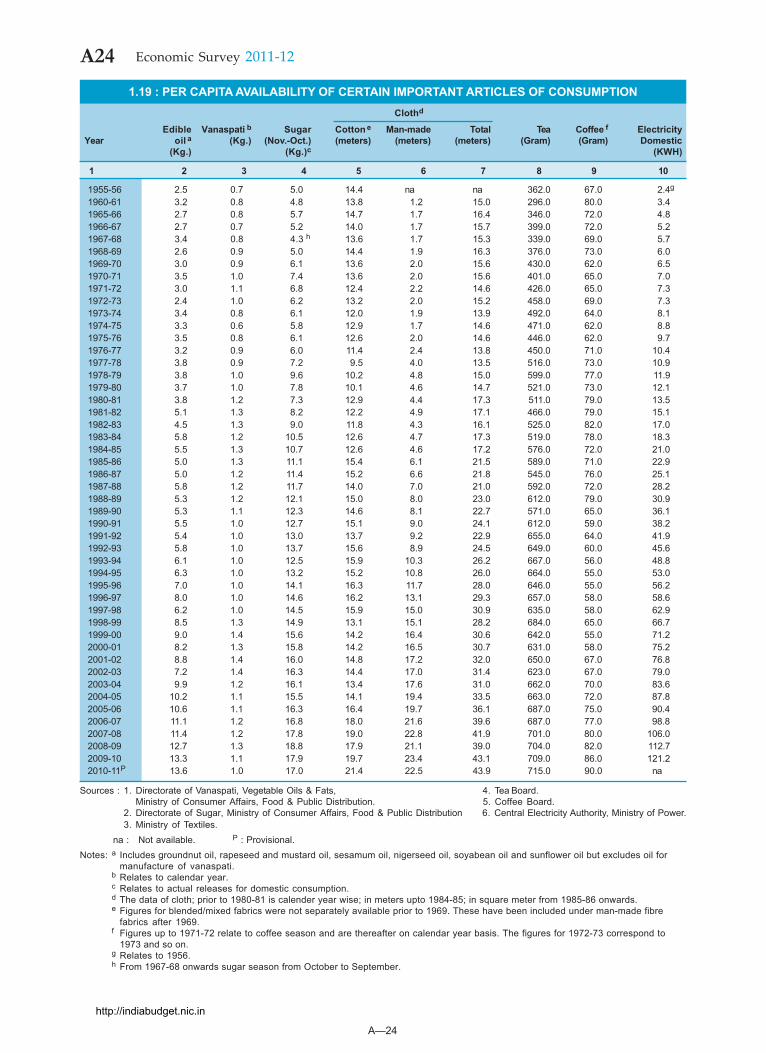
A—24
A24 Economic Survey 2011-12
1.19 : PER CAPITA AVAILABILITY OF CERTAIN IMPORTANT ARTICLES OF CONSUMPTIONClothd
Edible Vanaspati b Sugar Cotton e Man-made Total Tea Coffee f ElectricityYear oil a (Kg.) (Nov.-Oct.) (meters) (meters) (meters) (Gram) (Gram) Domestic
(Kg.) (Kg.)c (KWH)
1 2 3 4 5 6 7 8 9 10
1955-56 2.5 0.7 5.0 14.4 na na 362.0 67.0 2.4g
1960-61 3.2 0.8 4.8 13.8 1.2 15.0 296.0 80.0 3.41965-66 2.7 0.8 5.7 14.7 1.7 16.4 346.0 72.0 4.81966-67 2.7 0.7 5.2 14.0 1.7 15.7 399.0 72.0 5.21967-68 3.4 0.8 4.3 h 13.6 1.7 15.3 339.0 69.0 5.71968-69 2.6 0.9 5.0 14.4 1.9 16.3 376.0 73.0 6.01969-70 3.0 0.9 6.1 13.6 2.0 15.6 430.0 62.0 6.51970-71 3.5 1.0 7.4 13.6 2.0 15.6 401.0 65.0 7.01971-72 3.0 1.1 6.8 12.4 2.2 14.6 426.0 65.0 7.31972-73 2.4 1.0 6.2 13.2 2.0 15.2 458.0 69.0 7.31973-74 3.4 0.8 6.1 12.0 1.9 13.9 492.0 64.0 8.11974-75 3.3 0.6 5.8 12.9 1.7 14.6 471.0 62.0 8.81975-76 3.5 0.8 6.1 12.6 2.0 14.6 446.0 62.0 9.71976-77 3.2 0.9 6.0 11.4 2.4 13.8 450.0 71.0 10.41977-78 3.8 0.9 7.2 9.5 4.0 13.5 516.0 73.0 10.91978-79 3.8 1.0 9.6 10.2 4.8 15.0 599.0 77.0 11.91979-80 3.7 1.0 7.8 10.1 4.6 14.7 521.0 73.0 12.11980-81 3.8 1.2 7.3 12.9 4.4 17.3 511.0 79.0 13.51981-82 5.1 1.3 8.2 12.2 4.9 17.1 466.0 79.0 15.11982-83 4.5 1.3 9.0 11.8 4.3 16.1 525.0 82.0 17.01983-84 5.8 1.2 10.5 12.6 4.7 17.3 519.0 78.0 18.31984-85 5.5 1.3 10.7 12.6 4.6 17.2 576.0 72.0 21.01985-86 5.0 1.3 11.1 15.4 6.1 21.5 589.0 71.0 22.91986-87 5.0 1.2 11.4 15.2 6.6 21.8 545.0 76.0 25.11987-88 5.8 1.2 11.7 14.0 7.0 21.0 592.0 72.0 28.21988-89 5.3 1.2 12.1 15.0 8.0 23.0 612.0 79.0 30.91989-90 5.3 1.1 12.3 14.6 8.1 22.7 571.0 65.0 36.11990-91 5.5 1.0 12.7 15.1 9.0 24.1 612.0 59.0 38.21991-92 5.4 1.0 13.0 13.7 9.2 22.9 655.0 64.0 41.91992-93 5.8 1.0 13.7 15.6 8.9 24.5 649.0 60.0 45.61993-94 6.1 1.0 12.5 15.9 10.3 26.2 667.0 56.0 48.81994-95 6.3 1.0 13.2 15.2 10.8 26.0 664.0 55.0 53.01995-96 7.0 1.0 14.1 16.3 11.7 28.0 646.0 55.0 56.21996-97 8.0 1.0 14.6 16.2 13.1 29.3 657.0 58.0 58.61997-98 6.2 1.0 14.5 15.9 15.0 30.9 635.0 58.0 62.91998-99 8.5 1.3 14.9 13.1 15.1 28.2 684.0 65.0 66.71999-00 9.0 1.4 15.6 14.2 16.4 30.6 642.0 55.0 71.22000-01 8.2 1.3 15.8 14.2 16.5 30.7 631.0 58.0 75.22001-02 8.8 1.4 16.0 14.8 17.2 32.0 650.0 67.0 76.82002-03 7.2 1.4 16.3 14.4 17.0 31.4 623.0 67.0 79.02003-04 9.9 1.2 16.1 13.4 17.6 31.0 662.0 70.0 83.62004-05 10.2 1.1 15.5 14.1 19.4 33.5 663.0 72.0 87.82005-06 10.6 1.1 16.3 16.4 19.7 36.1 687.0 75.0 90.42006-07 11.1 1.2 16.8 18.0 21.6 39.6 687.0 77.0 98.82007-08 11.4 1.2 17.8 19.0 22.8 41.9 701.0 80.0 106.02008-09 12.7 1.3 18.8 17.9 21.1 39.0 704.0 82.0 112.72009-10 13.3 1.1 17.9 19.7 23.4 43.1 709.0 86.0 121.22010-11P 13.6 1.0 17.0 21.4 22.5 43.9 715.0 90.0 na
Sources : 1. Directorate of Vanaspati, Vegetable Oils & Fats, 4. Tea Board.Ministry of Consumer Affairs, Food & Public Distribution. 5. Coffee Board.
2. Directorate of Sugar, Ministry of Consumer Affairs, Food & Public Distribution 6. Central Electricity Authority, Ministry of Power.3. Ministry of Textiles.
na : Not available. P : Provisional.Notes: a Includes groundnut oil, rapeseed and mustard oil, sesamum oil, nigerseed oil, soyabean oil and sunflower oil but excludes oil for
manufacture of vanaspati.b Relates to calendar year.c Relates to actual releases for domestic consumption.d The data of cloth; prior to 1980-81 is calender year wise; in meters upto 1984-85; in square meter from 1985-86 onwards.e Figures for blended/mixed fabrics were not separately available prior to 1969. These have been included under man-made fibre
fabrics after 1969.f Figures up to 1971-72 relate to coffee season and are thereafter on calendar year basis. The figures for 1972-73 correspond to
1973 and so on.g Relates to 1956.h From 1967-68 onwards sugar season from October to September.
http://indiabudget.nic.in
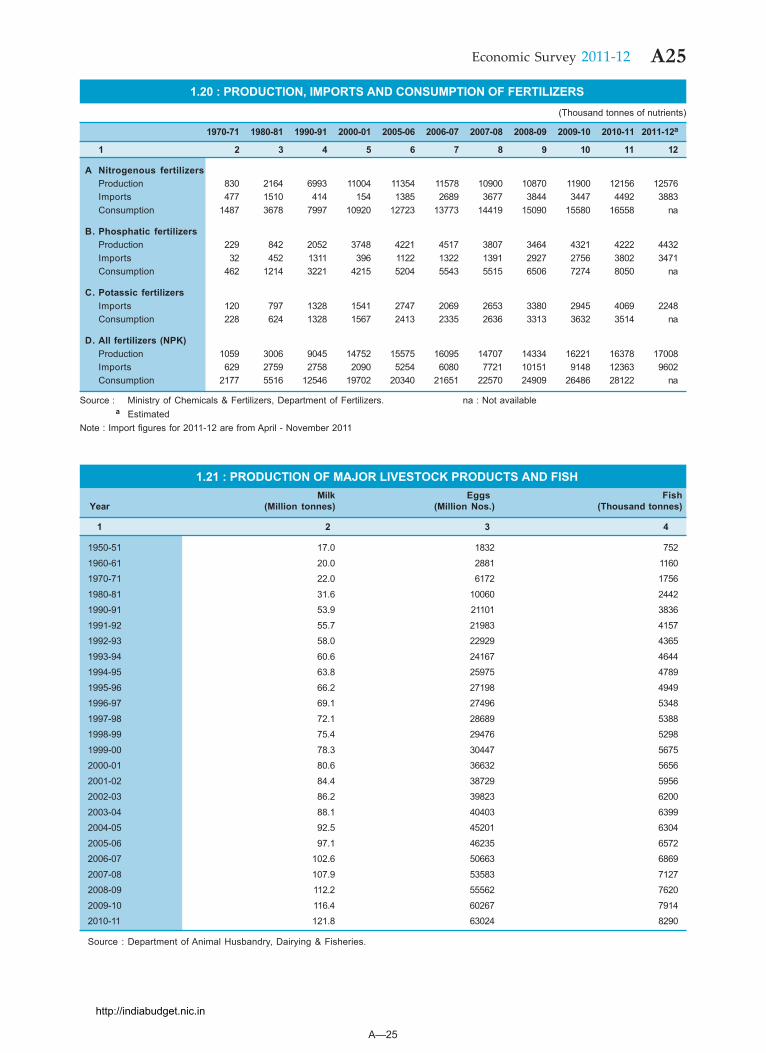
A—25
A25Economic Survey 2011-12
1.20 : PRODUCTION, IMPORTS AND CONSUMPTION OF FERTILIZERS(Thousand tonnes of nutrients)
1970-71 1980-81 1990-91 2000-01 2005-06 2006-07 2007-08 2008-09 2009-10 2010-11 2011-12a
1 2 3 4 5 6 7 8 9 10 11 12
A Nitrogenous fertilizersProduction 830 2164 6993 11004 11354 11578 10900 10870 11900 12156 12576Imports 477 1510 414 154 1385 2689 3677 3844 3447 4492 3883Consumption 1487 3678 7997 10920 12723 13773 14419 15090 15580 16558 na
B. Phosphatic fertilizersProduction 229 842 2052 3748 4221 4517 3807 3464 4321 4222 4432Imports 32 452 1311 396 1122 1322 1391 2927 2756 3802 3471Consumption 462 1214 3221 4215 5204 5543 5515 6506 7274 8050 na
C. Potassic fertilizersImports 120 797 1328 1541 2747 2069 2653 3380 2945 4069 2248Consumption 228 624 1328 1567 2413 2335 2636 3313 3632 3514 na
D. All fertilizers (NPK)Production 1059 3006 9045 14752 15575 16095 14707 14334 16221 16378 17008Imports 629 2759 2758 2090 5254 6080 7721 10151 9148 12363 9602Consumption 2177 5516 12546 19702 20340 21651 22570 24909 26486 28122 na
Source : Ministry of Chemicals & Fertilizers, Department of Fertilizers. na : Not availablea Estimated
Note : Import figures for 2011-12 are from April - November 2011
1.21 : PRODUCTION OF MAJOR LIVESTOCK PRODUCTS AND FISHMilk Eggs Fish
Year (Million tonnes) (Million Nos.) (Thousand tonnes)
1 2 3 4
1950-51 17.0 1832 752
1960-61 20.0 2881 11601970-71 22.0 6172 1756
1980-81 31.6 10060 24421990-91 53.9 21101 3836
1991-92 55.7 21983 41571992-93 58.0 22929 4365
1993-94 60.6 24167 46441994-95 63.8 25975 4789
1995-96 66.2 27198 49491996-97 69.1 27496 5348
1997-98 72.1 28689 53881998-99 75.4 29476 5298
1999-00 78.3 30447 56752000-01 80.6 36632 5656
2001-02 84.4 38729 59562002-03 86.2 39823 6200
2003-04 88.1 40403 63992004-05 92.5 45201 6304
2005-06 97.1 46235 65722006-07 102.6 50663 6869
2007-08 107.9 53583 71272008-09 112.2 55562 7620
2009-10 116.4 60267 79142010-11 121.8 63024 8290
Source : Department of Animal Husbandry, Dairying & Fisheries.
http://indiabudget.nic.in
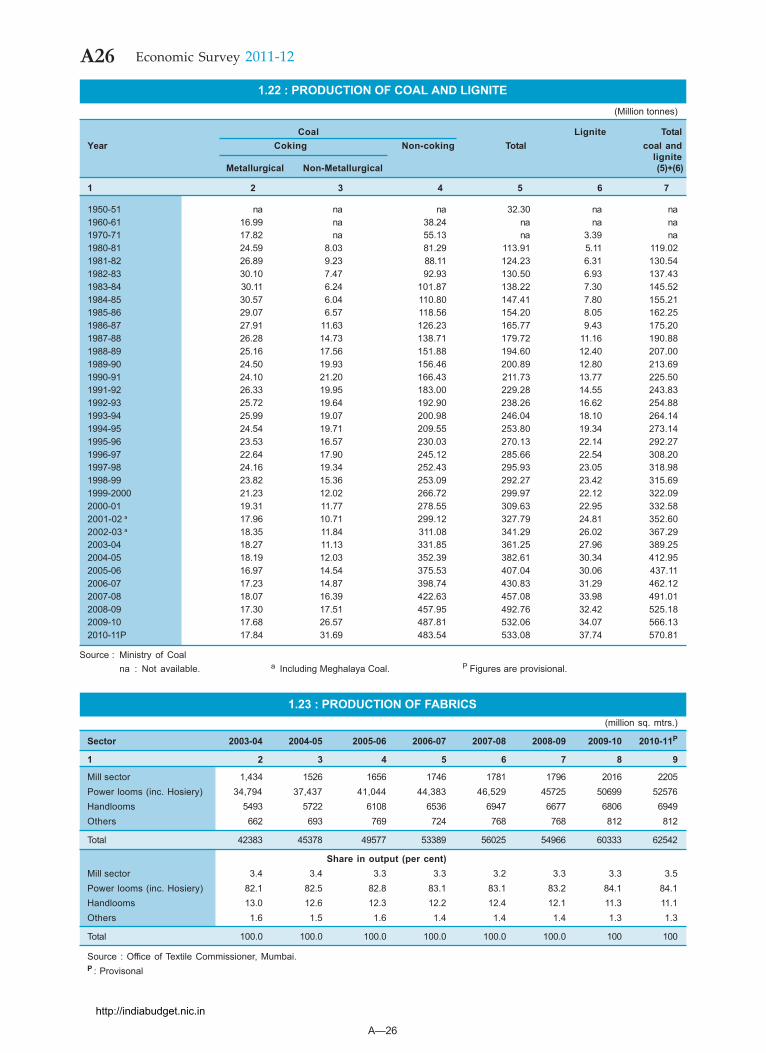
A—26
A26 Economic Survey 2011-12
1.23 : PRODUCTION OF FABRICS(million sq. mtrs.)
Sector 2003-04 2004-05 2005-06 2006-07 2007-08 2008-09 2009-10 2010-11P
1 2 3 4 5 6 7 8 9
Mill sector 1,434 1526 1656 1746 1781 1796 2016 2205Power looms (inc. Hosiery) 34,794 37,437 41,044 44,383 46,529 45725 50699 52576Handlooms 5493 5722 6108 6536 6947 6677 6806 6949Others 662 693 769 724 768 768 812 812
Total 42383 45378 49577 53389 56025 54966 60333 62542
Share in output (per cent)Mill sector 3.4 3.4 3.3 3.3 3.2 3.3 3.3 3.5Power looms (inc. Hosiery) 82.1 82.5 82.8 83.1 83.1 83.2 84.1 84.1Handlooms 13.0 12.6 12.3 12.2 12.4 12.1 11.3 11.1Others 1.6 1.5 1.6 1.4 1.4 1.4 1.3 1.3
Total 100.0 100.0 100.0 100.0 100.0 100.0 100 100
Source : Office of Textile Commissioner, Mumbai.P : Provisonal
1.22 : PRODUCTION OF COAL AND LIGNITE (Million tonnes)
Coal Lignite TotalYear Coking Non-coking Total coal and
ligniteMetallurgical Non-Metallurgical (5)+(6)
1 2 3 4 5 6 7
1950-51 na na na 32.30 na na1960-61 16.99 na 38.24 na na na1970-71 17.82 na 55.13 na 3.39 na1980-81 24.59 8.03 81.29 113.91 5.11 119.021981-82 26.89 9.23 88.11 124.23 6.31 130.541982-83 30.10 7.47 92.93 130.50 6.93 137.431983-84 30.11 6.24 101.87 138.22 7.30 145.521984-85 30.57 6.04 110.80 147.41 7.80 155.211985-86 29.07 6.57 118.56 154.20 8.05 162.251986-87 27.91 11.63 126.23 165.77 9.43 175.201987-88 26.28 14.73 138.71 179.72 11.16 190.881988-89 25.16 17.56 151.88 194.60 12.40 207.001989-90 24.50 19.93 156.46 200.89 12.80 213.691990-91 24.10 21.20 166.43 211.73 13.77 225.501991-92 26.33 19.95 183.00 229.28 14.55 243.831992-93 25.72 19.64 192.90 238.26 16.62 254.881993-94 25.99 19.07 200.98 246.04 18.10 264.141994-95 24.54 19.71 209.55 253.80 19.34 273.141995-96 23.53 16.57 230.03 270.13 22.14 292.271996-97 22.64 17.90 245.12 285.66 22.54 308.201997-98 24.16 19.34 252.43 295.93 23.05 318.981998-99 23.82 15.36 253.09 292.27 23.42 315.691999-2000 21.23 12.02 266.72 299.97 22.12 322.092000-01 19.31 11.77 278.55 309.63 22.95 332.582001-02 a 17.96 10.71 299.12 327.79 24.81 352.602002-03 a 18.35 11.84 311.08 341.29 26.02 367.292003-04 18.27 11.13 331.85 361.25 27.96 389.252004-05 18.19 12.03 352.39 382.61 30.34 412.952005-06 16.97 14.54 375.53 407.04 30.06 437.112006-07 17.23 14.87 398.74 430.83 31.29 462.122007-08 18.07 16.39 422.63 457.08 33.98 491.012008-09 17.30 17.51 457.95 492.76 32.42 525.182009-10 17.68 26.57 487.81 532.06 34.07 566.132010-11P 17.84 31.69 483.54 533.08 37.74 570.81
Source : Ministry of Coalna : Not available. a Including Meghalaya Coal. P Figures are provisional.
http://indiabudget.nic.in
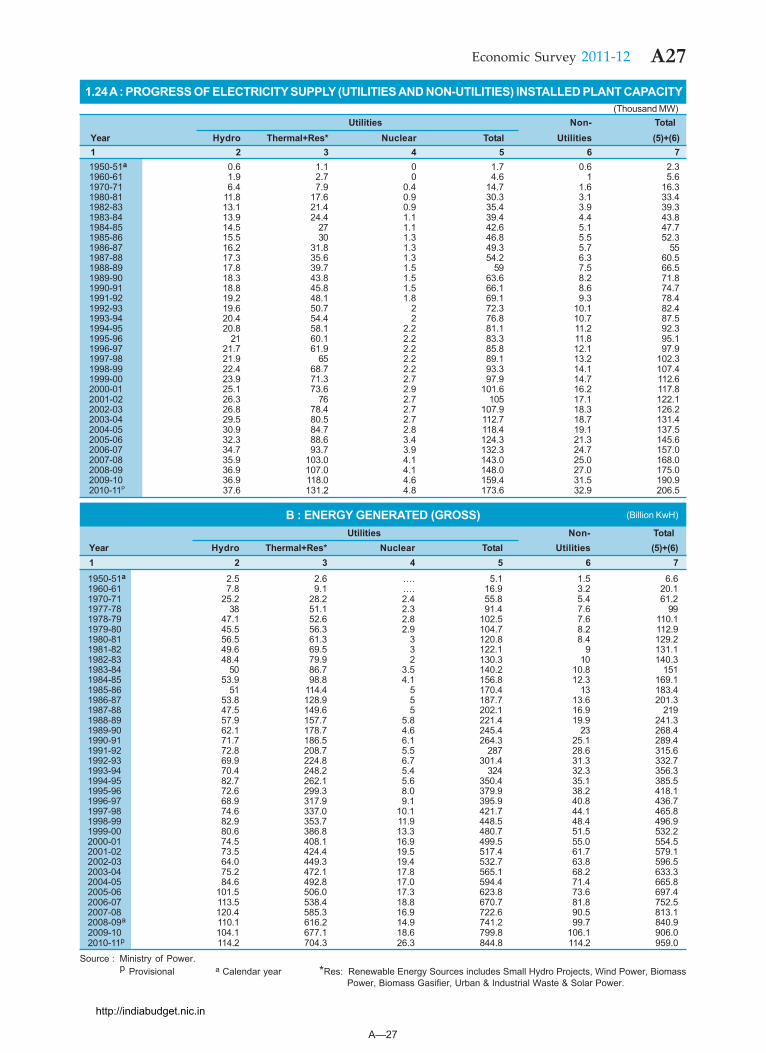
A—27
A27Economic Survey 2011-12
1.24 A : PROGRESS OF ELECTRICITY SUPPLY (UTILITIES AND NON-UTILITIES) INSTALLED PLANT CAPACITY(Thousand MW)
Utilities Non- TotalYear Hydro Thermal+Res* Nuclear Total Utilities (5)+(6)1 2 3 4 5 6 71950-51a 0.6 1.1 0 1.7 0.6 2.31960-61 1.9 2.7 0 4.6 1 5.61970-71 6.4 7.9 0.4 14.7 1.6 16.31980-81 11.8 17.6 0.9 30.3 3.1 33.41982-83 13.1 21.4 0.9 35.4 3.9 39.31983-84 13.9 24.4 1.1 39.4 4.4 43.81984-85 14.5 27 1.1 42.6 5.1 47.71985-86 15.5 30 1.3 46.8 5.5 52.31986-87 16.2 31.8 1.3 49.3 5.7 551987-88 17.3 35.6 1.3 54.2 6.3 60.51988-89 17.8 39.7 1.5 59 7.5 66.51989-90 18.3 43.8 1.5 63.6 8.2 71.81990-91 18.8 45.8 1.5 66.1 8.6 74.71991-92 19.2 48.1 1.8 69.1 9.3 78.41992-93 19.6 50.7 2 72.3 10.1 82.41993-94 20.4 54.4 2 76.8 10.7 87.51994-95 20.8 58.1 2.2 81.1 11.2 92.31995-96 21 60.1 2.2 83.3 11.8 95.11996-97 21.7 61.9 2.2 85.8 12.1 97.91997-98 21.9 65 2.2 89.1 13.2 102.31998-99 22.4 68.7 2.2 93.3 14.1 107.41999-00 23.9 71.3 2.7 97.9 14.7 112.62000-01 25.1 73.6 2.9 101.6 16.2 117.82001-02 26.3 76 2.7 105 17.1 122.12002-03 26.8 78.4 2.7 107.9 18.3 126.22003-04 29.5 80.5 2.7 112.7 18.7 131.42004-05 30.9 84.7 2.8 118.4 19.1 137.52005-06 32.3 88.6 3.4 124.3 21.3 145.62006-07 34.7 93.7 3.9 132.3 24.7 157.02007-08 35.9 103.0 4.1 143.0 25.0 168.02008-09 36.9 107.0 4.1 148.0 27.0 175.02009-10 36.9 118.0 4.6 159.4 31.5 190.92010-11P 37.6 131.2 4.8 173.6 32.9 206.5
B : ENERGY GENERATED (GROSS) Utilities Non- Total
Year Hydro Thermal+Res* Nuclear Total Utilities (5)+(6)1 2 3 4 5 6 71950-51a 2.5 2.6 …. 5.1 1.5 6.61960-61 7.8 9.1 …. 16.9 3.2 20.11970-71 25.2 28.2 2.4 55.8 5.4 61.21977-78 38 51.1 2.3 91.4 7.6 991978-79 47.1 52.6 2.8 102.5 7.6 110.11979-80 45.5 56.3 2.9 104.7 8.2 112.91980-81 56.5 61.3 3 120.8 8.4 129.21981-82 49.6 69.5 3 122.1 9 131.11982-83 48.4 79.9 2 130.3 10 140.31983-84 50 86.7 3.5 140.2 10.8 1511984-85 53.9 98.8 4.1 156.8 12.3 169.11985-86 51 114.4 5 170.4 13 183.41986-87 53.8 128.9 5 187.7 13.6 201.31987-88 47.5 149.6 5 202.1 16.9 2191988-89 57.9 157.7 5.8 221.4 19.9 241.31989-90 62.1 178.7 4.6 245.4 23 268.41990-91 71.7 186.5 6.1 264.3 25.1 289.41991-92 72.8 208.7 5.5 287 28.6 315.61992-93 69.9 224.8 6.7 301.4 31.3 332.71993-94 70.4 248.2 5.4 324 32.3 356.31994-95 82.7 262.1 5.6 350.4 35.1 385.51995-96 72.6 299.3 8.0 379.9 38.2 418.11996-97 68.9 317.9 9.1 395.9 40.8 436.71997-98 74.6 337.0 10.1 421.7 44.1 465.81998-99 82.9 353.7 11.9 448.5 48.4 496.91999-00 80.6 386.8 13.3 480.7 51.5 532.22000-01 74.5 408.1 16.9 499.5 55.0 554.52001-02 73.5 424.4 19.5 517.4 61.7 579.12002-03 64.0 449.3 19.4 532.7 63.8 596.52003-04 75.2 472.1 17.8 565.1 68.2 633.32004-05 84.6 492.8 17.0 594.4 71.4 665.82005-06 101.5 506.0 17.3 623.8 73.6 697.42006-07 113.5 538.4 18.8 670.7 81.8 752.52007-08 120.4 585.3 16.9 722.6 90.5 813.12008-09a 110.1 616.2 14.9 741.2 99.7 840.92009-10 104.1 677.1 18.6 799.8 106.1 906.02010-11p 114.2 704.3 26.3 844.8 114.2 959.0
Source : Ministry of Power.p Provisional a Calendar year *Res: Renewable Energy Sources includes Small Hydro Projects, Wind Power, Biomass
Power, Biomass Gasifier, Urban & Industrial Waste & Solar Power.
(Billion KwH)
http://indiabudget.nic.in
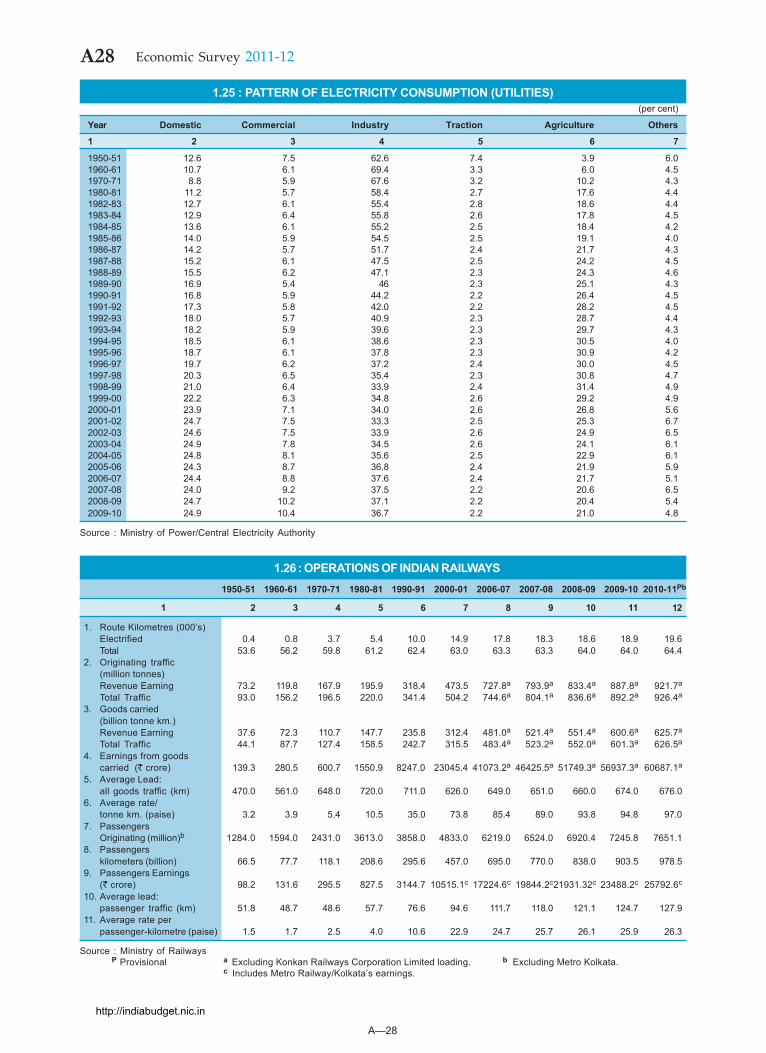
A—28
A28 Economic Survey 2011-12
1.26 : OPERATIONS OF INDIAN RAILWAYS1950-51 1960-61 1970-71 1980-81 1990-91 2000-01 2006-07 2007-08 2008-09 2009-10 2010-11Pb
1 2 3 4 5 6 7 8 9 10 11 12
1. Route Kilometres (000’s)Electrified 0.4 0.8 3.7 5.4 10.0 14.9 17.8 18.3 18.6 18.9 19.6Total 53.6 56.2 59.8 61.2 62.4 63.0 63.3 63.3 64.0 64.0 64.4
2. Originating traffic(million tonnes)Revenue Earning 73.2 119.8 167.9 195.9 318.4 473.5 727.8a 793.9a 833.4a 887.8a 921.7a
Total Traffic 93.0 156.2 196.5 220.0 341.4 504.2 744.6a 804.1a 836.6a 892.2a 926.4a
3. Goods carried(billion tonne km.)Revenue Earning 37.6 72.3 110.7 147.7 235.8 312.4 481.0a 521.4a 551.4a 600.6a 625.7a
Total Traffic 44.1 87.7 127.4 158.5 242.7 315.5 483.4a 523.2a 552.0a 601.3a 626.5a
4. Earnings from goodscarried (` crore) 139.3 280.5 600.7 1550.9 8247.0 23045.4 41073.2a 46425.5a 51749.3a 56937.3a 60687.1a
5. Average Lead:all goods traffic (km) 470.0 561.0 648.0 720.0 711.0 626.0 649.0 651.0 660.0 674.0 676.0
6. Average rate/tonne km. (paise) 3.2 3.9 5.4 10.5 35.0 73.8 85.4 89.0 93.8 94.8 97.0
7. PassengersOriginating (million)b 1284.0 1594.0 2431.0 3613.0 3858.0 4833.0 6219.0 6524.0 6920.4 7245.8 7651.1
8. Passengerskilometers (billion) 66.5 77.7 118.1 208.6 295.6 457.0 695.0 770.0 838.0 903.5 978.5
9. Passengers Earnings(` crore) 98.2 131.6 295.5 827.5 3144.7 10515.1c 17224.6c 19844.2c21931.32c 23488.2c 25792.6c
10. Average lead:passenger traffic (km) 51.8 48.7 48.6 57.7 76.6 94.6 111.7 118.0 121.1 124.7 127.9
11. Average rate perpassenger-kilometre (paise) 1.5 1.7 2.5 4.0 10.6 22.9 24.7 25.7 26.1 25.9 26.3
Source : Ministry of RailwaysP Provisional a Excluding Konkan Railways Corporation Limited loading. b Excluding Metro Kolkata.
c Includes Metro Railway/Kolkata’s earnings.
1.25 : PATTERN OF ELECTRICITY CONSUMPTION (UTILITIES)(per cent)
Year Domestic Commercial Industry Traction Agriculture Others
1 2 3 4 5 6 7
1950-51 12.6 7.5 62.6 7.4 3.9 6.01960-61 10.7 6.1 69.4 3.3 6.0 4.51970-71 8.8 5.9 67.6 3.2 10.2 4.31980-81 11.2 5.7 58.4 2.7 17.6 4.41982-83 12.7 6.1 55.4 2.8 18.6 4.41983-84 12.9 6.4 55.8 2.6 17.8 4.51984-85 13.6 6.1 55.2 2.5 18.4 4.21985-86 14.0 5.9 54.5 2.5 19.1 4.01986-87 14.2 5.7 51.7 2.4 21.7 4.31987-88 15.2 6.1 47.5 2.5 24.2 4.51988-89 15.5 6.2 47.1 2.3 24.3 4.61989-90 16.9 5.4 46 2.3 25.1 4.31990-91 16.8 5.9 44.2 2.2 26.4 4.51991-92 17.3 5.8 42.0 2.2 28.2 4.51992-93 18.0 5.7 40.9 2.3 28.7 4.41993-94 18.2 5.9 39.6 2.3 29.7 4.31994-95 18.5 6.1 38.6 2.3 30.5 4.01995-96 18.7 6.1 37.8 2.3 30.9 4.21996-97 19.7 6.2 37.2 2.4 30.0 4.51997-98 20.3 6.5 35.4 2.3 30.8 4.71998-99 21.0 6.4 33.9 2.4 31.4 4.91999-00 22.2 6.3 34.8 2.6 29.2 4.92000-01 23.9 7.1 34.0 2.6 26.8 5.62001-02 24.7 7.5 33.3 2.5 25.3 6.72002-03 24.6 7.5 33.9 2.6 24.9 6.52003-04 24.9 7.8 34.5 2.6 24.1 6.12004-05 24.8 8.1 35.6 2.5 22.9 6.12005-06 24.3 8.7 36.8 2.4 21.9 5.92006-07 24.4 8.8 37.6 2.4 21.7 5.12007-08 24.0 9.2 37.5 2.2 20.6 6.52008-09 24.7 10.2 37.1 2.2 20.4 5.42009-10 24.9 10.4 36.7 2.2 21.0 4.8
Source : Ministry of Power/Central Electricity Authority
http://indiabudget.nic.in
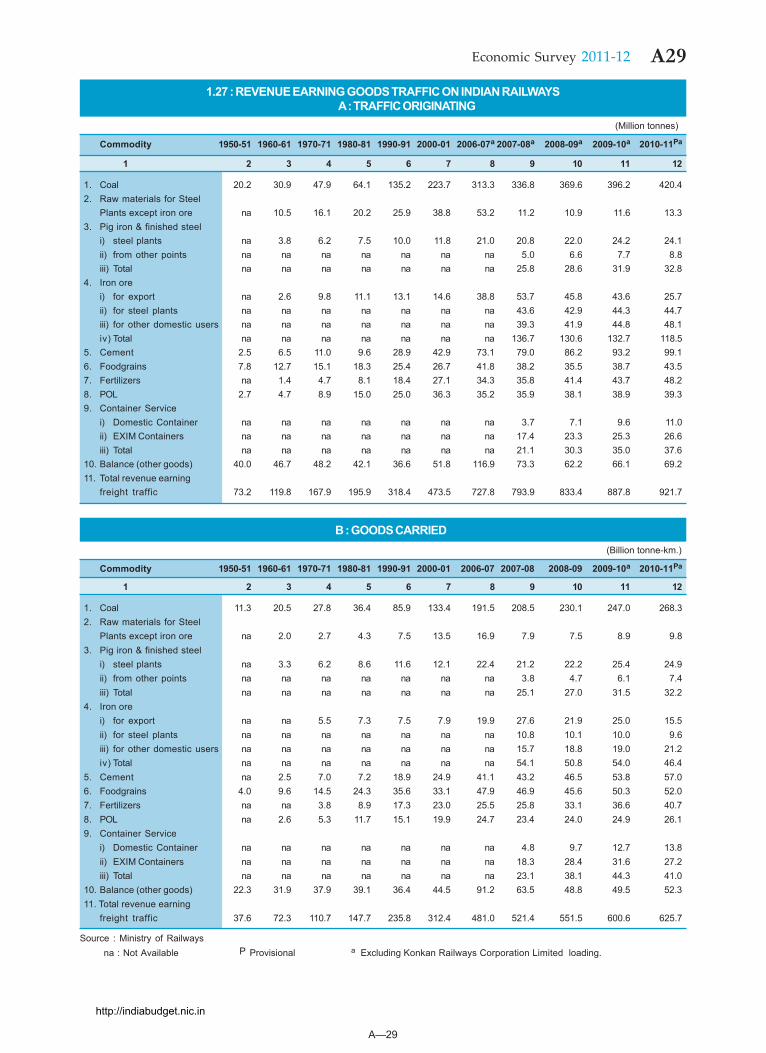
A—29
A29Economic Survey 2011-12
1.27 : REVENUE EARNING GOODS TRAFFIC ON INDIAN RAILWAYSA : TRAFFIC ORIGINATING
(Million tonnes)
Commodity 1950-51 1960-61 1970-71 1980-81 1990-91 2000-01 2006-07a 2007-08a 2008-09a 2009-10a 2010-11Pa
1 2 3 4 5 6 7 8 9 10 11 12
1. Coal 20.2 30.9 47.9 64.1 135.2 223.7 313.3 336.8 369.6 396.2 420.42. Raw materials for Steel
Plants except iron ore na 10.5 16.1 20.2 25.9 38.8 53.2 11.2 10.9 11.6 13.33. Pig iron & finished steel
i) steel plants na 3.8 6.2 7.5 10.0 11.8 21.0 20.8 22.0 24.2 24.1ii) from other points na na na na na na na 5.0 6.6 7.7 8.8iii) Total na na na na na na na 25.8 28.6 31.9 32.8
4. Iron orei) for export na 2.6 9.8 11.1 13.1 14.6 38.8 53.7 45.8 43.6 25.7ii) for steel plants na na na na na na na 43.6 42.9 44.3 44.7iii) for other domestic users na na na na na na na 39.3 41.9 44.8 48.1iv) Total na na na na na na na 136.7 130.6 132.7 118.5
5. Cement 2.5 6.5 11.0 9.6 28.9 42.9 73.1 79.0 86.2 93.2 99.16. Foodgrains 7.8 12.7 15.1 18.3 25.4 26.7 41.8 38.2 35.5 38.7 43.57. Fertilizers na 1.4 4.7 8.1 18.4 27.1 34.3 35.8 41.4 43.7 48.28. POL 2.7 4.7 8.9 15.0 25.0 36.3 35.2 35.9 38.1 38.9 39.39. Container Service
i) Domestic Container na na na na na na na 3.7 7.1 9.6 11.0ii) EXIM Containers na na na na na na na 17.4 23.3 25.3 26.6iii) Total na na na na na na na 21.1 30.3 35.0 37.6
10. Balance (other goods) 40.0 46.7 48.2 42.1 36.6 51.8 116.9 73.3 62.2 66.1 69.211. Total revenue earning
freight traffic 73.2 119.8 167.9 195.9 318.4 473.5 727.8 793.9 833.4 887.8 921.7
B : GOODS CARRIED(Billion tonne-km.)
Commodity 1950-51 1960-61 1970-71 1980-81 1990-91 2000-01 2006-07 2007-08 2008-09 2009-10a 2010-11Pa
1 2 3 4 5 6 7 8 9 10 11 12
1. Coal 11.3 20.5 27.8 36.4 85.9 133.4 191.5 208.5 230.1 247.0 268.32. Raw materials for Steel
Plants except iron ore na 2.0 2.7 4.3 7.5 13.5 16.9 7.9 7.5 8.9 9.83. Pig iron & finished steel
i) steel plants na 3.3 6.2 8.6 11.6 12.1 22.4 21.2 22.2 25.4 24.9ii) from other points na na na na na na na 3.8 4.7 6.1 7.4iii) Total na na na na na na na 25.1 27.0 31.5 32.2
4. Iron orei) for export na na 5.5 7.3 7.5 7.9 19.9 27.6 21.9 25.0 15.5ii) for steel plants na na na na na na na 10.8 10.1 10.0 9.6iii) for other domestic users na na na na na na na 15.7 18.8 19.0 21.2iv) Total na na na na na na na 54.1 50.8 54.0 46.4
5. Cement na 2.5 7.0 7.2 18.9 24.9 41.1 43.2 46.5 53.8 57.06. Foodgrains 4.0 9.6 14.5 24.3 35.6 33.1 47.9 46.9 45.6 50.3 52.07. Fertilizers na na 3.8 8.9 17.3 23.0 25.5 25.8 33.1 36.6 40.78. POL na 2.6 5.3 11.7 15.1 19.9 24.7 23.4 24.0 24.9 26.19. Container Service
i) Domestic Container na na na na na na na 4.8 9.7 12.7 13.8ii) EXIM Containers na na na na na na na 18.3 28.4 31.6 27.2iii) Total na na na na na na na 23.1 38.1 44.3 41.0
10. Balance (other goods) 22.3 31.9 37.9 39.1 36.4 44.5 91.2 63.5 48.8 49.5 52.311. Total revenue earning
freight traffic 37.6 72.3 110.7 147.7 235.8 312.4 481.0 521.4 551.5 600.6 625.7
Source : Ministry of Railwaysna : Not Available P Provisional a Excluding Konkan Railways Corporation Limited loading.
http://indiabudget.nic.in
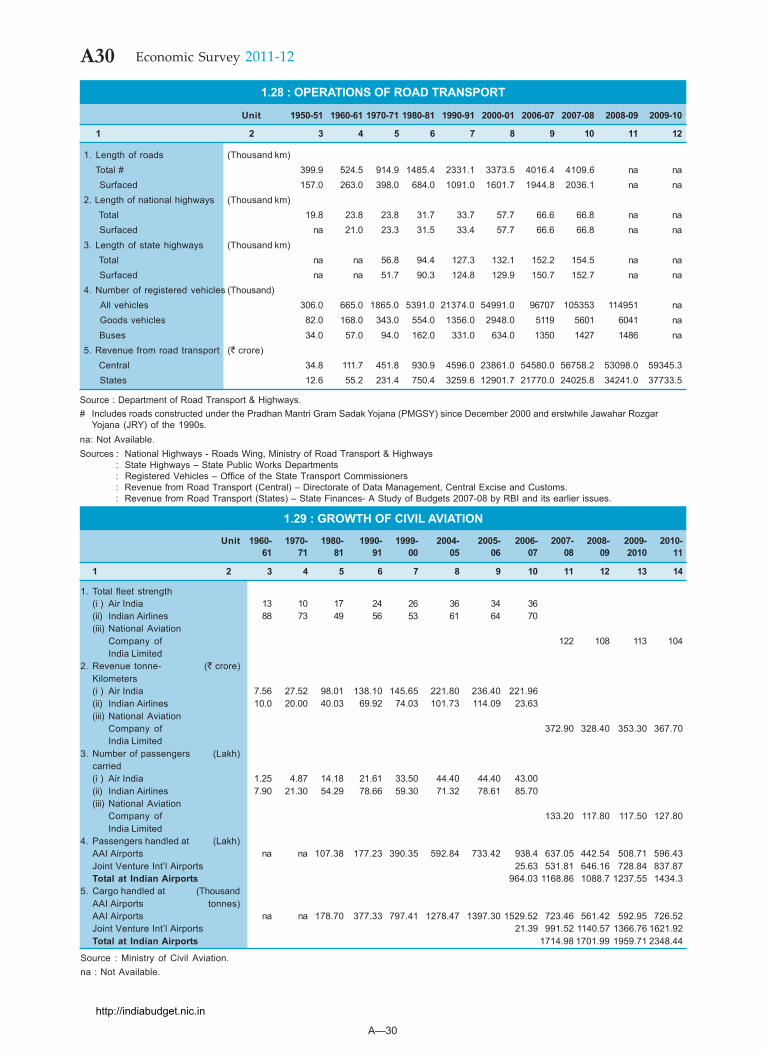
A—30
A30 Economic Survey 2011-12
1.28 : OPERATIONS OF ROAD TRANSPORT
Unit 1950-51 1960-61 1970-71 1980-81 1990-91 2000-01 2006-07 2007-08 2008-09 2009-10
1 2 3 4 5 6 7 8 9 10 11 12
1. Length of roads (Thousand km) Total # 399.9 524.5 914.9 1485.4 2331.1 3373.5 4016.4 4109.6 na na Surfaced 157.0 263.0 398.0 684.0 1091.0 1601.7 1944.8 2036.1 na na2. Length of national highways (Thousand km) Total 19.8 23.8 23.8 31.7 33.7 57.7 66.6 66.8 na na Surfaced na 21.0 23.3 31.5 33.4 57.7 66.6 66.8 na na3. Length of state highways (Thousand km) Total na na 56.8 94.4 127.3 132.1 152.2 154.5 na na Surfaced na na 51.7 90.3 124.8 129.9 150.7 152.7 na na4. Number of registered vehicles (Thousand) All vehicles 306.0 665.0 1865.0 5391.0 21374.0 54991.0 96707 105353 114951 na Goods vehicles 82.0 168.0 343.0 554.0 1356.0 2948.0 5119 5601 6041 na Buses 34.0 57.0 94.0 162.0 331.0 634.0 1350 1427 1486 na5. Revenue from road transport (` crore) Central 34.8 111.7 451.8 930.9 4596.0 23861.0 54580.0 56758.2 53098.0 59345.3 States 12.6 55.2 231.4 750.4 3259.6 12901.7 21770.0 24025.8 34241.0 37733.5
Source : Department of Road Transport & Highways.# Includes roads constructed under the Pradhan Mantri Gram Sadak Yojana (PMGSY) since December 2000 and erstwhile Jawahar Rozgar
Yojana (JRY) of the 1990s.na: Not Available.Sources : National Highways - Roads Wing, Ministry of Road Transport & Highways
: State Highways – State Public Works Departments: Registered Vehicles – Office of the State Transport Commissioners: Revenue from Road Transport (Central) – Directorate of Data Management, Central Excise and Customs.: Revenue from Road Transport (States) – State Finances- A Study of Budgets 2007-08 by RBI and its earlier issues.
1.29 : GROWTH OF CIVIL AVIATION
Unit 1960- 1970- 1980- 1990- 1999- 2004- 2005- 2006- 2007- 2008- 2009- 2010-61 71 81 91 00 05 06 07 08 09 2010 11
1 2 3 4 5 6 7 8 9 10 11 12 13 14
1. Total fleet strength(i ) Air India 13 10 17 24 26 36 34 36(ii) Indian Airlines 88 73 49 56 53 61 64 70(iii) National Aviation
Company of 122 108 113 104India Limited
2. Revenue tonne- (` crore)Kilometers(i ) Air India 7.56 27.52 98.01 138.10 145.65 221.80 236.40 221.96(ii) Indian Airlines 10.0 20.00 40.03 69.92 74.03 101.73 114.09 23.63(iii) National Aviation
Company of 372.90 328.40 353.30 367.70India Limited
3. Number of passengers (Lakh)carried(i ) Air India 1.25 4.87 14.18 21.61 33.50 44.40 44.40 43.00(ii) Indian Airlines 7.90 21.30 54.29 78.66 59.30 71.32 78.61 85.70(iii) National Aviation
Company of 133.20 117.80 117.50 127.80India Limited
4. Passengers handled at (Lakh)AAI Airports na na 107.38 177.23 390.35 592.84 733.42 938.4 637.05 442.54 508.71 596.43Joint Venture Int’l Airports 25.63 531.81 646.16 728.84 837.87Total at Indian Airports 964.03 1168.86 1088.7 1237.55 1434.3
5. Cargo handled at (ThousandAAI Airports tonnes)AAI Airports na na 178.70 377.33 797.41 1278.47 1397.30 1529.52 723.46 561.42 592.95 726.52Joint Venture Int’l Airports 21.39 991.52 1140.57 1366.76 1621.92Total at Indian Airports 1714.98 1701.99 1959.71 2348.44
Source : Ministry of Civil Aviation.na : Not Available.
http://indiabudget.nic.in
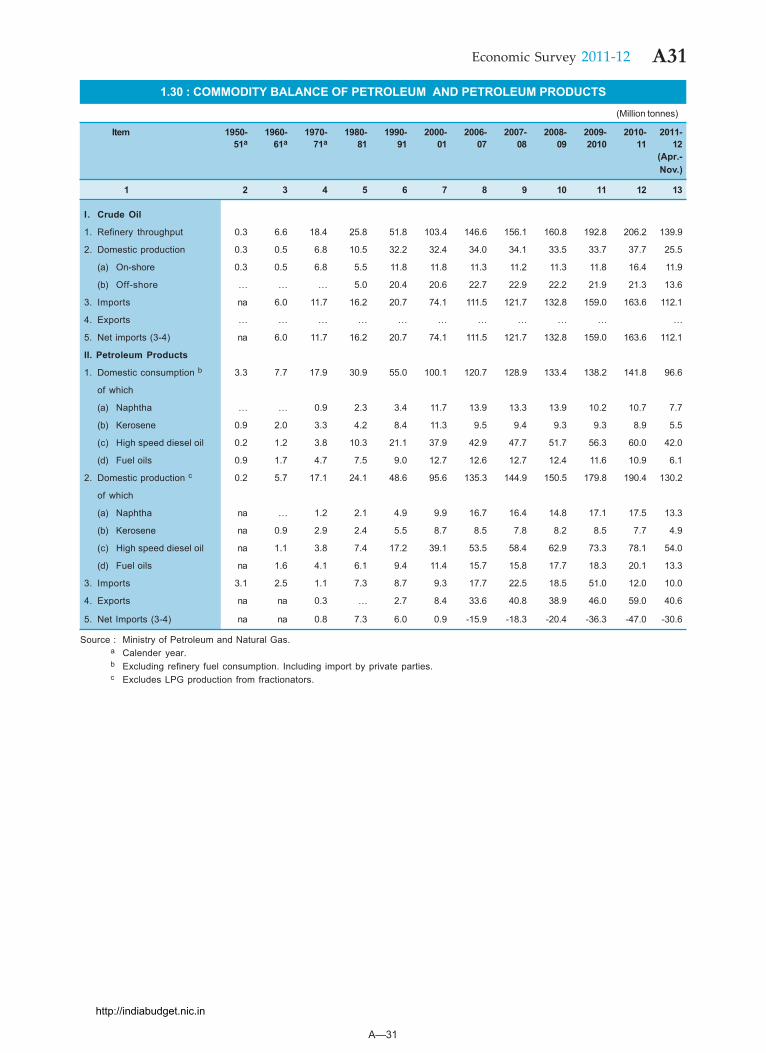
A—31
A31Economic Survey 2011-12
1.30 : COMMODITY BALANCE OF PETROLEUM AND PETROLEUM PRODUCTS
(Million tonnes)
Item 1950- 1960- 1970- 1980- 1990- 2000- 2006- 2007- 2008- 2009- 2010- 2011-51a 61a 71a 81 91 01 07 08 09 2010 11 12
(Apr.-Nov.)
1 2 3 4 5 6 7 8 9 10 11 12 13
I. Crude Oil
1. Refinery throughput 0.3 6.6 18.4 25.8 51.8 103.4 146.6 156.1 160.8 192.8 206.2 139.9
2. Domestic production 0.3 0.5 6.8 10.5 32.2 32.4 34.0 34.1 33.5 33.7 37.7 25.5
(a) On-shore 0.3 0.5 6.8 5.5 11.8 11.8 11.3 11.2 11.3 11.8 16.4 11.9
(b) Off-shore ... ... ... 5.0 20.4 20.6 22.7 22.9 22.2 21.9 21.3 13.6
3. Imports na 6.0 11.7 16.2 20.7 74.1 111.5 121.7 132.8 159.0 163.6 112.1
4. Exports ... ... ... ... ... ... ... ... ... … …
5. Net imports (3-4) na 6.0 11.7 16.2 20.7 74.1 111.5 121.7 132.8 159.0 163.6 112.1
II. Petroleum Products
1. Domestic consumption b 3.3 7.7 17.9 30.9 55.0 100.1 120.7 128.9 133.4 138.2 141.8 96.6
of which
(a) Naphtha ... ... 0.9 2.3 3.4 11.7 13.9 13.3 13.9 10.2 10.7 7.7
(b) Kerosene 0.9 2.0 3.3 4.2 8.4 11.3 9.5 9.4 9.3 9.3 8.9 5.5
(c) High speed diesel oil 0.2 1.2 3.8 10.3 21.1 37.9 42.9 47.7 51.7 56.3 60.0 42.0
(d) Fuel oils 0.9 1.7 4.7 7.5 9.0 12.7 12.6 12.7 12.4 11.6 10.9 6.1
2. Domestic production c 0.2 5.7 17.1 24.1 48.6 95.6 135.3 144.9 150.5 179.8 190.4 130.2
of which
(a) Naphtha na ... 1.2 2.1 4.9 9.9 16.7 16.4 14.8 17.1 17.5 13.3
(b) Kerosene na 0.9 2.9 2.4 5.5 8.7 8.5 7.8 8.2 8.5 7.7 4.9
(c) High speed diesel oil na 1.1 3.8 7.4 17.2 39.1 53.5 58.4 62.9 73.3 78.1 54.0
(d) Fuel oils na 1.6 4.1 6.1 9.4 11.4 15.7 15.8 17.7 18.3 20.1 13.3
3. Imports 3.1 2.5 1.1 7.3 8.7 9.3 17.7 22.5 18.5 51.0 12.0 10.0
4. Exports na na 0.3 … 2.7 8.4 33.6 40.8 38.9 46.0 59.0 40.6
5. Net Imports (3-4) na na 0.8 7.3 6.0 0.9 -15.9 -18.3 -20.4 -36.3 -47.0 -30.6
Source : Ministry of Petroleum and Natural Gas.a Calender year.b Excluding refinery fuel consumption. Including import by private parties.c Excludes LPG production from fractionators.
http://indiabudget.nic.in
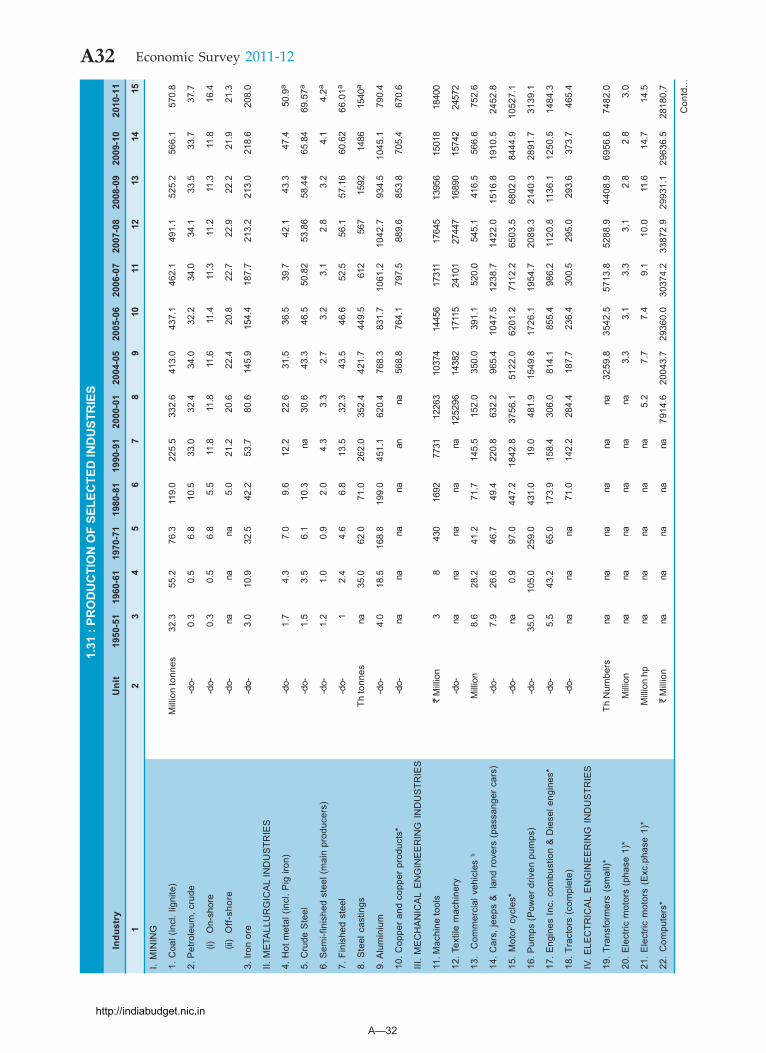
A—32
A32 Economic Survey 2011-12
Con
td...
1.31
: PR
OD
UC
TIO
N O
F SE
LEC
TED
IND
UST
RIE
S
Indu
stry
Uni
t19
50-5
119
60-6
119
70-7
119
80-8
119
90-9
120
00-0
120
04-0
520
05-0
620
06-0
720
07-0
820
08-0
920
09-1
020
10-1
1
12
34
56
78
910
1112
1314
15
I. M
ININ
G
1. C
oal (
incl
. lig
nite
)M
illio
n to
nnes
32.3
55.2
76.3
119.
022
5.5
332.
641
3.0
437.
146
2.1
491.
152
5.2
566.
157
0.8
2. P
etro
leum
, cru
de-d
o-0.
30.
56.
810
.533
.032
.434
.032
.234
.034
.133
.533
.737
.7
(i)O
n-sh
ore
-do-
0.3
0.5
6.8
5.5
11.8
11.8
11.6
11.4
11.3
11.2
11.3
11.8
16.4
(ii)
Off-
shor
e-d
o-na
nana
5.0
21.2
20.6
22.4
20.8
22.7
22.9
22.2
21.9
21.3
3. Ir
on o
re-d
o-3.
010
.932
.542
.253
.780
.614
5.9
154.
418
7.7
213.
221
3.0
218.
620
8.0
II. M
ETA
LLU
RG
ICA
L IN
DU
STR
IES
4. H
ot m
etal
(in
cl. P
ig ir
on)
-do-
1.7
4.3
7.0
9.6
12.2
22.6
31.5
36.5
39.7
42.1
43.3
47.4
50.9
a
5. C
rude
Ste
el-d
o-1.
53.
56.
110
.3na
30.6
43.3
46.5
50.8
253
.86
58.4
465
.84
69.5
7a
6. S
emi-f
inis
hed
stee
l (m
ain
prod
ucer
s)-d
o-1.
21.
00.
92.
04.
33.
32.
73.
23.
12.
83.
24.
14.
2a
7. F
inis
hed
stee
l-d
o-1
2.4
4.6
6.8
13.5
32.3
43.5
46.6
52.5
56.1
57.1
660
.62
66.0
1a
8. S
teel
cas
tings
Th to
nnes
na35
.062
.071
.026
2.0
352.
442
1.7
449.
561
256
715
9214
8615
40a
9. A
lum
iniu
m-d
o-4.
018
.516
8.8
199.
045
1.1
620.
476
8.3
831.
710
61.2
1042
.793
4.5
1045
.179
0.4
10. C
oppe
r and
cop
per p
rodu
cts*
-do-
nana
nana
anna
568.
876
4.1
797.
588
9.6
853.
870
5.4
670.
6
III.
ME
CH
AN
ICA
L E
NG
INE
ER
ING
IN
DU
STR
IES
11. M
achi
ne to
ols
` M
illio
n3
843
016
9277
3112
263
1037
414
456
1731
117
645
1395
615
018
1840
0
12. T
extil
e m
achi
nery
-do-
nana
nana
na12
5296
1438
217
115
2410
127
447
1689
015
742
2457
2
13.
Com
mer
cial
veh
icle
s b
Milli
on8.
628
.241
.271
.714
5.5
152.
035
0.0
391.
152
0.0
545.
141
6.5
566.
675
2.6
14. C
ars,
jeep
s &
lan
d ro
vers
(pa
ssan
ger
cars
)-d
o-7.
926
.646
.749
.422
0.8
632.
296
5.4
1047
.512
38.7
1422
.015
16.8
1910
.524
52.8
15.
Mot
or c
ycle
s*-d
o-na
0.9
97.0
447.
218
42.8
3756
.151
22.0
6201
.271
12.2
6503
.568
02.0
8444
.910
527.
1
16. P
umps
(Pow
er d
riven
pum
ps)
-do-
35.0
105.
025
9.0
431.
019
.048
1.9
1549
.817
26.1
1954
.720
89.3
2140
.328
91.7
3139
.1
17. E
ngin
es In
c. c
ombu
stio
n &
Die
sel e
ngin
es*
-do-
5.5
43.2
65.0
173.
915
8.4
306.
081
4.1
855.
498
6.2
1120
.811
36.1
1250
.514
84.3
18. T
ract
ors
(com
plet
e)-d
o-na
nana
71.0
142.
228
4.4
187.
723
6.4
300.
529
5.0
293.
637
3.7
465.
4
IV.
ELE
CTR
ICA
L E
NG
INE
ER
ING
IN
DU
STR
IES
19.
Tran
sfor
mer
s (s
mal
l)*Th
Num
bers
nana
nana
nana
3259
.835
42.5
5713
.852
88.9
4408
.969
56.6
7482
.0
20. E
lect
ric m
otor
s (p
hase
1)*
Milli
onna
nana
nana
na3.
33.
13.
33.
12.
82.
83.
0
21. E
lect
ric m
otor
s (E
xc.p
hase
1)*
Mill
ion
hpna
nana
nana
5.2
7.7
7.4
9.1
10.0
11.6
14.7
14.5
22.
Com
pute
rs*
` M
illio
nna
nana
nana
7914
.620
043.
729
360.
030
374.
233
872.
929
931.
129
636.
528
180.
7
http://indiabudget.nic.in
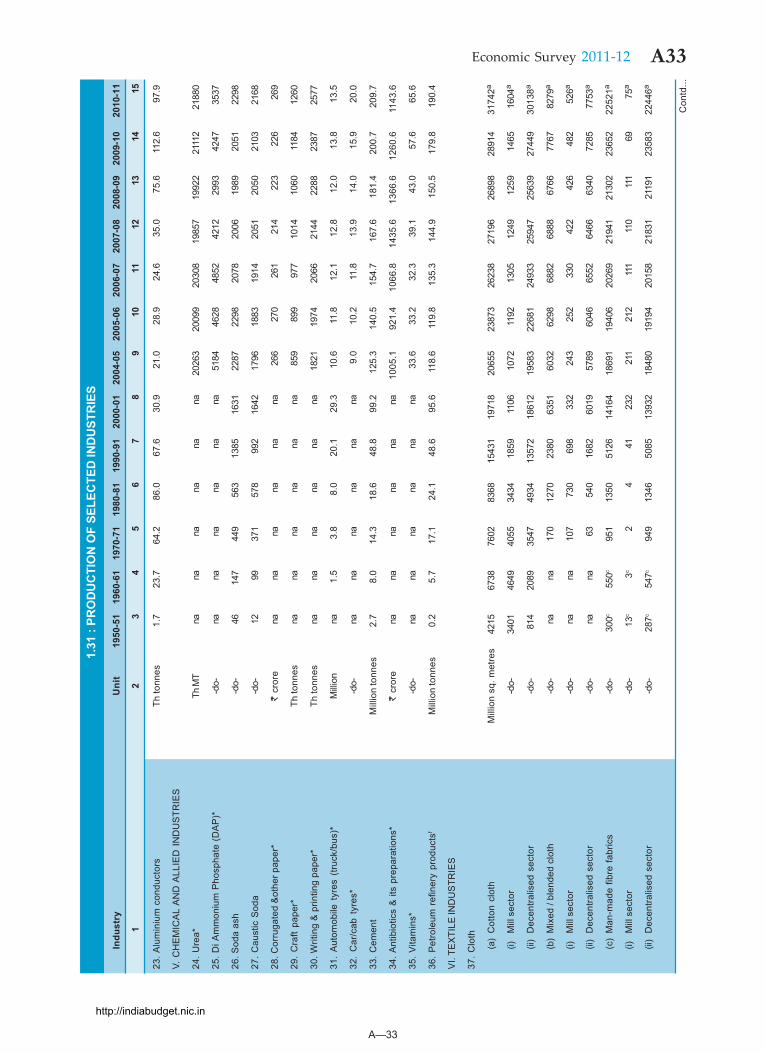
A—33
A33Economic Survey 2011-12
1.31
: PR
OD
UC
TIO
N O
F SE
LEC
TED
IND
UST
RIE
S
Indu
stry
Uni
t19
50-5
119
60-6
119
70-7
119
80-8
119
90-9
120
00-0
120
04-0
520
05-0
620
06-0
720
07-0
820
08-0
920
09-1
020
10-1
1
12
34
56
78
910
1112
1314
15
23. A
lum
iniu
m c
ondu
ctor
sTh
tonn
es1.
723
.764
.286
.067
.630
.921
.028
.924
.635
.075
.611
2.6
97.9
V. C
HE
MIC
AL
AN
D A
LLIE
D I
ND
US
TRIE
S
24. U
rea*
Th M
Tna
nana
nana
na20
263
2009
920
308
1985
719
922
2111
221
880
25. D
i Am
mon
ium
Pho
spha
te (
DA
P)*
-do-
nana
nana
nana
5184
4628
4852
4212
2993
4247
3537
26. S
oda
ash
-do-
4614
744
956
313
8516
3122
8722
9820
7820
0619
8920
5122
98
27. C
aust
ic S
oda
-do-
1299
371
578
992
1642
1796
1883
1914
2051
2050
2103
2168
28. C
orru
gate
d &
othe
r pap
er*
` cr
ore
nana
nana
nana
266
270
261
214
223
226
269
29.
Cra
ft pa
per*
Th to
nnes
nana
nana
nana
859
899
977
1014
1060
1184
1260
30. W
ritin
g &
prin
ting
pape
r*Th
tonn
esna
nana
nana
na18
2119
7420
6621
4422
8823
8725
77
31.
Aut
omob
ile t
yres
(tru
ck/b
us)*
Milli
onna
1.5
3.8
8.0
20.1
29.3
10.6
11.8
12.1
12.8
12.0
13.8
13.5
32.
Car
/cab
tyr
es*
-do-
nana
nana
nana
9.0
10.2
11.8
13.9
14.0
15.9
20.0
33. C
emen
tM
illio
n to
nnes
2.7
8.0
14.3
18.6
48.8
99.2
125.
314
0.5
154.
716
7.6
181.
420
0.7
209.
7
34. A
ntib
iotic
s &
its
prep
arat
ions
*`
cror
ena
nana
nana
na10
05.1
921.
410
66.8
1435
.613
66.6
1260
.611
43.6
35. V
itam
ins*
-do-
nana
nana
nana
33.6
33.2
32.3
39.1
43.0
57.6
65.6
36.
Pet
role
um r
efin
ery
prod
ucts
fM
illio
n to
nnes
0.2
5.7
17.1
24.1
48.6
95.6
118.
611
9.8
135.
314
4.9
150.
517
9.8
190.
4
VI.
TEX
TILE
IND
US
TRIE
S
37. C
loth
(a)
Cot
ton
clot
hM
illio
n sq
. met
res
4215
6738
7602
8368
1543
119
718
2065
523
873
2623
827
196
2689
828
914
3174
2a
(i)M
ill s
ecto
r-d
o-34
0146
4940
5534
3418
5911
0610
7211
9213
0512
4912
5914
6516
04a
(ii)
Dec
entra
lised
sec
tor
-do-
814
2089
3547
4934
1357
218
612
1958
322
681
2493
325
947
2563
927
449
3013
8a
(b)
Mix
ed /
blen
ded
clot
h-d
o-na
na17
012
7023
8063
5160
3262
9868
8268
8867
6677
6782
79a
(i)M
ill s
ecto
r-d
o-na
na10
773
069
833
224
325
233
042
242
648
252
6a
(ii)
Dec
entra
lised
sec
tor
-do-
nana
6354
016
8260
1957
8960
4665
5264
6663
4072
8577
53a
(c)
Man
-mad
e fib
re fa
bric
s-d
o-30
0c55
0c95
113
5051
2614
164
1869
119
406
2026
921
941
2130
223
652
2252
1a
(i)M
ill s
ecto
r-d
o-13
c3c
24
4123
221
121
211
111
011
169
75a
(ii)
Dec
entra
lised
sec
tor
-do-
287c
547c
949
1346
5085
1393
218
480
1919
420
158
2183
121
191
2358
322
446a
Con
td...
http://indiabudget.nic.in
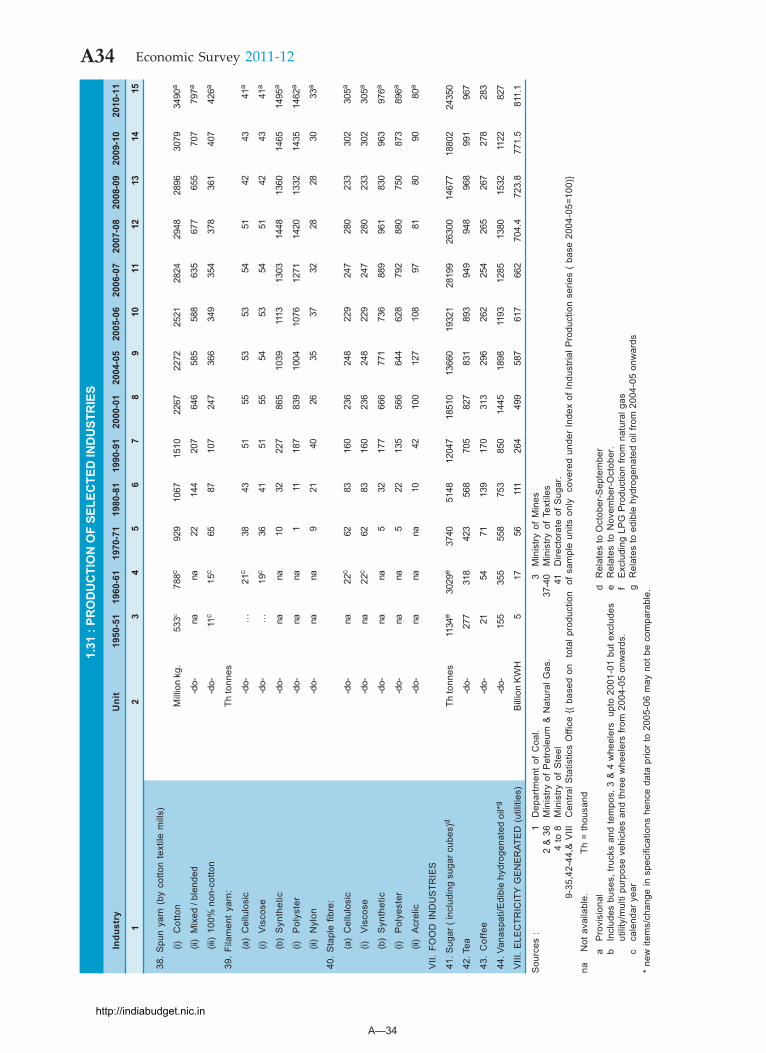
A—34
A34 Economic Survey 2011-12
Sou
rces
:1
Dep
artm
ent
of C
oal.
3M
inis
try o
f M
ines
2 &
36
Min
istry
of P
etro
leum
& N
atur
al G
as.
37-4
0M
inis
try o
f Te
xtile
s4
to 8
Min
istry
of
Ste
el41
Dire
ctor
ate
of S
ugar
.9-
35,4
2-44
,& V
IIIC
entra
l Sta
tistic
s O
ffice
{(
base
d on
to
tal p
rodu
ctio
n o
f sam
ple
units
onl
y c
over
ed u
nder
Inde
x of
Indu
stria
l Pro
duct
ion
serie
s (
base
200
4-05
=100
)}na
N
ot a
vaila
ble.
Th
= th
ousa
nda
Pro
visi
onal
dR
elat
es to
Oct
ober
-Sep
tem
ber
bIn
clud
es b
uses
, tru
cks
and
tem
pos,
3 &
4 w
heel
ers
upt
o 20
01-0
1 bu
t exc
lude
se
Rel
ates
to
Nov
embe
r-O
ctob
er.
utili
ty/m
ulti
purp
ose
vehi
cles
and
thre
e w
heel
ers
from
200
4-05
onw
ards
.f
Exc
ludi
ng L
PG
Pro
duct
ion
from
nat
ural
gas
cca
lend
ar y
ear
gR
elat
es to
edi
ble
hydr
ogen
ated
oil
from
200
4-05
onw
ards
* ne
w it
ems/
chan
ge in
spe
cific
atio
ns h
ence
dat
a pr
ior
to 2
005-
06 m
ay n
ot b
e co
mpa
rabl
e.
1.31
: PR
OD
UC
TIO
N O
F SE
LEC
TED
IND
UST
RIE
S
Indu
stry
Uni
t19
50-5
119
60-6
119
70-7
119
80-8
119
90-9
120
00-0
120
04-0
520
05-0
620
06-0
720
07-0
820
08-0
920
09-1
020
10-1
1
12
34
56
78
910
1112
1314
15
38. S
pun
yarn
(by
cot
ton
text
ile m
ills)
(i)C
otto
nM
illio
n kg
.53
3c78
8c92
910
6715
1022
6722
7225
2128
2429
4828
9630
7934
90a
(ii)
Mix
ed /
blen
ded
-do-
nana
2214
420
764
658
558
863
567
765
570
779
7a
(iii)
100%
non
-cot
ton
-do-
11c
15c
6587
107
247
366
349
354
378
361
407
426a
39.
Fila
men
t ya
rn:
Th to
nnes
(a)
Cel
lulo
sic
-do-
…21
c38
4351
5553
5354
5142
4341
a
(i)V
isco
se-d
o-…
19c
3641
5155
5453
5451
4243
41a
(b)
Syn
thet
ic-d
o-na
na10
3222
786
510
3911
1313
0314
4813
6014
6514
95a
(i)P
olys
ter
-do-
nana
111
187
839
1004
1076
1271
1420
1332
1435
1462
a
(ii)
Nyl
on-d
o-na
na9
2140
2635
3732
2828
3033
a
40.
Sta
ple
fibre
:
(a)
Cel
lulo
sic
-do-
na22
c62
8316
023
624
822
924
728
023
330
230
5a
(i)V
isco
se-d
o-na
22c
6283
160
236
248
229
247
280
233
302
305a
(b)
Syn
thet
ic-d
o-na
na5
3217
766
677
173
688
996
183
096
397
6a
(i)P
olye
ster
-do-
nana
522
135
566
644
628
792
880
750
873
896a
(ii)
Acr
elic
-do-
nana
na10
4210
012
710
897
8180
9080
a
VII.
FO
OD
IN
DU
STR
IES
41. S
ugar
( in
clud
ing
suga
r cub
es)d
Th to
nnes
1134
e30
29e
3740
5148
1204
718
510
1366
019
321
2819
926
300
1467
718
802
2435
0
42. T
ea-d
o-27
731
842
356
870
582
783
189
394
994
896
899
196
7
43.
Cof
fee
-do-
2154
7113
917
031
329
626
225
426
526
727
828
3
44. V
anas
pati/
Edi
ble
hydr
ogen
ated
oil*
g-d
o-15
535
555
875
385
014
4518
9811
9312
8513
8015
3211
2282
7
VIII
. ELE
CTR
ICIT
Y G
EN
ER
ATE
D (
utili
ties)
Bill
ion
KW
H5
1756
111
264
499
587
617
662
704.
472
3.8
771.
581
1.1
http://indiabudget.nic.in
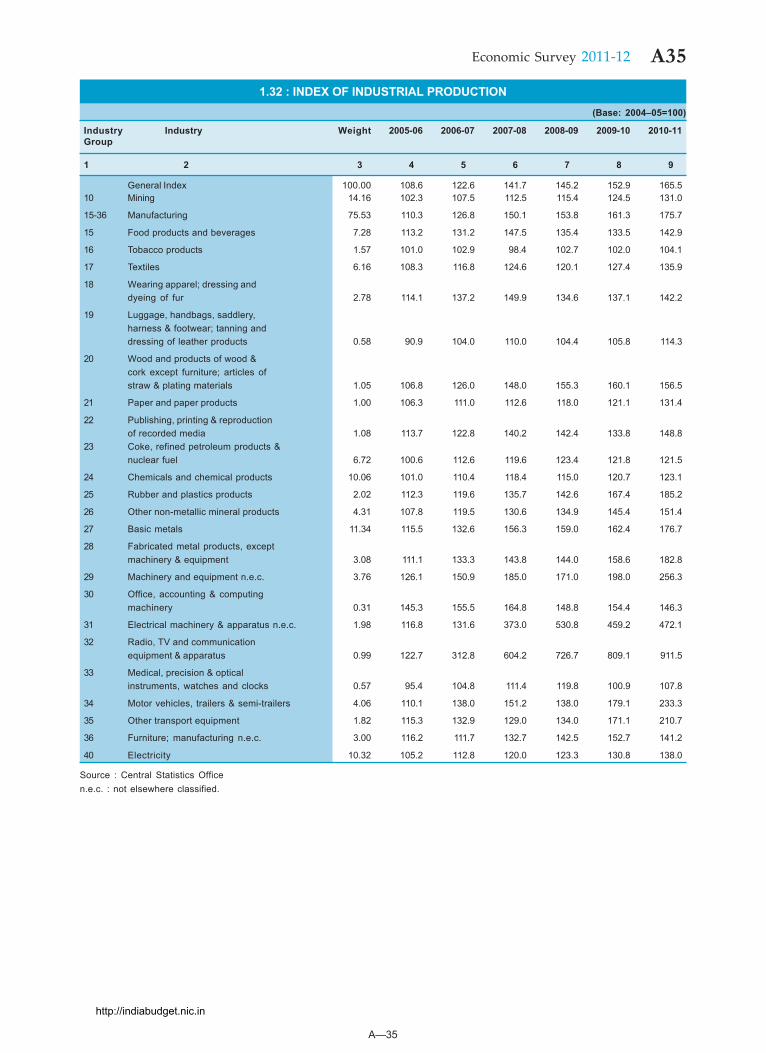
A—35
A35Economic Survey 2011-12
1.32 : INDEX OF INDUSTRIAL PRODUCTION(Base: 2004–05=100)
Industry Industry Weight 2005-06 2006-07 2007-08 2008-09 2009-10 2010-11Group
1 2 3 4 5 6 7 8 9
General Index 100.00 108.6 122.6 141.7 145.2 152.9 165.510 Mining 14.16 102.3 107.5 112.5 115.4 124.5 131.0
15-36 Manufacturing 75.53 110.3 126.8 150.1 153.8 161.3 175.7
15 Food products and beverages 7.28 113.2 131.2 147.5 135.4 133.5 142.9
16 Tobacco products 1.57 101.0 102.9 98.4 102.7 102.0 104.1
17 Textiles 6.16 108.3 116.8 124.6 120.1 127.4 135.9
18 Wearing apparel; dressing anddyeing of fur 2.78 114.1 137.2 149.9 134.6 137.1 142.2
19 Luggage, handbags, saddlery,harness & footwear; tanning anddressing of leather products 0.58 90.9 104.0 110.0 104.4 105.8 114.3
20 Wood and products of wood &cork except furniture; articles ofstraw & plating materials 1.05 106.8 126.0 148.0 155.3 160.1 156.5
21 Paper and paper products 1.00 106.3 111.0 112.6 118.0 121.1 131.4
22 Publishing, printing & reproductionof recorded media 1.08 113.7 122.8 140.2 142.4 133.8 148.8
23 Coke, refined petroleum products &nuclear fuel 6.72 100.6 112.6 119.6 123.4 121.8 121.5
24 Chemicals and chemical products 10.06 101.0 110.4 118.4 115.0 120.7 123.1
25 Rubber and plastics products 2.02 112.3 119.6 135.7 142.6 167.4 185.2
26 Other non-metallic mineral products 4.31 107.8 119.5 130.6 134.9 145.4 151.4
27 Basic metals 11.34 115.5 132.6 156.3 159.0 162.4 176.7
28 Fabricated metal products, exceptmachinery & equipment 3.08 111.1 133.3 143.8 144.0 158.6 182.8
29 Machinery and equipment n.e.c. 3.76 126.1 150.9 185.0 171.0 198.0 256.3
30 Office, accounting & computingmachinery 0.31 145.3 155.5 164.8 148.8 154.4 146.3
31 Electrical machinery & apparatus n.e.c. 1.98 116.8 131.6 373.0 530.8 459.2 472.1
32 Radio, TV and communicationequipment & apparatus 0.99 122.7 312.8 604.2 726.7 809.1 911.5
33 Medical, precision & opticalinstruments, watches and clocks 0.57 95.4 104.8 111.4 119.8 100.9 107.8
34 Motor vehicles, trailers & semi-trailers 4.06 110.1 138.0 151.2 138.0 179.1 233.3
35 Other transport equipment 1.82 115.3 132.9 129.0 134.0 171.1 210.7
36 Furniture; manufacturing n.e.c. 3.00 116.2 111.7 132.7 142.5 152.7 141.2
40 Electricity 10.32 105.2 112.8 120.0 123.3 130.8 138.0
Source : Central Statistics Officen.e.c. : not elsewhere classified.
http://indiabudget.nic.in
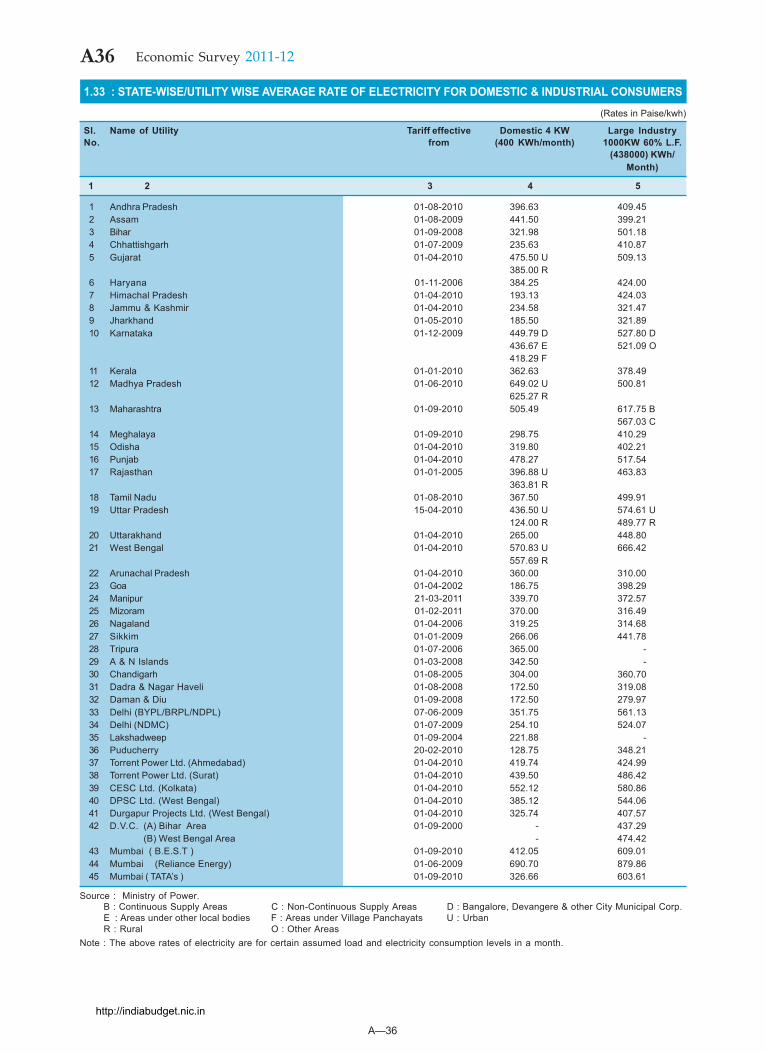
A—36
A36 Economic Survey 2011-12
1.33 : STATE-WISE/UTILITY WISE AVERAGE RATE OF ELECTRICITY FOR DOMESTIC & INDUSTRIAL CONSUMERS
(Rates in Paise/kwh)
Sl. Name of Utility Tariff effective Domestic 4 KW Large IndustryNo. from (400 KWh/month) 1000KW 60% L.F.
(438000) KWh/Month)
1 2 3 4 5
1 Andhra Pradesh 01-08-2010 396.63 409.452 Assam 01-08-2009 441.50 399.213 Bihar 01-09-2008 321.98 501.184 Chhattishgarh 01-07-2009 235.63 410.875 Gujarat 01-04-2010 475.50 U 509.13
385.00 R6 Haryana 01-11-2006 384.25 424.007 Himachal Pradesh 01-04-2010 193.13 424.038 Jammu & Kashmir 01-04-2010 234.58 321.479 Jharkhand 01-05-2010 185.50 321.8910 Karnataka 01-12-2009 449.79 D 527.80 D
436.67 E 521.09 O418.29 F
11 Kerala 01-01-2010 362.63 378.4912 Madhya Pradesh 01-06-2010 649.02 U 500.81
625.27 R13 Maharashtra 01-09-2010 505.49 617.75 B
567.03 C14 Meghalaya 01-09-2010 298.75 410.2915 Odisha 01-04-2010 319.80 402.2116 Punjab 01-04-2010 478.27 517.5417 Rajasthan 01-01-2005 396.88 U 463.83
363.81 R18 Tamil Nadu 01-08-2010 367.50 499.9119 Uttar Pradesh 15-04-2010 436.50 U 574.61 U
124.00 R 489.77 R20 Uttarakhand 01-04-2010 265.00 448.8021 West Bengal 01-04-2010 570.83 U 666.42
557.69 R22 Arunachal Pradesh 01-04-2010 360.00 310.0023 Goa 01-04-2002 186.75 398.2924 Manipur 21-03-2011 339.70 372.5725 Mizoram 01-02-2011 370.00 316.4926 Nagaland 01-04-2006 319.25 314.6827 Sikkim 01-01-2009 266.06 441.7828 Tripura 01-07-2006 365.00 -29 A & N Islands 01-03-2008 342.50 -30 Chandigarh 01-08-2005 304.00 360.7031 Dadra & Nagar Haveli 01-08-2008 172.50 319.0832 Daman & Diu 01-09-2008 172.50 279.9733 Delhi (BYPL/BRPL/NDPL) 07-06-2009 351.75 561.1334 Delhi (NDMC) 01-07-2009 254.10 524.0735 Lakshadweep 01-09-2004 221.88 -36 Puducherry 20-02-2010 128.75 348.2137 Torrent Power Ltd. (Ahmedabad) 01-04-2010 419.74 424.9938 Torrent Power Ltd. (Surat) 01-04-2010 439.50 486.4239 CESC Ltd. (Kolkata) 01-04-2010 552.12 580.8640 DPSC Ltd. (West Bengal) 01-04-2010 385.12 544.0641 Durgapur Projects Ltd. (West Bengal) 01-04-2010 325.74 407.5742 D.V.C. (A) Bihar Area 01-09-2000 - 437.29
(B) West Bengal Area - 474.4243 Mumbai ( B.E.S.T ) 01-09-2010 412.05 609.0144 Mumbai (Reliance Energy) 01-06-2009 690.70 879.8645 Mumbai ( TATA’s ) 01-09-2010 326.66 603.61
Source : Ministry of Power.B : Continuous Supply Areas C : Non-Continuous Supply Areas D : Bangalore, Devangere & other City Municipal Corp.E : Areas under other local bodies F : Areas under Village Panchayats U : UrbanR : Rural O : Other Areas
Note : The above rates of electricity are for certain assumed load and electricity consumption levels in a month.
http://indiabudget.nic.in
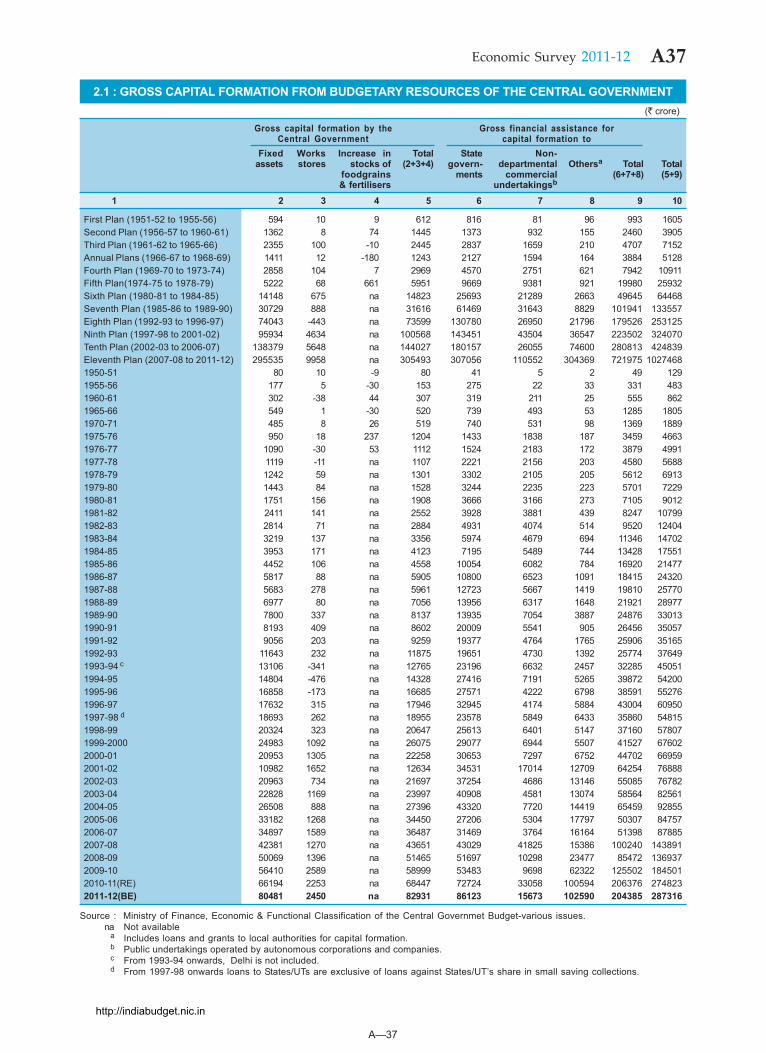
A—37
A37Economic Survey 2011-12
2.1 : GROSS CAPITAL FORMATION FROM BUDGETARY RESOURCES OF THE CENTRAL GOVERNMENT(` crore)
Gross capital formation by the Gross financial assistance forCentral Government capital formation to
Fixed Works Increase in Total State Non-assets stores stocks of (2+3+4) govern- departmental Othersa Total Total
foodgrains ments commercial (6+7+8) (5+9)& fertilisers undertakingsb
1 2 3 4 5 6 7 8 9 10
First Plan (1951-52 to 1955-56) 594 10 9 612 816 81 96 993 1605Second Plan (1956-57 to 1960-61) 1362 8 74 1445 1373 932 155 2460 3905Third Plan (1961-62 to 1965-66) 2355 100 -10 2445 2837 1659 210 4707 7152Annual Plans (1966-67 to 1968-69) 1411 12 -180 1243 2127 1594 164 3884 5128Fourth Plan (1969-70 to 1973-74) 2858 104 7 2969 4570 2751 621 7942 10911Fifth Plan(1974-75 to 1978-79) 5222 68 661 5951 9669 9381 921 19980 25932Sixth Plan (1980-81 to 1984-85) 14148 675 na 14823 25693 21289 2663 49645 64468Seventh Plan (1985-86 to 1989-90) 30729 888 na 31616 61469 31643 8829 101941 133557Eighth Plan (1992-93 to 1996-97) 74043 -443 na 73599 130780 26950 21796 179526 253125Ninth Plan (1997-98 to 2001-02) 95934 4634 na 100568 143451 43504 36547 223502 324070Tenth Plan (2002-03 to 2006-07) 138379 5648 na 144027 180157 26055 74600 280813 424839Eleventh Plan (2007-08 to 2011-12) 295535 9958 na 305493 307056 110552 304369 721975 10274681950-51 80 10 -9 80 41 5 2 49 1291955-56 177 5 -30 153 275 22 33 331 4831960-61 302 -38 44 307 319 211 25 555 8621965-66 549 1 -30 520 739 493 53 1285 18051970-71 485 8 26 519 740 531 98 1369 18891975-76 950 18 237 1204 1433 1838 187 3459 46631976-77 1090 -30 53 1112 1524 2183 172 3879 49911977-78 1119 -11 na 1107 2221 2156 203 4580 56881978-79 1242 59 na 1301 3302 2105 205 5612 69131979-80 1443 84 na 1528 3244 2235 223 5701 72291980-81 1751 156 na 1908 3666 3166 273 7105 90121981-82 2411 141 na 2552 3928 3881 439 8247 107991982-83 2814 71 na 2884 4931 4074 514 9520 124041983-84 3219 137 na 3356 5974 4679 694 11346 147021984-85 3953 171 na 4123 7195 5489 744 13428 175511985-86 4452 106 na 4558 10054 6082 784 16920 214771986-87 5817 88 na 5905 10800 6523 1091 18415 243201987-88 5683 278 na 5961 12723 5667 1419 19810 257701988-89 6977 80 na 7056 13956 6317 1648 21921 289771989-90 7800 337 na 8137 13935 7054 3887 24876 330131990-91 8193 409 na 8602 20009 5541 905 26456 350571991-92 9056 203 na 9259 19377 4764 1765 25906 351651992-93 11643 232 na 11875 19651 4730 1392 25774 376491993-94 c 13106 -341 na 12765 23196 6632 2457 32285 450511994-95 14804 -476 na 14328 27416 7191 5265 39872 542001995-96 16858 -173 na 16685 27571 4222 6798 38591 552761996-97 17632 315 na 17946 32945 4174 5884 43004 609501997-98 d 18693 262 na 18955 23578 5849 6433 35860 548151998-99 20324 323 na 20647 25613 6401 5147 37160 578071999-2000 24983 1092 na 26075 29077 6944 5507 41527 676022000-01 20953 1305 na 22258 30653 7297 6752 44702 669592001-02 10982 1652 na 12634 34531 17014 12709 64254 768882002-03 20963 734 na 21697 37254 4686 13146 55085 767822003-04 22828 1169 na 23997 40908 4581 13074 58564 825612004-05 26508 888 na 27396 43320 7720 14419 65459 928552005-06 33182 1268 na 34450 27206 5304 17797 50307 847572006-07 34897 1589 na 36487 31469 3764 16164 51398 878852007-08 42381 1270 na 43651 43029 41825 15386 100240 1438912008-09 50069 1396 na 51465 51697 10298 23477 85472 1369372009-10 56410 2589 na 58999 53483 9698 62322 125502 1845012010-11(RE) 66194 2253 na 68447 72724 33058 100594 206376 2748232011-12(BE) 80481 2450 na 82931 86123 15673 102590 204385 287316
Source : Ministry of Finance, Economic & Functional Classification of the Central Governmet Budget-various issues.na Not available
a Includes loans and grants to local authorities for capital formation.b Public undertakings operated by autonomous corporations and companies.c From 1993-94 onwards, Delhi is not included.d From 1997-98 onwards loans to States/UTs are exclusive of loans against States/UT’s share in small saving collections.
http://indiabudget.nic.in
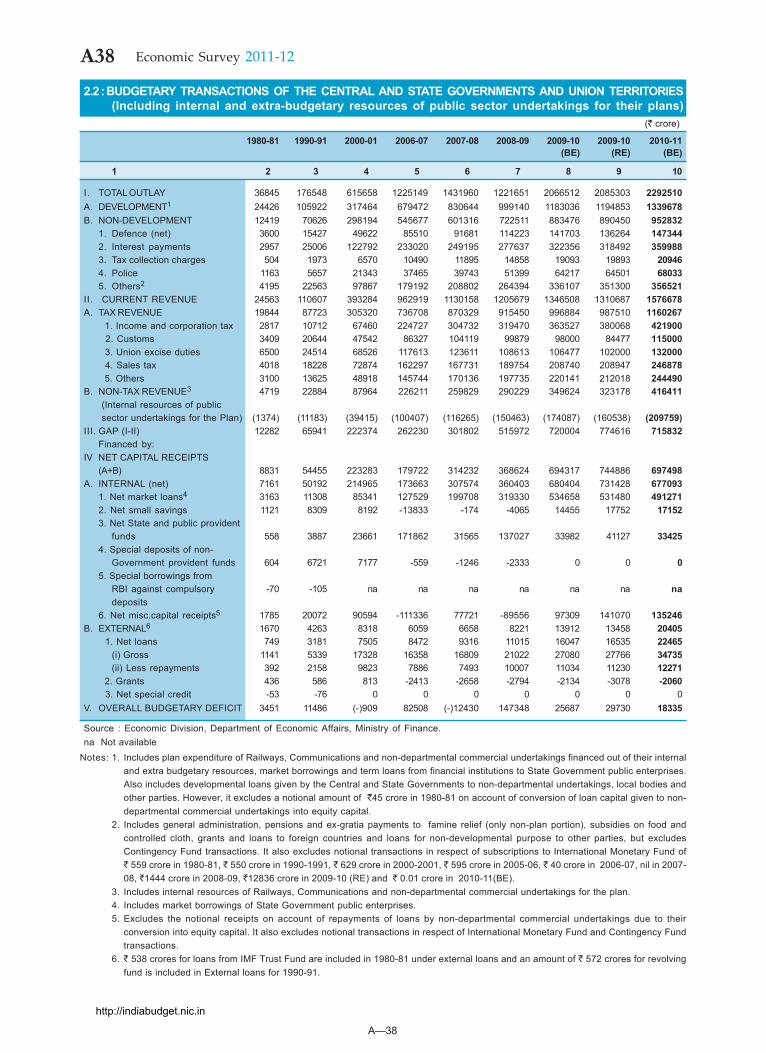
A—38
A38 Economic Survey 2011-12
2.2 : BUDGETARY TRANSACTIONS OF THE CENTRAL AND STATE GOVERNMENTS AND UNION TERRITORIES(Including internal and extra-budgetary resources of public sector undertakings for their plans)
(` crore)
1980-81 1990-91 2000-01 2006-07 2007-08 2008-09 2009-10 2009-10 2010-11(BE) (RE) (BE)
1 2 3 4 5 6 7 8 9 10
I. TOTAL OUTLAY 36845 176548 615658 1225149 1431960 1221651 2066512 2085303 2292510A. DEVELOPMENT1 24426 105922 317464 679472 830644 999140 1183036 1194853 1339678B. NON-DEVELOPMENT 12419 70626 298194 545677 601316 722511 883476 890450 952832
1. Defence (net) 3600 15427 49622 85510 91681 114223 141703 136264 1473442. Interest payments 2957 25006 122792 233020 249195 277637 322356 318492 3599883. Tax collection charges 504 1973 6570 10490 11895 14858 19093 19893 209464. Police 1163 5657 21343 37465 39743 51399 64217 64501 680335. Others2 4195 22563 97867 179192 208802 264394 336107 351300 356521
II. CURRENT REVENUE 24563 110607 393284 962919 1130158 1205679 1346508 1310687 1576678A. TAX REVENUE 19844 87723 305320 736708 870329 915450 996884 987510 1160267
1. Income and corporation tax 2817 10712 67460 224727 304732 319470 363527 380068 421900 2. Customs 3409 20644 47542 86327 104119 99879 98000 84477 115000 3. Union excise duties 6500 24514 68526 117613 123611 108613 106477 102000 132000 4. Sales tax 4018 18228 72874 162297 167731 189754 208740 208947 246878 5. Others 3100 13625 48918 145744 170136 197735 220141 212018 244490
B. NON-TAX REVENUE3 4719 22884 87964 226211 259829 290229 349624 323178 416411 (Internal resources of public sector undertakings for the Plan) (1374) (11183) (39415) (100407) (116265) (150463) (174087) (160538) (209759)
III. GAP (I-II) 12282 65941 222374 262230 301802 515972 720004 774616 715832Financed by:
IV NET CAPITAL RECEIPTS(A+B) 8831 54455 223283 179722 314232 368624 694317 744886 697498
A. INTERNAL (net) 7161 50192 214965 173663 307574 360403 680404 731428 6770931. Net market loans4 3163 11308 85341 127529 199708 319330 534658 531480 4912712. Net small savings 1121 8309 8192 -13833 -174 -4065 14455 17752 171523. Net State and public provident
funds 558 3887 23661 171862 31565 137027 33982 41127 334254. Special deposits of non-
Government provident funds 604 6721 7177 -559 -1246 -2333 0 0 05. Special borrowings from
RBI against compulsory -70 -105 na na na na na na nadeposits
6. Net misc.capital receipts5 1785 20072 90594 -111336 77721 -89556 97309 141070 135246B. EXTERNAL6 1670 4263 8318 6059 6658 8221 13912 13458 20405
1. Net loans 749 3181 7505 8472 9316 11015 16047 16535 22465(i) Gross 1141 5339 17328 16358 16809 21022 27080 27766 34735(ii) Less repayments 392 2158 9823 7886 7493 10007 11034 11230 12271
2. Grants 436 586 813 -2413 -2658 -2794 -2134 -3078 -2060 3. Net special credit -53 -76 0 0 0 0 0 0 0
V. OVERALL BUDGETARY DEFICIT 3451 11486 (-)909 82508 (-)12430 147348 25687 29730 18335
Source : Economic Division, Department of Economic Affairs, Ministry of Finance.na Not available
Notes: 1. Includes plan expenditure of Railways, Communications and non-departmental commercial undertakings financed out of their internaland extra budgetary resources, market borrowings and term loans from financial institutions to State Government public enterprises.Also includes developmental loans given by the Central and State Governments to non-departmental undertakings, local bodies andother parties. However, it excludes a notional amount of `45 crore in 1980-81 on account of conversion of loan capital given to non-departmental commercial undertakings into equity capital.
2. Includes general administration, pensions and ex-gratia payments to famine relief (only non-plan portion), subsidies on food andcontrolled cloth, grants and loans to foreign countries and loans for non-developmental purpose to other parties, but excludesContingency Fund transactions. It also excludes notional transactions in respect of subscriptions to International Monetary Fund of` 559 crore in 1980-81, ` 550 crore in 1990-1991, ` 629 crore in 2000-2001, ` 595 crore in 2005-06, ` 40 crore in 2006-07, nil in 2007-08, `1444 crore in 2008-09, `12836 crore in 2009-10 (RE) and ` 0.01 crore in 2010-11(BE).
3. Includes internal resources of Railways, Communications and non-departmental commercial undertakings for the plan.4. Includes market borrowings of State Government public enterprises.5. Excludes the notional receipts on account of repayments of loans by non-departmental commercial undertakings due to their
conversion into equity capital. It also excludes notional transactions in respect of International Monetary Fund and Contingency Fundtransactions.
6. ` 538 crores for loans from IMF Trust Fund are included in 1980-81 under external loans and an amount of ` 572 crores for revolvingfund is included in External loans for 1990-91.
http://indiabudget.nic.in
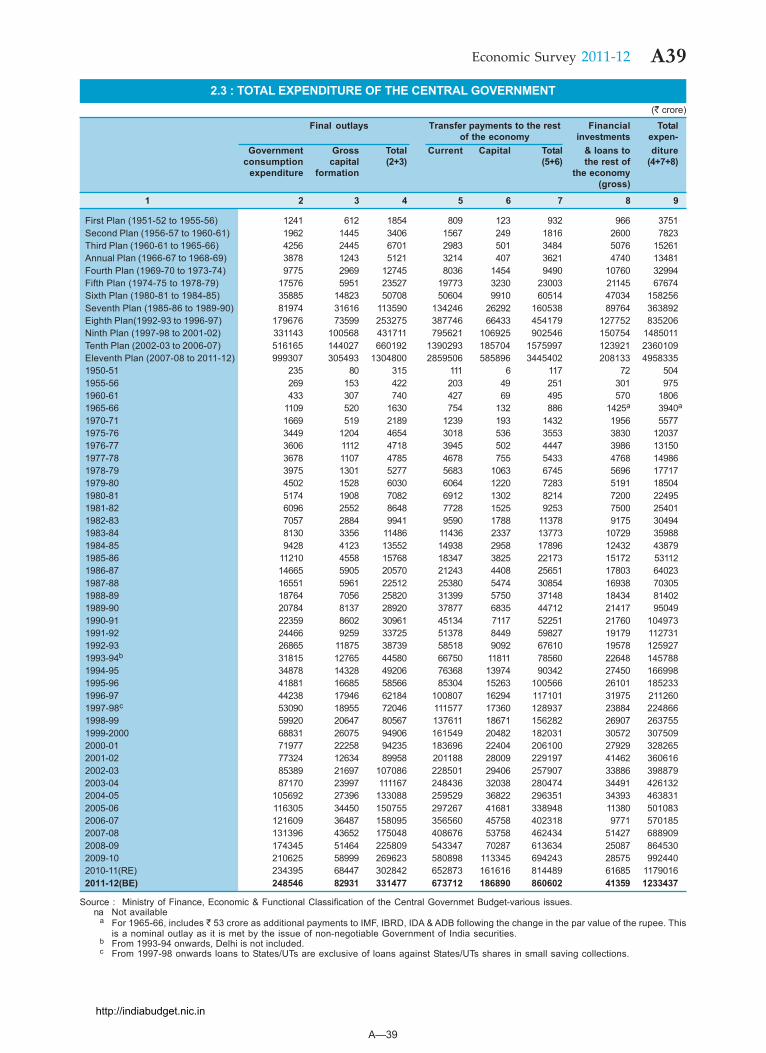
A—39
A39Economic Survey 2011-12
2.3 : TOTAL EXPENDITURE OF THE CENTRAL GOVERNMENT(` crore)
Final outlays Transfer payments to the rest Financial Totalof the economy investments expen-
Government Gross Total Current Capital Total & loans to ditureconsumption capital (2+3) (5+6) the rest of (4+7+8)
expenditure formation the economy(gross)
1 2 3 4 5 6 7 8 9
First Plan (1951-52 to 1955-56) 1241 612 1854 809 123 932 966 3751Second Plan (1956-57 to 1960-61) 1962 1445 3406 1567 249 1816 2600 7823Third Plan (1960-61 to 1965-66) 4256 2445 6701 2983 501 3484 5076 15261Annual Plan (1966-67 to 1968-69) 3878 1243 5121 3214 407 3621 4740 13481Fourth Plan (1969-70 to 1973-74) 9775 2969 12745 8036 1454 9490 10760 32994Fifth Plan (1974-75 to 1978-79) 17576 5951 23527 19773 3230 23003 21145 67674Sixth Plan (1980-81 to 1984-85) 35885 14823 50708 50604 9910 60514 47034 158256Seventh Plan (1985-86 to 1989-90) 81974 31616 113590 134246 26292 160538 89764 363892Eighth Plan(1992-93 to 1996-97) 179676 73599 253275 387746 66433 454179 127752 835206Ninth Plan (1997-98 to 2001-02) 331143 100568 431711 795621 106925 902546 150754 1485011Tenth Plan (2002-03 to 2006-07) 516165 144027 660192 1390293 185704 1575997 123921 2360109Eleventh Plan (2007-08 to 2011-12) 999307 305493 1304800 2859506 585896 3445402 208133 49583351950-51 235 80 315 111 6 117 72 5041955-56 269 153 422 203 49 251 301 9751960-61 433 307 740 427 69 495 570 18061965-66 1109 520 1630 754 132 886 1425a 3940a
1970-71 1669 519 2189 1239 193 1432 1956 55771975-76 3449 1204 4654 3018 536 3553 3830 120371976-77 3606 1112 4718 3945 502 4447 3986 131501977-78 3678 1107 4785 4678 755 5433 4768 149861978-79 3975 1301 5277 5683 1063 6745 5696 177171979-80 4502 1528 6030 6064 1220 7283 5191 185041980-81 5174 1908 7082 6912 1302 8214 7200 224951981-82 6096 2552 8648 7728 1525 9253 7500 254011982-83 7057 2884 9941 9590 1788 11378 9175 304941983-84 8130 3356 11486 11436 2337 13773 10729 359881984-85 9428 4123 13552 14938 2958 17896 12432 438791985-86 11210 4558 15768 18347 3825 22173 15172 531121986-87 14665 5905 20570 21243 4408 25651 17803 640231987-88 16551 5961 22512 25380 5474 30854 16938 703051988-89 18764 7056 25820 31399 5750 37148 18434 814021989-90 20784 8137 28920 37877 6835 44712 21417 950491990-91 22359 8602 30961 45134 7117 52251 21760 1049731991-92 24466 9259 33725 51378 8449 59827 19179 1127311992-93 26865 11875 38739 58518 9092 67610 19578 1259271993-94b 31815 12765 44580 66750 11811 78560 22648 1457881994-95 34878 14328 49206 76368 13974 90342 27450 1669981995-96 41881 16685 58566 85304 15263 100566 26101 1852331996-97 44238 17946 62184 100807 16294 117101 31975 2112601997-98c 53090 18955 72046 111577 17360 128937 23884 2248661998-99 59920 20647 80567 137611 18671 156282 26907 2637551999-2000 68831 26075 94906 161549 20482 182031 30572 3075092000-01 71977 22258 94235 183696 22404 206100 27929 3282652001-02 77324 12634 89958 201188 28009 229197 41462 3606162002-03 85389 21697 107086 228501 29406 257907 33886 3988792003-04 87170 23997 111167 248436 32038 280474 34491 4261322004-05 105692 27396 133088 259529 36822 296351 34393 4638312005-06 116305 34450 150755 297267 41681 338948 11380 5010832006-07 121609 36487 158095 356560 45758 402318 9771 5701852007-08 131396 43652 175048 408676 53758 462434 51427 6889092008-09 174345 51464 225809 543347 70287 613634 25087 8645302009-10 210625 58999 269623 580898 113345 694243 28575 9924402010-11(RE) 234395 68447 302842 652873 161616 814489 61685 11790162011-12(BE) 248546 82931 331477 673712 186890 860602 41359 1233437
Source : Ministry of Finance, Economic & Functional Classification of the Central Governmet Budget-various issues.na Not available
a For 1965-66, includes ` 53 crore as additional payments to IMF, IBRD, IDA & ADB following the change in the par value of the rupee. Thisis a nominal outlay as it is met by the issue of non-negotiable Government of India securities.
b From 1993-94 onwards, Delhi is not included.c From 1997-98 onwards loans to States/UTs are exclusive of loans against States/UTs shares in small saving collections.
http://indiabudget.nic.in
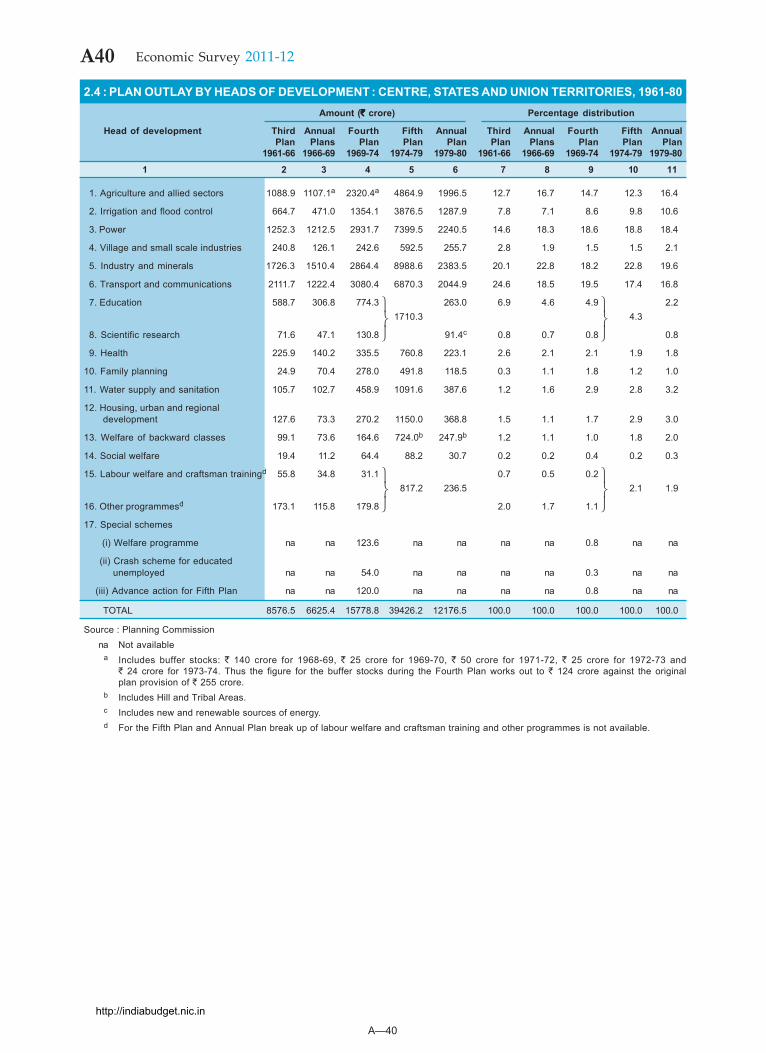
A—40
A40 Economic Survey 2011-12
2.4 : PLAN OUTLAY BY HEADS OF DEVELOPMENT : CENTRE, STATES AND UNION TERRITORIES, 1961-80Amount (`̀̀̀̀ crore) Percentage distribution
Head of development Third Annual Fourth Fifth Annual Third Annual Fourth Fifth AnnualPlan Plans Plan Plan Plan Plan Plans Plan Plan Plan
1961-66 1966-69 1969-74 1974-79 1979-80 1961-66 1966-69 1969-74 1974-79 1979-80
1 2 3 4 5 6 7 8 9 10 11
1. Agriculture and allied sectors 1088.9 1107.1a 2320.4a 4864.9 1996.5 12.7 16.7 14.7 12.3 16.4
2. Irrigation and flood control 664.7 471.0 1354.1 3876.5 1287.9 7.8 7.1 8.6 9.8 10.6
3. Power 1252.3 1212.5 2931.7 7399.5 2240.5 14.6 18.3 18.6 18.8 18.4
4. Village and small scale industries 240.8 126.1 242.6 592.5 255.7 2.8 1.9 1.5 1.5 2.1
5. Industry and minerals 1726.3 1510.4 2864.4 8988.6 2383.5 20.1 22.8 18.2 22.8 19.6
6. Transport and communications 2111.7 1222.4 3080.4 6870.3 2044.9 24.6 18.5 19.5 17.4 16.8
7. Education 588.7 306.8 774.3 263.0 6.9 4.6 4.9 2.21710.3 4.3
8. Scientific research 71.6 47.1 130.8 91.4c 0.8 0.7 0.8 0.8
9. Health 225.9 140.2 335.5 760.8 223.1 2.6 2.1 2.1 1.9 1.8
10. Family planning 24.9 70.4 278.0 491.8 118.5 0.3 1.1 1.8 1.2 1.0
11. Water supply and sanitation 105.7 102.7 458.9 1091.6 387.6 1.2 1.6 2.9 2.8 3.2
12. Housing, urban and regional development 127.6 73.3 270.2 1150.0 368.8 1.5 1.1 1.7 2.9 3.0
13. Welfare of backward classes 99.1 73.6 164.6 724.0b 247.9b 1.2 1.1 1.0 1.8 2.0
14. Social welfare 19.4 11.2 64.4 88.2 30.7 0.2 0.2 0.4 0.2 0.3
15. Labour welfare and craftsman trainingd 55.8 34.8 31.1 0.7 0.5 0.2817.2 236.5 2.1 1.9
16. Other programmesd 173.1 115.8 179.8 2.0 1.7 1.1
17. Special schemes
(i) Welfare programme na na 123.6 na na na na 0.8 na na
(ii) Crash scheme for educated unemployed na na 54.0 na na na na 0.3 na na
(iii) Advance action for Fifth Plan na na 120.0 na na na na 0.8 na na
TOTAL 8576.5 6625.4 15778.8 39426.2 12176.5 100.0 100.0 100.0 100.0 100.0
Source : Planning Commissionna Not available
a Includes buffer stocks: ` 140 crore for 1968-69, ` 25 crore for 1969-70, ` 50 crore for 1971-72, ` 25 crore for 1972-73 and` 24 crore for 1973-74. Thus the figure for the buffer stocks during the Fourth Plan works out to ` 124 crore against the originalplan provision of ` 255 crore.
b Includes Hill and Tribal Areas.c Includes new and renewable sources of energy.d For the Fifth Plan and Annual Plan break up of labour welfare and craftsman training and other programmes is not available.
http://indiabudget.nic.in
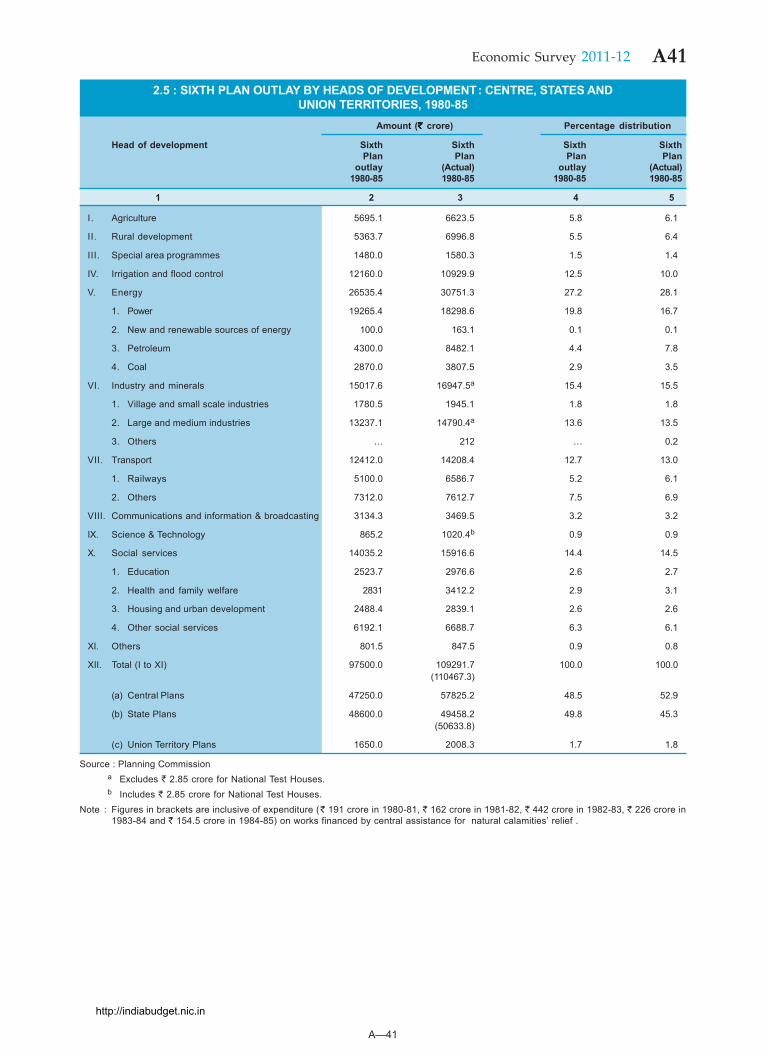
A—41
A41Economic Survey 2011-12
2.5 : SIXTH PLAN OUTLAY BY HEADS OF DEVELOPMENT: CENTRE, STATES ANDUNION TERRITORIES, 1980-85
Amount (`̀̀̀̀ crore) Percentage distribution
Head of development Sixth Sixth Sixth SixthPlan Plan Plan Plan
outlay (Actual) outlay (Actual)1980-85 1980-85 1980-85 1980-85
1 2 3 4 5
I. Agriculture 5695.1 6623.5 5.8 6.1
II. Rural development 5363.7 6996.8 5.5 6.4
III. Special area programmes 1480.0 1580.3 1.5 1.4
IV. Irrigation and flood control 12160.0 10929.9 12.5 10.0
V. Energy 26535.4 30751.3 27.2 28.1
1. Power 19265.4 18298.6 19.8 16.7
2. New and renewable sources of energy 100.0 163.1 0.1 0.1
3. Petroleum 4300.0 8482.1 4.4 7.8
4. Coal 2870.0 3807.5 2.9 3.5
VI. Industry and minerals 15017.6 16947.5a 15.4 15.5
1. Village and small scale industries 1780.5 1945.1 1.8 1.8
2. Large and medium industries 13237.1 14790.4a 13.6 13.5
3. Others … 212 … 0.2
VII. Transport 12412.0 14208.4 12.7 13.0
1. Railways 5100.0 6586.7 5.2 6.1
2. Others 7312.0 7612.7 7.5 6.9
VIII. Communications and information & broadcasting 3134.3 3469.5 3.2 3.2
IX. Science & Technology 865.2 1020.4b 0.9 0.9
X. Social services 14035.2 15916.6 14.4 14.5
1. Education 2523.7 2976.6 2.6 2.7
2. Health and family welfare 2831 3412.2 2.9 3.1
3. Housing and urban development 2488.4 2839.1 2.6 2.6
4. Other social services 6192.1 6688.7 6.3 6.1
XI. Others 801.5 847.5 0.9 0.8
XII. Total (I to XI) 97500.0 109291.7 100.0 100.0(110467.3)
(a) Central Plans 47250.0 57825.2 48.5 52.9
(b) State Plans 48600.0 49458.2 49.8 45.3(50633.8)
(c) Union Territory Plans 1650.0 2008.3 1.7 1.8
Source : Planning Commissiona Excludes ` 2.85 crore for National Test Houses.b Includes ` 2.85 crore for National Test Houses.
Note : Figures in brackets are inclusive of expenditure (` 191 crore in 1980-81, ` 162 crore in 1981-82, ` 442 crore in 1982-83, ` 226 crore in1983-84 and ` 154.5 crore in 1984-85) on works financed by central assistance for natural calamities’ relief .
http://indiabudget.nic.in
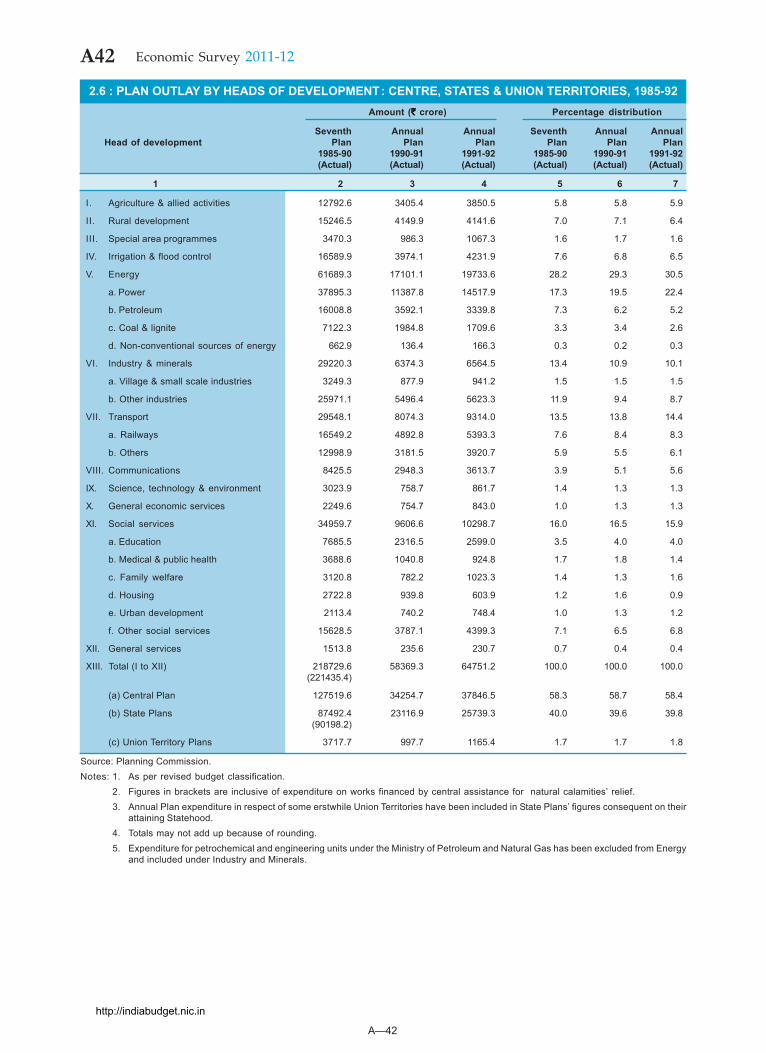
A—42
A42 Economic Survey 2011-12
2.6 : PLAN OUTLAY BY HEADS OF DEVELOPMENT: CENTRE, STATES & UNION TERRITORIES, 1985-92Amount ( `̀̀̀̀ crore) Percentage distribution
Seventh Annual Annual Seventh Annual AnnualHead of development Plan Plan Plan Plan Plan Plan
1985-90 1990-91 1991-92 1985-90 1990-91 1991-92(Actual) (Actual) (Actual) (Actual) (Actual) (Actual)
1 2 3 4 5 6 7
I. Agriculture & allied activities 12792.6 3405.4 3850.5 5.8 5.8 5.9
II. Rural development 15246.5 4149.9 4141.6 7.0 7.1 6.4
III. Special area programmes 3470.3 986.3 1067.3 1.6 1.7 1.6
IV. Irrigation & flood control 16589.9 3974.1 4231.9 7.6 6.8 6.5
V. Energy 61689.3 17101.1 19733.6 28.2 29.3 30.5
a. Power 37895.3 11387.8 14517.9 17.3 19.5 22.4
b. Petroleum 16008.8 3592.1 3339.8 7.3 6.2 5.2
c. Coal & lignite 7122.3 1984.8 1709.6 3.3 3.4 2.6
d. Non-conventional sources of energy 662.9 136.4 166.3 0.3 0.2 0.3
VI. Industry & minerals 29220.3 6374.3 6564.5 13.4 10.9 10.1
a. Village & small scale industries 3249.3 877.9 941.2 1.5 1.5 1.5
b. Other industries 25971.1 5496.4 5623.3 11.9 9.4 8.7
VII. Transport 29548.1 8074.3 9314.0 13.5 13.8 14.4
a. Railways 16549.2 4892.8 5393.3 7.6 8.4 8.3
b. Others 12998.9 3181.5 3920.7 5.9 5.5 6.1
VIII. Communications 8425.5 2948.3 3613.7 3.9 5.1 5.6
IX. Science, technology & environment 3023.9 758.7 861.7 1.4 1.3 1.3
X. General economic services 2249.6 754.7 843.0 1.0 1.3 1.3
XI. Social services 34959.7 9606.6 10298.7 16.0 16.5 15.9
a. Education 7685.5 2316.5 2599.0 3.5 4.0 4.0
b. Medical & public health 3688.6 1040.8 924.8 1.7 1.8 1.4
c. Family welfare 3120.8 782.2 1023.3 1.4 1.3 1.6
d. Housing 2722.8 939.8 603.9 1.2 1.6 0.9
e. Urban development 2113.4 740.2 748.4 1.0 1.3 1.2
f. Other social services 15628.5 3787.1 4399.3 7.1 6.5 6.8
XII. General services 1513.8 235.6 230.7 0.7 0.4 0.4
XIII. Total (I to XII) 218729.6 58369.3 64751.2 100.0 100.0 100.0(221435.4)
(a) Central Plan 127519.6 34254.7 37846.5 58.3 58.7 58.4
(b) State Plans 87492.4 23116.9 25739.3 40.0 39.6 39.8(90198.2)
(c) Union Territory Plans 3717.7 997.7 1165.4 1.7 1.7 1.8
Source: Planning Commission.Notes: 1. As per revised budget classification.
2. Figures in brackets are inclusive of expenditure on works financed by central assistance for natural calamities’ relief. 3. Annual Plan expenditure in respect of some erstwhile Union Territories have been included in State Plans’ figures consequent on their
attaining Statehood. 4. Totals may not add up because of rounding. 5. Expenditure for petrochemical and engineering units under the Ministry of Petroleum and Natural Gas has been excluded from Energy
and included under Industry and Minerals.
http://indiabudget.nic.in
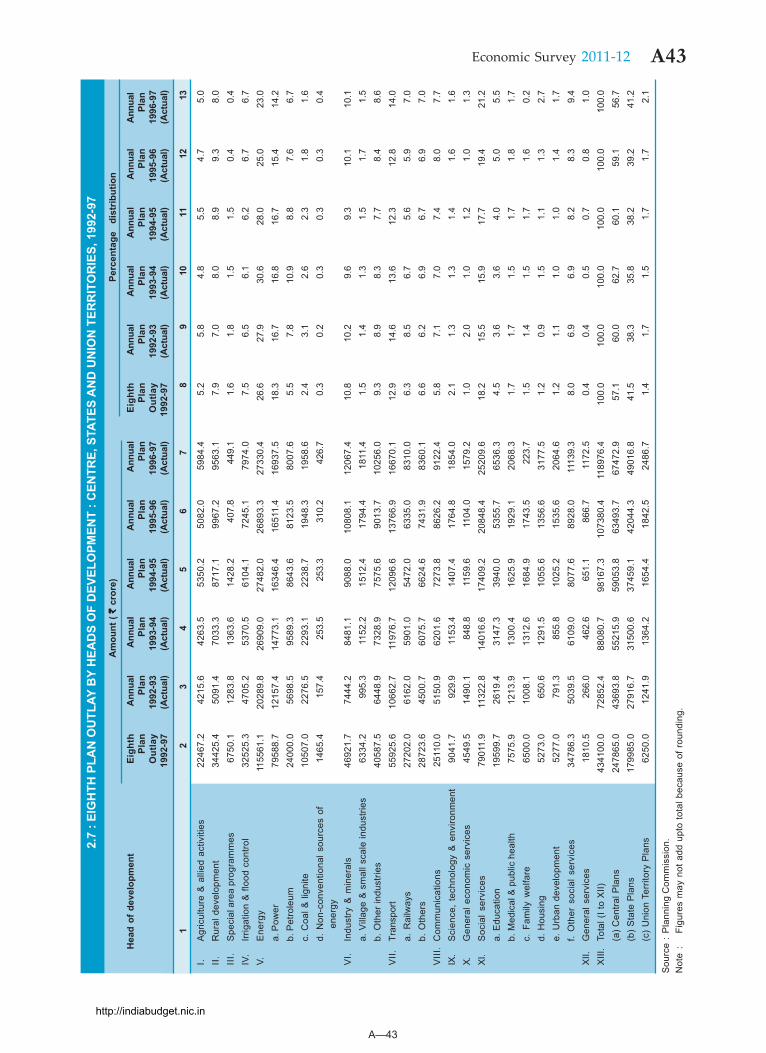
A—43
A43Economic Survey 2011-12
2.7
: EIG
HTH
PLA
N O
UTL
AY B
Y H
EAD
S O
F D
EVEL
OPM
ENT
: CEN
TRE,
STA
TES
AN
D U
NIO
N T
ERR
ITO
RIE
S, 1
992-
97A
mou
nt (
`̀̀̀̀ cr
ore)
Perc
enta
ge
dist
ribut
ion
Hea
d of
dev
elop
men
tEi
ghth
Ann
ual
Ann
ual
Ann
ual
Ann
ual
Ann
ual
Eigh
thA
nnua
lA
nnua
lA
nnua
lA
nnua
lA
nnua
lPl
anPl
anPl
anPl
anPl
anPl
anPl
anPl
anPl
anPl
anPl
anPl
anO
utla
y19
92-9
319
93-9
419
94-9
519
95-9
619
96-9
7O
utla
y19
92-9
319
93-9
419
94-9
519
95-9
619
96-9
719
92-9
7(A
ctua
l)(A
ctua
l)(A
ctua
l)(A
ctua
l)(A
ctua
l)19
92-9
7(A
ctua
l)(A
ctua
l)(A
ctua
l)(A
ctua
l)(A
ctua
l)
1 2
34
56
78
910
1112
13
I.A
gric
ultu
re &
alli
ed a
ctiv
ities
2246
7.2
4215
.642
63.5
5350
.250
82.0
5984
.45.
25.
84.
85.
54.
75.
0II
.R
ural
dev
elop
men
t34
425.
450
91.4
7033
.387
17.1
9967
.295
63.1
7.9
7.0
8.0
8.9
9.3
8.0
III.
Spe
cial
are
a pr
ogra
mm
es67
50.1
1283
.813
63.6
1428
.240
7.8
449.
11.
61.
81.
51.
50.
40.
4IV
.Irr
igat
ion
& fl
ood
cont
rol
3252
5.3
4705
.253
70.5
6104
.172
45.1
7974
.07.
56.
56.
16.
26.
76.
7V.
Ene
rgy
1155
61.1
2028
9.8
2690
9.0
2748
2.0
2689
3.3
2733
0.4
26.6
27.9
30.6
28.0
25.0
23.0
a. P
ower
7958
8.7
1215
7.4
1477
3.1
1634
6.4
1651
1.4
1693
7.5
18.3
16.7
16.8
16.7
15.4
14.2
b. P
etro
leum
2400
0.0
5698
.595
89.3
8643
.681
23.5
8007
.65.
57.
810
.98.
87.
66.
7c.
Coa
l & li
gnite
1050
7.0
2276
.522
93.1
2238
.719
48.3
1958
.62.
43.
12.
62.
31.
81.
6d.
Non
-con
vent
iona
l sou
rces
of
1465
.415
7.4
253.
525
3.3
310.
242
6.7
0.3
0.2
0.3
0.3
0.3
0.4
ener
gyV
I.In
dust
ry &
min
eral
s46
921.
774
44.2
8481
.190
88.0
1080
8.1
1206
7.4
10.8
10.2
9.6
9.3
10.1
10.1
a. V
illag
e &
sm
all s
cale
indu
strie
s63
34.2
995.
311
52.2
1512
.417
94.4
1811
.41.
51.
41.
31.
51.
71.
5b.
Oth
er in
dust
ries
4058
7.5
6448
.973
28.9
7575
.690
13.7
1025
6.0
9.3
8.9
8.3
7.7
8.4
8.6
VII.
Tran
spor
t55
925.
610
662.
711
976.
712
096.
613
766.
916
670.
112
.914
.613
.612
.312
.814
.0a.
Rai
lway
s27
202.
061
62.0
5901
.054
72.0
6335
.083
10.0
6.3
8.5
6.7
5.6
5.9
7.0
b. O
ther
s28
723.
645
00.7
6075
.766
24.6
7431
.983
60.1
6.6
6.2
6.9
6.7
6.9
7.0
VIII
.C
omm
unic
atio
ns25
110.
051
50.9
6201
.672
73.8
8626
.291
22.4
5.8
7.1
7.0
7.4
8.0
7.7
IX.
Sci
ence
, te
chno
logy
& e
nviro
nmen
t90
41.7
929.
911
53.4
1407
.417
64.8
1854
.02.
11.
31.
31.
41.
61.
6X.
Gen
eral
eco
nom
ic s
ervi
ces
4549
.514
90.1
848.
811
59.6
1104
.015
79.2
1.0
2.0
1.0
1.2
1.0
1.3
XI.
Soc
ial
serv
ices
7901
1.9
1132
2.8
1401
6.6
1740
9.2
2084
8.4
2520
9.6
18.2
15.5
15.9
17.7
19.4
21.2
a. E
duca
tion
1959
9.7
2619
.431
47.3
3940
.053
55.7
6536
.34.
53.
63.
64.
05.
05.
5b.
Med
ical
& p
ublic
hea
lth75
75.9
1213
.913
00.4
1625
.919
29.1
2068
.31.
71.
71.
51.
71.
81.
7c.
Fam
ily w
elfa
re65
00.0
1008
.113
12.6
1684
.917
43.5
223.
71.
51.
41.
51.
71.
60.
2d.
Hou
sing
5273
.065
0.6
1291
.510
55.6
1356
.631
77.5
1.2
0.9
1.5
1.1
1.3
2.7
e. U
rban
dev
elop
men
t52
77.0
791.
385
5.8
1025
.215
35.6
2064
.61.
21.
11.
01.
01.
41.
7f.
Oth
er s
ocia
l se
rvic
es34
786.
350
39.5
6109
.080
77.6
8928
.011
139.
38.
06.
96.
98.
28.
39.
4XI
I.G
ener
al s
ervi
ces
1810
.526
6.0
462.
665
1.1
866.
711
72.5
0.4
0.4
0.5
0.7
0.8
1.0
XIII
.To
tal (
I to
XII)
4341
00.0
7285
2.4
8808
0.7
9816
7.3
1073
80.4
1189
76.4
100.
010
0.0
100.
010
0.0
100.
010
0.0
(a) C
entra
l Pla
ns24
7865
.043
693.
855
215.
959
053.
863
493.
767
472.
957
.160
.062
.760
.159
.156
.7(b
) S
tate
Pla
ns17
9985
.027
916.
731
500.
637
459.
142
044.
349
016.
841
.538
.335
.838
.239
.241
.2(c
) U
nion
Ter
ritor
y P
lans
6250
.012
41.9
1364
.216
54.4
1842
.524
86.7
1.4
1.7
1.5
1.7
1.7
2.1
Sou
rce
:P
lann
ing
Com
mis
sion
.N
ote
:Fi
gure
s m
ay n
ot a
dd u
pto
tota
l bec
ause
of r
ound
ing.
http://indiabudget.nic.in
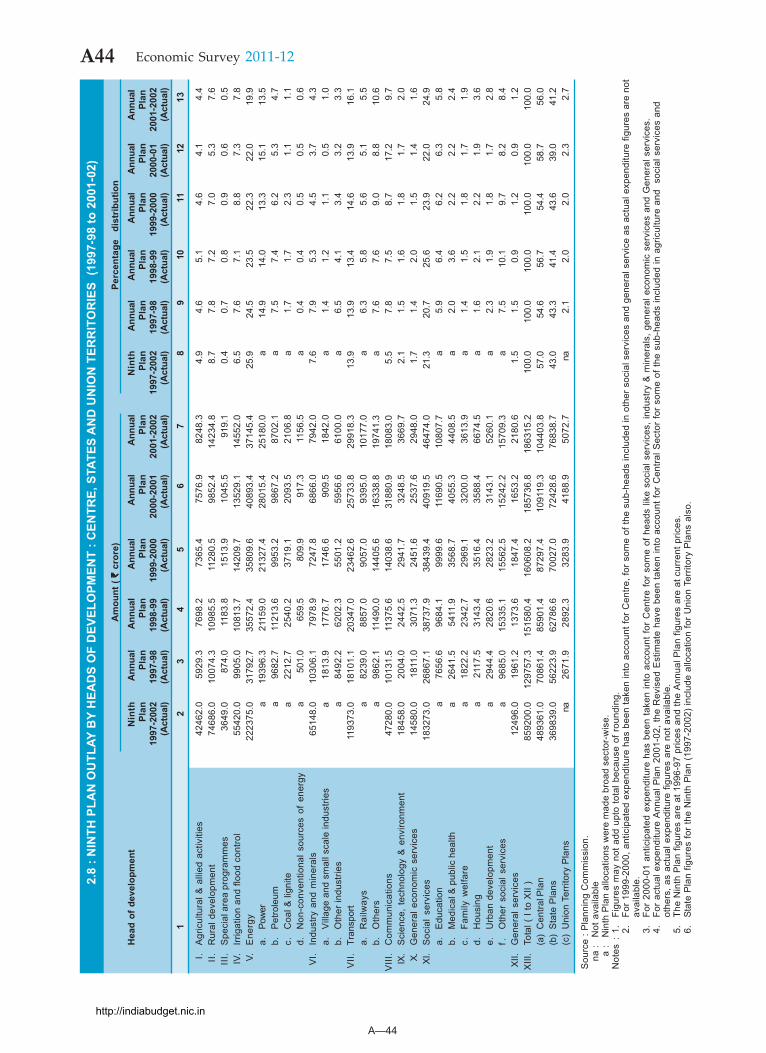
A—44
A44 Economic Survey 2011-12
2.8
: NIN
TH P
LAN
OU
TLAY
BY
HEA
DS
OF
DEV
ELO
PMEN
T : C
ENTR
E, S
TATE
S A
ND
UN
ION
TER
RIT
OR
IES
(199
7-98
to 2
001-
02)
Am
ount
( `̀̀̀̀
cror
e)Pe
rcen
tage
di
strib
utio
n
Hea
d of
dev
elop
men
tN
inth
Ann
ual
Ann
ual
Ann
ual
Ann
ual
Ann
ual
Nin
thA
nnua
lA
nnua
lA
nnua
lA
nnua
lA
nnua
lPl
anPl
anPl
anPl
anPl
anPl
anPl
anPl
anPl
anPl
anPl
anPl
an19
97-2
002
1997
-98
1998
-99
1999
-200
020
00-2
001
2001
-200
219
97-2
002
1997
-98
1998
-99
1999
-200
020
00-0
120
01-2
002
(Act
ual)
(Act
ual)
(Act
ual)
(Act
ual)
(Act
ual)
(Act
ual)
(Act
ual)
(Act
ual)
(Act
ual)
(Act
ual)
(Act
ual)
(Act
ual)
1 2
34
56
78
910
1112
13
I.A
gric
ultu
ral &
alli
ed a
ctiv
ities
4246
2.0
5929
.376
98.2
7365
.475
76.9
8248
.34.
94.
65.
14.
64.
14.
4II
.R
ural
dev
elop
men
t74
686.
010
074.
310
985.
511
280.
598
52.4
1423
4.8
8.7
7.8
7.2
7.0
5.3
7.6
III.
Spe
cial
are
a pr
ogra
mm
es36
49.0
874.
011
83.8
1513
.910
45.5
919.
10.
40.
70.
80.
90.
60.
5IV
.Irr
igat
ion
and
flood
con
trol
5542
0.0
9905
.010
813.
714
209.
713
529.
114
552.
06.
57.
67.
18.
87.
37.
8V.
Ene
rgy
2223
75.0
3179
2.7
3557
2.4
3580
9.6
4089
3.4
3714
5.4
25.9
24.5
23.5
22.3
22.0
19.9
a.Po
wer
a19
396.
321
159.
021
327.
428
015.
425
180.
0a
14.9
14.0
13.3
15.1
13.5
b.P
etro
leum
a96
82.7
1121
3.6
9953
.298
67.2
8702
.1a
7.5
7.4
6.2
5.3
4.7
c.C
oal &
lign
itea
2212
.725
40.2
3719
.120
93.5
2106
.8a
1.7
1.7
2.3
1.1
1.1
d.N
on-c
onve
ntio
nal s
ourc
es o
f en
ergy
a50
1.0
659.
580
9.9
917.
311
56.5
a0.
40.
40.
50.
50.
6V
I.In
dust
ry a
nd m
iner
als
6514
8.0
1030
6.1
7978
.972
47.8
6866
.079
42.0
7.6
7.9
5.3
4.5
3.7
4.3
a.V
illag
e an
d sm
all s
cale
indu
strie
sa
1813
.917
76.7
1746
.690
9.5
1842
.0a
1.4
1.2
1.1
0.5
1.0
b.O
ther
indu
strie
sa
8492
.262
02.3
5501
.259
56.6
6100
.0a
6.5
4.1
3.4
3.2
3.3
VII.
Tran
spor
t11
9373
.018
101.
120
347.
023
462.
625
733.
829
918.
313
.913
.913
.414
.613
.916
.1a.
Rai
lway
sa
8239
.088
57.0
9057
.093
95.0
1017
7.0
a6.
35.
85.
65.
15.
5b.
Oth
ers
a98
62.1
1149
0.0
1440
5.6
1633
8.8
1974
1.3
a7.
67.
69.
08.
810
.6V
III.
Com
mun
icat
ions
4728
0.0
1013
1.5
1137
5.6
1403
8.6
3188
0.9
1808
3.0
5.5
7.8
7.5
8.7
17.2
9.7
IX.
Sci
ence
, te
chno
logy
& e
nviro
nmen
t18
458.
020
04.0
2442
.529
41.7
3248
.536
69.7
2.1
1.5
1.6
1.8
1.7
2.0
X.G
ener
al e
cono
mic
ser
vice
s14
580.
018
11.0
3071
.324
51.6
2537
.629
48.0
1.7
1.4
2.0
1.5
1.4
1.6
XI.
Soc
ial
serv
ices
1832
73.0
2686
7.1
3873
7.9
3843
9.4
4091
9.5
4647
4.0
21.3
20.7
25.6
23.9
22.0
24.9
a.E
duca
tion
a76
56.6
9684
.199
99.6
1169
0.5
1080
7.7
a5.
96.
46.
26.
35.
8b.
Med
ical
& p
ublic
hea
ltha
2641
.554
11.9
3568
.740
55.3
4408
.5a
2.0
3.6
2.2
2.2
2.4
c.Fa
mily
wel
fare
a18
22.2
2342
.729
69.1
3200
.036
13.9
a1.
41.
51.
81.
71.
9d.
Hou
sing
a21
17.5
3143
.435
16.4
3588
.466
74.5
a1.
62.
12.
21.
93.
6e.
Urb
an d
evel
opm
ent
a29
44.4
2820
.628
23.2
3143
.152
60.1
a2.
31.
91.
81.
72.
8f.
Oth
er s
ocia
l ser
vice
sa
9685
.015
335.
115
562.
515
242.
215
709.
3a
7.5
10.1
9.7
8.2
8.4
XII.
Gen
eral
ser
vice
s12
496.
019
61.2
1373
.618
47.4
1653
.221
80.6
1.5
1.5
0.9
1.2
0.9
1.2
XIII
.To
tal (
I to
XII
)85
9200
.012
9757
.315
1580
.416
0608
.218
5736
.818
6315
.210
0.0
100.
010
0.0
100.
010
0.0
100.
0(a
)C
entra
l Pla
n48
9361
.070
861.
485
901.
487
297.
410
9119
.310
4403
.857
.054
.656
.754
.458
.756
.0(b
)S
tate
Pla
ns36
9839
.056
223.
962
786.
670
027.
072
428.
676
838.
743
.043
.341
.443
.639
.041
.2(c
)U
nion
Ter
ritor
y P
lans
na26
71.9
2892
.332
83.9
4188
.950
72.7
na2.
12.
02.
02.
32.
7
Sou
rce
: Pla
nnin
g C
omm
issi
on.
na :
Not
ava
ilabl
ea
:N
inth
Pla
n al
loca
tions
wer
e m
ade
broa
d se
ctor
-wis
e.N
otes
:1.
Figu
res
may
not
add
upt
o to
tal b
ecau
se o
f rou
ndin
g.2.
For 1
999-
2000
, ant
icip
ated
exp
endi
ture
has
bee
n ta
ken
into
acc
ount
for C
entre
, for
som
e of
the
sub-
head
s in
clud
ed in
oth
er s
ocia
l ser
vice
s an
d ge
nera
l ser
vice
as
actu
al e
xpen
ditu
re fi
gure
s ar
e no
tav
aila
ble.
3.Fo
r 20
00-0
1 an
ticip
ated
exp
endi
ture
has
bee
n ta
ken
into
acc
ount
for
Cen
tre fo
r so
me
of h
eads
like
soc
ial s
ervi
ces,
indu
stry
& m
iner
als,
gen
eral
eco
nom
ic s
ervi
ces
and
Gen
eral
ser
vice
s.4.
For
actu
al e
xpen
ditu
re A
nnua
l Pla
n 20
01-0
2, th
e R
evis
ed E
stim
ate
have
bee
n ta
ken
into
acc
ount
for
Cen
tral S
ecto
r fo
r so
me
of th
e su
b-he
ads
incl
uded
in a
gric
ultu
re a
nd s
ocia
l ser
vice
s an
dot
hers
, as
actu
al e
xpen
ditu
re fi
gure
s ar
e no
t ava
ilabl
e.5.
The
Nin
th P
lan
figur
es a
re a
t 199
6-97
pric
es a
nd th
e A
nnua
l Pla
n fig
ures
are
at c
urre
nt p
rices
.6.
Stat
e P
lan
figur
es fo
r th
e N
inth
Pla
n (1
997-
2002
) in
clud
e al
loca
tion
for
Uni
on T
errit
ory
Pla
ns a
lso.
http://indiabudget.nic.in
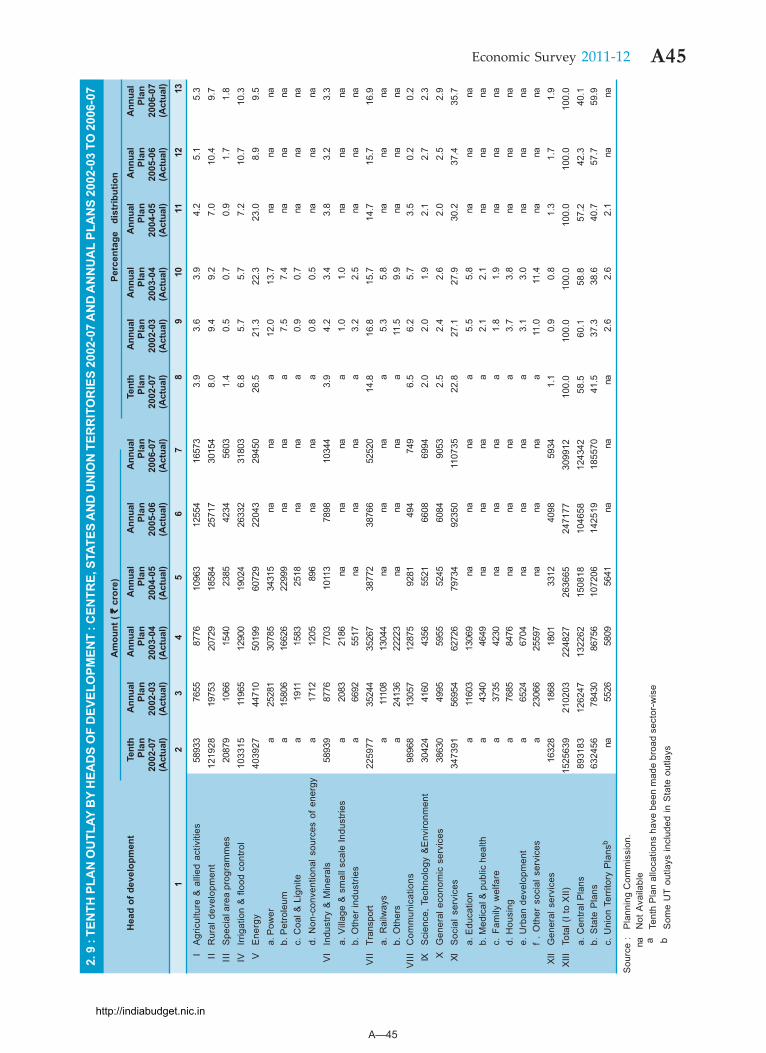
A—45
A45Economic Survey 2011-12
2. 9
: TE
NTH
PLA
N O
UTL
AY B
Y H
EAD
S O
F D
EVEL
OPM
ENT
: CEN
TRE,
STA
TES
AN
D U
NIO
N T
ERR
ITO
RIE
S 20
02-0
7 A
ND
AN
NU
AL
PLA
NS
2002
-03
TO 2
006-
07
Am
ount
( `̀̀̀̀
cror
e)Pe
rcen
tage
di
strib
utio
nH
ead
of d
evel
opm
ent
Tent
hA
nnua
lA
nnua
lA
nnua
lA
nnua
lA
nnua
lTe
nth
Ann
ual
Ann
ual
Ann
ual
Ann
ual
Ann
ual
Plan
Plan
Plan
Plan
Plan
Plan
Plan
Plan
Plan
Plan
Plan
Plan
2002
-07
2002
-03
2003
-04
2004
-05
2005
-06
2006
-07
2002
-07
2002
-03
2003
-04
2004
-05
2005
-06
2006
-07
(Act
ual)
(Act
ual)
(Act
ual)
(Act
ual)
(Act
ual)
(Act
ual)
(Act
ual)
(Act
ual)
(Act
ual)
(Act
ual)
(Act
ual)
(Act
ual)
1 2
34
56
78
910
1112
13
IA
gric
ultu
re &
alli
ed a
ctiv
ities
5893
376
5587
7610
963
1255
416
573
3.9
3.6
3.9
4.2
5.1
5.3
IIR
ural
dev
elop
men
t12
1928
1975
320
729
1858
425
717
3015
48.
09.
49.
27.
010
.49.
7II
IS
peci
al a
rea
prog
ram
mes
2087
910
6615
4023
8542
3456
031.
40.
50.
70.
91.
71.
8IV
Irrig
atio
n &
floo
d co
ntro
l10
3315
1196
512
900
1902
426
332
3180
36.
85.
75.
77.
210
.710
.3V
Ene
rgy
4039
2744
710
5019
960
729
2204
329
450
26.5
21.3
22.3
23.0
8.9
9.5
a. P
ower
a25
281
3078
534
315
nana
a12
.013
.7na
nana
b. P
etro
leum
a15
806
1662
622
999
nana
a7.
57.
4na
nana
c. C
oal &
Lig
nite
a19
1115
8325
18na
naa
0.9
0.7
nana
nad.
Non
-con
vent
iona
l sou
rces
of
ener
gya
1712
1205
896
nana
a0.
80.
5na
nana
VI
Indu
stry
& M
iner
als
5893
987
7677
0310
113
7898
1034
43.
94.
23.
43.
83.
23.
3a.
Vill
age
& s
mal
l sca
le In
dust
ries
a20
8321
86na
nana
a1.
01.
0na
nana
b. O
ther
indu
strie
sa
6692
5517
nana
naa
3.2
2.5
nana
naV
IITr
ansp
ort
2259
7735
244
3526
738
772
3876
652
520
14.8
16.8
15.7
14.7
15.7
16.9
a. R
ailw
ays
a11
108
1304
4na
nana
a5.
35.
8na
nana
b. O
ther
sa
2413
622
223
nana
naa
11.5
9.9
nana
naV
IIIC
omm
unic
atio
ns98
968
1305
712
875
9281
494
749
6.5
6.2
5.7
3.5
0.2
0.2
IXS
cien
ce, T
echn
olog
y &
Env
ironm
ent
3042
441
6043
5655
2166
0869
942.
02.
01.
92.
12.
72.
3X
Gen
eral
eco
nom
ic s
ervi
ces
3863
049
9559
5552
4560
8490
532.
52.
42.
62.
02.
52.
9XI
Soc
ial
serv
ices
3473
9156
954
6272
679
734
9235
011
0735
22.8
27.1
27.9
30.2
37.4
35.7
a. E
duca
tion
a11
603
1306
9na
nana
a5.
55.
8na
nana
b. M
edic
al &
pub
lic h
ealth
a43
4046
49na
nana
a2.
12.
1na
nana
c. F
amily
wel
fare
a37
3542
30na
nana
a1.
81.
9na
nana
d. H
ousi
nga
7685
8476
nana
naa
3.7
3.8
nana
nae.
Urb
an d
evel
opm
ent
a65
2467
04na
nana
a3.
13.
0na
nana
f .
Oth
er s
ocia
l ser
vice
sa
2306
625
597
nana
naa
11.0
11.4
nana
naXI
IG
ener
al s
ervi
ces
1632
818
6818
0133
1240
9859
341.
10.
90.
81.
31.
71.
9XI
IITo
tal (
I to
XII)
1525
639
2102
0322
4827
2636
6524
7177
3099
1210
0.0
100.
010
0.0
100.
010
0.0
100.
0a.
Cen
tral P
lans
8931
8312
6247
1322
6215
0818
1046
5812
4342
58.5
60.1
58.8
57.2
42.3
40.1
b. S
tate
Pla
ns63
2456
7843
086
756
1072
0614
2519
1855
7041
.537
.338
.640
.757
.759
.9c.
Uni
on T
errit
ory
Pla
nsb
na55
2658
0956
41na
nana
2.6
2.6
2.1
nana
Sou
rce
:P
lann
ing
Com
mis
sion
.na
Not
Ava
ilabl
ea
Tent
h P
lan
allo
catio
ns h
ave
been
mad
e br
oad
sect
or-w
ise
bS
ome
UT
outla
ys in
clud
ed in
Sta
te o
utla
ys
http://indiabudget.nic.in
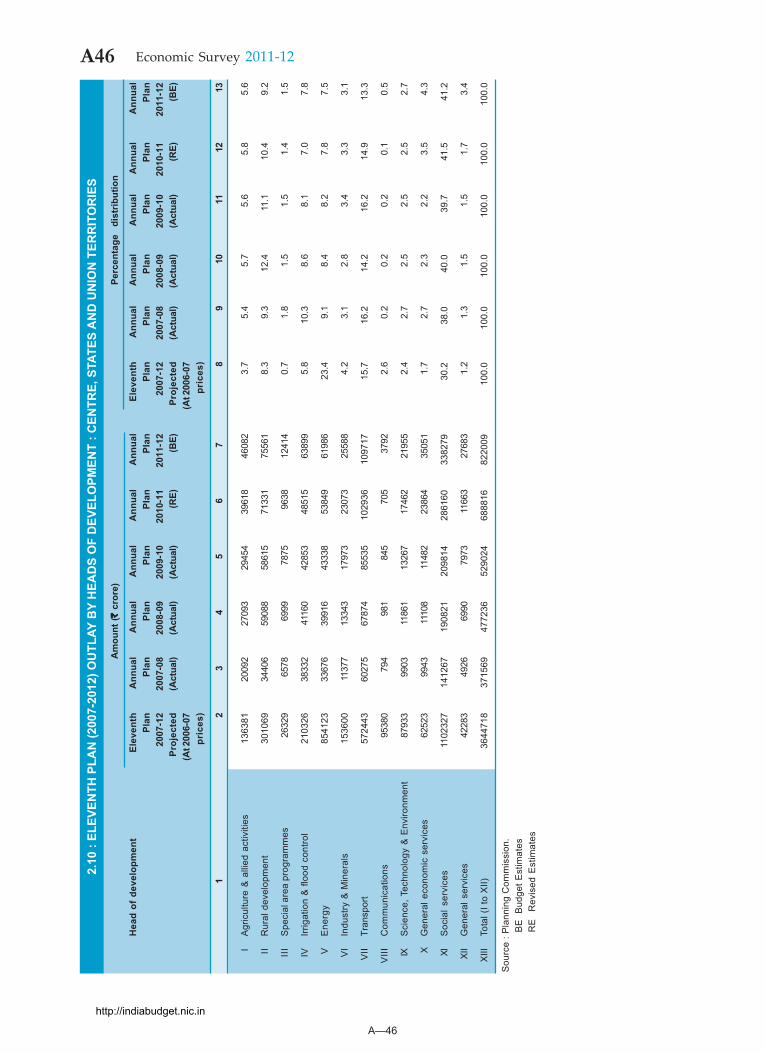
A—46
A46 Economic Survey 2011-12
2.10
: EL
EVEN
TH P
LAN
(200
7-20
12) O
UTL
AY B
Y H
EAD
S O
F D
EVEL
OPM
ENT
: CEN
TRE,
STA
TES
AN
D U
NIO
N T
ERR
ITO
RIE
S
Am
ount
( `̀̀̀̀ c
rore
)Pe
rcen
tage
di
strib
utio
n
Hea
d of
dev
elop
men
tEl
even
thA
nnua
lA
nnua
lA
nnua
lA
nnua
lA
nnua
lEl
even
thA
nnua
lA
nnua
lA
nnua
lA
nnua
lA
nnua
lPl
anPl
anPl
anPl
anPl
anPl
anPl
anPl
anPl
anPl
anPl
anPl
an20
07-1
220
07-0
820
08-0
920
09-1
020
10-1
120
11-1
220
07-1
220
07-0
820
08-0
920
09-1
020
10-1
120
11-1
2Pr
ojec
ted
(Act
ual)
(Act
ual)
(Act
ual)
(RE)
(BE)
Proj
ecte
d(A
ctua
l)(A
ctua
l)(A
ctua
l)(R
E)(B
E)(A
t 200
6-07
(At 2
006-
07pr
ices
)pr
ices
)
12
34
56
78
910
1112
13
IA
gric
ultu
re &
alli
ed a
ctiv
ities
1363
8120
092
2709
329
454
3961
846
082
3.7
5.4
5.7
5.6
5.8
5.6
IIR
ural
dev
elop
men
t30
1069
3440
659
088
5861
571
331
7556
18.
39.
312
.411
.110
.49.
2
III
Spe
cial
are
a pr
ogra
mm
es26
329
6578
6999
7875
9638
1241
40.
71.
81.
51.
51.
41.
5
IVIrr
igat
ion
& fl
ood
cont
rol
2103
2638
332
4116
042
853
4851
563
899
5.8
10.3
8.6
8.1
7.0
7.8
VE
nerg
y85
4123
3367
639
916
4333
853
849
6198
623
.49.
18.
48.
27.
87.
5
VI
Indu
stry
& M
iner
als
1536
0011
377
1334
317
973
2307
325
588
4.2
3.1
2.8
3.4
3.3
3.1
VII
Tran
spor
t57
2443
6027
567
874
8553
510
2936
1097
1715
.716
.214
.216
.214
.913
.3
VIII
Com
mun
icat
ions
9538
079
498
184
570
537
922.
60.
20.
20.
20.
10.
5
IXS
cien
ce, T
echn
olog
y &
Env
ironm
ent
8793
399
0311
861
1326
717
462
2195
52.
42.
72.
52.
52.
52.
7
XG
ener
al e
cono
mic
ser
vice
s62
523
9943
1110
811
482
2386
435
051
1.7
2.7
2.3
2.2
3.5
4.3
XIS
ocia
l se
rvic
es11
0232
714
1267
1908
2120
9814
2861
6033
8279
30.2
38.0
40.0
39.7
41.5
41.2
XII
Gen
eral
ser
vice
s42
283
4926
6990
7973
1166
327
683
1.2
1.3
1.5
1.5
1.7
3.4
XIII
Tota
l (I t
o X
II)36
4471
837
1569
4772
3652
9024
6888
1682
2009
100.
010
0.0
100.
010
0.0
100.
010
0.0
Sou
rce
: Pla
nnin
g C
omm
issi
on.
BE
Bud
get E
stim
ates
RE
R
evis
ed E
stim
ates
http://indiabudget.nic.in
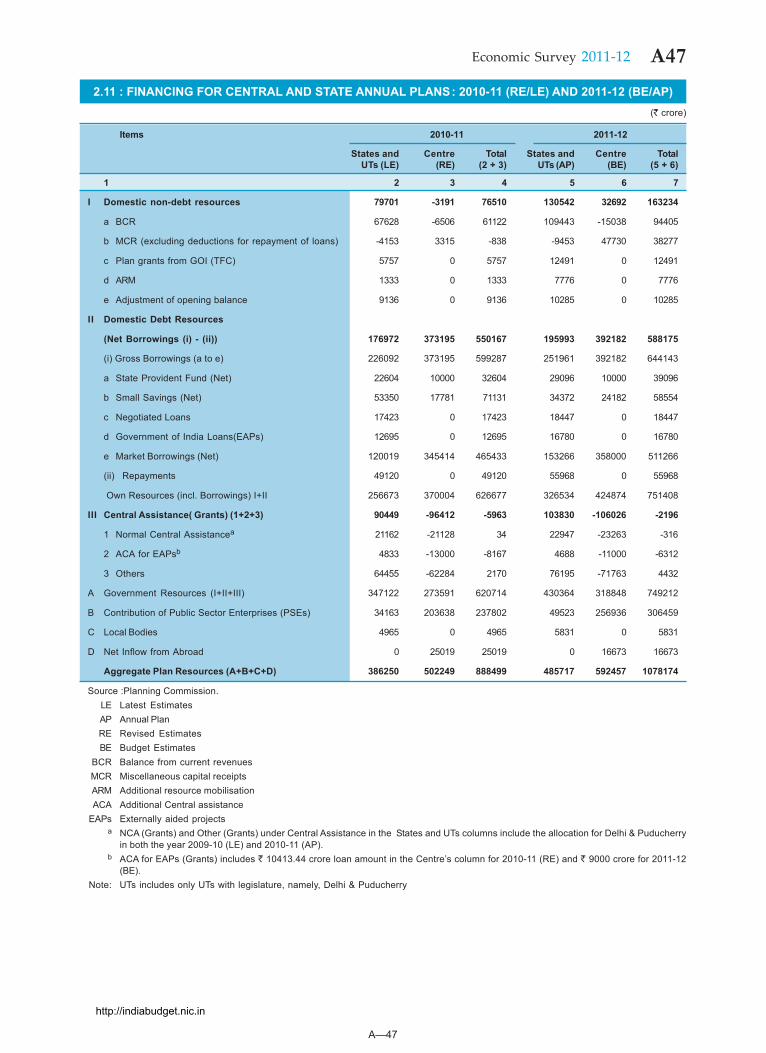
A—47
A47Economic Survey 2011-12
2.11 : FINANCING FOR CENTRAL AND STATE ANNUAL PLANS: 2010-11 (RE/LE) AND 2011-12 (BE/AP)(` crore)
Items 2010-11 2011-12
States and Centre Total States and Centre TotalUTs (LE) (RE) (2 + 3) UTs (AP) (BE) (5 + 6)
1 2 3 4 5 6 7
I Domestic non-debt resources 79701 -3191 76510 130542 32692 163234
a BCR 67628 -6506 61122 109443 -15038 94405
b MCR (excluding deductions for repayment of loans) -4153 3315 -838 -9453 47730 38277
c Plan grants from GOI (TFC) 5757 0 5757 12491 0 12491
d ARM 1333 0 1333 7776 0 7776
e Adjustment of opening balance 9136 0 9136 10285 0 10285
II Domestic Debt Resources
(Net Borrowings (i) - (ii)) 176972 373195 550167 195993 392182 588175
(i) Gross Borrowings (a to e) 226092 373195 599287 251961 392182 644143
a State Provident Fund (Net) 22604 10000 32604 29096 10000 39096
b Small Savings (Net) 53350 17781 71131 34372 24182 58554
c Negotiated Loans 17423 0 17423 18447 0 18447
d Government of India Loans(EAPs) 12695 0 12695 16780 0 16780
e Market Borrowings (Net) 120019 345414 465433 153266 358000 511266
(ii) Repayments 49120 0 49120 55968 0 55968
Own Resources (incl. Borrowings) I+II 256673 370004 626677 326534 424874 751408
III Central Assistance( Grants) (1+2+3) 90449 -96412 -5963 103830 -106026 -2196
1 Normal Central Assistancea 21162 -21128 34 22947 -23263 -316
2 ACA for EAPsb 4833 -13000 -8167 4688 -11000 -6312
3 Others 64455 -62284 2170 76195 -71763 4432
A Government Resources (I+II+III) 347122 273591 620714 430364 318848 749212
B Contribution of Public Sector Enterprises (PSEs) 34163 203638 237802 49523 256936 306459
C Local Bodies 4965 0 4965 5831 0 5831
D Net Inflow from Abroad 0 25019 25019 0 16673 16673
Aggregate Plan Resources (A+B+C+D) 386250 502249 888499 485717 592457 1078174
Source :Planning Commission.LE Latest EstimatesAP Annual PlanRE Revised EstimatesBE Budget Estimates
BCR Balance from current revenuesMCR Miscellaneous capital receiptsARM Additional resource mobilisationACA Additional Central assistance
EAPs Externally aided projectsa NCA (Grants) and Other (Grants) under Central Assistance in the States and UTs columns include the allocation for Delhi & Puducherry
in both the year 2009-10 (LE) and 2010-11 (AP).b ACA for EAPs (Grants) includes ` 10413.44 crore loan amount in the Centre’s column for 2010-11 (RE) and ` 9000 crore for 2011-12
(BE).Note: UTs includes only UTs with legislature, namely, Delhi & Puducherry
http://indiabudget.nic.in
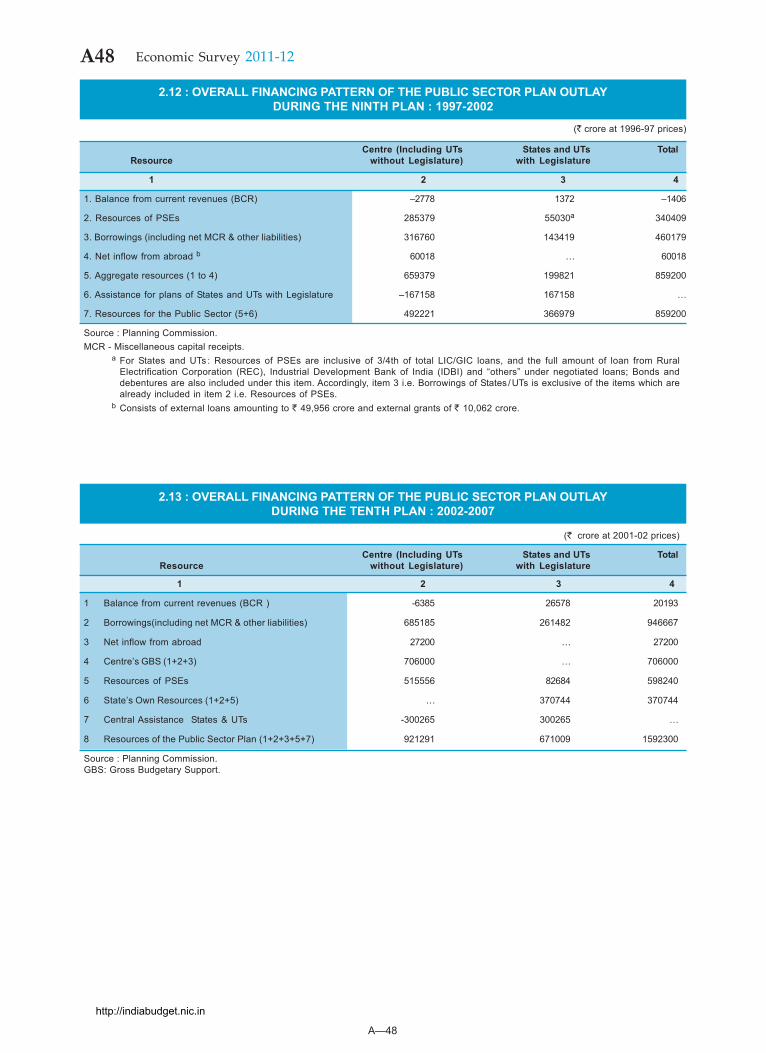
A—48
A48 Economic Survey 2011-12
2.13 : OVERALL FINANCING PATTERN OF THE PUBLIC SECTOR PLAN OUTLAYDURING THE TENTH PLAN : 2002-2007
(` crore at 2001-02 prices)
Centre (Including UTs States and UTs TotalResource without Legislature) with Legislature
1 2 3 4
1 Balance from current revenues (BCR ) -6385 26578 20193
2 Borrowings(including net MCR & other liabilities) 685185 261482 946667
3 Net inflow from abroad 27200 … 27200
4 Centre’s GBS (1+2+3) 706000 … 706000
5 Resources of PSEs 515556 82684 598240
6 State’s Own Resources (1+2+5) … 370744 370744
7 Central Assistance States & UTs -300265 300265 …
8 Resources of the Public Sector Plan (1+2+3+5+7) 921291 671009 1592300
Source : Planning Commission.GBS: Gross Budgetary Support.
2.12 : OVERALL FINANCING PATTERN OF THE PUBLIC SECTOR PLAN OUTLAYDURING THE NINTH PLAN : 1997-2002
(` crore at 1996-97 prices)
Centre (Including UTs States and UTs TotalResource without Legislature) with Legislature
1 2 3 4
1. Balance from current revenues (BCR) –2778 1372 –1406
2. Resources of PSEs 285379 55030a 340409
3. Borrowings (including net MCR & other liabilities) 316760 143419 460179
4. Net inflow from abroad b 60018 … 60018
5. Aggregate resources (1 to 4) 659379 199821 859200
6. Assistance for plans of States and UTs with Legislature –167158 167158 …
7. Resources for the Public Sector (5+6) 492221 366979 859200
Source : Planning Commission.MCR - Miscellaneous capital receipts.
a For States and UTs : Resources of PSEs are inclusive of 3/4th of total LIC/GIC loans, and the full amount of loan from RuralElectrification Corporation (REC), Industrial Development Bank of India (IDBI) and “others” under negotiated loans; Bonds anddebentures are also included under this item. Accordingly, item 3 i.e. Borrowings of States /UTs is exclusive of the items which arealready included in item 2 i.e. Resources of PSEs.
b Consists of external loans amounting to ` 49,956 crore and external grants of ` 10,062 crore.
http://indiabudget.nic.in
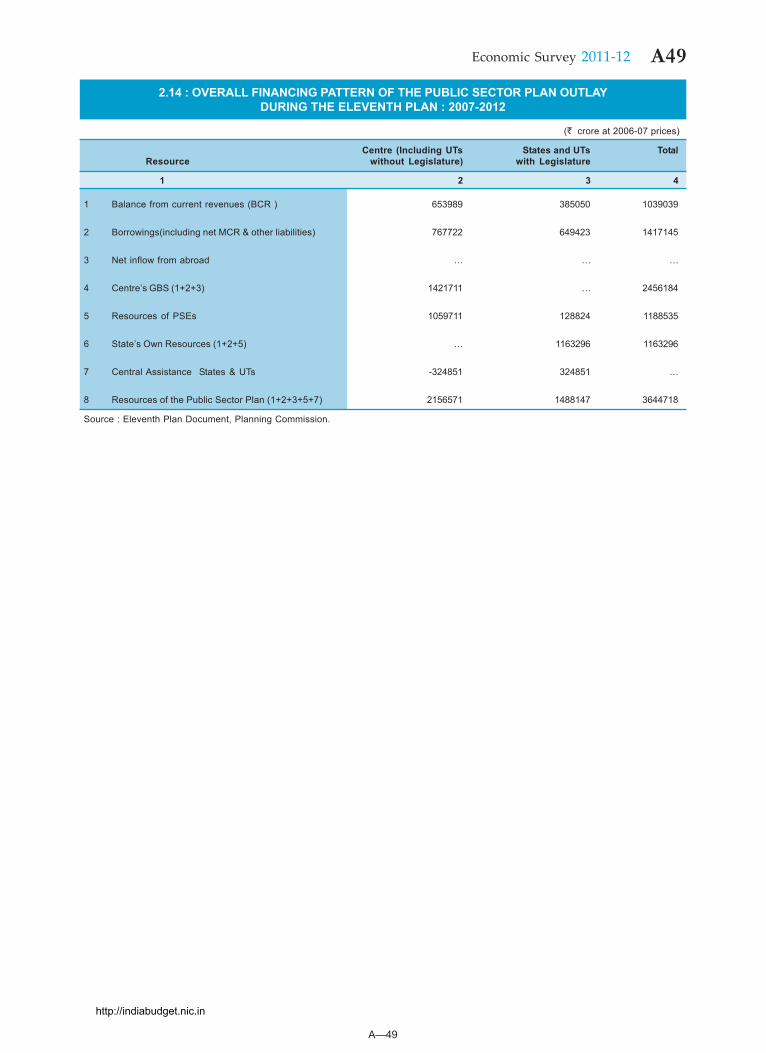
A—49
A49Economic Survey 2011-12
2.14 : OVERALL FINANCING PATTERN OF THE PUBLIC SECTOR PLAN OUTLAYDURING THE ELEVENTH PLAN : 2007-2012
(` crore at 2006-07 prices)
Centre (Including UTs States and UTs TotalResource without Legislature) with Legislature
1 2 3 4
1 Balance from current revenues (BCR ) 653989 385050 1039039
2 Borrowings(including net MCR & other liabilities) 767722 649423 1417145
3 Net inflow from abroad … … …
4 Centre’s GBS (1+2+3) 1421711 … 2456184
5 Resources of PSEs 1059711 128824 1188535
6 State’s Own Resources (1+2+5) … 1163296 1163296
7 Central Assistance States & UTs -324851 324851 …
8 Resources of the Public Sector Plan (1+2+3+5+7) 2156571 1488147 3644718
Source : Eleventh Plan Document, Planning Commission.
http://indiabudget.nic.in
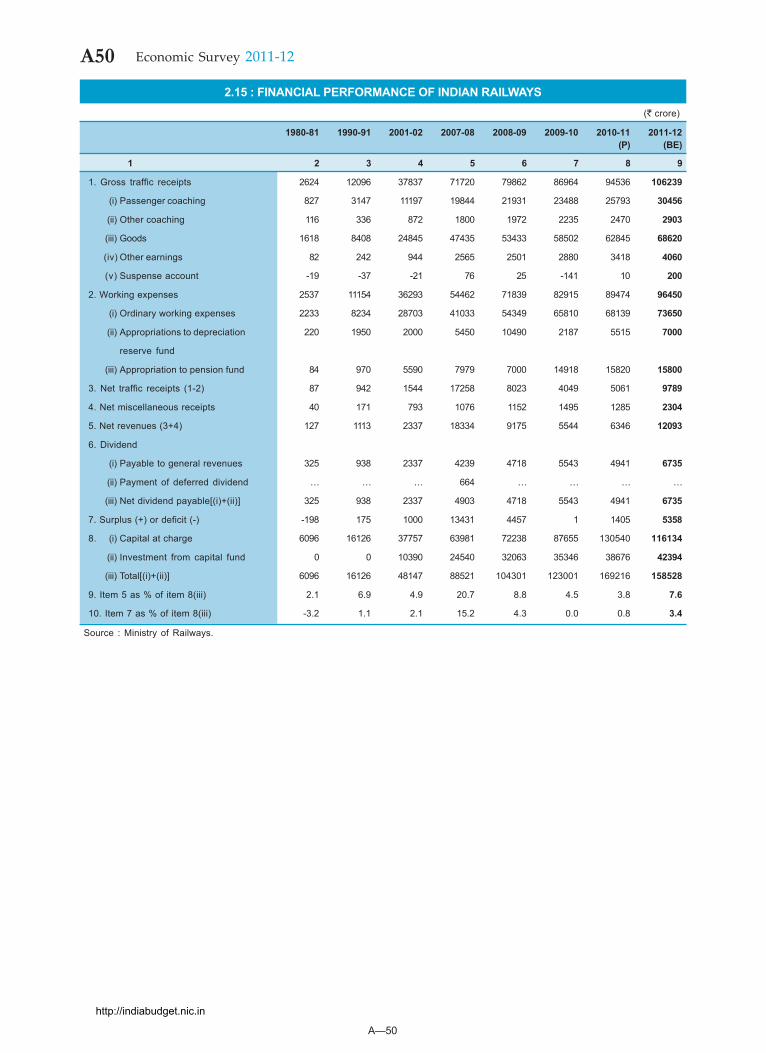
A—50
A50 Economic Survey 2011-12
2.15 : FINANCIAL PERFORMANCE OF INDIAN RAILWAYS(` crore)
1980-81 1990-91 2001-02 2007-08 2008-09 2009-10 2010-11 2011-12(P) (BE)
1 2 3 4 5 6 7 8 9
1. Gross traffic receipts 2624 12096 37837 71720 79862 86964 94536 106239
(i) Passenger coaching 827 3147 11197 19844 21931 23488 25793 30456
(ii) Other coaching 116 336 872 1800 1972 2235 2470 2903
(iii) Goods 1618 8408 24845 47435 53433 58502 62845 68620
(iv) Other earnings 82 242 944 2565 2501 2880 3418 4060
(v) Suspense account -19 -37 -21 76 25 -141 10 200
2. Working expenses 2537 11154 36293 54462 71839 82915 89474 96450
(i) Ordinary working expenses 2233 8234 28703 41033 54349 65810 68139 73650
(ii) Appropriations to depreciation 220 1950 2000 5450 10490 2187 5515 7000
reserve fund
(iii) Appropriation to pension fund 84 970 5590 7979 7000 14918 15820 15800
3. Net traffic receipts (1-2) 87 942 1544 17258 8023 4049 5061 9789
4. Net miscellaneous receipts 40 171 793 1076 1152 1495 1285 2304
5. Net revenues (3+4) 127 1113 2337 18334 9175 5544 6346 12093
6. Dividend
(i) Payable to general revenues 325 938 2337 4239 4718 5543 4941 6735
(ii) Payment of deferred dividend … … … 664 … … … …
(iii) Net dividend payable[(i)+(ii)] 325 938 2337 4903 4718 5543 4941 6735
7. Surplus (+) or deficit (-) -198 175 1000 13431 4457 1 1405 5358
8. (i) Capital at charge 6096 16126 37757 63981 72238 87655 130540 116134
(ii) Investment from capital fund 0 0 10390 24540 32063 35346 38676 42394
(iii) Total[(i)+(ii)] 6096 16126 48147 88521 104301 123001 169216 158528
9. Item 5 as % of item 8(iii) 2.1 6.9 4.9 20.7 8.8 4.5 3.8 7.6
10. Item 7 as % of item 8(iii) -3.2 1.1 2.1 15.2 4.3 0.0 0.8 3.4
Source : Ministry of Railways.
http://indiabudget.nic.in
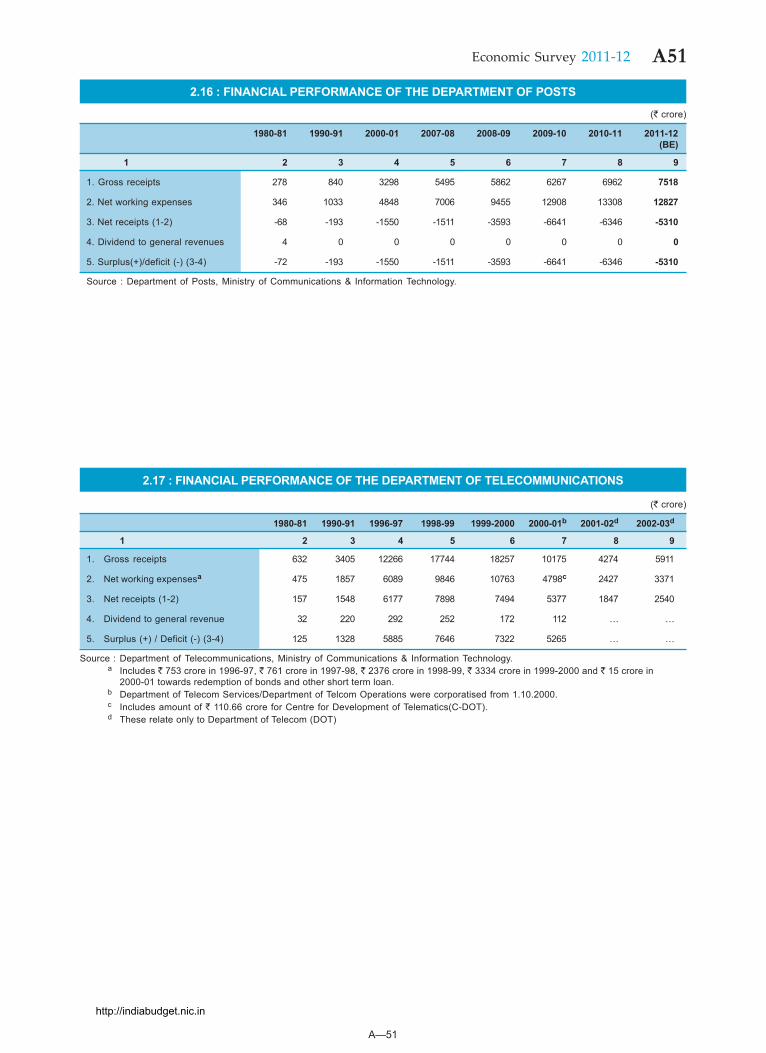
A—51
A51Economic Survey 2011-12
2.16 : FINANCIAL PERFORMANCE OF THE DEPARTMENT OF POSTS
(` crore)
1980-81 1990-91 2000-01 2007-08 2008-09 2009-10 2010-11 2011-12(BE)
1 2 3 4 5 6 7 8 9
1. Gross receipts 278 840 3298 5495 5862 6267 6962 7518
2. Net working expenses 346 1033 4848 7006 9455 12908 13308 12827
3. Net receipts (1-2) -68 -193 -1550 -1511 -3593 -6641 -6346 -5310
4. Dividend to general revenues 4 0 0 0 0 0 0 0
5. Surplus(+)/deficit (-) (3-4) -72 -193 -1550 -1511 -3593 -6641 -6346 -5310
Source : Department of Posts, Ministry of Communications & Information Technology.
2.17 : FINANCIAL PERFORMANCE OF THE DEPARTMENT OF TELECOMMUNICATIONS
(` crore)
1980-81 1990-91 1996-97 1998-99 1999-2000 2000-01b 2001-02d 2002-03d
1 2 3 4 5 6 7 8 9
1. Gross receipts 632 3405 12266 17744 18257 10175 4274 5911
2. Net working expensesa 475 1857 6089 9846 10763 4798c 2427 3371
3. Net receipts (1-2) 157 1548 6177 7898 7494 5377 1847 2540
4. Dividend to general revenue 32 220 292 252 172 112 … …
5. Surplus (+) / Deficit (-) (3-4) 125 1328 5885 7646 7322 5265 … …
Source : Department of Telecommunications, Ministry of Communications & Information Technology.a Includes ` 753 crore in 1996-97, ` 761 crore in 1997-98, ` 2376 crore in 1998-99, ` 3334 crore in 1999-2000 and ` 15 crore in
2000-01 towards redemption of bonds and other short term loan.b Department of Telecom Services/Department of Telcom Operations were corporatised from 1.10.2000.c Includes amount of ` 110.66 crore for Centre for Development of Telematics(C-DOT).d These relate only to Department of Telecom (DOT)
http://indiabudget.nic.in
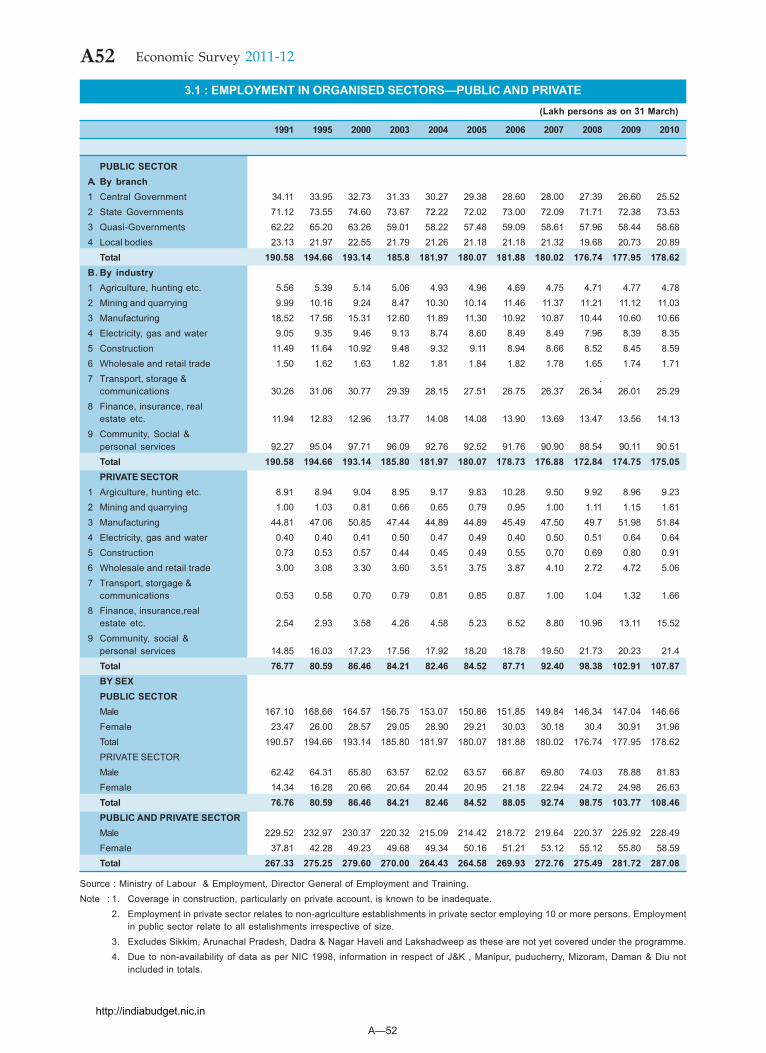
A—52
A52 Economic Survey 2011-12
3.1 : EMPLOYMENT IN ORGANISED SECTORS—PUBLIC AND PRIVATE(Lakh persons as on 31 March)
1991 1995 2000 2003 2004 2005 2006 2007 2008 2009 2010
1 2 3 4 5 6 7 8 9 10 11 12
PUBLIC SECTORA. By branch1 Central Government 34.11 33.95 32.73 31.33 30.27 29.38 28.60 28.00 27.39 26.60 25.522 State Governments 71.12 73.55 74.60 73.67 72.22 72.02 73.00 72.09 71.71 72.38 73.533 Quasi-Governments 62.22 65.20 63.26 59.01 58.22 57.48 59.09 58.61 57.96 58.44 58.684 Local bodies 23.13 21.97 22.55 21.79 21.26 21.18 21.18 21.32 19.68 20.73 20.89
Total 190.58 194.66 193.14 185.8 181.97 180.07 181.88 180.02 176.74 177.95 178.62B. By industry1 Agriculture, hunting etc. 5.56 5.39 5.14 5.06 4.93 4.96 4.69 4.75 4.71 4.77 4.782 Mining and quarrying 9.99 10.16 9.24 8.47 10.30 10.14 11.46 11.37 11.21 11.12 11.033 Manufacturing 18.52 17.56 15.31 12.60 11.89 11.30 10.92 10.87 10.44 10.60 10.664 Electricity, gas and water 9.05 9.35 9.46 9.13 8.74 8.60 8.49 8.49 7.96 8.39 8.355 Construction 11.49 11.64 10.92 9.48 9.32 9.11 8.94 8.66 8.52 8.45 8.596 Wholesale and retail trade 1.50 1.62 1.63 1.82 1.81 1.84 1.82 1.78 1.65 1.74 1.717 Transport, storage & .
communications 30.26 31.06 30.77 29.39 28.15 27.51 26.75 26.37 26.34 26.01 25.298 Finance, insurance, real
estate etc. 11.94 12.83 12.96 13.77 14.08 14.08 13.90 13.69 13.47 13.56 14.139 Community, Social &
personal services 92.27 95.04 97.71 96.09 92.76 92.52 91.76 90.90 88.54 90.11 90.51Total 190.58 194.66 193.14 185.80 181.97 180.07 178.73 176.88 172.84 174.75 175.05PRIVATE SECTOR
1 Argiculture, hunting etc. 8.91 8.94 9.04 8.95 9.17 9.83 10.28 9.50 9.92 8.96 9.232 Mining and quarrying 1.00 1.03 0.81 0.66 0.65 0.79 0.95 1.00 1.11 1.15 1.613 Manufacturing 44.81 47.06 50.85 47.44 44.89 44.89 45.49 47.50 49.7 51.98 51.844 Electricity, gas and water 0.40 0.40 0.41 0.50 0.47 0.49 0.40 0.50 0.51 0.64 0.645 Construction 0.73 0.53 0.57 0.44 0.45 0.49 0.55 0.70 0.69 0.80 0.916 Wholesale and retail trade 3.00 3.08 3.30 3.60 3.51 3.75 3.87 4.10 2.72 4.72 5.067 Transport, storgage &
communications 0.53 0.58 0.70 0.79 0.81 0.85 0.87 1.00 1.04 1.32 1.668 Finance, insurance,real
estate etc. 2.54 2.93 3.58 4.26 4.58 5.23 6.52 8.80 10.96 13.11 15.529 Community, social &
personal services 14.85 16.03 17.23 17.56 17.92 18.20 18.78 19.50 21.73 20.23 21.4Total 76.77 80.59 86.46 84.21 82.46 84.52 87.71 92.40 98.38 102.91 107.87BY SEXPUBLIC SECTORMale 167.10 168.66 164.57 156.75 153.07 150.86 151.85 149.84 146.34 147.04 146.66Female 23.47 26.00 28.57 29.05 28.90 29.21 30.03 30.18 30.4 30.91 31.96Total 190.57 194.66 193.14 185.80 181.97 180.07 181.88 180.02 176.74 177.95 178.62PRIVATE SECTORMale 62.42 64.31 65.80 63.57 62.02 63.57 66.87 69.80 74.03 78.88 81.83Female 14.34 16.28 20.66 20.64 20.44 20.95 21.18 22.94 24.72 24.98 26.63Total 76.76 80.59 86.46 84.21 82.46 84.52 88.05 92.74 98.75 103.77 108.46PUBLIC AND PRIVATE SECTORMale 229.52 232.97 230.37 220.32 215.09 214.42 218.72 219.64 220.37 225.92 228.49Female 37.81 42.28 49.23 49.68 49.34 50.16 51.21 53.12 55.12 55.80 58.59Total 267.33 275.25 279.60 270.00 264.43 264.58 269.93 272.76 275.49 281.72 287.08
Source : Ministry of Labour & Employment, Director General of Employment and Training.Note : 1. Coverage in construction, particularly on private account, is known to be inadequate.
2. Employment in private sector relates to non-agriculture establishments in private sector employing 10 or more persons. Employmentin public sector relate to all estalishments irrespective of size.
3. Excludes Sikkim, Arunachal Pradesh, Dadra & Nagar Haveli and Lakshadweep as these are not yet covered under the programme.4. Due to non-availability of data as per NIC 1998, information in respect of J&K , Manipur, puducherry, Mizoram, Daman & Diu not
included in totals.
http://indiabudget.nic.in
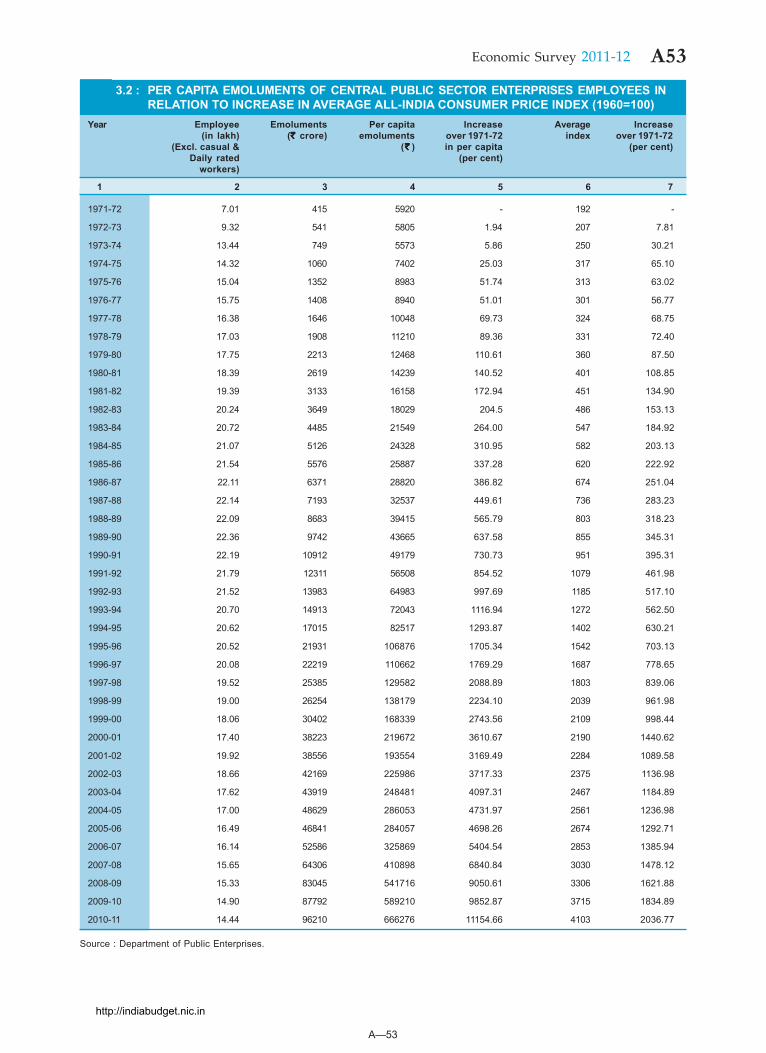
A—53
A53Economic Survey 2011-12
3.2 : PER CAPITA EMOLUMENTS OF CENTRAL PUBLIC SECTOR ENTERPRISES EMPLOYEES INRELATION TO INCREASE IN AVERAGE ALL-INDIA CONSUMER PRICE INDEX (1960=100)
Year Employee Emoluments Per capita Increase Average Increase(in lakh) ( `̀̀̀̀ crore) emoluments over 1971-72 index over 1971-72
(Excl. casual & ( `̀̀̀̀ ) in per capita (per cent)Daily rated (per cent)
workers)
1 2 3 4 5 6 7
1971-72 7.01 415 5920 - 192 -
1972-73 9.32 541 5805 1.94 207 7.81
1973-74 13.44 749 5573 5.86 250 30.21
1974-75 14.32 1060 7402 25.03 317 65.10
1975-76 15.04 1352 8983 51.74 313 63.02
1976-77 15.75 1408 8940 51.01 301 56.77
1977-78 16.38 1646 10048 69.73 324 68.75
1978-79 17.03 1908 11210 89.36 331 72.40
1979-80 17.75 2213 12468 110.61 360 87.50
1980-81 18.39 2619 14239 140.52 401 108.85
1981-82 19.39 3133 16158 172.94 451 134.90
1982-83 20.24 3649 18029 204.5 486 153.13
1983-84 20.72 4485 21549 264.00 547 184.92
1984-85 21.07 5126 24328 310.95 582 203.13
1985-86 21.54 5576 25887 337.28 620 222.92
1986-87 22.11 6371 28820 386.82 674 251.04
1987-88 22.14 7193 32537 449.61 736 283.23
1988-89 22.09 8683 39415 565.79 803 318.23
1989-90 22.36 9742 43665 637.58 855 345.31
1990-91 22.19 10912 49179 730.73 951 395.31
1991-92 21.79 12311 56508 854.52 1079 461.98
1992-93 21.52 13983 64983 997.69 1185 517.10
1993-94 20.70 14913 72043 1116.94 1272 562.50
1994-95 20.62 17015 82517 1293.87 1402 630.21
1995-96 20.52 21931 106876 1705.34 1542 703.13
1996-97 20.08 22219 110662 1769.29 1687 778.65
1997-98 19.52 25385 129582 2088.89 1803 839.06
1998-99 19.00 26254 138179 2234.10 2039 961.98
1999-00 18.06 30402 168339 2743.56 2109 998.44
2000-01 17.40 38223 219672 3610.67 2190 1440.62
2001-02 19.92 38556 193554 3169.49 2284 1089.58
2002-03 18.66 42169 225986 3717.33 2375 1136.98
2003-04 17.62 43919 248481 4097.31 2467 1184.89
2004-05 17.00 48629 286053 4731.97 2561 1236.98
2005-06 16.49 46841 284057 4698.26 2674 1292.71
2006-07 16.14 52586 325869 5404.54 2853 1385.94
2007-08 15.65 64306 410898 6840.84 3030 1478.12
2008-09 15.33 83045 541716 9050.61 3306 1621.88
2009-10 14.90 87792 589210 9852.87 3715 1834.89
2010-11 14.44 96210 666276 11154.66 4103 2036.77
Source : Department of Public Enterprises.
http://indiabudget.nic.in
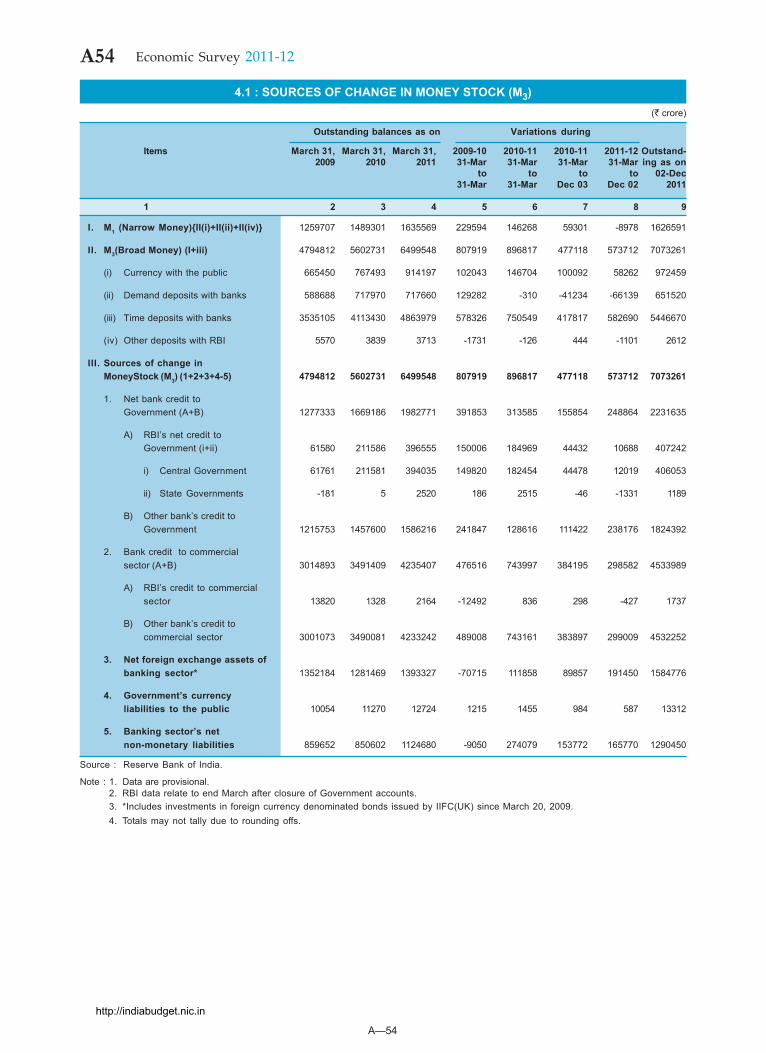
A—54
A54 Economic Survey 2011-12
4.1 : SOURCES OF CHANGE IN MONEY STOCK (M3)(` crore)
Outstanding balances as on Variations during
Items March 31, March 31, March 31, 2009-10 2010-11 2010-11 2011-12 Outstand-2009 2010 2011 31-Mar 31-Mar 31-Mar 31-Mar ing as on
to to to to 02-Dec31-Mar 31-Mar Dec 03 Dec 02 2011
1 2 3 4 5 6 7 8 9
I. M1 (Narrow Money){II(i)+II(ii)+II(iv)} 1259707 1489301 1635569 229594 146268 59301 -8978 1626591
II. M3(Broad Money) (I+iii) 4794812 5602731 6499548 807919 896817 477118 573712 7073261
(i) Currency with the public 665450 767493 914197 102043 146704 100092 58262 972459
(ii) Demand deposits with banks 588688 717970 717660 129282 -310 -41234 -66139 651520
(iii) Time deposits with banks 3535105 4113430 4863979 578326 750549 417817 582690 5446670
(iv) Other deposits with RBI 5570 3839 3713 -1731 -126 444 -1101 2612
III. Sources of change inMoneyStock (M3) (1+2+3+4-5) 4794812 5602731 6499548 807919 896817 477118 573712 7073261
1. Net bank credit toGovernment (A+B) 1277333 1669186 1982771 391853 313585 155854 248864 2231635
A) RBI’s net credit toGovernment (i+ii) 61580 211586 396555 150006 184969 44432 10688 407242
i) Central Government 61761 211581 394035 149820 182454 44478 12019 406053
ii) State Governments -181 5 2520 186 2515 -46 -1331 1189
B) Other bank’s credit toGovernment 1215753 1457600 1586216 241847 128616 111422 238176 1824392
2. Bank credit to commercialsector (A+B) 3014893 3491409 4235407 476516 743997 384195 298582 4533989
A) RBI’s credit to commercialsector 13820 1328 2164 -12492 836 298 -427 1737
B) Other bank’s credit tocommercial sector 3001073 3490081 4233242 489008 743161 383897 299009 4532252
3. Net foreign exchange assets ofbanking sector* 1352184 1281469 1393327 -70715 111858 89857 191450 1584776
4. Government’s currencyliabilities to the public 10054 11270 12724 1215 1455 984 587 13312
5. Banking sector’s netnon-monetary liabilities 859652 850602 1124680 -9050 274079 153772 165770 1290450
Source : Reserve Bank of India.
Note : 1. Data are provisional.2. RBI data relate to end March after closure of Government accounts.3. *Includes investments in foreign currency denominated bonds issued by IIFC(UK) since March 20, 2009.4. Totals may not tally due to rounding offs.
http://indiabudget.nic.in
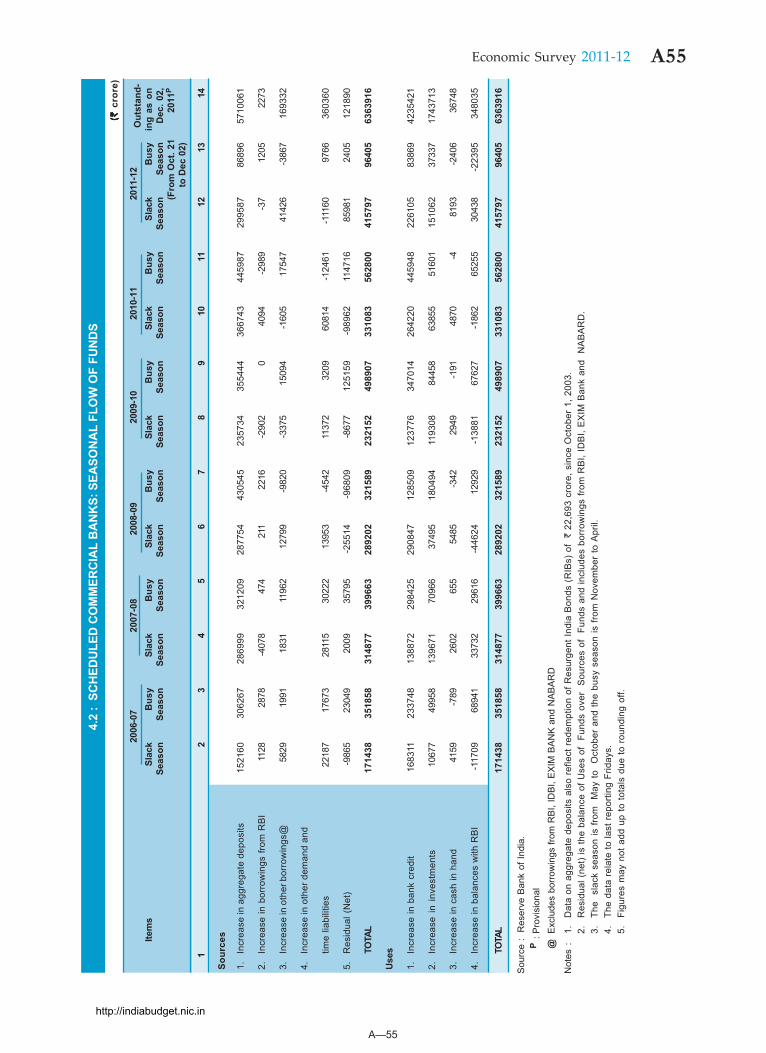
A—55
A55Economic Survey 2011-12
4.2
: SC
HED
ULE
D C
OM
MER
CIA
L B
AN
KS:
SEA
SON
AL
FLO
W O
F FU
ND
S(`(`(`(` (`
cro
re)
2006
-07
2007
-08
2008
-09
2009
-10
2010
-11
2011
-12
Out
stan
d-Ite
ms
Slac
kB
usy
Slac
kB
usy
Slac
kB
usy
Slac
kB
usy
Slac
kB
usy
Slac
kB
usy
ing
as o
nSe
ason
S
easo
n
Sea
son
S
easo
nSe
ason
Seas
onSe
ason
Seas
onSe
ason
Seas
onSe
ason
Seas
onD
ec. 0
2,(F
rom
Oct
. 21
2011
P
to D
ec 0
2)
12
34
56
78
910
1112
1314
Sour
ces
1.In
crea
se in
agg
rega
te d
epos
its15
2160
3062
6728
6999
3212
0928
7754
4305
4523
5734
3554
4436
6743
4459
8729
9587
8689
657
1006
1
2.In
crea
se in
bor
row
ings
from
RB
I11
2828
78-4
078
474
211
2216
-290
20
4094
-298
9-3
712
0522
73
3.In
crea
se in
oth
er b
orro
win
gs@
5829
1991
1831
1196
212
799
-982
0-3
375
1509
4-1
605
1754
741
426
-386
716
9332
4.In
crea
se in
oth
er d
eman
d an
d
time
liabi
litie
s22
187
1767
328
115
3022
213
953
-454
211
372
3209
6081
4-1
2461
-111
6097
6636
0360
5.R
esid
ual (
Net
)-9
865
2304
920
0935
795
-255
14-9
6809
-867
712
5159
-989
6211
4716
8598
124
0512
1890
TOTA
L17
1438
3518
5831
4877
3996
6328
9202
3215
8923
2152
4989
0733
1083
5628
0041
5797
9640
563
6391
6
Use
s
1.In
crea
se in
ban
k cr
edit
1683
1123
3748
1388
7229
8425
2908
4712
8509
1237
7634
7014
2642
2044
5948
2261
0583
869
4235
421
2.In
crea
se i
n in
vest
men
ts10
677
4995
813
9671
7096
637
495
1804
9411
9308
8445
863
855
5160
115
1062
3733
717
4371
3
3.In
crea
se in
cas
h in
han
d41
59-7
8926
0265
554
85-3
4229
49-1
9148
70-4
8193
-240
636
748
4.In
crea
se in
bal
ance
s w
ith R
BI
-117
0968
941
3373
229
616
-446
2412
929
-138
8167
627
-186
265
255
3043
8-2
2395
3480
35
TOTA
L17
1438
3518
5831
4877
3996
6328
9202
3215
8923
2152
4989
0733
1083
5628
0041
5797
9640
563
6391
6
Sou
rce
: R
eser
ve B
ank
of In
dia.
P :P
rovi
sion
al@
Exc
lude
s bo
rrow
ings
from
RB
I, ID
BI,
EX
IM B
AN
K a
nd N
AB
AR
D
Not
es :
1.D
ata
on a
ggre
gate
dep
osits
als
o re
flect
red
empt
ion
of R
esur
gent
Indi
a B
onds
(R
IBs)
of
` 22
,693
cro
re, s
ince
Oct
ober
1, 2
003.
2.R
esid
ual (
net)
is th
e ba
lanc
e of
Use
s of
Fu
nds
over
S
ourc
es o
f Fu
nds
and
incl
udes
bor
row
ings
from
RB
I, ID
BI,
EX
IM B
ank
and
NA
BA
RD
.3.
The
sla
ck s
easo
n is
from
M
ay to
O
ctob
er a
nd th
e bu
sy s
easo
n is
from
Nov
embe
r to
Apr
il.4.
The
data
rel
ate
to la
st r
epor
ting
Frid
ays.
5.Fi
gure
s m
ay n
ot a
dd u
p to
tota
ls d
ue to
rou
ndin
g of
f.
http://indiabudget.nic.in
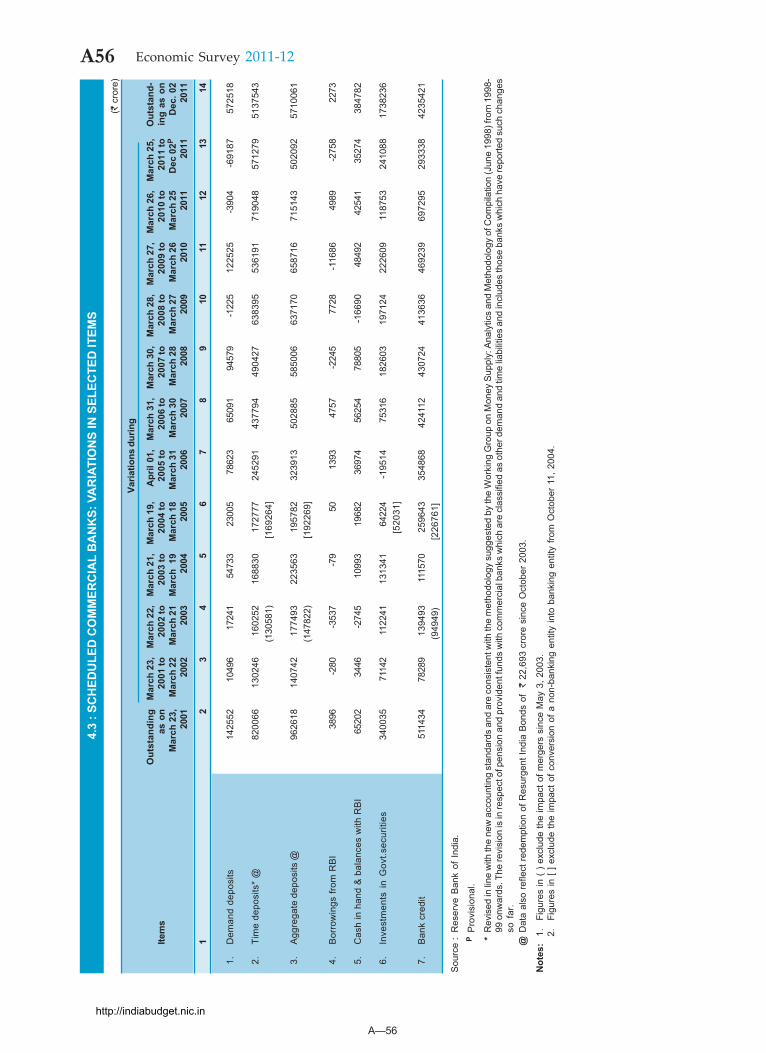
A—56
A56 Economic Survey 2011-12
4.3
: SC
HED
ULE
D C
OM
MER
CIA
L B
AN
KS:
VA
RIA
TIO
NS
IN S
ELEC
TED
ITEM
S
(` c
rore
)
Varia
tions
dur
ing
Out
stan
ding
Mar
ch 2
3,M
arch
22,
Mar
ch 2
1,M
arch
19,
Apr
il 01
,M
arch
31,
Mar
ch 3
0,M
arch
28,
Mar
ch 2
7,M
arch
26,
Mar
ch 2
5,O
utst
and-
Item
sas
on
2001
to20
02 to
2003
to20
04 to
2005
to20
06 to
2007
to20
08 to
2009
to20
10 to
2011
toin
g as
on
Mar
ch 2
3,M
arch
22
Mar
ch 2
1M
arch
19
Mar
ch 1
8M
arch
31
Mar
ch 3
0M
arch
28
Mar
ch 2
7M
arch
26
Mar
ch 2
5D
ec 0
2PD
ec. 0
220
0120
0220
0320
0420
0520
0620
0720
0820
0920
1020
1120
1120
11
12
34
56
78
910
1112
1314
1.D
eman
d de
posi
ts14
2552
1049
617
241
5473
323
005
7862
365
091
9457
9-1
225
1225
25-3
904
-691
8757
2518
2.Ti
me
depo
sits
* @
8200
6613
0246
1602
5216
8830
1727
7724
5291
4377
9449
0427
6383
9553
6191
7190
4857
1279
5137
543
(130
581)
[169
264]
3.A
ggre
gate
dep
osits
@96
2618
1407
4217
7493
2235
6319
5782
3239
1350
2885
5850
0663
7170
6587
1671
5143
5020
9257
1006
1(1
4782
2)[1
9226
9]
4.B
orro
win
gs fr
om R
BI
3896
-280
-353
7-7
950
1393
4757
-224
577
28-1
1686
4989
-275
822
73
5.C
ash
in h
and
& b
alan
ces
with
RB
I65
202
3446
-274
510
993
1968
236
974
5625
478
805
-166
9048
492
4254
135
274
3847
82
6.In
vest
men
ts i
n G
ovt.s
ecur
ities
3400
3571
142
1122
4113
1341
6422
4-1
9514
7531
618
2603
1971
2422
2609
1187
5324
1088
1738
236
[520
31]
7.B
ank
cred
it51
1434
7828
913
9493
1115
7025
9643
3548
6842
4112
4307
2441
3636
4692
3969
7295
2933
3842
3542
1(9
4949
)[2
2676
1]
Sou
rce
:R
eser
ve B
ank
of I
ndia
.P
Pro
visi
onal
.
*R
evis
ed in
line
with
the
new
acc
ount
ing
stan
dard
s an
d ar
e co
nsis
tent
with
the
met
hodo
logy
sug
gest
ed b
y th
e W
orki
ng G
roup
on
Mon
ey S
uppl
y: A
naly
tics
and
Met
hodo
logy
of C
ompi
latio
n (J
une
1998
) fro
m 1
998-
99 o
nwar
ds. T
he re
visi
on is
in re
spec
t of p
ensi
on a
nd p
rovi
dent
fund
s w
ith c
omm
erci
al b
anks
whi
ch a
re c
lass
ified
as
othe
r dem
and
and
time
liabi
litie
s an
d in
clud
es th
ose
bank
s w
hich
hav
e re
porte
d su
ch c
hang
esso
far
.@
Dat
a al
so re
flect
rede
mpt
ion
of R
esur
gent
Indi
a B
onds
of
` 22
,693
cro
re s
ince
Oct
ober
200
3.
Not
es:
1.Fi
gure
s in
( ) e
xclu
de th
e im
pact
of m
erge
rs s
ince
May
3, 2
003.
2.Fi
gure
s in
[ ] e
xclu
de th
e im
pact
of c
onve
rsio
n of
a n
on-b
anki
ng e
ntity
into
ban
king
ent
ity fr
om O
ctob
er 1
1, 2
004.
http://indiabudget.nic.in
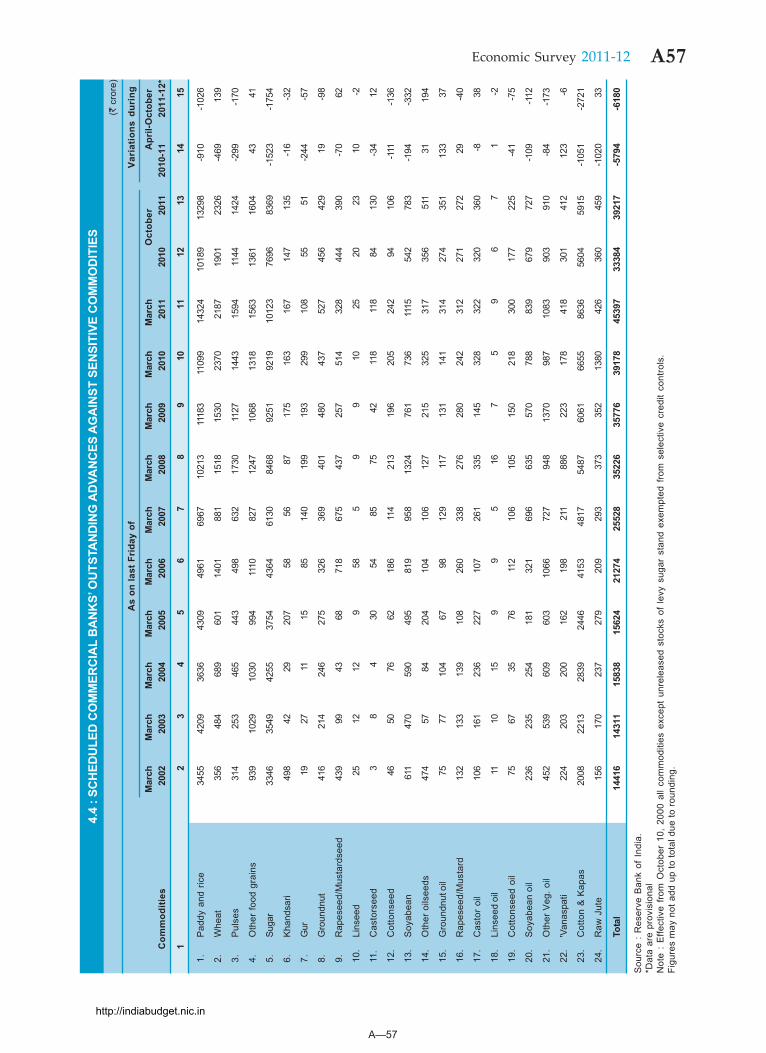
A—57
A57Economic Survey 2011-12
4.4
: SC
HED
ULE
D C
OM
MER
CIA
L B
AN
KS’
OU
TSTA
ND
ING
AD
VAN
CES
AG
AIN
ST S
ENSI
TIVE
CO
MM
OD
ITIE
S(`
cro
re)
As
on la
st F
riday
of
Vari
atio
ns d
urin
g
Mar
chM
arch
Mar
chM
arch
Mar
chM
arch
Mar
chM
arch
Mar
chM
arch
Oct
ober
Apr
il-O
ctob
erC
omm
oditi
es20
0220
0320
0420
0520
0620
0720
0820
0920
1020
1120
1020
1120
10-1
120
11-1
2*
12
34
56
78
910
1112
1314
15
1.P
addy
and
ric
e34
5542
0936
3643
0949
6169
6710
213
1118
311
099
1432
410
189
1329
8-9
10-1
026
2.W
heat
356
484
689
601
1401
881
1518
1530
2370
2187
1901
2326
-469
139
3.P
ulse
s31
425
346
544
349
863
217
3011
2714
4315
9411
4414
24-2
99-1
70
4.O
ther
food
gra
ins
939
1029
1030
994
1110
827
1247
1068
1318
1563
1361
1604
4341
5.Su
gar
3346
3549
4255
3754
4364
6130
8468
9251
9219
1012
376
9683
69-1
523
-175
4
6.K
hand
sari
498
4229
207
5856
8717
516
316
714
713
5-1
6-3
2
7.G
ur19
2711
1585
140
199
193
299
108
5551
-244
-57
8.G
roun
dnut
416
214
246
275
326
369
401
480
437
527
456
429
19-9
8
9.R
apes
eed/
Mus
tard
seed
439
9943
6871
867
543
725
751
432
844
439
0-7
062
10.
Lins
eed
2512
129
585
99
1025
2023
10-2
11.
Cas
tors
eed
38
430
5485
7542
118
118
8413
0-3
412
12.
Cot
tons
eed
4650
7662
186
114
213
196
205
242
9410
6-1
11-1
36
13.
Soy
abea
n61
147
059
049
581
995
813
2476
173
611
1554
278
3-1
94-3
32
14.
Oth
er o
ilsee
ds47
457
8420
410
410
612
721
532
531
735
651
131
194
15.
Gro
undn
ut o
il75
7710
467
9812
911
713
114
131
427
435
113
337
16.
Rap
esee
d/M
usta
rd13
213
313
910
826
033
827
628
024
231
227
127
229
-40
17.
Cas
tor
oil
106
161
236
227
107
261
335
145
328
322
320
360
-838
18.
Lins
eed
oil
1110
159
95
167
59
67
1-2
19.
Cot
tons
eed
oil
7567
3576
112
106
105
150
218
300
177
225
-41
-75
20.
Soy
abea
n oi
l23
623
525
418
132
169
663
557
078
883
967
972
7-1
09-1
12
21.
Oth
er V
eg. o
il45
253
960
960
310
6672
794
813
7098
710
8390
391
0-8
4-1
73
22.
'Van
aspa
ti22
420
320
016
219
821
188
622
317
841
830
141
212
3-6
23.
Cot
ton
& K
apas
2008
2213
2839
2446
4153
4817
5487
6061
6655
8636
5604
5915
-105
1-2
721
24.
Raw
Jut
e15
617
023
727
920
929
337
335
213
8042
636
045
9-1
020
33
Tota
l14
416
1431
115
838
1562
421
274
2552
835
226
3577
639
178
4539
733
384
3921
7-5
794
-618
0
Sou
rce
: R
eser
ve B
ank
of I
ndia
.*D
ata
are
prov
isio
nal
Not
e :
Effe
ctiv
e fro
m O
ctob
er 1
0, 2
000
all c
omm
oditi
es e
xcep
t un
rele
ased
sto
cks
of le
vy s
ugar
sta
nd e
xem
pted
fro
m s
elec
tive
cred
it co
ntro
ls.
Figu
res
may
not
add
up
to to
tal d
ue to
rou
ndin
g.
http://indiabudget.nic.in
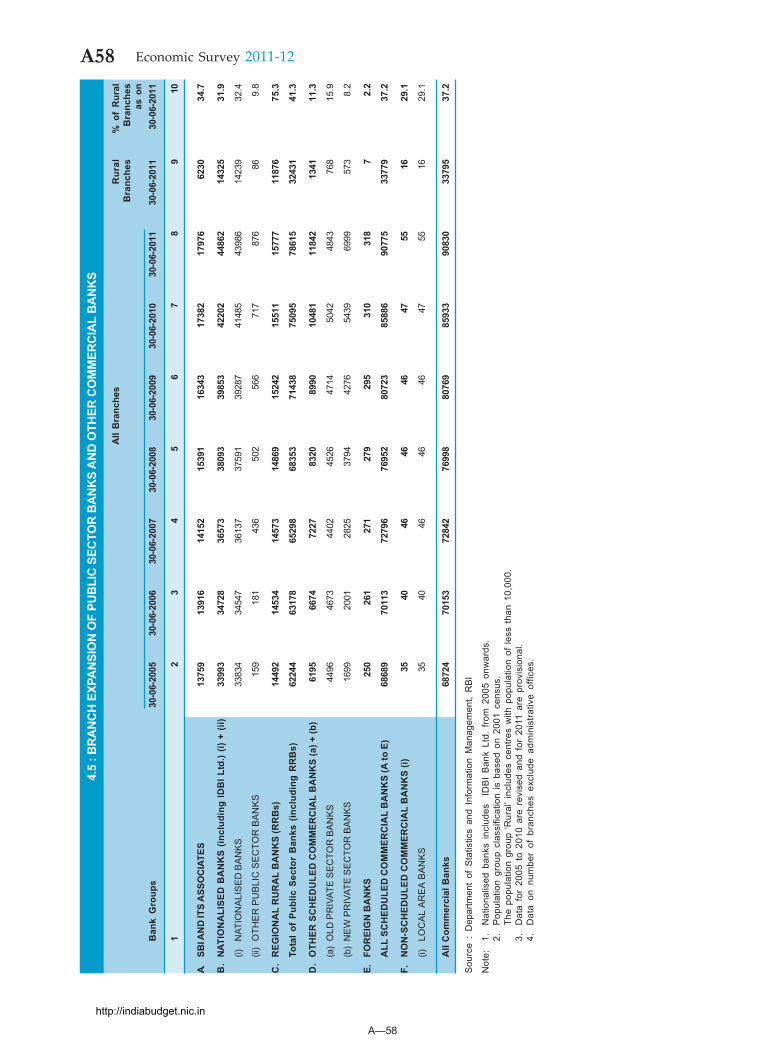
A—58
A58 Economic Survey 2011-12
4.5
: BR
AN
CH
EXP
AN
SIO
N O
F PU
BLI
C S
ECTO
R B
AN
KS
AN
D O
THER
CO
MM
ERC
IAL
BA
NK
S
All
Bra
nche
sR
ural
% o
f R
ural
Bra
nche
sB
ranc
hes
as o
nB
ank
Gro
ups
30-0
6-20
0530
-06-
2006
30-0
6-20
0730
-06-
2008
30-0
6-20
0930
-06-
2010
30-0
6-20
1130
-06-
2011
30-0
6-20
11
12
34
56
78
910
A.SB
I AN
D IT
S A
SSO
CIA
TES
1375
913
916
1415
215
391
1634
317
382
1797
662
3034
.7
B.
NAT
ION
ALI
SED
BA
NK
S (in
clud
ing
IDB
I Ltd
.) (i)
+ (
ii)33
993
3472
836
573
3809
339
853
4220
244
862
1432
531
.9
(i)N
ATIO
NA
LIS
ED
BA
NK
S33
834
3454
736
137
3759
139
287
4148
543
986
1423
932
.4
(ii)
OTH
ER
PU
BLI
C S
EC
TOR
BA
NK
S15
918
143
650
256
671
787
686
9.8
C.
REG
ION
AL
RU
RA
L B
AN
KS
(RR
Bs)
1449
214
534
1457
314
869
1524
215
511
1577
711
876
75.3
Tota
l of
Publ
ic S
ecto
r B
anks
(in
clud
ing
RR
Bs)
6224
463
178
6529
868
353
7143
875
095
7861
532
431
41.3
D.
OTH
ER S
CH
EDU
LED
CO
MM
ERC
IAL
BA
NK
S (a
) + (b
)61
9566
7472
2783
2089
9010
481
1184
213
4111
.3
(a)
OLD
PR
IVAT
E S
EC
TOR
BA
NK
S44
9646
7344
0245
2647
1450
4248
4376
815
.9
(b)
NE
W P
RIV
ATE
SE
CTO
R B
AN
KS
1699
2001
2825
3794
4276
5439
6999
573
8.2
E.FO
REI
GN
BA
NK
S25
026
127
127
929
531
031
87
2.2
ALL
SC
HED
ULE
D C
OM
MER
CIA
L B
AN
KS
(A to
E)
6868
970
113
7279
676
952
8072
385
886
9077
533
779
37.2
F.N
ON
-SC
HED
ULE
D C
OM
MER
CIA
L B
AN
KS
(i)35
4046
4646
4755
1629
.1
(i)LO
CA
L A
RE
A B
AN
KS
3540
4646
4647
5516
29.1
All
Com
mer
cial
Ban
ks68
724
7015
372
842
7699
880
769
8593
390
830
3379
537
.2
Sou
rce
: D
epar
tmen
t of
Sta
tistic
s an
d In
form
atio
n M
anag
emen
t, R
BI
Not
e:1.
Nat
iona
lised
ban
ks i
nclu
des
ID
BI
Ban
k Lt
d. f
rom
200
5 on
war
ds.
2.P
opul
atio
n gr
oup
clas
sific
atio
n is
bas
ed o
n 20
01 c
ensu
s.Th
e po
pula
tion
grou
p ‘R
ural
’ inc
lude
s ce
ntre
s w
ith p
opul
atio
n of
less
tha
n 10
,000
.3.
Dat
a fo
r 20
05 t
o 20
10 a
re r
evis
ed a
nd f
or 2
011
are
prov
isio
nal.
4.D
ata
on n
umbe
r of
bra
nche
s ex
clud
e ad
min
istra
tive
offic
es.
http://indiabudget.nic.in
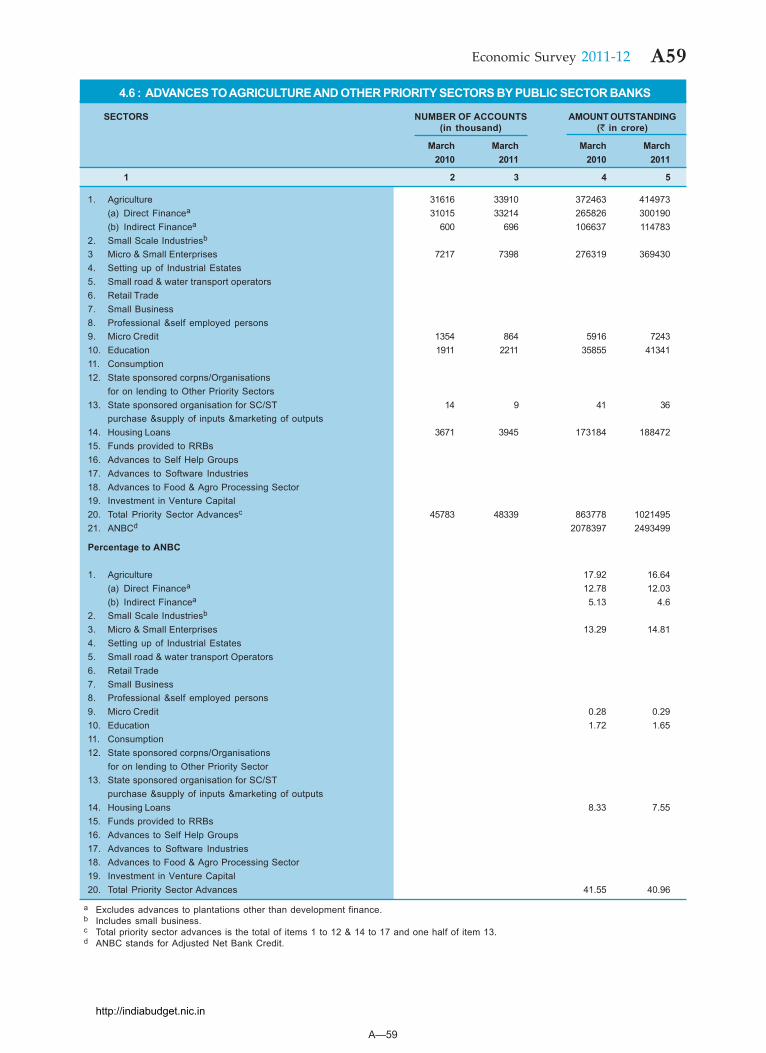
A—59
A59Economic Survey 2011-12
4.6 : ADVANCES TO AGRICULTURE AND OTHER PRIORITY SECTORS BY PUBLIC SECTOR BANKS
SECTORS NUMBER OF ACCOUNTS AMOUNT OUTSTANDING(in thousand) (` in crore)
March March March March2010 2011 2010 2011
1 2 3 4 5
1. Agriculture 31616 33910 372463 414973(a) Direct Financea 31015 33214 265826 300190(b) Indirect Financea 600 696 106637 114783
2. Small Scale Industriesb
3 Micro & Small Enterprises 7217 7398 276319 3694304. Setting up of Industrial Estates5. Small road & water transport operators6. Retail Trade7. Small Business8. Professional &self employed persons9. Micro Credit 1354 864 5916 724310. Education 1911 2211 35855 4134111. Consumption12. State sponsored corpns/Organisations
for on lending to Other Priority Sectors13. State sponsored organisation for SC/ST 14 9 41 36
purchase &supply of inputs &marketing of outputs14. Housing Loans 3671 3945 173184 18847215. Funds provided to RRBs16. Advances to Self Help Groups17. Advances to Software Industries18. Advances to Food & Agro Processing Sector19. Investment in Venture Capital20. Total Priority Sector Advancesc 45783 48339 863778 102149521. ANBCd 2078397 2493499
Percentage to ANBC
1. Agriculture 17.92 16.64(a) Direct Financea 12.78 12.03(b) Indirect Financea 5.13 4.6
2. Small Scale Industriesb
3. Micro & Small Enterprises 13.29 14.814. Setting up of Industrial Estates5. Small road & water transport Operators6. Retail Trade7. Small Business8. Professional &self employed persons9. Micro Credit 0.28 0.2910. Education 1.72 1.6511. Consumption12. State sponsored corpns/Organisations
for on lending to Other Priority Sector13. State sponsored organisation for SC/ST
purchase &supply of inputs &marketing of outputs14. Housing Loans 8.33 7.5515. Funds provided to RRBs16. Advances to Self Help Groups17. Advances to Software Industries18. Advances to Food & Agro Processing Sector19. Investment in Venture Capital20. Total Priority Sector Advances 41.55 40.96
a Excludes advances to plantations other than development finance.b Includes small business.c Total priority sector advances is the total of items 1 to 12 & 14 to 17 and one half of item 13.d ANBC stands for Adjusted Net Bank Credit.
http://indiabudget.nic.in
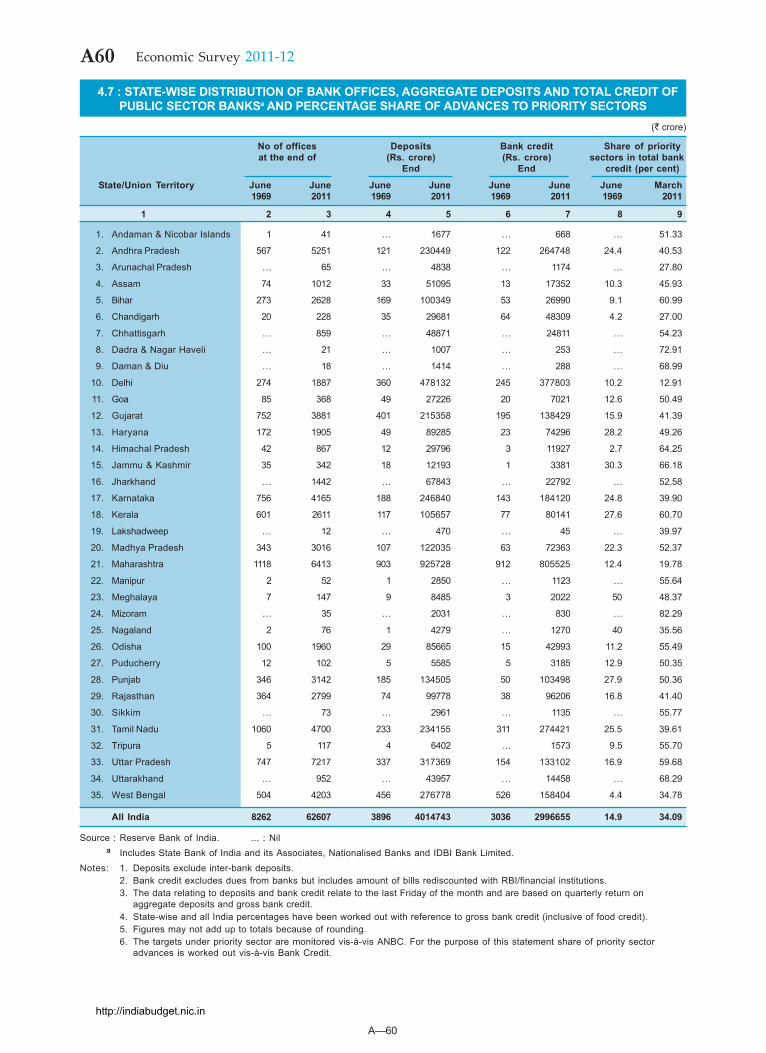
A—60
A60 Economic Survey 2011-12
4.7 : STATE-WISE DISTRIBUTION OF BANK OFFICES, AGGREGATE DEPOSITS AND TOTAL CREDIT OFPUBLIC SECTOR BANKSa AND PERCENTAGE SHARE OF ADVANCES TO PRIORITY SECTORS
(` crore)
No of offices Deposits Bank credit Share of priorityat the end of (Rs. crore) (Rs. crore) sectors in total bank
End End credit (per cent)
State/Union Territory June June June June June June June March1969 2011 1969 2011 1969 2011 1969 2011
1 2 3 4 5 6 7 8 9
1. Andaman & Nicobar Islands 1 41 ... 1677 ... 668 ... 51.33
2. Andhra Pradesh 567 5251 121 230449 122 264748 24.4 40.53
3. Arunachal Pradesh ... 65 ... 4838 ... 1174 ... 27.80
4. Assam 74 1012 33 51095 13 17352 10.3 45.93
5. Bihar 273 2628 169 100349 53 26990 9.1 60.99
6. Chandigarh 20 228 35 29681 64 48309 4.2 27.00
7. Chhattisgarh ... 859 ... 48871 ... 24811 ... 54.23
8. Dadra & Nagar Haveli ... 21 ... 1007 ... 253 ... 72.91
9. Daman & Diu ... 18 ... 1414 ... 288 ... 68.99
10. Delhi 274 1887 360 478132 245 377803 10.2 12.91
11. Goa 85 368 49 27226 20 7021 12.6 50.49
12. Gujarat 752 3881 401 215358 195 138429 15.9 41.39
13. Haryana 172 1905 49 89285 23 74296 28.2 49.26
14. Himachal Pradesh 42 867 12 29796 3 11927 2.7 64.25
15. Jammu & Kashmir 35 342 18 12193 1 3381 30.3 66.18
16. Jharkhand ... 1442 ... 67843 ... 22792 ... 52.58
17. Karnataka 756 4165 188 246840 143 184120 24.8 39.90
18. Kerala 601 2611 117 105657 77 80141 27.6 60.70
19. Lakshadweep ... 12 ... 470 ... 45 ... 39.97
20. Madhya Pradesh 343 3016 107 122035 63 72363 22.3 52.37
21. Maharashtra 1118 6413 903 925728 912 805525 12.4 19.78
22. Manipur 2 52 1 2850 ... 1123 ... 55.64
23. Meghalaya 7 147 9 8485 3 2022 50 48.37
24. Mizoram ... 35 ... 2031 ... 830 ... 82.29
25. Nagaland 2 76 1 4279 ... 1270 40 35.56
26. Odisha 100 1960 29 85665 15 42993 11.2 55.49
27. Puducherry 12 102 5 5585 5 3185 12.9 50.35
28. Punjab 346 3142 185 134505 50 103498 27.9 50.36
29. Rajasthan 364 2799 74 99778 38 96206 16.8 41.40
30. Sikkim ... 73 ... 2961 ... 1135 ... 55.77
31. Tamil Nadu 1060 4700 233 234155 311 274421 25.5 39.61
32. Tripura 5 117 4 6402 ... 1573 9.5 55.70
33. Uttar Pradesh 747 7217 337 317369 154 133102 16.9 59.68
34. Uttarakhand ... 952 ... 43957 ... 14458 ... 68.29
35. West Bengal 504 4203 456 276778 526 158404 4.4 34.78
All India 8262 62607 3896 4014743 3036 2996655 14.9 34.09
Source : Reserve Bank of India. ... : Nila Includes State Bank of India and its Associates, Nationalised Banks and IDBI Bank Limited.
Notes: 1. Deposits exclude inter-bank deposits.2. Bank credit excludes dues from banks but includes amount of bills rediscounted with RBI/financial institutions.3. The data relating to deposits and bank credit relate to the last Friday of the month and are based on quarterly return on
aggregate deposits and gross bank credit.4. State-wise and all India percentages have been worked out with reference to gross bank credit (inclusive of food credit).5. Figures may not add up to totals because of rounding.6. The targets under priority sector are monitored vis-à-vis ANBC. For the purpose of this statement share of priority sector
advances is worked out vis-à-vis Bank Credit.
http://indiabudget.nic.in
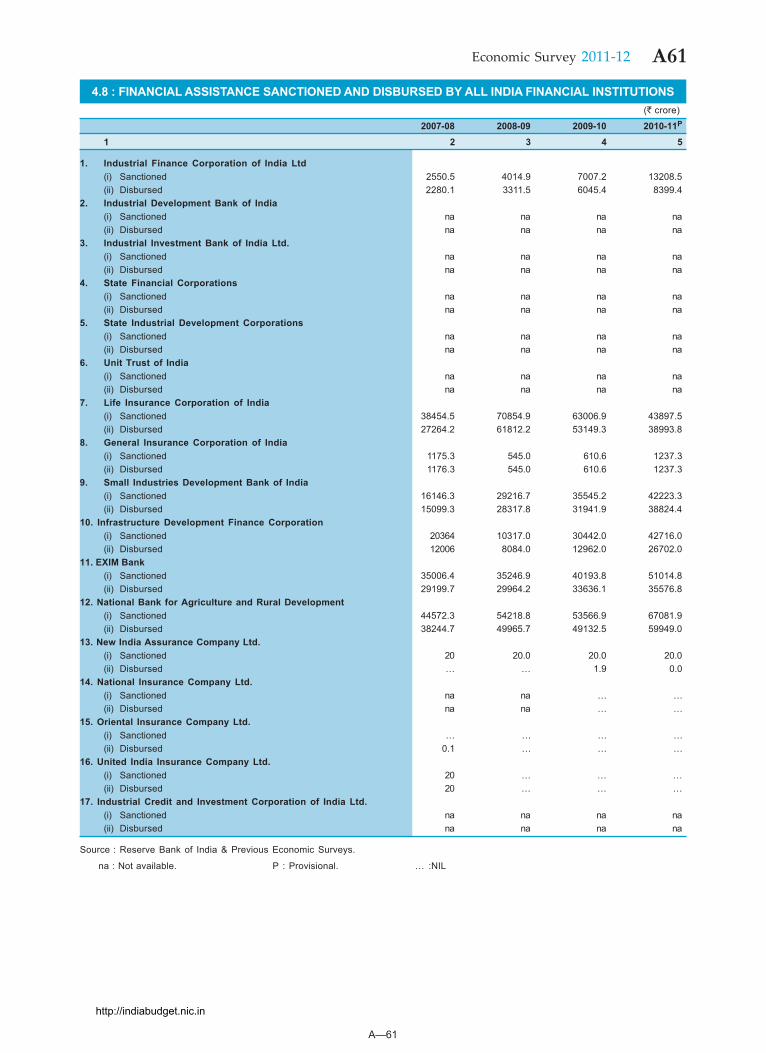
A—61
A61Economic Survey 2011-12
4.8 : FINANCIAL ASSISTANCE SANCTIONED AND DISBURSED BY ALL INDIA FINANCIAL INSTITUTIONS(` crore)
2007-08 2008-09 2009-10 2010-11P
1 2 3 4 5
1. Industrial Finance Corporation of India Ltd(i) Sanctioned 2550.5 4014.9 7007.2 13208.5(ii) Disbursed 2280.1 3311.5 6045.4 8399.4
2. Industrial Development Bank of India(i) Sanctioned na na na na(ii) Disbursed na na na na
3. Industrial Investment Bank of India Ltd.(i) Sanctioned na na na na(ii) Disbursed na na na na
4. State Financial Corporations(i) Sanctioned na na na na(ii) Disbursed na na na na
5. State Industrial Development Corporations(i) Sanctioned na na na na(ii) Disbursed na na na na
6. Unit Trust of India(i) Sanctioned na na na na(ii) Disbursed na na na na
7. Life Insurance Corporation of India(i) Sanctioned 38454.5 70854.9 63006.9 43897.5(ii) Disbursed 27264.2 61812.2 53149.3 38993.8
8. General Insurance Corporation of India(i) Sanctioned 1175.3 545.0 610.6 1237.3(ii) Disbursed 1176.3 545.0 610.6 1237.3
9. Small Industries Development Bank of India(i) Sanctioned 16146.3 29216.7 35545.2 42223.3(ii) Disbursed 15099.3 28317.8 31941.9 38824.4
10. Infrastructure Development Finance Corporation(i) Sanctioned 20364 10317.0 30442.0 42716.0(ii) Disbursed 12006 8084.0 12962.0 26702.0
11. EXIM Bank(i) Sanctioned 35006.4 35246.9 40193.8 51014.8(ii) Disbursed 29199.7 29964.2 33636.1 35576.8
12. National Bank for Agriculture and Rural Development(i) Sanctioned 44572.3 54218.8 53566.9 67081.9(ii) Disbursed 38244.7 49965.7 49132.5 59949.0
13. New India Assurance Company Ltd.(i) Sanctioned 20 20.0 20.0 20.0(ii) Disbursed … … 1.9 0.0
14. National Insurance Company Ltd.(i) Sanctioned na na … …(ii) Disbursed na na … …
15. Oriental Insurance Company Ltd.(i) Sanctioned … … … …(ii) Disbursed 0.1 … … …
16. United India Insurance Company Ltd.(i) Sanctioned 20 … … …(ii) Disbursed 20 … … …
17. Industrial Credit and Investment Corporation of India Ltd.(i) Sanctioned na na na na(ii) Disbursed na na na na
Source : Reserve Bank of India & Previous Economic Surveys.
na : Not available. P : Provisional. … :NIL
http://indiabudget.nic.in
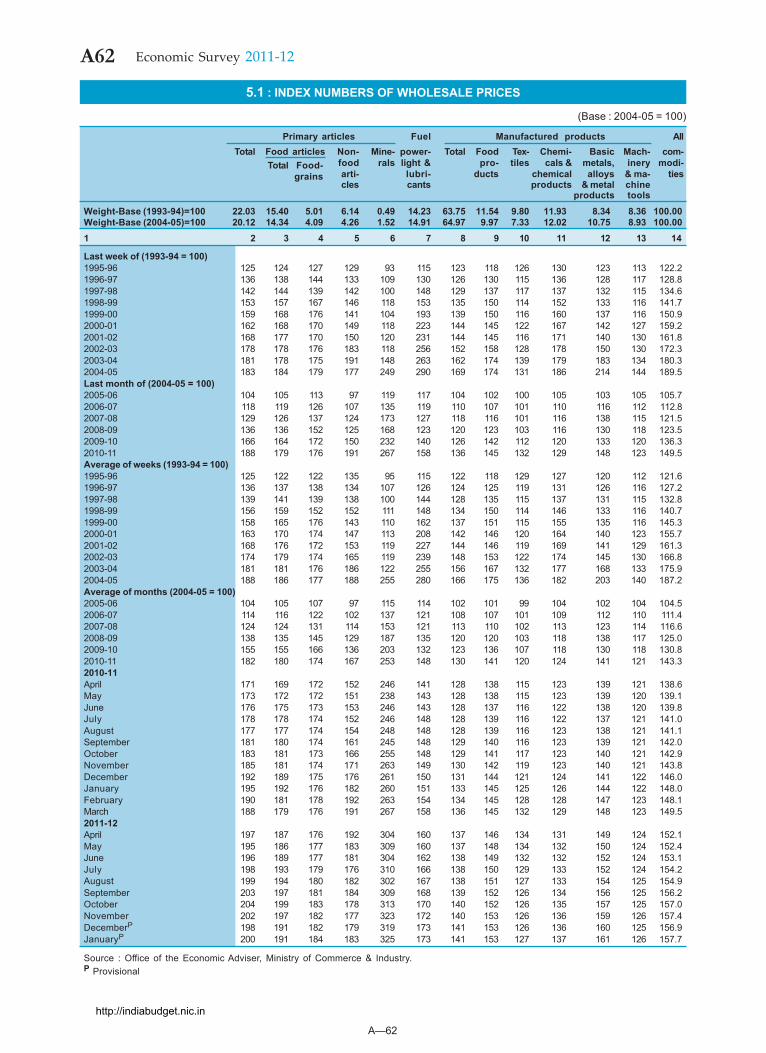
A62 Economic Survey 2011-12
A—62
5.1 : INDEX NUMBERS OF WHOLESALE PRICES
(Base : 2004-05 = 100)
Primary articles Fuel Manufactured products AllTotal Food articles Non- Mine- power- Total Food Tex- Chemi- Basic Mach- com-
Total Food- food rals light & pro- tiles cals & metals, inery modi-grains arti- lubri- ducts chemical alloys & ma- ties
cles cants products & metal chineproducts tools
Weight-Base (1993-94)=100 22.03 15.40 5.01 6.14 0.49 14.23 63.75 11.54 9.80 11.93 8.34 8.36 100.00Weight-Base (2004-05)=100 20.12 14.34 4.09 4.26 1.52 14.91 64.97 9.97 7.33 12.02 10.75 8.93 100.001 2 3 4 5 6 7 8 9 10 11 12 13 14
Last week of (1993-94 = 100)1995-96 125 124 127 129 93 115 123 118 126 130 123 113 122.21996-97 136 138 144 133 109 130 126 130 115 136 128 117 128.81997-98 142 144 139 142 100 148 129 137 117 137 132 115 134.61998-99 153 157 167 146 118 153 135 150 114 152 133 116 141.71999-00 159 168 176 141 104 193 139 150 116 160 137 116 150.92000-01 162 168 170 149 118 223 144 145 122 167 142 127 159.22001-02 168 177 170 150 120 231 144 145 116 171 140 130 161.82002-03 178 178 176 183 118 256 152 158 128 178 150 130 172.32003-04 181 178 175 191 148 263 162 174 139 179 183 134 180.32004-05 183 184 179 177 249 290 169 174 131 186 214 144 189.5Last month of (2004-05 = 100)2005-06 104 105 113 97 119 117 104 102 100 105 103 105 105.72006-07 118 119 126 107 135 119 110 107 101 110 116 112 112.82007-08 129 126 137 124 173 127 118 116 101 116 138 115 121.52008-09 136 136 152 125 168 123 120 123 103 116 130 118 123.52009-10 166 164 172 150 232 140 126 142 112 120 133 120 136.32010-11 188 179 176 191 267 158 136 145 132 129 148 123 149.5Average of weeks (1993-94 = 100)1995-96 125 122 122 135 95 115 122 118 129 127 120 112 121.61996-97 136 137 138 134 107 126 124 125 119 131 126 116 127.21997-98 139 141 139 138 100 144 128 135 115 137 131 115 132.81998-99 156 159 152 152 111 148 134 150 114 146 133 116 140.71999-00 158 165 176 143 110 162 137 151 115 155 135 116 145.32000-01 163 170 174 147 113 208 142 146 120 164 140 123 155.72001-02 168 176 172 153 119 227 144 146 119 169 141 129 161.32002-03 174 179 174 165 119 239 148 153 122 174 145 130 166.82003-04 181 181 176 186 122 255 156 167 132 177 168 133 175.92004-05 188 186 177 188 255 280 166 175 136 182 203 140 187.2Average of months (2004-05 = 100)2005-06 104 105 107 97 115 114 102 101 99 104 102 104 104.52006-07 114 116 122 102 137 121 108 107 101 109 112 110 111.42007-08 124 124 131 114 153 121 113 110 102 113 123 114 116.62008-09 138 135 145 129 187 135 120 120 103 118 138 117 125.02009-10 155 155 166 136 203 132 123 136 107 118 130 118 130.82010-11 182 180 174 167 253 148 130 141 120 124 141 121 143.32010-11April 171 169 172 152 246 141 128 138 115 123 139 121 138.6May 173 172 172 151 238 143 128 138 115 123 139 120 139.1June 176 175 173 153 246 143 128 137 116 122 138 120 139.8July 178 178 174 152 246 148 128 139 116 122 137 121 141.0August 177 177 174 154 248 148 128 139 116 123 138 121 141.1September 181 180 174 161 245 148 129 140 116 123 139 121 142.0October 183 181 173 166 255 148 129 141 117 123 140 121 142.9November 185 181 174 171 263 149 130 142 119 123 140 121 143.8December 192 189 175 176 261 150 131 144 121 124 141 122 146.0January 195 192 176 182 260 151 133 145 125 126 144 122 148.0February 190 181 178 192 263 154 134 145 128 128 147 123 148.1March 188 179 176 191 267 158 136 145 132 129 148 123 149.52011-12April 197 187 176 192 304 160 137 146 134 131 149 124 152.1May 195 186 177 183 309 160 137 148 134 132 150 124 152.4June 196 189 177 181 304 162 138 149 132 132 152 124 153.1July 198 193 179 176 310 166 138 150 129 133 152 124 154.2August 199 194 180 182 302 167 138 151 127 133 154 125 154.9September 203 197 181 184 309 168 139 152 126 134 156 125 156.2October 204 199 183 178 313 170 140 152 126 135 157 125 157.0November 202 197 182 177 323 172 140 153 126 136 159 126 157.4DecemberP 198 191 182 179 319 173 141 153 126 136 160 125 156.9JanuaryP 200 191 184 183 325 173 141 153 127 137 161 126 157.7
Source : Office of the Economic Adviser, Ministry of Commerce & Industry.P Provisional
http://indiabudget.nic.in
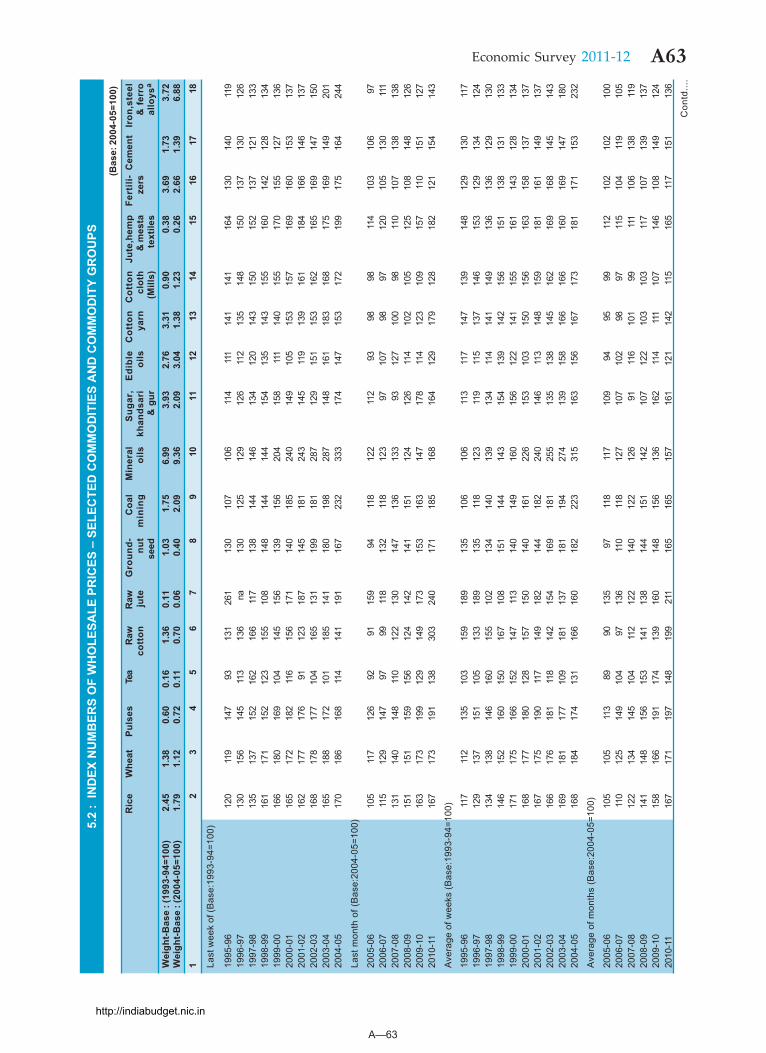
A63Economic Survey 2011-12
A—63
5.2
: IN
DEX
NU
MB
ERS
OF
WH
OLE
SALE
PR
ICES
– S
ELEC
TED
CO
MM
OD
ITIE
S A
ND
CO
MM
OD
ITY
GR
OU
PS (B
ase:
200
4-05
=100
)R
ice
Whe
atPu
lses
Tea
Raw
Raw
Gro
und-
Coa
lM
iner
alS
ugar
,E
dibl
eC
otto
nC
otto
nJu
te,h
emp
Fert
ili-
Cem
ent
Iron
,ste
elco
tton
jute
nut
min
ing
oils
khan
dsar
ioi
lsya
rncl
oth
& m
esta
zers
& f
erro
seed
& g
ur(M
ills)
text
iles
allo
ysa
Wei
ght-B
ase
: (19
93-9
4=10
0)2.
451.
380.
600.
161.
360.
111.
031.
756.
993.
932.
763.
310.
900.
383.
691.
733.
72W
eigh
t-Bas
e : (
2004
-05=
100)
1.79
1.12
0.72
0.11
0.70
0.06
0.40
2.09
9.36
2.09
3.04
1.38
1.23
0.26
2.66
1.39
6.88
12
34
56
78
910
1112
1314
1516
1718
Last
wee
k of
(Bas
e:19
93-9
4=10
0)
1995
-96
120
119
147
9313
126
113
010
710
611
411
114
114
116
413
014
011
919
96-9
713
015
614
511
313
6na
130
125
129
126
112
135
148
150
137
130
126
1997
-98
135
137
152
162
166
117
138
144
146
134
120
143
150
152
137
121
133
1998
-99
161
171
152
123
155
108
148
144
144
154
135
143
155
160
142
128
134
1999
-00
166
180
169
104
145
156
139
156
204
158
111
140
155
170
155
127
136
2000
-01
165
172
182
116
156
171
140
185
240
149
105
153
157
169
160
153
137
2001
-02
162
177
176
9112
318
714
518
124
314
511
913
916
118
416
614
613
720
02-0
316
817
817
710
416
513
119
918
128
712
915
115
316
216
516
914
715
020
03-0
416
518
817
210
118
514
118
019
828
714
816
118
316
817
516
914
920
120
04-0
517
018
616
811
414
119
116
723
233
317
414
715
317
219
917
516
424
4
Last
mon
th o
f (B
ase:
2004
-05=
100)
2005
-06
105
117
126
9291
159
9411
812
211
293
9898
114
103
106
9720
06-0
711
512
914
797
9911
813
211
812
397
107
9897
120
105
130
111
2007
-08
131
140
148
110
122
130
147
136
133
9312
710
098
110
107
138
138
2008
-09
151
151
159
156
124
142
141
151
124
126
114
102
105
125
108
148
126
2009
-10
163
173
199
129
149
173
153
163
147
178
114
123
109
157
110
151
127
2010
-11
167
173
191
138
303
240
171
185
168
164
129
179
128
182
121
154
143
Ave
rage
of w
eeks
(Bas
e:19
93-9
4=10
0)
1995
-96
117
112
135
103
159
189
135
106
106
113
117
147
139
148
129
130
117
1996
-97
129
137
151
105
133
189
135
118
123
119
115
137
146
153
129
134
124
1997
-98
134
138
146
160
155
102
134
140
139
134
114
141
149
136
136
129
130
1998
-99
146
152
160
150
167
108
151
144
143
154
139
142
156
151
138
131
133
1999
-00
171
175
166
152
147
113
140
149
160
156
122
141
155
161
143
128
134
2000
-01
168
177
180
128
157
150
140
161
226
153
103
150
156
163
158
137
137
2001
-02
167
175
190
117
149
182
144
182
240
146
113
148
159
181
161
149
137
2002
-03
166
176
181
118
142
154
169
181
255
135
138
145
162
169
168
145
143
2003
-04
169
181
177
109
181
137
181
194
274
139
158
166
166
160
169
147
180
2004
-05
168
184
174
131
166
160
182
223
315
163
156
167
173
181
171
153
232
Ave
rage
of m
onth
s (B
ase:
2004
-05=
100)
2005
-06
105
105
113
8990
135
9711
811
710
994
9599
112
102
102
100
2006
-07
110
125
149
104
9713
611
011
812
710
710
298
9711
510
411
910
520
07-0
812
213
414
510
411
212
214
012
212
691
116
101
9911
110
613
811
920
08-0
914
114
815
615
314
113
814
415
114
210
712
210
310
311
710
713
913
720
09-1
015
816
619
117
413
916
014
815
613
616
211
411
110
714
610
814
912
420
10-1
116
717
119
714
819
921
116
516
515
716
112
114
211
516
511
715
113
6
Con
td...
.
http://indiabudget.nic.in
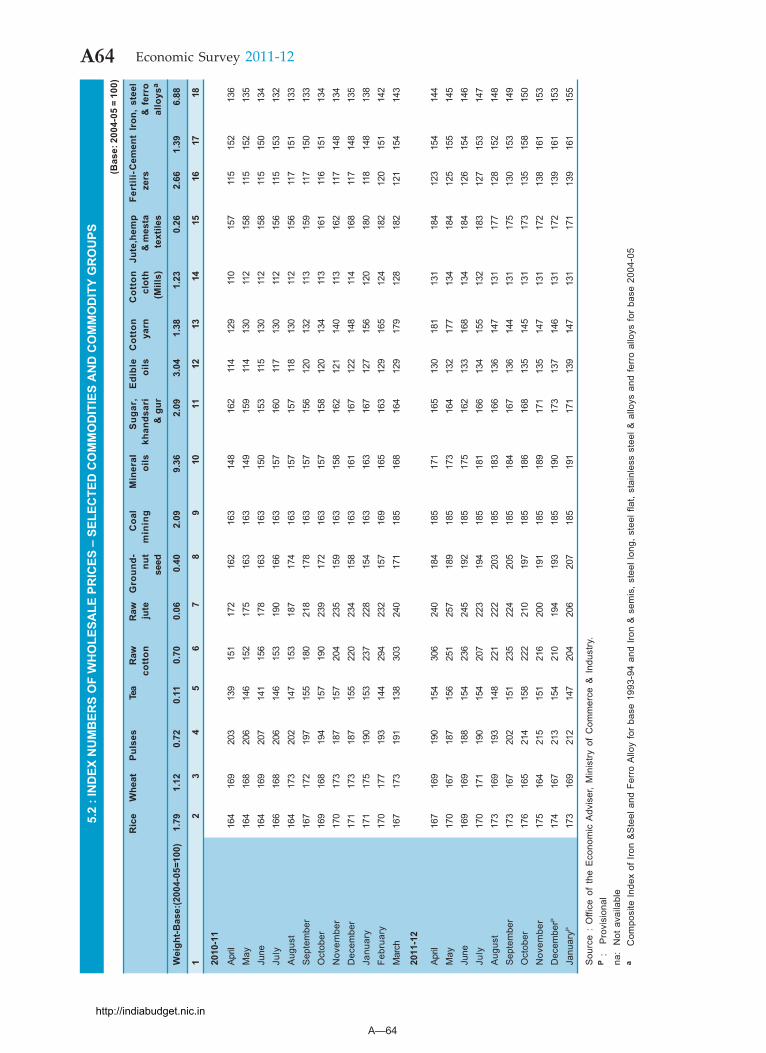
A64 Economic Survey 2011-12
A—64
5.2
: IN
DEX
NU
MB
ERS
OF
WH
OLE
SALE
PR
ICES
– S
ELEC
TED
CO
MM
OD
ITIE
S A
ND
CO
MM
OD
ITY
GR
OU
PS
(Bas
e: 2
004-
05 =
100
)
Ric
eW
heat
Puls
esTe
aR
awR
awG
roun
d-C
oal
Min
eral
Sug
ar,
Edi
ble
Cot
ton
Cot
ton
Jute
,hem
pFe
rtili
-Cem
ent
Iron
, st
eel
cott
onju
tenu
tm
inin
goi
lskh
ands
ari
oils
yarn
clot
h&
mes
taze
rs&
fer
rose
ed&
gur
(Mill
s)te
xtile
sal
loys
a
Wei
ght-B
ase:
(200
4-05
=100
)1.
791.
120.
720.
110.
700.
060.
402.
099.
362.
093.
041.
381.
230.
262.
661.
396.
88
12
34
56
78
910
1112
1314
1516
1718
2010
-11
April
164
169
203
139
151
172
162
163
148
162
114
129
110
157
115
152
136
May
164
168
206
146
152
175
163
163
149
159
114
130
112
158
115
152
135
June
164
169
207
141
156
178
163
163
150
153
115
130
112
158
115
150
134
July
166
168
206
146
153
190
166
163
157
160
117
130
112
156
115
153
132
Aug
ust
164
173
202
147
153
187
174
163
157
157
118
130
112
156
117
151
133
Sep
tem
ber
167
172
197
155
180
218
178
163
157
156
120
132
113
159
117
150
133
Oct
ober
169
168
194
157
190
239
172
163
157
158
120
134
113
161
116
151
134
Nov
embe
r17
017
318
715
720
423
515
916
315
816
212
114
011
316
211
714
813
4D
ecem
ber
171
173
187
155
220
234
158
163
161
167
122
148
114
168
117
148
135
Janu
ary
171
175
190
153
237
228
154
163
163
167
127
156
120
180
118
148
138
Febr
uary
170
177
193
144
294
232
157
169
165
163
129
165
124
182
120
151
142
Mar
ch16
717
319
113
830
324
017
118
516
816
412
917
912
818
212
115
414
3
2011
-12
April
167
169
190
154
306
240
184
185
171
165
130
181
131
184
123
154
144
May
170
167
187
156
251
257
189
185
173
164
132
177
134
184
125
155
145
June
169
169
188
154
236
245
192
185
175
162
133
168
134
184
126
154
146
July
170
171
190
154
207
223
194
185
181
166
134
155
132
183
127
153
147
Aug
ust
173
169
193
148
221
222
203
185
183
166
136
147
131
177
128
152
148
Sep
tem
ber
173
167
202
151
235
224
205
185
184
167
136
144
131
175
130
153
149
Oct
ober
176
165
214
158
222
210
197
185
186
168
135
145
131
173
135
158
150
Nov
embe
r17
516
421
515
121
620
019
118
518
917
113
514
713
117
213
816
115
3D
ecem
berP
174
167
213
154
210
194
193
185
190
173
137
146
131
172
139
161
153
Janu
aryP
173
169
212
147
204
206
207
185
191
171
139
147
131
171
139
161
155
Sou
rce
: O
ffice
of
the
Eco
nom
ic A
dvis
er,
Min
istry
of
Com
mer
ce &
Ind
ustry
.P
:P
rovi
sion
alna
: N
ot a
vaila
ble
a C
ompo
site
Inde
x of
Iron
&S
teel
and
Fer
ro A
lloy
for
base
199
3-94
and
Iron
& s
emis
, ste
el lo
ng, s
teel
flat
, sta
inle
ss s
teel
& a
lloys
and
ferr
o al
loys
for
base
200
4-05
http://indiabudget.nic.in
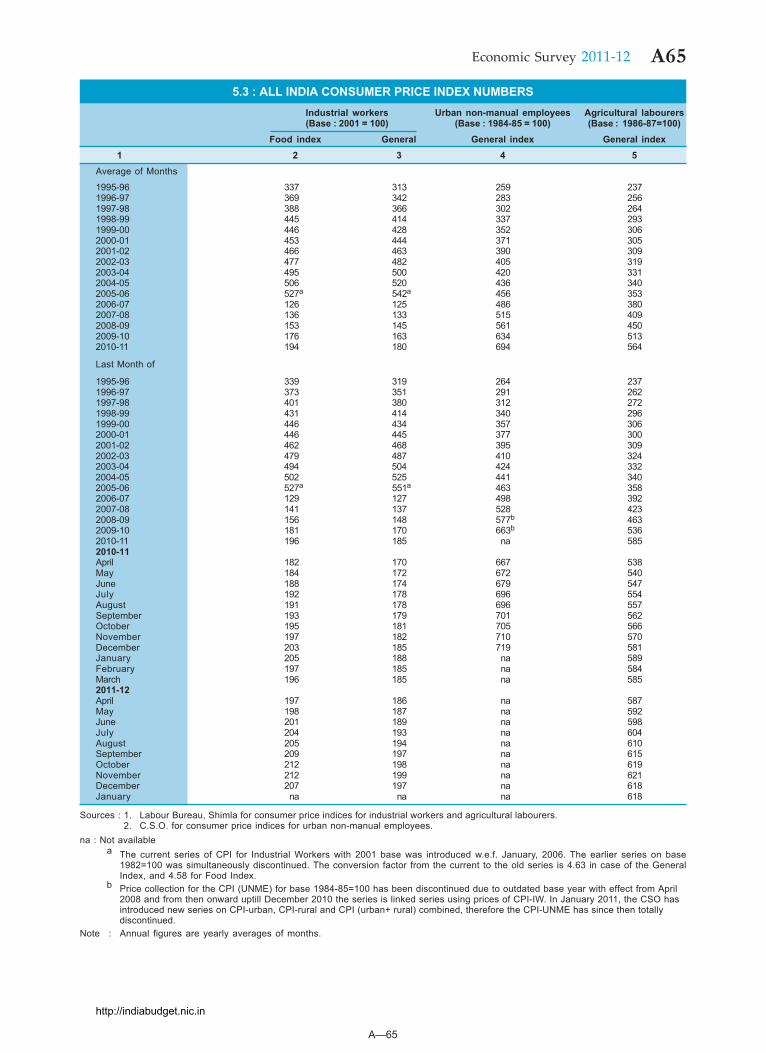
A65Economic Survey 2011-12
A—65
5.3 : ALL INDIA CONSUMER PRICE INDEX NUMBERSIndustrial workers Urban non-manual employees Agricultural labourers(Base : 2001 = 100) (Base : 1984-85 = 100) (Base : 1986-87=100)
Food index General General index General index1 2 3 4 5
Average of Months
1995-96 337 313 259 2371996-97 369 342 283 2561997-98 388 366 302 2641998-99 445 414 337 2931999-00 446 428 352 3062000-01 453 444 371 3052001-02 466 463 390 3092002-03 477 482 405 3192003-04 495 500 420 3312004-05 506 520 436 3402005-06 527a 542a 456 3532006-07 126 125 486 3802007-08 136 133 515 4092008-09 153 145 561 4502009-10 176 163 634 5132010-11 194 180 694 564
Last Month of
1995-96 339 319 264 2371996-97 373 351 291 2621997-98 401 380 312 2721998-99 431 414 340 2961999-00 446 434 357 3062000-01 446 445 377 3002001-02 462 468 395 3092002-03 479 487 410 3242003-04 494 504 424 3322004-05 502 525 441 3402005-06 527a 551a 463 3582006-07 129 127 498 3922007-08 141 137 528 4232008-09 156 148 577b 4632009-10 181 170 663b 5362010-11 196 185 na 5852010-11April 182 170 667 538May 184 172 672 540June 188 174 679 547July 192 178 696 554August 191 178 696 557September 193 179 701 562October 195 181 705 566November 197 182 710 570December 203 185 719 581January 205 188 na 589February 197 185 na 584March 196 185 na 5852011-12April 197 186 na 587May 198 187 na 592June 201 189 na 598July 204 193 na 604August 205 194 na 610September 209 197 na 615October 212 198 na 619November 212 199 na 621December 207 197 na 618January na na na 618
Sources : 1. Labour Bureau, Shimla for consumer price indices for industrial workers and agricultural labourers.2. C.S.O. for consumer price indices for urban non-manual employees.
na : Not availablea The current series of CPI for Industrial Workers with 2001 base was introduced w.e.f. January, 2006. The earlier series on base
1982=100 was simultaneously discontinued. The conversion factor from the current to the old series is 4.63 in case of the GeneralIndex, and 4.58 for Food Index.
b Price collection for the CPI (UNME) for base 1984-85=100 has been discontinued due to outdated base year with effect from April2008 and from then onward uptill December 2010 the series is linked series using prices of CPI-IW. In January 2011, the CSO hasintroduced new series on CPI-urban, CPI-rural and CPI (urban+ rural) combined, therefore the CPI-UNME has since then totallydiscontinued.
Note : Annual figures are yearly averages of months.
http://indiabudget.nic.in
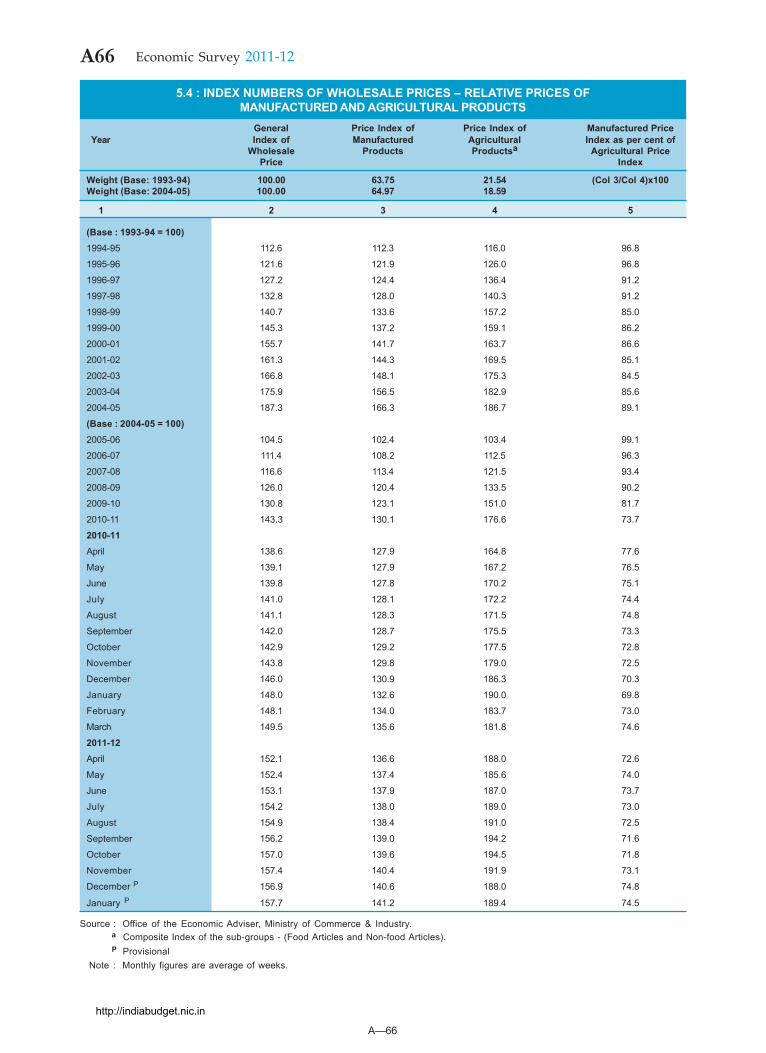
A66 Economic Survey 2011-12
A—66
5.4 : INDEX NUMBERS OF WHOLESALE PRICES – RELATIVE PRICES OFMANUFACTURED AND AGRICULTURAL PRODUCTS
General Price Index of Price Index of Manufactured PriceYear Index of Manufactured Agricultural Index as per cent of
Wholesale Products Productsa Agricultural PricePrice Index
Weight (Base: 1993-94) 100.00 63.75 21.54 (Col 3/Col 4)x100Weight (Base: 2004-05) 100.00 64.97 18.59
1 2 3 4 5
(Base : 1993-94 = 100)1994-95 112.6 112.3 116.0 96.8
1995-96 121.6 121.9 126.0 96.8
1996-97 127.2 124.4 136.4 91.2
1997-98 132.8 128.0 140.3 91.2
1998-99 140.7 133.6 157.2 85.0
1999-00 145.3 137.2 159.1 86.2
2000-01 155.7 141.7 163.7 86.6
2001-02 161.3 144.3 169.5 85.1
2002-03 166.8 148.1 175.3 84.5
2003-04 175.9 156.5 182.9 85.6
2004-05 187.3 166.3 186.7 89.1
(Base : 2004-05 = 100)2005-06 104.5 102.4 103.4 99.1
2006-07 111.4 108.2 112.5 96.3
2007-08 116.6 113.4 121.5 93.4
2008-09 126.0 120.4 133.5 90.2
2009-10 130.8 123.1 151.0 81.7
2010-11 143.3 130.1 176.6 73.7
2010-11April 138.6 127.9 164.8 77.6
May 139.1 127.9 167.2 76.5
June 139.8 127.8 170.2 75.1
July 141.0 128.1 172.2 74.4
August 141.1 128.3 171.5 74.8
September 142.0 128.7 175.5 73.3
October 142.9 129.2 177.5 72.8
November 143.8 129.8 179.0 72.5
December 146.0 130.9 186.3 70.3
January 148.0 132.6 190.0 69.8
February 148.1 134.0 183.7 73.0
March 149.5 135.6 181.8 74.6
2011-12April 152.1 136.6 188.0 72.6
May 152.4 137.4 185.6 74.0
June 153.1 137.9 187.0 73.7
July 154.2 138.0 189.0 73.0
August 154.9 138.4 191.0 72.5
September 156.2 139.0 194.2 71.6
October 157.0 139.6 194.5 71.8
November 157.4 140.4 191.9 73.1
December P 156.9 140.6 188.0 74.8
January P 157.7 141.2 189.4 74.5
Source : Office of the Economic Adviser, Ministry of Commerce & Industry.a Composite Index of the sub-groups - (Food Articles and Non-food Articles).P Provisional
Note : Monthly figures are average of weeks.
http://indiabudget.nic.in
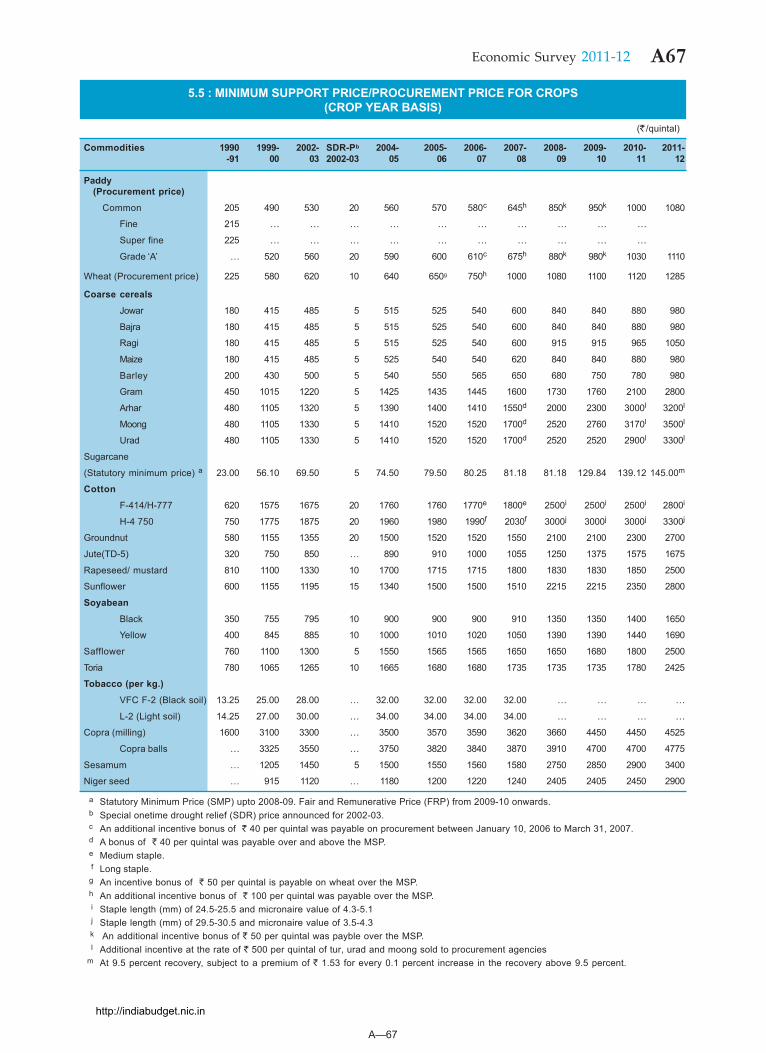
A67Economic Survey 2011-12
A—67
5.5 : MINIMUM SUPPORT PRICE/PROCUREMENT PRICE FOR CROPS(CROP YEAR BASIS)
(` /quintal)
Commodities 1990 1999- 2002- SDR-Pb 2004- 2005- 2006- 2007- 2008- 2009- 2010- 2011--91 00 03 2002-03 05 06 07 08 09 10 11 12
Paddy(Procurement price)
Common 205 490 530 20 560 570 580c 645h 850k 950k 1000 1080
Fine 215 ... ... ... ... ... ... ... ... ... ...
Super fine 225 ... ... ... ... ... ... ... ... ... ...
Grade ‘A’ ... 520 560 20 590 600 610c 675h 880k 980k 1030 1110
Wheat (Procurement price) 225 580 620 10 640 650g 750h 1000 1080 1100 1120 1285
Coarse cereals
Jowar 180 415 485 5 515 525 540 600 840 840 880 980
Bajra 180 415 485 5 515 525 540 600 840 840 880 980
Ragi 180 415 485 5 515 525 540 600 915 915 965 1050
Maize 180 415 485 5 525 540 540 620 840 840 880 980
Barley 200 430 500 5 540 550 565 650 680 750 780 980
Gram 450 1015 1220 5 1425 1435 1445 1600 1730 1760 2100 2800
Arhar 480 1105 1320 5 1390 1400 1410 1550d 2000 2300 3000l 3200l
Moong 480 1105 1330 5 1410 1520 1520 1700d 2520 2760 3170l 3500l
Urad 480 1105 1330 5 1410 1520 1520 1700d 2520 2520 2900l 3300l
Sugarcane
(Statutory minimum price) a 23.00 56.10 69.50 5 74.50 79.50 80.25 81.18 81.18 129.84 139.12 145.00m
Cotton
F-414/H-777 620 1575 1675 20 1760 1760 1770e 1800e 2500i 2500i 2500i 2800i
H-4 750 750 1775 1875 20 1960 1980 1990f 2030f 3000j 3000j 3000j 3300j
Groundnut 580 1155 1355 20 1500 1520 1520 1550 2100 2100 2300 2700
Jute(TD-5) 320 750 850 ... 890 910 1000 1055 1250 1375 1575 1675
Rapeseed/ mustard 810 1100 1330 10 1700 1715 1715 1800 1830 1830 1850 2500
Sunflower 600 1155 1195 15 1340 1500 1500 1510 2215 2215 2350 2800
Soyabean
Black 350 755 795 10 900 900 900 910 1350 1350 1400 1650
Yellow 400 845 885 10 1000 1010 1020 1050 1390 1390 1440 1690
Safflower 760 1100 1300 5 1550 1565 1565 1650 1650 1680 1800 2500
Toria 780 1065 1265 10 1665 1680 1680 1735 1735 1735 1780 2425
Tobacco (per kg.)
VFC F-2 (Black soil) 13.25 25.00 28.00 ... 32.00 32.00 32.00 32.00 ... ... ... ...
L-2 (Light soil) 14.25 27.00 30.00 ... 34.00 34.00 34.00 34.00 ... ... ... ...
Copra (milling) 1600 3100 3300 ... 3500 3570 3590 3620 3660 4450 4450 4525
Copra balls ... 3325 3550 ... 3750 3820 3840 3870 3910 4700 4700 4775
Sesamum ... 1205 1450 5 1500 1550 1560 1580 2750 2850 2900 3400
Niger seed ... 915 1120 ... 1180 1200 1220 1240 2405 2405 2450 2900
a Statutory Minimum Price (SMP) upto 2008-09. Fair and Remunerative Price (FRP) from 2009-10 onwards.b Special onetime drought relief (SDR) price announced for 2002-03.c An additional incentive bonus of ` 40 per quintal was payable on procurement between January 10, 2006 to March 31, 2007.d A bonus of ` 40 per quintal was payable over and above the MSP.e Medium staple.f Long staple.
g An incentive bonus of ` 50 per quintal is payable on wheat over the MSP.h An additional incentive bonus of ` 100 per quintal was payable over the MSP.i Staple length (mm) of 24.5-25.5 and micronaire value of 4.3-5.1j Staple length (mm) of 29.5-30.5 and micronaire value of 3.5-4.3k An additional incentive bonus of ` 50 per quintal was payble over the MSP.l Additional incentive at the rate of ` 500 per quintal of tur, urad and moong sold to procurement agencies
m At 9.5 percent recovery, subject to a premium of ` 1.53 for every 0.1 percent increase in the recovery above 9.5 percent.
http://indiabudget.nic.in
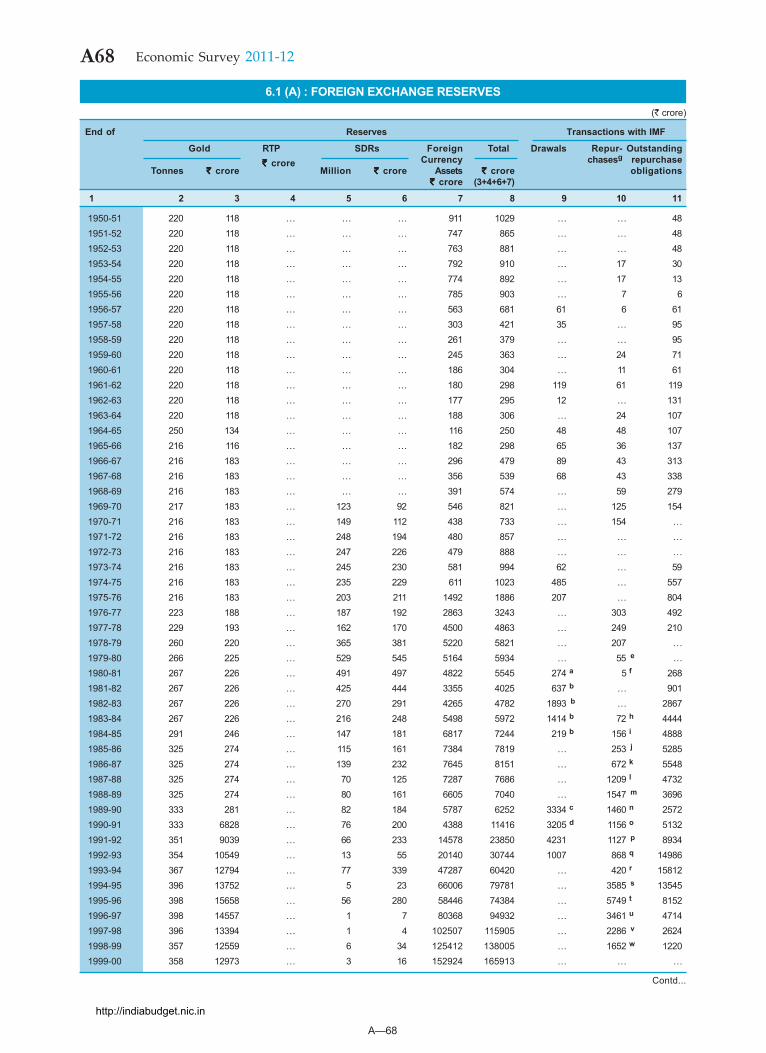
A—68
A68 Economic Survey 2011-12
6.1 (A) : FOREIGN EXCHANGE RESERVES(` crore)
End of Reserves Transactions with IMF
Gold RTP SDRs Foreign Total Drawals Repur- OutstandingCurrency chasesg repurchase
Tonnes `̀̀̀̀ crore`̀̀̀̀ crore
Million `̀̀̀̀ crore Assets `̀̀̀̀ crore obligations`̀̀̀̀ crore (3+4+6+7)
1 2 3 4 5 6 7 8 9 10 11
1950-51 220 118 ... ... ... 911 1029 ... ... 481951-52 220 118 ... ... ... 747 865 ... ... 481952-53 220 118 ... ... ... 763 881 ... ... 481953-54 220 118 ... ... ... 792 910 ... 17 301954-55 220 118 ... ... ... 774 892 ... 17 131955-56 220 118 ... ... ... 785 903 ... 7 61956-57 220 118 ... ... ... 563 681 61 6 611957-58 220 118 ... ... ... 303 421 35 ... 951958-59 220 118 ... ... ... 261 379 ... ... 951959-60 220 118 ... ... ... 245 363 ... 24 711960-61 220 118 ... ... ... 186 304 ... 11 611961-62 220 118 ... ... ... 180 298 119 61 1191962-63 220 118 ... ... ... 177 295 12 ... 1311963-64 220 118 ... ... ... 188 306 ... 24 1071964-65 250 134 ... ... ... 116 250 48 48 1071965-66 216 116 ... ... ... 182 298 65 36 1371966-67 216 183 ... ... ... 296 479 89 43 3131967-68 216 183 ... ... ... 356 539 68 43 3381968-69 216 183 ... ... ... 391 574 ... 59 2791969-70 217 183 ... 123 92 546 821 ... 125 1541970-71 216 183 ... 149 112 438 733 ... 154 ...1971-72 216 183 ... 248 194 480 857 ... ... ...1972-73 216 183 ... 247 226 479 888 ... ... ...1973-74 216 183 ... 245 230 581 994 62 ... 591974-75 216 183 ... 235 229 611 1023 485 ... 5571975-76 216 183 ... 203 211 1492 1886 207 ... 8041976-77 223 188 ... 187 192 2863 3243 ... 303 4921977-78 229 193 ... 162 170 4500 4863 ... 249 2101978-79 260 220 ... 365 381 5220 5821 ... 207 ...1979-80 266 225 ... 529 545 5164 5934 ... 55 e ...1980-81 267 226 ... 491 497 4822 5545 274 a 5 f 2681981-82 267 226 ... 425 444 3355 4025 637 b ... 9011982-83 267 226 ... 270 291 4265 4782 1893 b ... 28671983-84 267 226 ... 216 248 5498 5972 1414 b 72 h 44441984-85 291 246 ... 147 181 6817 7244 219 b 156 i 48881985-86 325 274 ... 115 161 7384 7819 ... 253 j 52851986-87 325 274 ... 139 232 7645 8151 ... 672 k 55481987-88 325 274 ... 70 125 7287 7686 ... 1209 l 47321988-89 325 274 ... 80 161 6605 7040 ... 1547 m 36961989-90 333 281 ... 82 184 5787 6252 3334 c 1460 n 25721990-91 333 6828 ... 76 200 4388 11416 3205 d 1156 o 51321991-92 351 9039 ... 66 233 14578 23850 4231 1127 p 89341992-93 354 10549 ... 13 55 20140 30744 1007 868 q 149861993-94 367 12794 ... 77 339 47287 60420 ... 420 r 158121994-95 396 13752 ... 5 23 66006 79781 ... 3585 s 135451995-96 398 15658 ... 56 280 58446 74384 ... 5749 t 81521996-97 398 14557 ... 1 7 80368 94932 ... 3461 u 47141997-98 396 13394 ... 1 4 102507 115905 ... 2286 v 26241998-99 357 12559 ... 6 34 125412 138005 ... 1652 w 12201999-00 358 12973 ... 3 16 152924 165913 ... ... ...
Contd...
http://indiabudget.nic.in
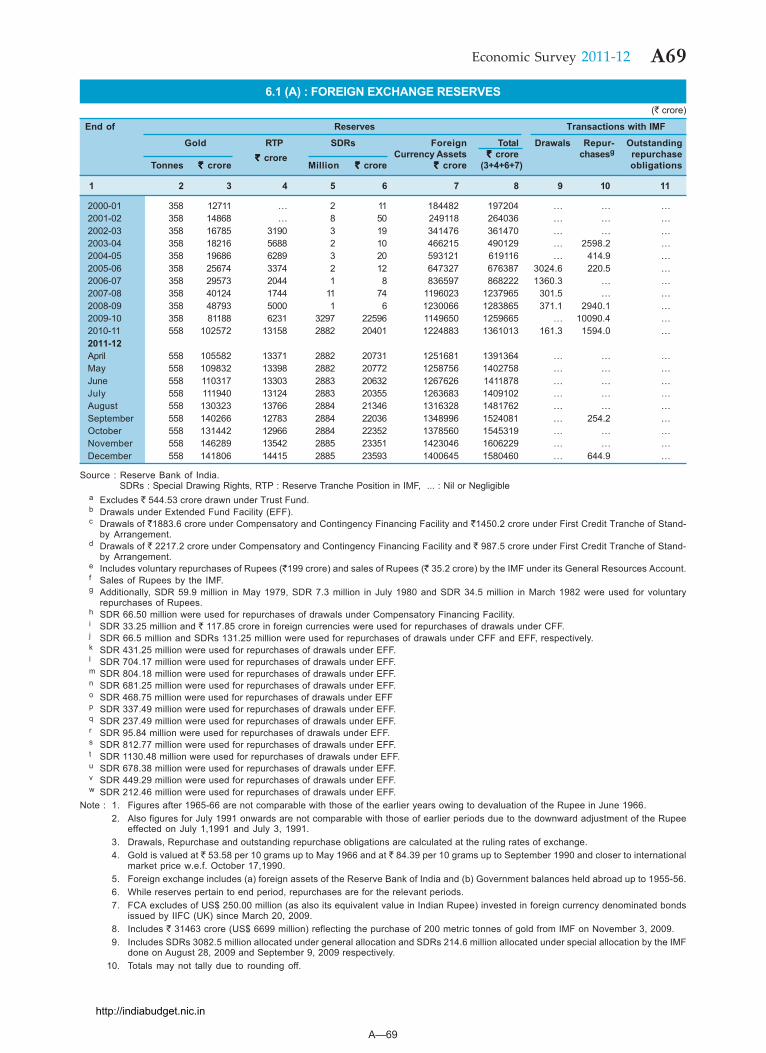
A—69
A69Economic Survey 2011-12
6.1 (A) : FOREIGN EXCHANGE RESERVES(` crore)
End of Reserves Transactions with IMF
Gold RTP SDRs Foreign Total Drawals Repur- OutstandingCurrency Assets `̀̀̀̀ crore chasesg repurchase
Tonnes `̀̀̀̀ crore `̀̀̀̀ crore
Million `̀̀̀̀ crore `̀̀̀̀ crore (3+4+6+7) obligations
1 2 3 4 5 6 7 8 9 10 11
2000-01 358 12711 ... 2 11 184482 197204 ... ... ...2001-02 358 14868 ... 8 50 249118 264036 ... ... ...2002-03 358 16785 3190 3 19 341476 361470 ... ... ...2003-04 358 18216 5688 2 10 466215 490129 ... 2598.2 ...2004-05 358 19686 6289 3 20 593121 619116 ... 414.9 ...2005-06 358 25674 3374 2 12 647327 676387 3024.6 220.5 ...2006-07 358 29573 2044 1 8 836597 868222 1360.3 ... ...2007-08 358 40124 1744 11 74 1196023 1237965 301.5 ... ...2008-09 358 48793 5000 1 6 1230066 1283865 371.1 2940.1 ...2009-10 358 81188 6231 3297 22596 1149650 1259665 ... 10090.4 ...2010-11 558 102572 13158 2882 20401 1224883 1361013 161.3 1594.0 ...2011-12April 558 105582 13371 2882 20731 1251681 1391364 ... ... ...May 558 109832 13398 2882 20772 1258756 1402758 ... ... ...June 558 110317 13303 2883 20632 1267626 1411878 ... ... ...July 558 111940 13124 2883 20355 1263683 1409102 ... ... ...August 558 130323 13766 2884 21346 1316328 1481762 ... ... ...September 558 140266 12783 2884 22036 1348996 1524081 ... 254.2 ...October 558 131442 12966 2884 22352 1378560 1545319 ... ... ...November 558 146289 13542 2885 23351 1423046 1606229 ... ... ...December 558 141806 14415 2885 23593 1400645 1580460 ... 644.9 ...
Source : Reserve Bank of India.SDRs : Special Drawing Rights, RTP : Reserve Tranche Position in IMF, ... : Nil or Negligible
a Excludes ` 544.53 crore drawn under Trust Fund.b Drawals under Extended Fund Facility (EFF).c Drawals of `1883.6 crore under Compensatory and Contingency Financing Facility and `1450.2 crore under First Credit Tranche of Stand-
by Arrangement.d Drawals of ` 2217.2 crore under Compensatory and Contingency Financing Facility and ` 987.5 crore under First Credit Tranche of Stand-
by Arrangement.e Includes voluntary repurchases of Rupees (`199 crore) and sales of Rupees (` 35.2 crore) by the IMF under its General Resources Account.f Sales of Rupees by the IMF.g Additionally, SDR 59.9 million in May 1979, SDR 7.3 million in July 1980 and SDR 34.5 million in March 1982 were used for voluntary
repurchases of Rupees.h SDR 66.50 million were used for repurchases of drawals under Compensatory Financing Facility.i SDR 33.25 million and ` 117.85 crore in foreign currencies were used for repurchases of drawals under CFF.j SDR 66.5 million and SDRs 131.25 million were used for repurchases of drawals under CFF and EFF, respectively.k SDR 431.25 million were used for repurchases of drawals under EFF.l SDR 704.17 million were used for repurchases of drawals under EFF.m SDR 804.18 million were used for repurchases of drawals under EFF.n SDR 681.25 million were used for repurchases of drawals under EFF.o SDR 468.75 million were used for repurchases of drawals under EFFp SDR 337.49 million were used for repurchases of drawals under EFF.q SDR 237.49 million were used for repurchases of drawals under EFF.r SDR 95.84 million were used for repurchases of drawals under EFF.s SDR 812.77 million were used for repurchases of drawals under EFF.t SDR 1130.48 million were used for repurchases of drawals under EFF.u SDR 678.38 million were used for repurchases of drawals under EFF.v SDR 449.29 million were used for repurchases of drawals under EFF.w SDR 212.46 million were used for repurchases of drawals under EFF.
Note : 1. Figures after 1965-66 are not comparable with those of the earlier years owing to devaluation of the Rupee in June 1966.2. Also figures for July 1991 onwards are not comparable with those of earlier periods due to the downward adjustment of the Rupee
effected on July 1,1991 and July 3, 1991.3. Drawals, Repurchase and outstanding repurchase obligations are calculated at the ruling rates of exchange.4. Gold is valued at ` 53.58 per 10 grams up to May 1966 and at ` 84.39 per 10 grams up to September 1990 and closer to international
market price w.e.f. October 17,1990.5. Foreign exchange includes (a) foreign assets of the Reserve Bank of India and (b) Government balances held abroad up to 1955-56.6. While reserves pertain to end period, repurchases are for the relevant periods.7. FCA excludes of US$ 250.00 million (as also its equivalent value in Indian Rupee) invested in foreign currency denominated bonds
issued by IIFC (UK) since March 20, 2009.8. Includes ` 31463 crore (US$ 6699 million) reflecting the purchase of 200 metric tonnes of gold from IMF on November 3, 2009.9. Includes SDRs 3082.5 million allocated under general allocation and SDRs 214.6 million allocated under special allocation by the IMF
done on August 28, 2009 and September 9, 2009 respectively.10. Totals may not tally due to rounding off.
http://indiabudget.nic.in
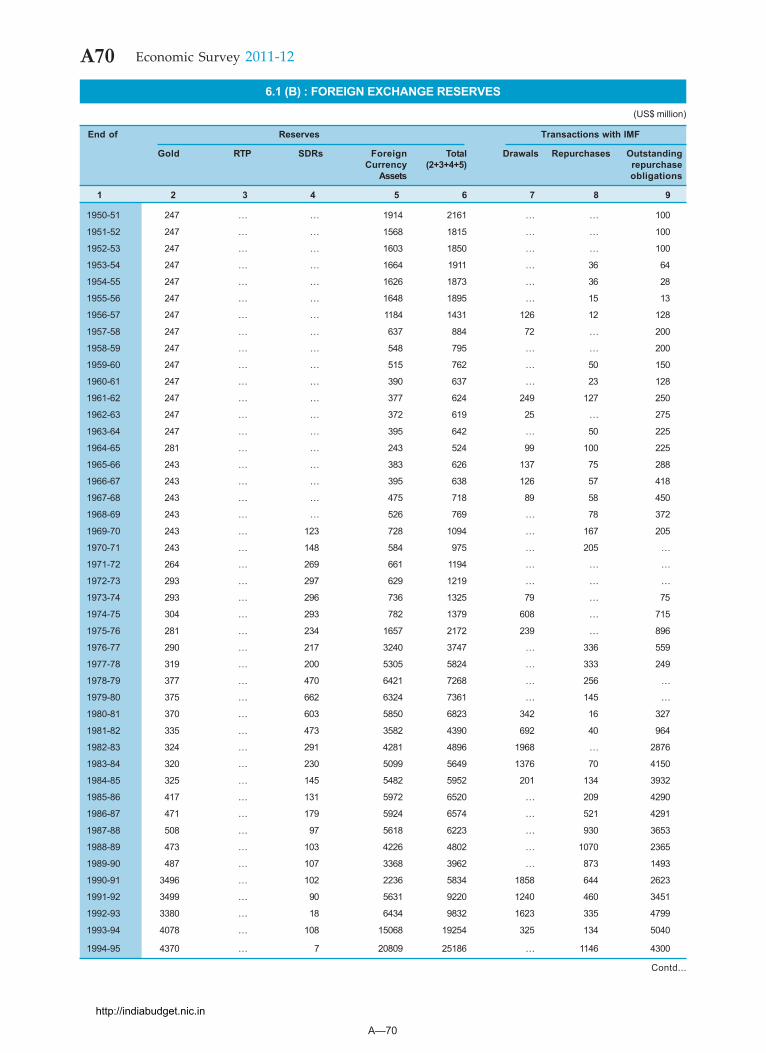
A—70
A70 Economic Survey 2011-12
6.1 (B) : FOREIGN EXCHANGE RESERVES
(US$ million)
End of Reserves Transactions with IMF
Gold RTP SDRs Foreign Total Drawals Repurchases OutstandingCurrency (2+3+4+5) repurchase
Assets obligations
1 2 3 4 5 6 7 8 9
1950-51 247 ... ... 1914 2161 ... ... 100
1951-52 247 ... ... 1568 1815 ... ... 100
1952-53 247 ... ... 1603 1850 ... ... 100
1953-54 247 ... ... 1664 1911 ... 36 64
1954-55 247 ... ... 1626 1873 ... 36 28
1955-56 247 ... ... 1648 1895 ... 15 13
1956-57 247 ... ... 1184 1431 126 12 128
1957-58 247 ... ... 637 884 72 ... 200
1958-59 247 ... ... 548 795 ... ... 200
1959-60 247 ... ... 515 762 ... 50 150
1960-61 247 ... ... 390 637 ... 23 128
1961-62 247 ... ... 377 624 249 127 250
1962-63 247 ... ... 372 619 25 ... 275
1963-64 247 ... ... 395 642 ... 50 225
1964-65 281 ... ... 243 524 99 100 225
1965-66 243 ... ... 383 626 137 75 288
1966-67 243 ... ... 395 638 126 57 418
1967-68 243 ... ... 475 718 89 58 450
1968-69 243 ... ... 526 769 ... 78 372
1969-70 243 ... 123 728 1094 ... 167 205
1970-71 243 ... 148 584 975 ... 205 ...
1971-72 264 ... 269 661 1194 ... ... ...
1972-73 293 ... 297 629 1219 ... ... ...
1973-74 293 ... 296 736 1325 79 ... 75
1974-75 304 ... 293 782 1379 608 ... 715
1975-76 281 ... 234 1657 2172 239 ... 896
1976-77 290 ... 217 3240 3747 ... 336 559
1977-78 319 ... 200 5305 5824 ... 333 249
1978-79 377 ... 470 6421 7268 ... 256 ...
1979-80 375 ... 662 6324 7361 ... 145 ...
1980-81 370 ... 603 5850 6823 342 16 327
1981-82 335 ... 473 3582 4390 692 40 964
1982-83 324 ... 291 4281 4896 1968 ... 2876
1983-84 320 ... 230 5099 5649 1376 70 4150
1984-85 325 ... 145 5482 5952 201 134 3932
1985-86 417 ... 131 5972 6520 ... 209 4290
1986-87 471 ... 179 5924 6574 ... 521 4291
1987-88 508 ... 97 5618 6223 ... 930 3653
1988-89 473 ... 103 4226 4802 ... 1070 2365
1989-90 487 ... 107 3368 3962 ... 873 1493
1990-91 3496 ... 102 2236 5834 1858 644 2623
1991-92 3499 ... 90 5631 9220 1240 460 3451
1992-93 3380 ... 18 6434 9832 1623 335 4799
1993-94 4078 ... 108 15068 19254 325 134 5040
1994-95 4370 ... 7 20809 25186 ... 1146 4300
Contd...
http://indiabudget.nic.in
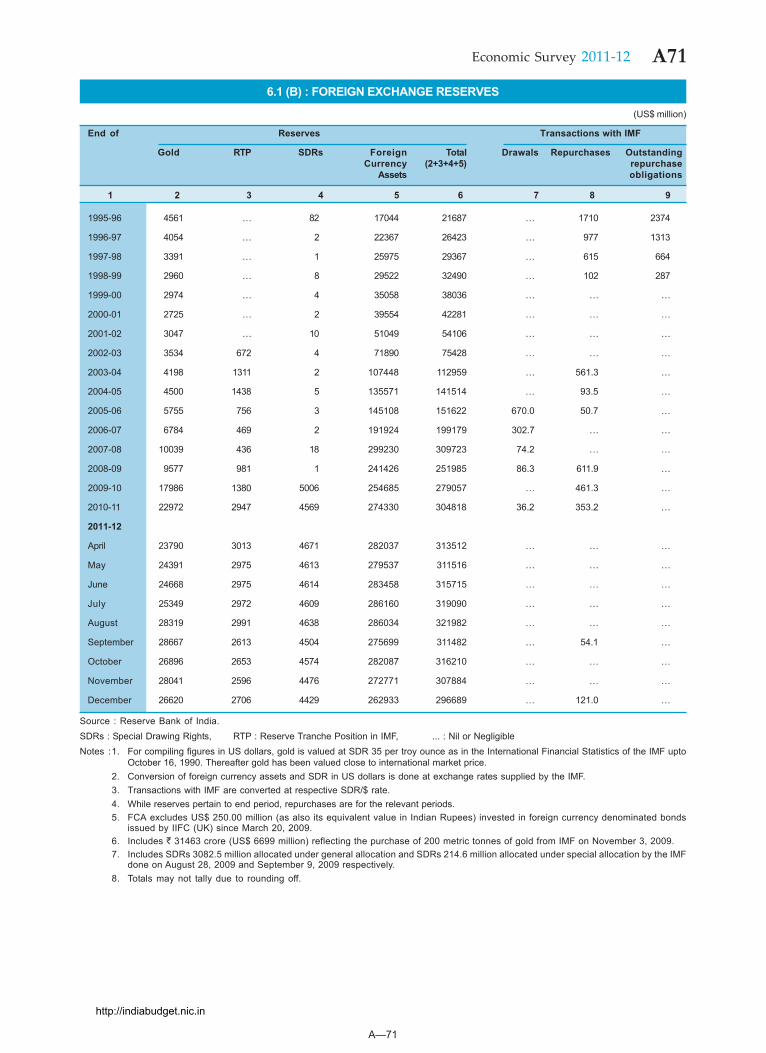
A—71
A71Economic Survey 2011-12
6.1 (B) : FOREIGN EXCHANGE RESERVES
(US$ million)
End of Reserves Transactions with IMF
Gold RTP SDRs Foreign Total Drawals Repurchases OutstandingCurrency (2+3+4+5) repurchase
Assets obligations
1 2 3 4 5 6 7 8 9
1995-96 4561 ... 82 17044 21687 ... 1710 2374
1996-97 4054 ... 2 22367 26423 ... 977 1313
1997-98 3391 ... 1 25975 29367 ... 615 664
1998-99 2960 ... 8 29522 32490 ... 102 287
1999-00 2974 ... 4 35058 38036 ... ... ...
2000-01 2725 ... 2 39554 42281 ... ... ...
2001-02 3047 ... 10 51049 54106 ... ... ...
2002-03 3534 672 4 71890 75428 ... ... ...
2003-04 4198 1311 2 107448 112959 ... 561.3 ...
2004-05 4500 1438 5 135571 141514 ... 93.5 ...
2005-06 5755 756 3 145108 151622 670.0 50.7 ...
2006-07 6784 469 2 191924 199179 302.7 ... ...
2007-08 10039 436 18 299230 309723 74.2 ... ...
2008-09 9577 981 1 241426 251985 86.3 611.9 ...
2009-10 17986 1380 5006 254685 279057 ... 461.3 ...
2010-11 22972 2947 4569 274330 304818 36.2 353.2 ...
2011-12
April 23790 3013 4671 282037 313512 ... ... ...
May 24391 2975 4613 279537 311516 ... ... ...
June 24668 2975 4614 283458 315715 ... ... ...
July 25349 2972 4609 286160 319090 ... ... ...
August 28319 2991 4638 286034 321982 ... ... ...
September 28667 2613 4504 275699 311482 ... 54.1 ...
October 26896 2653 4574 282087 316210 ... ... ...
November 28041 2596 4476 272771 307884 ... ... ...
December 26620 2706 4429 262933 296689 ... 121.0 ...
Source : Reserve Bank of India.SDRs : Special Drawing Rights, RTP : Reserve Tranche Position in IMF, ... : Nil or NegligibleNotes :1. For compiling figures in US dollars, gold is valued at SDR 35 per troy ounce as in the International Financial Statistics of the IMF upto
October 16, 1990. Thereafter gold has been valued close to international market price.2. Conversion of foreign currency assets and SDR in US dollars is done at exchange rates supplied by the IMF.3. Transactions with IMF are converted at respective SDR/$ rate.4. While reserves pertain to end period, repurchases are for the relevant periods.5. FCA excludes US$ 250.00 million (as also its equivalent value in Indian Rupees) invested in foreign currency denominated bonds
issued by IIFC (UK) since March 20, 2009.6. Includes ` 31463 crore (US$ 6699 million) reflecting the purchase of 200 metric tonnes of gold from IMF on November 3, 2009.7. Includes SDRs 3082.5 million allocated under general allocation and SDRs 214.6 million allocated under special allocation by the IMF
done on August 28, 2009 and September 9, 2009 respectively.8. Totals may not tally due to rounding off.
http://indiabudget.nic.in
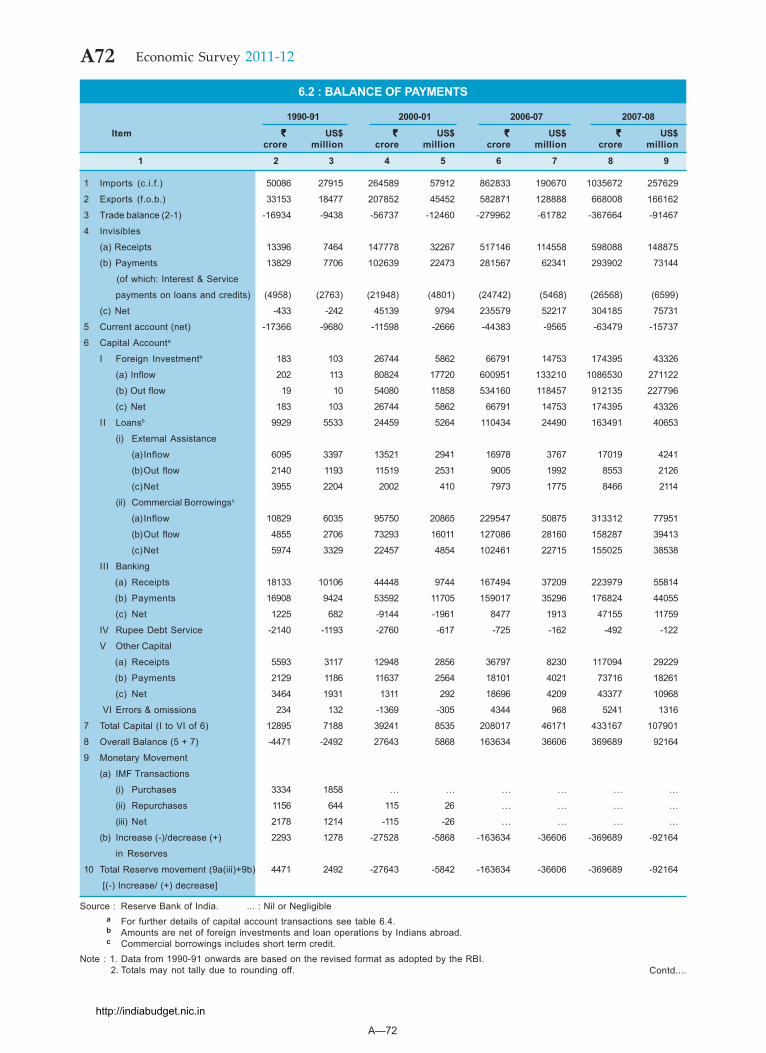
A—72
A72 Economic Survey 2011-12
Contd....
6.2 : BALANCE OF PAYMENTS
1990-91 2000-01 2006-07 2007-08
Item `̀̀̀̀ US$ `̀̀̀̀ US$ `̀̀̀̀ US$ `̀̀̀̀ US$crore million crore million crore million crore million
1 2 3 4 5 6 7 8 9
1 Imports (c.i.f.) 50086 27915 264589 57912 862833 190670 1035672 257629
2 Exports (f.o.b.) 33153 18477 207852 45452 582871 128888 668008 166162
3 Trade balance (2-1) -16934 -9438 -56737 -12460 -279962 -61782 -367664 -91467
4 Invisibles
(a) Receipts 13396 7464 147778 32267 517146 114558 598088 148875
(b) Payments 13829 7706 102639 22473 281567 62341 293902 73144
(of which: Interest & Service
payments on loans and credits) (4958) (2763) (21948) (4801) (24742) (5468) (26568) (6599)
(c) Net -433 -242 45139 9794 235579 52217 304185 75731
5 Current account (net) -17366 -9680 -11598 -2666 -44383 -9565 -63479 -15737
6 Capital Accounta
I Foreign Investmentb 183 103 26744 5862 66791 14753 174395 43326
(a) Inflow 202 113 80824 17720 600951 133210 1086530 271122
(b) Out flow 19 10 54080 11858 534160 118457 912135 227796
(c) Net 183 103 26744 5862 66791 14753 174395 43326
II Loansb 9929 5533 24459 5264 110434 24490 163491 40653
(i) External Assistance
(a)Inflow 6095 3397 13521 2941 16978 3767 17019 4241
(b)Out flow 2140 1193 11519 2531 9005 1992 8553 2126
(c)Net 3955 2204 2002 410 7973 1775 8466 2114
(ii) Commercial Borrowingsc
(a) Inflow 10829 6035 95750 20865 229547 50875 313312 77951
(b)Out flow 4855 2706 73293 16011 127086 28160 158287 39413
(c)Net 5974 3329 22457 4854 102461 22715 155025 38538
III Banking
(a) Receipts 18133 10106 44448 9744 167494 37209 223979 55814
(b) Payments 16908 9424 53592 11705 159017 35296 176824 44055
(c) Net 1225 682 -9144 -1961 8477 1913 47155 11759
IV Rupee Debt Service -2140 -1193 -2760 -617 -725 -162 -492 -122
V Other Capital
(a) Receipts 5593 3117 12948 2856 36797 8230 117094 29229
(b) Payments 2129 1186 11637 2564 18101 4021 73716 18261
(c) Net 3464 1931 1311 292 18696 4209 43377 10968
VI Errors & omissions 234 132 -1369 -305 4344 968 5241 1316
7 Total Capital (I to VI of 6) 12895 7188 39241 8535 208017 46171 433167 107901
8 Overall Balance (5 + 7) -4471 -2492 27643 5868 163634 36606 369689 92164
9 Monetary Movement
(a) IMF Transactions
(i) Purchases 3334 1858 ... ... ... ... ... ...
(ii) Repurchases 1156 644 115 26 ... ... ... ...
(iii) Net 2178 1214 -115 -26 ... ... ... ...
(b) Increase (-)/decrease (+) 2293 1278 -27528 -5868 -163634 -36606 -369689 -92164
in Reserves
10 Total Reserve movement (9a(iii)+9b) 4471 2492 -27643 -5842 -163634 -36606 -369689 -92164
[(-) Increase/ (+) decrease]
Source : Reserve Bank of India. ... : Nil or Negligiblea For further details of capital account transactions see table 6.4.b Amounts are net of foreign investments and loan operations by Indians abroad.c Commercial borrowings includes short term credit.
Note : 1. Data from 1990-91 onwards are based on the revised format as adopted by the RBI. 2. Totals may not tally due to rounding off.
http://indiabudget.nic.in
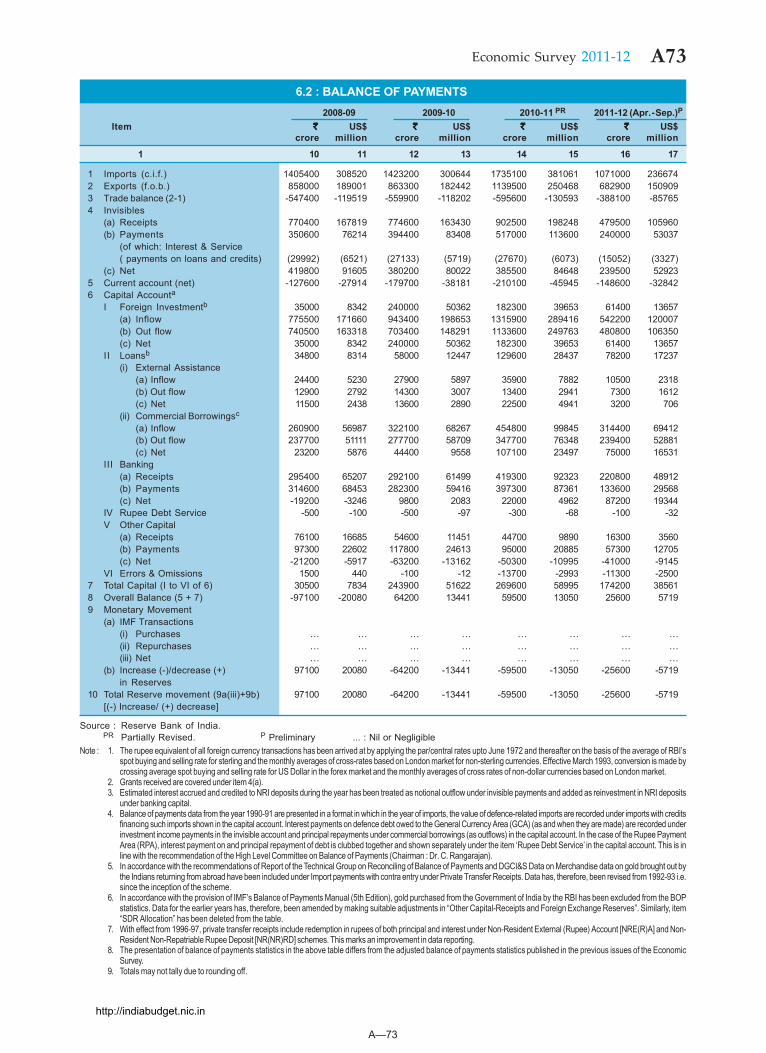
A—73
A73Economic Survey 2011-12
6.2 : BALANCE OF PAYMENTS2008-09 2009-10 2010-11 PR 2011-12 (Apr.-Sep.)P
Item `̀̀̀̀ US$ `̀̀̀̀ US$ `̀̀̀̀ US$ `̀̀̀̀ US$crore million crore million crore million crore million
1 10 11 12 13 14 15 16 17
1 Imports (c.i.f.) 1405400 308520 1423200 300644 1735100 381061 1071000 2366742 Exports (f.o.b.) 858000 189001 863300 182442 1139500 250468 682900 1509093 Trade balance (2-1) -547400 -119519 -559900 -118202 -595600 -130593 -388100 -857654 Invisibles
(a) Receipts 770400 167819 774600 163430 902500 198248 479500 105960(b) Payments 350600 76214 394400 83408 517000 113600 240000 53037
(of which: Interest & Service( payments on loans and credits) (29992) (6521) (27133) (5719) (27670) (6073) (15052) (3327)
(c) Net 419800 91605 380200 80022 385500 84648 239500 529235 Current account (net) -127600 -27914 -179700 -38181 -210100 -45945 -148600 -328426 Capital Accounta
I Foreign Investmentb 35000 8342 240000 50362 182300 39653 61400 13657(a) Inflow 775500 171660 943400 198653 1315900 289416 542200 120007(b) Out flow 740500 163318 703400 148291 1133600 249763 480800 106350(c) Net 35000 8342 240000 50362 182300 39653 61400 13657
II Loansb 34800 8314 58000 12447 129600 28437 78200 17237(i) External Assistance
(a) Inflow 24400 5230 27900 5897 35900 7882 10500 2318(b) Out flow 12900 2792 14300 3007 13400 2941 7300 1612(c) Net 11500 2438 13600 2890 22500 4941 3200 706
(ii) Commercial Borrowingsc
(a) Inflow 260900 56987 322100 68267 454800 99845 314400 69412(b) Out flow 237700 51111 277700 58709 347700 76348 239400 52881(c) Net 23200 5876 44400 9558 107100 23497 75000 16531
III Banking(a) Receipts 295400 65207 292100 61499 419300 92323 220800 48912(b) Payments 314600 68453 282300 59416 397300 87361 133600 29568(c) Net -19200 -3246 9800 2083 22000 4962 87200 19344
IV Rupee Debt Service -500 -100 -500 -97 -300 -68 -100 -32V Other Capital
(a) Receipts 76100 16685 54600 11451 44700 9890 16300 3560(b) Payments 97300 22602 117800 24613 95000 20885 57300 12705(c) Net -21200 -5917 -63200 -13162 -50300 -10995 -41000 -9145
VI Errors & Omissions 1500 440 -100 -12 -13700 -2993 -11300 -25007 Total Capital (I to VI of 6) 30500 7834 243900 51622 269600 58995 174200 385618 Overall Balance (5 + 7) -97100 -20080 64200 13441 59500 13050 25600 57199 Monetary Movement
(a) IMF Transactions(i) Purchases ... ... ... ... ... ... ... ...(ii) Repurchases ... ... ... ... ... ... ... ...(iii) Net ... ... ... ... ... ... ... ...
(b) Increase (-)/decrease (+) 97100 20080 -64200 -13441 -59500 -13050 -25600 -5719in Reserves
10 Total Reserve movement (9a(iii)+9b) 97100 20080 -64200 -13441 -59500 -13050 -25600 -5719[(-) Increase/ (+) decrease]
Source : Reserve Bank of India. PR Partially Revised. P Preliminary ... : Nil or Negligible
Note : 1. The rupee equivalent of all foreign currency transactions has been arrived at by applying the par/central rates upto June 1972 and thereafter on the basis of the average of RBI’sspot buying and selling rate for sterling and the monthly averages of cross-rates based on London market for non-sterling currencies. Effective March 1993, conversion is made bycrossing average spot buying and selling rate for US Dollar in the forex market and the monthly averages of cross rates of non-dollar currencies based on London market.
2. Grants received are covered under item 4(a).3. Estimated interest accrued and credited to NRI deposits during the year has been treated as notional outflow under invisible payments and added as reinvestment in NRI deposits
under banking capital.4. Balance of payments data from the year 1990-91 are presented in a format in which in the year of imports, the value of defence-related imports are recorded under imports with credits
financing such imports shown in the capital account. Interest payments on defence debt owed to the General Currency Area (GCA) (as and when they are made) are recorded underinvestment income payments in the invisible account and principal repayments under commercial borrowings (as outflows) in the capital account. In the case of the Rupee PaymentArea (RPA), interest payment on and principal repayment of debt is clubbed together and shown separately under the item ‘Rupee Debt Service’ in the capital account. This is inline with the recommendation of the High Level Committee on Balance of Payments (Chairman : Dr. C. Rangarajan).
5. In accordance with the recommendations of Report of the Technical Group on Reconciling of Balance of Payments and DGCI&S Data on Merchandise data on gold brought out bythe Indians returning from abroad have been included under Import payments with contra entry under Private Transfer Receipts. Data has, therefore, been revised from 1992-93 i.e.since the inception of the scheme.
6. In accordance with the provision of IMF’s Balance of Payments Manual (5th Edition), gold purchased from the Government of India by the RBI has been excluded from the BOPstatistics. Data for the earlier years has, therefore, been amended by making suitable adjustments in “Other Capital-Receipts and Foreign Exchange Reserves”. Similarly, item“SDR Allocation” has been deleted from the table.
7. With effect from 1996-97, private transfer receipts include redemption in rupees of both principal and interest under Non-Resident External (Rupee) Account [NRE(R)A] and Non-Resident Non-Repatriable Rupee Deposit [NR(NR)RD] schemes. This marks an improvement in data reporting.
8. The presentation of balance of payments statistics in the above table differs from the adjusted balance of payments statistics published in the previous issues of the EconomicSurvey.
9. Totals may not tally due to rounding off.
http://indiabudget.nic.in
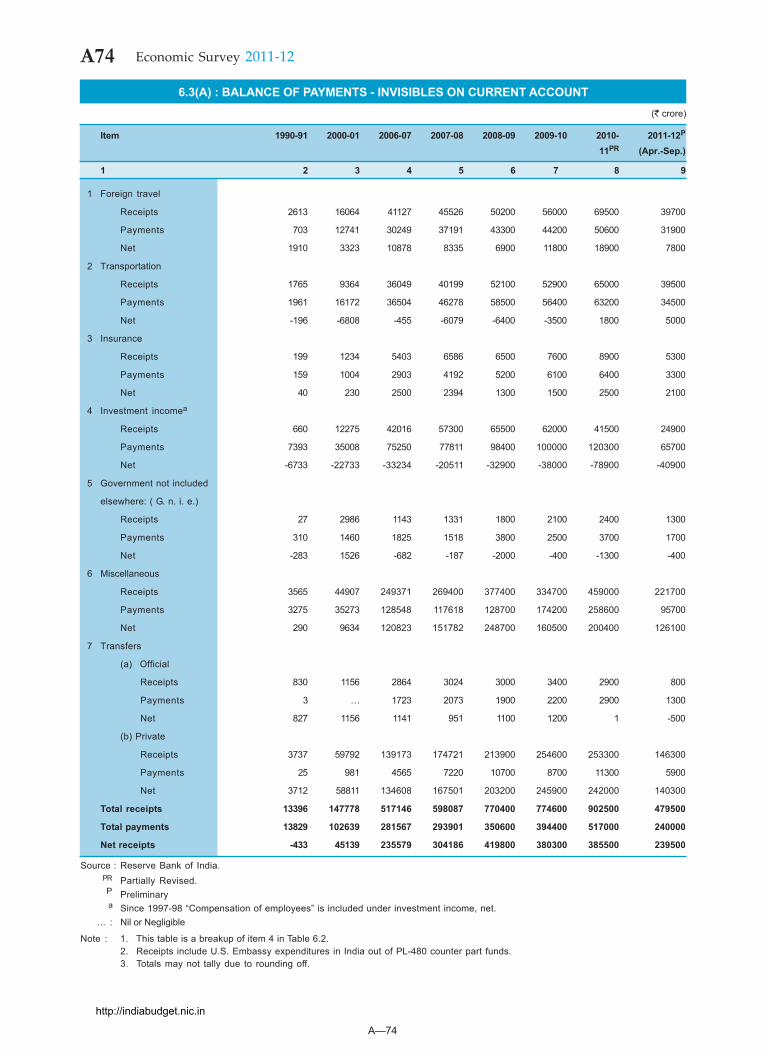
A—74
A74 Economic Survey 2011-12
6.3(A) : BALANCE OF PAYMENTS - INVISIBLES ON CURRENT ACCOUNT(` crore)
Item 1990-91 2000-01 2006-07 2007-08 2008-09 2009-10 2010- 2011-12P
11PR (Apr.-Sep.)
1 2 3 4 5 6 7 8 9
1 Foreign travel
Receipts 2613 16064 41127 45526 50200 56000 69500 39700
Payments 703 12741 30249 37191 43300 44200 50600 31900
Net 1910 3323 10878 8335 6900 11800 18900 7800
2 Transportation
Receipts 1765 9364 36049 40199 52100 52900 65000 39500
Payments 1961 16172 36504 46278 58500 56400 63200 34500
Net -196 -6808 -455 -6079 -6400 -3500 1800 5000
3 Insurance
Receipts 199 1234 5403 6586 6500 7600 8900 5300
Payments 159 1004 2903 4192 5200 6100 6400 3300
Net 40 230 2500 2394 1300 1500 2500 2100
4 Investment incomea
Receipts 660 12275 42016 57300 65500 62000 41500 24900
Payments 7393 35008 75250 77811 98400 100000 120300 65700
Net -6733 -22733 -33234 -20511 -32900 -38000 -78900 -40900
5 Government not included
elsewhere: ( G. n. i. e.)
Receipts 27 2986 1143 1331 1800 2100 2400 1300
Payments 310 1460 1825 1518 3800 2500 3700 1700
Net -283 1526 -682 -187 -2000 -400 -1300 -400
6 Miscellaneous
Receipts 3565 44907 249371 269400 377400 334700 459000 221700
Payments 3275 35273 128548 117618 128700 174200 258600 95700
Net 290 9634 120823 151782 248700 160500 200400 126100
7 Transfers
(a) Official
Receipts 830 1156 2864 3024 3000 3400 2900 800
Payments 3 ... 1723 2073 1900 2200 2900 1300
Net 827 1156 1141 951 1100 1200 1 -500
(b) Private
Receipts 3737 59792 139173 174721 213900 254600 253300 146300
Payments 25 981 4565 7220 10700 8700 11300 5900
Net 3712 58811 134608 167501 203200 245900 242000 140300
Total receipts 13396 147778 517146 598087 770400 774600 902500 479500
Total payments 13829 102639 281567 293901 350600 394400 517000 240000
Net receipts -433 45139 235579 304186 419800 380300 385500 239500
Source : Reserve Bank of India.PR Partially Revised.P Preliminarya Since 1997-98 “Compensation of employees” is included under investment income, net.
... : Nil or Negligible
Note : 1. This table is a breakup of item 4 in Table 6.2.2. Receipts include U.S. Embassy expenditures in India out of PL-480 counter part funds.3. Totals may not tally due to rounding off.
http://indiabudget.nic.in
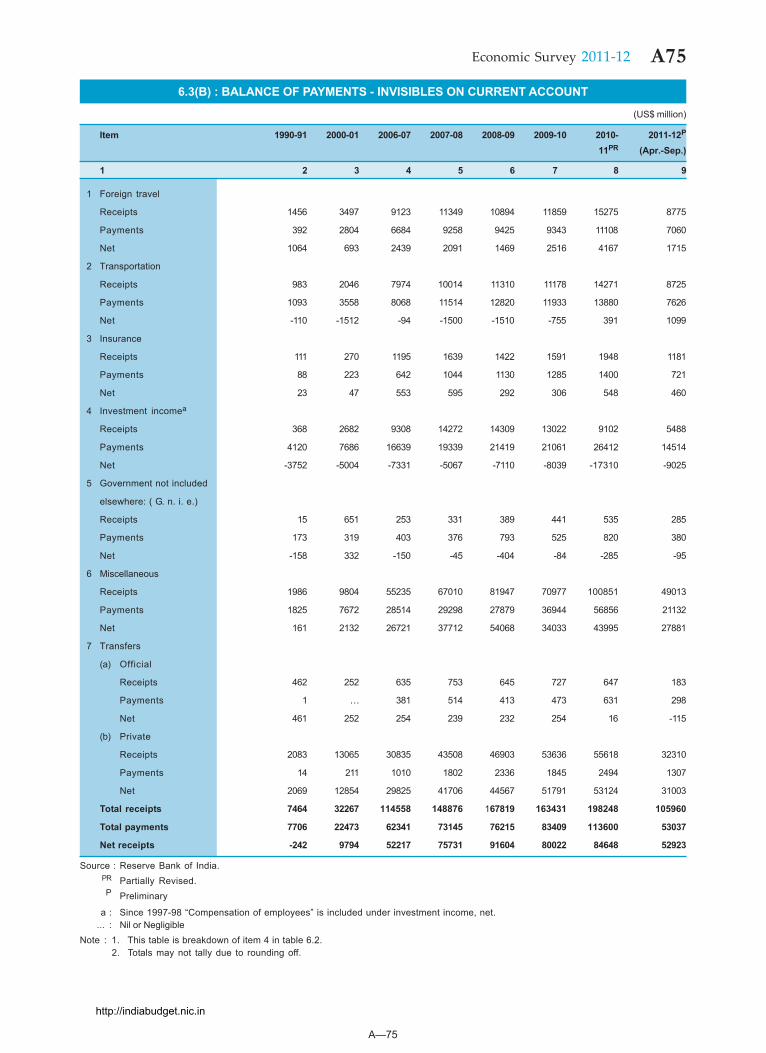
A—75
A75Economic Survey 2011-12
6.3(B) : BALANCE OF PAYMENTS - INVISIBLES ON CURRENT ACCOUNT
(US$ million)
Item 1990-91 2000-01 2006-07 2007-08 2008-09 2009-10 2010- 2011-12P
11PR (Apr.-Sep.)
1 2 3 4 5 6 7 8 9
1 Foreign travel
Receipts 1456 3497 9123 11349 10894 11859 15275 8775
Payments 392 2804 6684 9258 9425 9343 11108 7060
Net 1064 693 2439 2091 1469 2516 4167 1715
2 Transportation
Receipts 983 2046 7974 10014 11310 11178 14271 8725
Payments 1093 3558 8068 11514 12820 11933 13880 7626
Net -110 -1512 -94 -1500 -1510 -755 391 1099
3 Insurance
Receipts 111 270 1195 1639 1422 1591 1948 1181
Payments 88 223 642 1044 1130 1285 1400 721
Net 23 47 553 595 292 306 548 460
4 Investment incomea
Receipts 368 2682 9308 14272 14309 13022 9102 5488
Payments 4120 7686 16639 19339 21419 21061 26412 14514
Net -3752 -5004 -7331 -5067 -7110 -8039 -17310 -9025
5 Government not included
elsewhere: ( G. n. i. e.)
Receipts 15 651 253 331 389 441 535 285
Payments 173 319 403 376 793 525 820 380
Net -158 332 -150 -45 -404 -84 -285 -95
6 Miscellaneous
Receipts 1986 9804 55235 67010 81947 70977 100851 49013
Payments 1825 7672 28514 29298 27879 36944 56856 21132
Net 161 2132 26721 37712 54068 34033 43995 27881
7 Transfers
(a) Official
Receipts 462 252 635 753 645 727 647 183
Payments 1 ... 381 514 413 473 631 298
Net 461 252 254 239 232 254 16 -115
(b) Private
Receipts 2083 13065 30835 43508 46903 53636 55618 32310
Payments 14 211 1010 1802 2336 1845 2494 1307
Net 2069 12854 29825 41706 44567 51791 53124 31003
Total receipts 7464 32267 114558 148876 167819 163431 198248 105960
Total payments 7706 22473 62341 73145 76215 83409 113600 53037
Net receipts -242 9794 52217 75731 91604 80022 84648 52923
Source : Reserve Bank of India.PR Partially Revised.P Preliminary
a : Since 1997-98 “Compensation of employees” is included under investment income, net.... : Nil or Negligible
Note : 1. This table is breakdown of item 4 in table 6.2.2. Totals may not tally due to rounding off.
http://indiabudget.nic.in
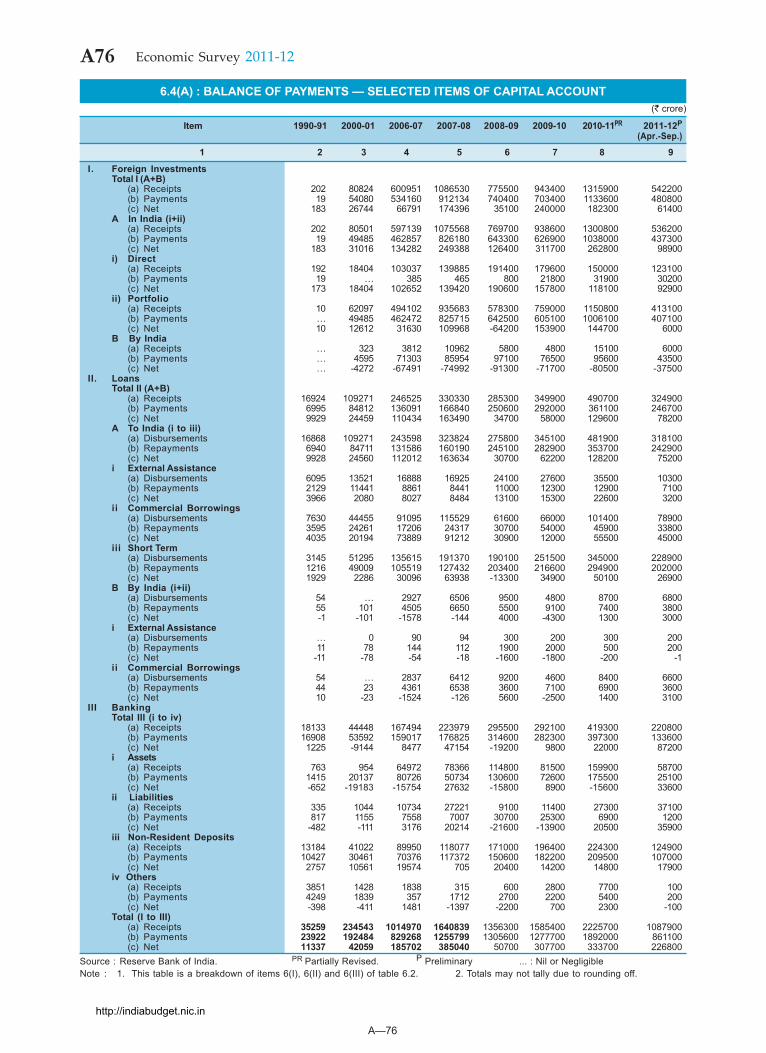
A—76
A76 Economic Survey 2011-12
6.4(A) : BALANCE OF PAYMENTS — SELECTED ITEMS OF CAPITAL ACCOUNT(` crore)
Item 1990-91 2000-01 2006-07 2007-08 2008-09 2009-10 2010-11PR 2011-12P
(Apr.-Sep.)
1 2 3 4 5 6 7 8 9
I. Foreign InvestmentsTotal I (A+B)
(a) Receipts 202 80824 600951 1086530 775500 943400 1315900 542200(b) Payments 19 54080 534160 912134 740400 703400 1133600 480800(c) Net 183 26744 66791 174396 35100 240000 182300 61400
A In India (i+ii)(a) Receipts 202 80501 597139 1075568 769700 938600 1300800 536200(b) Payments 19 49485 462857 826180 643300 626900 1038000 437300(c) Net 183 31016 134282 249388 126400 311700 262800 98900
i) Direct(a) Receipts 192 18404 103037 139885 191400 179600 150000 123100(b) Payments 19 ... 385 465 800 21800 31900 30200(c) Net 173 18404 102652 139420 190600 157800 118100 92900
ii) Portfolio(a) Receipts 10 62097 494102 935683 578300 759000 1150800 413100(b) Payments ... 49485 462472 825715 642500 605100 1006100 407100(c) Net 10 12612 31630 109968 -64200 153900 144700 6000
B By India(a) Receipts ... 323 3812 10962 5800 4800 15100 6000(b) Payments ... 4595 71303 85954 97100 76500 95600 43500(c) Net ... -4272 -67491 -74992 -91300 -71700 -80500 -37500
II. LoansTotal II (A+B)
(a) Receipts 16924 109271 246525 330330 285300 349900 490700 324900(b) Payments 6995 84812 136091 166840 250600 292000 361100 246700(c) Net 9929 24459 110434 163490 34700 58000 129600 78200
A To India (i to iii)(a) Disbursements 16868 109271 243598 323824 275800 345100 481900 318100(b) Repayments 6940 84711 131586 160190 245100 282900 353700 242900(c) Net 9928 24560 112012 163634 30700 62200 128200 75200
i External Assistance(a) Disbursements 6095 13521 16888 16925 24100 27600 35500 10300(b) Repayments 2129 11441 8861 8441 11000 12300 12900 7100(c) Net 3966 2080 8027 8484 13100 15300 22600 3200
ii Commercial Borrowings(a) Disbursements 7630 44455 91095 115529 61600 66000 101400 78900(b) Repayments 3595 24261 17206 24317 30700 54000 45900 33800(c) Net 4035 20194 73889 91212 30900 12000 55500 45000
iii Short Term(a) Disbursements 3145 51295 135615 191370 190100 251500 345000 228900(b) Repayments 1216 49009 105519 127432 203400 216600 294900 202000(c) Net 1929 2286 30096 63938 -13300 34900 50100 26900
B By India (i+ii)(a) Disbursements 54 ... 2927 6506 9500 4800 8700 6800(b) Repayments 55 101 4505 6650 5500 9100 7400 3800(c) Net -1 -101 -1578 -144 4000 -4300 1300 3000
i External Assistance(a) Disbursements ... 0 90 94 300 200 300 200(b) Repayments 11 78 144 112 1900 2000 500 200(c) Net -11 -78 -54 -18 -1600 -1800 -200 -1
ii Commercial Borrowings(a) Disbursements 54 ... 2837 6412 9200 4600 8400 6600(b) Repayments 44 23 4361 6538 3600 7100 6900 3600(c) Net 10 -23 -1524 -126 5600 -2500 1400 3100
III BankingTotal III (i to iv)
(a) Receipts 18133 44448 167494 223979 295500 292100 419300 220800(b) Payments 16908 53592 159017 176825 314600 282300 397300 133600(c) Net 1225 -9144 8477 47154 -19200 9800 22000 87200
i Assets(a) Receipts 763 954 64972 78366 114800 81500 159900 58700(b) Payments 1415 20137 80726 50734 130600 72600 175500 25100(c) Net -652 -19183 -15754 27632 -15800 8900 -15600 33600
ii Liabilities(a) Receipts 335 1044 10734 27221 9100 11400 27300 37100(b) Payments 817 1155 7558 7007 30700 25300 6900 1200(c) Net -482 -111 3176 20214 -21600 -13900 20500 35900
iii Non-Resident Deposits(a) Receipts 13184 41022 89950 118077 171000 196400 224300 124900(b) Payments 10427 30461 70376 117372 150600 182200 209500 107000(c) Net 2757 10561 19574 705 20400 14200 14800 17900
iv Others(a) Receipts 3851 1428 1838 315 600 2800 7700 100(b) Payments 4249 1839 357 1712 2700 2200 5400 200(c) Net -398 -411 1481 -1397 -2200 700 2300 -100
Total (I to III)(a) Receipts 35259 234543 1014970 1640839 1356300 1585400 2225700 1087900(b) Payments 23922 192484 829268 1255799 1305600 1277700 1892000 861100(c) Net 11337 42059 185702 385040 50700 307700 333700 226800
Source : Reserve Bank of India. PR Partially Revised. P Preliminary ... : Nil or NegligibleNote : 1. This table is a breakdown of items 6(I), 6(II) and 6(III) of table 6.2. 2. Totals may not tally due to rounding off.
http://indiabudget.nic.in
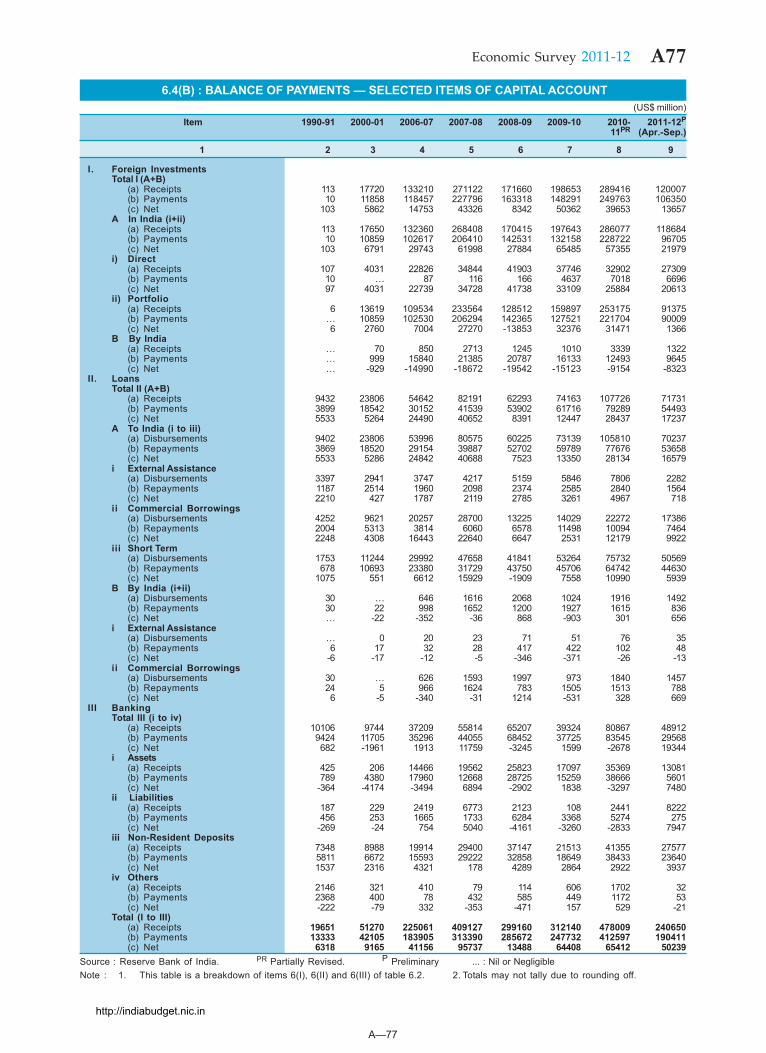
A—77
A77Economic Survey 2011-12
6.4(B) : BALANCE OF PAYMENTS — SELECTED ITEMS OF CAPITAL ACCOUNT(US$ million)
Item 1990-91 2000-01 2006-07 2007-08 2008-09 2009-10 2010- 2011-12P
11PR (Apr.-Sep.)
1 2 3 4 5 6 7 8 9
I. Foreign InvestmentsTotal I (A+B)
(a) Receipts 113 17720 133210 271122 171660 198653 289416 120007(b) Payments 10 11858 118457 227796 163318 148291 249763 106350(c) Net 103 5862 14753 43326 8342 50362 39653 13657
A In India (i+ii)(a) Receipts 113 17650 132360 268408 170415 197643 286077 118684(b) Payments 10 10859 102617 206410 142531 132158 228722 96705(c) Net 103 6791 29743 61998 27884 65485 57355 21979
i) Direct(a) Receipts 107 4031 22826 34844 41903 37746 32902 27309(b) Payments 10 ... 87 116 166 4637 7018 6696(c) Net 97 4031 22739 34728 41738 33109 25884 20613
ii) Portfolio(a) Receipts 6 13619 109534 233564 128512 159897 253175 91375(b) Payments ... 10859 102530 206294 142365 127521 221704 90009(c) Net 6 2760 7004 27270 -13853 32376 31471 1366
B By India(a) Receipts ... 70 850 2713 1245 1010 3339 1322(b) Payments ... 999 15840 21385 20787 16133 12493 9645(c) Net ... -929 -14990 -18672 -19542 -15123 -9154 -8323
II. LoansTotal II (A+B)
(a) Receipts 9432 23806 54642 82191 62293 74163 107726 71731(b) Payments 3899 18542 30152 41539 53902 61716 79289 54493(c) Net 5533 5264 24490 40652 8391 12447 28437 17237
A To India (i to iii)(a) Disbursements 9402 23806 53996 80575 60225 73139 105810 70237(b) Repayments 3869 18520 29154 39887 52702 59789 77676 53658(c) Net 5533 5286 24842 40688 7523 13350 28134 16579
i External Assistance(a) Disbursements 3397 2941 3747 4217 5159 5846 7806 2282(b) Repayments 1187 2514 1960 2098 2374 2585 2840 1564(c) Net 2210 427 1787 2119 2785 3261 4967 718
ii Commercial Borrowings(a) Disbursements 4252 9621 20257 28700 13225 14029 22272 17386(b) Repayments 2004 5313 3814 6060 6578 11498 10094 7464(c) Net 2248 4308 16443 22640 6647 2531 12179 9922
iii Short Term(a) Disbursements 1753 11244 29992 47658 41841 53264 75732 50569(b) Repayments 678 10693 23380 31729 43750 45706 64742 44630(c) Net 1075 551 6612 15929 -1909 7558 10990 5939
B By India (i+ii)(a) Disbursements 30 ... 646 1616 2068 1024 1916 1492(b) Repayments 30 22 998 1652 1200 1927 1615 836(c) Net ... -22 -352 -36 868 -903 301 656
i External Assistance(a) Disbursements ... 0 20 23 71 51 76 35(b) Repayments 6 17 32 28 417 422 102 48(c) Net -6 -17 -12 -5 -346 -371 -26 -13
ii Commercial Borrowings(a) Disbursements 30 ... 626 1593 1997 973 1840 1457(b) Repayments 24 5 966 1624 783 1505 1513 788(c) Net 6 -5 -340 -31 1214 -531 328 669
III BankingTotal III (i to iv)
(a) Receipts 10106 9744 37209 55814 65207 39324 80867 48912(b) Payments 9424 11705 35296 44055 68452 37725 83545 29568(c) Net 682 -1961 1913 11759 -3245 1599 -2678 19344
i Assets(a) Receipts 425 206 14466 19562 25823 17097 35369 13081(b) Payments 789 4380 17960 12668 28725 15259 38666 5601(c) Net -364 -4174 -3494 6894 -2902 1838 -3297 7480
ii Liabilities(a) Receipts 187 229 2419 6773 2123 108 2441 8222(b) Payments 456 253 1665 1733 6284 3368 5274 275(c) Net -269 -24 754 5040 -4161 -3260 -2833 7947
iii Non-Resident Deposits(a) Receipts 7348 8988 19914 29400 37147 21513 41355 27577(b) Payments 5811 6672 15593 29222 32858 18649 38433 23640(c) Net 1537 2316 4321 178 4289 2864 2922 3937
iv Others(a) Receipts 2146 321 410 79 114 606 1702 32(b) Payments 2368 400 78 432 585 449 1172 53(c) Net -222 -79 332 -353 -471 157 529 -21
Total (I to III)(a) Receipts 19651 51270 225061 409127 299160 312140 478009 240650(b) Payments 13333 42105 183905 313390 285672 247732 412597 190411(c) Net 6318 9165 41156 95737 13488 64408 65412 50239
Source : Reserve Bank of India. PR Partially Revised. P Preliminary ... : Nil or NegligibleNote : 1. This table is a breakdown of items 6(I), 6(II) and 6(III) of table 6.2. 2. Totals may not tally due to rounding off.
http://indiabudget.nic.in
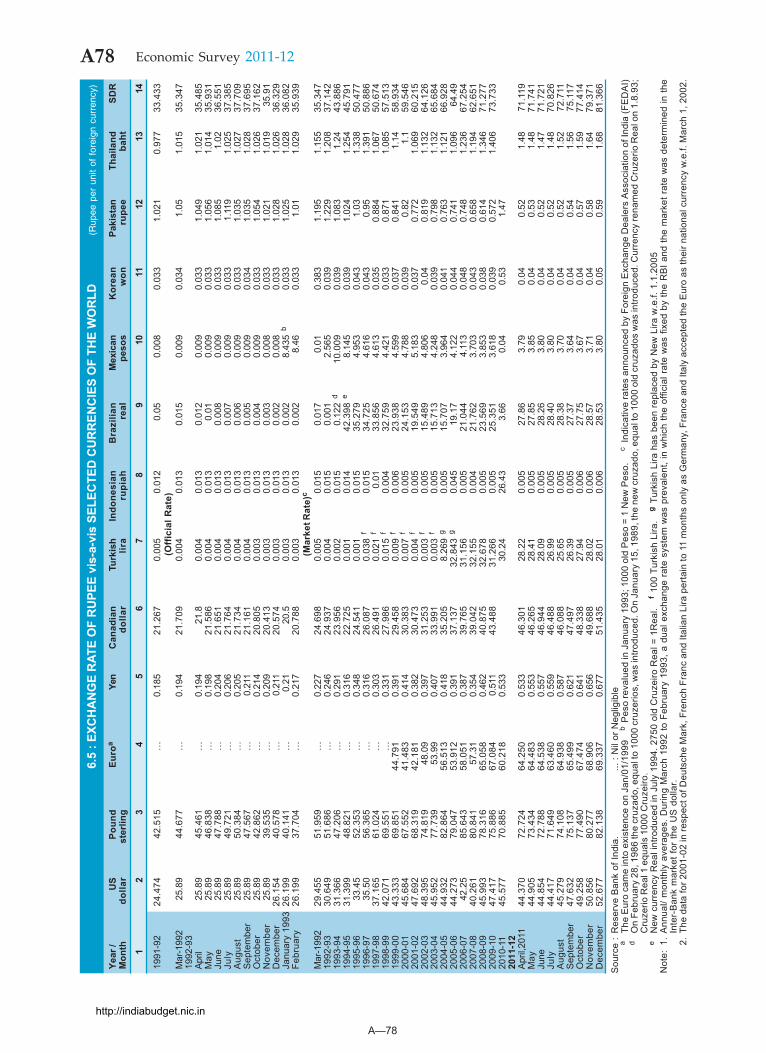
A—78
A78 Economic Survey 2011-12
(Rup
ee p
er u
nit
of f
orei
gn c
urre
ncy)
6.5
: EXC
HA
NG
E R
ATE
OF
RU
PEE
vis-
a-vi
s SE
LEC
TED
CU
RR
ENC
IES
OF
THE
WO
RLD
Year
/U
SPo
und
Euro
aYe
nC
anad
ian
Turk
ish
Indo
nesi
anB
razi
lian
Mex
ican
Kor
ean
Paki
stan
Thai
land
SDR
Mon
thdo
llar
ste
rling
dolla
rlir
aru
piah
real
peso
sw
onru
pee
baht
1
2
3
4
56
78
910
1112
1314
1991
-92
24.4
7442
.515
…0.
185
21.2
670.
005
0.01
20.
050.
008
0.03
31.
021
0.97
733
.433
(Off
icia
l Rat
e)M
ar-1
992
25.8
944
.677
…0.
194
21.7
090.
004
0.01
30.
015
0.00
90.
034
1.05
1.01
535
.347
1992
-93
April
25.8
945
.461
…0.
194
21.8
0.00
40.
013
0.01
20.
009
0.03
31.
049
1.02
135
.485
May
25.8
946
.838
…0.
198
21.5
860.
004
0.01
30.
010.
009
0.03
31.
056
1.01
435
.931
June
25.8
947
.788
…0.
204
21.6
510.
004
0.01
30.
008
0.00
90.
033
1.08
51.
0236
.551
July
25.8
949
.721
…0.
206
21.7
640.
004
0.01
30.
007
0.00
90.
033
1.11
91.
025
37.3
85A
ugus
t25
.89
50.3
84…
0.20
521
.734
0.00
40.
013
0.00
60.
009
0.03
31.
035
1.02
737
.709
Sep
tem
ber
25.8
947
.567
…0.
211
21.1
610.
004
0.01
30.
005
0.00
90.
034
1.03
51.
028
37.6
95O
ctob
er25
.89
42.8
62…
0.21
420
.805
0.00
30.
013
0.00
40.
009
0.03
31.
054
1.02
637
.162
Nov
embe
r25
.89
39.5
35…
0.20
920
.413
0.00
30.
013
0.00
30.
008
0.03
31.
021
1.01
935
.91
Dec
embe
r26
.154
40.5
78…
0.21
120
.574
0.00
30.
013
0.00
20.
008
0.03
31.
028
1.02
636
.329
Janu
ary
1993
26.1
9940
.141
…0.
2120
.50.
003
0.01
30.
002
8.43
5b
0.03
31.
025
1.02
836
.082
Febr
uary
26.1
9937
.704
…0.
217
20.7
880.
003
0.01
30.
002
8.46
0.03
31.
011.
029
35.9
39(M
arke
t Rat
e)c
Mar
-199
229
.455
51.9
59…
0.22
724
.698
0.00
50.
015
0.01
70.
010.
383
1.19
51.
155
35.3
4719
92-9
330
.649
51.6
86…
0.24
624
.937
0.00
40.
015
0.00
12.
565
0.03
91.
229
1.20
837
.142
1993
-94
31.3
6647
.206
…0.
291
23.9
560.
002
0.01
50.
122
d10
.009
0.03
91.
083
1.24
43.8
8619
94-9
531
.399
48.8
21…
0.31
622
.725
0.00
10.
014
42.3
98e
8.14
50.
039
1.02
41.
254
45.7
9119
95-9
633
.45
52.3
53…
0.34
824
.541
0.00
10.
015
35.2
794.
953
0.04
31.
031.
338
50.4
7719
96-9
735
.50
56.3
65…
0.31
626
.087
0.03
8f
0.01
534
.725
4.61
60.
043
0.95
1.39
150
.886
1997
-98
37.1
6561
.024
…0.
303
26.4
910.
021
f0.
0133
.856
4.61
30.
035
0.88
41.
067
50.6
7419
98-9
942
.071
69.5
51…
0.33
127
.986
0.01
5f
0.00
432
.759
4.42
10.
033
0.87
11.
085
57.5
1319
99-0
043
.333
69.8
5144
.791
0.39
129
.458
0.00
9f
0.00
623
.938
4.59
90.
037
0.84
11.
1458
.934
2000
-01
45.6
8467
.552
41.4
830.
414
30.3
830.
007
f0.
005
24.1
534.
788
0.03
90.
821.
159
.546
2001
-02
47.6
9268
.319
42.1
810.
382
30.4
730.
004
f0.
005
19.5
495.
183
0.03
70.
772
1.06
960
.215
2002
-03
48.3
9574
.819
48.0
90.
397
31.2
530.
003
f0.
005
15.4
894.
806
0.04
0.81
91.
132
64.1
2620
03-0
445
.952
77.7
3953
.99
0.40
733
.991
0.00
3f
0.00
515
.713
4.24
80.
039
0.79
81.
132
65.6
8420
04-0
544
.932
82.8
6456
.513
0.41
835
.205
8.26
9g
0.00
515
.707
3.96
40.
041
0.76
31.
121
66.9
2820
05-0
644
.273
79.0
4753
.912
0.39
137
.137
32.8
43g
0.04
519
.17
4.12
20.
044
0.74
11.
096
64.4
920
06-0
742
.25
85.6
4358
.051
0.38
739
.765
31.1
560.
005
21.0
444.
113
0.04
80.
748
1.23
667
.254
2007
-08
40.2
6180
.841
57.3
10.
354
39.0
4232
.155
0.00
421
.762
3.70
30.
043
0.65
81.
194
62.6
5120
08-0
945
.993
78.3
1665
.058
0.46
240
.875
32.6
780.
005
23.5
693.
853
0.03
80.
614
1.34
671
.277
2009
-10
47.4
1775
.886
67.0
840.
511
43.4
8831
.266
0.00
525
.351
3.61
80.
039
0.57
21.
406
73.7
3320
10-1
145
.577
70.8
8560
.218
0.53
330
.24
26.4
33.
660.
040.
531.
4720
11-1
2Ap
ril,2
011
44.3
7072
.724
64.2
500.
533
46.3
0128
.22
0.00
527
.86
3.79
0.04
0.52
1.48
71.1
19M
ay44
.905
73.4
3464
.483
0.55
346
.265
28.4
10.
005
27.8
53.
850.
040.
531.
4871
.741
June
44.8
5472
.788
64.5
380.
557
46.9
4428
.09
0.00
528
.26
3.80
0.04
0.52
1.47
71.7
21Ju
ly44
.417
71.6
4963
.460
0.55
946
.488
26.9
90.
005
28.4
03.
800.
040.
521.
4870
.826
Aug
ust
45.2
7974
.108
64.9
380.
587
46.0
8825
.65
0.00
528
.38
3.70
0.04
0.52
1.52
72.7
11S
epte
mbe
r47
.632
75.1
3765
.499
0.62
147
.497
26.3
90.
005
27.3
73.
640.
040.
541.
5675
.117
Oct
ober
49.2
5877
.490
67.4
740.
641
48.3
3827
.94
0.00
627
.75
3.67
0.04
0.57
1.59
77.4
14N
ovem
ber
50.8
5680
.277
68.9
060.
656
49.6
8828
.02
0.00
628
.57
3.71
0.04
0.58
1.64
79.3
71D
ecem
ber
52.6
7782
.138
69.3
370.
677
51.4
3528
.01
0.00
628
.53
3.80
0.05
0.59
1.68
81.3
66S
ourc
e :
Res
erve
Ban
k of
Indi
a....
: N
il or
Neg
ligib
lea
The
Eur
o ca
me
into
exi
sten
ce o
n Ja
n/01
/199
9b
Pes
o re
valu
ed in
Jan
uary
199
3; 1
000
old
Pes
o =
1 N
ew P
eso.
c
Indi
cativ
e ra
tes
anno
unce
d by
For
eign
Exc
hang
e D
eale
rs A
ssoc
iatio
n of
Indi
a (F
ED
AI)
dO
n Fe
brua
ry 2
8, 1
986
the
cruz
ado,
equ
al to
100
0 cr
uzer
ios,
was
intro
duce
d. O
n Ja
nuar
y 15
, 198
9, th
e ne
w c
ruza
do, e
qual
to 1
000
old
cruz
ados
was
intro
duce
d. C
urre
ncy
rena
med
Cru
zerio
Rea
l on
1.8.
93;
Cru
zerio
Rea
l 1 e
qual
s 10
00 C
ruze
iro.
eN
ew c
urre
ncy
Rea
l int
rodu
ced
in J
uly
1994
. 275
0 ol
d C
ruze
iro R
eal =
1R
eal.
f10
0 Tu
rkis
h Li
ra.
gTu
rkis
h Li
ra h
as b
een
repl
aced
by
New
Lira
w.e
.f. 1
.1.2
005
Not
e:1.
Ann
ual/
mon
thly
ave
rage
s. D
urin
g M
arch
199
2 to
Feb
ruar
y 19
93, a
dua
l exc
hang
e ra
te s
yste
m w
as p
reva
lent
, in
whi
ch th
e of
ficia
l rat
e w
as fi
xed
by th
e R
BI a
nd th
e m
arke
t rat
e w
as d
eter
min
ed in
the
Inte
r-B
ank
mar
ket f
or th
e U
S d
olla
r.2.
The
data
for 2
001-
02 in
resp
ect o
f Deu
tsch
e M
ark,
Fre
nch
Fran
c an
d Ita
lian
Lira
per
tain
to 1
1 m
onth
s on
ly a
s G
erm
any,
Fra
nce
and
Italy
acc
epte
d th
e E
uro
as th
eir n
atio
nal c
urre
ncy
w.e
.f. M
arch
1, 2
002.
http://indiabudget.nic.in
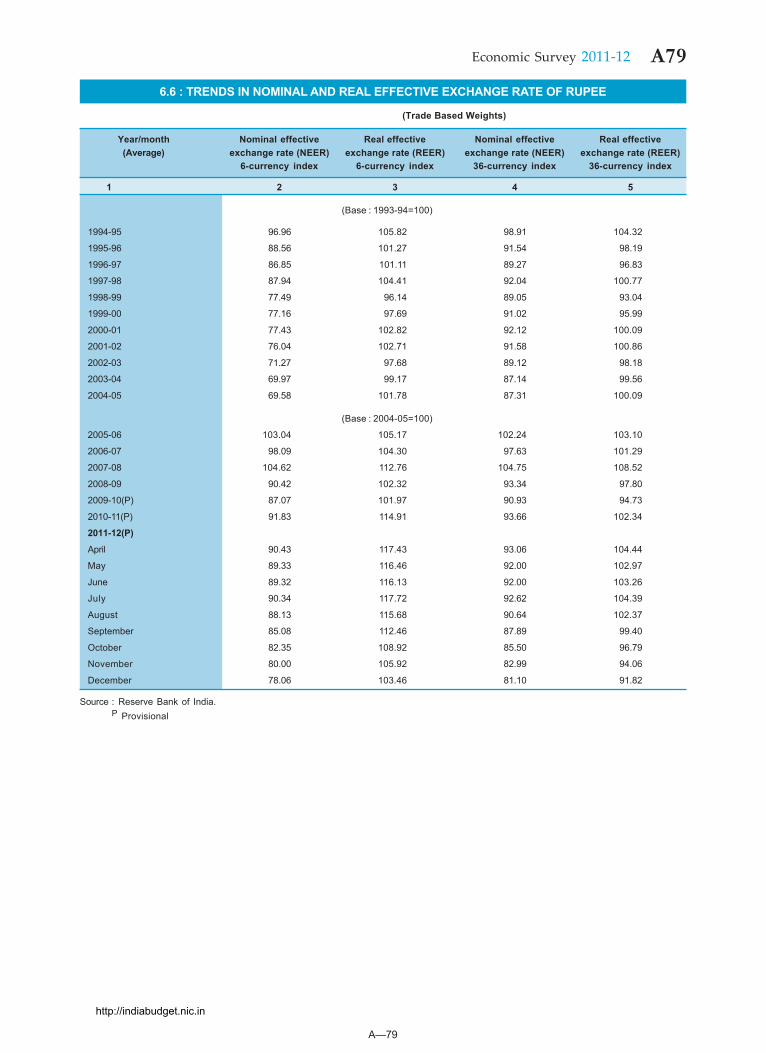
A—79
A79Economic Survey 2011-12
6.6 : TRENDS IN NOMINAL AND REAL EFFECTIVE EXCHANGE RATE OF RUPEE
Year/month Nominal effective Real effective Nominal effective Real effective(Average) exchange rate (NEER) exchange rate (REER) exchange rate (NEER) exchange rate (REER)
6-currency index 6-currency index 36-currency index 36-currency index
1 2 3 4 5
(Base : 1993-94=100)
1994-95 96.96 105.82 98.91 104.32
1995-96 88.56 101.27 91.54 98.19
1996-97 86.85 101.11 89.27 96.83
1997-98 87.94 104.41 92.04 100.77
1998-99 77.49 96.14 89.05 93.04
1999-00 77.16 97.69 91.02 95.99
2000-01 77.43 102.82 92.12 100.09
2001-02 76.04 102.71 91.58 100.86
2002-03 71.27 97.68 89.12 98.18
2003-04 69.97 99.17 87.14 99.56
2004-05 69.58 101.78 87.31 100.09
(Base : 2004-05=100)
2005-06 103.04 105.17 102.24 103.10
2006-07 98.09 104.30 97.63 101.29
2007-08 104.62 112.76 104.75 108.52
2008-09 90.42 102.32 93.34 97.80
2009-10(P) 87.07 101.97 90.93 94.73
2010-11(P) 91.83 114.91 93.66 102.34
2011-12(P)
April 90.43 117.43 93.06 104.44
May 89.33 116.46 92.00 102.97
June 89.32 116.13 92.00 103.26
July 90.34 117.72 92.62 104.39
August 88.13 115.68 90.64 102.37
September 85.08 112.46 87.89 99.40
October 82.35 108.92 85.50 96.79
November 80.00 105.92 82.99 94.06
December 78.06 103.46 81.10 91.82
Source : Reserve Bank of India.P Provisional
(Trade Based Weights)
http://indiabudget.nic.in
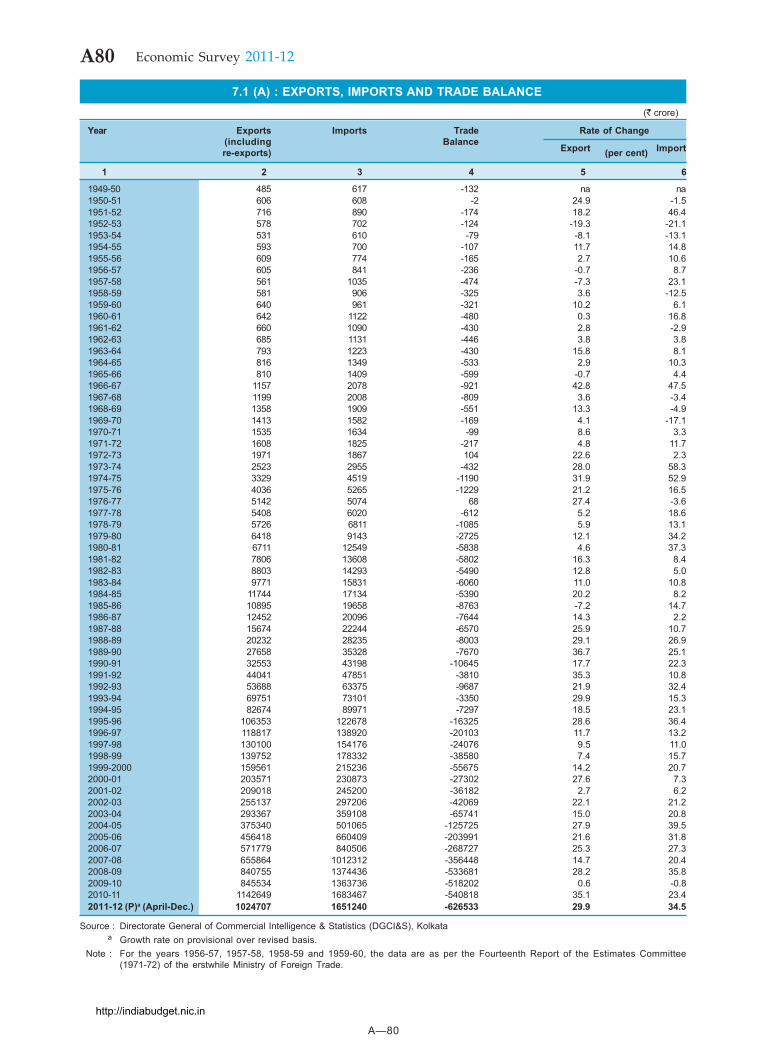
A—80
A80 Economic Survey 2011-12
7.1 (A) : EXPORTS, IMPORTS AND TRADE BALANCE(` crore)
Year Exports Imports Trade Rate of Change(including Balance Export Importre-exports) (per cent)
1 2 3 4 5 6
1949-50 485 617 -132 na na1950-51 606 608 -2 24.9 -1.51951-52 716 890 -174 18.2 46.41952-53 578 702 -124 -19.3 -21.11953-54 531 610 -79 -8.1 -13.11954-55 593 700 -107 11.7 14.81955-56 609 774 -165 2.7 10.61956-57 605 841 -236 -0.7 8.71957-58 561 1035 -474 -7.3 23.11958-59 581 906 -325 3.6 -12.51959-60 640 961 -321 10.2 6.11960-61 642 1122 -480 0.3 16.81961-62 660 1090 -430 2.8 -2.91962-63 685 1131 -446 3.8 3.81963-64 793 1223 -430 15.8 8.11964-65 816 1349 -533 2.9 10.31965-66 810 1409 -599 -0.7 4.41966-67 1157 2078 -921 42.8 47.51967-68 1199 2008 -809 3.6 -3.41968-69 1358 1909 -551 13.3 -4.91969-70 1413 1582 -169 4.1 -17.11970-71 1535 1634 -99 8.6 3.31971-72 1608 1825 -217 4.8 11.71972-73 1971 1867 104 22.6 2.31973-74 2523 2955 -432 28.0 58.31974-75 3329 4519 -1190 31.9 52.91975-76 4036 5265 -1229 21.2 16.51976-77 5142 5074 68 27.4 -3.61977-78 5408 6020 -612 5.2 18.61978-79 5726 6811 -1085 5.9 13.11979-80 6418 9143 -2725 12.1 34.21980-81 6711 12549 -5838 4.6 37.31981-82 7806 13608 -5802 16.3 8.41982-83 8803 14293 -5490 12.8 5.01983-84 9771 15831 -6060 11.0 10.81984-85 11744 17134 -5390 20.2 8.21985-86 10895 19658 -8763 -7.2 14.71986-87 12452 20096 -7644 14.3 2.21987-88 15674 22244 -6570 25.9 10.71988-89 20232 28235 -8003 29.1 26.91989-90 27658 35328 -7670 36.7 25.11990-91 32553 43198 -10645 17.7 22.31991-92 44041 47851 -3810 35.3 10.81992-93 53688 63375 -9687 21.9 32.41993-94 69751 73101 -3350 29.9 15.31994-95 82674 89971 -7297 18.5 23.11995-96 106353 122678 -16325 28.6 36.41996-97 118817 138920 -20103 11.7 13.21997-98 130100 154176 -24076 9.5 11.01998-99 139752 178332 -38580 7.4 15.71999-2000 159561 215236 -55675 14.2 20.72000-01 203571 230873 -27302 27.6 7.32001-02 209018 245200 -36182 2.7 6.22002-03 255137 297206 -42069 22.1 21.22003-04 293367 359108 -65741 15.0 20.82004-05 375340 501065 -125725 27.9 39.52005-06 456418 660409 -203991 21.6 31.82006-07 571779 840506 -268727 25.3 27.32007-08 655864 1012312 -356448 14.7 20.42008-09 840755 1374436 -533681 28.2 35.82009-10 845534 1363736 -518202 0.6 -0.82010-11 1142649 1683467 -540818 35.1 23.42011-12 (P)a (April-Dec.) 1024707 1651240 -626533 29.9 34.5
Source : Directorate General of Commercial Intelligence & Statistics (DGCI&S), Kolkataa Growth rate on provisional over revised basis.
Note : For the years 1956-57, 1957-58, 1958-59 and 1959-60, the data are as per the Fourteenth Report of the Estimates Committee(1971-72) of the erstwhile Ministry of Foreign Trade.
http://indiabudget.nic.in
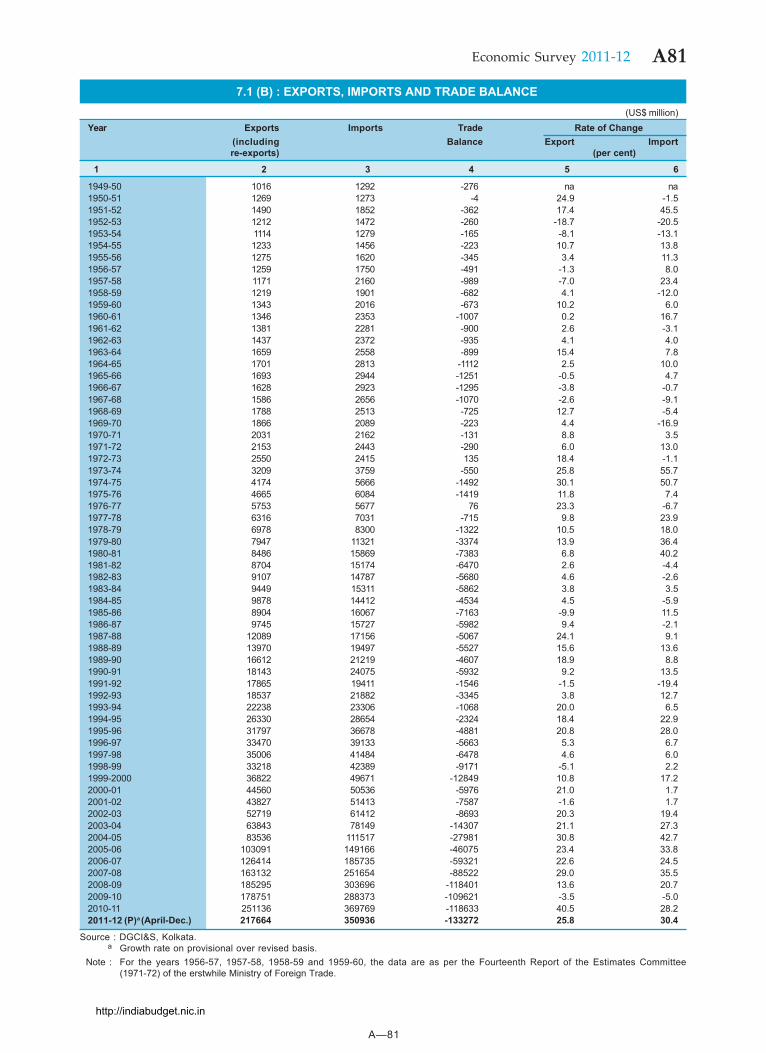
A—81
A81Economic Survey 2011-12
7.1 (B) : EXPORTS, IMPORTS AND TRADE BALANCE(US$ million)
Year Exports Imports Trade Rate of Change(including Balance Export Importre-exports) (per cent)
1 2 3 4 5 6
1949-50 1016 1292 -276 na na1950-51 1269 1273 -4 24.9 -1.51951-52 1490 1852 -362 17.4 45.51952-53 1212 1472 -260 -18.7 -20.51953-54 1114 1279 -165 -8.1 -13.11954-55 1233 1456 -223 10.7 13.81955-56 1275 1620 -345 3.4 11.31956-57 1259 1750 -491 -1.3 8.01957-58 1171 2160 -989 -7.0 23.41958-59 1219 1901 -682 4.1 -12.01959-60 1343 2016 -673 10.2 6.01960-61 1346 2353 -1007 0.2 16.71961-62 1381 2281 -900 2.6 -3.11962-63 1437 2372 -935 4.1 4.01963-64 1659 2558 -899 15.4 7.81964-65 1701 2813 -1112 2.5 10.01965-66 1693 2944 -1251 -0.5 4.71966-67 1628 2923 -1295 -3.8 -0.71967-68 1586 2656 -1070 -2.6 -9.11968-69 1788 2513 -725 12.7 -5.41969-70 1866 2089 -223 4.4 -16.91970-71 2031 2162 -131 8.8 3.51971-72 2153 2443 -290 6.0 13.01972-73 2550 2415 135 18.4 -1.11973-74 3209 3759 -550 25.8 55.71974-75 4174 5666 -1492 30.1 50.71975-76 4665 6084 -1419 11.8 7.41976-77 5753 5677 76 23.3 -6.71977-78 6316 7031 -715 9.8 23.91978-79 6978 8300 -1322 10.5 18.01979-80 7947 11321 -3374 13.9 36.41980-81 8486 15869 -7383 6.8 40.21981-82 8704 15174 -6470 2.6 -4.41982-83 9107 14787 -5680 4.6 -2.61983-84 9449 15311 -5862 3.8 3.51984-85 9878 14412 -4534 4.5 -5.91985-86 8904 16067 -7163 -9.9 11.51986-87 9745 15727 -5982 9.4 -2.11987-88 12089 17156 -5067 24.1 9.11988-89 13970 19497 -5527 15.6 13.61989-90 16612 21219 -4607 18.9 8.81990-91 18143 24075 -5932 9.2 13.51991-92 17865 19411 -1546 -1.5 -19.41992-93 18537 21882 -3345 3.8 12.71993-94 22238 23306 -1068 20.0 6.51994-95 26330 28654 -2324 18.4 22.91995-96 31797 36678 -4881 20.8 28.01996-97 33470 39133 -5663 5.3 6.71997-98 35006 41484 -6478 4.6 6.01998-99 33218 42389 -9171 -5.1 2.21999-2000 36822 49671 -12849 10.8 17.22000-01 44560 50536 -5976 21.0 1.72001-02 43827 51413 -7587 -1.6 1.72002-03 52719 61412 -8693 20.3 19.42003-04 63843 78149 -14307 21.1 27.32004-05 83536 111517 -27981 30.8 42.72005-06 103091 149166 -46075 23.4 33.82006-07 126414 185735 -59321 22.6 24.52007-08 163132 251654 -88522 29.0 35.52008-09 185295 303696 -118401 13.6 20.72009-10 178751 288373 -109621 -3.5 -5.02010-11 251136 369769 -118633 40.5 28.22011-12 (P)a (April-Dec.) 217664 350936 -133272 25.8 30.4
Source : DGCI&S, Kolkata.a Growth rate on provisional over revised basis.
Note : For the years 1956-57, 1957-58, 1958-59 and 1959-60, the data are as per the Fourteenth Report of the Estimates Committee(1971-72) of the erstwhile Ministry of Foreign Trade.
http://indiabudget.nic.in
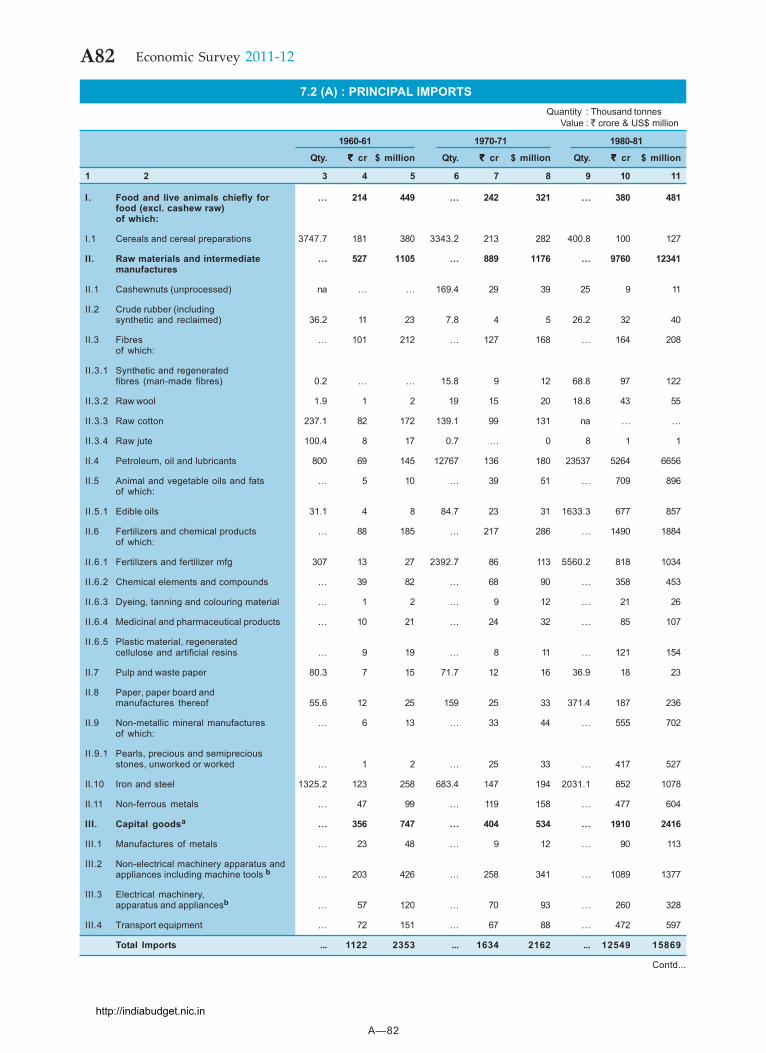
A—82
A82 Economic Survey 2011-12
7.2 (A) : PRINCIPAL IMPORTSQuantity : Thousand tonnes
Value : ` crore & US$ million
1960-61 1970-71 1980-81
Qty. ` ` ` ` ` cr $ million Qty. ` ` ` ` ` cr $ million Qty. ` ` ` ` ` cr $ million
1 2 3 4 5 6 7 8 9 10 11
I. Food and live animals chiefly for ... 214 449 ... 242 321 ... 380 481food (excl. cashew raw)of which:
I.1 Cereals and cereal preparations 3747.7 181 380 3343.2 213 282 400.8 100 127
II. Raw materials and intermediate ... 527 1105 ... 889 1176 ... 9760 12341manufactures
II.1 Cashewnuts (unprocessed) na ... ... 169.4 29 39 25 9 11
II.2 Crude rubber (includingsynthetic and reclaimed) 36.2 11 23 7.8 4 5 26.2 32 40
II.3 Fibres ... 101 212 ... 127 168 ... 164 208of which:
II.3.1 Synthetic and regeneratedfibres (man-made fibres) 0.2 ... ... 15.8 9 12 68.8 97 122
II.3.2 Raw wool 1.9 1 2 19 15 20 18.8 43 55
II.3.3 Raw cotton 237.1 82 172 139.1 99 131 na ... ...
II.3.4 Raw jute 100.4 8 17 0.7 ... 0 8 1 1
II.4 Petroleum, oil and lubricants 800 69 145 12767 136 180 23537 5264 6656
II.5 Animal and vegetable oils and fats ... 5 10 ... 39 51 ... 709 896of which:
II.5.1 Edible oils 31.1 4 8 84.7 23 31 1633.3 677 857
II.6 Fertilizers and chemical products ... 88 185 ... 217 286 ... 1490 1884of which:
II.6.1 Fertilizers and fertilizer mfg 307 13 27 2392.7 86 113 5560.2 818 1034
II.6.2 Chemical elements and compounds ... 39 82 ... 68 90 ... 358 453
II.6.3 Dyeing, tanning and colouring material ... 1 2 ... 9 12 ... 21 26
II.6.4 Medicinal and pharmaceutical products ... 10 21 ... 24 32 ... 85 107
II.6.5 Plastic material, regeneratedcellulose and artificial resins ... 9 19 ... 8 11 ... 121 154
II.7 Pulp and waste paper 80.3 7 15 71.7 12 16 36.9 18 23
II.8 Paper, paper board andmanufactures thereof 55.6 12 25 159 25 33 371.4 187 236
II.9 Non-metallic mineral manufactures ... 6 13 ... 33 44 ... 555 702of which:
II.9.1 Pearls, precious and semipreciousstones, unworked or worked ... 1 2 ... 25 33 ... 417 527
II.10 Iron and steel 1325.2 123 258 683.4 147 194 2031.1 852 1078
II.11 Non-ferrous metals ... 47 99 ... 119 158 ... 477 604
III. Capital goodsa ... 356 747 ... 404 534 ... 1910 2416
III.1 Manufactures of metals ... 23 48 ... 9 12 ... 90 113
III.2 Non-electrical machinery apparatus andappliances including machine tools b ... 203 426 ... 258 341 ... 1089 1377
III.3 Electrical machinery,apparatus and appliancesb ... 57 120 ... 70 93 ... 260 328
III.4 Transport equipment ... 72 151 ... 67 88 ... 472 597
Total Imports ... 1122 2353 ... 1634 2162 ... 12549 15869
Contd...
http://indiabudget.nic.in
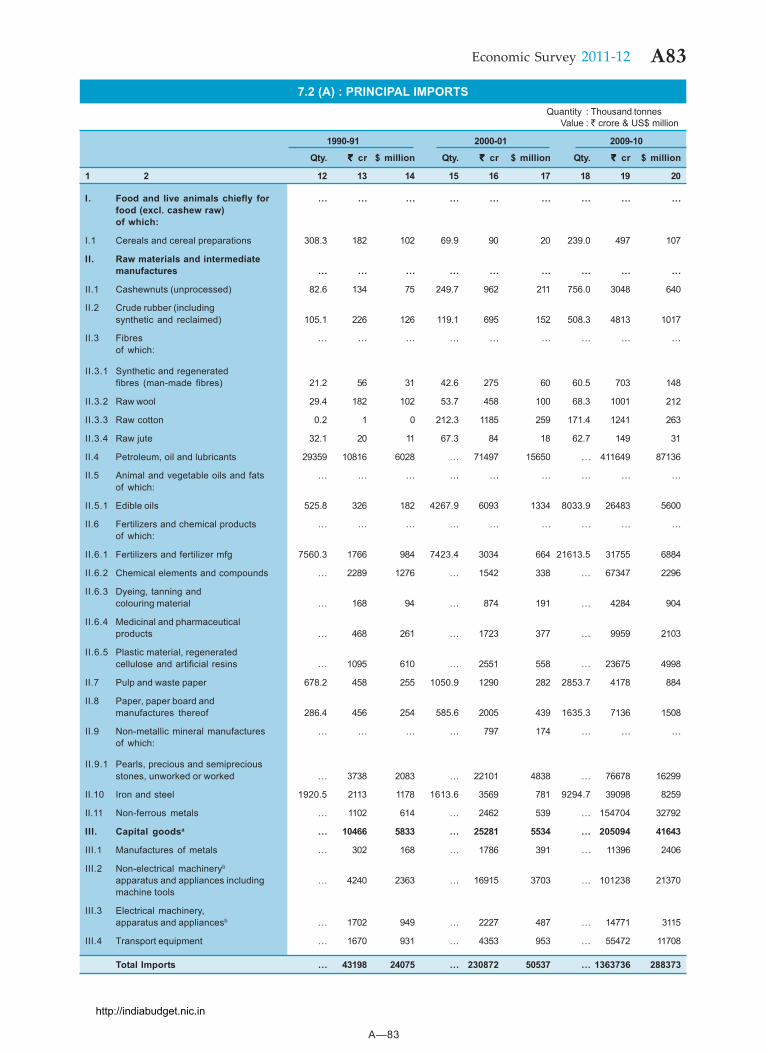
A—83
A83Economic Survey 2011-12
7.2 (A) : PRINCIPAL IMPORTSQuantity : Thousand tonnes
Value : ` crore & US$ million
1990-91 2000-01 2009-10
Qty. ` ` ` ` ` cr $ million Qty. ` ` ` ` ` cr $ million Qty. ` ` ` ` ` cr $ million
1 2 12 13 14 15 16 17 18 19 20
I. Food and live animals chiefly for ... ... ... ... ... ... ... ... ...food (excl. cashew raw)of which:
I.1 Cereals and cereal preparations 308.3 182 102 69.9 90 20 239.0 497 107
II. Raw materials and intermediatemanufactures ... ... ... ... ... ... ... ... ...
II.1 Cashewnuts (unprocessed) 82.6 134 75 249.7 962 211 756.0 3048 640
II.2 Crude rubber (includingsynthetic and reclaimed) 105.1 226 126 119.1 695 152 508.3 4813 1017
II.3 Fibres ... ... ... ... ... ... ... ... ...of which:
II.3.1 Synthetic and regeneratedfibres (man-made fibres) 21.2 56 31 42.6 275 60 60.5 703 148
II.3.2 Raw wool 29.4 182 102 53.7 458 100 68.3 1001 212
II.3.3 Raw cotton 0.2 1 0 212.3 1185 259 171.4 1241 263
II.3.4 Raw jute 32.1 20 11 67.3 84 18 62.7 149 31
II.4 Petroleum, oil and lubricants 29359 10816 6028 ... 71497 15650 ... 411649 87136
II.5 Animal and vegetable oils and fats ... ... ... ... ... ... ... ... ...of which:
II.5.1 Edible oils 525.8 326 182 4267.9 6093 1334 8033.9 26483 5600
II.6 Fertilizers and chemical products ... ... ... ... ... ... ... ... ...of which:
II.6.1 Fertilizers and fertilizer mfg 7560.3 1766 984 7423.4 3034 664 21613.5 31755 6884
II.6.2 Chemical elements and compounds ... 2289 1276 ... 1542 338 ... 67347 2296
II.6.3 Dyeing, tanning andcolouring material ... 168 94 ... 874 191 ... 4284 904
II.6.4 Medicinal and pharmaceuticalproducts ... 468 261 ... 1723 377 ... 9959 2103
II.6.5 Plastic material, regeneratedcellulose and artificial resins ... 1095 610 ... 2551 558 ... 23675 4998
II.7 Pulp and waste paper 678.2 458 255 1050.9 1290 282 2853.7 4178 884
II.8 Paper, paper board andmanufactures thereof 286.4 456 254 585.6 2005 439 1635.3 7136 1508
II.9 Non-metallic mineral manufactures ... ... ... ... 797 174 ... ... ...of which:
II.9.1 Pearls, precious and semipreciousstones, unworked or worked ... 3738 2083 ... 22101 4838 ... 76678 16299
II.10 Iron and steel 1920.5 2113 1178 1613.6 3569 781 9294.7 39098 8259
II.11 Non-ferrous metals ... 1102 614 ... 2462 539 ... 154704 32792
III. Capital goodsa ... 10466 5833 ... 25281 5534 ... 205094 41643
III.1 Manufactures of metals ... 302 168 ... 1786 391 ... 11396 2406
III.2 Non-electrical machineryb
apparatus and appliances including ... 4240 2363 ... 16915 3703 ... 101238 21370machine tools
III.3 Electrical machinery,apparatus and appliancesb ... 1702 949 ... 2227 487 ... 14771 3115
III.4 Transport equipment ... 1670 931 ... 4353 953 ... 55472 11708
Total Imports ... 43198 24075 ... 230872 50537 ... 1363736 288373
http://indiabudget.nic.in
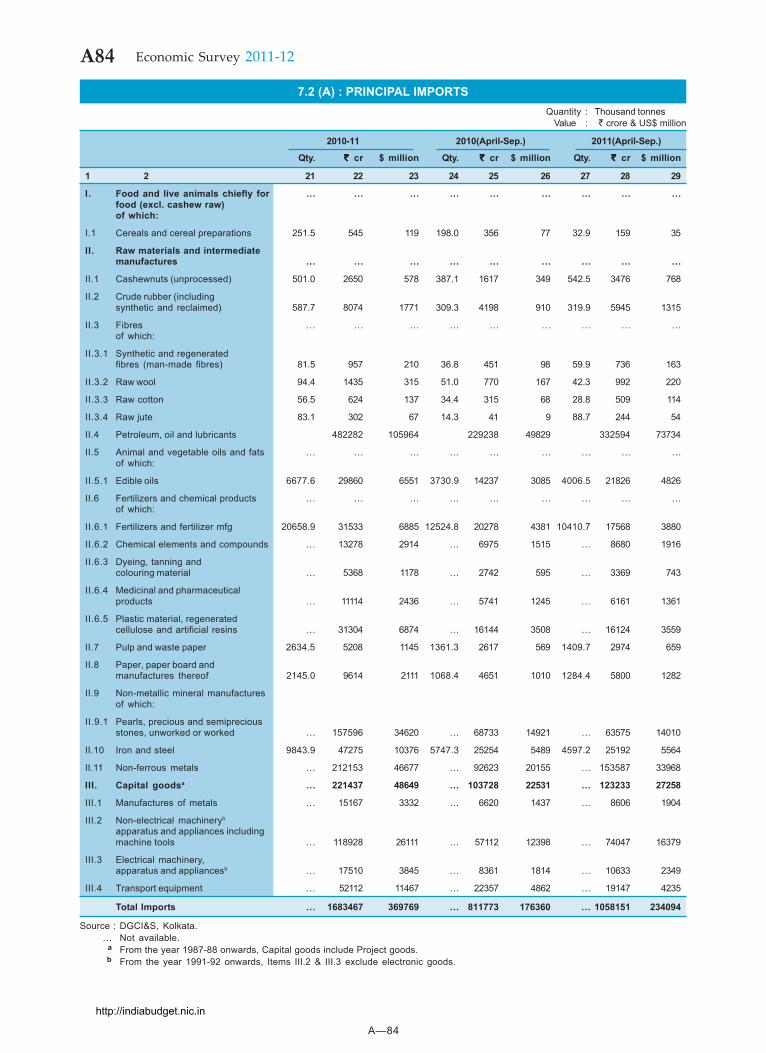
A—84
A84 Economic Survey 2011-12
Source : DGCI&S, Kolkata.... Not available.
a From the year 1987-88 onwards, Capital goods include Project goods.b From the year 1991-92 onwards, Items III.2 & III.3 exclude electronic goods.
7.2 (A) : PRINCIPAL IMPORTSQuantity : Thousand tonnes
Value : ` crore & US$ million
2010-11 2010(April-Sep.) 2011(April-Sep.)
Qty. ` ` ` ` ` cr $ million Qty. ` ` ` ` ` cr $ million Qty. ` ` ` ` ` cr $ million
1 2 21 22 23 24 25 26 27 28 29
I. Food and live animals chiefly for ... ... ... ... ... ... ... ... ...food (excl. cashew raw)of which:
I.1 Cereals and cereal preparations 251.5 545 119 198.0 356 77 32.9 159 35
II. Raw materials and intermediatemanufactures ... ... ... ... ... ... ... ... ...
II.1 Cashewnuts (unprocessed) 501.0 2650 578 387.1 1617 349 542.5 3476 768
II.2 Crude rubber (includingsynthetic and reclaimed) 587.7 8074 1771 309.3 4198 910 319.9 5945 1315
II.3 Fibres ... ... ... ... ... ... ... ... ...of which:
II.3.1 Synthetic and regeneratedfibres (man-made fibres) 81.5 957 210 36.8 451 98 59.9 736 163
II.3.2 Raw wool 94.4 1435 315 51.0 770 167 42.3 992 220
II.3.3 Raw cotton 56.5 624 137 34.4 315 68 28.8 509 114
II.3.4 Raw jute 83.1 302 67 14.3 41 9 88.7 244 54
II.4 Petroleum, oil and lubricants 482282 105964 229238 49829 332594 73734
II.5 Animal and vegetable oils and fats ... ... ... ... ... ... ... ... ...of which:
II.5.1 Edible oils 6677.6 29860 6551 3730.9 14237 3085 4006.5 21826 4826
II.6 Fertilizers and chemical products ... ... ... ... ... ... ... ... ...of which:
II.6.1 Fertilizers and fertilizer mfg 20658.9 31533 6885 12524.8 20278 4381 10410.7 17568 3880
II.6.2 Chemical elements and compounds ... 13278 2914 ... 6975 1515 ... 8680 1916
II.6.3 Dyeing, tanning andcolouring material ... 5368 1178 ... 2742 595 ... 3369 743
II.6.4 Medicinal and pharmaceuticalproducts ... 11114 2436 ... 5741 1245 ... 6161 1361
II.6.5 Plastic material, regeneratedcellulose and artificial resins ... 31304 6874 ... 16144 3508 ... 16124 3559
II.7 Pulp and waste paper 2634.5 5208 1145 1361.3 2617 569 1409.7 2974 659
II.8 Paper, paper board andmanufactures thereof 2145.0 9614 2111 1068.4 4651 1010 1284.4 5800 1282
II.9 Non-metallic mineral manufacturesof which:
II.9.1 Pearls, precious and semipreciousstones, unworked or worked ... 157596 34620 ... 68733 14921 ... 63575 14010
II.10 Iron and steel 9843.9 47275 10376 5747.3 25254 5489 4597.2 25192 5564
II.11 Non-ferrous metals ... 212153 46677 ... 92623 20155 ... 153587 33968
III. Capital goodsa ... 221437 48649 ... 103728 22531 ... 123233 27258
III.1 Manufactures of metals ... 15167 3332 ... 6620 1437 ... 8606 1904
III.2 Non-electrical machineryb
apparatus and appliances includingmachine tools ... 118928 26111 ... 57112 12398 ... 74047 16379
III.3 Electrical machinery,apparatus and appliancesb ... 17510 3845 ... 8361 1814 ... 10633 2349
III.4 Transport equipment ... 52112 11467 ... 22357 4862 ... 19147 4235
Total Imports ... 1683467 369769 ... 811773 176360 ... 1058151 234094
http://indiabudget.nic.in
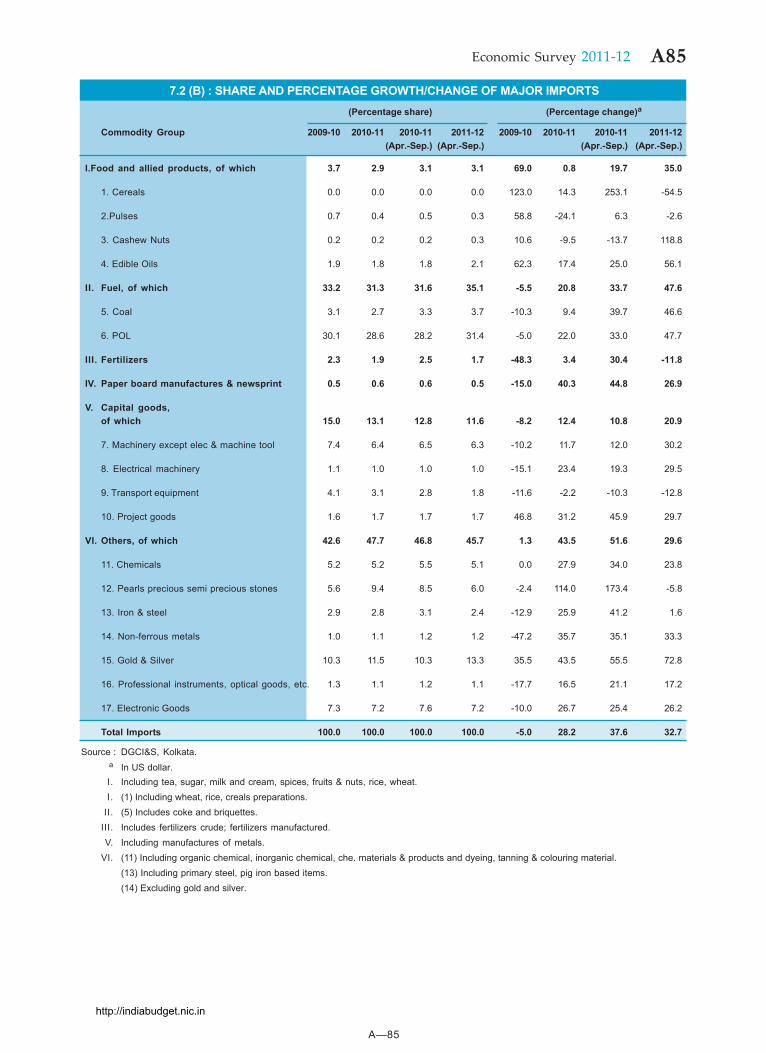
A—85
A85Economic Survey 2011-12
7.2 (B) : SHARE AND PERCENTAGE GROWTH/CHANGE OF MAJOR IMPORTS(Percentage share) (Percentage change)a
Commodity Group 2009-10 2010-11 2010-11 2011-12 2009-10 2010-11 2010-11 2011-12(Apr.-Sep.) (Apr.-Sep.) (Apr.-Sep.) (Apr.-Sep.)
I.Food and allied products, of which 3.7 2.9 3.1 3.1 69.0 0.8 19.7 35.0
1. Cereals 0.0 0.0 0.0 0.0 123.0 14.3 253.1 -54.5
2.Pulses 0.7 0.4 0.5 0.3 58.8 -24.1 6.3 -2.6
3. Cashew Nuts 0.2 0.2 0.2 0.3 10.6 -9.5 -13.7 118.8
4. Edible Oils 1.9 1.8 1.8 2.1 62.3 17.4 25.0 56.1
II. Fuel, of which 33.2 31.3 31.6 35.1 -5.5 20.8 33.7 47.6
5. Coal 3.1 2.7 3.3 3.7 -10.3 9.4 39.7 46.6
6. POL 30.1 28.6 28.2 31.4 -5.0 22.0 33.0 47.7
III. Fertilizers 2.3 1.9 2.5 1.7 -48.3 3.4 30.4 -11.8
IV. Paper board manufactures & newsprint 0.5 0.6 0.6 0.5 -15.0 40.3 44.8 26.9
V. Capital goods,of which 15.0 13.1 12.8 11.6 -8.2 12.4 10.8 20.9
7. Machinery except elec & machine tool 7.4 6.4 6.5 6.3 -10.2 11.7 12.0 30.2
8. Electrical machinery 1.1 1.0 1.0 1.0 -15.1 23.4 19.3 29.5
9. Transport equipment 4.1 3.1 2.8 1.8 -11.6 -2.2 -10.3 -12.8
10. Project goods 1.6 1.7 1.7 1.7 46.8 31.2 45.9 29.7
VI. Others, of which 42.6 47.7 46.8 45.7 1.3 43.5 51.6 29.6
11. Chemicals 5.2 5.2 5.5 5.1 0.0 27.9 34.0 23.8
12. Pearls precious semi precious stones 5.6 9.4 8.5 6.0 -2.4 114.0 173.4 -5.8
13. Iron & steel 2.9 2.8 3.1 2.4 -12.9 25.9 41.2 1.6
14. Non-ferrous metals 1.0 1.1 1.2 1.2 -47.2 35.7 35.1 33.3
15. Gold & Silver 10.3 11.5 10.3 13.3 35.5 43.5 55.5 72.8
16. Professional instruments, optical goods, etc. 1.3 1.1 1.2 1.1 -17.7 16.5 21.1 17.2
17. Electronic Goods 7.3 7.2 7.6 7.2 -10.0 26.7 25.4 26.2
Total Imports 100.0 100.0 100.0 100.0 -5.0 28.2 37.6 32.7
Source : DGCI&S, Kolkata.a In US dollar.I. Including tea, sugar, milk and cream, spices, fruits & nuts, rice, wheat.I. (1) Including wheat, rice, creals preparations.
II. (5) Includes coke and briquettes.III. Includes fertilizers crude; fertilizers manufactured.V. Including manufactures of metals.
VI. (11) Including organic chemical, inorganic chemical, che. materials & products and dyeing, tanning & colouring material.(13) Including primary steel, pig iron based items.(14) Excluding gold and silver.
http://indiabudget.nic.in
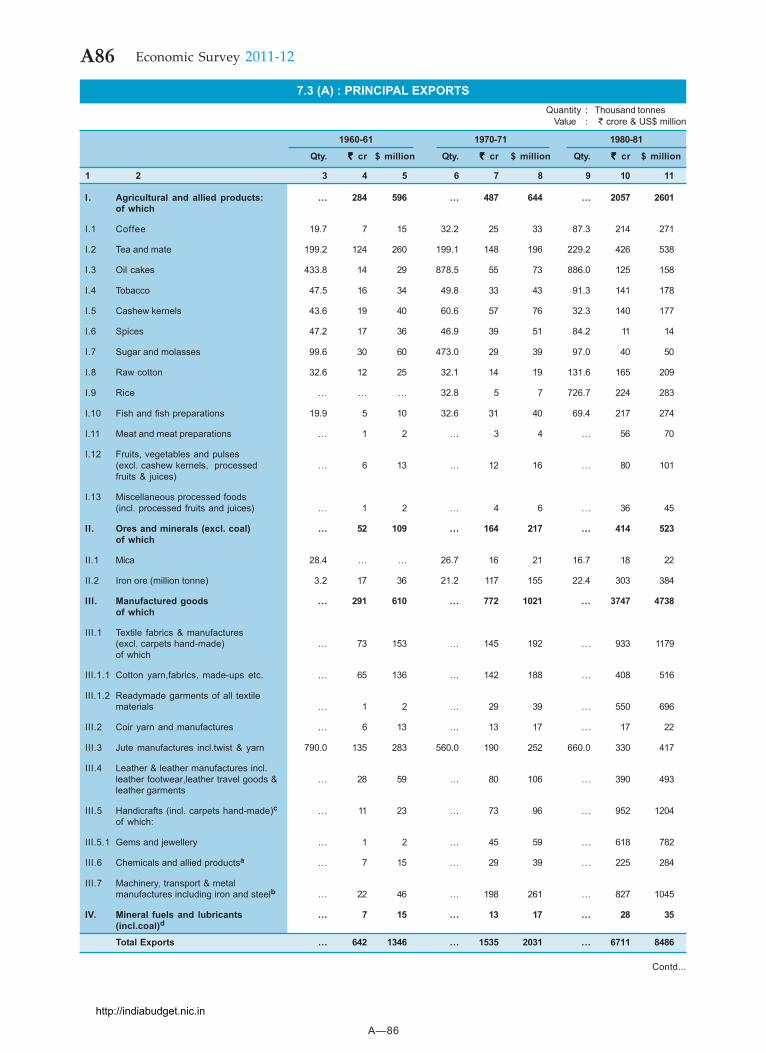
A—86
A86 Economic Survey 2011-12
7.3 (A) : PRINCIPAL EXPORTSQuantity : Thousand tonnes
Value : ` crore & US$ million
1960-61 1970-71 1980-81
Qty. ` ` ` ` ` cr $ million Qty. ` ` ` ` ` cr $ million Qty. ` ` ` ` ` cr $ million
1 2 3 4 5 6 7 8 9 10 11
I. Agricultural and allied products: ... 284 596 ... 487 644 ... 2057 2601of which
I.1 Coffee 19.7 7 15 32.2 25 33 87.3 214 271
I.2 Tea and mate 199.2 124 260 199.1 148 196 229.2 426 538
I.3 Oil cakes 433.8 14 29 878.5 55 73 886.0 125 158
I.4 Tobacco 47.5 16 34 49.8 33 43 91.3 141 178
I.5 Cashew kernels 43.6 19 40 60.6 57 76 32.3 140 177
I.6 Spices 47.2 17 36 46.9 39 51 84.2 11 14
I.7 Sugar and molasses 99.6 30 60 473.0 29 39 97.0 40 50
I.8 Raw cotton 32.6 12 25 32.1 14 19 131.6 165 209
I.9 Rice ... ... ... 32.8 5 7 726.7 224 283
I.10 Fish and fish preparations 19.9 5 10 32.6 31 40 69.4 217 274
I.11 Meat and meat preparations ... 1 2 ... 3 4 ... 56 70
I.12 Fruits, vegetables and pulses(excl. cashew kernels, processed ... 6 13 ... 12 16 ... 80 101fruits & juices)
I.13 Miscellaneous processed foods(incl. processed fruits and juices) ... 1 2 ... 4 6 ... 36 45
II. Ores and minerals (excl. coal) ... 52 109 ... 164 217 ... 414 523of which
II.1 Mica 28.4 ... ... 26.7 16 21 16.7 18 22
II.2 Iron ore (million tonne) 3.2 17 36 21.2 117 155 22.4 303 384
III. Manufactured goods ... 291 610 ... 772 1021 ... 3747 4738of which
III.1 Textile fabrics & manufactures(excl. carpets hand-made) ... 73 153 ... 145 192 ... 933 1179of which
III.1.1 Cotton yarn,fabrics, made-ups etc. ... 65 136 ... 142 188 ... 408 516
III.1.2 Readymade garments of all textilematerials ... 1 2 ... 29 39 ... 550 696
III.2 Coir yarn and manufactures ... 6 13 ... 13 17 ... 17 22
III.3 Jute manufactures incl.twist & yarn 790.0 135 283 560.0 190 252 660.0 330 417
III.4 Leather & leather manufactures incl.leather footwear,leather travel goods & ... 28 59 ... 80 106 ... 390 493leather garments
III.5 Handicrafts (incl. carpets hand-made)c ... 11 23 ... 73 96 ... 952 1204of which:
III.5.1 Gems and jewellery ... 1 2 ... 45 59 ... 618 782
III.6 Chemicals and allied productsa ... 7 15 ... 29 39 ... 225 284
III.7 Machinery, transport & metalmanufactures including iron and steelb ... 22 46 ... 198 261 ... 827 1045
IV. Mineral fuels and lubricants ... 7 15 ... 13 17 ... 28 35(incl.coal)d
Total Exports ... 642 1346 ... 1535 2031 ... 6711 8486
Contd...
http://indiabudget.nic.in
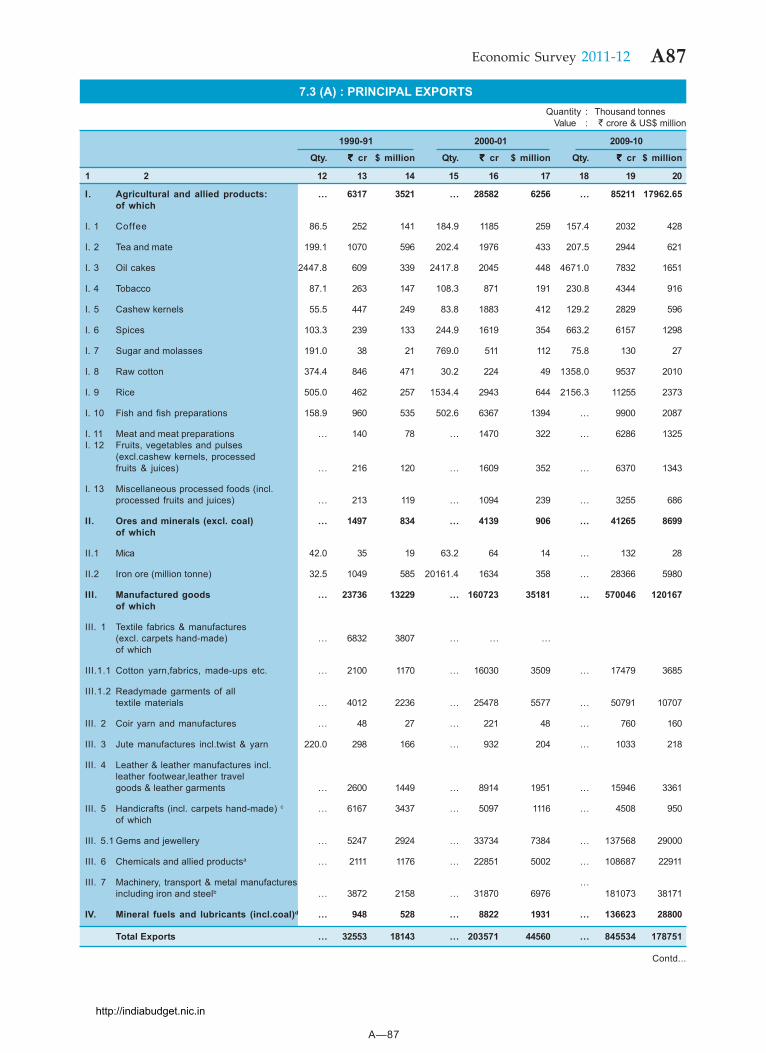
A—87
A87Economic Survey 2011-12
7.3 (A) : PRINCIPAL EXPORTSQuantity : Thousand tonnes
Value : ` crore & US$ million
1990-91 2000-01 2009-10
Qty. ` ` ` ` ` cr $ million Qty. ` ` ` ` ` cr $ million Qty. ` ` ` ` ` cr $ million
1 2 12 13 14 15 16 17 18 19 20
I. Agricultural and allied products: ... 6317 3521 ... 28582 6256 ... 85211 17962.65of which
I. 1 Coffee 86.5 252 141 184.9 1185 259 157.4 2032 428
I. 2 Tea and mate 199.1 1070 596 202.4 1976 433 207.5 2944 621
I. 3 Oil cakes 2447.8 609 339 2417.8 2045 448 4671.0 7832 1651
I. 4 Tobacco 87.1 263 147 108.3 871 191 230.8 4344 916
I. 5 Cashew kernels 55.5 447 249 83.8 1883 412 129.2 2829 596
I. 6 Spices 103.3 239 133 244.9 1619 354 663.2 6157 1298
I. 7 Sugar and molasses 191.0 38 21 769.0 511 112 75.8 130 27
I. 8 Raw cotton 374.4 846 471 30.2 224 49 1358.0 9537 2010
I. 9 Rice 505.0 462 257 1534.4 2943 644 2156.3 11255 2373
I. 10 Fish and fish preparations 158.9 960 535 502.6 6367 1394 ... 9900 2087
I. 11 Meat and meat preparations ... 140 78 ... 1470 322 ... 6286 1325I. 12 Fruits, vegetables and pulses
(excl.cashew kernels, processedfruits & juices) ... 216 120 ... 1609 352 ... 6370 1343
I. 13 Miscellaneous processed foods (incl.processed fruits and juices) ... 213 119 ... 1094 239 ... 3255 686
II. Ores and minerals (excl. coal) ... 1497 834 ... 4139 906 ... 41265 8699of which
II.1 Mica 42.0 35 19 63.2 64 14 ... 132 28
II.2 Iron ore (million tonne) 32.5 1049 585 20161.4 1634 358 ... 28366 5980
III. Manufactured goods ... 23736 13229 ... 160723 35181 ... 570046 120167of which
III. 1 Textile fabrics & manufactures(excl. carpets hand-made) ... 6832 3807 ... ... ...of which
III.1.1 Cotton yarn,fabrics, made-ups etc. ... 2100 1170 ... 16030 3509 ... 17479 3685
III.1.2 Readymade garments of alltextile materials ... 4012 2236 ... 25478 5577 ... 50791 10707
III. 2 Coir yarn and manufactures ... 48 27 ... 221 48 ... 760 160
III. 3 Jute manufactures incl.twist & yarn 220.0 298 166 ... 932 204 ... 1033 218
III. 4 Leather & leather manufactures incl.leather footwear,leather travelgoods & leather garments ... 2600 1449 ... 8914 1951 ... 15946 3361
III. 5 Handicrafts (incl. carpets hand-made) c ... 6167 3437 ... 5097 1116 ... 4508 950of which
III. 5.1 Gems and jewellery ... 5247 2924 ... 33734 7384 ... 137568 29000
III. 6 Chemicals and allied productsa ... 2111 1176 ... 22851 5002 ... 108687 22911
III. 7 Machinery, transport & metal manufactures ...including iron and steelb ... 3872 2158 ... 31870 6976 181073 38171
IV. Mineral fuels and lubricants (incl.coal)d ... 948 528 ... 8822 1931 ... 136623 28800
Total Exports ... 32553 18143 ... 203571 44560 ... 845534 178751
Contd...
http://indiabudget.nic.in
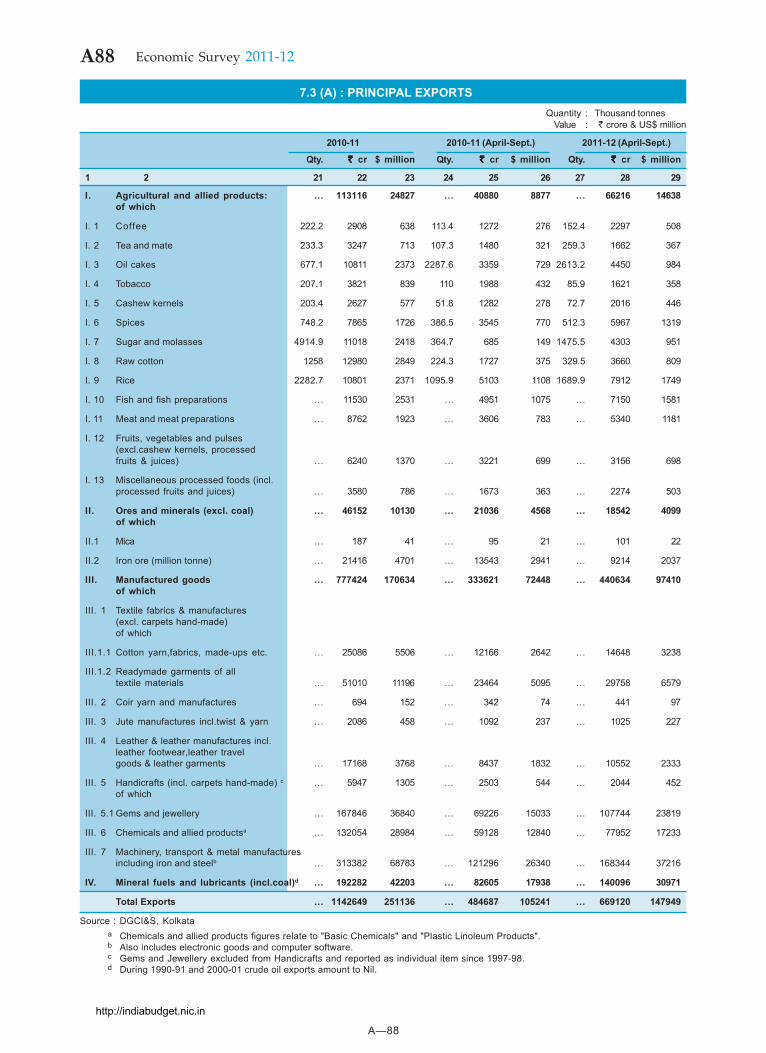
A—88
A88 Economic Survey 2011-12
7.3 (A) : PRINCIPAL EXPORTSQuantity : Thousand tonnes
Value : ` crore & US$ million
2010-11 2010-11 (April-Sept.) 2011-12 (April-Sept.)
Qty. ` ` ` ` ` cr $ million Qty. ` ` ` ` ` cr $ million Qty. ` ` ` ` ` cr $ million
1 2 21 22 23 24 25 26 27 28 29
I. Agricultural and allied products: ... 113116 24827 ... 40880 8877 ... 66216 14638of which
I. 1 Coffee 222.2 2908 638 113.4 1272 276 152.4 2297 508
I. 2 Tea and mate 233.3 3247 713 107.3 1480 321 259.3 1662 367
I. 3 Oil cakes 677.1 10811 2373 2287.6 3359 729 2613.2 4450 984
I. 4 Tobacco 207.1 3821 839 110 1988 432 85.9 1621 358
I. 5 Cashew kernels 203.4 2627 577 51.8 1282 278 72.7 2016 446
I. 6 Spices 748.2 7865 1726 386.5 3545 770 512.3 5967 1319
I. 7 Sugar and molasses 4914.9 11018 2418 364.7 685 149 1475.5 4303 951
I. 8 Raw cotton 1258 12980 2849 224.3 1727 375 329.5 3660 809
I. 9 Rice 2282.7 10801 2371 1095.9 5103 1108 1689.9 7912 1749
I. 10 Fish and fish preparations ... 11530 2531 ... 4951 1075 ... 7150 1581
I. 11 Meat and meat preparations ... 8762 1923 ... 3606 783 ... 5340 1181
I. 12 Fruits, vegetables and pulses(excl.cashew kernels, processedfruits & juices) ... 6240 1370 ... 3221 699 ... 3156 698
I. 13 Miscellaneous processed foods (incl.processed fruits and juices) ... 3580 786 ... 1673 363 ... 2274 503
II. Ores and minerals (excl. coal) ... 46152 10130 ... 21036 4568 ... 18542 4099of which
II.1 Mica ... 187 41 ... 95 21 ... 101 22
II.2 Iron ore (million tonne) ... 21416 4701 ... 13543 2941 ... 9214 2037
III. Manufactured goods ... 777424 170634 ... 333621 72448 ... 440634 97410of which
III. 1 Textile fabrics & manufactures(excl. carpets hand-made)of which
III.1.1 Cotton yarn,fabrics, made-ups etc. ... 25086 5506 ... 12166 2642 ... 14648 3238
III.1.2 Readymade garments of alltextile materials ... 51010 11196 ... 23464 5095 ... 29758 6579
III. 2 Coir yarn and manufactures ... 694 152 ... 342 74 ... 441 97
III. 3 Jute manufactures incl.twist & yarn ... 2086 458 ... 1092 237 ... 1025 227
III. 4 Leather & leather manufactures incl.leather footwear,leather travelgoods & leather garments ... 17168 3768 ... 8437 1832 ... 10552 2333
III. 5 Handicrafts (incl. carpets hand-made) c ... 5947 1305 ... 2503 544 ... 2044 452of which
III. 5.1 Gems and jewellery ... 167846 36840 ... 69226 15033 ... 107744 23819
III. 6 Chemicals and allied productsa ... 132054 28984 ... 59128 12840 ... 77952 17233
III. 7 Machinery, transport & metal manufacturesincluding iron and steelb ... 313382 68783 ... 121296 26340 ... 168344 37216
IV. Mineral fuels and lubricants (incl.coal)d ... 192282 42203 ... 82605 17938 ... 140096 30971
Total Exports ... 1142649 251136 ... 484687 105241 ... 669120 147949
Source : DGCI&S, Kolkataa Chemicals and allied products figures relate to "Basic Chemicals" and "Plastic Linoleum Products".b Also includes electronic goods and computer software.c Gems and Jewellery excluded from Handicrafts and reported as individual item since 1997-98.d During 1990-91 and 2000-01 crude oil exports amount to Nil.
http://indiabudget.nic.in
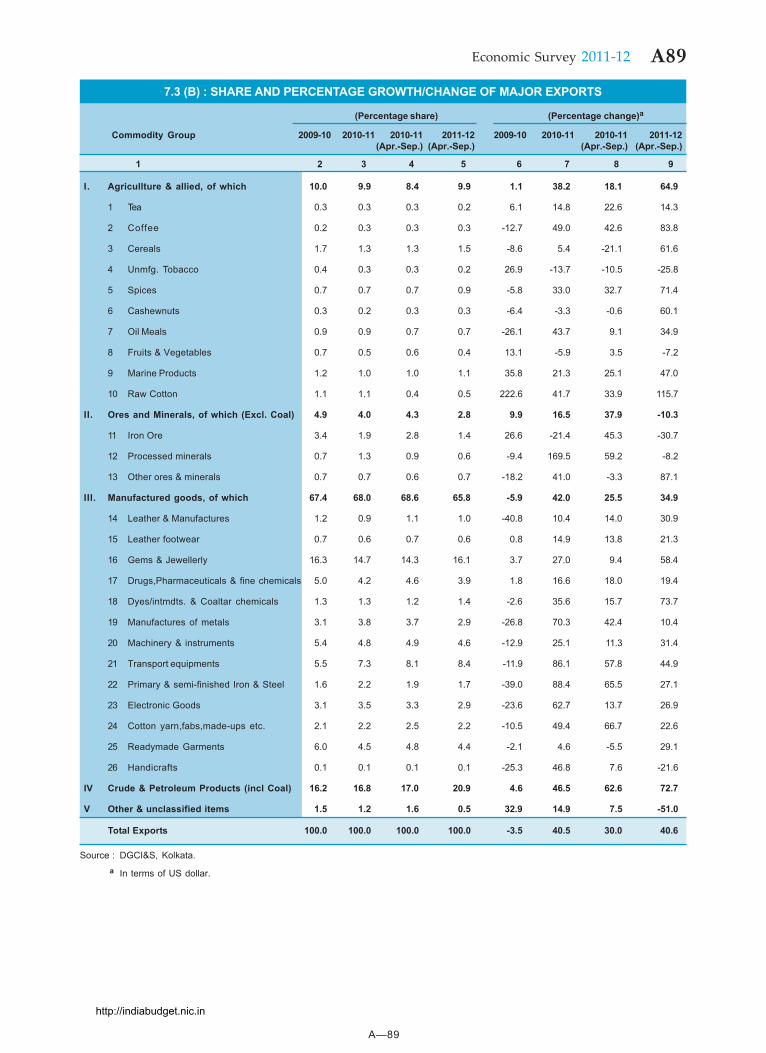
A—89
A89Economic Survey 2011-12
7.3 (B) : SHARE AND PERCENTAGE GROWTH/CHANGE OF MAJOR EXPORTS
(Percentage share) (Percentage change)a
Commodity Group 2009-10 2010-11 2010-11 2011-12 2009-10 2010-11 2010-11 2011-12(Apr.-Sep.) (Apr.-Sep.) (Apr.-Sep.) (Apr.-Sep.)
1 2 3 4 5 6 7 8 9
I. Agricullture & allied, of which 10.0 9.9 8.4 9.9 1.1 38.2 18.1 64.9
1 Tea 0.3 0.3 0.3 0.2 6.1 14.8 22.6 14.3
2 Coffee 0.2 0.3 0.3 0.3 -12.7 49.0 42.6 83.8
3 Cereals 1.7 1.3 1.3 1.5 -8.6 5.4 -21.1 61.6
4 Unmfg. Tobacco 0.4 0.3 0.3 0.2 26.9 -13.7 -10.5 -25.8
5 Spices 0.7 0.7 0.7 0.9 -5.8 33.0 32.7 71.4
6 Cashewnuts 0.3 0.2 0.3 0.3 -6.4 -3.3 -0.6 60.1
7 Oil Meals 0.9 0.9 0.7 0.7 -26.1 43.7 9.1 34.9
8 Fruits & Vegetables 0.7 0.5 0.6 0.4 13.1 -5.9 3.5 -7.2
9 Marine Products 1.2 1.0 1.0 1.1 35.8 21.3 25.1 47.0
10 Raw Cotton 1.1 1.1 0.4 0.5 222.6 41.7 33.9 115.7
II. Ores and Minerals, of which (Excl. Coal) 4.9 4.0 4.3 2.8 9.9 16.5 37.9 -10.3
11 Iron Ore 3.4 1.9 2.8 1.4 26.6 -21.4 45.3 -30.7
12 Processed minerals 0.7 1.3 0.9 0.6 -9.4 169.5 59.2 -8.2
13 Other ores & minerals 0.7 0.7 0.6 0.7 -18.2 41.0 -3.3 87.1
III. Manufactured goods, of which 67.4 68.0 68.6 65.8 -5.9 42.0 25.5 34.9
14 Leather & Manufactures 1.2 0.9 1.1 1.0 -40.8 10.4 14.0 30.9
15 Leather footwear 0.7 0.6 0.7 0.6 0.8 14.9 13.8 21.3
16 Gems & Jewellerly 16.3 14.7 14.3 16.1 3.7 27.0 9.4 58.4
17 Drugs,Pharmaceuticals & fine chemicals 5.0 4.2 4.6 3.9 1.8 16.6 18.0 19.4
18 Dyes/intmdts. & Coaltar chemicals 1.3 1.3 1.2 1.4 -2.6 35.6 15.7 73.7
19 Manufactures of metals 3.1 3.8 3.7 2.9 -26.8 70.3 42.4 10.4
20 Machinery & instruments 5.4 4.8 4.9 4.6 -12.9 25.1 11.3 31.4
21 Transport equipments 5.5 7.3 8.1 8.4 -11.9 86.1 57.8 44.9
22 Primary & semi-finished Iron & Steel 1.6 2.2 1.9 1.7 -39.0 88.4 65.5 27.1
23 Electronic Goods 3.1 3.5 3.3 2.9 -23.6 62.7 13.7 26.9
24 Cotton yarn,fabs,made-ups etc. 2.1 2.2 2.5 2.2 -10.5 49.4 66.7 22.6
25 Readymade Garments 6.0 4.5 4.8 4.4 -2.1 4.6 -5.5 29.1
26 Handicrafts 0.1 0.1 0.1 0.1 -25.3 46.8 7.6 -21.6
IV Crude & Petroleum Products (incl Coal) 16.2 16.8 17.0 20.9 4.6 46.5 62.6 72.7
V Other & unclassified items 1.5 1.2 1.6 0.5 32.9 14.9 7.5 -51.0
Total Exports 100.0 100.0 100.0 100.0 -3.5 40.5 30.0 40.6
Source : DGCI&S, Kolkata.a In terms of US dollar.
http://indiabudget.nic.in
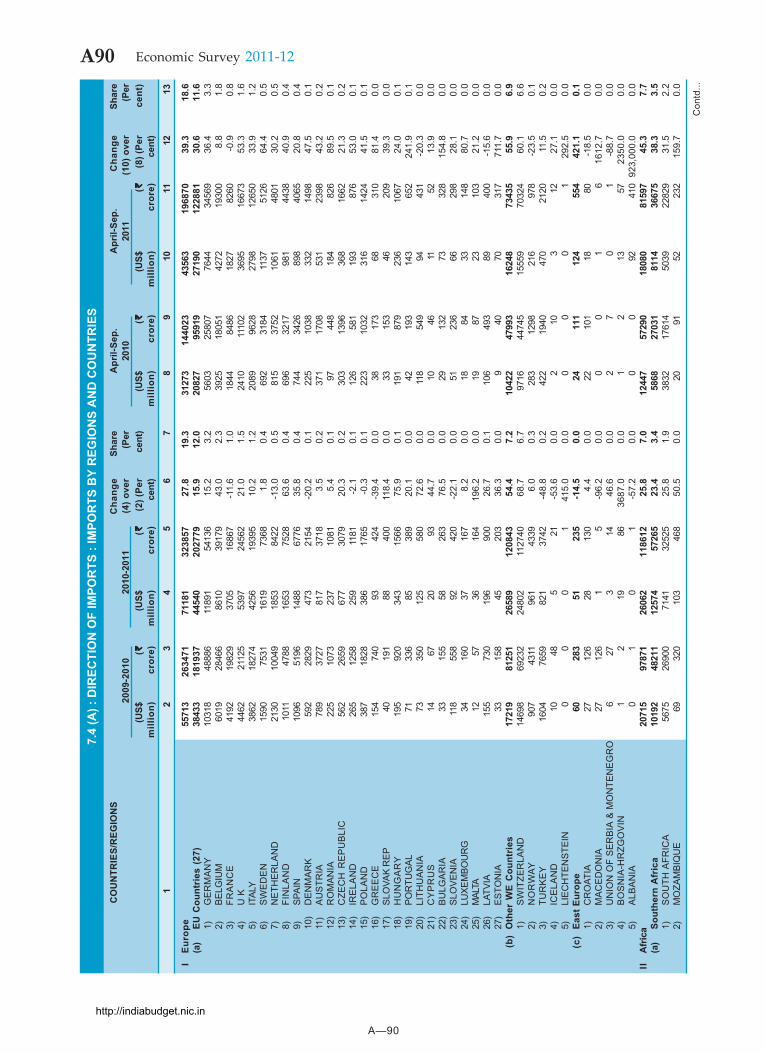
A—90
A90 Economic Survey 2011-12
Con
td...
7.4
(A) :
DIR
ECTI
ON
OF
IMPO
RTS
: IM
POR
TS B
Y R
EGIO
NS
AN
D C
OU
NTR
IES
CO
UN
TRIE
S/R
EGIO
NS
Cha
nge
Shar
eA
pril-
Sep.
Apr
il-Se
p.C
hang
eSh
are
2009
-201
020
10-2
011
(4) o
ver
(Per
2010
2011
(10)
ove
r(P
er(U
S$( `̀̀̀̀
(US$
( `̀̀̀̀(2
) (Pe
rce
nt)
(US$
( `̀̀̀̀(U
S$( `̀̀̀̀
(8) (
Per
cent
)m
illio
n)cr
ore)
mill
ion)
cror
e)ce
nt)
mill
ion)
cror
e)m
illio
n)cr
ore)
cent
)1
23
45
67
89
1011
1213
IE
urop
e55
713
2634
7171
181
3238
5727
.819
.331
273
1440
2343
563
1968
7039
.318
.6(a
)EU
Cou
ntri
es (
27)
3843
318
1937
4454
020
2779
15.9
12.0
2082
795
919
2719
012
2881
30.6
11.6
1)G
ER
MA
NY
1031
848
886
1189
154
136
15.2
3.2
5603
2580
776
4434
569
36.4
3.3
2)BE
LGIU
M60
1928
466
8610
3917
943
.02.
339
2518
051
4272
1930
08.
81.
83)
FRA
NC
E41
9219
829
3705
1686
7-1
1.6
1.0
1844
8486
1827
8260
-0.9
0.8
4)U
K44
6221
125
5397
2456
221
.01.
524
1011
102
3695
1667
353
.31.
65)
ITAL
Y38
6218
274
4256
1939
510
.21.
220
8996
2827
9812
650
33.9
1.2
6)S
WE
DE
N15
9075
3116
1973
681.
80.
469
231
8411
3751
2664
.40.
57)
NE
THE
RLA
ND
2130
1004
918
5384
22-1
3.0
0.5
815
3752
1061
4801
30.2
0.5
8)FI
NLA
ND
1011
4788
1653
7528
63.6
0.4
696
3217
981
4438
40.9
0.4
9)SP
AIN
1096
5196
1488
6776
35.8
0.4
744
3426
898
4065
20.8
0.4
10)
DE
NM
AR
K59
228
2947
321
54-2
0.2
0.1
225
1038
332
1498
47.5
0.1
11)
AU
STR
IA78
937
2781
737
183.
50.
237
117
0853
123
9843
.20.
212
)R
OM
AN
IA22
510
7323
710
815.
40.
197
448
184
826
89.5
0.1
13)
CZE
CH
RE
PU
BLI
C56
226
5967
730
7920
.30.
230
313
9636
816
6221
.30.
214
)IR
ELA
ND
265
1258
259
1181
-2.1
0.1
126
581
193
876
53.0
0.1
15)
PO
LAN
D38
718
2838
617
65-0
.30.
122
310
3231
614
2441
.50.
116
)G
RE
EC
E15
474
093
424
-39.
40.
038
173
6831
081
.40.
017
)S
LOVA
K R
EP
4019
188
400
118.
40.
033
153
4620
939
.30.
018
)H
UN
GA
RY
195
920
343
1566
75.9
0.1
191
879
236
1067
24.0
0.1
19)
POR
TUG
AL71
336
8538
920
.10.
042
193
143
652
241.
90.
120
)LI
THU
AN
IA73
350
125
580
72.6
0.0
118
549
9443
1-2
0.3
0.0
21)
CY
PR
US
1467
2093
44.7
0.0
1046
1152
13.9
0.0
22)
BU
LGA
RIA
3315
558
263
76.5
0.0
2913
273
328
154.
80.
023
)S
LOV
EN
IA11
855
892
420
-22.
10.
051
236
6629
828
.10.
024
)LU
XEM
BOU
RG
3416
037
167
8.2
0.0
1884
3314
880
.70.
025
)M
ALTA
1257
3616
419
6.2
0.0
1987
2310
321
.20.
026
)LA
TVIA
155
730
196
900
26.7
0.1
106
493
8940
0-1
5.6
0.0
27)
ES
TON
IA33
158
4520
336
.30.
09
4070
317
711.
70.
0
(
b)O
ther
WE
Cou
ntri
es17
219
8125
126
589
1208
4354
.47.
210
422
4799
316
248
7343
555
.96.
91)
SW
ITZE
RLA
ND
1469
869
232
2480
211
2740
68.7
6.7
9716
4474
515
559
7032
460
.16.
62)
NO
RW
AY90
743
1196
143
396.
00.
328
312
9821
697
8-2
3.5
0.1
3)TU
RK
EY
1604
7659
821
3742
-48.
80.
242
219
4047
021
2011
.50.
24)
ICE
LAN
D10
485
21-5
3.6
0.0
210
312
27.1
0.0
5)LI
EC
HTE
NS
TEIN
00
01
415.
00.
00
00
129
2.5
0.0
(c)
East
Eur
ope
6028
351
235
-14.
50.
024
111
124
554
421.
10.
11)
CR
OAT
IA27
126
2813
04.
40.
022
101
1880
-18.
50.
02)
MA
CE
DO
NIA
2712
61
5-9
6.2
0.0
00
16
1612
.70.
03)
UN
ION
OF
SE
RB
IA &
MO
NTE
NE
GR
O6
273
1446
.60.
02
70
1-8
8.7
0.0
4)B
OS
NIA
-HR
ZGO
VIN
12
1986
3687
.00.
01
213
5723
50.0
0.0
5)A
LBA
NIA
01
01
-57.
20.
00
092
410
923,
000.
00.
0II
Afr
ica
2071
597
871
2606
211
8612
25.8
7.0
1244
757
290
1808
081
597
45.3
7.7
(a)
Sout
hern
Afr
ica
1019
248
211
1257
457
265
23.4
3.4
5868
2703
181
1436
675
38.3
3.5
1)S
OU
TH A
FRIC
A56
7526
900
7141
3252
525
.81.
938
3217
614
5039
2282
931
.52.
22)
MO
ZAM
BIQ
UE
6932
010
346
850
.50.
020
9152
232
159.
70.
0
http://indiabudget.nic.in
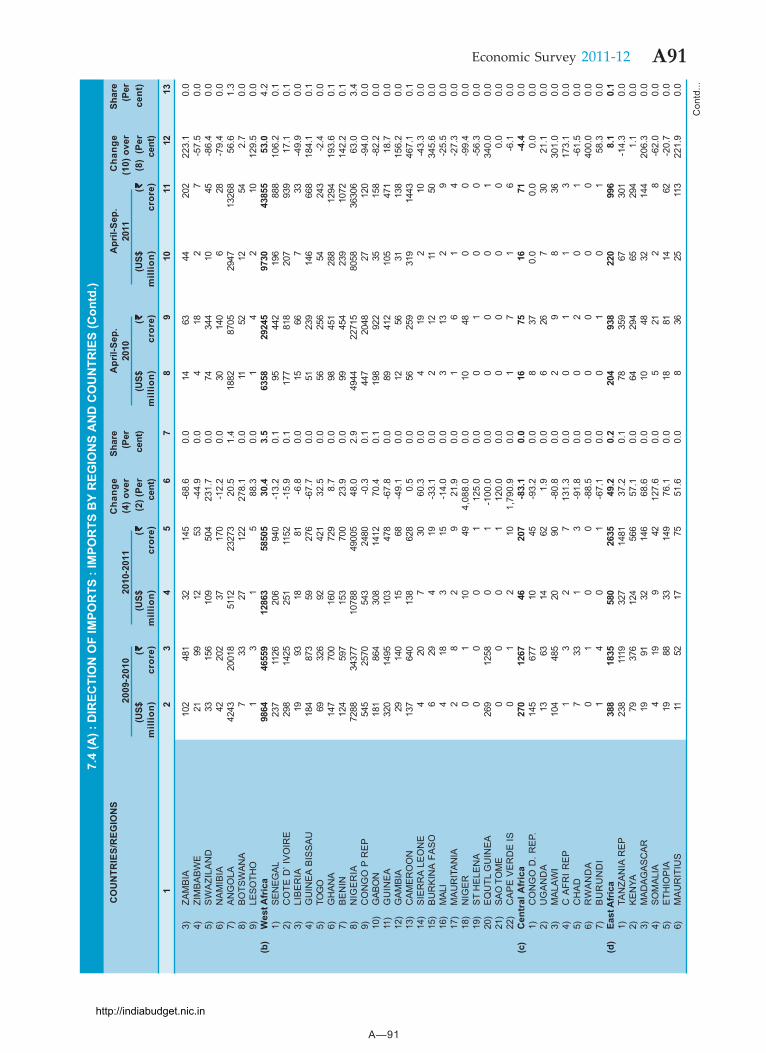
A—91
A91Economic Survey 2011-12
7.4
(A) :
DIR
ECTI
ON
OF
IMPO
RTS
: IM
POR
TS B
Y R
EGIO
NS
AN
D C
OU
NTR
IES
(Con
td.)
CO
UN
TRIE
S/R
EGIO
NS
Cha
nge
Shar
eA
pril-
Sep.
Apr
il-Se
p.C
hang
eSh
are
2009
-201
020
10-2
011
(4) o
ver
(Per
2010
2011
(10)
ove
r(P
er(U
S$( `̀̀̀̀
(US$
( `̀̀̀̀(2
) (Pe
rce
nt)
(US$
( `̀̀̀̀(U
S$( `̀̀̀̀
(8)
(Per
cent
)m
illio
n)cr
ore)
mill
ion)
cror
e)ce
nt)
mill
ion)
cror
e)m
illio
n)cr
ore)
cent
)1
23
45
67
89
1011
1213
3)ZA
MB
IA10
248
132
145
-68.
60.
014
6344
202
223.
10.
04)
ZIM
BA
BW
E21
9912
53-4
4.9
0.0
418
27
-57.
50.
05)
SW
AZI
LAN
D33
156
109
504
231.
70.
074
344
1045
-86.
40.
06)
NA
MIB
IA42
202
3717
0-1
2.2
0.0
3014
06
28-7
9.4
0.0
7)A
NG
OLA
4243
2001
851
1223
273
20.5
1.4
1882
8705
2947
1326
856
.61.
38)
BOTS
WAN
A7
3327
122
278.
10.
011
5212
542.
70.
09)
LESO
THO
13
15
88.3
0.0
14
210
129.
50.
0(b
)W
est A
fric
a98
6446
559
1286
358
505
30.4
3.5
6358
2924
597
3043
855
53.0
4.2
1)SE
NEG
AL23
711
2620
694
0-1
3.2
0.1
9544
219
688
810
6.2
0.1
2)C
OTE
D’ I
VO
IRE
298
1425
251
1152
-15.
90.
117
781
820
793
917
.10.
13)
LIB
ER
IA19
9318
81-6
.80.
015
667
33-4
9.9
0.0
4)G
UIN
EA
BIS
SA
U18
487
359
276
-67.
70.
051
239
146
668
184.
10.
15)
TOG
O69
326
9242
132
.50.
056
256
5424
3-2
.40.
06)
GH
ANA
147
700
160
729
8.7
0.0
9845
128
812
9419
3.6
0.1
7)B
EN
IN12
459
715
370
023
.90.
099
454
239
1072
142.
20.
18)
NIG
ER
IA72
8834
377
1078
849
005
48.0
2.9
4944
2271
580
5836
306
63.0
3.4
9)C
ON
GO
P R
EP
545
2570
543
2480
-0.3
0.1
447
2048
2712
0-9
4.0
0.0
10)
GAB
ON
181
864
308
1412
70.4
0.1
198
922
3515
8-8
2.2
0.0
11)
GU
INE
A32
014
9510
347
8-6
7.8
0.0
8941
210
547
118
.70.
012
)G
AMBI
A29
140
1568
-49.
10.
012
5631
138
156.
20.
013
)C
AM
ER
OO
N13
764
013
862
80.
50.
056
259
319
1443
467.
10.
114
)S
IER
RA
LE
ON
E4
207
3060
.30.
04
192
10-4
3.3
0.0
15)
BU
RK
INA
FA
SO
629
419
-33.
10.
02
1211
5034
5.6
0.0
16)
MAL
I4
183
15-1
4.0
0.0
313
29
-25.
50.
017
)M
AU
RIT
AN
IA2
82
921
.90.
01
61
4-2
7.3
0.0
18)
NIG
ER
01
1049
4,08
8.0
0.0
1048
00
-99.
40.
019
)S
T H
ELE
NA
00
01
125.
00.
00
10
0-5
6.3
0.0
20)
EQ
UTL
GU
INE
A26
912
580
1-1
00.0
0.0
00
01
340.
00.
021
)SA
O T
OM
E0
00
112
0.0
0.0
00
00
0.0
0.0
22)
CA
PE
VE
RD
E IS
01
210
1,79
0.9
0.0
17
16
-6.1
0.0
(c)
Cen
tral
Afr
ica
270
1267
4620
7-8
3.1
0.0
1675
1671
-4.4
0.0
1)C
ON
GO
D. R
EP.
145
677
1045
-93.
20.
08
370.
00.
00.
00.
02)
UG
AN
DA
1363
1462
1.9
0.0
626
730
21.1
0.0
3)M
ALA
WI
104
485
2090
-80.
80.
02
98
3630
1.0
0.0
4)C
AFR
I R
EP
13
27
131.
30.
00
11
317
3.1
0.0
5)C
HA
D7
331
3-9
1.8
0.0
02
01
-61.
50.
06)
RW
AN
DA
01
00
-88.
50.
00
00
040
0.0
0.0
7)B
UR
UN
DI
14
01
-67.
10.
00
10
158
.30.
0(d
)Ea
st A
fric
a38
818
3558
026
3549
.20.
220
493
822
099
68.
10.
11)
TAN
ZAN
IA R
EP
238
1119
327
1481
37.2
0.1
7835
967
301
-14.
30.
02)
KEN
YA79
376
124
566
57.1
0.0
6429
465
294
1.1
0.0
3)M
ADAG
ASC
AR19
9132
146
68.6
0.0
1048
3214
420
6.3
0.0
4)SO
MAL
IA4
199
4212
7.6
0.0
521
28
-62.
00.
05)
ETH
IOP
IA19
8833
149
76.1
0.0
1881
1462
-20.
70.
06)
MA
UR
ITIU
S11
5217
7551
.60.
08
3625
113
221.
90.
0
Con
td...
http://indiabudget.nic.in
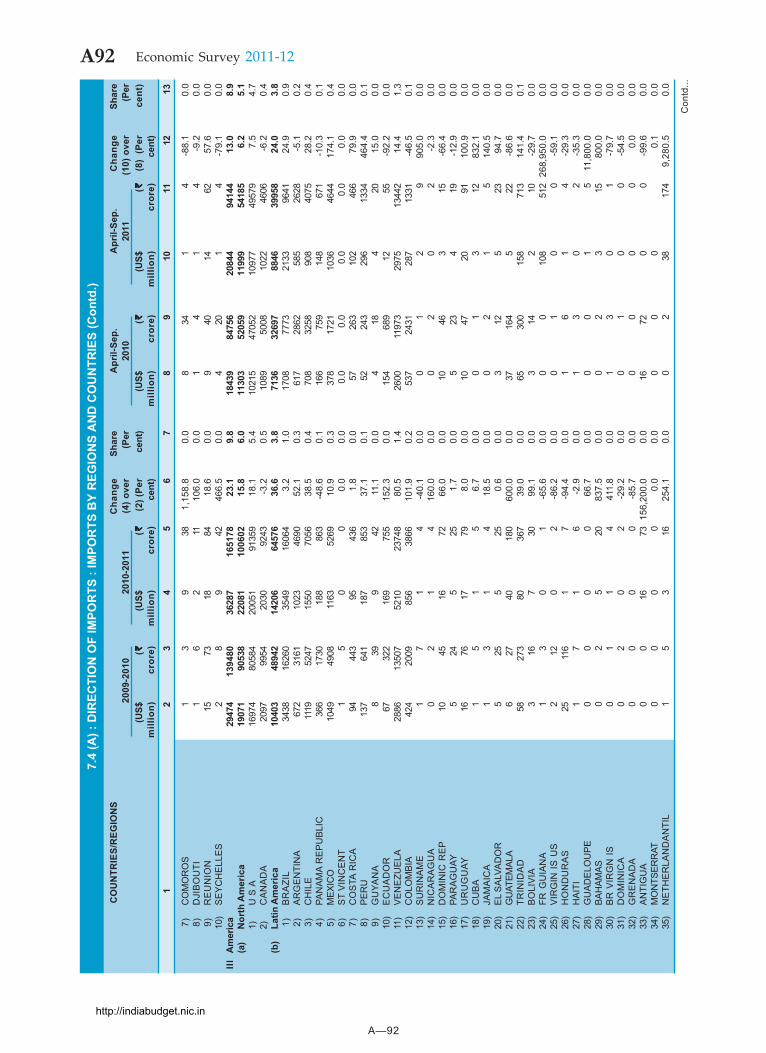
A—92
A92 Economic Survey 2011-12
Con
td...
7.4
(A) :
DIR
ECTI
ON
OF
IMPO
RTS
: IM
POR
TS B
Y R
EGIO
NS
AN
D C
OU
NTR
IES
(Con
td.)
CO
UN
TRIE
S/R
EGIO
NS
Cha
nge
Shar
eA
pril-
Sep.
Apr
il-Se
p.C
hang
eSh
are
2009
-201
020
10-2
011
(4) o
ver
(Per
2010
2011
(10)
ove
r(P
er(U
S$( `̀̀̀̀
(US$
( `̀̀̀̀(2
) (Pe
rce
nt)
(US$
( `̀̀̀̀(U
S$( `̀̀̀̀
(8)
(Per
cent
)m
illio
n)cr
ore)
mill
ion)
cror
e)ce
nt)
mill
ion)
cror
e)m
illio
n)cr
ore)
cent
)1
23
45
67
89
1011
1213
7)
CO
MO
RO
S1
39
381,
158.
80.
08
341
4-8
8.1
0.0
8)
DJI
BO
UTI
16
211
106.
00.
01
41
4-9
.20.
0 9
)R
EU
NIO
N15
7318
8418
.60.
09
4014
6257
.60.
010
)S
EY
CH
ELL
ES
28
942
466.
50.
04
201
4-7
9.1
0.0
IIIA
mer
ica
2947
413
9480
3628
716
5178
23.1
9.8
1843
984
756
2084
494
144
13.0
8.9
(a)
Nor
th A
mer
ica
1907
190
538
2208
110
0602
15.8
6.0
1130
352
059
1199
954
185
6.2
5.1
1)U
S A
1697
480
584
2005
191
359
18.1
5.4
1021
547
052
1097
749
579
7.5
4.7
2)C
AN
AD
A20
9799
5420
3092
43-3
.20.
510
8950
0810
2246
06-6
.20.
4(b
)La
tin A
mer
ica
1040
348
942
1420
664
576
36.6
3.8
7136
3269
788
4639
958
24.0
3.8
1)
BR
AZI
L34
3816
260
3549
1606
43.
21.
017
0877
7321
3396
4124
.90.
9 2
)A
RG
EN
TIN
A67
231
6110
2346
9052
.10.
361
728
6258
526
28-5
.10.
2 3
)C
HIL
E11
1952
4715
5070
5638
.50.
470
832
5890
840
7528
.20.
4 4
)PA
NA
MA
RE
PU
BLI
C36
617
3018
886
3-4
8.6
0.1
166
759
148
671
-10.
30.
1 5
)M
EXIC
O10
4949
0811
6352
6910
.90.
337
817
2110
3646
4417
4.1
0.4
6)
ST
VIN
CE
NT
15
00
0.0
0.0
0.0
0.0
0.0
0.0
0.0
0.0
7)
CO
STA
RIC
A94
443
9543
61.
80.
057
263
102
466
79.9
0.0
8)
PER
U13
764
118
785
337
.10.
152
243
296
1334
464.
40.
1 9
)G
UYA
NA
839
942
11.1
0.0
418
420
15.0
0.0
10)
EC
UA
DO
R67
322
169
755
152.
30.
015
468
912
55-9
2.2
0.0
11)
VE
NE
ZUE
LA28
8613
507
5210
2374
880
.51.
426
0011
973
2975
1344
214
.41.
312
)C
OLO
MBI
A42
420
0985
638
6610
1.9
0.2
537
2431
287
1331
-46.
50.
113
)S
UR
INA
ME
17
14
-40.
10.
00
12
990
5.0
0.0
14)
NIC
AR
AG
UA
02
14
160.
00.
00
20
2-2
.30.
015
)D
OM
INIC
RE
P10
4516
7266
.00.
010
463
15-6
6.4
0.0
16)
PAR
AG
UAY
524
525
1.7
0.0
523
419
-12.
90.
017
)U
RU
GU
AY16
7617
798.
00.
010
4720
9110
0.9
0.0
18)
CU
BA
15
15
6.7
0.0
01
312
832.
10.
019
)JA
MA
ICA
13
14
18.5
0.0
02
15
140.
50.
020
)E
L S
ALV
AD
OR
525
525
0.6
0.0
312
523
94.7
0.0
21)
GU
ATEM
ALA
627
4018
060
0.0
0.0
3716
45
22-8
6.6
0.0
22)
TRIN
IDA
D58
273
8036
739
.00.
065
300
158
713
141.
40.
123
)B
OLI
VIA
316
730
99.1
0.0
314
210
-29.
70.
024
)FR
GU
IAN
A1
30
1-6
5.6
0.0
00
108
512
268,
950.
00.
025
)V
IRG
IN IS
US
212
02
-86.
20.
00
10
0-5
9.1
0.0
26)
HO
ND
UR
AS
2511
61
7-9
4.4
0.0
16
14
-29.
30.
027
)H
AIT
I1
71
6-2
.90.
01
30
2-3
5.3
0.0
28)
GU
AD
ELO
UP
E0
00
066
.70.
00
01
511
,800
.00.
029
)BA
HAM
AS0
25
2083
7.5
0.0
02
315
800.
00.
030
)B
R V
IRG
N IS
01
14
411.
80.
01
30
1-7
9.7
0.0
31)
DO
MIN
ICA
02
02
-29.
20.
00
10
0-5
4.5
0.0
32)
GR
EN
AD
A0
00
0-8
5.7
0.0
00
00
0.0
0.0
33)
AN
TIG
UA
00
1673
156,
200.
00.
016
720
0-9
9.6
0.0
34)
MO
NTS
ERR
AT0
00
00.
00.
00
00
0.
10.
035
)N
ETH
ER
LAN
DA
NTI
L1
53
1625
4.1
0.0
02
3817
49,
280.
50.
0
http://indiabudget.nic.in
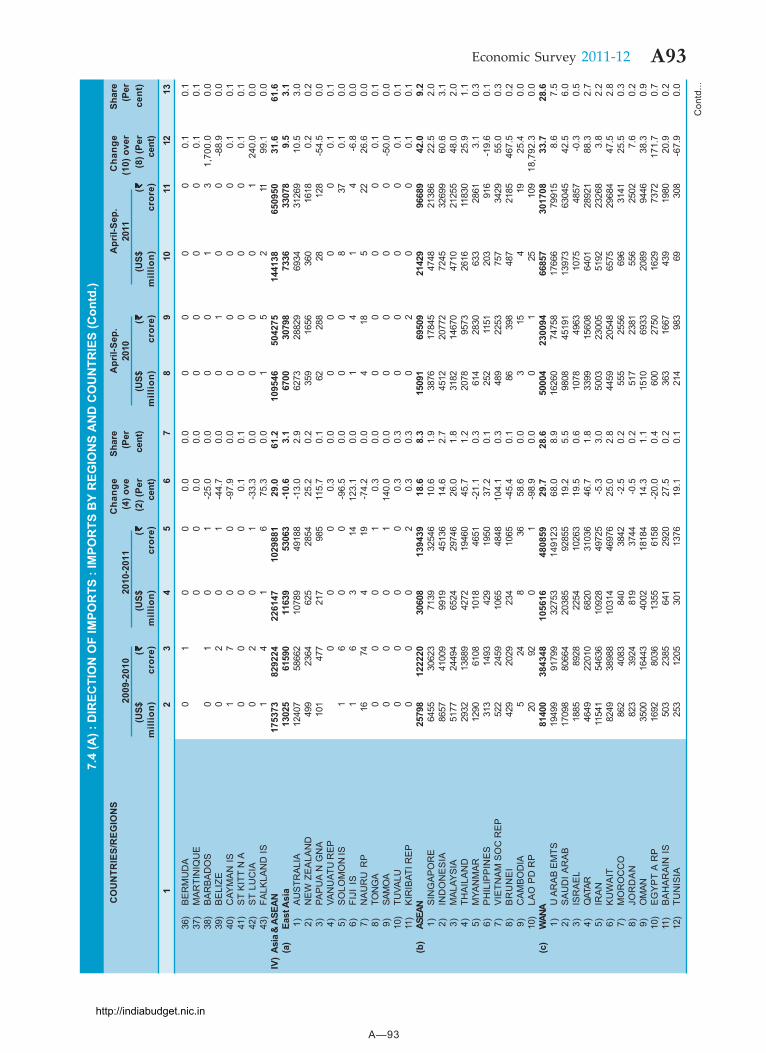
A—93
A93Economic Survey 2011-12
Con
td...
36)
BE
RM
UD
A0
10
00.
00.
00
00
00.
10.
137
)M
AR
TIN
IQU
E
0
00.
00.
00
00
00.
10.
138
)B
AR
BA
DO
S0
10
1-2
5.0
0.0
00
13
1,70
0.0
0.0
39)
BE
LIZE
02
01
-44.
70.
00
10
0-8
8.9
0.0
40)
CAY
MA
N IS
17
00
-97.
90.
00
00
00.
10.
141
)S
T K
ITT
N A
00
00
0.1
0.1
00
00
0.1
0.1
42)
ST
LUC
IA0
20
1-3
3.3
0.0
00
01
240.
00.
043
)FA
LKLA
ND
IS1
41
675
.30.
01
52
1199
.10.
0IV
)As
ia &
ASE
AN17
5373
8292
2422
6147
1029
881
29.0
61.2
1095
4650
4275
1441
3865
0950
31.6
61.6
(a)
East
Asi
a13
025
6159
011
639
5306
3-1
0.6
3.1
6700
3079
873
3633
078
9.5
3.1
1)
AU
STR
ALI
A12
407
5866
210
789
4918
8-1
3.0
2.9
6273
2882
969
3431
269
10.5
3.0
2)
NE
W Z
EA
LAN
D49
923
6462
528
5425
.20.
235
916
5636
016
180.
20.
2 3
)PA
PU
A N
GN
A10
147
721
798
511
5.7
0.1
6228
828
128
-54.
50.
0 4
)VA
NU
ATU
RE
P
00
00.
30.
00
00
00.
10.
1 5
)S
OLO
MO
N IS
16
00
-96.
50.
00
08
370.
10.
0 6
)FI
JI I
S1
63
1412
3.1
0.0
14
14
-6.8
0.0
7)
NA
UR
U R
P16
744
19-7
4.2
0.0
418
522
26.6
0.0
8)
TON
GA
00
01
0.3
0.0
00
00
0.1
0.1
9)
SAM
OA
00
01
140.
00.
00
00
0-5
0.0
0.0
10)
TUVA
LU0
00
00.
30.
30
00
00.
10.
111
)K
IRIB
ATI R
EP
00
02
0.3
0.3
02
00
0.1
0.1
(b)
ASEA
N25
798
1222
2030
608
1394
3918
.68.
315
091
6950
921
429
9668
942
.09.
2 1
)S
ING
AP
OR
E64
5530
623
7139
3254
610
.61.
938
7617
845
4748
2138
622
.52.
0 2
)IN
DO
NE
SIA
8657
4100
999
1945
136
14.6
2.7
4512
2077
272
4532
699
60.6
3.1
3)
MAL
AYSI
A51
7724
494
6524
2974
626
.01.
831
8214
670
4710
2125
548
.02.
0 4
)TH
AIL
AN
D29
3213
889
4272
1946
045
.71.
220
7895
7326
1611
830
25.9
1.1
5)
MYA
NM
AR
1290
6108
1018
4651
-21.
10.
361
428
3063
328
613.
10.
3 6
)P
HIL
IPP
INE
S31
314
9342
919
5037
.20.
125
211
5120
391
6-1
9.6
0.1
7)
VIE
TNA
M S
OC
RE
P52
224
5910
6548
4810
4.1
0.3
489
2253
757
3429
55.0
0.3
8)
BR
UN
EI
429
2029
234
1065
-45.
40.
186
398
487
2185
467.
50.
2 9
)C
AM
BO
DIA
524
836
58.6
0.0
315
419
25.4
0.0
10)
LAO
PD
RP
2092
01
-98.
90.
00
125
109
18,7
92.3
0.0
(c)
WAN
A81
400
3843
4810
5616
4808
5929
.728
.650
004
2300
9466
857
3017
0833
.728
.6 1
)U
AR
AB
EM
TS19
499
9179
932
753
1491
2368
.08.
916
260
7475
817
666
7991
58.
67.
5 2
)S
AU
DI A
RA
B17
098
8066
420
385
9285
519
.25.
598
0845
191
1397
363
045
42.5
6.0
3)
ISR
AE
L18
8589
2822
5410
263
19.5
0.6
1078
4963
1075
4857
-0.3
0.5
4)
QAT
AR46
4922
010
6820
3103
646
.71.
833
9915
608
6401
2892
188
.32.
7 5
)IR
AN
1154
154
636
1092
849
725
-5.3
3.0
5003
2300
551
9223
268
3.8
2.2
6)
KU
WA
IT82
4938
988
1031
446
976
25.0
2.8
4459
2054
865
7529
684
47.5
2.8
7)
MO
RO
CC
O86
240
8384
038
42-2
.50.
255
525
5669
631
4125
.50.
3 8
)JO
RD
AN
823
3924
819
3744
-0.5
0.2
517
2381
556
2502
7.6
0.2
9)
OM
AN35
0016
443
4002
1818
414
.31.
115
1069
3320
8994
4638
.30.
910
)E
GY
PT
A R
P16
9280
3613
5561
58-2
0.0
0.4
600
2750
1629
7372
171.
70.
711
)B
AH
AR
AIN
IS50
323
8564
129
2027
.50.
236
316
6743
919
8020
.90.
212
)TU
NIS
IA25
312
0530
113
7619
.10.
121
498
369
308
-67.
90.
0
7.4
(A) :
DIR
ECTI
ON
OF
IMPO
RTS
: IM
POR
TS B
Y R
EGIO
NS
AN
D C
OU
NTR
IES
(Con
td.)
CO
UN
TRIE
S/R
EGIO
NS
Cha
nge
Shar
eA
pril-
Sep.
Apr
il-Se
p.C
hang
eSh
are
2009
-201
020
10-2
011
(4) o
ve(P
er20
1020
11(1
0) o
ver
(Per
(US$
( `̀̀̀̀(U
S$( `̀̀̀̀
(2) (
Per
cent
)(U
S$( `̀̀̀̀
(US$
( `̀̀̀̀(8
) (Pe
rce
nt)
mill
ion)
cror
e)m
illio
n)cr
ore)
cent
)m
illio
n)cr
ore)
mill
ion)
cror
e)ce
nt)
12
34
56
78
910
1112
13
http://indiabudget.nic.in
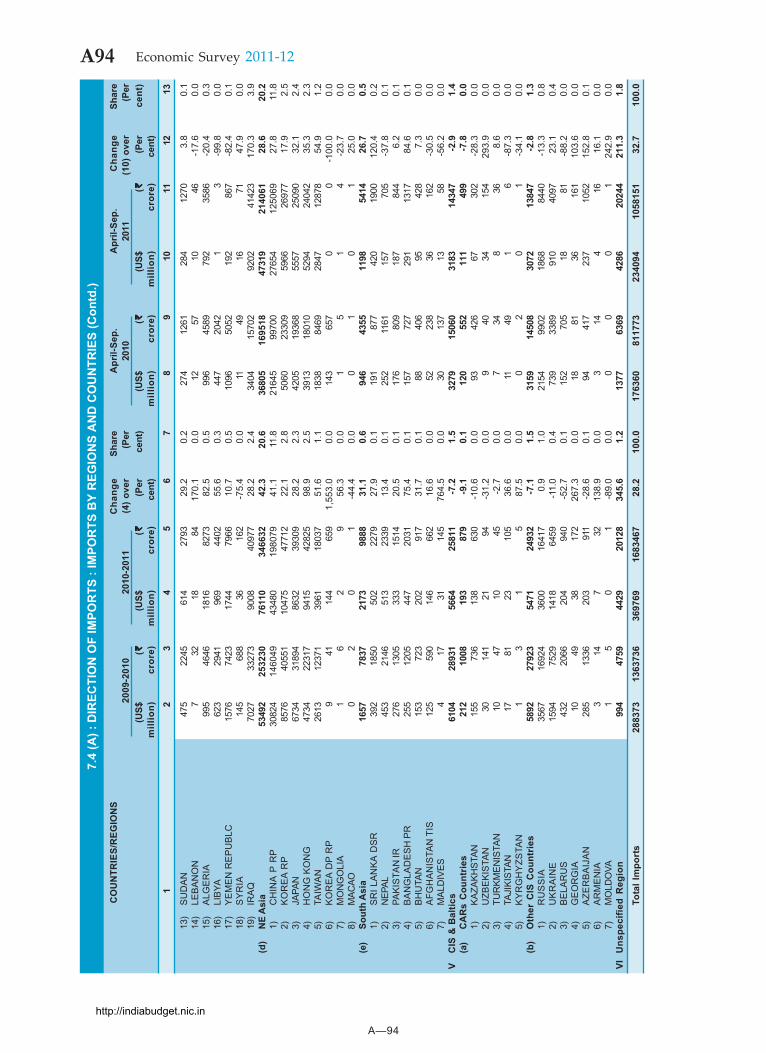
A—94
A94 Economic Survey 2011-12
7.4
(A) :
DIR
ECTI
ON
OF
IMPO
RTS
: IM
POR
TS B
Y R
EGIO
NS
AN
D C
OU
NTR
IES
(Con
td.)
CO
UN
TRIE
S/R
EGIO
NS
Cha
nge
Shar
eA
pril-
Sep.
Apr
il-Se
p.C
hang
eSh
are
2009
-201
020
10-2
011
(4) o
ver
(Per
2010
2011
(10)
ove
r(P
er(U
S$( `̀̀̀̀
(US$
( `̀̀̀̀(P
erce
nt)
(US$
( `̀̀̀̀(U
S$( `̀̀̀̀
(Per
cent
)m
illio
n)cr
ore)
mill
ion)
cror
e)ce
nt)
mill
ion)
cror
e)m
illio
n)cr
ore)
cent
)1
23
45
67
89
1011
1213
13)
SU
DA
N47
522
4561
427
9329
.20.
227
412
6128
412
703.
80.
114
)LE
BA
NO
N7
3218
8417
0.1
0.0
1257
1046
-17.
60.
015
)A
LGE
RIA
995
4646
1816
8273
82.5
0.5
996
4589
792
3586
-20.
40.
316
)LI
BYA
623
2941
969
4402
55.6
0.3
447
2042
13
-99.
80.
017
)Y
EM
EN
RE
PU
BLC
1576
7423
1744
7966
10.7
0.5
1096
5052
192
867
-82.
40.
118
)S
YR
IA14
568
836
162
-75.
40.
011
4916
7147
.90.
019
)IR
AQ
7027
3327
390
0840
977
28.2
2.4
3404
1570
292
0241
423
170.
33.
9(d
)N
E A
sia
5349
225
3230
7611
034
6632
42.3
20.6
3680
516
9518
4731
921
4061
28.6
20.2
1)C
HIN
A P
RP
3082
414
6049
4348
019
8079
41.1
11.8
2164
599
700
2765
412
5069
27.8
11.8
2)K
OR
EA
RP
8576
4055
110
475
4771
222
.12.
850
6023
309
5966
2697
717
.92.
53)
JAPA
N67
3431
894
8632
3930
928
.22.
342
0519
368
5557
2509
032
.12.
44)
HO
NG
KO
NG
4734
2231
794
1542
825
98.9
2.5
3913
1801
052
9424
042
35.3
2.3
5)TA
IWA
N26
1312
371
3961
1803
751
.61.
118
3884
6928
4712
878
54.9
1.2
6)K
OR
EA
DP
RP
941
144
659
1,55
3.0
0.0
143
657
00
-100
.00.
07)
MO
NG
OLI
A1
62
956
.30.
01
51
4-2
3.7
0.0
8)M
ACAO
02
01
-44.
40.
00
10
125
.00.
0(e
)So
uth
Asi
a16
5778
3721
7398
8831
.10.
694
643
5511
9854
1426
.70.
51)
SR
I LA
NK
A D
SR
392
1850
502
2279
27.9
0.1
191
877
420
1900
120.
40.
22)
NEP
AL45
321
4651
323
3913
.40.
125
211
6115
770
5-3
7.8
0.1
3)PA
KIS
TAN
IR27
613
0533
315
1420
.50.
117
680
918
784
46.
20.
14)
BA
NG
LAD
ES
H P
R25
512
0544
720
3175
.40.
115
772
729
113
1784
.60.
15)
BH
UTA
N15
372
320
291
731
.70.
188
406
9542
87.
30.
06)
AFG
HA
NIS
TAN
TIS
125
590
146
662
16.6
0.0
5223
836
162
-30.
50.
07)
MAL
DIV
ES4
1731
145
764.
50.
030
137
1358
-56.
20.
0V
CIS
& B
altic
s61
0428
931
5664
2581
1-7
.21.
532
7915
060
3183
1434
7-2
.91.
4(a
)C
AR
s C
ount
ries
212
1008
193
879
-9.1
0.1
120
552
111
499
-7.8
0.0
1)KA
ZAKH
STAN
155
736
138
630
-10.
60.
093
426
6730
2-2
8.3
0.0
2)U
ZBE
KIS
TAN
3014
121
94-3
1.2
0.0
940
3415
429
3.9
0.0
3)TU
RKM
ENIS
TAN
1047
1045
-2.7
0.0
734
836
8.6
0.0
4)TA
JIKI
STAN
1781
2310
536
.60.
011
491
6-8
7.3
0.0
5)K
YR
GH
YZS
TAN
13
15
87.5
0.0
02
01
-34.
10.
0(b
)O
ther
CIS
Cou
ntri
es58
9227
923
5471
2493
2-7
.11.
531
5914
508
3072
1384
7-2
.81.
31)
RU
SS
IA35
6716
924
3600
1641
70.
91.
021
5499
0218
6884
40-1
3.3
0.8
2)U
KR
AIN
E15
9475
2914
1864
59-1
1.0
0.4
739
3389
910
4097
23.1
0.4
3)B
ELA
RU
S43
220
6620
494
0-5
2.7
0.1
152
705
1881
-88.
20.
04)
GE
OR
GIA
1049
3817
226
7.3
0.0
1881
3616
110
3.6
0.0
5)A
ZER
BA
IJA
N28
513
3620
391
1-2
8.6
0.1
9441
723
710
5215
2.8
0.1
6)A
RM
EN
IA3
147
3213
8.9
0.0
314
416
16.1
0.0
7)M
OLD
OVA
15
01
-89.
00.
00
00
124
2.9
0.0
VIU
nspe
cifie
d R
egio
n99
447
5944
2920
128
345.
61.
213
7763
6942
8620
244
211.
31.
8
Tota
l Im
port
s28
8373
1363
736
3697
6916
8346
728
.210
0.0
1763
6081
1773
2340
9410
5815
132
.710
0.0
http://indiabudget.nic.in
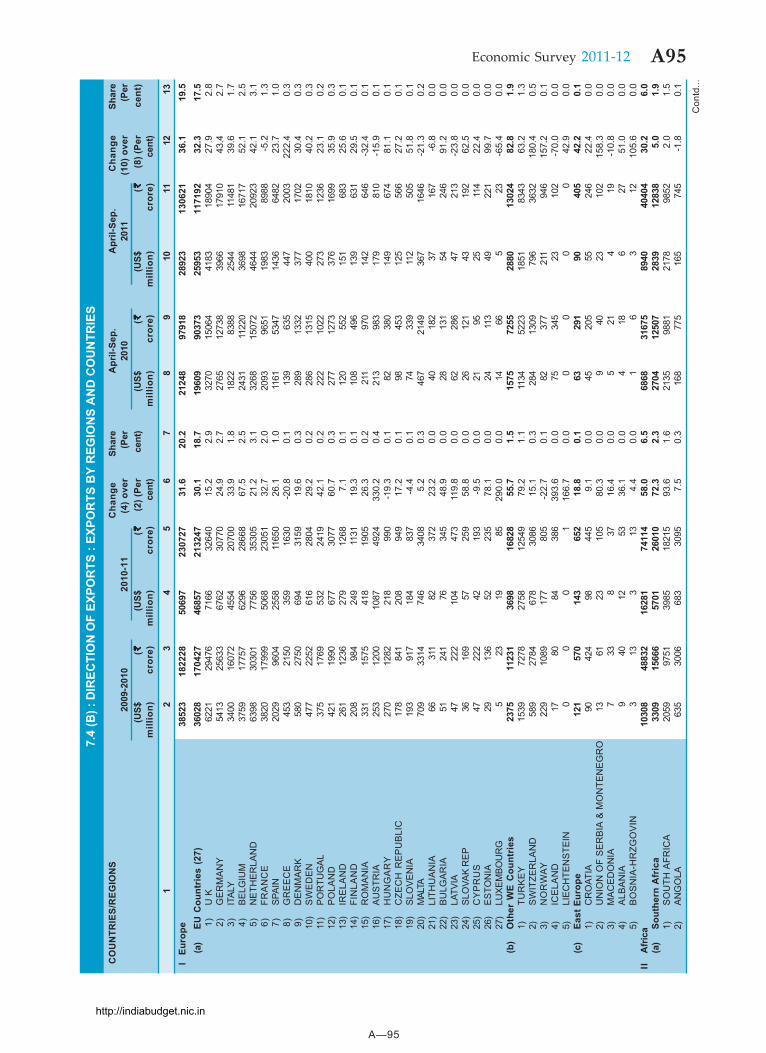
A—95
A95Economic Survey 2011-12
Con
td...
7.4
(B) :
DIR
ECTI
ON
OF
EXPO
RTS
: EX
POR
TS B
Y R
EGIO
NS
AN
D C
OU
NTR
IES
CO
UN
TRIE
S/R
EGIO
NS
Cha
nge
Shar
eA
pril-
Sep.
Apr
il-Se
p.C
hang
eSh
are
2009
-201
0
2
010-
11(4
) ove
r(P
er20
1020
11(1
0) o
ver
(Per
(US$
( `̀̀̀̀(U
S$( `̀̀̀̀
(2) (
Per
cent
)(U
S$( `̀̀̀̀
(US$
( `̀̀̀̀(8
) (Pe
rce
nt)
mill
ion)
cror
e)m
illio
n)cr
ore)
cent
)m
illio
n)cr
ore)
mill
ion)
cror
e)ce
nt)
12
34
56
78
910
1112
13I
Euro
pe38
523
1822
2850
697
2307
2731
.620
.221
248
9791
828
923
1306
2136
.119
.5(a
)EU
Cou
ntri
es (
27)
3602
817
0427
4685
721
3247
30.1
18.7
1960
990
373
2595
311
7192
32.3
17.5
1)
U K
6221
2947
671
6632
640
15.2
2.9
3270
1506
441
8318
904
27.9
2.8
2)
GE
RM
AN
Y54
1325
633
6762
3077
024
.92.
727
6512
738
3966
1791
043
.42.
7 3
)IT
ALY
3400
1607
245
5420
700
33.9
1.8
1822
8388
2544
1148
139
.61.
7 4
)BE
LGIU
M37
5917
757
6296
2866
867
.52.
524
3111
220
3698
1671
752
.12.
5 5
)N
ETH
ER
LAN
D63
9830
301
7756
3530
521
.23.
132
6815
072
4644
2092
342
.13.
1 6
)FR
AN
CE
3820
1799
950
6823
051
32.7
2.0
2093
9651
1983
8988
-5.2
1.3
7)
SPAI
N20
2996
0425
5811
650
26.1
1.0
1161
5347
1436
6482
23.7
1.0
8)
GR
EE
CE
453
2150
359
1630
-20.
80.
113
963
544
720
0322
2.4
0.3
9)
DE
NM
AR
K58
027
5069
431
5919
.60.
328
913
3237
717
0230
.40.
310
)S
WE
DE
N47
722
5261
628
0429
.20.
228
613
1540
018
1040
.20.
311
)PO
RTU
GAL
375
1769
532
2419
42.1
0.2
222
1022
273
1236
23.1
0.2
12)
PO
LAN
D42
119
9067
730
7760
.70.
327
712
7337
616
9935
.90.
313
)IR
ELA
ND
261
1236
279
1268
7.1
0.1
120
552
151
683
25.6
0.1
14)
FIN
LAN
D20
898
424
911
3119
.30.
110
849
613
963
129
.50.
115
)R
OM
AN
IA33
115
7541
819
0526
.30.
221
197
014
264
6-3
2.4
0.1
16)
AU
STR
IA25
312
0010
8749
2433
0.2
0.4
213
983
179
810
-15.
90.
117
)H
UN
GA
RY
270
1282
218
990
-19.
30.
182
380
149
674
81.1
0.1
18)
CZE
CH
RE
PU
BLI
C17
884
120
894
917
.20.
198
453
125
566
27.2
0.1
19)
SLO
VE
NIA
193
917
184
837
-4.4
0.1
7433
911
250
551
.80.
120
)M
ALTA
709
3314
746
3408
5.2
0.3
467
2149
367
1646
-21.
30.
221
)LI
THU
AN
IA66
311
8237
223
.20.
040
182
3716
7-6
.80.
022
)B
ULG
AR
IA51
241
7634
548
.90.
028
131
5424
691
.20.
023
)LA
TVIA
4722
210
447
311
9.8
0.0
6228
647
213
-23.
80.
024
)S
LOVA
K R
EP
3616
957
259
58.8
0.0
2612
143
192
62.5
0.0
25)
CY
PR
US
4722
242
193
-9.5
0.0
2195
2511
422
.40.
026
)E
STO
NIA
2913
652
235
78.1
0.0
2411
349
221
99.7
0.0
27)
LUXE
MBO
UR
G5
2319
8529
0.0
0.0
1466
523
-65.
40.
0(b
)O
ther
WE
Cou
ntri
es23
7511
231
3698
1682
855
.71.
515
7572
5528
8013
024
82.8
1.9
1)TU
RK
EY
1539
7278
2758
1254
979
.21.
111
3452
2318
5183
4363
.21.
32)
SW
ITZE
RLA
ND
589
2784
678
3086
15.1
0.3
284
1309
796
3632
180.
40.
53)
NO
RW
AY22
910
8917
780
5-2
2.7
0.1
8237
721
194
615
7.2
0.1
4)IC
ELA
ND
1780
8438
639
3.6
0.0
7534
523
102
-70.
00.
05)
LIE
CH
TEN
STE
IN0
00
116
6.7
0.0
00
00
42.9
0.0
(c)
East
Eur
ope
121
570
143
652
18.8
0.1
6329
190
405
42.2
0.1
1)C
RO
ATIA
9042
498
445
9.1
0.0
4520
555
246
22.4
0.0
2)U
NIO
N O
F S
ER
BIA
& M
ON
TEN
EG
RO
1361
2310
580
.30.
09
4023
102
158.
30.
03)
MA
CE
DO
NIA
733
837
16.4
0.0
521
419
-10.
80.
04)
ALB
AN
IA9
4012
5336
.10.
04
186
2751
.00.
05)
BO
SN
IA-H
RZG
OV
IN3
133
134.
40.
01
63
1210
5.6
0.0
IIA
fric
a10
308
4883
216
281
7411
458
.06.
568
6831
675
8940
4040
430
.26.
0(a
)So
uthe
rn A
fric
a33
0915
666
5701
2601
072
.32.
327
0412
507
2839
1283
85.
01.
91)
SO
UTH
AFR
ICA
2059
9751
3985
1821
593
.61.
621
3598
8121
7898
522.
01.
52)
AN
GO
LA63
530
0668
330
957.
50.
316
877
516
574
5-1
.80.
1
http://indiabudget.nic.in
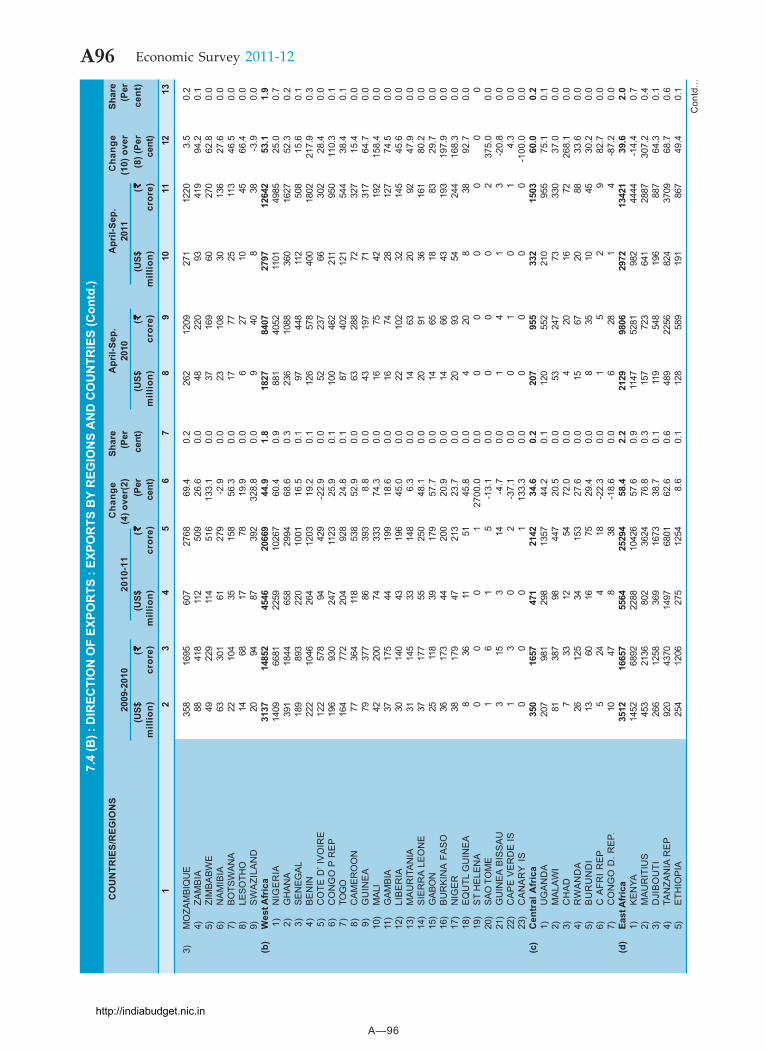
A—96
A96 Economic Survey 2011-12
Con
td...
3)M
OZA
MBI
QU
E35
816
9560
727
6869
.40.
226
212
0927
112
203.
50.
24)
ZAM
BIA
8841
811
250
926
.60.
048
220
9341
994
.20.
15)
ZIM
BA
BW
E49
229
114
516
133.
10.
037
169
6027
062
.80.
06)
NA
MIB
IA63
301
6127
9-2
.90.
023
108
3013
627
.60.
07)
BOTS
WAN
A22
104
3515
856
.30.
017
7725
113
46.5
0.0
8)LE
SOTH
O14
6817
7819
.90.
06
2710
4566
.40.
09)
SW
AZI
LAN
D20
9487
392
328.
80.
09
408
38-3
.90.
0(b
)W
est A
fric
a31
3714
852
4546
2066
944
.91.
818
2784
0727
9712
642
53.1
1.9
1)
NIG
ER
IA14
0966
8122
5910
267
60.4
0.9
881
4052
1101
4985
25.0
0.7
2)
GH
ANA
391
1844
658
2994
68.6
0.3
236
1088
360
1627
52.3
0.2
3)
SEN
EGAL
189
893
220
1001
16.5
0.1
9744
811
250
815
.60.
1 4
)B
EN
IN22
210
4626
412
0319
.20.
112
657
840
018
0221
7.9
0.3
5)
CO
TE D
’ IV
OIR
E12
257
894
429
-22.
90.
052
237
6630
228
.40.
0 6
)C
ON
GO
P R
EP
196
930
247
1123
25.9
0.1
100
462
211
950
110.
30.
1 7
)TO
GO
164
772
204
928
24.8
0.1
8740
212
154
438
.40.
1 8
)C
AM
ER
OO
N77
364
118
538
52.9
0.0
6328
872
327
15.4
0.0
9)
GU
INE
A79
377
8639
38.
80.
043
197
7131
764
.70.
010
)M
ALI
4220
074
333
74.3
0.0
1675
4219
215
8.4
0.0
11)
GAM
BIA
3717
544
199
18.6
0.0
1674
2812
774
.50.
012
)LI
BE
RIA
3014
043
196
45.0
0.0
2210
232
145
45.6
0.0
13)
MA
UR
ITA
NIA
3114
533
148
6.3
0.0
1463
2092
47.9
0.0
14)
SIE
RR
A L
EO
NE
3717
755
250
48.1
0.0
2091
3616
180
.20.
015
)G
ABO
N25
118
3917
957
.70.
014
6518
8329
.70.
016
)B
UR
KIN
A F
AS
O36
173
4420
020
.90.
014
6643
193
197.
90.
017
)N
IGE
R38
179
4721
323
.70.
020
9354
244
168.
30.
018
)E
QU
TL G
UIN
EA
836
1151
45.8
0.0
420
838
92.7
0.0
19)
ST
HE
LEN
A0
00
127
00.0
0.0
00
00
00
20)
SAO
TO
ME
16
15
-13.
10.
00
00
237
5.0
0.0
21)
GU
INE
A B
ISS
AU
315
314
-4.7
0.0
14
13
-20.
80.
022
)C
AP
E V
ER
DE
IS1
30
2-3
7.1
0.0
01
01
4.3
0.0
23)
CA
NA
RY
IS
00
01
133.
30.
00
00
0-1
00.0
0.0
(c)
Cen
tral
Afr
ica
350
1657
471
2142
34.6
0.2
207
955
332
1503
60.0
0.2
1)U
GA
ND
A20
798
129
813
5744
.20.
112
055
221
095
575
.10.
12)
MA
LAW
I81
387
9844
720
.50.
053
247
7333
037
.00.
03)
CH
AD
733
1254
72.0
0.0
420
1672
268.
10.
04)
RW
AN
DA
2612
534
153
27.6
0.0
1567
2088
33.6
0.0
5)B
UR
UN
DI
1360
1675
29.4
0.0
835
1045
30.2
0.0
6)C
AFR
I R
EP
524
418
-22.
30.
01
52
982
.70.
07)
CO
NG
O D
. RE
P.10
478
38-1
8.6
0.0
628
14
-87.
20.
0(d
)Ea
st A
fric
a35
1216
657
5564
2529
458
.42.
221
2998
0629
7213
421
39.6
2.0
1)K
EN
YA14
5268
9222
8810
426
57.6
0.9
1147
5281
982
4444
-14.
40.
72)
MA
UR
ITIU
S45
321
3680
236
2476
.80.
315
772
364
128
8730
7.2
0.4
3)D
JIB
OU
TI26
612
5836
916
7338
.70.
111
954
819
688
764
.30.
14)
TAN
ZAN
IA R
EP
920
4370
1497
6801
62.6
0.6
489
2256
824
3709
68.7
0.6
5)E
THIO
PIA
254
1206
275
1254
8.6
0.1
128
589
191
867
49.4
0.1
7.4
(B) :
DIR
ECTI
ON
OF
EXPO
RTS
: EX
POR
TS B
Y R
EGIO
NS
AN
D C
OU
NTR
IES
(Con
td.)
CO
UN
TRIE
S/R
EGIO
NS
Cha
nge
Shar
eA
pril-
Sep.
Apr
il-Se
p.C
hang
eSh
are
2009
-201
0
2
010-
11(4
) ove
r(2)
(Per
2010
2011
(10)
ove
r(P
er(U
S$( `̀̀̀̀
(US$
( `̀̀̀̀(P
erce
nt)
(US$
( `̀̀̀̀(U
S$( `̀̀̀̀
(8) (
Per
cent
)m
illio
n)cr
ore)
mill
ion)
cror
e)ce
nt)
mill
ion)
cror
e)m
illio
n)cr
ore)
cent
)1
23
45
67
89
1011
1213
http://indiabudget.nic.in
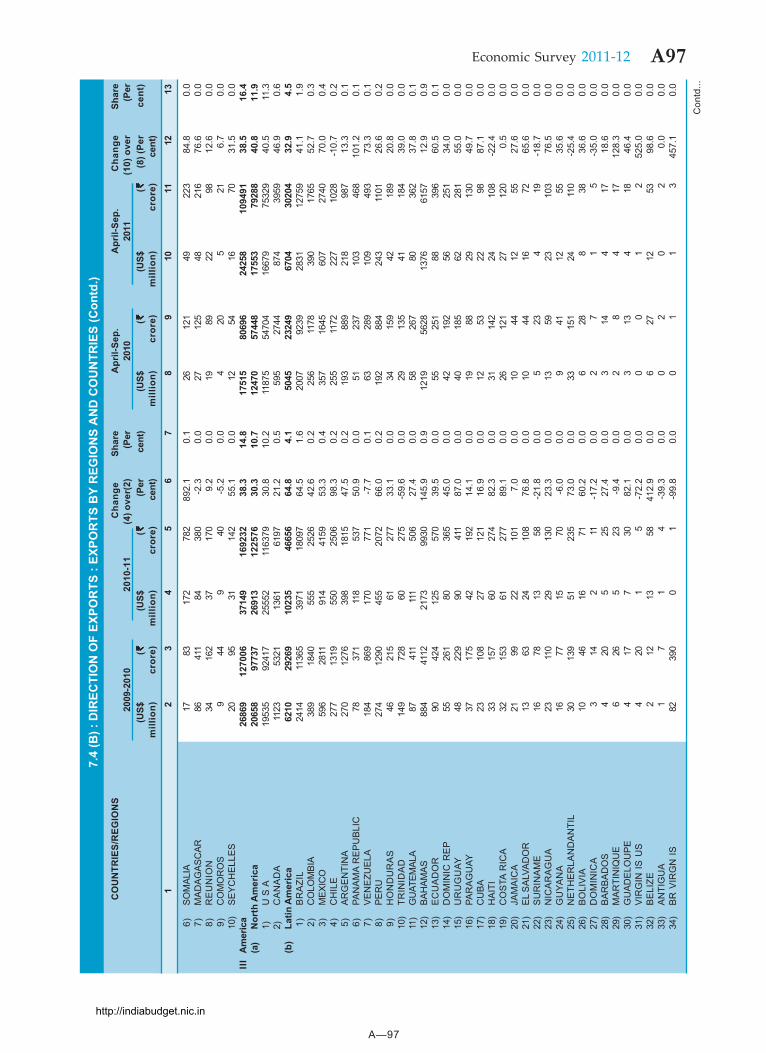
A—97
A97Economic Survey 2011-12
Con
td...
6)
SOM
ALIA
1783
172
782
892.
10.
126
121
4922
384
.80.
0 7
)M
ADAG
ASC
AR86
411
8438
0-2
.30.
027
125
4821
676
.60.
0 8
)R
EU
NIO
N34
162
3717
09.
20.
019
8922
9812
.60.
0 9
)C
OM
OR
OS
944
940
-5.2
0.0
420
521
6.7
0.0
10)
SE
YC
HE
LLE
S20
9531
142
55.1
0.0
1254
1670
31.5
0.0
IIIA
mer
ica
2686
912
7006
3714
916
9232
38.3
14.8
1751
580
696
2425
810
9491
38.5
16.4
(a)
Nor
th A
mer
ica
2065
897
737
2691
312
2576
30.3
10.7
1247
057
448
1755
379
288
40.8
11.9
1)U
S A
1953
592
417
2555
211
6379
30.8
10.2
1187
554
704
1667
975
329
40.5
11.3
2)C
AN
AD
A11
2353
2113
6161
9721
.20.
559
527
4487
439
5946
.90.
6(b
)La
tin A
mer
ica
6210
2926
910
235
4665
664
.84.
150
4523
249
6704
3020
432
.94.
5 1
)B
RA
ZIL
2414
1136
539
7118
097
64.5
1.6
2007
9239
2831
1275
941
.11.
9 2
)C
OLO
MBI
A38
918
4055
525
2642
.60.
225
611
7839
017
6552
.70.
3 3
)M
EXIC
O59
628
1191
441
5953
.30.
435
716
4560
727
4070
.00.
4 4
)C
HIL
E27
713
1955
025
0698
.30.
225
511
7222
710
28-1
0.7
0.2
5)
AR
GE
NTI
NA
270
1276
398
1815
47.5
0.2
193
889
218
987
13.3
0.1
6)
PAN
AM
A R
EP
UB
LIC
7837
111
853
750
.90.
051
237
103
468
101.
20.
1 7
)V
EN
EZU
ELA
184
869
170
771
-7.7
0.1
6328
910
949
373
.30.
1 8
)PE
RU
274
1290
455
2072
66.0
0.2
192
884
243
1101
26.6
0.2
9)
HO
ND
UR
AS
4621
561
277
33.1
0.0
3415
942
189
20.8
0.0
10)
TRIN
IDA
D14
972
860
275
-59.
60.
029
135
4118
439
.00.
011
)G
UAT
EMAL
A87
411
111
506
27.4
0.0
5826
780
362
37.8
0.1
12)
BAH
AMAS
884
4112
2173
9930
145.
90.
912
1956
2813
7661
5712
.90.
913
)E
CU
AD
OR
9042
412
557
039
.50.
055
251
8839
660
.50.
114
)D
OM
INIC
RE
P55
261
8036
545
.00.
042
192
5625
134
.00.
015
)U
RU
GU
AY48
229
9041
187
.00.
040
185
6228
155
.00.
016
)PA
RA
GU
AY37
175
4219
214
.10.
019
8829
130
49.7
0.0
17)
CU
BA23
108
2712
116
.90.
012
5322
9887
.10.
018
)H
AIT
I33
157
6027
482
.30.
031
142
2410
8-2
2.4
0.0
19)
CO
STA
RIC
A32
153
6127
789
.10.
026
121
2712
00.
50.
020
)JA
MA
ICA
2199
2210
17.
00.
010
4412
5527
.60.
021
)E
L S
ALV
AD
OR
1363
2410
876
.80.
010
4416
7265
.60.
022
)S
UR
INA
ME
1678
1358
-21.
80.
05
234
19-1
8.7
0.0
23)
NIC
AR
AG
UA
2311
029
130
23.3
0.0
1359
2310
376
.50.
024
)G
UYA
NA
1677
1570
-6.0
0.0
941
1255
35.6
0.0
25)
NE
THE
RLA
ND
AN
TIL
3013
951
235
73.0
0.0
3315
124
110
-25.
40.
026
)B
OLI
VIA
1046
1671
60.2
0.0
628
838
36.6
0.0
27)
DO
MIN
ICA
314
211
-17.
20.
02
71
5-3
5.0
0.0
28)
BA
RB
AD
OS
420
525
27.4
0.0
314
417
18.6
0.0
29)
MA
RTI
NIQ
UE
626
523
-9.4
0.0
28
417
128.
30.
030
)G
UA
DE
LOU
PE
417
730
82.1
0.0
313
418
46.4
0.0
31)
VIR
GIN
IS U
S4
201
5-7
2.2
0.0
00
12
525.
00.
032
)B
ELI
ZE2
1213
5841
2.9
0.0
627
1253
98.6
0.0
33)
AN
TIG
UA
17
14
-39.
30.
00
20
20.
00.
03 4
)B
R V
IRG
N IS
8239
00
1-9
9.8
0.0
01
13
457.
10.
0
7.4
(B) :
DIR
ECTI
ON
OF
EXPO
RTS
: EX
POR
TS B
Y R
EGIO
NS
AN
D C
OU
NTR
IES
(Con
td.)
CO
UN
TRIE
S/R
EGIO
NS
Cha
nge
Shar
eA
pril-
Sep.
Apr
il-Se
p.C
hang
eSh
are
2009
-201
0
2
010-
11(4
) ove
r(2)
(Per
2010
2011
(10)
ove
r(P
er(U
S$( `̀̀̀̀
(US$
( `̀̀̀̀(P
erce
nt)
(US$
( `̀̀̀̀(U
S$( `̀̀̀̀
(8) (
Per
cent
)m
illio
n)cr
ore)
mill
ion)
cror
e)ce
nt)
mill
ion)
cror
e)m
illio
n)cr
ore)
cent
)1
23
45
67
89
1011
1213
http://indiabudget.nic.in
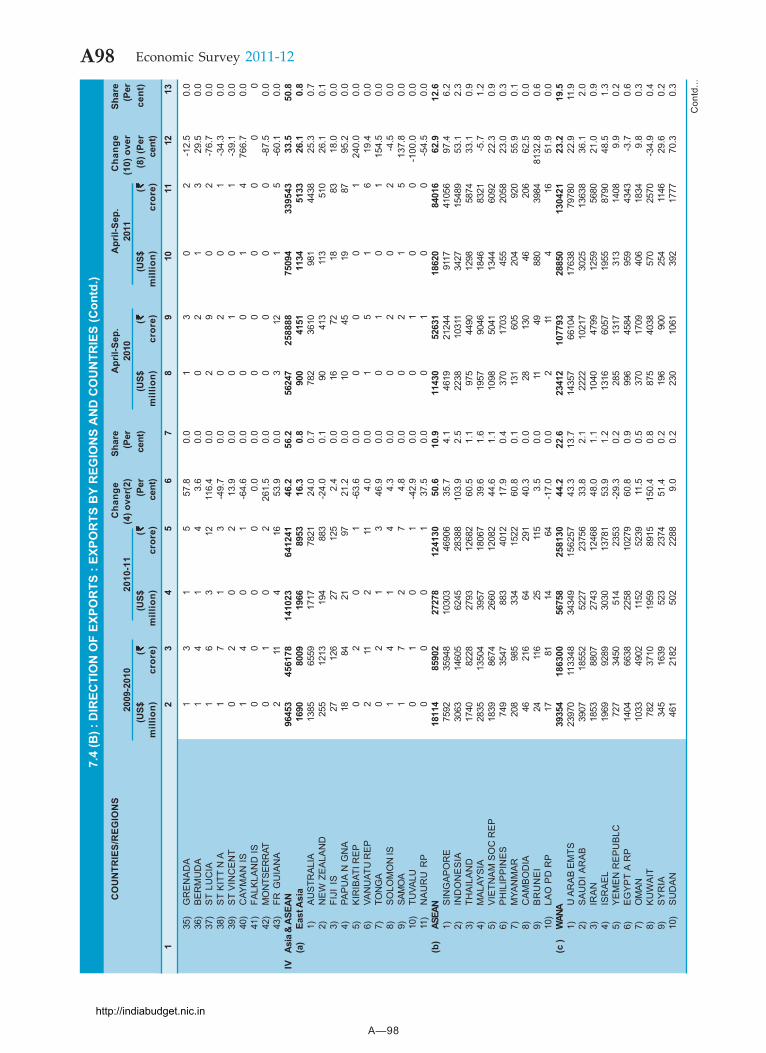
A—98
A98 Economic Survey 2011-12
7.4
(B) :
DIR
ECTI
ON
OF
EXPO
RTS
: EX
POR
TS B
Y R
EGIO
NS
AN
D C
OU
NTR
IES
(Con
td.)
CO
UN
TRIE
S/R
EGIO
NS
Cha
nge
Shar
eA
pril-
Sep.
Apr
il-Se
p.C
hang
eSh
are
2009
-201
0
2
010-
11(4
) ove
r(2)
(Per
2010
2011
(10)
ove
r(P
er(U
S$( `̀̀̀̀
(US$
( `̀̀̀̀(P
erce
nt)
(US$
( `̀̀̀̀(U
S$( `̀̀̀̀
(8) (
Per
cent
)m
illio
n)cr
ore)
mill
ion)
cror
e)ce
nt)
mill
ion)
cror
e)m
illio
n)cr
ore)
cent
)1
23
45
67
89
1011
1213
35)
GR
EN
AD
A1
31
557
.80.
01
30
2-1
2.5
0.0
36)
BE
RM
UD
A1
41
43.
60.
00
21
329
.50.
037
)S
T LU
CIA
16
312
116.
40.
02
90
2-7
6.7
0.0
38)
ST
KIT
T N
A1
71
3-4
9.7
0.0
02
01
-34.
30.
039
)S
T V
INC
EN
T0
20
213
.90.
00
10
1-3
9.1
0.0
40)
CAY
MA
N IS
14
01
-64.
60.
00
01
476
6.7
0.0
41)
FALK
LAN
D IS
00
00
0.0
0.0
00
00
00
42)
MO
NTS
ERR
AT0
10
226
1.5
0.0
00
00
-87.
50.
043
)FR
GU
IAN
A2
114
1653
.90.
03
121
5-6
0.1
0.0
IVA
sia
& A
SEA
N96
453
4561
7814
1023
6412
4146
.256
.256
247
2588
8875
094
3395
4333
.550
.8(a
)Ea
st A
sia
1690
8009
1966
8953
16.3
0.8
900
4151
1134
5133
26.1
0.8
1)A
US
TRA
LIA
1385
6559
1717
7821
24.0
0.7
782
3610
981
4438
25.3
0.7
2)N
EW
ZE
ALA
ND
255
1213
194
883
-24.
00.
190
413
113
510
26.1
0.1
3)FI
JI I
S27
126
2712
52.
40.
016
7218
8318
.00.
04)
PAP
UA
N G
NA
1884
2197
21.2
0.0
1045
1987
95.2
0.0
5)K
IRIB
ATI R
EP
02
01
-63.
60.
00
00
124
0.0
0.0
6)VA
NU
ATU
RE
P2
112
114.
00.
01
51
619
.40.
07)
TON
GA
02
13
46.9
0.0
01
01
154.
50.
08)
SO
LOM
ON
IS1
41
44.
30.
00
20
2-4
.50.
09)
SAM
OA
17
27
4.8
0.0
02
15
137.
80.
010
)TU
VALU
01
01
-42.
90.
00
10
0-1
00.0
0.0
11)
NA
UR
U R
P0
00
137
.50.
00
10
0-5
4.5
0.0
(b)
ASEA
N18
114
8590
227
278
1241
3050
.610
.911
430
5263
118
620
8401
662
.912
.61)
SIN
GA
PO
RE
7592
3594
810
303
4690
635
.74.
146
1921
244
9117
4105
697
.46.
22)
IND
ON
ES
IA30
6314
605
6245
2838
810
3.9
2.5
2238
1031
134
2715
489
53.1
2.3
3)TH
AIL
AN
D17
4082
2827
9312
682
60.5
1.1
975
4490
1298
5874
33.1
0.9
4)M
ALAY
SIA
2835
1350
439
5718
067
39.6
1.6
1957
9046
1846
8321
-5.7
1.2
5)V
IETN
AM
SO
C R
EP
1839
8674
2660
1208
244
.61.
110
9850
4113
4460
9222
.30.
96)
PH
ILIP
PIN
ES
749
3547
883
4012
17.9
0.4
370
1703
455
2058
23.0
0.3
7)M
YAN
MA
R20
898
533
415
2260
.80.
113
160
520
492
055
.90.
18)
CA
MB
OD
IA46
216
6429
140
.30.
028
130
4620
662
.50.
09)
BR
UN
EI
2411
625
115
3.5
0.0
1149
880
3984
8132
.80.
610
)LA
O P
D R
P17
8114
64-1
7.0
0.0
211
416
51.9
0.0
(c )
WAN
A39
354
1863
0056
758
2581
3044
.222
.623
412
1077
9328
850
1304
2123
.219
.51)
U A
RA
B E
MTS
2397
011
3348
3434
915
6257
43.3
13.7
1435
766
104
1763
879
780
22.9
11.9
2)S
AU
DI A
RA
B39
0718
552
5227
2375
633
.82.
122
2210
217
3025
1363
836
.12.
03)
IRA
N18
5388
0727
4312
468
48.0
1.1
1040
4799
1259
5680
21.0
0.9
4)IS
RA
EL
1969
9289
3030
1378
153
.91.
213
1660
5719
5587
9048
.51.
35)
YE
ME
N R
EP
UB
LC72
734
5051
423
53-2
9.3
0.2
285
1317
313
1408
9.9
0.2
6)E
GY
PT
A R
P14
0466
3822
5810
279
60.8
0.9
996
4584
959
4343
-3.7
0.6
7)O
MAN
1033
4902
1152
5239
11.5
0.5
370
1709
406
1834
9.8
0.3
8)K
UW
AIT
782
3710
1959
8915
150.
40.
887
540
3857
025
70-3
4.9
0.4
9)S
YR
IA34
516
3952
323
7451
.40.
219
690
025
411
4629
.60.
210
)S
UD
AN
461
2182
502
2288
9.0
0.2
230
1061
392
1777
70.3
0.3
Con
td...
http://indiabudget.nic.in
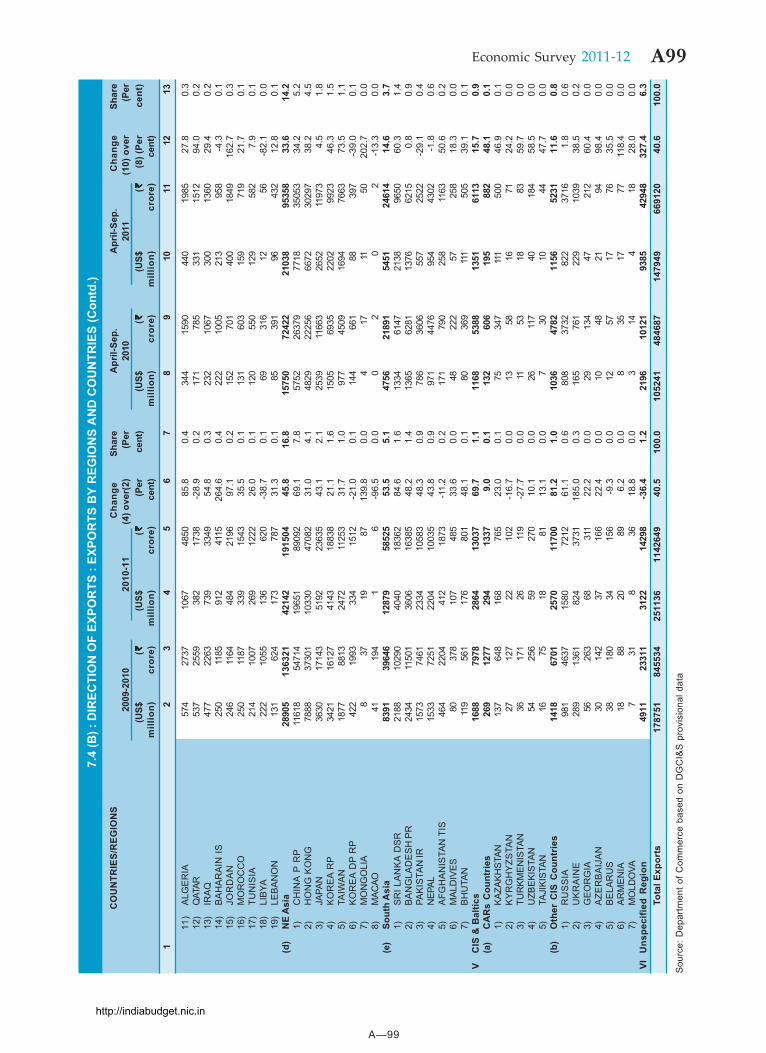
A—99
A99Economic Survey 2011-12
7.4
(B) :
DIR
ECTI
ON
OF
EXPO
RTS
: EX
POR
TS B
Y R
EGIO
NS
AN
D C
OU
NTR
IES
(Con
td.)
CO
UN
TRIE
S/R
EGIO
NS
Cha
nge
Shar
eA
pril-
Sep.
Apr
il-Se
p.C
hang
eSh
are
2009
-201
0
2
010-
11(4
) ove
r(2)
(Per
2010
2011
(10)
ove
r(P
er(U
S$( `̀̀̀̀
(US$
( `̀̀̀̀(P
erce
nt)
(US$
( `̀̀̀̀(U
S$( `̀̀̀̀
(8) (
Per
cent
)m
illio
n)cr
ore)
mill
ion)
cror
e)ce
nt)
mill
ion)
cror
e)m
illio
n)cr
ore)
cent
)1
23
45
67
89
1011
1213
11)
ALG
ER
IA57
427
3710
6748
5085
.80.
434
415
9044
019
8527
.80.
312
)Q
ATAR
537
2559
382
1738
-28.
90.
217
178
533
115
1294
.00.
213
)IR
AQ
477
2263
739
3349
54.8
0.3
232
1067
300
1360
29.4
0.2
14)
BA
HA
RA
IN IS
250
1185
912
4115
264.
60.
422
210
0521
395
8-4
.30.
115
)JO
RD
AN
246
1164
484
2196
97.1
0.2
152
701
400
1849
162.
70.
316
)M
OR
OC
CO
250
1187
339
1543
35.5
0.1
131
603
159
719
21.7
0.1
17)
TUN
ISIA
214
1007
269
1222
26.0
0.1
120
550
129
582
7.9
0.1
18)
LIB
YA22
210
5513
662
0-3
8.7
0.1
6931
612
56-8
2.1
0.0
19)
LEB
AN
ON
131
624
173
787
31.3
0.1
8539
196
432
12.8
0.1
(d)
NE
Asi
a28
905
1363
2142
142
1915
0445
.816
.815
750
7242
221
038
9535
833
.614
.21)
CH
INA
P R
P11
618
5471
419
651
8909
269
.17.
857
5226
379
7718
3505
334
.25.
22)
HO
NG
KO
NG
7888
3730
110
330
4708
231
.04.
148
2922
256
6672
3029
738
.24.
53)
JAPA
N36
3017
143
5192
2363
543
.12.
125
3911
663
2652
1197
34.
51.
84)
KO
RE
A R
P34
2116
127
4143
1883
821
.11.
615
0569
3522
0299
2346
.31.
55)
TAIW
AN
1877
8813
2472
1125
331
.71.
097
745
0916
9476
6373
.51.
16)
KO
RE
A D
P R
P42
219
9333
415
12-2
1.0
0.1
144
661
8839
7-3
9.0
0.1
7)M
ON
GO
LIA
837
1987
139.
80.
04
1711
5020
2.7
0.0
8)M
ACAO
4119
41
6-9
6.5
0.0
02
02
-13.
30.
0(e
)So
uth
Asi
a83
9139
646
1287
958
525
53.5
5.1
4756
2189
154
5124
614
14.6
3.7
1)S
RI L
AN
KA
DS
R21
8810
290
4040
1836
284
.61.
613
3461
4721
3896
5060
.31.
42)
BA
NG
LAD
ES
H P
R24
3411
501
3606
1638
548
.21.
413
6562
8113
7662
150.
80.
93)
PAK
ISTA
N IR
1573
7461
2334
1058
348
.30.
978
636
0655
725
22-2
9.1
0.4
4)N
EPAL
1533
7251
2204
1003
543
.80.
997
144
7695
443
02-1
.80.
65)
AFG
HA
NIS
TAN
TIS
464
2204
412
1873
-11.
20.
217
179
025
811
6350
.60.
26)
MAL
DIV
ES80
378
107
485
33.6
0.0
4822
257
258
18.3
0.0
7)B
HU
TAN
119
561
176
801
48.1
0.1
8036
911
150
539
.10.
1V
CIS
& B
altic
s16
8879
7828
6413
037
69.7
1.1
1168
5388
1351
6113
15.7
0.9
(a)
CA
Rs
Cou
ntrie
s26
912
7729
413
379.
00.
113
260
619
588
248
.10.
11)
KAZA
KHST
AN13
764
816
876
523
.00.
175
347
111
500
46.9
0.1
2)K
YR
GH
YZS
TAN
2712
722
102
-16.
70.
013
5816
7124
.20.
03)
TUR
KMEN
ISTA
N36
171
2611
9-2
7.7
0.0
1153
1883
59.7
0.0
4)U
ZBE
KIS
TAN
5425
659
270
10.1
0.0
2611
740
184
58.5
0.0
5)TA
JIKI
STAN
1675
1881
13.1
0.0
730
1044
47.7
0.0
(b)
Oth
er C
IS C
ount
ries
1418
6701
2570
1170
081
.21.
010
3647
8211
5652
3111
.60.
81)
RU
SS
IA98
146
3715
8072
1261
.10.
680
837
3282
237
161.
80.
62)
UK
RA
INE
289
1361
824
3731
185.
00.
316
576
122
910
3938
.50.
23)
GE
OR
GIA
5626
368
311
22.2
0.0
2913
447
212
60.4
0.0
4)A
ZER
BA
IJA
N30
142
3716
622
.40.
010
4821
9498
.40.
05)
BE
LAR
US
3818
034
156
-9.3
0.0
1257
1776
35.5
0.0
6)A
RM
EN
IA18
8820
896.
20.
08
3517
7711
8.4
0.0
7)M
OLD
OVA
731
836
18.8
0.0
314
418
28.0
0.0
VIU
nspe
cifie
d R
egio
n49
1123
311
3122
1429
8-3
6.4
1.2
2196
1012
193
8542
948
327.
46.
3To
tal E
xpor
ts17
8751
8455
3425
1136
1142
649
40.5
100.
010
5241
4846
8714
7949
6691
2040
.610
0.0
Sou
rce:
Dep
artm
ent o
f Com
mer
ce b
ased
on
DG
CI&
S p
rovi
sion
al d
ata
http://indiabudget.nic.in
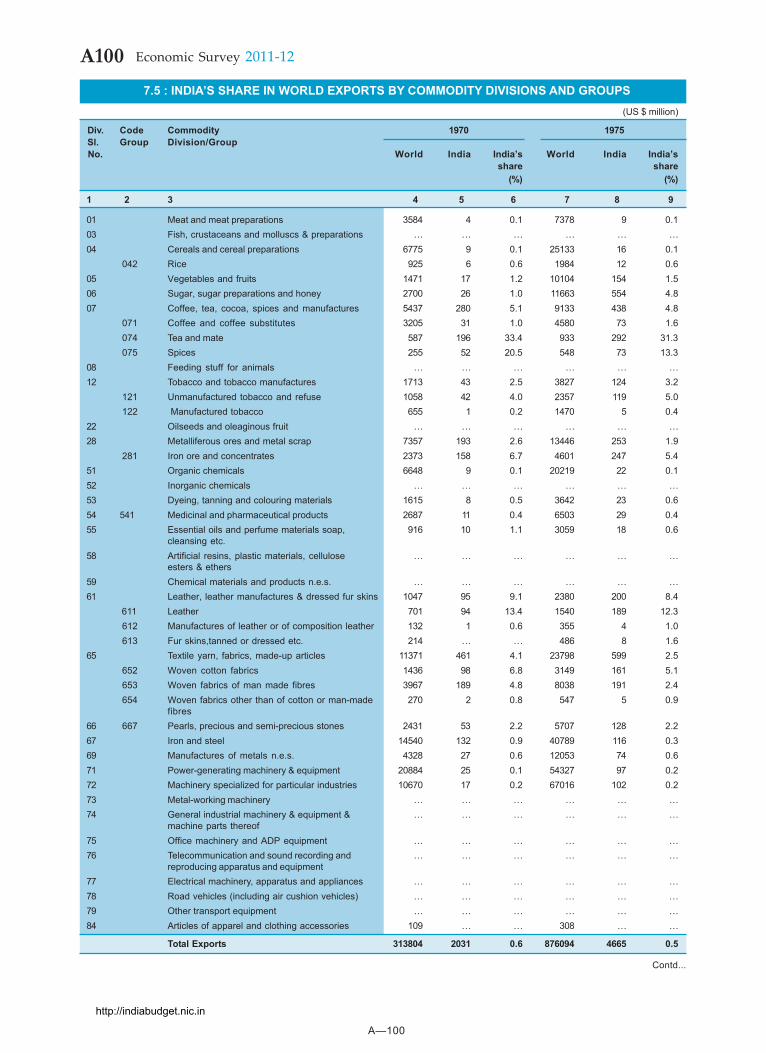
A—100
A100 Economic Survey 2011-12
7.5 : INDIA’S SHARE IN WORLD EXPORTS BY COMMODITY DIVISIONS AND GROUPS(US $ million)
Div. Code Commodity 1970 1975 Sl. Group Division/Group No. World India India’s World India India’s
share share(%) (%)
1 2 3 4 5 6 7 8 9
01 Meat and meat preparations 3584 4 0.1 7378 9 0.103 Fish, crustaceans and molluscs & preparations ... ... ... ... ... ...04 Cereals and cereal preparations 6775 9 0.1 25133 16 0.1
042 Rice 925 6 0.6 1984 12 0.605 Vegetables and fruits 1471 17 1.2 10104 154 1.506 Sugar, sugar preparations and honey 2700 26 1.0 11663 554 4.807 Coffee, tea, cocoa, spices and manufactures 5437 280 5.1 9133 438 4.8
071 Coffee and coffee substitutes 3205 31 1.0 4580 73 1.6 074 Tea and mate 587 196 33.4 933 292 31.3 075 Spices 255 52 20.5 548 73 13.3
08 Feeding stuff for animals ... ... ... ... ... ...12 Tobacco and tobacco manufactures 1713 43 2.5 3827 124 3.2
121 Unmanufactured tobacco and refuse 1058 42 4.0 2357 119 5.0 122 Manufactured tobacco 655 1 0.2 1470 5 0.4
22 Oilseeds and oleaginous fruit ... ... ... ... ... ...28 Metalliferous ores and metal scrap 7357 193 2.6 13446 253 1.9
281 Iron ore and concentrates 2373 158 6.7 4601 247 5.451 Organic chemicals 6648 9 0.1 20219 22 0.152 Inorganic chemicals ... ... ... ... ... ...53 Dyeing, tanning and colouring materials 1615 8 0.5 3642 23 0.654 541 Medicinal and pharmaceutical products 2687 11 0.4 6503 29 0.455 Essential oils and perfume materials soap, 916 10 1.1 3059 18 0.6
cleansing etc.58 Artificial resins, plastic materials, cellulose ... ... ... ... ... ...
esters & ethers59 Chemical materials and products n.e.s. ... ... ... ... ... ...61 Leather, leather manufactures & dressed fur skins 1047 95 9.1 2380 200 8.4
611 Leather 701 94 13.4 1540 189 12.3 612 Manufactures of leather or of composition leather 132 1 0.6 355 4 1.0 613 Fur skins,tanned or dressed etc. 214 ... ... 486 8 1.6
65 Textile yarn, fabrics, made-up articles 11371 461 4.1 23798 599 2.5 652 Woven cotton fabrics 1436 98 6.8 3149 161 5.1 653 Woven fabrics of man made fibres 3967 189 4.8 8038 191 2.4 654 Woven fabrics other than of cotton or man-made 270 2 0.8 547 5 0.9
fibres66 667 Pearls, precious and semi-precious stones 2431 53 2.2 5707 128 2.267 Iron and steel 14540 132 0.9 40789 116 0.369 Manufactures of metals n.e.s. 4328 27 0.6 12053 74 0.671 Power-generating machinery & equipment 20884 25 0.1 54327 97 0.272 Machinery specialized for particular industries 10670 17 0.2 67016 102 0.273 Metal-working machinery ... ... ... ... ... ...74 General industrial machinery & equipment & ... ... ... ... ... ...
machine parts thereof75 Office machinery and ADP equipment ... ... ... ... ... ...76 Telecommunication and sound recording and ... ... ... ... ... ...
reproducing apparatus and equipment77 Electrical machinery, apparatus and appliances ... ... ... ... ... ...78 Road vehicles (including air cushion vehicles) ... ... ... ... ... ...79 Other transport equipment ... ... ... ... ... ...84 Articles of apparel and clothing accessories 109 ... ... 308 ... ...
Total Exports 313804 2031 0.6 876094 4665 0.5
Contd...
http://indiabudget.nic.in
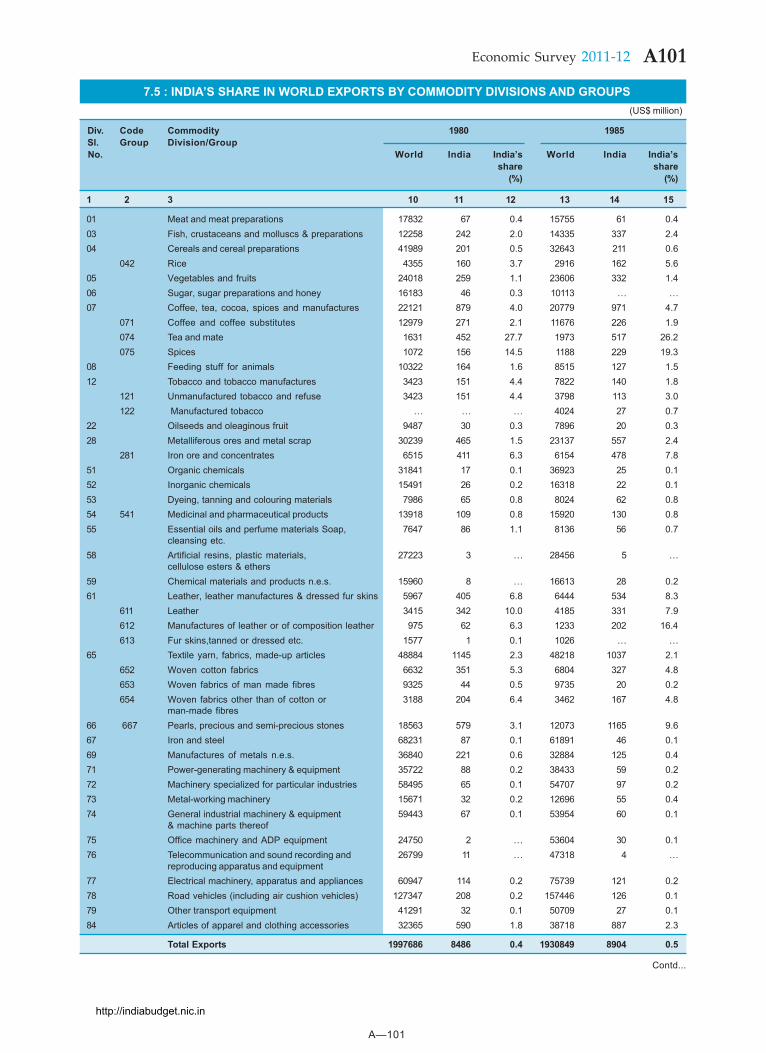
A—101
A101Economic Survey 2011-12
7.5 : INDIA’S SHARE IN WORLD EXPORTS BY COMMODITY DIVISIONS AND GROUPS(US$ million)
Div. Code Commodity 1980 1985 Sl. Group Division/Group No. World India India’s World India India’s
share share(%) (%)
1 2 3 10 11 12 13 14 15
01 Meat and meat preparations 17832 67 0.4 15755 61 0.403 Fish, crustaceans and molluscs & preparations 12258 242 2.0 14335 337 2.404 Cereals and cereal preparations 41989 201 0.5 32643 211 0.6
042 Rice 4355 160 3.7 2916 162 5.605 Vegetables and fruits 24018 259 1.1 23606 332 1.406 Sugar, sugar preparations and honey 16183 46 0.3 10113 ... ...07 Coffee, tea, cocoa, spices and manufactures 22121 879 4.0 20779 971 4.7
071 Coffee and coffee substitutes 12979 271 2.1 11676 226 1.9074 Tea and mate 1631 452 27.7 1973 517 26.2075 Spices 1072 156 14.5 1188 229 19.3
08 Feeding stuff for animals 10322 164 1.6 8515 127 1.512 Tobacco and tobacco manufactures 3423 151 4.4 7822 140 1.8
121 Unmanufactured tobacco and refuse 3423 151 4.4 3798 113 3.0122 Manufactured tobacco ... ... ... 4024 27 0.7
22 Oilseeds and oleaginous fruit 9487 30 0.3 7896 20 0.328 Metalliferous ores and metal scrap 30239 465 1.5 23137 557 2.4
281 Iron ore and concentrates 6515 411 6.3 6154 478 7.851 Organic chemicals 31841 17 0.1 36923 25 0.152 Inorganic chemicals 15491 26 0.2 16318 22 0.153 Dyeing, tanning and colouring materials 7986 65 0.8 8024 62 0.854 541 Medicinal and pharmaceutical products 13918 109 0.8 15920 130 0.855 Essential oils and perfume materials Soap, 7647 86 1.1 8136 56 0.7
cleansing etc.58 Artificial resins, plastic materials, 27223 3 ... 28456 5 ...
cellulose esters & ethers59 Chemical materials and products n.e.s. 15960 8 ... 16613 28 0.261 Leather, leather manufactures & dressed fur skins 5967 405 6.8 6444 534 8.3
611 Leather 3415 342 10.0 4185 331 7.9612 Manufactures of leather or of composition leather 975 62 6.3 1233 202 16.4613 Fur skins,tanned or dressed etc. 1577 1 0.1 1026 ... ...
65 Textile yarn, fabrics, made-up articles 48884 1145 2.3 48218 1037 2.1652 Woven cotton fabrics 6632 351 5.3 6804 327 4.8653 Woven fabrics of man made fibres 9325 44 0.5 9735 20 0.2654 Woven fabrics other than of cotton or 3188 204 6.4 3462 167 4.8
man-made fibres66 667 Pearls, precious and semi-precious stones 18563 579 3.1 12073 1165 9.667 Iron and steel 68231 87 0.1 61891 46 0.169 Manufactures of metals n.e.s. 36840 221 0.6 32884 125 0.471 Power-generating machinery & equipment 35722 88 0.2 38433 59 0.272 Machinery specialized for particular industries 58495 65 0.1 54707 97 0.273 Metal-working machinery 15671 32 0.2 12696 55 0.474 General industrial machinery & equipment 59443 67 0.1 53954 60 0.1
& machine parts thereof75 Office machinery and ADP equipment 24750 2 ... 53604 30 0.176 Telecommunication and sound recording and 26799 11 ... 47318 4 ...
reproducing apparatus and equipment77 Electrical machinery, apparatus and appliances 60947 114 0.2 75739 121 0.278 Road vehicles (including air cushion vehicles) 127347 208 0.2 157446 126 0.179 Other transport equipment 41291 32 0.1 50709 27 0.184 Articles of apparel and clothing accessories 32365 590 1.8 38718 887 2.3
Total Exports 1997686 8486 0.4 1930849 8904 0.5
Contd...
http://indiabudget.nic.in
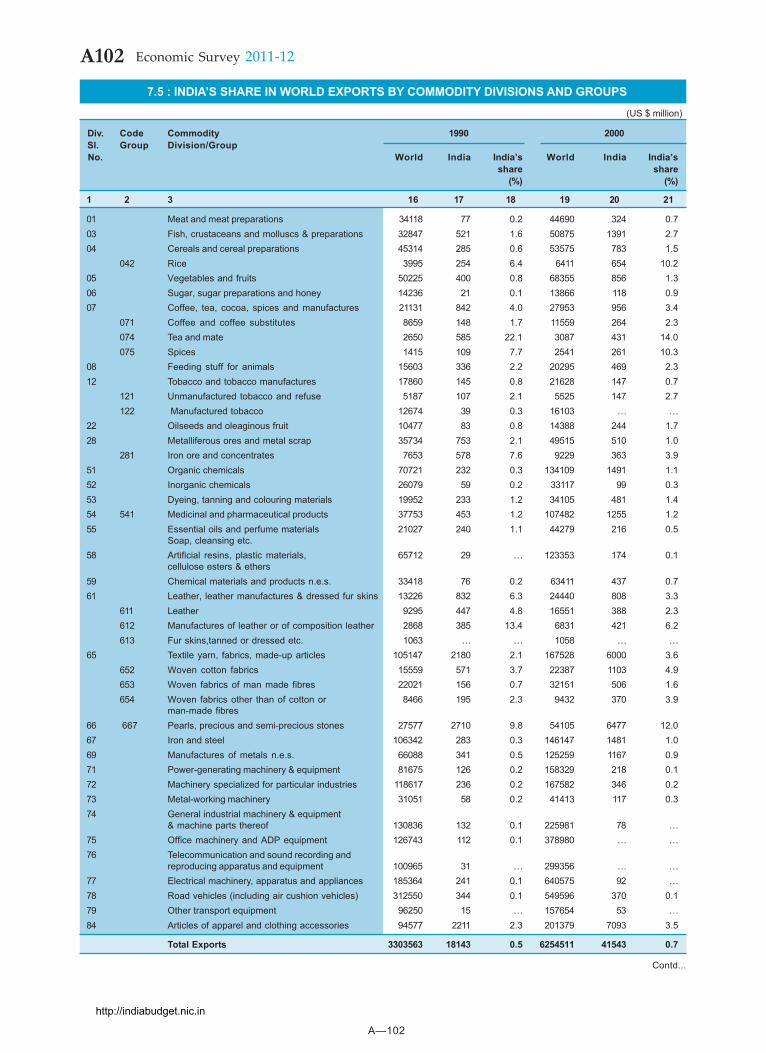
A—102
A102 Economic Survey 2011-12
7.5 : INDIA’S SHARE IN WORLD EXPORTS BY COMMODITY DIVISIONS AND GROUPS
(US $ million)
Div. Code Commodity 1990 2000 Sl. Group Division/Group No. World India India’s World India India’s
share share(%) (%)
1 2 3 16 17 18 19 20 21
01 Meat and meat preparations 34118 77 0.2 44690 324 0.703 Fish, crustaceans and molluscs & preparations 32847 521 1.6 50875 1391 2.704 Cereals and cereal preparations 45314 285 0.6 53575 783 1.5
042 Rice 3995 254 6.4 6411 654 10.205 Vegetables and fruits 50225 400 0.8 68355 856 1.306 Sugar, sugar preparations and honey 14236 21 0.1 13866 118 0.907 Coffee, tea, cocoa, spices and manufactures 21131 842 4.0 27953 956 3.4
071 Coffee and coffee substitutes 8659 148 1.7 11559 264 2.3074 Tea and mate 2650 585 22.1 3087 431 14.0075 Spices 1415 109 7.7 2541 261 10.3
08 Feeding stuff for animals 15603 336 2.2 20295 469 2.312 Tobacco and tobacco manufactures 17860 145 0.8 21628 147 0.7
121 Unmanufactured tobacco and refuse 5187 107 2.1 5525 147 2.7122 Manufactured tobacco 12674 39 0.3 16103 ... ...
22 Oilseeds and oleaginous fruit 10477 83 0.8 14388 244 1.728 Metalliferous ores and metal scrap 35734 753 2.1 49515 510 1.0
281 Iron ore and concentrates 7653 578 7.6 9229 363 3.951 Organic chemicals 70721 232 0.3 134109 1491 1.152 Inorganic chemicals 26079 59 0.2 33117 99 0.353 Dyeing, tanning and colouring materials 19952 233 1.2 34105 481 1.454 541 Medicinal and pharmaceutical products 37753 453 1.2 107482 1255 1.255 Essential oils and perfume materials 21027 240 1.1 44279 216 0.5
Soap, cleansing etc.58 Artificial resins, plastic materials, 65712 29 ... 123353 174 0.1
cellulose esters & ethers59 Chemical materials and products n.e.s. 33418 76 0.2 63411 437 0.761 Leather, leather manufactures & dressed fur skins 13226 832 6.3 24440 808 3.3
611 Leather 9295 447 4.8 16551 388 2.3612 Manufactures of leather or of composition leather 2868 385 13.4 6831 421 6.2613 Fur skins,tanned or dressed etc. 1063 ... ... 1058 ... ...
65 Textile yarn, fabrics, made-up articles 105147 2180 2.1 167528 6000 3.6652 Woven cotton fabrics 15559 571 3.7 22387 1103 4.9653 Woven fabrics of man made fibres 22021 156 0.7 32151 506 1.6654 Woven fabrics other than of cotton or 8466 195 2.3 9432 370 3.9
man-made fibres66 667 Pearls, precious and semi-precious stones 27577 2710 9.8 54105 6477 12.067 Iron and steel 106342 283 0.3 146147 1481 1.069 Manufactures of metals n.e.s. 66088 341 0.5 125259 1167 0.971 Power-generating machinery & equipment 81675 126 0.2 158329 218 0.172 Machinery specialized for particular industries 118617 236 0.2 167582 346 0.273 Metal-working machinery 31051 58 0.2 41413 117 0.374 General industrial machinery & equipment
& machine parts thereof 130836 132 0.1 225981 78 ...75 Office machinery and ADP equipment 126743 112 0.1 378980 ... ...76 Telecommunication and sound recording and
reproducing apparatus and equipment 100965 31 ... 299356 ... ...77 Electrical machinery, apparatus and appliances 185364 241 0.1 640575 92 ...78 Road vehicles (including air cushion vehicles) 312550 344 0.1 549596 370 0.179 Other transport equipment 96250 15 ... 157654 53 ...84 Articles of apparel and clothing accessories 94577 2211 2.3 201379 7093 3.5
Total Exports 3303563 18143 0.5 6254511 41543 0.7
Contd...
http://indiabudget.nic.in
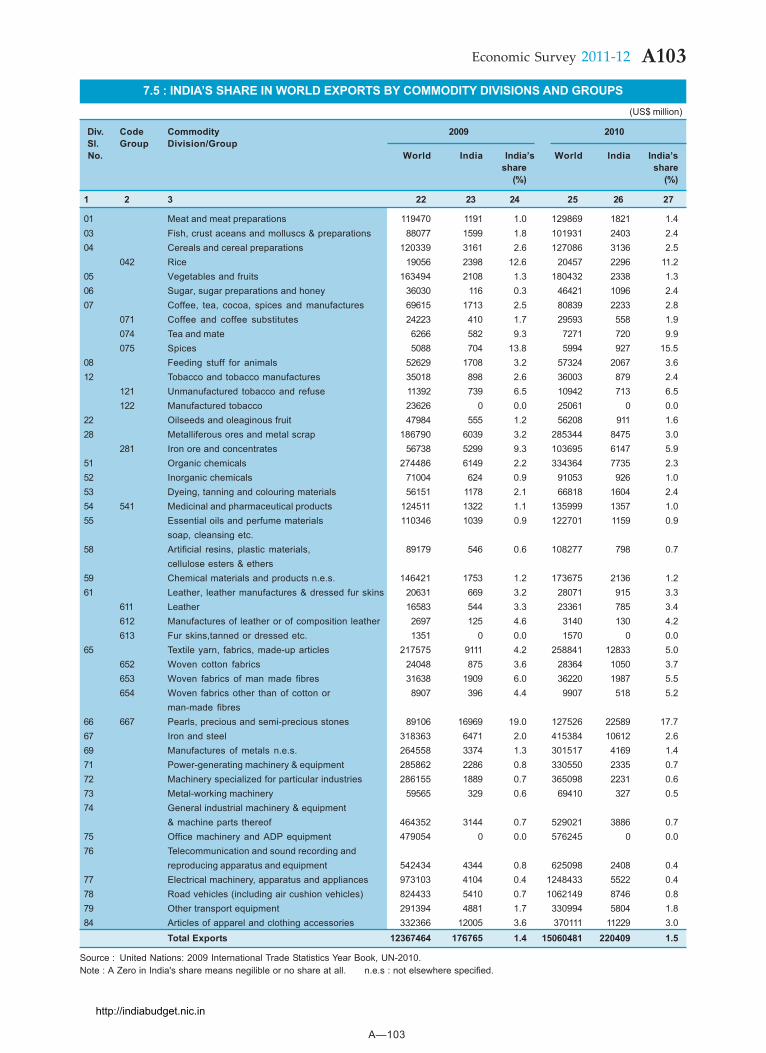
A—103
A103Economic Survey 2011-12
7.5 : INDIA’S SHARE IN WORLD EXPORTS BY COMMODITY DIVISIONS AND GROUPS(US$ million)
Div. Code Commodity 2009 2010 Sl. Group Division/Group No. World India India’s World India India’s
share share(%) (%)
1 2 3 22 23 24 25 26 27
01 Meat and meat preparations 119470 1191 1.0 129869 1821 1.403 Fish, crust aceans and molluscs & preparations 88077 1599 1.8 101931 2403 2.404 Cereals and cereal preparations 120339 3161 2.6 127086 3136 2.5
042 Rice 19056 2398 12.6 20457 2296 11.205 Vegetables and fruits 163494 2108 1.3 180432 2338 1.306 Sugar, sugar preparations and honey 36030 116 0.3 46421 1096 2.407 Coffee, tea, cocoa, spices and manufactures 69615 1713 2.5 80839 2233 2.8
071 Coffee and coffee substitutes 24223 410 1.7 29593 558 1.9074 Tea and mate 6266 582 9.3 7271 720 9.9075 Spices 5088 704 13.8 5994 927 15.5
08 Feeding stuff for animals 52629 1708 3.2 57324 2067 3.612 Tobacco and tobacco manufactures 35018 898 2.6 36003 879 2.4
121 Unmanufactured tobacco and refuse 11392 739 6.5 10942 713 6.5122 Manufactured tobacco 23626 0 0.0 25061 0 0.0
22 Oilseeds and oleaginous fruit 47984 555 1.2 56208 911 1.628 Metalliferous ores and metal scrap 186790 6039 3.2 285344 8475 3.0
281 Iron ore and concentrates 56738 5299 9.3 103695 6147 5.951 Organic chemicals 274486 6149 2.2 334364 7735 2.352 Inorganic chemicals 71004 624 0.9 91053 926 1.053 Dyeing, tanning and colouring materials 56151 1178 2.1 66818 1604 2.454 541 Medicinal and pharmaceutical products 124511 1322 1.1 135999 1357 1.055 Essential oils and perfume materials 110346 1039 0.9 122701 1159 0.9
soap, cleansing etc.58 Artificial resins, plastic materials, 89179 546 0.6 108277 798 0.7
cellulose esters & ethers59 Chemical materials and products n.e.s. 146421 1753 1.2 173675 2136 1.261 Leather, leather manufactures & dressed fur skins 20631 669 3.2 28071 915 3.3
611 Leather 16583 544 3.3 23361 785 3.4612 Manufactures of leather or of composition leather 2697 125 4.6 3140 130 4.2613 Fur skins,tanned or dressed etc. 1351 0 0.0 1570 0 0.0
65 Textile yarn, fabrics, made-up articles 217575 9111 4.2 258841 12833 5.0652 Woven cotton fabrics 24048 875 3.6 28364 1050 3.7653 Woven fabrics of man made fibres 31638 1909 6.0 36220 1987 5.5654 Woven fabrics other than of cotton or 8907 396 4.4 9907 518 5.2
man-made fibres66 667 Pearls, precious and semi-precious stones 89106 16969 19.0 127526 22589 17.767 Iron and steel 318363 6471 2.0 415384 10612 2.669 Manufactures of metals n.e.s. 264558 3374 1.3 301517 4169 1.471 Power-generating machinery & equipment 285862 2286 0.8 330550 2335 0.772 Machinery specialized for particular industries 286155 1889 0.7 365098 2231 0.673 Metal-working machinery 59565 329 0.6 69410 327 0.574 General industrial machinery & equipment
& machine parts thereof 464352 3144 0.7 529021 3886 0.775 Office machinery and ADP equipment 479054 0 0.0 576245 0 0.076 Telecommunication and sound recording and
reproducing apparatus and equipment 542434 4344 0.8 625098 2408 0.477 Electrical machinery, apparatus and appliances 973103 4104 0.4 1248433 5522 0.478 Road vehicles (including air cushion vehicles) 824433 5410 0.7 1062149 8746 0.879 Other transport equipment 291394 4881 1.7 330994 5804 1.884 Articles of apparel and clothing accessories 332366 12005 3.6 370111 11229 3.0
Total Exports 12367464 176765 1.4 15060481 220409 1.5
Source : United Nations: 2009 International Trade Statistics Year Book, UN-2010.Note : A Zero in India's share means negilible or no share at all. n.e.s : not elsewhere specified.
http://indiabudget.nic.in
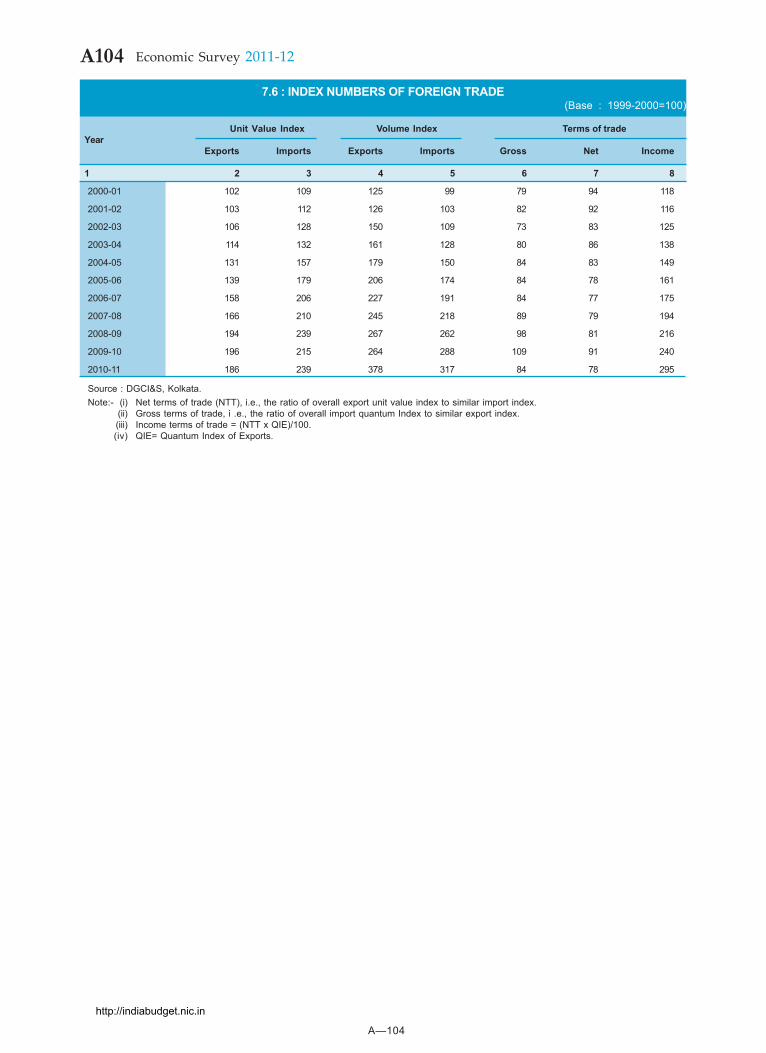
A—104
A104 Economic Survey 2011-12
7.6 : INDEX NUMBERS OF FOREIGN TRADE(Base : 1999-2000=100)
Unit Value Index Volume Index Terms of tradeYear
Exports Imports Exports Imports Gross Net Income
1 2 3 4 5 6 7 8
2000-01 102 109 125 99 79 94 118
2001-02 103 112 126 103 82 92 116
2002-03 106 128 150 109 73 83 125
2003-04 114 132 161 128 80 86 138
2004-05 131 157 179 150 84 83 149
2005-06 139 179 206 174 84 78 161
2006-07 158 206 227 191 84 77 175
2007-08 166 210 245 218 89 79 194
2008-09 194 239 267 262 98 81 216
2009-10 196 215 264 288 109 91 240
2010-11 186 239 378 317 84 78 295
Source : DGCI&S, Kolkata.Note:- (i) Net terms of trade (NTT), i.e., the ratio of overall export unit value index to similar import index.
(ii) Gross terms of trade, i .e., the ratio of overall import quantum Index to similar export index.(iii) Income terms of trade = (NTT x QIE)/100.(iv) QIE= Quantum Index of Exports.
http://indiabudget.nic.in
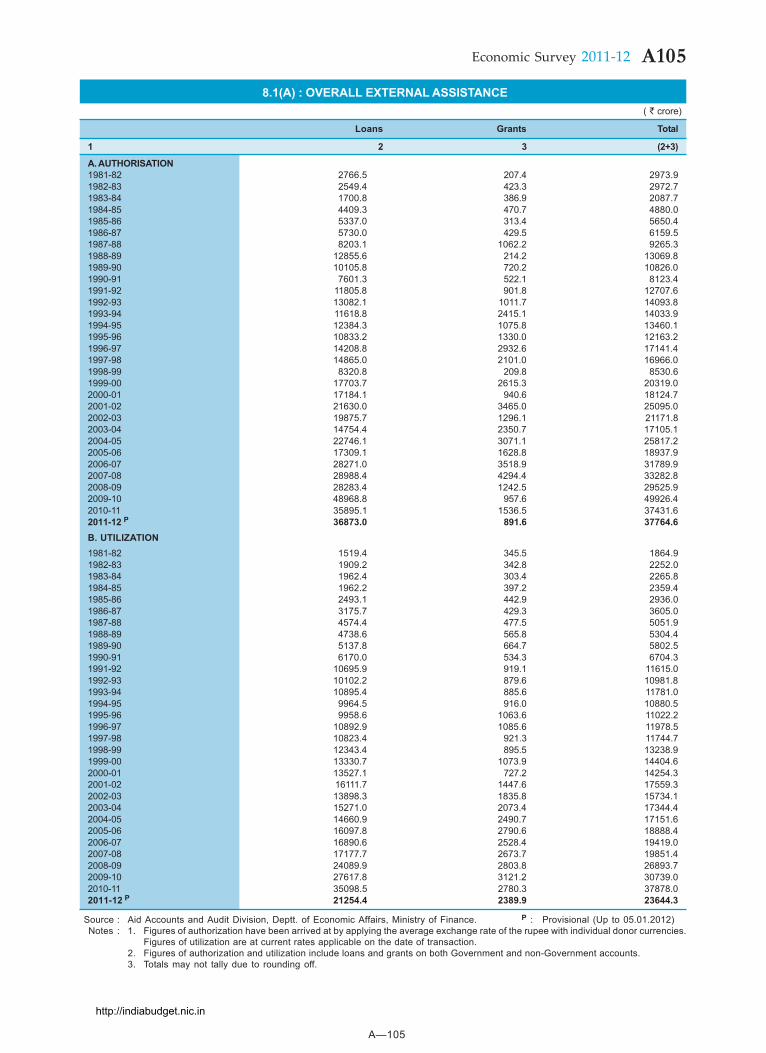
A—105
A105Economic Survey 2011-12
8.1(A) : OVERALL EXTERNAL ASSISTANCE( ` crore)
Loans Grants Total
1 2 3 (2+3)
A. AUTHORISATION1981-82 2766.5 207.4 2973.91982-83 2549.4 423.3 2972.71983-84 1700.8 386.9 2087.71984-85 4409.3 470.7 4880.01985-86 5337.0 313.4 5650.41986-87 5730.0 429.5 6159.51987-88 8203.1 1062.2 9265.31988-89 12855.6 214.2 13069.81989-90 10105.8 720.2 10826.01990-91 7601.3 522.1 8123.41991-92 11805.8 901.8 12707.61992-93 13082.1 1011.7 14093.81993-94 11618.8 2415.1 14033.91994-95 12384.3 1075.8 13460.11995-96 10833.2 1330.0 12163.21996-97 14208.8 2932.6 17141.41997-98 14865.0 2101.0 16966.01998-99 8320.8 209.8 8530.61999-00 17703.7 2615.3 20319.02000-01 17184.1 940.6 18124.72001-02 21630.0 3465.0 25095.02002-03 19875.7 1296.1 21171.82003-04 14754.4 2350.7 17105.12004-05 22746.1 3071.1 25817.22005-06 17309.1 1628.8 18937.92006-07 28271.0 3518.9 31789.92007-08 28988.4 4294.4 33282.82008-09 28283.4 1242.5 29525.92009-10 48968.8 957.6 49926.42010-11 35895.1 1536.5 37431.62011-12 P 36873.0 891.6 37764.6B. UTILIZATION1981-82 1519.4 345.5 1864.91982-83 1909.2 342.8 2252.01983-84 1962.4 303.4 2265.81984-85 1962.2 397.2 2359.41985-86 2493.1 442.9 2936.01986-87 3175.7 429.3 3605.01987-88 4574.4 477.5 5051.91988-89 4738.6 565.8 5304.41989-90 5137.8 664.7 5802.51990-91 6170.0 534.3 6704.31991-92 10695.9 919.1 11615.01992-93 10102.2 879.6 10981.81993-94 10895.4 885.6 11781.01994-95 9964.5 916.0 10880.51995-96 9958.6 1063.6 11022.21996-97 10892.9 1085.6 11978.51997-98 10823.4 921.3 11744.71998-99 12343.4 895.5 13238.91999-00 13330.7 1073.9 14404.62000-01 13527.1 727.2 14254.32001-02 16111.7 1447.6 17559.32002-03 13898.3 1835.8 15734.12003-04 15271.0 2073.4 17344.42004-05 14660.9 2490.7 17151.62005-06 16097.8 2790.6 18888.42006-07 16890.6 2528.4 19419.02007-08 17177.7 2673.7 19851.42008-09 24089.9 2803.8 26893.72009-10 27617.8 3121.2 30739.02010-11 35098.5 2780.3 37878.02011-12 P 21254.4 2389.9 23644.3
Source : Aid Accounts and Audit Division, Deptt. of Economic Affairs, Ministry of Finance. P : Provisional (Up to 05.01.2012) Notes : 1. Figures of authorization have been arrived at by applying the average exchange rate of the rupee with individual donor currencies.
Figures of utilization are at current rates applicable on the date of transaction.2. Figures of authorization and utilization include loans and grants on both Government and non-Government accounts.3. Totals may not tally due to rounding off.
http://indiabudget.nic.in
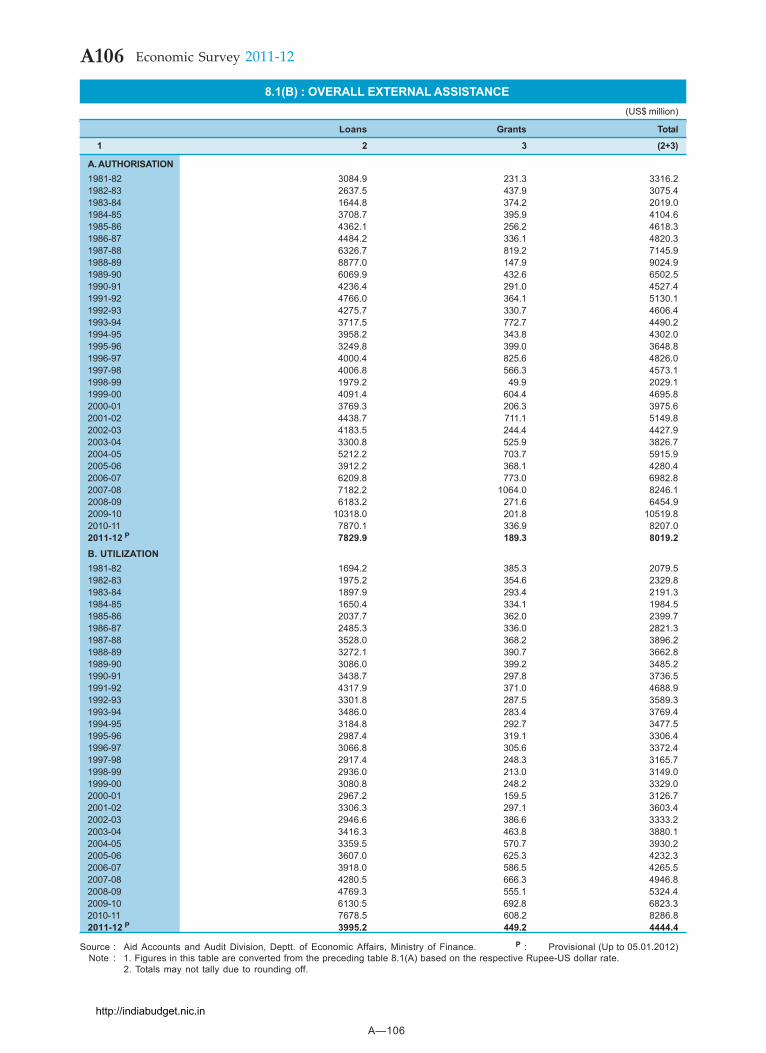
A—106
A106 Economic Survey 2011-12
8.1(B) : OVERALL EXTERNAL ASSISTANCE(US$ million)
Loans Grants Total
1 2 3 (2+3)
A. AUTHORISATION1981-82 3084.9 231.3 3316.21982-83 2637.5 437.9 3075.41983-84 1644.8 374.2 2019.01984-85 3708.7 395.9 4104.61985-86 4362.1 256.2 4618.31986-87 4484.2 336.1 4820.31987-88 6326.7 819.2 7145.91988-89 8877.0 147.9 9024.91989-90 6069.9 432.6 6502.51990-91 4236.4 291.0 4527.41991-92 4766.0 364.1 5130.11992-93 4275.7 330.7 4606.41993-94 3717.5 772.7 4490.21994-95 3958.2 343.8 4302.01995-96 3249.8 399.0 3648.81996-97 4000.4 825.6 4826.01997-98 4006.8 566.3 4573.11998-99 1979.2 49.9 2029.11999-00 4091.4 604.4 4695.82000-01 3769.3 206.3 3975.62001-02 4438.7 711.1 5149.82002-03 4183.5 244.4 4427.92003-04 3300.8 525.9 3826.72004-05 5212.2 703.7 5915.92005-06 3912.2 368.1 4280.42006-07 6209.8 773.0 6982.82007-08 7182.2 1064.0 8246.12008-09 6183.2 271.6 6454.92009-10 10318.0 201.8 10519.82010-11 7870.1 336.9 8207.02011-12 P 7829.9 189.3 8019.2B. UTILIZATION1981-82 1694.2 385.3 2079.51982-83 1975.2 354.6 2329.81983-84 1897.9 293.4 2191.31984-85 1650.4 334.1 1984.51985-86 2037.7 362.0 2399.71986-87 2485.3 336.0 2821.31987-88 3528.0 368.2 3896.21988-89 3272.1 390.7 3662.81989-90 3086.0 399.2 3485.21990-91 3438.7 297.8 3736.51991-92 4317.9 371.0 4688.91992-93 3301.8 287.5 3589.31993-94 3486.0 283.4 3769.41994-95 3184.8 292.7 3477.51995-96 2987.4 319.1 3306.41996-97 3066.8 305.6 3372.41997-98 2917.4 248.3 3165.71998-99 2936.0 213.0 3149.01999-00 3080.8 248.2 3329.02000-01 2967.2 159.5 3126.72001-02 3306.3 297.1 3603.42002-03 2946.6 386.6 3333.22003-04 3416.3 463.8 3880.12004-05 3359.5 570.7 3930.22005-06 3607.0 625.3 4232.32006-07 3918.0 586.5 4265.52007-08 4280.5 666.3 4946.82008-09 4769.3 555.1 5324.42009-10 6130.5 692.8 6823.32010-11 7678.5 608.2 8286.82011-12 P 3995.2 449.2 4444.4
Source : Aid Accounts and Audit Division, Deptt. of Economic Affairs, Ministry of Finance. P : Provisional (Up to 05.01.2012)Note : 1. Figures in this table are converted from the preceding table 8.1(A) based on the respective Rupee-US dollar rate.
2. Totals may not tally due to rounding off.
http://indiabudget.nic.in
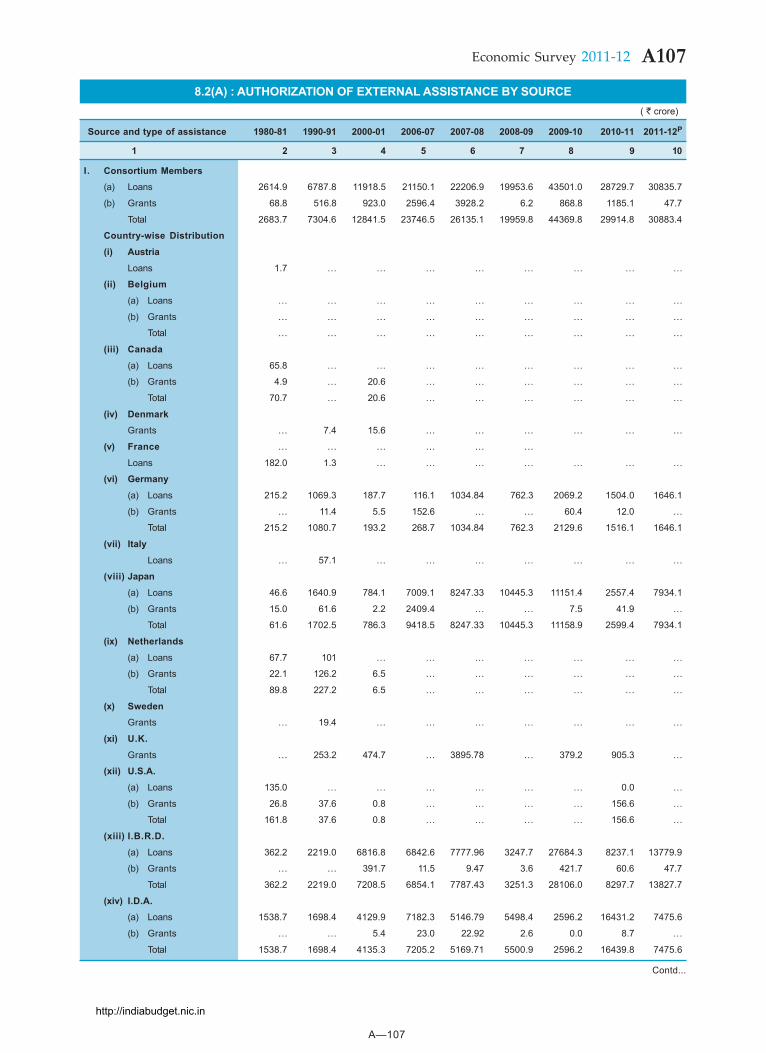
A—107
A107Economic Survey 2011-12
Contd...
8.2(A) : AUTHORIZATION OF EXTERNAL ASSISTANCE BY SOURCE( ` crore)
Source and type of assistance 1980-81 1990-91 2000-01 2006-07 2007-08 2008-09 2009-10 2010-11 2011-12P
1 2 3 4 5 6 7 8 9 10
I. Consortium Members(a) Loans 2614.9 6787.8 11918.5 21150.1 22206.9 19953.6 43501.0 28729.7 30835.7
(b) Grants 68.8 516.8 923.0 2596.4 3928.2 6.2 868.8 1185.1 47.7
Total 2683.7 7304.6 12841.5 23746.5 26135.1 19959.8 44369.8 29914.8 30883.4
Country-wise Distribution
(i) Austria
Loans 1.7 ... ... ... ... ... ... ... ...
(ii) Belgium
(a) Loans ... ... ... ... ... ... ... ... ...
(b) Grants ... ... ... ... ... ... ... ... ...
Total ... ... ... ... ... ... ... ... ...
(iii) Canada
(a) Loans 65.8 ... ... ... ... ... ... ... ...
(b) Grants 4.9 ... 20.6 ... ... ... ... ... ...
Total 70.7 ... 20.6 ... ... ... ... ... ...
(iv) DenmarkGrants ... 7.4 15.6 ... ... ... ... ... ...
(v) France ... ... ... ... ... ...
Loans 182.0 1.3 ... ... ... ... ... ... ...
(vi) Germany
(a) Loans 215.2 1069.3 187.7 116.1 1034.84 762.3 2069.2 1504.0 1646.1
(b) Grants ... 11.4 5.5 152.6 ... ... 60.4 12.0 ...
Total 215.2 1080.7 193.2 268.7 1034.84 762.3 2129.6 1516.1 1646.1
(vii) Italy
Loans ... 57.1 ... ... ... ... ... ... ...
(viii) Japan
(a) Loans 46.6 1640.9 784.1 7009.1 8247.33 10445.3 11151.4 2557.4 7934.1
(b) Grants 15.0 61.6 2.2 2409.4 ... ... 7.5 41.9 ...
Total 61.6 1702.5 786.3 9418.5 8247.33 10445.3 11158.9 2599.4 7934.1
(ix) Netherlands
(a) Loans 67.7 101 ... ... ... ... ... ... ...
(b) Grants 22.1 126.2 6.5 ... ... ... ... ... ...
Total 89.8 227.2 6.5 ... ... ... ... ... ...
(x) SwedenGrants ... 19.4 ... ... ... ... ... ... ...
(xi) U.K.
Grants ... 253.2 474.7 ... 3895.78 ... 379.2 905.3 ...
(xii) U.S.A.
(a) Loans 135.0 ... ... ... ... ... ... 0.0 ...
(b) Grants 26.8 37.6 0.8 ... ... ... ... 156.6 ...
Total 161.8 37.6 0.8 ... ... ... ... 156.6 ...
(xiii) I.B.R.D.
(a) Loans 362.2 2219.0 6816.8 6842.6 7777.96 3247.7 27684.3 8237.1 13779.9
(b) Grants ... ... 391.7 11.5 9.47 3.6 421.7 60.6 47.7
Total 362.2 2219.0 7208.5 6854.1 7787.43 3251.3 28106.0 8297.7 13827.7
(xiv) I.D.A.(a) Loans 1538.7 1698.4 4129.9 7182.3 5146.79 5498.4 2596.2 16431.2 7475.6
(b) Grants ... ... 5.4 23.0 22.92 2.6 0.0 8.7 ...
Total 1538.7 1698.4 4135.3 7205.2 5169.71 5500.9 2596.2 16439.8 7475.6
http://indiabudget.nic.in
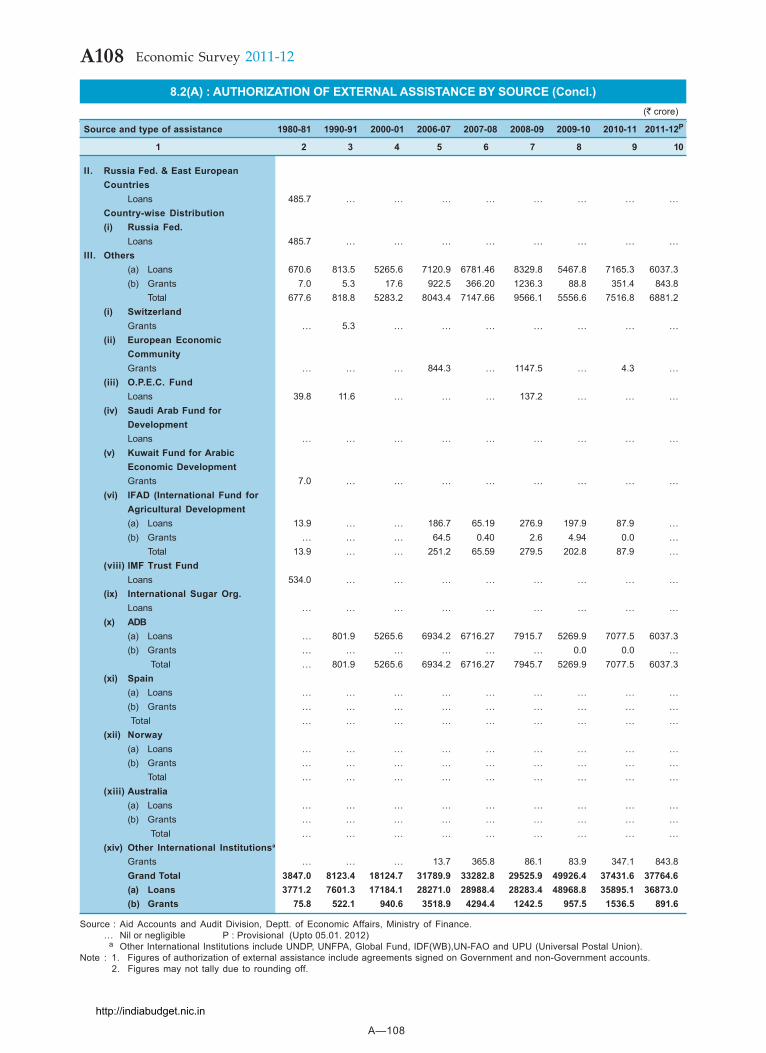
A—108
A108 Economic Survey 2011-12
8.2(A) : AUTHORIZATION OF EXTERNAL ASSISTANCE BY SOURCE (Concl.)(` crore)
Source and type of assistance 1980-81 1990-91 2000-01 2006-07 2007-08 2008-09 2009-10 2010-11 2011-12P
1 2 3 4 5 6 7 8 9 10
II. Russia Fed. & East EuropeanCountries
Loans 485.7 ... ... ... ... ... ... ... ...Country-wise Distribution(i) Russia Fed.
Loans 485.7 ... ... ... ... ... ... ... ...III. Others
(a) Loans 670.6 813.5 5265.6 7120.9 6781.46 8329.8 5467.8 7165.3 6037.3(b) Grants 7.0 5.3 17.6 922.5 366.20 1236.3 88.8 351.4 843.8
Total 677.6 818.8 5283.2 8043.4 7147.66 9566.1 5556.6 7516.8 6881.2(i) Switzerland
Grants ... 5.3 ... ... ... ... ... ... ...(ii) European Economic
CommunityGrants ... ... ... 844.3 ... 1147.5 ... 4.3 ...
(iii) O.P.E.C. FundLoans 39.8 11.6 ... ... ... 137.2 ... ... ...
(iv) Saudi Arab Fund forDevelopmentLoans ... ... ... ... ... ... ... ... ...
(v) Kuwait Fund for ArabicEconomic DevelopmentGrants 7.0 ... ... ... ... ... ... ... ...
(vi) IFAD (International Fund forAgricultural Development(a) Loans 13.9 ... ... 186.7 65.19 276.9 197.9 87.9 ...(b) Grants ... ... ... 64.5 0.40 2.6 4.94 0.0 ...
Total 13.9 ... ... 251.2 65.59 279.5 202.8 87.9 ...(viii) IMF Trust Fund
Loans 534.0 ... ... ... ... ... ... ... ...(ix) International Sugar Org.
Loans ... ... ... ... ... ... ... ... ...(x) ADB
(a) Loans ... 801.9 5265.6 6934.2 6716.27 7915.7 5269.9 7077.5 6037.3(b) Grants ... ... ... ... ... ... 0.0 0.0 ...
Total ... 801.9 5265.6 6934.2 6716.27 7945.7 5269.9 7077.5 6037.3(xi) Spain
(a) Loans ... ... ... ... ... ... ... ... ...(b) Grants ... ... ... ... ... ... ... ... ... Total ... ... ... ... ... ... ... ... ...
(xii) Norway(a) Loans ... ... ... ... ... ... ... ... ...(b) Grants ... ... ... ... ... ... ... ... ...
Total ... ... ... ... ... ... ... ... ...(xiii) Australia
(a) Loans ... ... ... ... ... ... ... ... ...(b) Grants ... ... ... ... ... ... ... ... ...
Total ... ... ... ... ... ... ... ... ...(xiv) Other International Institutionsa
Grants ... ... ... 13.7 365.8 86.1 83.9 347.1 843.8Grand Total 3847.0 8123.4 18124.7 31789.9 33282.8 29525.9 49926.4 37431.6 37764.6(a) Loans 3771.2 7601.3 17184.1 28271.0 28988.4 28283.4 48968.8 35895.1 36873.0(b) Grants 75.8 522.1 940.6 3518.9 4294.4 1242.5 957.5 1536.5 891.6
Source : Aid Accounts and Audit Division, Deptt. of Economic Affairs, Ministry of Finance.... Nil or negligible P : Provisional (Upto 05.01. 2012)
a Other International Institutions include UNDP, UNFPA, Global Fund, IDF(WB),UN-FAO and UPU (Universal Postal Union).Note : 1. Figures of authorization of external assistance include agreements signed on Government and non-Government accounts.
2. Figures may not tally due to rounding off.
http://indiabudget.nic.in
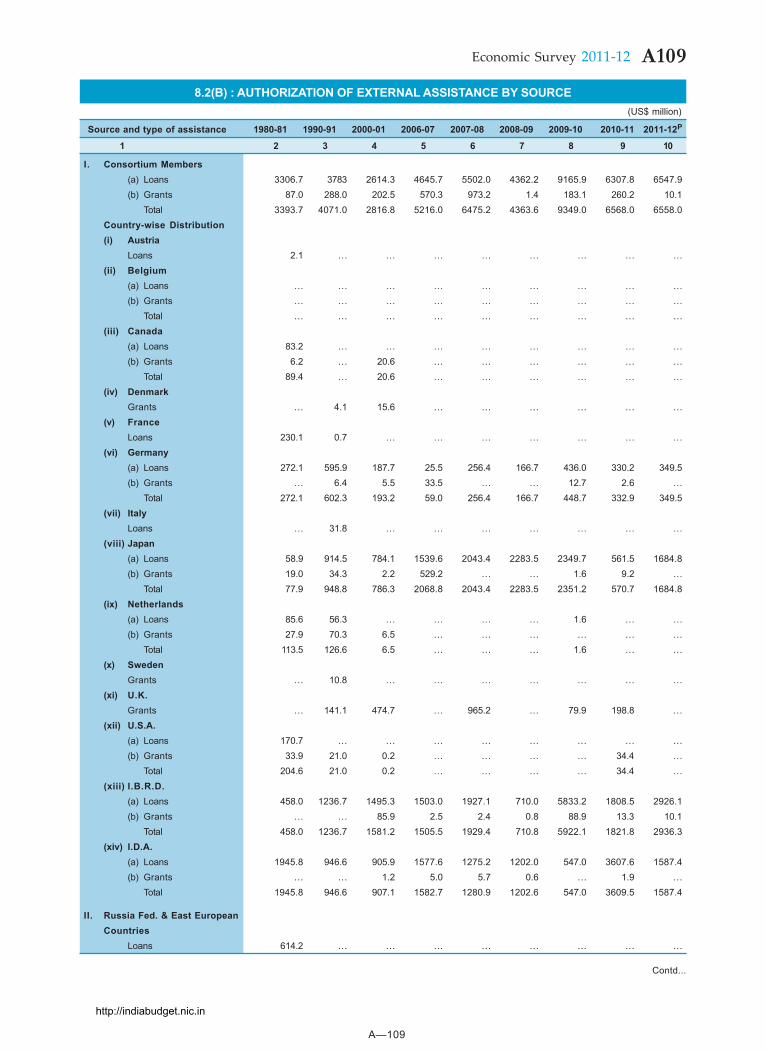
A—109
A109Economic Survey 2011-12
Contd...
8.2(B) : AUTHORIZATION OF EXTERNAL ASSISTANCE BY SOURCE(US$ million)
Source and type of assistance 1980-81 1990-91 2000-01 2006-07 2007-08 2008-09 2009-10 2010-11 2011-12P
1 2 3 4 5 6 7 8 9 10
I. Consortium Members(a) Loans 3306.7 3783 2614.3 4645.7 5502.0 4362.2 9165.9 6307.8 6547.9(b) Grants 87.0 288.0 202.5 570.3 973.2 1.4 183.1 260.2 10.1
Total 3393.7 4071.0 2816.8 5216.0 6475.2 4363.6 9349.0 6568.0 6558.0Country-wise Distribution(i) Austria
Loans 2.1 ... ... ... ... ... ... ... ...(ii) Belgium
(a) Loans ... ... ... ... ... ... ... ... ...(b) Grants ... ... ... ... ... ... ... ... ...
Total ... ... ... ... ... ... ... ... ...(iii) Canada
(a) Loans 83.2 ... ... ... ... ... ... ... ...(b) Grants 6.2 ... 20.6 ... ... ... ... ... ...
Total 89.4 ... 20.6 ... ... ... ... ... ...(iv) Denmark
Grants ... 4.1 15.6 ... ... ... ... ... ...(v) France
Loans 230.1 0.7 ... ... ... ... ... ... ...(vi) Germany
(a) Loans 272.1 595.9 187.7 25.5 256.4 166.7 436.0 330.2 349.5(b) Grants ... 6.4 5.5 33.5 ... ... 12.7 2.6 ...
Total 272.1 602.3 193.2 59.0 256.4 166.7 448.7 332.9 349.5(vii) Italy
Loans ... 31.8 ... ... ... ... ... ... ...(viii) Japan
(a) Loans 58.9 914.5 784.1 1539.6 2043.4 2283.5 2349.7 561.5 1684.8(b) Grants 19.0 34.3 2.2 529.2 ... ... 1.6 9.2 ...
Total 77.9 948.8 786.3 2068.8 2043.4 2283.5 2351.2 570.7 1684.8(ix) Netherlands
(a) Loans 85.6 56.3 ... ... ... ... 1.6 ... ...(b) Grants 27.9 70.3 6.5 ... ... ... ... ... ...
Total 113.5 126.6 6.5 ... ... ... 1.6 ... ...(x) Sweden
Grants ... 10.8 ... ... ... ... ... ... ...(xi) U.K.
Grants ... 141.1 474.7 ... 965.2 ... 79.9 198.8 ...(xii) U.S.A.
(a) Loans 170.7 ... ... ... ... ... ... ... ...(b) Grants 33.9 21.0 0.2 ... ... ... ... 34.4 ...
Total 204.6 21.0 0.2 ... ... ... ... 34.4 ...(xiii) I.B.R.D.
(a) Loans 458.0 1236.7 1495.3 1503.0 1927.1 710.0 5833.2 1808.5 2926.1(b) Grants ... ... 85.9 2.5 2.4 0.8 88.9 13.3 10.1
Total 458.0 1236.7 1581.2 1505.5 1929.4 710.8 5922.1 1821.8 2936.3(xiv) I.D.A.
(a) Loans 1945.8 946.6 905.9 1577.6 1275.2 1202.0 547.0 3607.6 1587.4(b) Grants ... ... 1.2 5.0 5.7 0.6 ... 1.9 ...
Total 1945.8 946.6 907.1 1582.7 1280.9 1202.6 547.0 3609.5 1587.4
II. Russia Fed. & East EuropeanCountries
Loans 614.2 ... ... ... ... ... ... ... ...
http://indiabudget.nic.in
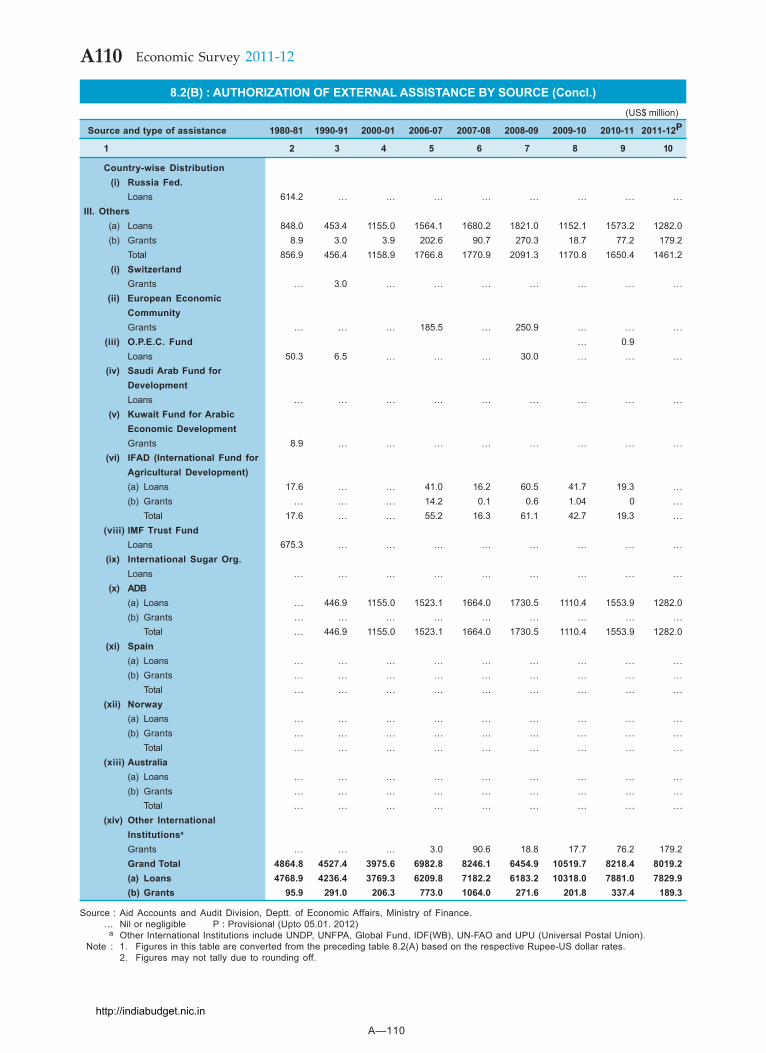
A—110
A110 Economic Survey 2011-12
8.2(B) : AUTHORIZATION OF EXTERNAL ASSISTANCE BY SOURCE (Concl.)(US$ million)
Source and type of assistance 1980-81 1990-91 2000-01 2006-07 2007-08 2008-09 2009-10 2010-11 2011-12P
1 2 3 4 5 6 7 8 9 10
Country-wise Distribution(i) Russia Fed.
Loans 614.2 ... ... ... ... ... ... ... ...III. Others
(a) Loans 848.0 453.4 1155.0 1564.1 1680.2 1821.0 1152.1 1573.2 1282.0(b) Grants 8.9 3.0 3.9 202.6 90.7 270.3 18.7 77.2 179.2
Total 856.9 456.4 1158.9 1766.8 1770.9 2091.3 1170.8 1650.4 1461.2(i) Switzerland
Grants ... 3.0 ... ... ... ... ... ... ...(ii) European Economic
CommunityGrants ... ... ... 185.5 ... 250.9 ... ... ...
(iii) O.P.E.C. Fund ... 0.9Loans 50.3 6.5 ... ... ... 30.0 ... ... ...
(iv) Saudi Arab Fund forDevelopmentLoans ... ... ... ... ... ... ... ... ...
(v) Kuwait Fund for ArabicEconomic DevelopmentGrants 8.9 ... ... ... ... ... ... ... ...
(vi) IFAD (International Fund forAgricultural Development)(a) Loans 17.6 ... ... 41.0 16.2 60.5 41.7 19.3 ...(b) Grants ... ... ... 14.2 0.1 0.6 1.04 0 ...
Total 17.6 ... ... 55.2 16.3 61.1 42.7 19.3 ...(viii) IMF Trust Fund
Loans 675.3 ... ... ... ... ... ... ... ...(ix) International Sugar Org.
Loans ... ... ... ... ... ... ... ... ...(x) ADB
(a) Loans ... 446.9 1155.0 1523.1 1664.0 1730.5 1110.4 1553.9 1282.0(b) Grants ... ... ... ... ... ... ... ... ...
Total ... 446.9 1155.0 1523.1 1664.0 1730.5 1110.4 1553.9 1282.0(xi) Spain
(a) Loans ... ... ... ... ... ... ... ... ...(b) Grants ... ... ... ... ... ... ... ... ...
Total ... ... ... ... ... ... ... ... ...(xii) Norway
(a) Loans ... ... ... ... ... ... ... ... ...(b) Grants ... ... ... ... ... ... ... ... ...
Total ... ... ... ... ... ... ... ... ...(xiii) Australia
(a) Loans ... ... ... ... ... ... ... ... ...(b) Grants ... ... ... ... ... ... ... ... ...
Total ... ... ... ... ... ... ... ... ...(xiv) Other International
Institutionsa
Grants ... ... ... 3.0 90.6 18.8 17.7 76.2 179.2Grand Total 4864.8 4527.4 3975.6 6982.8 8246.1 6454.9 10519.7 8218.4 8019.2(a) Loans 4768.9 4236.4 3769.3 6209.8 7182.2 6183.2 10318.0 7881.0 7829.9(b) Grants 95.9 291.0 206.3 773.0 1064.0 271.6 201.8 337.4 189.3
Source : Aid Accounts and Audit Division, Deptt. of Economic Affairs, Ministry of Finance.... Nil or negligible P : Provisional (Upto 05.01. 2012)
a Other International Institutions include UNDP, UNFPA, Global Fund, IDF(WB), UN-FAO and UPU (Universal Postal Union).Note : 1. Figures in this table are converted from the preceding table 8.2(A) based on the respective Rupee-US dollar rates.
2. Figures may not tally due to rounding off.
http://indiabudget.nic.in
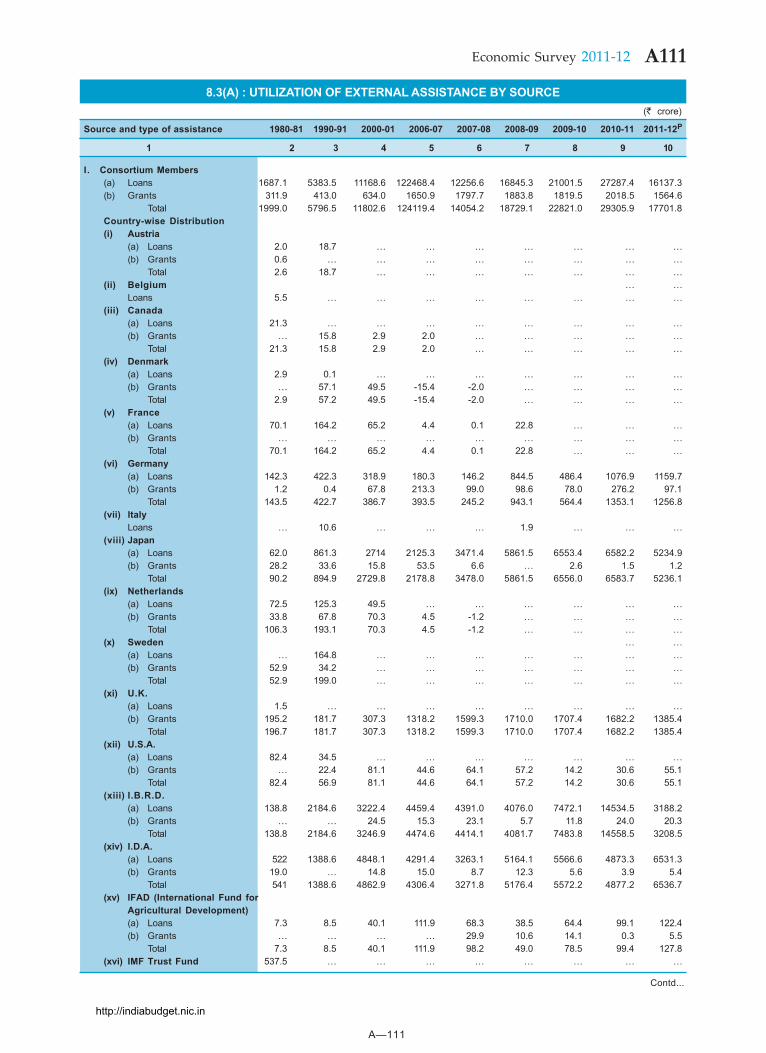
A—111
A111Economic Survey 2011-12
Contd...
8.3(A) : UTILIZATION OF EXTERNAL ASSISTANCE BY SOURCE(` crore)
Source and type of assistance 1980-81 1990-91 2000-01 2006-07 2007-08 2008-09 2009-10 2010-11 2011-12P
1 2 3 4 5 6 7 8 9 10
I. Consortium Members(a) Loans 1687.1 5383.5 11168.6 122468.4 12256.6 16845.3 21001.5 27287.4 16137.3(b) Grants 311.9 413.0 634.0 1650.9 1797.7 1883.8 1819.5 2018.5 1564.6
Total 1999.0 5796.5 11802.6 124119.4 14054.2 18729.1 22821.0 29305.9 17701.8Country-wise Distribution(i) Austria
(a) Loans 2.0 18.7 ... ... ... ... ... ... ...(b) Grants 0.6 ... ... ... ... ... ... ... ...
Total 2.6 18.7 ... ... ... ... ... ... ...(ii) Belgium ... ...
Loans 5.5 ... ... ... ... ... ... ... ...(iii) Canada
(a) Loans 21.3 ... ... ... ... ... ... ... ...(b) Grants ... 15.8 2.9 2.0 ... ... ... ... ...
Total 21.3 15.8 2.9 2.0 ... ... ... ... ...(iv) Denmark
(a) Loans 2.9 0.1 ... ... ... ... ... ... ...(b) Grants ... 57.1 49.5 -15.4 -2.0 ... ... ... ...
Total 2.9 57.2 49.5 -15.4 -2.0 ... ... ... ...(v) France
(a) Loans 70.1 164.2 65.2 4.4 0.1 22.8 ... ... ...(b) Grants ... ... ... ... ... ... ... ... ...
Total 70.1 164.2 65.2 4.4 0.1 22.8 ... ... ...(vi) Germany
(a) Loans 142.3 422.3 318.9 180.3 146.2 844.5 486.4 1076.9 1159.7(b) Grants 1.2 0.4 67.8 213.3 99.0 98.6 78.0 276.2 97.1
Total 143.5 422.7 386.7 393.5 245.2 943.1 564.4 1353.1 1256.8(vii) Italy
Loans ... 10.6 ... ... ... 1.9 ... ... ...(viii) Japan
(a) Loans 62.0 861.3 2714 2125.3 3471.4 5861.5 6553.4 6582.2 5234.9(b) Grants 28.2 33.6 15.8 53.5 6.6 ... 2.6 1.5 1.2
Total 90.2 894.9 2729.8 2178.8 3478.0 5861.5 6556.0 6583.7 5236.1(ix) Netherlands
(a) Loans 72.5 125.3 49.5 ... ... ... ... ... ...(b) Grants 33.8 67.8 70.3 4.5 -1.2 ... ... ... ...
Total 106.3 193.1 70.3 4.5 -1.2 ... ... ... ...(x) Sweden ... ...
(a) Loans ... 164.8 ... ... ... ... ... ... ...(b) Grants 52.9 34.2 ... ... ... ... ... ... ...
Total 52.9 199.0 ... ... ... ... ... ... ...(xi) U.K.
(a) Loans 1.5 ... ... ... ... ... ... ... ...(b) Grants 195.2 181.7 307.3 1318.2 1599.3 1710.0 1707.4 1682.2 1385.4
Total 196.7 181.7 307.3 1318.2 1599.3 1710.0 1707.4 1682.2 1385.4(xii) U.S.A.
(a) Loans 82.4 34.5 ... ... ... ... ... ... ...(b) Grants ... 22.4 81.1 44.6 64.1 57.2 14.2 30.6 55.1
Total 82.4 56.9 81.1 44.6 64.1 57.2 14.2 30.6 55.1(xiii) I.B.R.D.
(a) Loans 138.8 2184.6 3222.4 4459.4 4391.0 4076.0 7472.1 14534.5 3188.2(b) Grants ... ... 24.5 15.3 23.1 5.7 11.8 24.0 20.3
Total 138.8 2184.6 3246.9 4474.6 4414.1 4081.7 7483.8 14558.5 3208.5(xiv) I.D.A.
(a) Loans 522 1388.6 4848.1 4291.4 3263.1 5164.1 5566.6 4873.3 6531.3(b) Grants 19.0 ... 14.8 15.0 8.7 12.3 5.6 3.9 5.4
Total 541 1388.6 4862.9 4306.4 3271.8 5176.4 5572.2 4877.2 6536.7(xv) IFAD (International Fund for
Agricultural Development)(a) Loans 7.3 8.5 40.1 111.9 68.3 38.5 64.4 99.1 122.4(b) Grants ... ... ... ... 29.9 10.6 14.1 0.3 5.5
Total 7.3 8.5 40.1 111.9 98.2 49.0 78.5 99.4 127.8(xvi) IMF Trust Fund 537.5 ... ... ... ... ... ... ... ...
http://indiabudget.nic.in
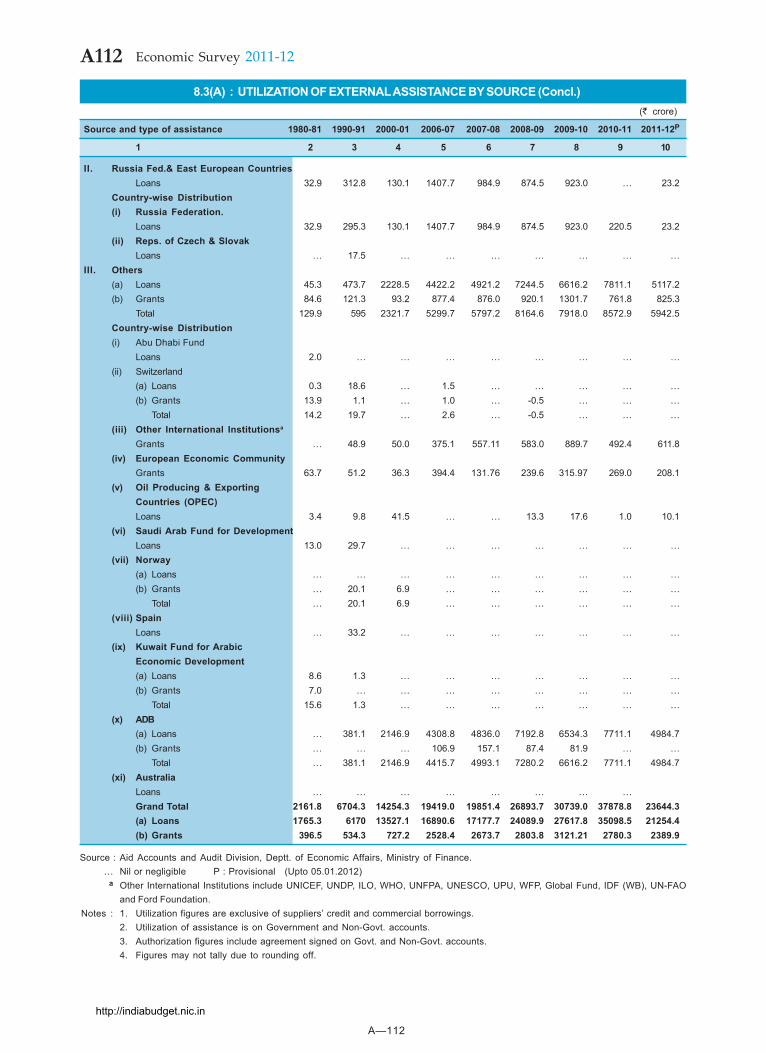
A—112
A112 Economic Survey 2011-12
8.3(A) : UTILIZATION OF EXTERNAL ASSISTANCE BY SOURCE (Concl.)(` crore)
Source and type of assistance 1980-81 1990-91 2000-01 2006-07 2007-08 2008-09 2009-10 2010-11 2011-12P
1 2 3 4 5 6 7 8 9 10
II. Russia Fed.& East European CountriesLoans 32.9 312.8 130.1 1407.7 984.9 874.5 923.0 ... 23.2
Country-wise Distribution(i) Russia Federation.
Loans 32.9 295.3 130.1 1407.7 984.9 874.5 923.0 220.5 23.2(ii) Reps. of Czech & Slovak
Loans ... 17.5 ... ... ... ... ... ... ...III. Others
(a) Loans 45.3 473.7 2228.5 4422.2 4921.2 7244.5 6616.2 7811.1 5117.2(b) Grants 84.6 121.3 93.2 877.4 876.0 920.1 1301.7 761.8 825.3
Total 129.9 595 2321.7 5299.7 5797.2 8164.6 7918.0 8572.9 5942.5Country-wise Distribution(i) Abu Dhabi Fund
Loans 2.0 ... ... ... ... ... ... ... ...(ii) Switzerland
(a) Loans 0.3 18.6 ... 1.5 ... ... ... ... ...(b) Grants 13.9 1.1 ... 1.0 ... -0.5 ... ... ...
Total 14.2 19.7 ... 2.6 ... -0.5 ... ... ...(iii) Other International Institutionsa
Grants ... 48.9 50.0 375.1 557.11 583.0 889.7 492.4 611.8(iv) European Economic Community
Grants 63.7 51.2 36.3 394.4 131.76 239.6 315.97 269.0 208.1(v) Oil Producing & Exporting
Countries (OPEC)Loans 3.4 9.8 41.5 ... ... 13.3 17.6 1.0 10.1
(vi) Saudi Arab Fund for DevelopmentLoans 13.0 29.7 ... ... ... ... ... ... ...
(vii) Norway(a) Loans ... ... ... ... ... ... ... ... ...(b) Grants ... 20.1 6.9 ... ... ... ... ... ...
Total ... 20.1 6.9 ... ... ... ... ... ...(viii) Spain
Loans ... 33.2 ... ... ... ... ... ... ...(ix) Kuwait Fund for Arabic
Economic Development(a) Loans 8.6 1.3 ... ... ... ... ... ... ...(b) Grants 7.0 ... ... ... ... ... ... ... ...
Total 15.6 1.3 ... ... ... ... ... ... ...(x) ADB
(a) Loans ... 381.1 2146.9 4308.8 4836.0 7192.8 6534.3 7711.1 4984.7(b) Grants ... ... ... 106.9 157.1 87.4 81.9 ... ...
Total ... 381.1 2146.9 4415.7 4993.1 7280.2 6616.2 7711.1 4984.7(xi) Australia
Loans ... ... ... ... ... ... ... ...Grand Total 2161.8 6704.3 14254.3 19419.0 19851.4 26893.7 30739.0 37878.8 23644.3(a) Loans 1765.3 6170 13527.1 16890.6 17177.7 24089.9 27617.8 35098.5 21254.4(b) Grants 396.5 534.3 727.2 2528.4 2673.7 2803.8 3121.21 2780.3 2389.9
Source : Aid Accounts and Audit Division, Deptt. of Economic Affairs, Ministry of Finance.... Nil or negligible P : Provisional (Upto 05.01.2012)
a Other International Institutions include UNICEF, UNDP, ILO, WHO, UNFPA, UNESCO, UPU, WFP, Global Fund, IDF (WB), UN-FAOand Ford Foundation.
Notes : 1. Utilization figures are exclusive of suppliers’ credit and commercial borrowings.2. Utilization of assistance is on Government and Non-Govt. accounts.3. Authorization figures include agreement signed on Govt. and Non-Govt. accounts.4. Figures may not tally due to rounding off.
http://indiabudget.nic.in
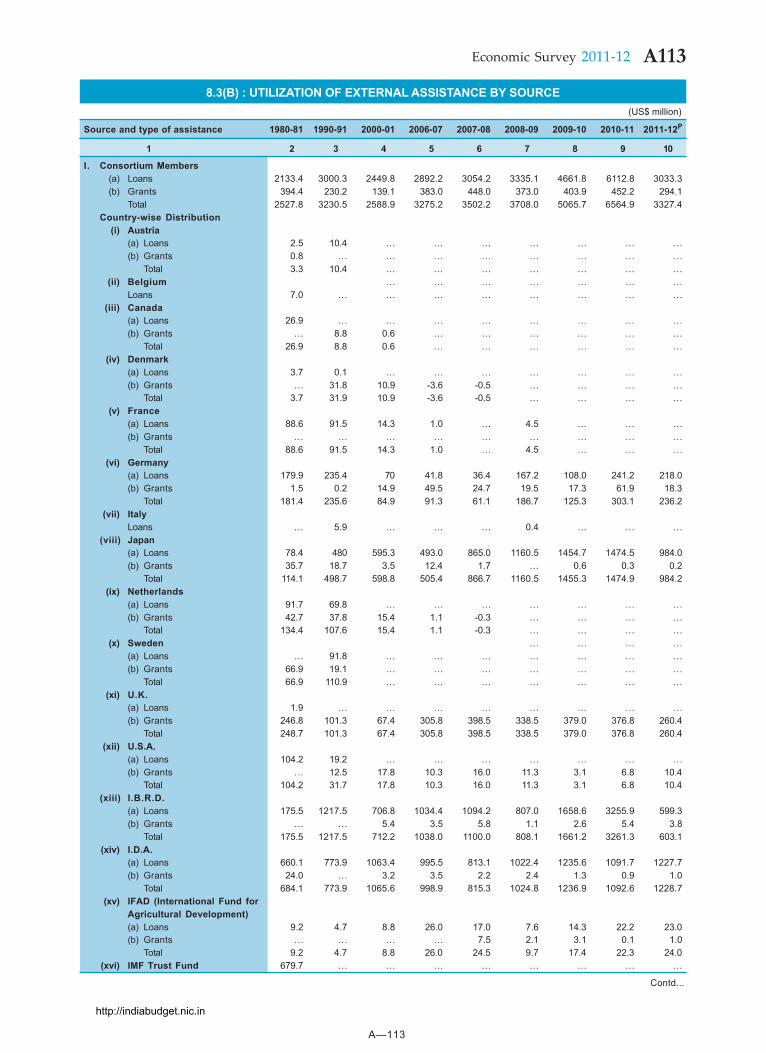
A—113
A113Economic Survey 2011-12
Contd...
8.3(B) : UTILIZATION OF EXTERNAL ASSISTANCE BY SOURCE(US$ million)
Source and type of assistance 1980-81 1990-91 2000-01 2006-07 2007-08 2008-09 2009-10 2010-11 2011-12P
1 2 3 4 5 6 7 8 9 10
I. Consortium Members(a) Loans 2133.4 3000.3 2449.8 2892.2 3054.2 3335.1 4661.8 6112.8 3033.3(b) Grants 394.4 230.2 139.1 383.0 448.0 373.0 403.9 452.2 294.1
Total 2527.8 3230.5 2588.9 3275.2 3502.2 3708.0 5065.7 6564.9 3327.4Country-wise Distribution
(i) Austria(a) Loans 2.5 10.4 ... ... ... ... ... ... ...(b) Grants 0.8 ... ... ... ... ... ... ... ...
Total 3.3 10.4 ... ... ... ... ... ... ...(ii) Belgium ... ... ... ... ... ... ...
Loans 7.0 ... ... ... ... ... ... ... ...(iii) Canada
(a) Loans 26.9 ... ... ... ... ... ... ... ...(b) Grants ... 8.8 0.6 ... ... ... ... ... ...
Total 26.9 8.8 0.6 ... ... ... ... ... ...(iv) Denmark
(a) Loans 3.7 0.1 ... ... ... ... ... ... ...(b) Grants ... 31.8 10.9 -3.6 -0.5 ... ... ... ...
Total 3.7 31.9 10.9 -3.6 -0.5 ... ... ... ...(v) France
(a) Loans 88.6 91.5 14.3 1.0 ... 4.5 ... ... ...(b) Grants ... ... ... ... ... ... ... ... ...
Total 88.6 91.5 14.3 1.0 ... 4.5 ... ... ...(vi) Germany
(a) Loans 179.9 235.4 70 41.8 36.4 167.2 108.0 241.2 218.0(b) Grants 1.5 0.2 14.9 49.5 24.7 19.5 17.3 61.9 18.3
Total 181.4 235.6 84.9 91.3 61.1 186.7 125.3 303.1 236.2(vii) Italy
Loans ... 5.9 ... ... ... 0.4 ... ... ...(viii) Japan
(a) Loans 78.4 480 595.3 493.0 865.0 1160.5 1454.7 1474.5 984.0(b) Grants 35.7 18.7 3.5 12.4 1.7 ... 0.6 0.3 0.2
Total 114.1 498.7 598.8 505.4 866.7 1160.5 1455.3 1474.9 984.2(ix) Netherlands
(a) Loans 91.7 69.8 ... ... ... ... ... ... ...(b) Grants 42.7 37.8 15.4 1.1 -0.3 ... ... ... ...
Total 134.4 107.6 15.4 1.1 -0.3 ... ... ... ...(x) Sweden ... ... ... ...
(a) Loans ... 91.8 ... ... ... ... ... ... ...(b) Grants 66.9 19.1 ... ... ... ... ... ... ...
Total 66.9 110.9 ... ... ... ... ... ... ...(xi) U.K.
(a) Loans 1.9 ... ... ... ... ... ... ... ...(b) Grants 246.8 101.3 67.4 305.8 398.5 338.5 379.0 376.8 260.4
Total 248.7 101.3 67.4 305.8 398.5 338.5 379.0 376.8 260.4(xii) U.S.A.
(a) Loans 104.2 19.2 ... ... ... ... ... ... ...(b) Grants ... 12.5 17.8 10.3 16.0 11.3 3.1 6.8 10.4
Total 104.2 31.7 17.8 10.3 16.0 11.3 3.1 6.8 10.4(xiii) I.B.R.D.
(a) Loans 175.5 1217.5 706.8 1034.4 1094.2 807.0 1658.6 3255.9 599.3(b) Grants ... ... 5.4 3.5 5.8 1.1 2.6 5.4 3.8
Total 175.5 1217.5 712.2 1038.0 1100.0 808.1 1661.2 3261.3 603.1(xiv) I.D.A.
(a) Loans 660.1 773.9 1063.4 995.5 813.1 1022.4 1235.6 1091.7 1227.7(b) Grants 24.0 ... 3.2 3.5 2.2 2.4 1.3 0.9 1.0
Total 684.1 773.9 1065.6 998.9 815.3 1024.8 1236.9 1092.6 1228.7(xv) IFAD (International Fund for
Agricultural Development)(a) Loans 9.2 4.7 8.8 26.0 17.0 7.6 14.3 22.2 23.0(b) Grants ... ... ... ... 7.5 2.1 3.1 0.1 1.0
Total 9.2 4.7 8.8 26.0 24.5 9.7 17.4 22.3 24.0(xvi) IMF Trust Fund 679.7 ... ... ... ... ... ... ... ...
http://indiabudget.nic.in
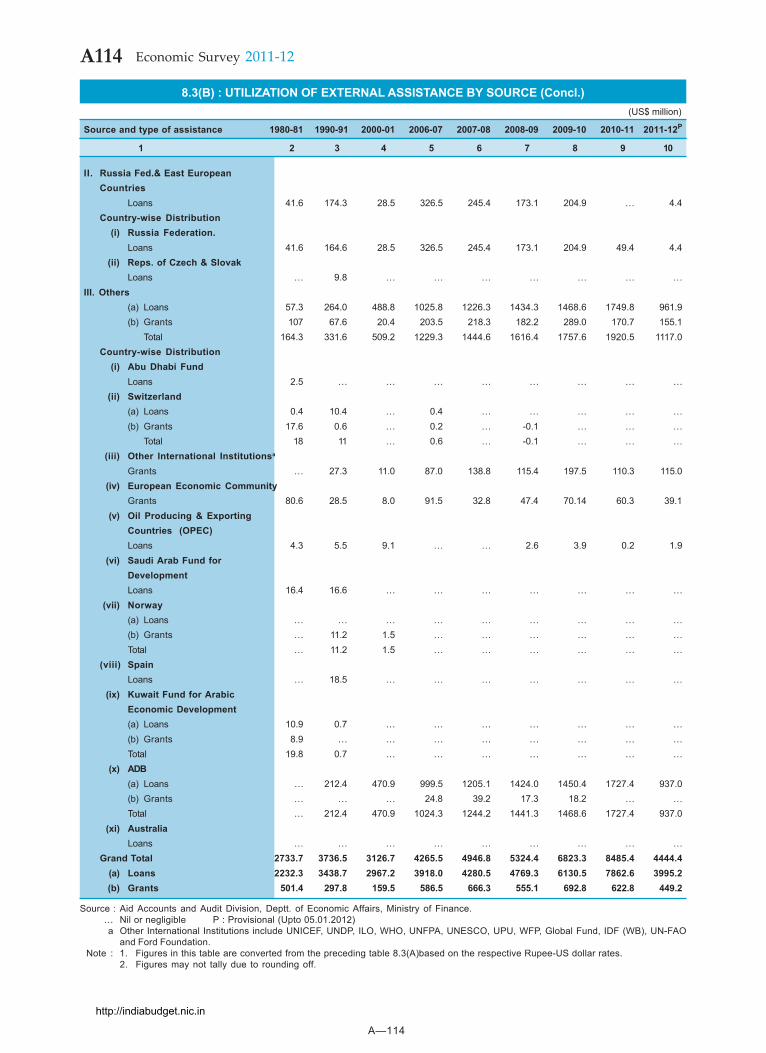
A—114
A114 Economic Survey 2011-12
8.3(B) : UTILIZATION OF EXTERNAL ASSISTANCE BY SOURCE (Concl.)(US$ million)
Source and type of assistance 1980-81 1990-91 2000-01 2006-07 2007-08 2008-09 2009-10 2010-11 2011-12P
1 2 3 4 5 6 7 8 9 10
II. Russia Fed.& East EuropeanCountries
Loans 41.6 174.3 28.5 326.5 245.4 173.1 204.9 ... 4.4Country-wise Distribution
(i) Russia Federation.Loans 41.6 164.6 28.5 326.5 245.4 173.1 204.9 49.4 4.4
(ii) Reps. of Czech & SlovakLoans ... 9.8 ... ... ... ... ... ... ...
III. Others(a) Loans 57.3 264.0 488.8 1025.8 1226.3 1434.3 1468.6 1749.8 961.9(b) Grants 107 67.6 20.4 203.5 218.3 182.2 289.0 170.7 155.1
Total 164.3 331.6 509.2 1229.3 1444.6 1616.4 1757.6 1920.5 1117.0Country-wise Distribution
(i) Abu Dhabi FundLoans 2.5 ... ... ... ... ... ... ... ...
(ii) Switzerland(a) Loans 0.4 10.4 ... 0.4 ... ... ... ... ...(b) Grants 17.6 0.6 ... 0.2 ... -0.1 ... ... ...
Total 18 11 ... 0.6 ... -0.1 ... ... ...(iii) Other International Institutionsa
Grants ... 27.3 11.0 87.0 138.8 115.4 197.5 110.3 115.0(iv) European Economic Community
Grants 80.6 28.5 8.0 91.5 32.8 47.4 70.14 60.3 39.1(v) Oil Producing & Exporting
Countries (OPEC)Loans 4.3 5.5 9.1 ... ... 2.6 3.9 0.2 1.9
(vi) Saudi Arab Fund forDevelopmentLoans 16.4 16.6 ... ... ... ... ... ... ...
(vii) Norway(a) Loans ... ... ... ... ... ... ... ... ...(b) Grants ... 11.2 1.5 ... ... ... ... ... ...Total ... 11.2 1.5 ... ... ... ... ... ...
(viii) SpainLoans ... 18.5 ... ... ... ... ... ... ...
(ix) Kuwait Fund for ArabicEconomic Development(a) Loans 10.9 0.7 ... ... ... ... ... ... ...(b) Grants 8.9 ... ... ... ... ... ... ... ...Total 19.8 0.7 ... ... ... ... ... ... ...
(x) ADB(a) Loans ... 212.4 470.9 999.5 1205.1 1424.0 1450.4 1727.4 937.0(b) Grants ... ... ... 24.8 39.2 17.3 18.2 ... ...Total ... 212.4 470.9 1024.3 1244.2 1441.3 1468.6 1727.4 937.0
(xi) AustraliaLoans ... ... ... ... ... ... ... ... ...
Grand Total 2733.7 3736.5 3126.7 4265.5 4946.8 5324.4 6823.3 8485.4 4444.4(a) Loans 2232.3 3438.7 2967.2 3918.0 4280.5 4769.3 6130.5 7862.6 3995.2(b) Grants 501.4 297.8 159.5 586.5 666.3 555.1 692.8 622.8 449.2
Source : Aid Accounts and Audit Division, Deptt. of Economic Affairs, Ministry of Finance.... Nil or negligible P : Provisional (Upto 05.01.2012)a Other International Institutions include UNICEF, UNDP, ILO, WHO, UNFPA, UNESCO, UPU, WFP, Global Fund, IDF (WB), UN-FAO
and Ford Foundation.Note : 1. Figures in this table are converted from the preceding table 8.3(A)based on the respective Rupee-US dollar rates.
2. Figures may not tally due to rounding off.
http://indiabudget.nic.in
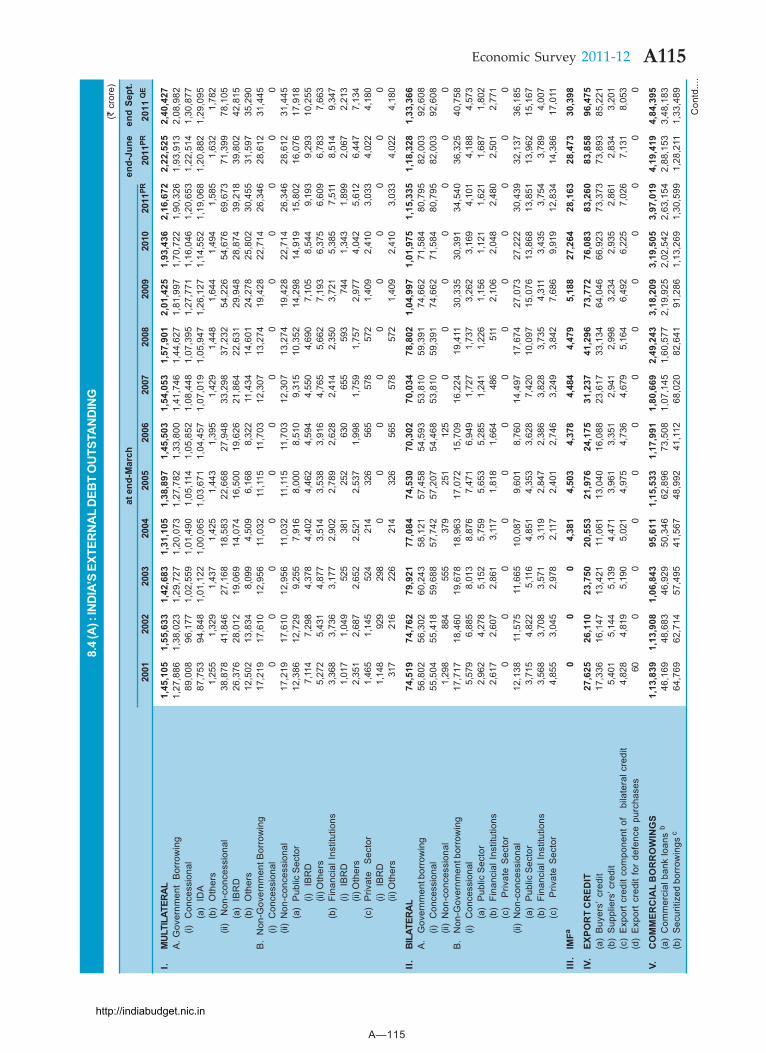
A—115
A115Economic Survey 2011-12
Co
ntd
....
8.4
(A) :
IND
IA’S
EXT
ERN
AL
DEB
T O
UTS
TAN
DIN
G(`
cro
re)
at e
nd-M
arch
end-
June
end
Sept
.
2001
2002
2003
2004
2005
2006
2007
2008
2009
2010
2011
PR20
11PR
2011
QE
I.M
ULTI
LATE
RAL
1,45
,105
1,55
,633
1,42
,683
1,31
,105
1,38
,897
1,45
,503
1,54
,053
1,57
,901
2,01
,425
1,93
,436
2,16
,672
2,22
,525
2,40
,427
A. G
over
nmen
t B
orro
win
g1,
27,8
861,
38,0
231,
29,7
271,
20,0
731,
27,7
821,
33,8
001,
41,7
461,
44,6
271,
81,9
971,
70,7
221,
90,3
261,
93,9
132,
08,9
82(i)
Con
cess
iona
l89
,008
96,1
771,
02,5
591,
01,4
901,
05,1
141,
05,8
521,
08,4
481,
07,3
951,
27,7
711,
16,0
461,
20,6
531,
22,5
141,
30,8
77(a
)ID
A87
,753
94,8
481,
01,1
221,
00,0
651,
03,6
711,
04,4
571,
07,0
191,
05,9
471,
26,1
271,
14,5
521,
19,0
681,
20,8
821,
29,0
95(b
)O
ther
s1,
255
1,32
91,
437
1,42
51,
443
1,39
51,
429
1,44
81,
644
1,49
41,
585
1,63
21,
782
(ii)
Non
-con
cess
iona
l38
,878
41,8
4627
,168
18,5
8322
,668
27,9
4833
,298
37,2
3254
,226
54,6
7669
,673
71,3
9978
,105
(a)
IBR
D26
,376
28,0
1219
,069
14,0
7416
,500
19,6
2621
,864
22,6
3129
,948
28,8
7439
,218
39,8
0242
,815
(b)
Oth
ers
12,5
0213
,834
8,09
94,
509
6,16
88,
322
11,4
3414
,601
24,2
7825
,802
30,4
5531
,597
35,2
90B
. N
on-G
over
nmen
t Bor
row
ing
17,2
1917
,610
12,9
5611
,032
11,1
1511
,703
12,3
0713
,274
19,4
2822
,714
26,3
4628
,612
31,4
45(i)
Con
cess
iona
l0
00
00
00
00
00
00
(ii)
Non
-con
cess
iona
l17
,219
17,6
1012
,956
11,0
3211
,115
11,7
0312
,307
13,2
7419
,428
22,7
1426
,346
28,6
1231
,445
(a)
Pub
lic S
ecto
r12
,386
12,7
299,
255
7,91
68,
000
8,51
09,
315
10,3
5214
,298
14,9
1915
,802
16,0
7617
,918
(i) IB
RD
7,11
47,
298
4,37
84,
402
4,46
24,
594
4,55
04,
690
7,10
58,
544
9,19
39,
293
10,2
55(ii
)Oth
ers
5,27
25,
431
4,87
73,
514
3,53
83,
916
4,76
55,
662
7,19
36,
375
6,60
96,
783
7,66
3(b
)Fi
nanc
ial I
nstit
utio
ns3,
368
3,73
63,
177
2,90
22,
789
2,62
82,
414
2,35
03,
721
5,38
57,
511
8,51
49,
347
(i) IB
RD
1,01
71,
049
525
381
252
630
655
593
744
1,34
31,
899
2,06
72,
213
(ii)O
ther
s2,
351
2,68
72,
652
2,52
12,
537
1,99
81,
759
1,75
72,
977
4,04
25,
612
6,44
77,
134
(c)
Priv
ate
Sec
tor
1,46
51,
145
524
214
326
565
578
572
1,40
92,
410
3,03
34,
022
4,18
0(i)
IBR
D1,
148
929
298
00
00
00
00
00
(ii)O
ther
s31
721
622
621
432
656
557
857
21,
409
2,41
03,
033
4,02
24,
180
II.BI
LATE
RAL
74,5
1974
,762
79,9
2177
,084
74,5
3070
,302
70,0
3478
,802
1,04
,997
1,01
,975
1,15
,335
1,18
,328
1,33
,366
A.
Gov
ernm
ent b
orro
win
g56
,802
56,3
0260
,243
58,1
2157
,458
54,5
9353
,810
59,3
9174
,662
71,5
8480
,795
82,0
0392
,608
(i)C
once
ssio
nal
55,5
0455
,418
59,6
8857
,742
57,2
0754
,468
53,8
1059
,391
74,6
6271
,584
80,7
9582
,003
92,6
08(ii
)N
on-c
once
ssio
nal
1,29
888
455
537
925
112
50
00
00
00
B.
Non
-Gov
ernm
ent b
orro
win
g17
,717
18,4
6019
,678
18,9
6317
,072
15,7
0916
,224
19,4
1130
,335
30,3
9134
,540
36,3
2540
,758
(i)C
once
ssio
nal
5,57
96,
885
8,01
38,
876
7,47
16,
949
1,72
71,
737
3,26
23,
169
4,10
14,
188
4,57
3(a
)P
ublic
Sec
tor
2,96
24,
278
5,15
25,
759
5,65
35,
285
1,24
11,
226
1,15
61,
121
1,62
11,
687
1,80
2(b
)Fi
nanc
ial I
nstit
utio
ns2,
617
2,60
72,
861
3,11
71,
818
1,66
448
651
12,
106
2,04
82,
480
2,50
12,
771
(c)
Priv
ate
Sec
tor
00
00
00
00
00
00
0(ii
)N
on-c
once
ssio
nal
12,1
3811
,575
11,6
6510
,087
9,60
18,
760
14,4
9717
,674
27,0
7327
,222
30,4
3932
,137
36,1
85(a
)P
ublic
Sec
tor
3,71
54,
822
5,11
64,
851
4,35
33,
628
7,42
010
,097
15,0
7613
,868
13,8
5113
,962
15,1
67(b
)Fi
nanc
ial I
nstit
utio
ns3,
568
3,70
83,
571
3,11
92,
847
2,38
63,
828
3,73
54,
311
3,43
53,
754
3,78
94,
007
(c)
Priv
ate
Sec
tor
4,85
53,
045
2,97
82,
117
2,40
12,
746
3,24
93,
842
7,68
69,
919
12,8
3414
,386
17,0
11
III.
IMFa
00
04,
381
4,50
34,
378
4,48
44,
479
5,18
827
,264
28,1
6328
,473
30,3
98
IV.
EXPO
RT
CR
EDIT
27,6
2526
,110
23,7
5020
,553
21,9
7624
,175
31,2
3741
,296
73,7
7276
,083
83,2
6083
,858
96,4
75(a
)B
uyer
s’ c
redi
t17
,336
16,1
4713
,421
11,0
6113
,040
16,0
8823
,617
33,1
3464
,046
66,9
2373
,373
73,8
9385
,221
(b)
Sup
plie
rs’ c
redi
t5,
401
5,14
45,
139
4,47
13,
961
3,35
12,
941
2,99
83,
234
2,93
52,
861
2,83
43,
201
(c)
Exp
ort c
redi
t com
pone
nt o
f b
ilate
ral c
redi
t4,
828
4,81
95,
190
5,02
14,
975
4,73
64,
679
5,16
46,
492
6,22
57,
026
7,13
18,
053
(d)
Exp
ort
cred
it fo
r de
fenc
e pu
rcha
ses
600
00
00
00
00
00
0
V.C
OM
MER
CIA
L B
OR
RO
WIN
GS
1,13
,839
1,13
,908
1,06
,843
95,6
111,
15,5
331,
17,9
911,
80,6
692,
49,2
433,
18,2
093,
19,5
053,
97,0
194,
19,4
194,
84,3
95(a
)C
omm
erci
al b
ank
loan
s b
46,1
6948
,683
46,9
2950
,346
62,8
9673
,508
1,07
,145
1,60
,577
2,19
,925
2,02
,542
2,63
,154
2,88
,153
3,48
,183
(b)
Sec
uriti
zed
borr
owin
gs c
64,7
6962
,714
57,4
9541
,567
48,9
9241
,112
68,0
2082
,641
91,2
861,
13,2
691,
30,5
991,
28,2
111,
33,4
89
http://indiabudget.nic.in
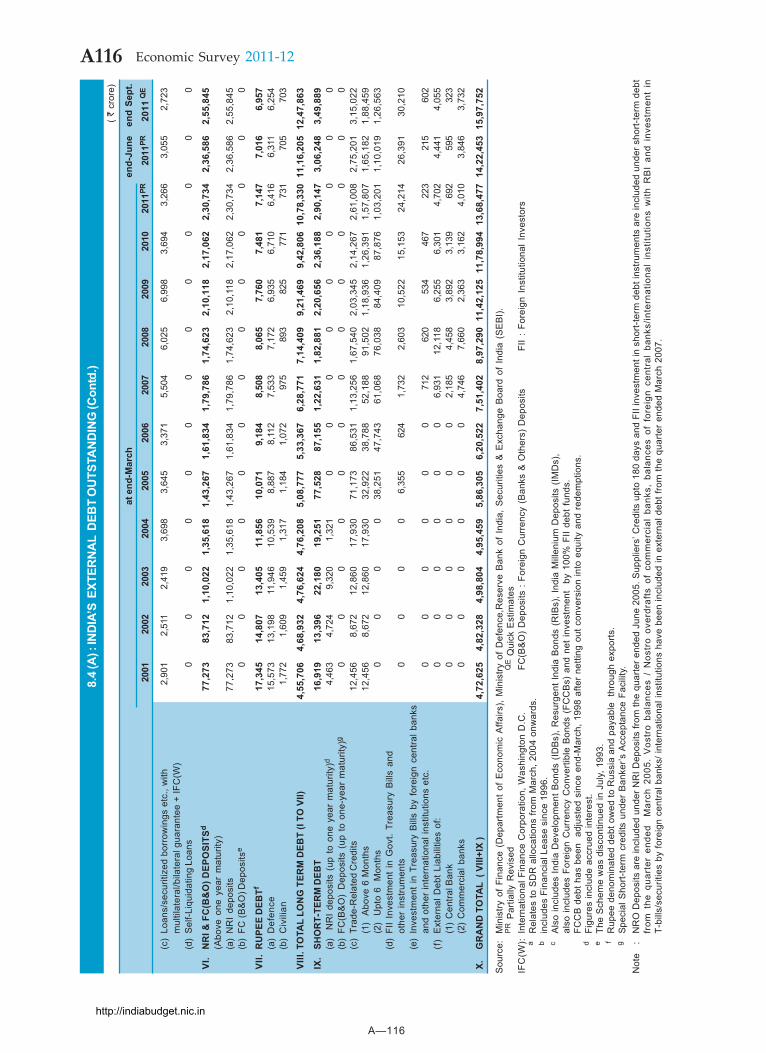
A—116
A116 Economic Survey 2011-12
8.4
(A) :
IND
IA’S
EXT
ERN
AL
DEB
T O
UTS
TAN
DIN
G (C
ontd
.)(
` cr
ore)
at e
nd-M
arch
end-
June
end
Sept
.
2001
2002
2003
2004
2005
2006
2007
2008
2009
2010
2011
PR20
11PR
2011
QE
(c)
Loan
s/se
curit
ized
bor
row
ings
etc
., w
ith2,
901
2,51
12,
419
3,69
83,
645
3,37
15,
504
6,02
56,
998
3,69
43,
266
3,05
52,
723
mul
tilat
eral
/bila
tera
l gua
rant
ee +
IFC
(W)
(d)
Sel
f-Liq
uida
ting
Loan
s0
00
00
00
00
00
00
VI.
NR
I & F
C(B
&O
) DEP
OSI
TSd
77,2
7383
,712
1,10
,022
1,35
,618
1,43
,267
1,61
,834
1,79
,786
1,74
,623
2,10
,118
2,17
,062
2,30
,734
2,36
,586
2,55
,845
(Abo
ve o
ne y
ear
mat
urity
)(a
)N
RI
depo
sits
77,2
7383
,712
1,10
,022
1,35
,618
1,43
,267
1,61
,834
1,79
,786
1,74
,623
2,10
,118
2,17
,062
2,30
,734
2,36
,586
2,55
,845
(b)
FC (B
&O
)Dep
osits
e0
00
00
00
00
00
00
VII.
RU
PEE
DEB
Tf17
,345
14,8
0713
,405
11,8
5610
,071
9,18
48,
508
8,06
57,
760
7,48
17,
147
7,01
66,
957
(a)
Def
ence
15,5
7313
,198
11,9
4610
,539
8,88
78,
112
7,53
37,
172
6,93
56,
710
6,41
66,
311
6,25
4(b
)C
ivili
an1,
772
1,60
91,
459
1,31
71,
184
1,07
297
589
382
577
173
170
570
3
VIII
.TO
TAL
LON
G T
ERM
DEB
T (I
TO V
II)4,
55,7
064,
68,9
324,
76,6
244,
76,2
085,
08,7
775,
33,3
676,
28,7
717,
14,4
099,
21,4
699,
42,8
0610
,78,
330
11,1
6,20
512
,47,
863
IX.
SHO
RT-
TER
M D
EBT
16,9
1913
,396
22,1
8019
,251
77,5
2887
,155
1,22
,631
1,82
,881
2,20
,656
2,36
,188
2,90
,147
3,06
,248
3,49
,889
(a)
NR
I de
posi
ts (
up t
o on
e ye
ar m
atur
ity)d
4,46
34,
724
9,32
01,
321
00
00
00
00
0(b
)FC
(B&
O)
Dep
osits
(up
to
one-
year
mat
urity
)g0
00
00
00
00
00
00
(c)
Trad
e-R
elat
ed C
redi
ts12
,456
8,67
212
,860
17,9
3071
,173
86,5
311,
13,2
561,
67,5
402,
03,3
452,
14,2
672,
61,0
082,
75,2
013,
15,0
22(1
) A
bove
6 M
onth
s12
,456
8,67
212
,860
17,9
3032
,922
38,7
8852
,188
91,5
02 1
,18,
936
1,26
,391
1,57
,807
1,65
,182
1,88
,459
(2)
Upt
o 6
Mon
ths
00
00
38,2
5147
,743
61,0
6876
,038
8
4,40
987
,876
1,03
,201
1,10
,019
1,26
,563
(d)
FII
Inve
stm
ent
in G
ovt.
Trea
sury
Bill
s an
dot
her
inst
rum
ents
00
00
6,35
562
41,
732
2,60
310
,522
15,1
5324
,214
26,3
9130
,210
(e)
Inve
stm
ent
in T
reas
ury
Bill
s by
for
eign
cen
tral b
anks
and
othe
r in
tern
atio
nal i
nstit
utio
ns e
tc.
00
00
00
712
620
534
467
223
215
602
(f)
Ext
erna
l Deb
t Lia
bilit
ies
of:
00
00
00
6,93
112
,118
6,25
56,
301
4,70
24,
441
4,05
5(1
)C
entra
l Ban
k0
00
00
02,
185
4,45
83,
892
3,13
969
259
532
3(2
)C
omm
erci
al b
anks
00
00
00
4,74
67,
660
2,36
33,
162
4,01
03,
846
3,73
2
X.G
RA
ND
TO
TAL
( VI
II+IX
)4,
72,6
254,
82,3
284,
98,8
044,
95,4
595,
86,3
056,
20,5
227,
51,4
028,
97,2
9011
,42,
125
11,7
8,99
413
,68,
477
14,2
2,45
315
,97,
752
Sou
rce:
Min
istry
of
Fina
nce
(Dep
artm
ent
of E
cono
mic
Affa
irs),
Min
istry
of
Def
ence
,Res
erve
Ban
k of
Ind
ia,
Sec
uriti
es &
Exc
hang
e B
oard
of
Indi
a (S
EB
I).P
R P
artia
lly R
evis
edQ
E Q
uick
Est
imat
esIF
C(W
):In
tern
atio
nal F
inan
ce C
orpo
ratio
n, W
ashi
ngto
n D
.C.
FC(B
&O
) D
epos
its :
Fore
ign
Cur
renc
y (B
anks
& O
ther
s) D
epos
itsFI
I :
Fore
ign
Inst
itutio
nal I
nves
tors
aR
elat
es to
SD
R a
lloca
tions
from
Mar
ch, 2
004
onw
ards
.b
incl
udes
Fin
anci
al L
ease
sin
ce 1
996.
cA
lso
incl
udes
Indi
a D
evel
opm
ent B
onds
(ID
Bs)
, Res
urge
nt In
dia
Bon
ds (
RIB
s), I
ndia
Mill
eniu
m D
epos
its (
IMD
s),
also
incl
udes
For
eign
Cur
renc
y C
onve
rtibl
e B
onds
(FC
CB
s) a
nd n
et in
vest
men
t by
100
% F
II de
bt fu
nds.
FCC
B d
ebt h
as b
een
adj
uste
d si
nce
end-
Mar
ch, 1
998
afte
r ne
tting
out
con
vers
ion
into
equ
ity a
nd r
edem
ptio
ns.
dFi
gure
s in
clud
e ac
crue
d in
tere
st.
eTh
e S
chem
e w
as d
isco
ntin
ued
in J
uly,
199
3.f
Rup
ee d
enom
inat
ed d
ebt o
wed
to R
ussi
a an
d pa
yabl
e th
roug
h ex
ports
.g
Spec
ial S
hort-
term
cre
dits
und
er B
anke
r’s A
ccep
tanc
e Fa
cilit
y.N
ote
:N
RO
Dep
osits
are
incl
uded
und
er N
RI D
epos
its fr
om th
e qu
arte
r end
ed J
une
2005
. Sup
plie
rs’ C
redi
ts u
pto
180
days
and
FII
inve
stm
ent i
n sh
ort-t
erm
deb
t ins
trum
ents
are
incl
uded
und
er s
hort-
term
deb
tfr
om t
he q
uart
er e
nded
M
arch
200
5. V
ostr
o ba
lanc
es /
Nos
tro
over
draf
ts o
f co
mm
erci
al b
anks
, ba
lanc
es o
f fo
reig
n ce
ntra
l ba
nks/
inte
rnat
iona
l in
stitu
tions
with
RB
I an
d in
vest
men
t in
T-bi
lls/s
ecur
ities
by
fore
ign
cent
ral b
anks
/ int
erna
tiona
l ins
titut
ions
hav
e be
en in
clud
ed in
ext
erna
l deb
t fro
m th
e qu
arte
r en
ded
Mar
ch 2
007.
http://indiabudget.nic.in
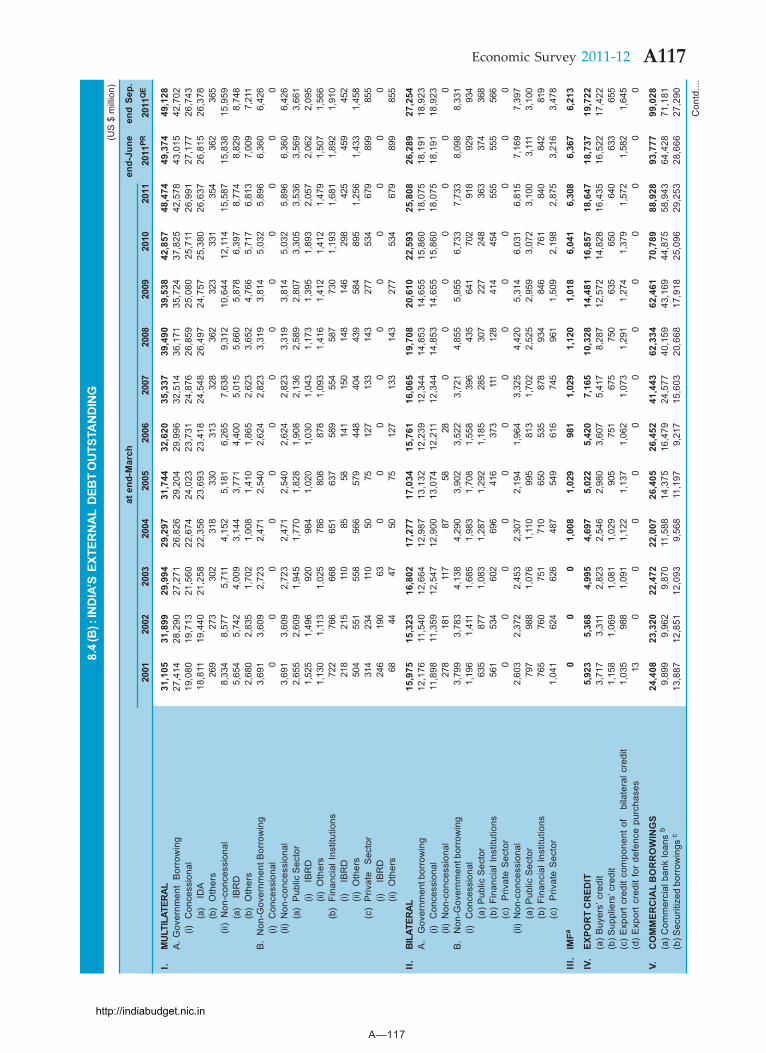
A—117
A117Economic Survey 2011-12
Co
ntd
....
8.4
(B) :
IND
IA’S
EXT
ERN
AL
DEB
T O
UTS
TAN
DIN
G(U
S $
mill
ion)
at e
nd-M
arch
end-
June
end
Sep.
2001
2002
2003
2004
2005
2006
2007
2008
2009
2010
2011
2011
PR20
11Q
E
I.M
ULT
ILAT
ERAL
31,1
0531
,899
29,9
9429
,297
31,7
4432
,620
35,3
3739
,490
39,5
3842
,857
48,4
7449
,374
49,1
28A
. Gov
ernm
ent
Bor
row
ing
27,4
1428
,290
27,2
7126
,826
29,2
0429
,996
32,5
1436
,171
35,7
2437
,825
42,5
7843
,015
42,7
02(i)
Con
cess
iona
l19
,080
19,7
1321
,560
22,6
7424
,023
23,7
3124
,876
26,8
5925
,080
25,7
1126
,991
27,1
7726
,743
(a)
IDA
18,8
1119
,440
21,2
5822
,356
23,6
9323
,418
24,5
4826
,497
24,7
5725
,380
26,6
3726
,815
26,3
78(b
)O
ther
s26
927
330
231
833
031
332
836
232
333
135
436
236
5(ii
) N
on-c
once
ssio
nal
8,33
48,
577
5,71
14,
152
5,18
16,
265
7,63
89,
312
10,6
4412
,114
15,5
8715
,838
15,9
59(a
) IB
RD
5,65
45,
742
4,00
93,
144
3,77
14,
400
5,01
55,
660
5,87
86,
397
8,77
48,
829
8,74
8(b
)O
ther
s2,
680
2,83
51,
702
1,00
81,
410
1,86
52,
623
3,65
24,
766
5,71
76,
813
7,00
97,
211
B.
Non
-Gov
ernm
ent B
orro
win
g3,
691
3,60
92,
723
2,47
12,
540
2,62
42,
823
3,31
93,
814
5,03
25,
896
6,36
06,
426
(i)C
once
ssio
nal
00
00
00
00
00
00
0(ii
)N
on-c
once
ssio
nal
3,69
13,
609
2,72
32,
471
2,54
02,
624
2,82
33,
319
3,81
45,
032
5,89
66,
360
6,42
6(a
)P
ublic
Sec
tor
2,65
52,
609
1,94
51,
770
1,82
81,
908
2,13
62,
589
2,80
73,
305
3,53
63,
569
3,66
1(i)
IB
RD
1,52
51,
496
920
984
1,02
01,
030
1,04
31,
173
1,39
51,
893
2,05
72,
062
2,09
5(ii
) O
ther
s1,
130
1,11
31,
025
786
808
878
1,09
31,
416
1,41
21,
412
1,47
91,
507
1,56
6(b
)Fi
nanc
ial I
nstit
utio
ns72
276
666
865
163
758
955
458
773
01,
193
1,68
11,
892
1,91
0(i)
IB
RD
218
215
110
8558
141
150
148
146
298
425
459
452
(ii)
Oth
ers
504
551
558
566
579
448
404
439
584
895
1,25
61,
433
1,45
8(c
)P
rivat
e S
ecto
r31
423
411
050
7512
713
314
327
753
467
989
985
5(i)
IB
RD
246
190
630
00
00
00
00
0(ii
) O
ther
s68
4447
5075
127
133
143
277
534
679
899
855
II.BI
LATE
RAL
15,9
7515
,323
16,8
0217
,277
17,0
3415
,761
16,0
6519
,708
20,6
1022
,593
25,8
0826
,289
27,2
54A
.G
over
nmen
t bor
row
ing
12,1
7611
,540
12,6
6412
,987
13,1
3212
,239
12,3
4414
,853
14,6
5515
,860
18,0
7518
,191
18,9
23(i)
Con
cess
iona
l11
,898
11,3
5912
,547
12,9
0013
,074
12,2
1112
,344
14,8
5314
,655
15,8
6018
,075
18,1
9118
,923
(ii)
Non
-con
cess
iona
l27
818
111
787
5828
00
00
00
0B
.N
on-G
over
nmen
t bor
row
ing
3,79
93,
783
4,13
84,
290
3,90
23,
522
3,72
14,
855
5,95
56,
733
7,73
38,
098
8,33
1(i)
Con
cess
iona
l1,
196
1,41
11,
685
1,98
31,
708
1,55
839
643
564
170
291
892
993
4(a
) Pub
lic S
ecto
r63
587
71,
083
1,28
71,
292
1,18
528
530
722
724
836
337
436
8(b
) Fi
nanc
ial I
nstit
utio
ns56
153
460
269
641
637
311
112
841
445
455
555
556
6(c
) P
rivat
e S
ecto
r0
00
00
00
00
00
00
(ii)
Non
-con
cess
iona
l2,
603
2,37
22,
453
2,30
72,
194
1,96
43,
325
4,42
05,
314
6,03
16,
815
7,16
97,
397
(a) P
ublic
Sec
tor
797
988
1,07
61,
110
995
813
1,70
22,
525
2,95
93,
072
3,10
03,
111
3,10
0(b
) Fi
nanc
ial I
nstit
utio
ns76
576
075
171
065
053
587
893
484
676
184
084
281
9(c
) P
rivat
e S
ecto
r1,
041
624
626
487
549
616
745
961
1,50
92,
198
2,87
53,
216
3,47
8
III.
IMFa
00
01,
008
1,02
998
11,
029
1,12
01,
018
6,04
16,
308
6,36
76,
213
IV.
EXPO
RT
CR
EDIT
5,92
35,
368
4,99
54,
697
5,02
25,
420
7,16
510
,328
14,4
8116
,857
18,6
4718
,737
19,7
22(a
) B
uyer
s’ c
redi
t3,
717
3,31
12,
823
2,54
62,
980
3,60
75,
417
8,28
712
,572
14,8
2816
,435
16,5
2217
,422
(b) S
uppl
iers
’ cre
dit
1,15
81,
069
1,08
11,
029
905
751
675
750
635
650
640
633
655
(c)
Exp
ort c
redi
t com
pone
nt o
f b
ilate
ral c
redi
t1,
035
988
1,09
11,
122
1,13
71,
062
1,07
31,
291
1,27
41,
379
1,57
21,
582
1,64
5(d
) E
xpor
t cre
dit f
or d
efen
ce p
urch
ases
130
00
00
00
00
00
0
V.C
OM
MER
CIA
L B
OR
RO
WIN
GS
24,4
0823
,320
22,4
7222
,007
26,4
0526
,452
41,4
4362
,334
62,4
6170
,789
88,9
2893
,777
99,0
28(a
) Com
mer
cial
ban
k lo
ans
b9,
899
9,96
29,
870
11,5
8814
,375
16,4
7924
,577
40,1
5943
,169
44,8
7558
,943
64,4
2871
,181
(b) S
ecur
itize
d bo
rrow
ings
c13
,887
12,8
5112
,093
9,56
811
,197
9,21
715
,603
20,6
6817
,918
25,0
9629
,253
28,6
6627
,290
http://indiabudget.nic.in
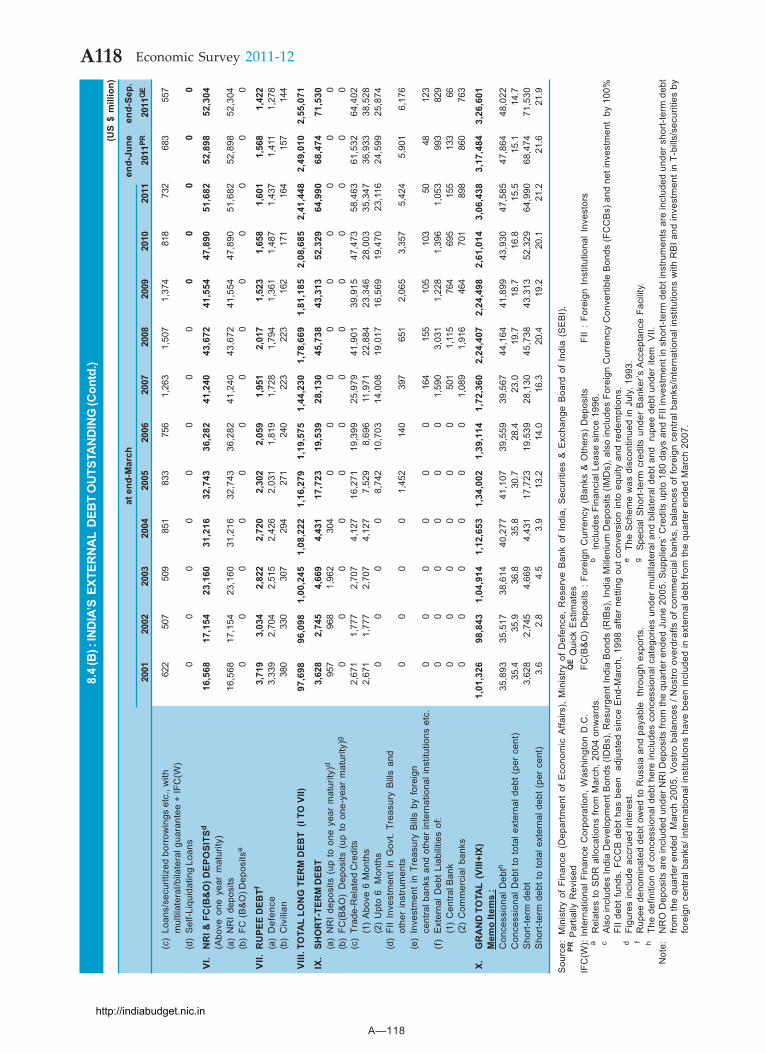
A—118
A118 Economic Survey 2011-12
8.4
(B) :
IND
IA’S
EXT
ERN
AL
DEB
T O
UTS
TAN
DIN
G (C
ontd
.)(U
S $
mill
ion)
at e
nd-M
arch
end-
June
end-
Sep.
2001
2002
2003
2004
2005
2006
2007
2008
2009
2010
2011
2011
PR20
11Q
E
(c)
Loan
s/se
curit
ized
bor
row
ings
etc
., w
ith62
250
750
985
183
375
61,
263
1,50
71,
374
818
732
683
557
mul
tilat
eral
/bila
tera
l gua
rant
ee +
IFC
(W)
(d)
Sel
f-Liq
uida
ting
Loan
s0
00
00
00
00
00
00
VI.
NR
I & F
C(B
&O
) DEP
OSI
TSd
16,5
6817
,154
23,1
6031
,216
32,7
4336
,282
41,2
4043
,672
41,5
5447
,890
51,6
8252
,898
52,3
04(A
bove
one
yea
r m
atur
ity)
(a)
NR
I de
posi
ts16
,568
17,1
5423
,160
31,2
1632
,743
36,2
8241
,240
43,6
7241
,554
47,8
9051
,682
52,8
9852
,304
(b)
FC (B
&O
)Dep
osits
e0
00
00
00
00
00
00
VII.
RU
PEE
DEB
Tf3,
719
3,03
42,
822
2,72
02,
302
2,05
91,
951
2,01
71,
523
1,65
81,
601
1,56
81,
422
(a)
Def
ence
3,33
92,
704
2,51
52,
426
2,03
11,
819
1,72
81,
794
1,36
11,
487
1,43
71,
411
1,27
8(b
)C
ivili
an38
033
030
729
427
124
022
322
316
217
116
415
714
4
VIII
.TO
TAL
LON
G T
ERM
DEB
T (I
TO
VII)
97,6
9896
,098
1,00
,245
1,08
,222
1,16
,279
1,19
,575
1,44
,230
1,78
,669
1,81
,185
2,08
,685
2,41
,448
2,49
,010
2,55
,071
IX.
SHO
RT-
TER
M D
EBT
3,62
82,
745
4,66
94,
431
17,7
2319
,539
28,1
3045
,738
43,3
1352
,329
64,9
9068
,474
71,5
30(a
)N
RI d
epos
its (
up to
one
yea
r m
atur
ity)d
957
968
1,96
230
40
00
00
00
00
(b)
FC(B
&O
)D
epos
its (
up t
o on
e-ye
ar m
atur
ity)g
00
00
00
00
00
00
0(c
)Tr
ade-
Rel
ated
Cre
dits
2,67
11,
777
2,70
74,
127
16,2
7119
,399
25,9
7941
,901
39,9
1547
,473
58,4
6361
,532
64,4
02(1
)A
bove
6 M
onth
s2,
671
1,77
72,
707
4,12
77,
529
8,69
611
,971
22,8
8423
,346
28,0
0335
,347
36,9
3338
,528
(2)
Upt
o 6
Mon
ths
00
00
8,74
210
,703
14,0
0819
,017
16,5
6919
,470
23,1
1624
,599
25,8
74(d
)FI
I In
vest
men
t in
Gov
t. Tr
easu
ry B
ills
and
othe
r in
stru
men
ts0
00
01,
452
140
397
651
2,06
53,
357
5,42
45,
901
6,17
6(e
)In
vest
men
t in
Tre
asur
y B
ills
by f
orei
gnce
ntra
l ban
ks a
nd o
ther
inte
rnat
iona
l ins
titut
ions
etc
.0
00
00
016
415
510
510
350
4812
3(f
)E
xter
nal D
ebt L
iabi
litie
s of
:0
00
00
01,
590
3,03
11,
228
1,39
61,
053
993
829
(1)
Cen
tral B
ank
00
00
00
501
1,11
576
469
515
513
366
(2)
Com
mer
cial
ban
ks0
00
00
01,
089
1,91
646
470
189
886
076
3
X.G
RA
ND
TO
TAL
(VIII
+IX)
1,01
,326
98,8
431,
04,9
141,
12,6
531,
34,0
021,
39,1
141,
72,3
602,
24,4
072,
24,4
982,
61,0
143,
06,4
383,
17,4
843,
26,6
01M
emo
Item
s :
Con
cess
iona
l Deb
th35
,893
35,5
1738
,614
40,2
7741
,107
39,5
5939
,567
44,1
6441
,899
43,9
3047
,585
47,8
6448
,022
Con
cess
iona
l Deb
t to
tota
l ext
erna
l deb
t (pe
r ce
nt)
35.4
35.9
36.8
35.8
30.7
28.4
23.0
19.7
18.7
16.8
15.5
15.1
14.7
Sho
rt-te
rm d
ebt
3,62
82,
745
4,66
94,
431
17,7
2319
,539
28,1
3045
,738
43,3
1352
,329
64,9
9068
,474
71,5
30S
hort-
term
deb
t to
tota
l ext
erna
l deb
t (pe
r ce
nt)
3.6
2.8
4.5
3.9
13.2
14.0
16.3
20.4
19.2
20.1
21.2
21.6
21.9
Sou
rce:
Min
istry
of
Fina
nce
(Dep
artm
ent
of E
cono
mic
Affa
irs),
Min
istry
of
Def
ence
, R
eser
ve B
ank
of I
ndia
, S
ecur
ities
& E
xcha
nge
Boa
rd o
f In
dia
(SE
BI).
PR P
artia
lly R
evis
edQ
E Q
uick
Est
imat
esIF
C(W
): In
tern
atio
nal F
inan
ce C
orpo
ratio
n, W
ashi
ngto
n D
.C.
FC(B
&O
) D
epos
its :
Fore
ign
Cur
renc
y (B
anks
& O
ther
s) D
epos
itsFI
I :
Fore
ign
Inst
itutio
nal I
nves
tors
aR
elat
es to
SD
R a
lloca
tions
from
Mar
ch, 2
004
onw
ards
.b
in
clud
es F
inan
cial
Lea
se s
ince
199
6.c
Als
o in
clud
es In
dia
Dev
elop
men
t Bon
ds (I
DB
s), R
esur
gent
Indi
a B
onds
(RIB
s), I
ndia
Mill
eniu
m D
epos
its (I
MD
s), a
lso
incl
udes
For
eign
Cur
renc
y C
onve
rtibl
e B
onds
(FC
CB
s) a
nd n
et in
vest
men
t by
100
%FI
I deb
t fun
ds. F
CC
B d
ebt h
as b
een
adj
uste
d si
nce
End
-Mar
ch, 1
998
afte
r ne
tting
out
con
vers
ion
into
equ
ity a
nd r
edem
ptio
ns.
dFi
gure
s in
clud
e ac
crue
d in
tere
st.
eTh
e S
chem
e w
as d
isco
ntin
ued
in J
uly,
199
3.f
Rup
ee d
enom
inat
ed d
ebt o
wed
to R
ussi
a an
d pa
yabl
e th
roug
h ex
ports
.g
Spec
ial S
hort-
term
cre
dits
und
er B
anke
r’s A
ccep
tanc
e Fa
cilit
y.h
The
defin
ition
of c
once
ssio
nal d
ebt h
ere
incl
udes
con
cess
iona
l cat
egor
ies
unde
r mul
tilat
eral
and
bila
tera
l deb
t and
rup
ee d
ebt u
nder
item
VII.
Not
e:N
RO
Dep
osits
are
incl
uded
und
er N
RI D
epos
its fr
om th
e qu
arte
r end
ed J
une
2005
. Sup
plie
rs’ C
redi
ts u
pto
180
days
and
FII
inve
stm
ent i
n sh
ort-t
erm
deb
t ins
trum
ents
are
incl
uded
und
er s
hort-
term
deb
tfro
m th
e qu
arte
r end
ed M
arch
200
5. V
ostro
bal
ance
s / N
ostro
ove
rdra
fts o
f com
mer
cial
ban
ks, b
alan
ces
of fo
reig
n ce
ntra
l ban
ks/in
tern
atio
nal i
nstit
utio
ns w
ith R
BI a
nd in
vest
men
t in
T-bi
lls/s
ecur
ities
by
fore
ign
cent
ral b
anks
/ int
erna
tiona
l ins
titut
ions
hav
e be
en in
clud
ed in
ext
erna
l deb
t fro
m th
e qu
arte
r end
ed M
arch
200
7.
http://indiabudget.nic.in
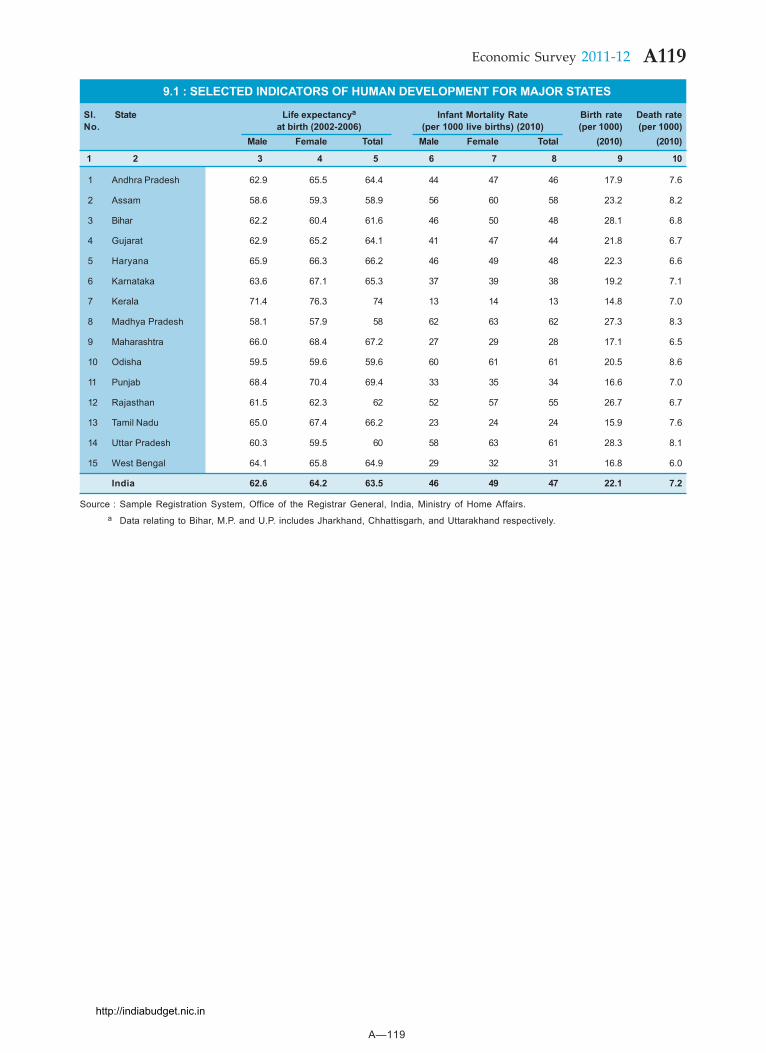
A—119
A119Economic Survey 2011-12
9.1 : SELECTED INDICATORS OF HUMAN DEVELOPMENT FOR MAJOR STATES
Sl. State Life expectancya Infant Mortality Rate Birth rate Death rateNo. at birth (2002-2006) (per 1000 live births) (2010) (per 1000) (per 1000)
Male Female Total Male Female Total (2010) (2010)
1 2 3 4 5 6 7 8 9 10
1 Andhra Pradesh 62.9 65.5 64.4 44 47 46 17.9 7.6
2 Assam 58.6 59.3 58.9 56 60 58 23.2 8.2
3 Bihar 62.2 60.4 61.6 46 50 48 28.1 6.8
4 Gujarat 62.9 65.2 64.1 41 47 44 21.8 6.7
5 Haryana 65.9 66.3 66.2 46 49 48 22.3 6.6
6 Karnataka 63.6 67.1 65.3 37 39 38 19.2 7.1
7 Kerala 71.4 76.3 74 13 14 13 14.8 7.0
8 Madhya Pradesh 58.1 57.9 58 62 63 62 27.3 8.3
9 Maharashtra 66.0 68.4 67.2 27 29 28 17.1 6.5
10 Odisha 59.5 59.6 59.6 60 61 61 20.5 8.6
11 Punjab 68.4 70.4 69.4 33 35 34 16.6 7.0
12 Rajasthan 61.5 62.3 62 52 57 55 26.7 6.7
13 Tamil Nadu 65.0 67.4 66.2 23 24 24 15.9 7.6
14 Uttar Pradesh 60.3 59.5 60 58 63 61 28.3 8.1
15 West Bengal 64.1 65.8 64.9 29 32 31 16.8 6.0
India 62.6 64.2 63.5 46 49 47 22.1 7.2
Source : Sample Registration System, Office of the Registrar General, India, Ministry of Home Affairs.a Data relating to Bihar, M.P. and U.P. includes Jharkhand, Chhattisgarh, and Uttarakhand respectively.
http://indiabudget.nic.in
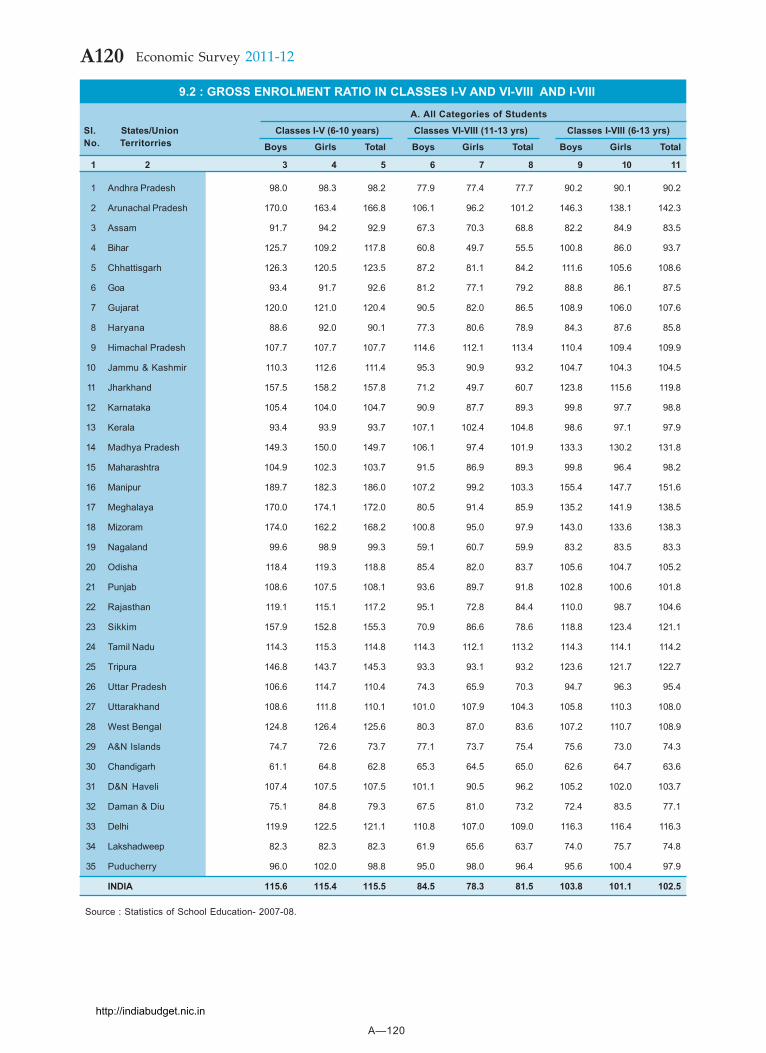
A—120
A120 Economic Survey 2011-12
9.2 : GROSS ENROLMENT RATIO IN CLASSES I-V AND VI-VIII AND I-VIII
A. All Categories of Students
Sl. States/Union Classes I-V (6-10 years) Classes VI-VIII (11-13 yrs) Classes I-VIII (6-13 yrs)No. Territorries Boys Girls Total Boys Girls Total Boys Girls Total
1 2 3 4 5 6 7 8 9 10 11
1 Andhra Pradesh 98.0 98.3 98.2 77.9 77.4 77.7 90.2 90.1 90.2
2 Arunachal Pradesh 170.0 163.4 166.8 106.1 96.2 101.2 146.3 138.1 142.3
3 Assam 91.7 94.2 92.9 67.3 70.3 68.8 82.2 84.9 83.5
4 Bihar 125.7 109.2 117.8 60.8 49.7 55.5 100.8 86.0 93.7
5 Chhattisgarh 126.3 120.5 123.5 87.2 81.1 84.2 111.6 105.6 108.6
6 Goa 93.4 91.7 92.6 81.2 77.1 79.2 88.8 86.1 87.5
7 Gujarat 120.0 121.0 120.4 90.5 82.0 86.5 108.9 106.0 107.6
8 Haryana 88.6 92.0 90.1 77.3 80.6 78.9 84.3 87.6 85.8
9 Himachal Pradesh 107.7 107.7 107.7 114.6 112.1 113.4 110.4 109.4 109.9
10 Jammu & Kashmir 110.3 112.6 111.4 95.3 90.9 93.2 104.7 104.3 104.5
11 Jharkhand 157.5 158.2 157.8 71.2 49.7 60.7 123.8 115.6 119.8
12 Karnataka 105.4 104.0 104.7 90.9 87.7 89.3 99.8 97.7 98.8
13 Kerala 93.4 93.9 93.7 107.1 102.4 104.8 98.6 97.1 97.9
14 Madhya Pradesh 149.3 150.0 149.7 106.1 97.4 101.9 133.3 130.2 131.8
15 Maharashtra 104.9 102.3 103.7 91.5 86.9 89.3 99.8 96.4 98.2
16 Manipur 189.7 182.3 186.0 107.2 99.2 103.3 155.4 147.7 151.6
17 Meghalaya 170.0 174.1 172.0 80.5 91.4 85.9 135.2 141.9 138.5
18 Mizoram 174.0 162.2 168.2 100.8 95.0 97.9 143.0 133.6 138.3
19 Nagaland 99.6 98.9 99.3 59.1 60.7 59.9 83.2 83.5 83.3
20 Odisha 118.4 119.3 118.8 85.4 82.0 83.7 105.6 104.7 105.2
21 Punjab 108.6 107.5 108.1 93.6 89.7 91.8 102.8 100.6 101.8
22 Rajasthan 119.1 115.1 117.2 95.1 72.8 84.4 110.0 98.7 104.6
23 Sikkim 157.9 152.8 155.3 70.9 86.6 78.6 118.8 123.4 121.1
24 Tamil Nadu 114.3 115.3 114.8 114.3 112.1 113.2 114.3 114.1 114.2
25 Tripura 146.8 143.7 145.3 93.3 93.1 93.2 123.6 121.7 122.7
26 Uttar Pradesh 106.6 114.7 110.4 74.3 65.9 70.3 94.7 96.3 95.4
27 Uttarakhand 108.6 111.8 110.1 101.0 107.9 104.3 105.8 110.3 108.0
28 West Bengal 124.8 126.4 125.6 80.3 87.0 83.6 107.2 110.7 108.9
29 A&N Islands 74.7 72.6 73.7 77.1 73.7 75.4 75.6 73.0 74.3
30 Chandigarh 61.1 64.8 62.8 65.3 64.5 65.0 62.6 64.7 63.6
31 D&N Haveli 107.4 107.5 107.5 101.1 90.5 96.2 105.2 102.0 103.7
32 Daman & Diu 75.1 84.8 79.3 67.5 81.0 73.2 72.4 83.5 77.1
33 Delhi 119.9 122.5 121.1 110.8 107.0 109.0 116.3 116.4 116.3
34 Lakshadweep 82.3 82.3 82.3 61.9 65.6 63.7 74.0 75.7 74.8
35 Puducherry 96.0 102.0 98.8 95.0 98.0 96.4 95.6 100.4 97.9
INDIA 115.6 115.4 115.5 84.5 78.3 81.5 103.8 101.1 102.5
Source : Statistics of School Education- 2007-08.
http://indiabudget.nic.in
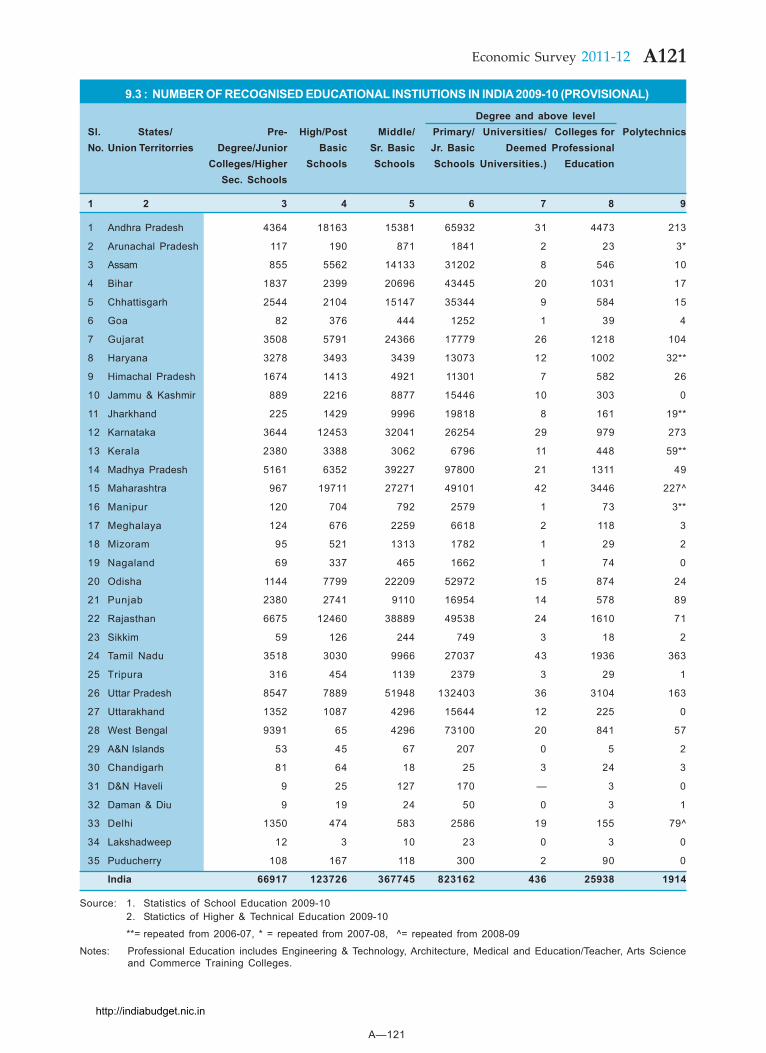
A—121
A121Economic Survey 2011-12
9.3 : NUMBER OF RECOGNISED EDUCATIONAL INSTIUTIONS IN INDIA 2009-10 (PROVISIONAL)
Degree and above levelSl. States/ Pre- High/Post Middle/ Primary/ Universities/ Colleges for PolytechnicsNo. Union Territorries Degree/Junior Basic Sr. Basic Jr. Basic Deemed Professional
Colleges/Higher Schools Schools Schools Universities.) EducationSec. Schools
1 2 3 4 5 6 7 8 9
1 Andhra Pradesh 4364 18163 15381 65932 31 4473 213
2 Arunachal Pradesh 117 190 871 1841 2 23 3*
3 Assam 855 5562 14133 31202 8 546 10
4 Bihar 1837 2399 20696 43445 20 1031 17
5 Chhattisgarh 2544 2104 15147 35344 9 584 15
6 Goa 82 376 444 1252 1 39 4
7 Gujarat 3508 5791 24366 17779 26 1218 104
8 Haryana 3278 3493 3439 13073 12 1002 32**
9 Himachal Pradesh 1674 1413 4921 11301 7 582 26
10 Jammu & Kashmir 889 2216 8877 15446 10 303 0
11 Jharkhand 225 1429 9996 19818 8 161 19**
12 Karnataka 3644 12453 32041 26254 29 979 273
13 Kerala 2380 3388 3062 6796 11 448 59**
14 Madhya Pradesh 5161 6352 39227 97800 21 1311 49
15 Maharashtra 967 19711 27271 49101 42 3446 227^
16 Manipur 120 704 792 2579 1 73 3**
17 Meghalaya 124 676 2259 6618 2 118 3
18 Mizoram 95 521 1313 1782 1 29 2
19 Nagaland 69 337 465 1662 1 74 0
20 Odisha 1144 7799 22209 52972 15 874 24
21 Punjab 2380 2741 9110 16954 14 578 89
22 Rajasthan 6675 12460 38889 49538 24 1610 71
23 Sikkim 59 126 244 749 3 18 2
24 Tamil Nadu 3518 3030 9966 27037 43 1936 363
25 Tripura 316 454 1139 2379 3 29 1
26 Uttar Pradesh 8547 7889 51948 132403 36 3104 163
27 Uttarakhand 1352 1087 4296 15644 12 225 0
28 West Bengal 9391 65 4296 73100 20 841 57
29 A&N Islands 53 45 67 207 0 5 2
30 Chandigarh 81 64 18 25 3 24 3
31 D&N Haveli 9 25 127 170 — 3 0
32 Daman & Diu 9 19 24 50 0 3 1
33 Delhi 1350 474 583 2586 19 155 79^
34 Lakshadweep 12 3 10 23 0 3 0
35 Puducherry 108 167 118 300 2 90 0
India 66917 123726 367745 823162 436 25938 1914
Source: 1. Statistics of School Education 2009-102. Statictics of Higher & Technical Education 2009-10
**= repeated from 2006-07, * = repeated from 2007-08, ^= repeated from 2008-09
Notes: Professional Education includes Engineering & Technology, Architecture, Medical and Education/Teacher, Arts Scienceand Commerce Training Colleges.
http://indiabudget.nic.in
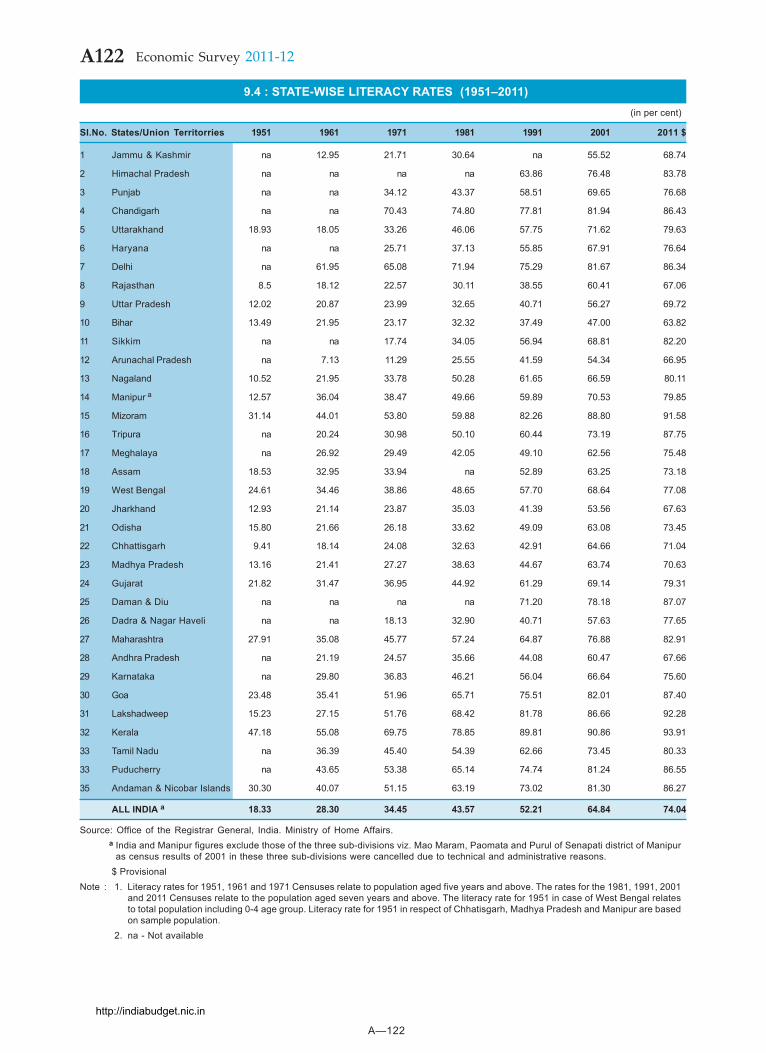
A—122
A122 Economic Survey 2011-12
9.4 : STATE-WISE LITERACY RATES (1951–2011)(in per cent)
Sl.No. States/Union Territorries 1951 1961 1971 1981 1991 2001 2011 $
1 Jammu & Kashmir na 12.95 21.71 30.64 na 55.52 68.74
2 Himachal Pradesh na na na na 63.86 76.48 83.78
3 Punjab na na 34.12 43.37 58.51 69.65 76.68
4 Chandigarh na na 70.43 74.80 77.81 81.94 86.43
5 Uttarakhand 18.93 18.05 33.26 46.06 57.75 71.62 79.63
6 Haryana na na 25.71 37.13 55.85 67.91 76.64
7 Delhi na 61.95 65.08 71.94 75.29 81.67 86.34
8 Rajasthan 8.5 18.12 22.57 30.11 38.55 60.41 67.06
9 Uttar Pradesh 12.02 20.87 23.99 32.65 40.71 56.27 69.72
10 Bihar 13.49 21.95 23.17 32.32 37.49 47.00 63.82
11 Sikkim na na 17.74 34.05 56.94 68.81 82.20
12 Arunachal Pradesh na 7.13 11.29 25.55 41.59 54.34 66.95
13 Nagaland 10.52 21.95 33.78 50.28 61.65 66.59 80.11
14 Manipur a 12.57 36.04 38.47 49.66 59.89 70.53 79.85
15 Mizoram 31.14 44.01 53.80 59.88 82.26 88.80 91.58
16 Tripura na 20.24 30.98 50.10 60.44 73.19 87.75
17 Meghalaya na 26.92 29.49 42.05 49.10 62.56 75.48
18 Assam 18.53 32.95 33.94 na 52.89 63.25 73.18
19 West Bengal 24.61 34.46 38.86 48.65 57.70 68.64 77.08
20 Jharkhand 12.93 21.14 23.87 35.03 41.39 53.56 67.63
21 Odisha 15.80 21.66 26.18 33.62 49.09 63.08 73.45
22 Chhattisgarh 9.41 18.14 24.08 32.63 42.91 64.66 71.04
23 Madhya Pradesh 13.16 21.41 27.27 38.63 44.67 63.74 70.63
24 Gujarat 21.82 31.47 36.95 44.92 61.29 69.14 79.31
25 Daman & Diu na na na na 71.20 78.18 87.07
26 Dadra & Nagar Haveli na na 18.13 32.90 40.71 57.63 77.65
27 Maharashtra 27.91 35.08 45.77 57.24 64.87 76.88 82.91
28 Andhra Pradesh na 21.19 24.57 35.66 44.08 60.47 67.66
29 Karnataka na 29.80 36.83 46.21 56.04 66.64 75.60
30 Goa 23.48 35.41 51.96 65.71 75.51 82.01 87.40
31 Lakshadweep 15.23 27.15 51.76 68.42 81.78 86.66 92.28
32 Kerala 47.18 55.08 69.75 78.85 89.81 90.86 93.91
33 Tamil Nadu na 36.39 45.40 54.39 62.66 73.45 80.33
33 Puducherry na 43.65 53.38 65.14 74.74 81.24 86.55
35 Andaman & Nicobar Islands 30.30 40.07 51.15 63.19 73.02 81.30 86.27
ALL INDIA a 18.33 28.30 34.45 43.57 52.21 64.84 74.04
Source: Office of the Registrar General, India. Ministry of Home Affairs.a India and Manipur figures exclude those of the three sub-divisions viz. Mao Maram, Paomata and Purul of Senapati district of Manipur
as census results of 2001 in these three sub-divisions were cancelled due to technical and administrative reasons.$ Provisional
Note : 1. Literacy rates for 1951, 1961 and 1971 Censuses relate to population aged five years and above. The rates for the 1981, 1991, 2001and 2011 Censuses relate to the population aged seven years and above. The literacy rate for 1951 in case of West Bengal relatesto total population including 0-4 age group. Literacy rate for 1951 in respect of Chhatisgarh, Madhya Pradesh and Manipur are basedon sample population.
2. na - Not available
http://indiabudget.nic.in
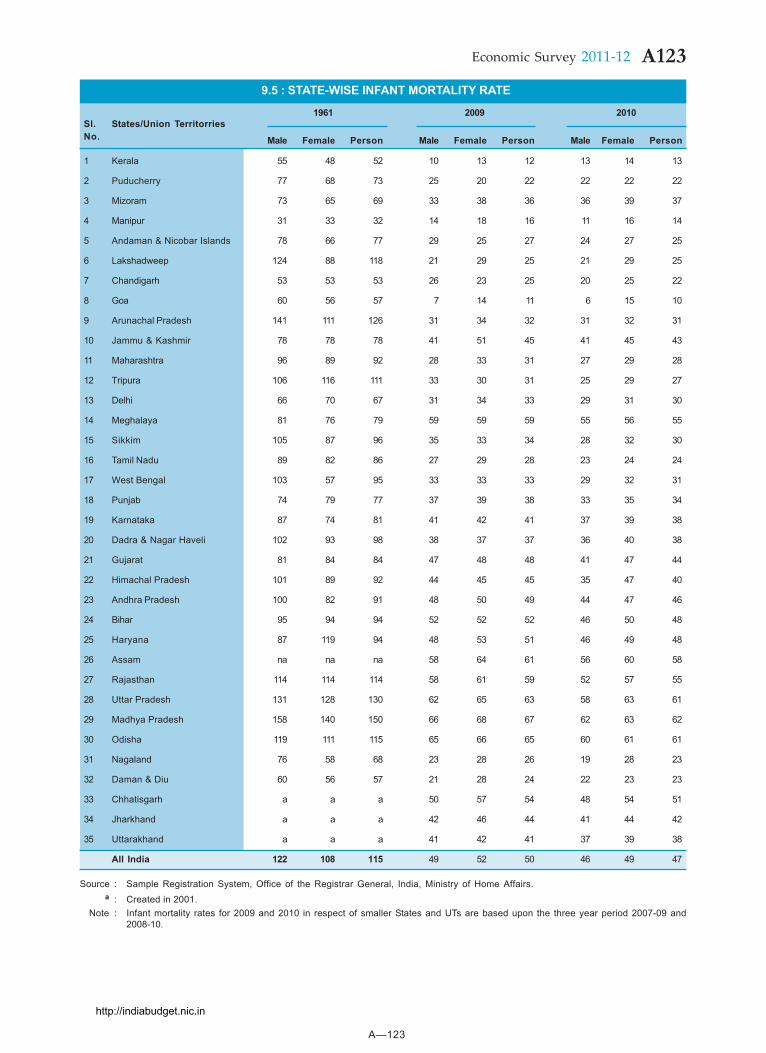
A—123
A123Economic Survey 2011-12
9.5 : STATE-WISE INFANT MORTALITY RATE
1961 2009 2010Sl. States/Union TerritorriesNo. Male Female Person Male Female Person Male Female Person
1 Kerala 55 48 52 10 13 12 13 14 13
2 Puducherry 77 68 73 25 20 22 22 22 22
3 Mizoram 73 65 69 33 38 36 36 39 37
4 Manipur 31 33 32 14 18 16 11 16 14
5 Andaman & Nicobar Islands 78 66 77 29 25 27 24 27 25
6 Lakshadweep 124 88 118 21 29 25 21 29 25
7 Chandigarh 53 53 53 26 23 25 20 25 22
8 Goa 60 56 57 7 14 11 6 15 10
9 Arunachal Pradesh 141 111 126 31 34 32 31 32 31
10 Jammu & Kashmir 78 78 78 41 51 45 41 45 43
11 Maharashtra 96 89 92 28 33 31 27 29 28
12 Tripura 106 116 111 33 30 31 25 29 27
13 Delhi 66 70 67 31 34 33 29 31 30
14 Meghalaya 81 76 79 59 59 59 55 56 55
15 Sikkim 105 87 96 35 33 34 28 32 30
16 Tamil Nadu 89 82 86 27 29 28 23 24 24
17 West Bengal 103 57 95 33 33 33 29 32 31
18 Punjab 74 79 77 37 39 38 33 35 34
19 Karnataka 87 74 81 41 42 41 37 39 38
20 Dadra & Nagar Haveli 102 93 98 38 37 37 36 40 38
21 Gujarat 81 84 84 47 48 48 41 47 44
22 Himachal Pradesh 101 89 92 44 45 45 35 47 40
23 Andhra Pradesh 100 82 91 48 50 49 44 47 46
24 Bihar 95 94 94 52 52 52 46 50 48
25 Haryana 87 119 94 48 53 51 46 49 48
26 Assam na na na 58 64 61 56 60 58
27 Rajasthan 114 114 114 58 61 59 52 57 55
28 Uttar Pradesh 131 128 130 62 65 63 58 63 61
29 Madhya Pradesh 158 140 150 66 68 67 62 63 62
30 Odisha 119 111 115 65 66 65 60 61 61
31 Nagaland 76 58 68 23 28 26 19 28 23
32 Daman & Diu 60 56 57 21 28 24 22 23 23
33 Chhatisgarh a a a 50 57 54 48 54 51
34 Jharkhand a a a 42 46 44 41 44 42
35 Uttarakhand a a a 41 42 41 37 39 38
All India 122 108 115 49 52 50 46 49 47
Source : Sample Registration System, Office of the Registrar General, India, Ministry of Home Affairs.a : Created in 2001.
Note : Infant mortality rates for 2009 and 2010 in respect of smaller States and UTs are based upon the three year period 2007-09 and2008-10.
http://indiabudget.nic.in
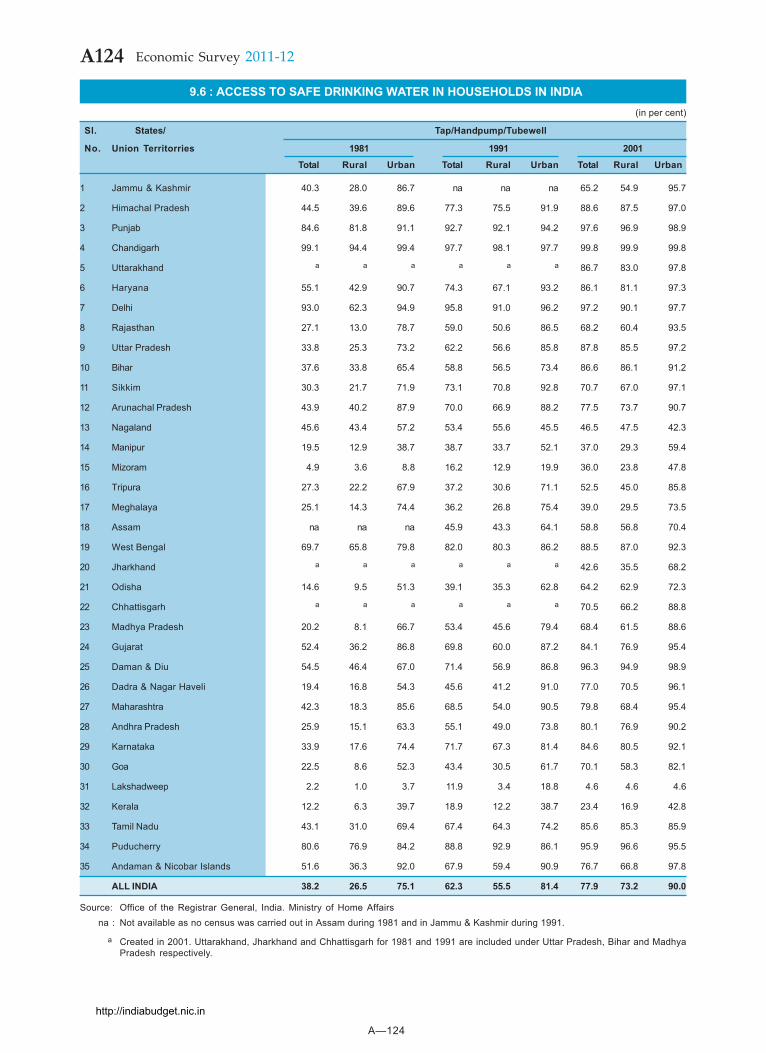
A—124
A124 Economic Survey 2011-12
9.6 : ACCESS TO SAFE DRINKING WATER IN HOUSEHOLDS IN INDIA(in per cent)
Sl. States/ Tap/Handpump/Tubewell
No. Union Territorries 1981 1991 2001
Total Rural Urban Total Rural Urban Total Rural Urban
1 Jammu & Kashmir 40.3 28.0 86.7 na na na 65.2 54.9 95.7
2 Himachal Pradesh 44.5 39.6 89.6 77.3 75.5 91.9 88.6 87.5 97.0
3 Punjab 84.6 81.8 91.1 92.7 92.1 94.2 97.6 96.9 98.9
4 Chandigarh 99.1 94.4 99.4 97.7 98.1 97.7 99.8 99.9 99.8
5 Uttarakhand a a a a a a 86.7 83.0 97.8
6 Haryana 55.1 42.9 90.7 74.3 67.1 93.2 86.1 81.1 97.3
7 Delhi 93.0 62.3 94.9 95.8 91.0 96.2 97.2 90.1 97.7
8 Rajasthan 27.1 13.0 78.7 59.0 50.6 86.5 68.2 60.4 93.5
9 Uttar Pradesh 33.8 25.3 73.2 62.2 56.6 85.8 87.8 85.5 97.2
10 Bihar 37.6 33.8 65.4 58.8 56.5 73.4 86.6 86.1 91.2
11 Sikkim 30.3 21.7 71.9 73.1 70.8 92.8 70.7 67.0 97.1
12 Arunachal Pradesh 43.9 40.2 87.9 70.0 66.9 88.2 77.5 73.7 90.7
13 Nagaland 45.6 43.4 57.2 53.4 55.6 45.5 46.5 47.5 42.3
14 Manipur 19.5 12.9 38.7 38.7 33.7 52.1 37.0 29.3 59.4
15 Mizoram 4.9 3.6 8.8 16.2 12.9 19.9 36.0 23.8 47.8
16 Tripura 27.3 22.2 67.9 37.2 30.6 71.1 52.5 45.0 85.8
17 Meghalaya 25.1 14.3 74.4 36.2 26.8 75.4 39.0 29.5 73.5
18 Assam na na na 45.9 43.3 64.1 58.8 56.8 70.4
19 West Bengal 69.7 65.8 79.8 82.0 80.3 86.2 88.5 87.0 92.3
20 Jharkhand a a a a a a 42.6 35.5 68.2
21 Odisha 14.6 9.5 51.3 39.1 35.3 62.8 64.2 62.9 72.3
22 Chhattisgarh a a a a a a 70.5 66.2 88.8
23 Madhya Pradesh 20.2 8.1 66.7 53.4 45.6 79.4 68.4 61.5 88.6
24 Gujarat 52.4 36.2 86.8 69.8 60.0 87.2 84.1 76.9 95.4
25 Daman & Diu 54.5 46.4 67.0 71.4 56.9 86.8 96.3 94.9 98.9
26 Dadra & Nagar Haveli 19.4 16.8 54.3 45.6 41.2 91.0 77.0 70.5 96.1
27 Maharashtra 42.3 18.3 85.6 68.5 54.0 90.5 79.8 68.4 95.4
28 Andhra Pradesh 25.9 15.1 63.3 55.1 49.0 73.8 80.1 76.9 90.2
29 Karnataka 33.9 17.6 74.4 71.7 67.3 81.4 84.6 80.5 92.1
30 Goa 22.5 8.6 52.3 43.4 30.5 61.7 70.1 58.3 82.1
31 Lakshadweep 2.2 1.0 3.7 11.9 3.4 18.8 4.6 4.6 4.6
32 Kerala 12.2 6.3 39.7 18.9 12.2 38.7 23.4 16.9 42.8
33 Tamil Nadu 43.1 31.0 69.4 67.4 64.3 74.2 85.6 85.3 85.9
34 Puducherry 80.6 76.9 84.2 88.8 92.9 86.1 95.9 96.6 95.5
35 Andaman & Nicobar Islands 51.6 36.3 92.0 67.9 59.4 90.9 76.7 66.8 97.8
ALL INDIA 38.2 26.5 75.1 62.3 55.5 81.4 77.9 73.2 90.0
Source: Office of the Registrar General, India. Ministry of Home Affairs na : Not available as no census was carried out in Assam during 1981 and in Jammu & Kashmir during 1991.
a Created in 2001. Uttarakhand, Jharkhand and Chhattisgarh for 1981 and 1991 are included under Uttar Pradesh, Bihar and MadhyaPradesh respectively.
http://indiabudget.nic.in
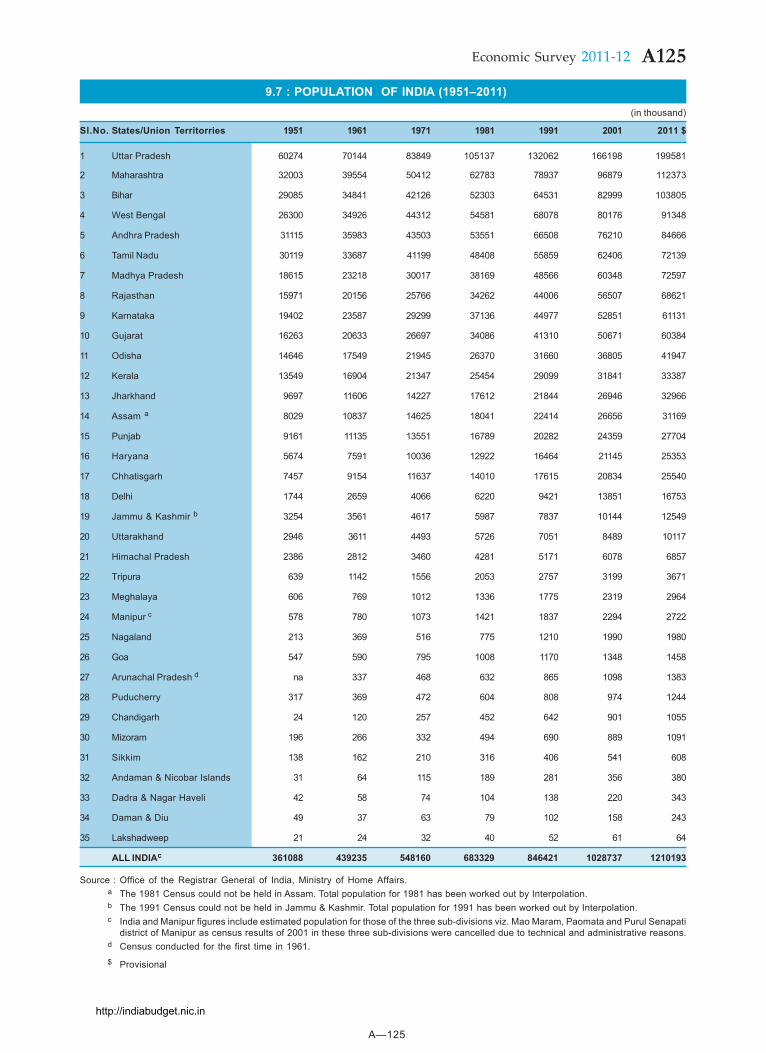
A—125
A125Economic Survey 2011-12
9.7 : POPULATION OF INDIA (1951–2011)(in thousand)
Sl.No. States/Union Territorries 1951 1961 1971 1981 1991 2001 2011 $
1 Uttar Pradesh 60274 70144 83849 105137 132062 166198 199581
2 Maharashtra 32003 39554 50412 62783 78937 96879 112373
3 Bihar 29085 34841 42126 52303 64531 82999 103805
4 West Bengal 26300 34926 44312 54581 68078 80176 91348
5 Andhra Pradesh 31115 35983 43503 53551 66508 76210 84666
6 Tamil Nadu 30119 33687 41199 48408 55859 62406 72139
7 Madhya Pradesh 18615 23218 30017 38169 48566 60348 72597
8 Rajasthan 15971 20156 25766 34262 44006 56507 68621
9 Karnataka 19402 23587 29299 37136 44977 52851 61131
10 Gujarat 16263 20633 26697 34086 41310 50671 60384
11 Odisha 14646 17549 21945 26370 31660 36805 41947
12 Kerala 13549 16904 21347 25454 29099 31841 33387
13 Jharkhand 9697 11606 14227 17612 21844 26946 32966
14 Assam a 8029 10837 14625 18041 22414 26656 31169
15 Punjab 9161 11135 13551 16789 20282 24359 27704
16 Haryana 5674 7591 10036 12922 16464 21145 25353
17 Chhatisgarh 7457 9154 11637 14010 17615 20834 25540
18 Delhi 1744 2659 4066 6220 9421 13851 16753
19 Jammu & Kashmir b 3254 3561 4617 5987 7837 10144 12549
20 Uttarakhand 2946 3611 4493 5726 7051 8489 10117
21 Himachal Pradesh 2386 2812 3460 4281 5171 6078 6857
22 Tripura 639 1142 1556 2053 2757 3199 3671
23 Meghalaya 606 769 1012 1336 1775 2319 2964
24 Manipur c 578 780 1073 1421 1837 2294 2722
25 Nagaland 213 369 516 775 1210 1990 1980
26 Goa 547 590 795 1008 1170 1348 1458
27 Arunachal Pradesh d na 337 468 632 865 1098 1383
28 Puducherry 317 369 472 604 808 974 1244
29 Chandigarh 24 120 257 452 642 901 1055
30 Mizoram 196 266 332 494 690 889 1091
31 Sikkim 138 162 210 316 406 541 608
32 Andaman & Nicobar Islands 31 64 115 189 281 356 380
33 Dadra & Nagar Haveli 42 58 74 104 138 220 343
34 Daman & Diu 49 37 63 79 102 158 243
35 Lakshadweep 21 24 32 40 52 61 64
ALL INDIAc 361088 439235 548160 683329 846421 1028737 1210193
Source : Office of the Registrar General of India, Ministry of Home Affairs.a The 1981 Census could not be held in Assam. Total population for 1981 has been worked out by Interpolation.b The 1991 Census could not be held in Jammu & Kashmir. Total population for 1991 has been worked out by Interpolation.c India and Manipur figures include estimated population for those of the three sub-divisions viz. Mao Maram, Paomata and Purul Senapati
district of Manipur as census results of 2001 in these three sub-divisions were cancelled due to technical and administrative reasons.d Census conducted for the first time in 1961.$ Provisional
http://indiabudget.nic.in