Embed Size (px)
Citation preview
1
International TradeChapter
19
Copyright © 2002 Addison Wesley
CHAPTER CHECKLIST
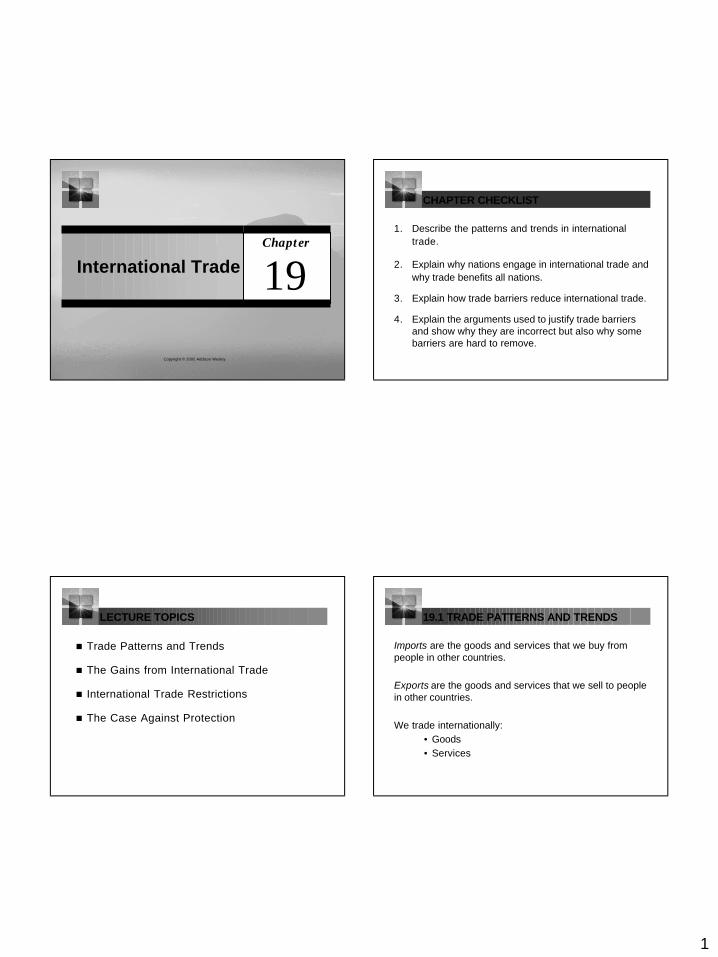
1. Describe the patterns and trends in international trade.
2. Explain why nations engage in international trade and why trade benefits all nations.
3. Explain how trade barriers reduce international trade.
4. Explain the arguments used to justify trade barriers and show why they are incorrect but also why some barriers are hard to remove.
LECTURE TOPICS
n Trade Patterns and Trends
n The Gains from International Trade
n International Trade Restrictions
n The Case Against Protection
LECTURE TOPICS 19.1 TRADE PATTERNS AND TRENDS
Imports are the goods and services that we buy from people in other countries.
Exports are the goods and services that we sell to people in other countries.
We trade internationally:• Goods • Services
2
19.1 TRADE PATTERNS AND TRENDS
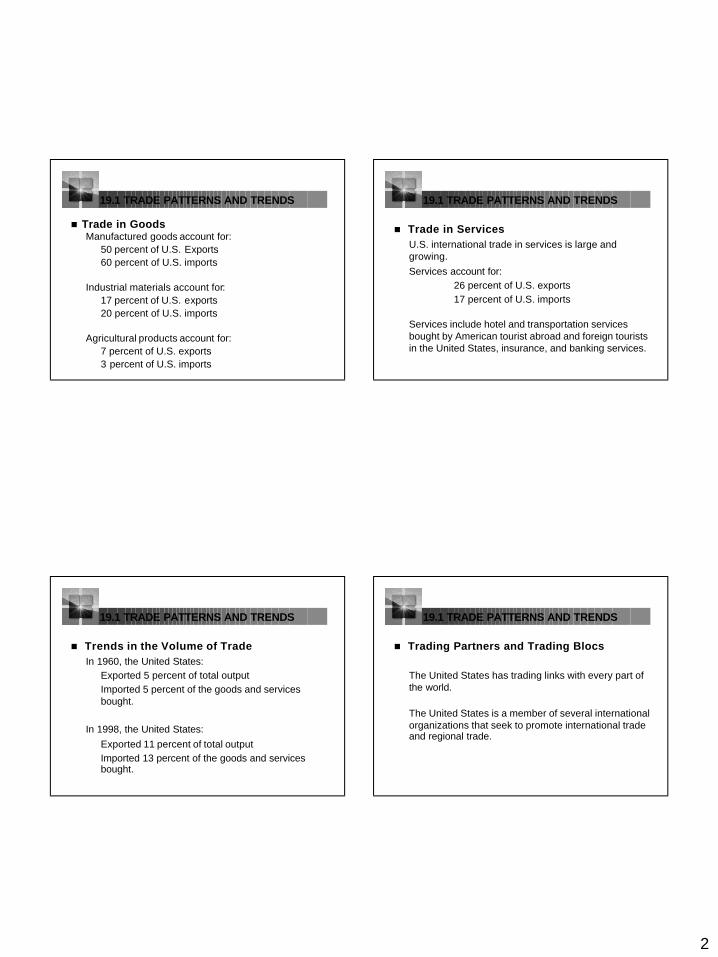
n Trade in GoodsManufactured goods account for:
50 percent of U.S. Exports60 percent of U.S. imports
Industrial materials account for:17 percent of U.S. exports20 percent of U.S. imports
Agricultural products account for:7 percent of U.S. exports3 percent of U.S. imports
19.1 TRADE PATTERNS AND TRENDS
n Trade in ServicesU.S. international trade in services is large and growing.Services account for:
26 percent of U.S. exports17 percent of U.S. imports
Services include hotel and transportation services bought by American tourist abroad and foreign tourists in the United States, insurance, and banking services.
19.1 TRADE PATTERNS AND TRENDS
n Trends in the Volume of TradeIn 1960, the United States:
Exported 5 percent of total outputImported 5 percent of the goods and services bought.
In 1998, the United States:Exported 11 percent of total outputImported 13 percent of the goods and services bought.
19.1 TRADE PATTERNS AND TRENDS
n Trading Partners and Trading Blocs
The United States has trading links with every part of the world.
The United States is a member of several international organizations that seek to promote international trade and regional trade.
3
19.1 TRADE PATTERNS AND TRENDS
U.S. Trading Partners Biggest trading partner: CanadaSecond biggest trading partners: Mexico and JapanOther large trading partners:
• China• Germany• United Kingdom
Significant volumes of trade with:• Hong Kong, South Korea, and Taiwan
19.1 TRADE PATTERNS AND TRENDS
Trading Blocs
A trading bloc is a group of nations in an international organization.
The three largest geographical trading blocs are:• North American Free Trade Agreement• Asia-Pacific Economic Cooperation• European Union
19.1 TRADE PATTERNS AND TRENDS
North American Free Trade Agreement (NAFTA)An agreement between the United States, Canada, and Mexico to make trade among them easier and freer.
NAFTA came into effect in 1994 and since then trade among these three countries has grown rapidly.
All American countries, except Cuba, have entered into a Free Trade of the Americas process, which aims for free trade among all American nations by 2005.
19.1 TRADE PATTERNS AND TRENDS
Asia-Pacific Economic Cooperation (APEC)APEC is a group of 21 nations that border the Pacific Ocean.
APEC was established in 1989 and has developed into an organization that promotes freer trade and cooperation among its members.
In 1999, APEC nations conducted 44 percent of world international trade.
4
19.1 TRADE PATTERNS AND TRENDS
n Balance of Trade and International Borrowing
Balance of tradeThe value of exports minus the value of imports.
In 2000, U.S. imports exceeded U.S. exports and the U.S. trade balance was negative.
19.1 TRADE PATTERNS AND TRENDS
A country has a:• Trade deficit i f imports > exports.• Trade surplus if exports > imports.
When a country has a trade deficit, it pays for the deficit by borrowing from other countries or by selling some of its assets.
When a country has a trade surplus, it lends to other countries or buys more foreign assets so that other countries can pay their trade deficits.
19.2 THE GAINS FROM TRADE
Comparative advantage is the force that generates international trade.
n Why the United States Exports AirplanesThe United States has a comparative advantage in the production of airplanes because the opportunity cost of producing an airplane is lower in the United Statesthan in most other countries.
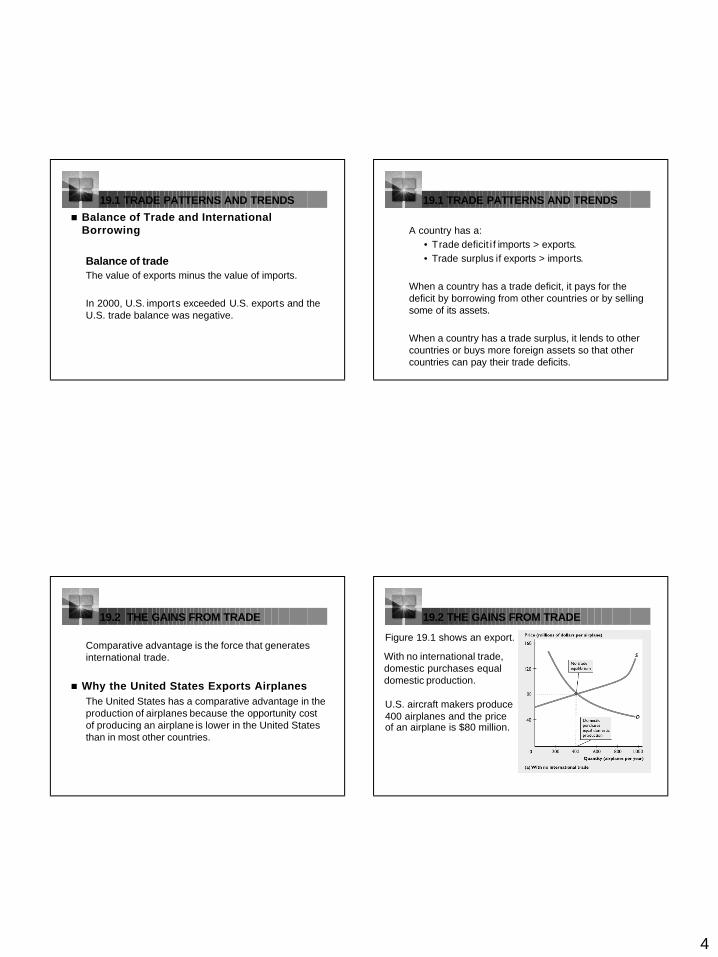
Figure 19.1 shows an export.
With no international trade, domestic purchases equal domestic production.
19.2 THE GAINS FROM TRADE
U.S. aircraft makers produce 400 airplanes and the price of an airplane is $80 million.
5
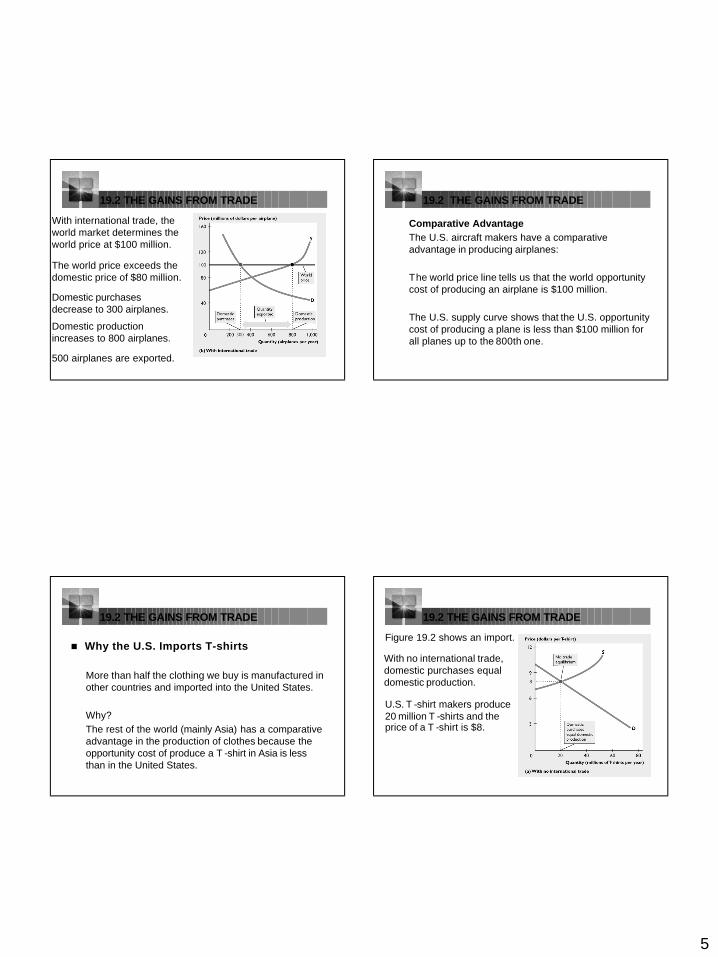
With international trade, the world market determines the world price at $100 million.
19.2 THE GAINS FROM TRADE
Domestic purchases decrease to 300 airplanes.
Domestic production increases to 800 airplanes.
The world price exceeds the domestic price of $80 million.
500 airplanes are exported.
19.2 THE GAINS FROM TRADE
Comparative AdvantageThe U.S. aircraft makers have a comparative advantage in producing airplanes:
The world price line tells us that the world opportunity cost of producing an airplane is $100 million.
The U.S. supply curve shows that the U.S. opportunity cost of producing a plane is less than $100 million for all planes up to the 800th one.
19.2 THE GAINS FROM TRADE
n Why the U.S. Imports T-shirts
More than half the clothing we buy is manufactured in other countries and imported into the United States.
Why?The rest of the world (mainly Asia) has a comparative advantage in the production of clothes because the opportunity cost of produce a T -shirt in Asia is less than in the United States.
Figure 19.2 shows an import.
19.2 THE GAINS FROM TRADE
With no international trade, domestic purchases equal domestic production.
U.S. T -shirt makers produce 20 million T -shirts and the price of a T -shirt is $8.
6
19.2 THE GAINS FROM TRADE
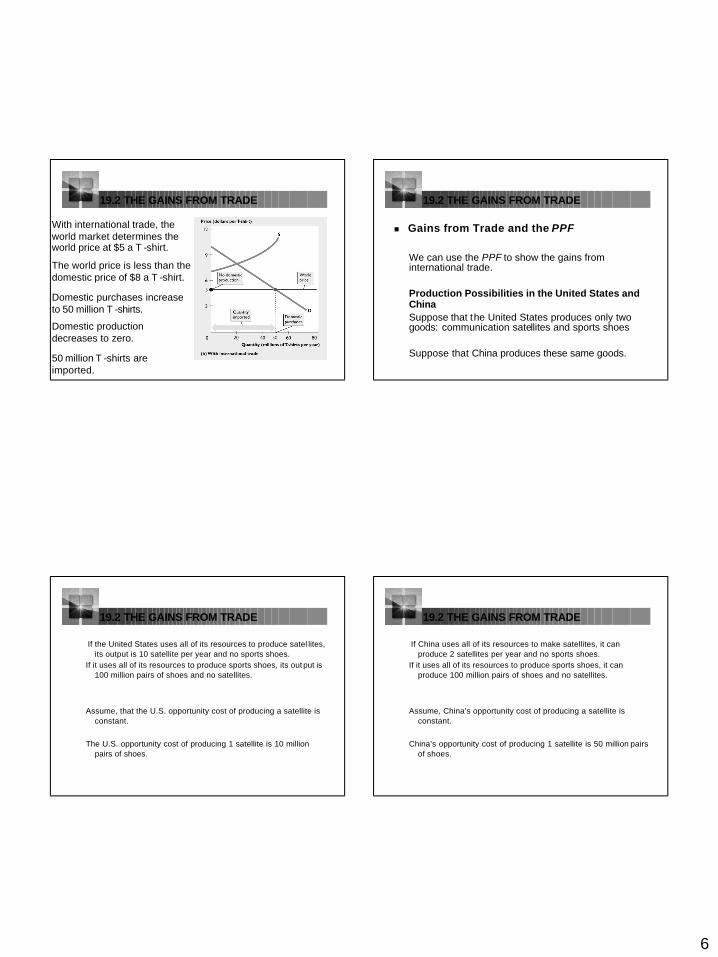
With international trade, the world market determines the world price at $5 a T -shirt.
The world price is less than the domestic price of $8 a T -shirt.
Domestic purchases increase to 50 million T -shirts.
Domestic production decreases to zero.
50 million T -shirts are imported.
19.2 THE GAINS FROM TRADE
n Gains from Trade and the PPF
We can use the PPF to show the gains from international trade.
Production Possibilities in the United States and ChinaSuppose that the United States produces only two goods: communication satellites and sports shoes
Suppose that China produces these same goods.
19.2 THE GAINS FROM TRADE
If the United States uses all of its resources to produce satel lites, its output is 10 satellite per year and no sports shoes.
If it uses all of its resources to produce sports shoes, its out put is 100 million pairs of shoes and no satellites.
Assume, that the U.S. opportunity cost of producing a satellite is constant.
The U.S. opportunity cost of producing 1 satellite is 10 millionpairs of shoes.
19.2 THE GAINS FROM TRADE
If China uses all of its resources to make satellites, it can produce 2 satellites per year and no sports shoes.
If it uses all of its resources to produce sports shoes, it can produce 100 million pairs of shoes and no satellites.
Assume, China’s opportunity cost of producing a satellite is constant.
China’s opportunity cost of producing 1 satellite is 50 million pairs of shoes.
7
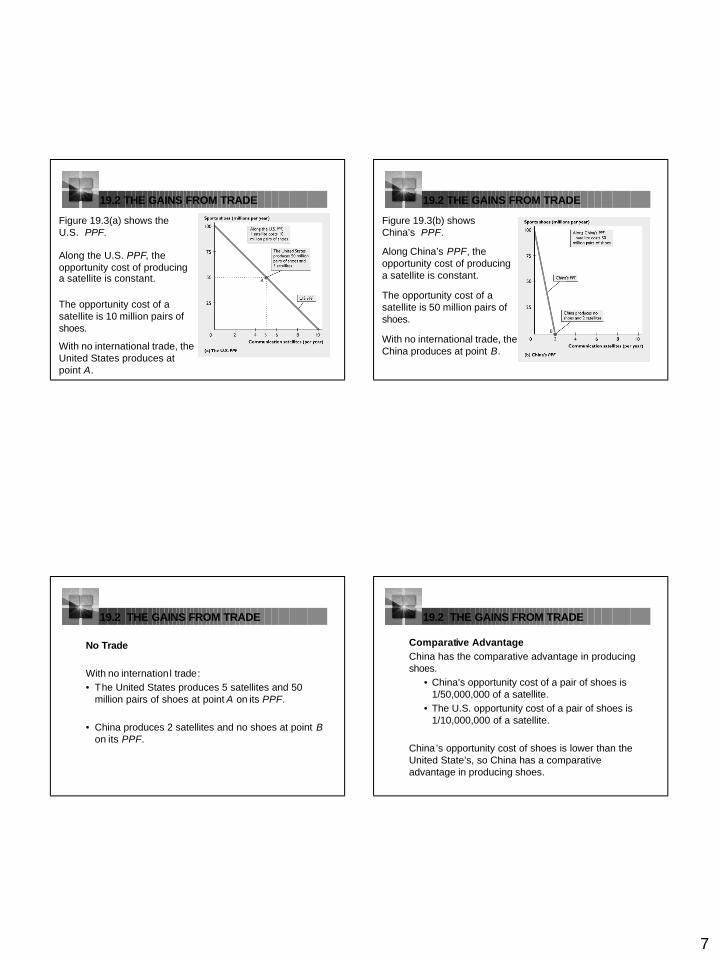
Figure 19.3(a) shows the U.S. PPF.
19.2 THE GAINS FROM TRADE
Along the U.S. PPF, the opportunity cost of producing a satellite is constant.
The opportunity cost of a satellite is 10 million pairs of shoes.
With no international trade, the United States produces at point A.
19.2 THE GAINS FROM TRADE
Along China’s PPF, the opportunity cost of producing a satellite is constant.
The opportunity cost of a satellite is 50 million pairs of shoes.
With no international trade, the China produces at point B.
Figure 19.3(b) shows China’s PPF.
19.2 THE GAINS FROM TRADE
No Trade
With no internationl trade:• The United States produces 5 satellites and 50
million pairs of shoes at point A on its PPF.
• China produces 2 satellites and no shoes at point B on its PPF.
19.2 THE GAINS FROM TRADE
Comparative AdvantageChina has the comparative advantage in producing shoes.
• China’s opportunity cost of a pair of shoes is 1/50,000,000 of a satellite.
• The U.S. opportunity cost of a pair of shoes is 1/10,000,000 of a satellite.
China’s opportunity cost of shoes is lower than the United State’s, so China has a comparative advantage in producing shoes.
8
19.2 THE GAINS FROM TRADE
The United States has a comparative advantage in producing satellites.
• The U.S. opportunity cost of producing a satellite is 10 million pairs of shoes.
• China’s opportunity cost of producing a satellite is 50 million pairs of shoes.
The U.S. opportunity cost of a satellite is less than China’s, so the United States has a comparative advantage in producing satellites.
19.2 THE GAINS FROM TRADE
Achieving the Gains from Trade
The United States and China will reap the gains from international trade, if each country specializes in producing the good in which it has a comparative advantage and then the two countries trade with each other.
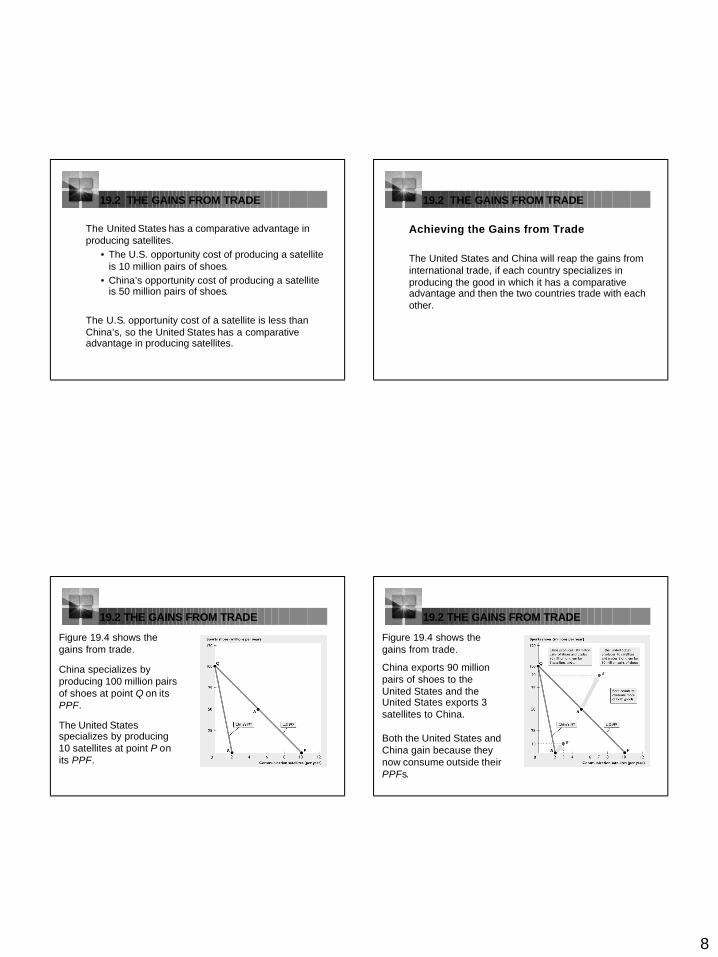
Figure 19.4 shows the gains from trade.
19.2 THE GAINS FROM TRADE
The United States specializes by producing 10 satellites at point P on its PPF.
China specializes by producing 100 million pairs of shoes at point Q on its PPF.
Figure 19.4 shows the gains from trade.
19.2 THE GAINS FROM TRADE
Both the United States and China gain because they now consume outside their PPFs.
China exports 90 million pairs of shoes to the United States and the United States exports 3 satellites to China.
9
19.2 THE GAINS FROM TRADE
With no trade, China produces 2 satellites and no shoes.
By specializing in producing shoes (the good in which it has a comparative advantage) and trading with the United States, China has 10 million pairs of shoes and 3 satellites.
China’s gains from trade are 10 million pairs of shoes and 1 satellite.
19.2 THE GAINS FROM TRADE
With no trade, the United States produces 5 satellites and 50 million pairs of shoes.
By specializing in producing satellites (the good in which it has a comparative advantage) and trading with China, the United States has 90 million pairs of shoes and 7 satellites.
The U.S. gains from trade are 40 million pairs of shoes and 2 satellite.
19.2 THE GAINS FROM TRADE
Dynamic Comparative Advantage
Learning-by-doing occurs when people become more productive as a result of repeatedly performing the same task or producing a particular good or service.
Dynamic comparative advantageA comparative advantage that a person (or country) obtains as a result of learning-by-doing.
19.3 TRADE RESTRICTIONS
Governments restrict trade to protect industries from foreign competition by using two main tools:
• Tariffs• Nontariff barriers
A tariff is a tax on a good that is imposed by theimporting country when an imported good crossesits international border.
A nontariff barrier is any action other than a tariff that restricts international trade. For example, a quota.
10
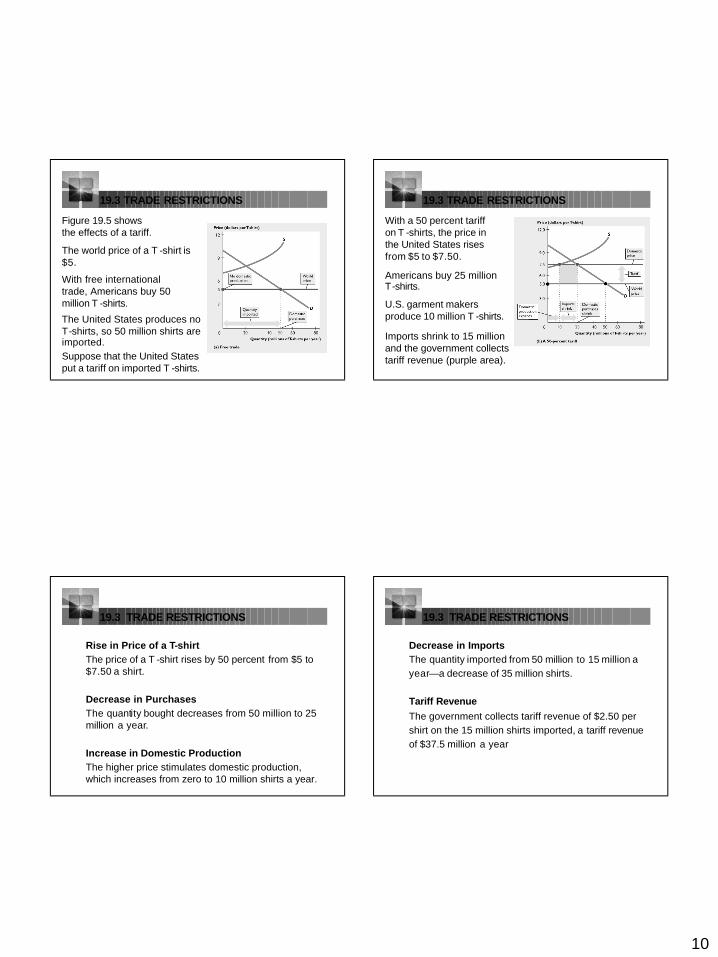
Figure 19.5 shows the effects of a tariff.
The world price of a T -shirt is $5.
19.3 TRADE RESTRICTIONS
With free international trade, Americans buy 50 million T -shirts.
Suppose that the United States put a tariff on imported T -shirts.
The United States produces no T-shirts, so 50 million shirts are imported.
With a 50 percent tariff on T -shirts, the price in the United States rises from $5 to $7.50.
19.3 TRADE RESTRICTIONS
Americans buy 25 million T-shirts.
U.S. garment makers produce 10 million T -shirts.
Imports shrink to 15 million and the government collects tariff revenue (purple area).
19.3 TRADE RESTRICTIONS
Rise in Price of a T-shirtThe price of a T -shirt rises by 50 percent from $5 to $7.50 a shirt.
Decrease in PurchasesThe quantity bought decreases from 50 million to 25 million a year.
Increase in Domestic ProductionThe higher price stimulates domestic production, which increases from zero to 10 million shirts a year.
19.3 TRADE RESTRICTIONS
Decrease in ImportsThe quantity imported from 50 million to 15 million ayear—a decrease of 35 million shirts.
Tariff RevenueThe government collects tariff revenue of $2.50 pershirt on the 15 million shirts imported, a tariff revenueof $37.5 million a year
11
19.3 TRADE RESTRICTIONS
U.S. Consumers LoseThe opportunity cost of T-shirt is $5.
But Americans pay $7.50 for a T-shirt—$2.50 more than the opportunity cost of a shirt.
U.S. consumers are willing to buy 50 million shirts a year at the opportunity cost.
So the tariff deprives people of shirts that they are willing to buy at a price equal to its opportunity cost.
19.3 TRADE RESTRICTIONS
n Nontariff Barriers
QuotaA specified maximum amount of a good that may be imported in a given period of time.
How a Quota WorksWith free trade, Americans pay $5 a T -shirt and import 50 million T -shirts a year.Suppose the U.S. government sets a quota on imported T -shirts at 15 million a year.
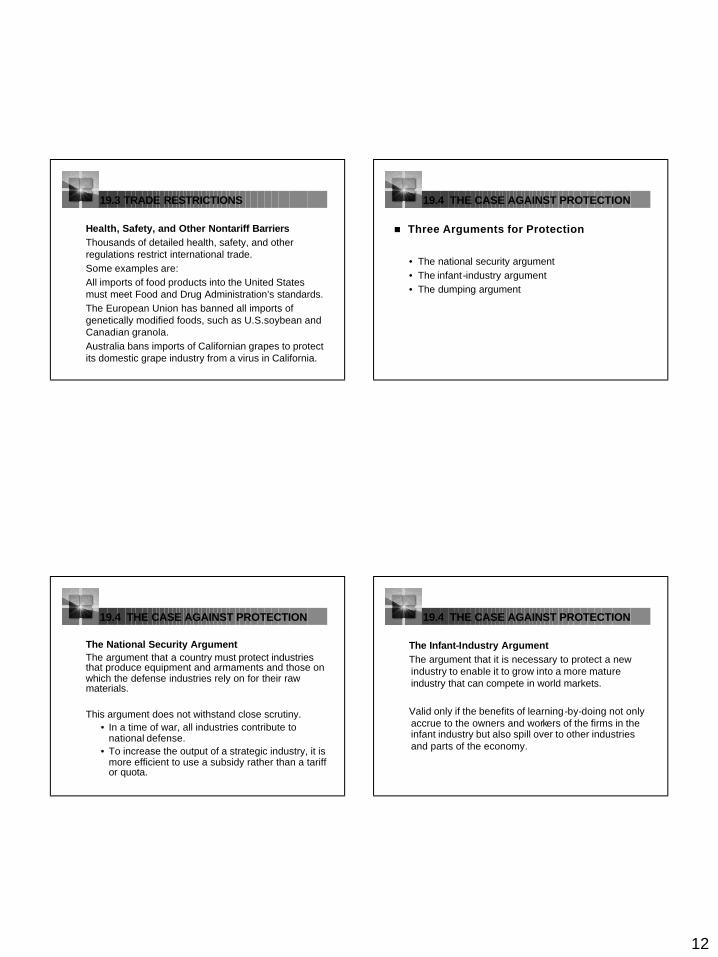
Figure 19.6 shows the effects of a quota.
19.3 TRADE RESTRICTIONS
With a quota, the supply of shirts in the U.S. market equals the supply by U.S. shirt makers plus the quota on imports.
The price Americans pay is determined in the U.S. shirt market and it rises to $7.50 a shirt.
19.3 TRADE RESTRICTIONS
With the higher price, U.S shirt makers increase production to 10 million a year.
Imports decrease from 50 million to 15 million shirts, which equals the quota.
Americans buy 25 million shirts a year—down from 50 million a year.
12
19.3 TRADE RESTRICTIONS
Health, Safety, and Other Nontariff BarriersThousands of detailed health, safety, and other regulations restrict international trade.Some examples are:All imports of food products into the United States must meet Food and Drug Administration’s standards.The European Union has banned all imports of genetically modified foods, such as U.S.soybean and Canadian granola. Australia bans imports of Californian grapes to protect its domestic grape industry from a virus in California.
19.4 THE CASE AGAINST PROTECTION
n Three Arguments for Protection
• The national security argument• The infant-industry argument• The dumping argument
19.4 THE CASE AGAINST PROTECTION
The National Security ArgumentThe argument that a country must protect industries that produce equipment and armaments and those on which the defense industries rely on for their raw materials.
This argument does not withstand close scrutiny.• In a time of war, all industries contribute to
national defense.• To increase the output of a strategic industry, it is
more efficient to use a subsidy rather than a tariff or quota.
19.4 THE CASE AGAINST PROTECTION
The Infant-Industry ArgumentThe argument that it is necessary to protect a new industry to enable it to grow into a more mature industry that can compete in world markets.
Valid only if the benefits of learning-by-doing not only accrue to the owners and workers of the firms in the infant industry but also spill over to other industries and parts of the economy.
13
19.4 THE CASE AGAINST PROTECTION
The Dumping Argument
Dumping occurs when a foreign firm sells its exports at a lower price than its cost of production.
The argument is that a firm that wants to become a global monopoly might try to eliminate its foreign competitors by dumping.Once it has a global monopoly, it will raise its price.
Dumping is usually justification for temporary countervailing duties.
19.4 THE CASE AGAINST PROTECTION
n Fatally Flawed Arguments for Protection
Saves JobsThe argument is that protection saves jobs because when we buy shoes from Brazil or shirts from Taiwan,U.S. workers lose their jobs.
Allows Us to Compete with Cheap Foreign LaborThe argument is that with the removal of protective tariffs in U.S. trade with Mexico jobs rushing to Mexicowould make a “giant sucking sound.”
19.4 THE CASE AGAINST PROTECTION
Brings Diversity and StabilityThe argument is that protection brings a diversified economy—an economy that fluctuates less than an one that produces only a fewgoods and services.
Penalizes Lax Environmental StandardsThe argument is that many poor countries, such as Mexico, do not have the same environmental standards as the U.S., so we cannot compete without tariffs.
19.4 THE CASE AGAINST PROTECTION
Protects National CultureThe argument that is commonly heard in Canada and Europe is that free trade in books, magazines, movies, and television programs means U.S. domination and the end of local culture.
Prevents Rich Countries from Exploiting Developing CountriesThe argument is that if we trade with developing countries in which the wage rate is low, we increase the demand for the goods they produce and so increase the demand for their labor.
14
19.4 THE CASE AGAINST PROTECTION
n Why Is International Trade Restricted?Two key reasons:• Tariff revenue• Rent seeking
Tariff RevenueThe U.S. government’s revenue comes from taxes.But in some developing countries, governmentscannot use taxes because financial record-keeping is poor.In these countries, international trade transactions are well recorded, so governments use tariffs on imports to raise revenue.
19.4 THE CASE AGAINST PROTECTION
Rent Seeking
Rent seeking is lobbying and other political activity that seeks to capture the gains from trade.
Free trade increases consumption possibilities on the average, but not everyone shares in the gains.
Free trade brings benefits to some and costs to others.
The uneven distribution of benefits and costs is the principle source of impediment to freer international trade.
19.4 THE CASE AGAINST PROTECTION
Compensating Losers
In total, the gains from free international trade exceed the losses, so why don’t the people who gain from free trade compensate the losers?
To a degree, losers are compensated: When Congress approved the NAFTA deal with Canada and Mexico, it set up a $56 million fund to support and retrain workers who lost their jobs because of the free trade agreement.
19.4 THE CASE AGAINST PROTECTION
During the first six months of NAFTA, only 5,000 workers applied for benefits under the scheme.
But in general, we don’t compensate the losers from free international trade that protectionism is such a popular and permanent feature of our economic and political life.
15
The EndChapter
19
Copyright © 2002 Addison Wesley