Embed Size (px)
Citation preview

March 2013
International Towers Sydney
New development is shaping the future of Sydney as a global finance centre

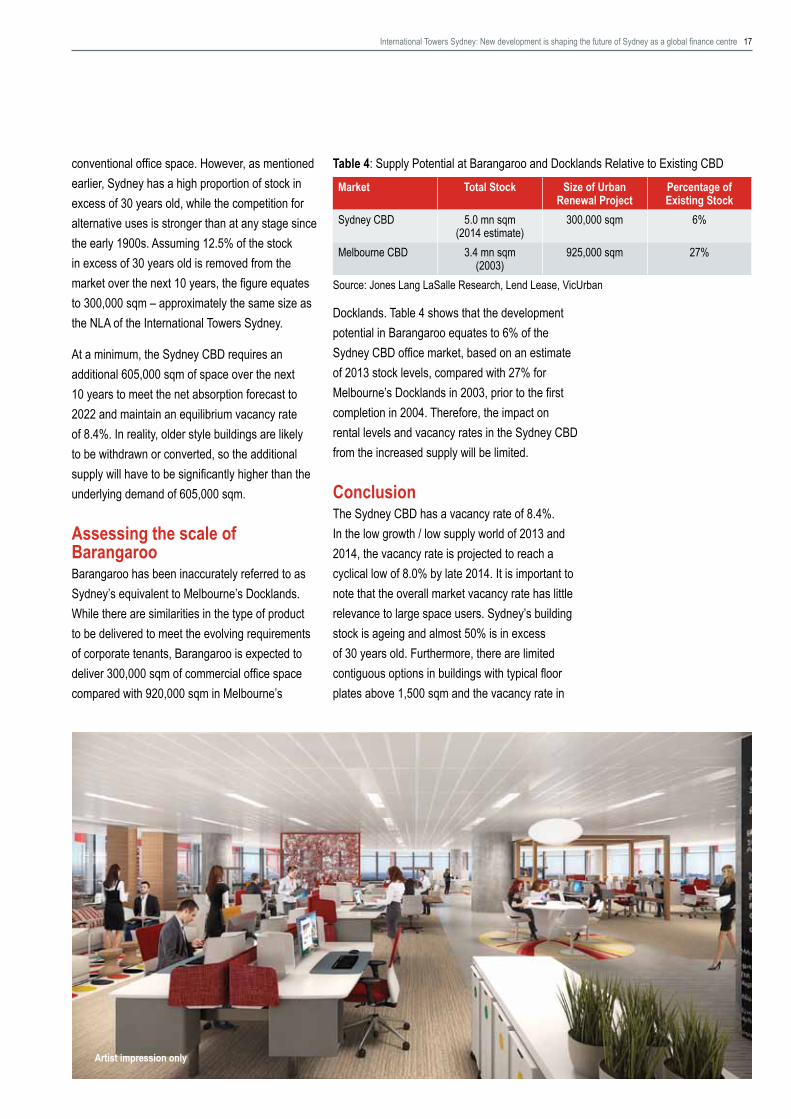
Artist impression only
2 Advance
Executive summary• The Sydney CBD is ageing. Almost 50%
of the 5.0 million sqm of stock, which comprises the Sydney CBD office market, is in excess of 30 years old. Increasingly, Sydney’s building stock reflects the design and characteristics of the 1980s or earlier.
• The shape, size and layout of a building’s floor plate will contribute to occupier efficiencies. Modern corporate occupiers, in particular financial and professional services firms, are seeking large floors, preferably a minimum of 1,500 sqm, but increasingly 2,000 sqm, with minimal intrusions in terms of columns and core areas.
• In the Sydney CBD approximately 281,800 sqm of space, equating to 5.7% of the total stock, is in buildings with typical floor plates in excess of 2,000 sqm. The vacancy rate within these assets is ~0%.
• Barangaroo on the CBD’s western harbour front is a 22 hectare mixed-use redevelopment.
• Barangaroo is Sydney’s largest and most ambitious urban regeneration project since the 2000 Olympics.
• The site is divided into three sections – a naturalistic six hectare park at the northern end, a central area featuring civic, educational, residential and recreational spaces and the southern precinct – the AUD 6 billion Barangaroo South precinct which is being created by Lend Lease. This 7.8 hectare mixed use commercial, residential and leisure precinct is based around three commercial towers that form International Towers Sydney.
• International Towers Sydney are delivering the next generation of office product to the Sydney CBD. International Towers Sydney will showcase Sydney as a world leader in sustainable office design.
• Barangaroo South aims to be Australia’s first large scale carbon neutral community.
• Barangaroo will be integrated with the Sydney CBD and public transportation infrastructure. A new pedestrian tunnel, Wynyard Walk, will enable pedestrians to access the Barangaroo waterfront in six minutes from the Wynyard Transport Hub.
• The development of Barangaroo will support Sydney’s aim to be a global finance centre and regional services hub. The FIRE (Finance &
International Towers Sydney: New development is shaping the future of Sydney as a global finance centre 3
Insurance and Real Estate) sector is projected to account for 29% of employment growth in the Sydney CBD between 2012 and 2022.
• Jones Lang LaSalle believes that the development of International Towers Sydney and other major Sydney CBD developments are positive for the city’s global profile. Leading Ecologically Sustainable Development (ESD) designs for Barangaroo will enhance perceptions of Sydney as a world leader in the design of sustainable office buildings.
• Net absorption in the Sydney CBD is projected at 605,000 sqm between 2012 and 2022. International Towers Sydney will only have the capacity to meet 50% of projected demand over the next ten years.
Addressing the requirements of modern corporate occupiersBarangaroo is a major urban renewal project on the western harbour front of Sydney’s Central Business District. A crucial part of the redevelopment, International Towers Sydney, will offer the next generation of office accommodation in the CBD. International Towers Sydney are
designed to serve the evolving needs of large corporate occupiers.
The Financial & Insurance Services (F&I) and the Professional, Technical & Scientific Services (Professional Services) sectors are cornerstones of the New South Wales economy, accounting for 23% of output in 2011/12. They are also the largest occupiers of office space and represent 61% of office-using employment in the Sydney CBD.
The short-term demand outlook for office space is challenging in the Sydney CBD. Tenant expansion, however, is only one driver of leasing activity. A number of businesses in Sydney are looking to consolidate multiple tenancies to improve efficiencies across their real estate portfolios and achieve productivity gains. Jones Lang LaSalle has identified major lease expiries approaching 1.4 million sqm of space between 2012 and 2015. The weight of lease expiry, even when applying low conversion rates, will generate additional activity in Sydney.
4 Advance
Space requirements for modern corporate occupiers continue to evolve. Tenants now consider a range of factors when reviewing their accommodation strategies, including an emphasis on building design, greater efficiencies, sustainability credentials and how the format supports staff interaction and corporate culture.
Sydney’s building stock, however, is ageing. Almost 50% of the existing office stock in Sydney is in excess of 30 years old. Approximately 281,800 sqm of Sydney’s 5.0 million sqm of office space, equating to 5.7% of total stock, is in buildings with typical floor plates in excess of 2,000 sqm. The bulk of this product is occupied by major businesses under long leases with the vacancy rate within these assets at ~0%. As a result, tenants are pre-committing to development stock. Seven major pre-commitments have occurred in the Sydney CBD since mid-2012 totalling 180,000 sqm.
Nevertheless, the development environment is challenging. In a normal short-listing process, a tenant would consider the suitability of the scheme, location and price-point. However, the lending criteria for development finance are tough and financiers are lending on lower loan-to-cost ratios than were evident between 2004 and 2007. Tenants now have to assess the strength of a developer’s balance sheet and the ability to attract equity partners to the project or to source a fund-through arrangement from an investor.
In this paper, Jones Lang LaSalle will consider the employment outlook for F&I and Professional Services sectors. Businesses are looking to use office space more efficiently to control occupancy costs and attract and retain key staff. We will, therefore, provide a range of scenarios that illustrate how the employment outlook translates into the underlying demand for office space based on a range of workspace ratios.
International Towers Sydney and other major developments will deliver space into the Sydney CBD market between 2015 and 2017. However, there is a misconception that completions equal
supply in Australian office markets. Over the next ten years, a significant proportion of Sydney’s stock will be withdrawn for refurbishment or converted to an alternative use.
What is Barangaroo?Barangaroo is a 22 hectare mixed-use redevelopment on the western harbour front of Sydney’s CBD. It is the largest urban regeneration project in Sydney since the 2000 Olympics. The redevelopment, which is being created by Lend Lease, is valued at AUD 6 billion. It is estimated that this precinct will inject more than AUD 1.5 billion into the New South Wales economy annually.
Barangaroo has three distinct precincts:
• Headland Park: - A six hectare restored naturalistic headland
park.
- A place for the public to relax by the harbour in natural surroundings just minutes from the CBD.
- A public foreshore walk will run the length of Barangaroo. The walk continues north onto Walsh Bay and Circular Quay. To the south, the walk connects with Kings Street Wharf. The linkage that Barangaroo will create between Kings Street Wharf and Walsh Bay will form part of an 11 kilometre harbour foreshore walk.
• Barangaroo Central: - Will combine the commercial development
with civic and recreation spaces to create an area for the community.
- The precinct will contain unique buildings, open-air spaces for festivals, entertainment, arts, culture and educational activities.
• Barangaroo South: - The commercial centre of the redevelopment.
- Based around three commercial buildings, known as International Towers Sydney, which

Artist impression only
International Towers Sydney: New development is shaping the future of Sydney as a global finance centre 5
will deliver 283,900 sqm of world leading commercial office space.
- Approximately 800 residential apartments, 80-100 retail outlets and a landmark international hotel will ensure the site is vibrant and active seven days per week.
Sustainable growthThe design and development of International Towers Sydney are aimed at showcasing Sydney as a world leader in sustainability.
Barangaroo South aims to be Australia’s first large scale carbon neutral community.
Lend Lease’s aspirations for International Towers Sydney and Barangaroo South include:
• Office buildings designed to exceed 5 star National Australian Built Environment Rating System (NABERS) Energy rating and to be the first high rise office towers to achieve 6 star Green Star Design and As Built rating (v3).
• Centralised precinct services including energy, cooling, water recycling and reducing waste to landfill. Lend Lease is aiming for a 97% diversion of construction waste away from landfill.
• On site renewable energy from an estimated 6,000 sqm of solar panels, capable of generating over 1,000 MWh of energy annually – equivalent to the power required to run the site’s blackwater treatment plant and public domain.
KPMG pre-commits to the International Towers
In June 2012, KPMG announced its planned move to the Barangaroo precinct, signing a 14 year lease to occupy the top 15 floors of the 39 storey Tower 3 International Towers Sydney from January 2016.
KPMG Chief Executive, Geoff Wilson, underlined the significance of the move when he said at the time:
“We see this as an incredible opportunity to rethink and reshape what the future of work looks like.”
“Moving to Barangaroo is an integral part of our long-term growth strategy and a major initiative in building our firm’s own workplace for the future. Our strategy is to build an attractive workplace that enables greater flexibility and collaboration – a place that brings our people and our clients together in new creative ways.”
“We are very proud to be a part of what we know will become an iconic landmark for the City of Sydney.”

6 Advance
• Targeting a 20% reduction in embodied carbon, including a produce Life Cycle Assessment (LCA) for the top 20 building materials.
• Ultra low energy buildings designed to respond to their location and the environment.
• Specially designed façade system for the three towers involving bespoke fins on each aspect of the exterior will minimise glare and solar gain and reduce energy demand for cooling.
• The towers’ lift structures positioned outside the main core on the buildings’ northern facades to provide solar shields against heat gain from the midday sun.
• A chilled beam system for air-conditioning, with 100% fresh air to help combat worker sickness and absenteeism.
• Inspiring architecture designed to deliver healthy, light filled homes and workplaces.
Connectivity with the Sydney CBD Barangaroo will be fully integrated with Sydney’s CBD upon completion. As such, Barangaroo will connect with new and existing public transport infrastructure. Metropolitan Sydney has the highest public transport usage of any capital city in Australia1. The Australian Bureau of Statistics Census (2011) provides a breakdown of the method of travel to work to the Sydney Local Government Area (LGA), an area larger than the Sydney CBD. The extent of public transport usage would be even higher in the Sydney CBD.
Public transport is the primary mode of transportation for people working in the Sydney LGA (Figure 1). Almost 60% of workers in the Sydney LGA are using some form of public transport to arrive at their place of employment. The growth in inner city living has resulted in a higher proportion of workers walking (7.4%) or cycling (1.8%) to work than reported in the 2006 census.
It is worth noting that census night occurred in July – the middle of the southern hemisphere winter.
1 Australian Bureau of Statistics, ‘4102.0 – Australian Social Trends, 2008, Public Transport Use for Work and Study’.
As a result, the proportion of workers that walk or cycle is likely to be understated in comparison to the period between October and May. Building owners are adjusting to the evolution in travel methods. A number of tenants are placing greater emphasis on ‘end of trip facilities,’ including showers, lockers and bike racks in office buildings.
The proximity to key public transportation nodes is important for occupiers considering relocation to International Towers Sydney. The Barangaroo precinct is located on the Hickson Road / Sussex Street bus route and a short distance from the Wynyard Transport Hub (heavy rail and bus) which is a key component of the Sydney CBD public transportation network. At the moment, the ease of access between the Wynyard Transport Hub and the western CBD is inhibited by multiple road crossings and the steep gradient of the Sydney CBD between George Street and the western harbour.
The NSW state government approved Wynyard Walk is designed to provide a fully accessible pedestrian link from the Wynyard Transport Hub to the Barangaroo / Kings Street Wharf waterfront. Work has already commenced and is scheduled to complete by mid-2015. The Wynyard Walk, which is substantially undercover, will allow pedestrians
* Did not work is excluded from the analysisSource: Australian Bureau of Statistics, Jones Lang LaSalle
Figure 1: Method of travel to work, Sydney LGA, 2011 Census
0%
5%
10%
15%
20%
25%
30%
Train Car Bus PublicTransport / Car
Walked Transport Worked at Home
Others
28.2%26.4%
16.5%
7.6% 7.4%4.9%
1.9%
7.2%

International Towers Sydney: New development is shaping the future of Sydney as a global finance centre 7
to walk from the Wynyard Transport Hub to the western waterfront in approximately six minutes, avoiding steep inclines and road crossings.
In addition to the improved access Wynyard Walk will provide to heavy rail and bus routes, the NSW Government has proposed a new ferry terminal (two-three piers / four-six berths) for Barangaroo. This could supplement the existing terminals at King Street Wharf and Darling Harbour and would ease congestion at Circular Quay.
Overview of Sydney’s office stockThe Sydney CBD office market comprises 4.94 million sqm. The prime grade market accounts for 2.73 million sqm of space, while the secondary grade market is 2.21 million sqm.
Between 1970 and 2012, the office floor area of the Sydney CBD increased at an average rate of 2.3% per annum. The annualised growth rate is inflated by the construction booms of the mid-1970s and late-1980s. The majority of the Australian office markets experienced strong development activity between 2004 and 2008. However, the development cycle largely bypassed Sydney, and over the past ten years (2003–2012), the average annual growth rate of office floor area was 1.1% per annum.
Limited development activity is reflected by the age composition of office stock in the Sydney CBD office market. Sydney’s building stock is significantly older than other CBD office markets. Figure 2 shows the age cohort of office stock at ten yearly intervals. Approximately 12% of Sydney’s office stock is less than ten years old, while 46% of the stock is more than 30 years old, the highest proportion in any Australian CBD office market.
Increasingly, Sydney’s building stock represents the designs and characteristics of the 1980s, or earlier. Multinational companies are seeking space in prime buildings with large floor plates. Recent moves and pre-commitments made by firms in the F&I and Professional Services industry
sectors highlight a preference for product with floor plates in excess of 1,500 sqm. Increasingly this requirement is moving towards 2,000 sqm and above floor plates. A high proportion of the 2,000 sqm floor plate stock is located in the Western Corridor sub-market of the Sydney CBD.
Overall, there is a shortage of prime grade stock in the Sydney CBD with a typical floor plate in excess of 1,500 sqm. Approximately 37% of the prime grade stock in the Sydney CBD, in terms of NLA, has an average floor plate above 1,500 sqm (Figure 3). However, when this figure is analysed by the number of floors, which is a more relevant comparison, only 26% of the prime floors
Source: Jones Lang LaSalle
Figure 2: Age composition of stock in Australian CBD office markets
0%
10%
20%
30%
40%
Sydney Melbourne Brisbane Perth Adelaide
<10 Years 10 - 19 Years 20 - 29 Years 30 - 39 Years 40 Years+
Source: Jones Lang LaSalle
Figure 3: Sydney CBD prime stock by NLA
1,000 to 1,499 sqm51%
1,500 to 1,999 sqm27%
Greater than 2,000 sqm10%
Less than 1,000 sqm12%

8 Advance
in Sydney are above 1,500 sqm, and only 5% are above the 2,000 sqm threshold (Figure 4).
There is also demand for environmentally sustainable features with many tenants stipulating minimum Green Star and NABERS energy ratings in their market briefs. The introduction of Commercial Building Disclosure (1 November 2010) –ensures that credible and meaningful energy-efficiency information is given to prospective purchasers and lessees of large commercial office space (>2,000 sqm). The legislation has started to accelerate the obsolescence of older style buildings with poor sustainability credentials.
What are modern corporate occupiers looking for?Physical flexibilityThe shape, size and layout of a building’s floor plate contribute to occupier efficiencies. A rectangular design with a side core and column free floors allows for higher occupational densities and reduced circulation space.
Not all, but many tenants in excess of 3,000 to 4,000 sqm, are most efficient on floor plates of 1,500 sqm to 2,000 sqm, and above, for the following reasons:
• It creates a collaborative workplace that enables stronger relationship between specialist businesses.
• Large floor plates and shared spaces allows for greater connections between team members.
• Large and efficient floor plates provide flexibility in accommodating project space and adapting to changing space requirements.
• Interaction is enhanced by the centralisation of gathering points such as breakout lounges, kitchens and meeting rooms.
• Efficiency and productivity gains can ultimately lead to a cost saving on the overall tenancy.
• A more efficient balance is achieved between horizontal and vertical connectivity.
The preference shown by larger tenants for floor plates of 1,500 sqm and above is highlighted by
the breakdown of the Sydney CBD vacancy rate (Figure 5). The vacancy rate in the Sydney CBD for all building grades was 8.4% in 2012. This comprised a direct vacancy rate of 7.6% and sub-lease availability equating to 0.8% of stock.
However, for prime buildings with average floor plates in excess of 1,500 sqm the direct vacancy rate was 5.9%. In the 2,000 sqm size tenancy cohort of the market, the vacancy rate is approximately zero with only a small sub-lease available in one building. All of the current availability sits in the 1,500 to 1,999 sqm size tenancy cohort. The vacancy is a result of movements out of existing buildings to new
Source: Jones Lang LaSalle
Figure 4: Sydney CBD prime stock by number of floors
1,000 to 1,499 sqm57%
1,500 to 1,999 sqm21%
Greater than 2,000 sqm5%
Less than 1,000 sqm17%
Figure 5: Sydney CBD vacancy rates, prime (by floor plate size) and secondary grade, 2012
Source: Jones Lang LaSalle
0%
2%
4%
6%
8%
10%
12%
14%
Greater than
2,000 sqm
1,500 to1,999 sqm
1,000 to1,499 sqm
Less than1,000 sqm
B C D
Prime Secondary
Stock Vacant

International Towers Sydney: New development is shaping the future of Sydney as a global finance centre 9
developments, with floor plates in excess of 1,500 sqm, and uncommitted space in recently completed buildings.
A vacancy rate of 8.2% was recorded for stock with typical floor plates between 1,000 and 1,499 sqm and 12.1% for product with average floor plates below 1,000 sqm.
High technical specificationsA major consideration in any office set-up or relocation is the initial capital expenditure (CAPEX) cost involved in setting up premises. Modern buildings provide infrastructure such as water supply to each floor, knock out panels for internal staircases, heavy load areas for compact uses/safes (negating the need for weight spreading floors) and tenant-dedicated risers to allow cabling between floors. The move towards activity-based working has increased the importance of telecommunications infrastructure to support wireless technology.
This type of infrastructure will substantially reduce the upfront CAPEX costs, on-going occupancy costs and reinstatement costs at the end of the lease.
A workplace that assists in attracting and retaining staffPeople are very mobile in the Professional Services and F&I sectors. Therefore, employee satisfaction and retention, as well as the ability to attract workers, are important factors for large businesses.
Increasingly, a workplace should assist staff to manage a work-life balance. Facilities can include service retailing, bars, restaurants, entertainment, open spaces, gymnasiums and childcare.
In the Sydney LGA, approximately 60% of the CBD workers commute to and from work using some form of public transport. Proximity to the public transport network is, therefore, an important factor for most large businesses.
Space that assists in meeting corporate social responsibility targetsLarge multinational firms are committed to meeting and reporting on Corporate Social Responsibility (CSR) targets. As part of CSR, an overarching theme is to minimise a corporate carbon footprint, and in many instances, this is expressed through a desire or aim to be carbon neutral.
Improving the design and operation of building portfolios is a key part of the strategy adopted by businesses to reduce energy use and greenhouse emissions.
The McKinsey Quarterly2 concluded that ensuring the efficient operation of commercial buildings represents one of the lowest cost options for effectively reducing greenhouse gas emissions. As a perceived low-cost option, commercial property has been at the forefront of meeting the environmental component of CSR.
A number of firms are implementing performance contracts with facilities managers, including smart meters, which enable electricity usage to be monitored and improved, as well as efficiency audits.
A location that provides clustering benefits The NSW and Commonwealth Government continue to promote Sydney as a global financial centre and as a regional financial services hub. The Global Financial Centres Index, published by the Z/Yen Group, confirms this ambition, rating Sydney as an established transnational finance centre and the fifth most important finance centre in the Asia Pacific.
The Sydney CBD is recognised as the primary location for domestic and international financial services firms. NSW is the headquarters of the two largest domestic banks – Commonwealth Bank of Australia and Westpac Banking Corporation – by market capitalisation. According to data compiled
2 The McKinsey Quarterly, ‘How the world should invest in energy efficiency’ (July 2008).

10 Advance
Jones Lang LaSalle
Jones Lang LaSalle wanted to create a work environment that would enhance the experience for employees, providing them with a space that allowed them to collaborate, innovate and reach their full potential.
In February 2012 Jones Lang LaSalle moved into new premises and embraced a new workplace strategy that encompassed eight different work settings. These settings allowed employees to move between spaces for intense, focused work, to impromptu and informal space, to formal meeting depending on the activity they were undertaking.
In addition to the new workplace strategy, updated technology capabilities, reduced reliance on paper storage, and new sustainable workplace features, combined to create a more efficient and productive team. The new environment has helped Jones Lang LaSalle to attract and retain top talent, minimise staff turnover and drive improvements in people management strategies.
A new survey taken eight months after moving into 420 George Street showed that:
• 93% of staff strongly agreed or agreed that the workspace projected a progressive and positive brand image to visitors and employees.
• 87% of respondents strongly agreed or agreed that we have adequate meeting space that fosters collaboration.• 87% of Jones Lang LaSalle employees strongly agreed or agreed that the office design process at 420 George Street provides an
attractive environment to work in and contributes to the respondents’ productivity.• 81% of staff strongly agreed or agreed that the work environment enhanced their satisfaction as an employee of Jones Lang
LaSalle.• 81% of respondents strongly agreed or agreed that the activity based working model adopted provided the flexibility to support the
work that they undertake.• 71% of staff strongly agreed or agreed that the work environment at 420 George Street improved overall productivity.

International Towers Sydney: New development is shaping the future of Sydney as a global finance centre 11
by Bloomberg, these two banks are in the world’s top 12 banks by market capitalisation. NSW is also the headquarters of the eight foreign-owned subsidiary banks operating in Australia.
The economic benefits of clusters are well established. Firms gain from economies of agglomeration due to their proximity to other related firms, which allow face-to-face contact in business environments. The benefits include the following:
• Technology and Knowledge Spillovers – firms are more likely to learn from innovations of other firms if they are physically close to each other, and more so if the firms are from the same sector.
• Input Market Effects – there is a greater variety of inputs from suppliers where many firms are located close together, and competition between suppliers will exert downward pressure on prices.
• Labour Market Effects – when more firms are located together, suitably experienced and qualified workers target the area or country.
Economic clusters act as a comparative advantage for a city, country or region, and in part, offset the negative influences of higher labour costs, accommodation costs, transport costs and other price factors. There are indirect benefits to
the wider economy with increased competition between firms that are closely related. In short, competition drives down costs and improves productivity.
Productivity gains caused by proximity to other related firms differ by industry sector. In Figure 6, the elasticity shows the percentage change in the productivity of workers in each industry sector in response to a 1% increase in the effective density of employment3.
Professional Services and F&I are the two industry sectors which derive the greatest benefit from clustering. International Towers Sydney will integrate with the Sydney CBD and facilitate the agglomeration of the finance sector in Australia and support government policy to promote Sydney as a regional financial centre.
The long-term demand outlook for the Sydney CBD The Sydney CBD has experienced a patchy demand environment following the downturn of 2008 and 2009. Nevertheless, Jones Lang LaSalle has recorded 222,000 sqm of net absorption between 2Q09 and 4Q12 in the Sydney CBD. As a result, occupied stock in the Sydney CBD hit an all-time high of 4.52 million in 2012.
3 Daniel J Graham, ‘Wider Economic Benefits of Transport Improvements; Link Between Agglomeration and Productivity, Stage 2 Report’, report for the Department of Transport, 2006.
Figure 6: Elasticity of productivity by sector
Source: UK Department of Transport, Jones Lang LaSalle
0
0.05
0.1
0.15
0.2
0.25
0.3
0.35
Business&
managementconsultant
Finance & insurance
Advertising Real estate
IT services
Recruitment Publicadministration
and other
Economy as a
whole

12 Advance
The short-term demand outlook will be challenging in 2013 and 2014, with net absorption forecast to be significantly below trend. The Sydney CBD, however, is benefitting from tight conditions and a lack of development activity across the lower North Shore and Fringe office markets. The lack of contiguous options for larger space users has resulted in tenant centralisation and provides support to occupancy levels in the Sydney CBD.
The medium-term prognosis is stronger. NSW is the most populous state in Australia and the state’s economy produced AUD 446 billion in 2011-12, or about 31% of Australia’s GDP. The NSW economy is projected to grow by an average of 2.3% per annum between 2012 and 2014, before accelerating to 2.6% per annum between 2014 and 2017.
Sydney is the headquarters of corporate Australia. As such, Sydney is the finance and administrative heart of Australia. The market capitalisation of the Australian Stock Exchange is AUD 1,400 billion, making it the ninth largest stock exchange in the world. Approximately 36% of the companies listed on the S&P ASX 300 are headquartered in NSW (Figure 7).
The S&P ASX All Ordinaries Index has increased by 23% from May 2012 to mid-February 2013. Historically, there is a lag of between one and three years from movements in the All Ordinaries to net absorption in the Sydney CBD.
Corporate Australia has scaled back business investment spending plans over the past five years. Businesses, concerned about the revenue outlook, rationalised their cost base to maintain margins. With a renewed push towards productivity growth, businesses will allocate resources (capital and human) to business investment projects that deliver this productivity growth. Specifically, we expect to see a reactivation of IT infrastructure projects. As a result, the Professional Services sector will be the main driver of demand between 2012 and
4 Reserve Bank of Australia, Assets and Liabilities of Financial Institutions and Non-Financial Sectors, Table B1 – Assets of Financial Institutions. Reserve Bank assets included as total financial assets
2017, accounting for 70% of employment growth in the Sydney CBD. Depending on the workspace ratio adopted, the underlying demand for space in the Sydney CBD is between 232,300 sqm and 325,200 sqm over 2012 to 2017 (Table 1).
The finance and insurance sector will be below trend in the short-termBanking is the dominant sector of the Australian financial services industry, accounting for 61%4 of the total financial institutions assets as of
Table 1: Sydney CBD White Collar Employment & Implied Net Absorption2012 to 2017
Key Sectors Number of People
1:10 (sqm)
1:12 (sqm)
1:14 (sqm)
Professional Services
16,500 164,500 197,400 230,300
FIRE 4,000 39,900 47,900 55,900Information Services
-200 -1,600 -1,900 -2,200
Administration & Support Services
1,500 15,400 18,400 21,500
Public Administration
100 1,100 1,400 1,600
Others 1,300 12,900 15,500 18,100Total 23,200 232,300 278,800 325,200
Note: FIRE sector is Financial & Insurance Services & Real Estate ServicesSource: Jones Lang LaSalle Research, Deloitte Access Economics
Figure 7: Headquarters of S&P/ASX 300
Source: Standard & Poor’s, Australian Stock Exchange, Jones Lang LaSalle
Sydney Melbourne Brisbane Perth Adelaide Canberra Overseas0
20
40
60
80
100
120Number of Companies

International Towers Sydney: New development is shaping the future of Sydney as a global finance centre 13
September 2012. While the global banking climate is challenging, Australia has attracted new entrants. At the end of 2012, the CIMB Group launched investment banking operations in Australia following the acquisition of the Australian investment banking businesses of the Royal Bank of Scotland. CIMB has 145 employees in Sydney and Melbourne and will offer traditional investment banking advisory services, equity and capital market fund raising abilities, brokering services and research.
In the short-term, the F&I sector is adjusting to lower growth in its balance sheets and will look to improve productivity and return on equity before increasing headcount. F&I sector output growth is projected to average 2.4% per annum in 2013 and 2014, less than half the growth rate recorded between 2002 and 2012 (5.2% per annum). The level of F&I sector output has a contemporaneous impact on this sector’s employment level in the Sydney CBD (Figure 8). The lower growth outlook over the short-term will limit employment generation within the F&I sector. Based on our analysis of the Deloitte Access Economics white collar employment projections, the underlying demand for office space from the FIRE (F&I and Real Estate) sector ranges from 39,900 sqm to 55,900 sqm between 2012 and 2017.
There is longer-term growth potential in the financial services sectorFunds management and foreign exchange are expected to be growth engines for the financial services sector in NSW. Australia’s fund management sector has burgeoned since the nationally mandated retirement income scheme commenced in 1992. Australia has the fourth largest pool of investment fund assets in the world and the largest in Asia (ex-Japan). As a result of compulsory superannuation fund contributions, total consolidated funds under management grew to AUD 1.95 trillion in September 2012, up AUD 260.8 billion or 15.4% from three years earlier. Approximately 75% of the managed funds industry
Table 2: Global Pension Assets StudyCountry Total Assets (USD Billion) % GDP (local currency)Australia 1,555 101%Brazil 340 14%Canada 1,483 84%France 168 7%Germany 498 15%Hong Kong 104 40%Ireland 113 55%Japan 3,721 62%Netherlands 1,199 156%South Africa 252 64%Switzerland 732 118%UK 2,736 112%US 16,851 108%Total 29,754 78%
Notes:Assets/GDP ratio for the world is calculated in USD and assets were estimates as of 31 Dec 2012Brazil Pension Assets only include those from closed entitiesGermany only includes pension assets for company pension schemesSwitzerland only includes total of autonomous pension fundsSource: Tower Watson and secondary sources
is the institutional management of superannuation funds (Table 2).
Current government policy is for the compulsory superannuation levy on wages and salaries to increase in stages from 9% currently to 12% by 2020, further supporting the growth of superannuation funds under management.
Figure 8: Finance and insurance sector output and Sydney CBD finance and insurance white collar employment, 1993 to 2012
Source: Jones Lang LaSalle, Deloitte Access Economics
35,000
40,000
45,000
50,000
55,000
60,000
65,000
70,000
75,000
10,000 15,000 20,000 25,000 30,000 35,000 40,000
Sydney CBD F&I Sector Employment
F&I Sector Output
Lag in Employment Growth post the 1991 Recession
Asian Financial Crisis
Employment Rebound in mid 1990s
Lead up to Y2KTech-Wreck
Resource boom
GlobalFinancial Crisis
Below trend inthe short-term

Artist impression only
14 Advance
The IMF announced in late 2012 that the AUD, along with the CAD, would be included in the definition of reserve currencies. The AUD is no longer viewed as a high beta risk currency. The AUD is the fifth most traded currency in the world with the AUD/USD the fourth most traded currency pair.
Funds management is a long-term growth sector. A more significant contribution, however, may come from the increased export of financial services. In part, this will be fuelled by the regional ambitions of the big four commercial banks. As an illustration, ANZ is aiming to increase its share of profits from overseas markets by nine to 14 percentage points to 25-30% by 2017.
Australia is situated close to the fastest growing region in the world, Emerging Asia and China. In many countries within the region, growth in income and wealth, along with populations that are growing and ageing, will increasingly require the development of a wider range of financial services.
These include capital markets to help finance development, retirement income schemes as well as asset management and insurance products to provide wealth management and its protection.
In the Global Financial Centres Index (2012) sub-indices, Sydney already ranks amongst the top 10 financial centres in the world in the areas of professional services and insurance. In these areas, Sydney is well-positioned to capitalise on regional growth.
While the Asia Pacific has four finance centres ranked in the world’s top 10, the Global Financial Centres sub-indices show that the Asia Pacific is under-represented in the sectors of asset management and wealth management services. The provision of wealth management advisory services and asset management to the wider Asia Pacific region is a growth opportunity for the financial services sector in Sydney and the Asia Pacific more broadly.
Funds management operations are expanding in Sydney due to the following:
• Australia has the fourth-largest asset pool in the world.
• A mature and innovative funds management sector.
• A highly skilled and multilingual workforce.• Competitive costs.• A safe, low risk business and legal environment.• A world-class telecommunications infrastructure.• A time zone that spans the United States and
European markets.
Source: NSW Department of State and Regional Development, Jones Lang LaSalle
International Towers Sydney: New development is shaping the future of Sydney as a global finance centre 15
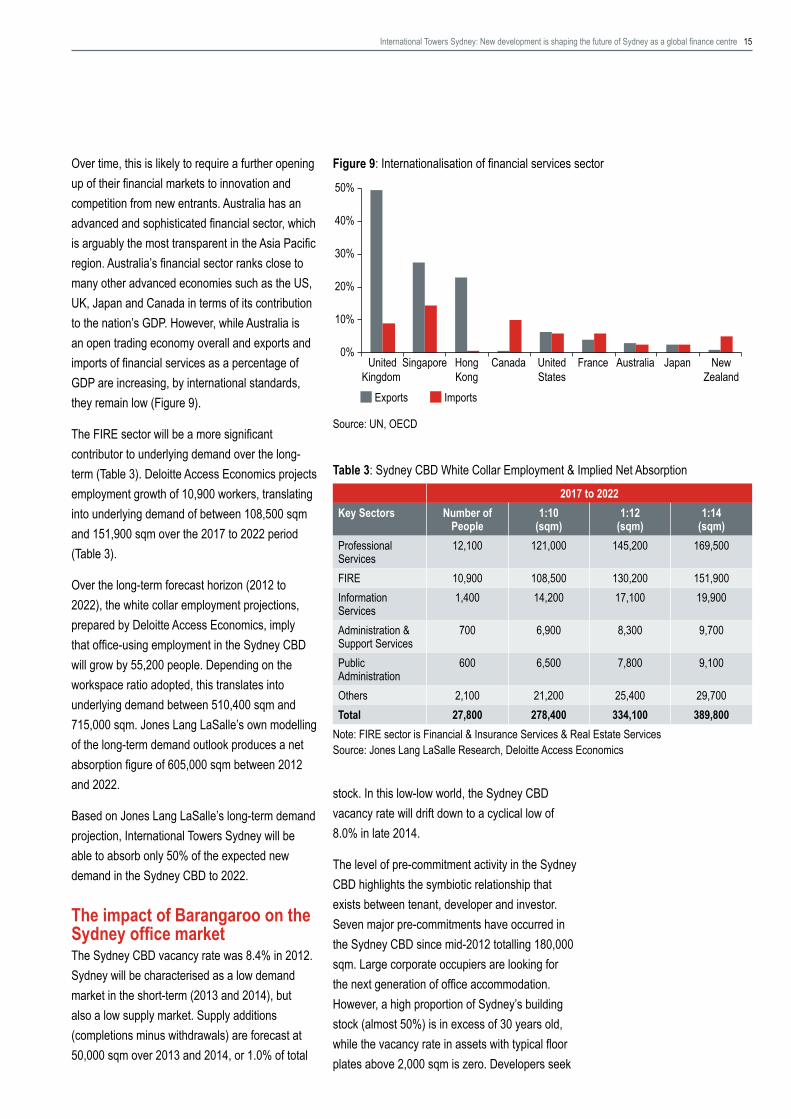
Over time, this is likely to require a further opening up of their financial markets to innovation and competition from new entrants. Australia has an advanced and sophisticated financial sector, which is arguably the most transparent in the Asia Pacific region. Australia’s financial sector ranks close to many other advanced economies such as the US, UK, Japan and Canada in terms of its contribution to the nation’s GDP. However, while Australia is an open trading economy overall and exports and imports of financial services as a percentage of GDP are increasing, by international standards, they remain low (Figure 9).
The FIRE sector will be a more significant contributor to underlying demand over the long-term (Table 3). Deloitte Access Economics projects employment growth of 10,900 workers, translating into underlying demand of between 108,500 sqm and 151,900 sqm over the 2017 to 2022 period (Table 3).
Over the long-term forecast horizon (2012 to 2022), the white collar employment projections, prepared by Deloitte Access Economics, imply that office-using employment in the Sydney CBD will grow by 55,200 people. Depending on the workspace ratio adopted, this translates into underlying demand between 510,400 sqm and 715,000 sqm. Jones Lang LaSalle’s own modelling of the long-term demand outlook produces a net absorption figure of 605,000 sqm between 2012 and 2022.
Based on Jones Lang LaSalle’s long-term demand projection, International Towers Sydney will be able to absorb only 50% of the expected new demand in the Sydney CBD to 2022.
The impact of Barangaroo on the Sydney office marketThe Sydney CBD vacancy rate was 8.4% in 2012. Sydney will be characterised as a low demand market in the short-term (2013 and 2014), but also a low supply market. Supply additions (completions minus withdrawals) are forecast at 50,000 sqm over 2013 and 2014, or 1.0% of total
stock. In this low-low world, the Sydney CBD vacancy rate will drift down to a cyclical low of 8.0% in late 2014.
The level of pre-commitment activity in the Sydney CBD highlights the symbiotic relationship that exists between tenant, developer and investor. Seven major pre-commitments have occurred in the Sydney CBD since mid-2012 totalling 180,000 sqm. Large corporate occupiers are looking for the next generation of office accommodation. However, a high proportion of Sydney’s building stock (almost 50%) is in excess of 30 years old, while the vacancy rate in assets with typical floor plates above 2,000 sqm is zero. Developers seek
Table 3: Sydney CBD White Collar Employment & Implied Net Absorption2017 to 2022
Key Sectors Number of People
1:10 (sqm)
1:12 (sqm)
1:14 (sqm)
Professional Services
12,100 121,000 145,200 169,500
FIRE 10,900 108,500 130,200 151,900Information Services
1,400 14,200 17,100 19,900
Administration & Support Services
700 6,900 8,300 9,700
Public Administration
600 6,500 7,800 9,100
Others 2,100 21,200 25,400 29,700Total 27,800 278,400 334,100 389,800
Note: FIRE sector is Financial & Insurance Services & Real Estate ServicesSource: Jones Lang LaSalle Research, Deloitte Access Economics
Figure 9: Internationalisation of financial services sector
Source: UN, OECD
0%
10%
20%
30%
40%
50%
UnitedKingdom
Singapore HongKong
Canada UnitedStates
France Australia Japan NewZealand
Exports Imports

16 Advance
to secure pre-commitments to underwrite future earnings, while investor demand is strong for the long-dated leases that are offered through development stock.
Completions in the Sydney CBD over 2015 and 2016 are expected to be above the historical (40-year) average of 119,300 sqm per annum. In addition to the pre-commitments made by the Westpac Banking Corporation, KPMG and Lend Lease to International Towers Sydney, Ashurst has pre-committed to the redevelopment and extension of 5 Martin Place (33,000 sqm), Ernst & Young will be the anchor tenant for 200 George Street (40,000 sqm), while Macquarie acquired 48-50 Martin Place (19,000 sqm) and will occupy the building after undertaking a substantial refurbishment.
The delivery of these new developments will occur at a time when the NSW economy is expected to be stronger. White collar employment growth is projected to average 2.8% per annum between 2013 and 2016 (Figure 10).
There is a misconception that completions equal supply in office markets. In Figure 10, Jones Lang LaSalle showed the outlook for completions between 2013 and 2018. The Westpac Banking Corporation consolidation out of nine sites across the CBD and into Tower 2 International Towers Sydney will create backfill space in the Sydney CBD. However, a significant proportion of this backfill space including: 60 Martin Place (28,385 sqm), 82 George Street (14,460 sqm) and 33-35 Pitt Street (13,525 sqm) is expected to be withdrawn.
Furthermore, there is competition for sites in the Sydney CBD for alternative uses. The residential population of the City of Sydney LGA has increased by 17,900 people or 9.8% over the five years to 2011. The City of Sydney commissioned ID Consulting to prepare long-term population projections for the LGA. Between 2011 and 2021, the resident population of the City of Sydney is projected to grow by 42,700 residents or 23%. The City of Sydney has a higher proportion of single
person households than metropolitan Sydney. As a result, the household formation size is significantly smaller. Assuming a ratio of 1.2 residents per dwelling, there is an underlying demand of 35,600 units in the City of Sydney LGA to 2021.
A number of existing buildings have already been mooted as residential conversions, including Goldfields House at 1 Alfred Street and 50-54 Park Street. A number of assets in close proximity to Hyde Park with low floorspace ratios will also be candidates for conversion to residential.
Withdrawals in the Sydney CBD averaged 1.44% of stock per annum between 1990 and 2012 (Figure 11). A high proportion of the stock was refurbished and delivered back to the market as
Figure 10: Sydney CBD Completions & White Collar Employment
Source: Jones Lang LaSalle, Deloitte Access Economics
0
50,000
100,000
150,000
200,000
250,000
300,000
350,000Sqm
-4%
-2%
0%
2%
4%
6%
8%Y/Y, % Change
Completions White Collar Employment (RHS)80 82 84 86 88 90 92 94 96 98 00 02 04 06 08 10 12 14 16 18
Figure 11: Sydney CBD Completions & Withdrawals
Source: Jones Lang LaSalle
Sqm
-200,000
-100,000
0
100,000
200,000
300,000
400,000
Withdrawals Completions72 76 80 84 88 92 96 00 04 08 12 16
Artist impression only
International Towers Sydney: New development is shaping the future of Sydney as a global finance centre 17
conventional office space. However, as mentioned earlier, Sydney has a high proportion of stock in excess of 30 years old, while the competition for alternative uses is stronger than at any stage since the early 1900s. Assuming 12.5% of the stock in excess of 30 years old is removed from the market over the next 10 years, the figure equates to 300,000 sqm – approximately the same size as the NLA of the International Towers Sydney.
At a minimum, the Sydney CBD requires an additional 605,000 sqm of space over the next 10 years to meet the net absorption forecast to 2022 and maintain an equilibrium vacancy rate of 8.4%. In reality, older style buildings are likely to be withdrawn or converted, so the additional supply will have to be significantly higher than the underlying demand of 605,000 sqm.
Assessing the scale of BarangarooBarangaroo has been inaccurately referred to as Sydney’s equivalent to Melbourne’s Docklands. While there are similarities in the type of product to be delivered to meet the evolving requirements of corporate tenants, Barangaroo is expected to deliver 300,000 sqm of commercial office space compared with 920,000 sqm in Melbourne’s
Table 4: Supply Potential at Barangaroo and Docklands Relative to Existing CBDMarket Total Stock Size of Urban
Renewal ProjectPercentage of Existing Stock
Sydney CBD 5.0 mn sqm (2014 estimate)
300,000 sqm 6%
Melbourne CBD 3.4 mn sqm (2003)
925,000 sqm 27%
Source: Jones Lang LaSalle Research, Lend Lease, VicUrban
Docklands. Table 4 shows that the development potential in Barangaroo equates to 6% of the Sydney CBD office market, based on an estimate of 2013 stock levels, compared with 27% for Melbourne’s Docklands in 2003, prior to the first completion in 2004. Therefore, the impact on rental levels and vacancy rates in the Sydney CBD from the increased supply will be limited.
ConclusionThe Sydney CBD has a vacancy rate of 8.4%. In the low growth / low supply world of 2013 and 2014, the vacancy rate is projected to reach a cyclical low of 8.0% by late 2014. It is important to note that the overall market vacancy rate has little relevance to large space users. Sydney’s building stock is ageing and almost 50% is in excess of 30 years old. Furthermore, there are limited contiguous options in buildings with typical floor plates above 1,500 sqm and the vacancy rate in

18 Advance
established transnational finance centre and ranks in the Global Financial Centres Index top 10 in the sub-sectors of professional services and insurance. While the Asia Pacific region has four cities in the top 10 global financial centres, the region is under-represented in the sectors of wealth management and asset management. The demand for these products and services will grow as Asia’s middle class expands and the population ages. Australia has significant expertise in this sector, with the fourth largest pool of investment funds assets in the world, and is well positioned to export these services to the region.
Jones Lang LaSalle believes new development activity is having a positive impact on the Sydney CBD office market and the city’s profile as a major financial centre in the Asia Pacific region. New development is regenerating Sydney’s stock and allowing businesses to achieve the efficiencies and productivity gains associated with new space.
Jones Lang LaSalle projects that the Sydney CBD requires at least an additional 605,000 sqm of space over the next 10 years to meet the net absorption forecast. International Towers Sydney only has the capacity to meet 50% of this underlying demand between 2012 and 2022.
assets with typical floor plates in excess of 2,000 sqm is essentially zero.
As a result, tenant demand for the next generation of office accommodation is being expressed through pre-commitment. Westpac, KPMG and Lend Lease have all pre-committed to International Towers Sydney. Other developments at 200 George Street, 5 Martin Place, 48-50 Martin Place and 180 Thomas Street have all secured pre-commitment since mid-2012.
While a number of large users have pre-committed to development stock, the demand environment in the 500 to 3,000 sqm size tenancy cohort is challenging. The medium to long-term prognosis is stronger. The rise of the S&P/ASX All Ordinaries between May 2012 and February 2013 is positive for Sydney. Movements in the share market have been a lead indicator of net absorption in the Sydney CBD with a one to three year lag. Capital expenditure in the non-mining sectors of the economy has been weak over the past five years. Corporate Australia will look to reactivate business investment projects to support productivity growth, under-pinning the demand for Professional Services workers.
In the long-term, the F&I sector will be a more significant contributor to growth. Sydney is an
Artist impression only

Tim O’Connor Head of Office Leasing – NSW +61 2 9220 8680
Tim is the Head of Office Leasing for NSW at Jones Lang LaSalle and works with an integrated team that specialise in the marketing and leasing of commercial property across metropolitan Sydney. Tim has over 18 years’ experience in office leasing since starting his career in Sydney. In 2001, Tim relocated to Hong Kong, before moving to Shanghai in 2006. During his time in Asia, Tim gained extensive experience in all aspects of project leasing large scale commercial assets from development and marketing consultancy through to transacting with multinational occupiers. Clients represented included: Sun Hung Kai Properties, Wharf Henderson Land, AIG Global Real Estate, CapitaLand, Swire Properties, GIC Real Estate and Merrill Lynch. Tim returned to Australia in 2010 and his current appointments include: International Towers Sydney, 1 Bligh Street and 52 Martin Place.
Andrew Ballantyne Head of Capital Markets Research – Australia +61 2 9220 8412
Andrew is the Head of Capital Markets Research at Jones Lang LaSalle. He has over 12 years’ experience in industry research in the commercial and residential property, as well as the transportation and logistics sectors. A well-respected industry commentator, Andrew is regularly quoted in the national press and property journals. He is responsible for the production of thought leadership papers, the office market research portfolio and management of the overall Strategic Research team. Andrew holds an MA in Applied Research and BA (Hons) in Business Economics.
Authors
www.internationaltowerssydney.com

COPYRIGHT © JONES LANG LASALLE 2013 All rights reserved. No part of this publication may be published without prior written permission from Jones Lang LaSalle. The information in this publication should be regarded solely as a general guide. Whilst care has been taken in its preparation no representation is made or responsibility accepted for the accuracy of the whole or any part. We stress that forecasting is a problematical exercise which at best should be regarded as an indicative assessment of possibilities rather than absolute certainties. The process of making forward projections involves assumptions regarding numerous variables which are acutely sensitive to changing conditions, variations in any one of which may significantly affect the outcome, and we draw your attention to this factor.
www.joneslanglasalle.com.au
Adelaide Level 22, Grenfell Centre 25 Grenfell Street Adelaide SA 5000 tel +61 8 8233 8888
BrisbaneLevel 33, Central Plaza One 345 Queen Street Brisbane QLD 4000 tel +61 7 3231 1311
CanberraLevel 7, 121 Marcus Clarke Street Canberra, ACT, 2601 tel +61 2 6274 9888
Glen WaverleyBuilding 2 540 Springvale Road Glen Waverley VIC 3150 tel +61 3 9565 6666
MascotLevel 3, Sydney Airport Centre 15 Bourke Road Mascot, NSW, 2020 tel +61 2 9693 9800
MelbourneLevel 21, Bourke Place 600 Bourke Street Melbourne VIC 3000 tel +61 3 9672 6666
North SydneyLevel 27, North Point 100 Miller Street North Sydney NSW 2060 tel +61 2 9936 5888
ParramattaLevel 8, 79 George Street Parramatta NSW 2150 tel +61 2 9806 2800
PerthLevel 29, Central Park 152-158 St Georges Terrace Perth WA 6000 tel +61 8 9322 5111
SydneyLevel 25, 420 George Street Sydney NSW 2000 tel +61 2 9220 8500