Embed Size (px)
Citation preview
1
International Technology Alliances, Technology-based M&As, and the Innovative Performance of EU and non-
EU Firms*
Rene Belderbosa,b,c Ibrahim Bolata
Jojo Jacoba
Boris Lokshina,c
Preliminary version
a UNU-MERIT, Keizer Karelplein 19, 6211 TC Maastricht, The Netherlands b Department of Managerial Economics, Strategy and Innovation, Katholieke Universiteit Leuven, Naamsestraat 69, B-3000, Leuven, Belgium c School of Business and Economics, Maastricht University, Maastricht, The Netherlands *This paper draws on a report prepared for the “FP7 GlobInn Project“ Acknowledgements We thank Pari Patel and other participants of the GlobInn workshop at Bocconi University, Milan, October 2010 for helpful comments.
2
ABSTRACT
In this paper we examine to what extent strategic technology alliances and technology-based
mergers and acquisition (M&As) improve the innovative performance of firms. We analyze
the innovative performance (patent applications) of 104 EU firms that are leading in EU
manufacturing and services industries between 2001 and 2007, and compare this to the
performance of a sample (61) of non-EU firms with a strong presence in the EU. Results of
fixed effects panel data analysis suggest that both technology alliances and technology based
M&As can improve innovative performance. The empirical results, however, show marked
differences between the effects of the two sourcing modes for EU and non-EU firms, and
important differences with respect to the location of the partner or target firm. Overall,
technology alliances improve innovative performance with the strongest effects observed for
alliances with EU firms. Technology based M&As with EU targets have a positive impact, but
in contrast, M&As with non-EU targets reduce innovative performance. Similarly, alliances
with firms based in emerging economies reduce, rather than increase, innovative performance.
1. INTRODUCTION
Globalization and the increasing intensity of product market competition are increasingly
driving firms to develop competitive strength through the development and utilization of
technological assets. As internal sources of technology development are often insufficient to
cope with complex and uncertain technological developments, external knowledge acquisition
has become a cornerstone of many firms’ R&D strategies. The need for broader development
of technology assets and broader search for sources of new technology has been accompanied
by an increasing internationalization of R&D and external knowledge acquisition (e.g.
Archibugi and Michie, 1995; OECD, 2007, Patel and Pavitt, 1992). Foreign R&D to create
new technologies is part of the response, as firms need to get access to centers of excellence in
scientific and technological development as well as to pools of talented scientists and
engineers at lower costs. One way to build up an international R&D presence and to tap into
technological knowledge abroad is through high tech cross-border acquisitions and
collaborative modes of international R&D.
In this paper, we examine to what extent strategic technology alliances and technology-based
mergers and acquisition help improve the innovative performance of firms. We consider
M&As and alliances as part of a broad portfolio of technology sourcing mechanisms and
3
focus on effect of the geographic scope of M&A and alliance activity, in particular their
international character. While there is an abundant literature on the performance effects of
alliances (e.g. de Man and Duysters, 2005; Lavie, 2007; Gulati, 1999) and M&As (e.g. Ahuja
and Katila, 2001; Grimpe, 2007; Bertrand and Zuniga, 2005), very little attention has been
given to their joint effects on performance. We examine to what extent these two modes of
(international) technology sourcing are complements or substitutes, and which strategy has the
largest comparative impact on performance.
Empirically, we analyze the innovative performance (patent applications) of 104 EU firms
leading in European manufacturing and services industries between 2001 and 2007, and
compare this to the performance of a sample of (61) non-EU firms that are leading firms in
Europe. We examine the impact of strategic technology alliances and technology-based
M&As in fixed effects panel data models, controlling for various other firm specific
characteristics affecting performance.
The remainder of this paper is organized as follows. In Section 2, we detail the theoretical
background and prior studies on innovative performance and the role of technology alliances
and technology based M&As. In section 3, we describe the database, and in section 4, we
present the key data on alliances and M&As. In section 4, we define the variables and
empirical model and section five presents the empirical results. We conclude in Section 6.
2. BACKGROUND: TECHNOLOGY ALLIANCES, TECHNOLOGY-BA SED M&As,
AND INNOVATION
External sourcing of technology has been the subject of a large and growing body of research.
While the mechanisms of technological sourcing are varied, those that are most frequently
examined and used are strategic alliances and M&As. We can discern three broad categories
of studies. One set of studies examine the factors that shape the choice between M&As and
alliances, as they entail varying degrees of financial commitment, control and flexibility. Two
other strands of literature focus on the effectiveness of one of the two external technology-
sourcing mechanisms -alliances or M&As- in enhancing innovative performance. A fourth
subset of studies that is relevant here gives specific attention to the difficulties in managing a
4
diverse portfolio of alliances. Prior studies have not examined the joint performance effects of
technology sourcing strategies combining M&As and technology alliances - the subject of the
current paper. Based on the extant research we formulate a number of research questions that
we attempt to answer in the empirical analysis. We pay particular attention to the geographic
(international or national) dimension of alliances and M&As -the focal characteristic of
technology sourcing strategies in this paper.
The choice between M&As and Alliances
In the literature on external technological sourcing, one major strand has focused on the
factors shaping the choice between alliances and M&As (Hagedoorn and Duysters, 2002a;
Vanhaverbeke et al., 2002; Villalonga and Macgahan, 2005; Carayannopoulos and Auster,
2010). The main conclusions emanating from this literature is that the flexibility and limited
financial commitment of alliances are particularly preferred under circumstances of
technological and market uncertainty. Hagedoorn and Duysters (2002a) find that firms prefer
M&As for their core businesses, while they demonstrate a higher preference for alliances in
their other businesses where they lack key competitive advantages. The size of the target firms
has also been found to be of importance. Given that large target firms are rather difficult to
'digest' and integrate and diseconomies of scale and scope may arise when a company acquires
more knowledge than what is desirable, alliances may be more effective (Hennart, 1991;
Hennart and Reddy, 1997). On the other hand, alliances are found to be less effective in the
sourcing of complex knowledge because access to complex knowledge requires access to a
variety of knowledge elements (Carayannopoulos and Auster, 2010). Alliances limit the
interaction to specific segments of the organization, and hence do not ensure a broad access
that will ensure the transmission of complex knowledge.
Only a handful of studies have paid attention to the role that differences in the geographic
dimension (nationalities of partners or targets) play in shaping the choice between alliances
and M&As, with mixed findings. Vanhaverbeke, et al (2002) in their study of the application-
specific integrated circuits industry find that international technology activity is more likely to
be a strategic alliance rather than an M&A. In a similar vein, Kogut and Singh (1988) observe
that when the home country of firms entering the United States is culturally distant from the
United States, joint ventures are preferred to M&A. The common explanation is that
international and cultural differences make M&As a more cumbersome technology sourcing
mode (Kogut, 1988; Mowery et al, 1996), as M&A requires the complete integration of the
5
two firms’ knowledge bases. For firms with different corporate cultures this is likely to be
more difficult given that a substantial amount of learning routines lose their purpose after
M&A (Barney 1999). Cultural differences also reduce the ability of managers to absorb each
other's knowledge (Madhok 1996), thereby increasing the cost of learning. In addition, large
differences in corporate (R&D) practices might increase the chances of key researchers
leaving the acquired firm or reducing their efforts (Ernst and Vitt, 2000). In such
circumstances, alliances offer greater flexibility to the firm in that it can ‘cherry pick’ the
most desired knowledge available from a partner (de Man and Duysters, 2005). In some
contrast, Gulati (1995) finds that international alliances are more likely to be of the equity-
form than of the more flexible non-equity based form, compared with national alliances. The
argument is that governance modes that yield greater control can be preferred when firms
have not built enough trust with their partners and trust is likely to exist less among firms in
different countries.
6
M&As and Innovative Performance
On the contribution of M&As to innovative performance, many prior studies have found the
effect of M&As to be either neutral or negative (for a review, see de Man and Duysters,
2005).1 The literature has suggested that owing to divergent management practices integrating
newly acquired business units with the existing ones can lead to efficiency losses, and that
many M&As decisions may be driven by the pursuit of managerial objectives and the
availability of excess cash flow rather than by the pursuit of efficiency (Caves, 1989;
Ravenscraft and Scherer, 1989).
Recent research however provides a more nuanced view: while M&As that are not
technological in nature have a negative impact on innovative performance, technology
motivated M&As are found to have positive performance consequences (Ahuja and Katila,
2001; Cloodt, et al. 2006). In other words, only acquisitions that provide technological inputs
should be expected to improve the innovative performance of the combined firm. The
international dimension of M&A activity is more often than not found to be a positive
moderator, perhaps because the variety in knowledge ensures the greatest complementarity in
technology development and ideas. Ahuja and Katila (2001) find that cultural differences do
not lead to any post-acquisition conflicts, and may even have a positive effect on innovative
performance; the latter findings is confirmed by the replication study of Cloodt, et al (2006).
Hagedoorn and Duysters (2002b) similarly find that firms with a focus on international
M&As improve their technological performance relatively more.
A limited number of studies have looked into the reorganization of R&D activities in the
acquiring and target firm after M&As. Hall (1999) finds that acquiring firms experienced a
significantly greater increase in R&D intensity and growth in total factor productivity post
merger compared to firms that did not engage in M&As. Firms with a high probability of
acquiring were much larger than other firms and had lower R&D intensities and higher
Tobin’s Q. These results might suggest that acquisition would have a positive performance
effect only when it generates economies of scale in R&D, and the acquirer does not have to
divert its R&D budget to service any debt associated with the acquisition (c.f. Baysinger and
Hoskisson, 1989). Bertrand (2009) in a study of acquisitions of French firms by foreign firms
finds that R&D in the foreign target firm tends to increase.post-acquisition if the target
1 Early research into the performance effect of M&As focused mainly on financial performance (for a review see,
Caves, 1989; Hagedoorn and Schakenraad, 1994).
7
continues to operate separately and is not fully integrated. This suggests that technology-
based M&As may be an instrument to redefine the organization of a firm’s R&D and may
lead to greater specialization in specific technology fields. This may be suggestive of
increasing regional knowledge specialization through M&As.
Alliances and Innovative Performance
Compared to the innovative contribution of M&As, the performance consequences of
technology alliances has been the subject of much more extensive research and the evidence
has been much less ambiguous. The greater majority of studies has found that technology
alliances have a positive influence on innovative performance (e.g. DeMan and Duysters,
2003; Nooteboom, 1992; Anand and Khanna, 2000; Baum et al., 2000; Owen-Smith and
Powell, 2004). Much of the more recent research has focused on the properties of the broader
alliance network of firms and the position that firms take in this network (Rowley, et al, 2000;
Gilsing et al, 2008). Surprisingly, the contribution of engaging in international alliances to
innovative performance has received only scant scrutiny. The few studies that have paid
attention to the international dimension have suggested that international alliances can serve a
"radar function" by linking firms to diverse partners and accessing novel information in a
world that is dynamic and not very transparent (Duysters and Lokshin, 2007). For example,
Duysters and Lokshin (2007) find that innovative firms are more likely to possess a broader
portfolio of international alliances than non-innovators or imitators. The study by Lavie and
Miller (2008) lends further support for this argument. Their results show that moderate levels
of international partner diversity (measured as a composite of several national-level
differences like geographical, cultural, institutional and economic diversities) contribute to
improved (financial) performance. They argue that when the international diversity of partners
is neither too low nor too high, firms are able to understand partners’ background and
accordingly adopt collaborative routines that are effective in bridging national differences.
Complexity of Alliance Portfolios and Innovative Performance
The alliance literature has paid attention to the fact that difficulties in managing alliances can
weaken the innovative process associated with alliances. Early research in this area, primarily
at the dyadic level (individual alliances), has claimed that managerial complexity, difficulty in
coordination of alliance activities and lining up of alliance operations with the strategic goals
of partners generally undermine alliance performance (Park and Ungson, 2001). Task
complexity, resulting from the increasing scope of activities undertaken within an alliance and
8
organizational complexity resulting from the increase in the number of partners will have
negative consequences for alliance performance (Killing, 1988). In addition, Robson et al.,
(2008) conclude that organizational complexity which arises due to physical, cultural and
institutional differences between partners weakens the beneficial effect of trust in cross-border
strategic alliances resulting in such negative consequence as lack of coordination of the
various endowments in alliances, which leads to sub-optimal performance. Scope
complexities will increase the probability of the termination outcome in the alliance because
of greater uncertainty regarding the performance of individual tasks and the coordination of
tasks and contractual hazards (Reuer and Zollo 2005, Oxley and Sampson 2004).
Increasingly, the alliance literature is adopting a portfolio approach to analyze the effect of
alliances on firms’ performance. This approach is to a large extent motivated by the
recognition that firms are ever more involved in various strategic alliances with heterogeneous
partners at the same time (Gulati and Singh 1998, Hoffmann, 2007; Wassmer 2008, Ozcan
and Eisenhardt 2009). Complexity issues identified at the dyadic level have their
repercussions for firms that have sizable alliance portfolios and therefore have to deal
simultaneously with various partner types who often exhibit conflicting alliance objectives.
Consequently, alliance scholars have examined the evolution of diverse and complex alliance
portfolios (Ozcan and Eisenhardt, 2009); the strategies that firms employ in order to deal with
greater diversity and the resulting complexity in alliance portfolios, and the optimal
configuration of a portfolio (Bamford and Ernst, 2002; Heimeriks and Duysters, 2007;
Heimeriks et al. 2009; Hoffmann, 2005; 2007; Marino et al. 2002; Vassolo et al, 2004); and
the contribution of complex alliance portfolios to firms’ performance. On the last topic,
studies have confirmed that firms which possess heterogeneous alliance portfolios tend to be
more innovative (Duysters and Lokshin, 2007; Sampson, 2007) and generate better financial
performance (Baum et al. 2000; Lavie, 2007; Lavie and Miller, 2008; Ozkan and Overby,
2009.
On the other hand, if alliances cover similar technologies and there is redundancy in the
alliance portfolio, performance may be negatively affected, and more cessations are observed
(Vassolo et al, 2004). In addition, as the complexity of managing a heterogeneous portfolio of
alliances increases, coordination among alliances and effective allocation of resources
becomes challenging (Hoffmann 2005, 2007; Gulati, 1998, Hoang and Rothaermel, 2005).
Management of conflicting demands of multiple and heterogeneous partners as well as
9
monitoring and controlling of the performance of a large-scope portfolio may make alliance
activity less effective (Gomes-Casseres, 1996; Medcof, 1997; Gemünden and Ritter 1997,
Bamford and Ernst 2002). This may leave the firm with a reduced ability to appropriate the
innovative potential from its technology-sourcing portfolio (Bolton and Dewatripont, 1994).
Combinations of R&D alliances with varied objectives and partners (e.g. a public research
institutions and suppliers), each requiring R&D allocation and management attention, have
been found to be detrimental to productivity (Belderbos, et al. 2006).
Obviously, the level of complexity and its associated cost are likely to be even higher when
firms simultaneously engage in M&A activity while maintaining sizable alliance portfolios.
Effective integration of (sizeable) of targets demands substantial management attention and
reorganization of the R&D activities. The management of the technology alliance portfolio
also requires substantial managerial oversight, and redundancies with the knowledge base of
the partner (target) have to be addressed. From the perspective of international knowledge
sourcing and the importance of diversity, redundancies may result when a firm engages in
M&As (alliances) in a given geographic region when it already has many alliances (M&As) in
that region. Redundant knowledge may thus add to the problems of monitoring and
coordination characteristic of complex technology sourcing portfolios.
Present study
The review above suggests that the extant literature has primarily investigated the effect of a
single technology sourcing strategy, either technology alliances or technology-based M&As
on firm performance. However, firms in practice choose to pursue external technology
sourcing strategies that combine M&As and alliances. Surprisingly, the question of which
technology-sourcing strategy has a larger impact on firm innovative performance and whether
a strategy pursuing both types of technology souring is superior to a single sourcing strategy
has not received attention in prior studies. In this paper, we examine the effect of such joint
M&A and alliance strategies, with a focus on geographic diversity and potential redundancy.
Drawing on prior studies, we may expect that international knowledge sourcing is more
effective if it takes the form of alliances. Partners from different countries are likely to be
relatively unfamiliar with each other and each other’s external environment. In such a context,
alliances are likely to be the most efficient mechanism for joint technology development and
transfer of knowledge. M&As on the other hand are most likely to be effective if they involve
10
national external technology sourcing activities and national partners or targets. This is
because M&As ensure the broadest possible transfer of knowledge, while familiarity among
partners suggests that learning costs are likely to be small.
Given the international scope of firms’ technological sourcing strategies, and given the
international variability in the effectiveness of different modes, firms with partners from
diverse countries will have a portfolio of governance modes. However, the literature on the
complexity of alliance portfolios indicates that a complex portfolio presents itself with
challenges and that redundancies may occur when two technology sourcing strategies target
the same knowledge base.
Against this background, the present study aims to answer the following questions. Are
alliances more effective when partners are international? Are M&As more effective when
they are made within the focal firm’s country or region? Do alliances and M&As in the same
region contribute to knowledge redundancies and hence to sub-optimal innovative
performance, or is there a complementarity in innovation performance between M&A and
alliance strategies? Does the combination of large numbers of alliances and M&As increase
complexity of the technology-sourcing portfolio to such extent that it has an adverse impact
on firm’s innovative performance? We examine this by analyzing the joint effects of M&A
and alliance activity of leading firms in EU industries and by differentiating technology
sourcing strategies targeting intra-country, EU, non-EU, developed country, and emerging
economy partners.
3. DATA
Database and selection of firms
We constructed a dataset including the leading firms in a broad spectrum of 65 European
manufacturing and a few selected (telecommunications, IT services, retailing) services
industries. Firms were selected based on their manufacturing volume or services presence in
the EU in 2007 and could be headquartered in the EU or elsewhere. The top 5 firms by size in
their sectors were selected. For these firms we collected data on patent applications with the
European Patent Office (as a measure of innovative performance), information on technology
alliances and M&As, and financial indicators such as R&D expenditures. In total 104 EU-
11
headquartered firms and 61 non-EU firms were identified as leading firms with available
information on patent activity and R&D. 2
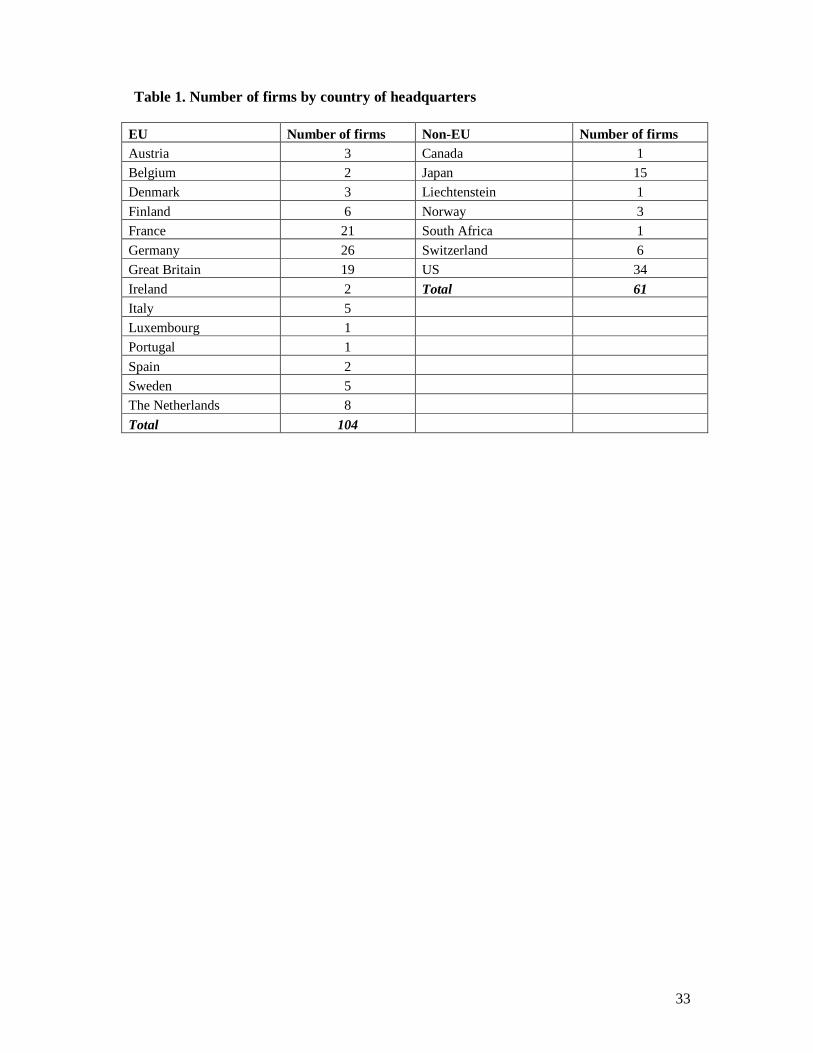
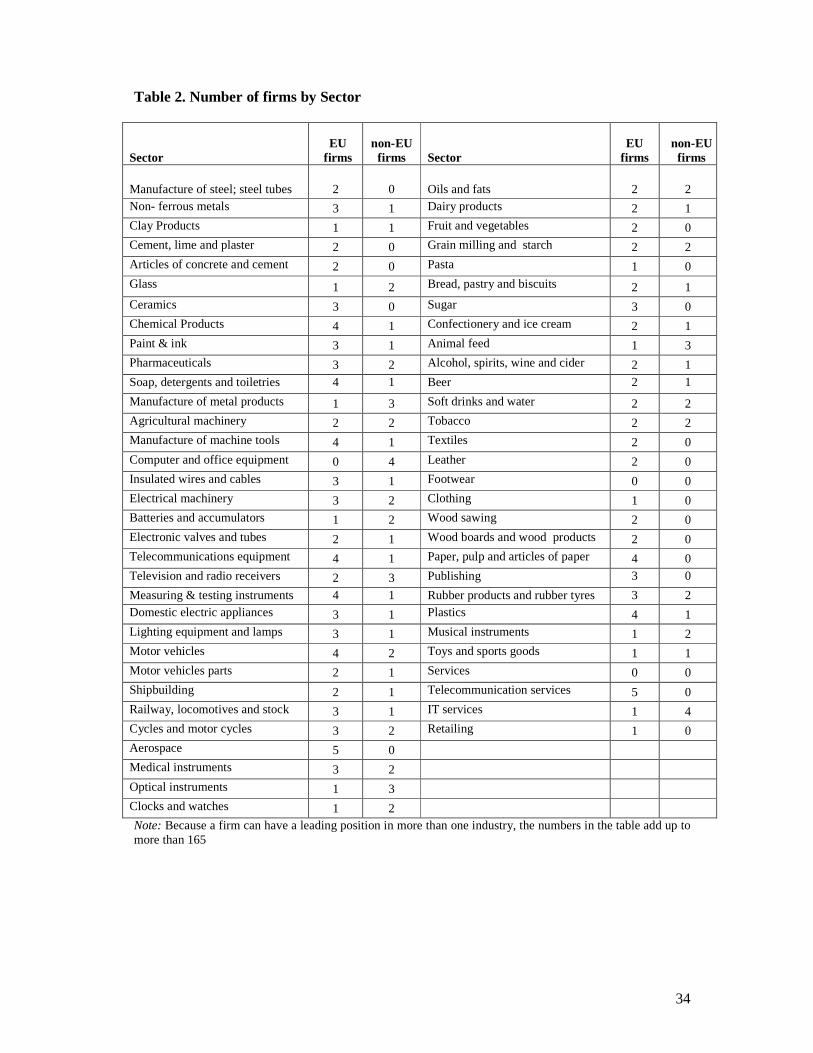
The number of firms by country and by industry is shown in tables 1 and 2, and Appendix A
lists all firms in the analysis with their industries and patent applications during 2000-2007.
The largest number of firms is based in Germany (26) followed by France (21) and the UK
(19). Italian firms are less well represented, while 5-8 firms are headquartered in small and
internationalized economies such as The Netherlands, Finland and Sweden. US firms make up
more than half of the non-EU Firms that are leading in EU industries (34). Several other
leading firms are based in Japan (15) and Switzerland (6). One firm (SAB Miller, in South
Africa) is not headquartered in an industrialized country. The firms are active in a wide range
of industries (Table 2) and are roughly evenly spread across sectors. The services firms are
less well represented, which is due to the nature of the selection criteria, but also due to the
limited role that patents play in services sectors. The ICT and telecommunication sectors are
notable exceptions. The non-EU firms are relatively well represented in high tech industries
such as computer and office equipment, pharmaceuticals (with aerospace the exception),
while they are much less present in low tech industries (e.g. wood products and wood sawing,
paper, sugar, fruit & vegetables).
INSERT TABLE 1 and TABLE 2
Patent data
We draw on patent data to establish past and current innovative output of the firms. There are
numerous advantages to the use of patent indicators as measures of firms’ technological
activities (Pavitt, 1985; Basberg, 1987; Griliches, 1990). Patent data are available in a
consistent and longitudinal manner and provide ‘objective’ information in the sense that
patents have been processed and validated by patent examiners based on novelty and utility of
use. Drawbacks are that patent propensities vary across industries and firms; and patented
inventions differ in their technical and economic value (Mansfield, 1986; Levin et al, 1987;
Arundel and Kabla, 1998). In the analysis, we will seek to control for differences in patent
propensities. A partial solution to the heterogeneity in patent valuations is to use forward
citations. However, given the recent period that we are examining and because a number of 2 This implied that low technology industries with little or no patenting activity are relatively less well represented, as are privately held firms that do not report R&D expenditures.
12
years post-publication are required to assess the importance of patents by the intensity with
which they are cited in other patents, we cannot use this method in the current analysis. We
used European patent data (applications) for all firms. This ensures data consistency and
comparability as patent systems differ in their application standards and granting procedures
(Ahuja and Lampert, 2001). Due to long patent grant time lags at the European Patent Office,
we opted for the use of patent application data rather than patent grants.3
For each leading firm we collected patent data at the consolidated firm level for the years
2000-2007. We constructed patent datasets of firms at the consolidated level, i.e. all patents of
the parent firm and its consolidated (majority-owned) subsidiaries are collected. For this
purpose, yearly lists of consolidated subsidiaries included in corporate annual reports, 10-K
reports filed with the SEC in the US and, for Japanese firms, information on foreign
subsidiaries published by Toyo Keizai in the yearly ‘Directories of Japanese Overseas
Investments’, were used. The consolidated subsidiaries are in almost all cases majority
owned. The consolidation was conducted on an annual basis to take into account changes in
the group structure of the firms over time, including -importantly- divestments and M&As.
Using consolidated patent data is important since a large share of firms’ patented inventions
are developed and applied for in firms’ subsidiaries.4
Alliances
To examine the trends and patterns in technology alliances, we make use of the SDC
(Securities Data Company) Platinum databases -a well known data source for empirical
studies on strategic alliances and M&A (Schilling, 2008). This database is richer than the
MERIT-CATI database, as it codes more information on the alliances and because it also
covers M&As.5 The SDC Platinum database covers the period 1980-2008, although the
coverage of alliance activity in earlier years has been less systematic. The database covers
alliances and M&As by firms across all sectors and includes more than 85,000 strategic
alliances and more than 670,000 M&As.
3 For example, for EPO patents applied in 1995, the average granting lag was 5.01 years, with 25% of grants having a granting lag of 6 years or longer. 4 On average 20 percent of the sample firms’ patents use a subsidiary name or variant of the current parent firm. 5 In addition, the MERIT-CATI database has not been updated in recent years. Both databases are noted for a certain US-bias in the information they contain, due to their partial reliance on US based information sources (Schilling, 2008).
13
Our main focus is on technology alliances. Here we employ a strict definition and include
only those alliance for which we have explicit information that technology development and
technology sharing were among the objectives of the alliance. We include alliances as
technology alliances if they satisfy one of the following criteria:
• The alliance includes cross technology transfer: alliances in which more than one
participant transfers technology to another participant or to the alliance
• The alliance includes a research and development agreement
• The alliance includes a cross licensing agreement: alliances in which more than one
participant grants a license to another participant
Hence, we do not include simple one-way technology licensing, as this is essentially a market-
based mode of technology acquisition. Likewise we do not include joint ventures if these are
not associated with technology transfer as these joint ventures, more often than not, have joint
production or marketing objectives rather than the pooling of R&D resources. This definition
is stricter than the one used in much prior work (see Schilling, 2008), but patterns of this well-
delineated definition of technology alliances ensures a focus on technology sourcing
strategies. For the EU firms in our dataset, technology alliances on average make up about 15
percent of total alliances (cf. Belderbos et al, 2010).
We distinguish alliances by the origin of the partners. The geographic origin of the partner is
taken as the location of the participant-partner in the alliance, irrespective of whether this
partner is independent or part of a larger group or ultimately owned by a parent firm based in
another country. We take this focus because it can be assumed that the technological
capabilities of the direct partner firm are most important in the alliance.
Technology Based M&As
We used the Zephyr database on M&AS (published by Bureau van Dijk) and the Thomson
SDC Platinum (shortly SDC) databases which are the commonly used sources for M&As.
Zephyr is particularly focused on M&As of European firms, while SDC is more globally
oriented, and the two databases complement each other well to get maximum coverage. In
addition, the consolidation exercise in which we drew on annual reports helped to identify
some further M&A activity. We count the number of majority stake or full M&As in which
the firms in the sample were acquirers or the dominant party in a merger. We follow Ahuja
and Katila (2000) by defining a technology-based M&A as an M&A where the target firm has
14
(EPO) patent applications. In case a target firm holds patents but also has subsidiaries with
patent activities, the M&A is counted only once.
Financial data
Our primary source of financial data on the firms was Compustat, subsections North America
as well as Global. As Compustat has less than full coverage of European firms, we augmented
these data with information retrieved from Worldscope and Annual reports. As for R&D data,
we could also draw on the European R&D Scoreboard, which ranks firms by R&D
expenditures since 2003. We used exchange rate information from the IMF Financial
Statistics to represent figures that were in domestic currencies in dollar terms
4. TECHNOLOGY-BASED M&As AND TECHNOLOGY ALLIANCS, 2000-2007
Technology Alliances
Figure 1 and Table 3 show the importance for EU Firms of technology alliances with partners
from different regions and countries and the trend therein, following the strict definition set
out above. The total number of alliances has varied between 40 and 70. In the most recent
years, alliance activity has been increasing. US firms have by far been the most prominent
technology alliance partners for EU firms, with shares of more than 50 percent in the most
recent years during which the absolute number of alliances registered a strong increase.
Partners from other EU countries take up roughly 20 percent of alliance activity (with the
exception of 2005). Technology alliances involve same-country partners less frequently,
which a share of less than 10 percent (with the exception of the years 2000 and 2007). The
share of Japanese firms has been declining very rapidly since 2002 and has been surpassed by
emerging economies (in particular China and India). Overall, technology alliance activity by
EU firms is distinctly international and externally oriented, with on average around 60 percent
of the alliances formed with partner firms outside of the EU.
INSERT FIGURE 1 and TABLE 3
15
For the non-EU firms in the sample (with Japanese and US firms most prominent) we see
higher numbers of alliances with a maximum of close to 130 (in 2000) (Figure 2 and Table 3.)
Given the smaller number of non-EU firms in the sample, this implies a higher alliance
intensity. This is partly related to the greater presence of the non-EU firms in medium tech
and high tech industries (see Table 2). Alliance activity shows a decline in 2003-2006 and a
resurgence in 2005-2007 - a pattern that is much more pronounced than the trend in alliances
by EU firms in Figure 1. Figure 2 shows a relatively large share of alliance partners based in
the same (home) country, at around 50 percent. This is largely due to the importance of US
partners for US firms. US partners place second as they are also important partner firms for
Japanese and European firms (based outside the EU), but the number of alliances with US
firms has fallen in 2007. Partners from the EU place third, with a share between 10 and 20
percent and a relatively stable number of on average 10 alliances yearly. The share of
Japanese partner firms for the non-EU firms in the sample shows a similar decline as that for
the EU firms in Figure 1. The data show a greater increase in the role of partners from
emerging economies (mainly China and India) in the most recent year (2007).
INSERT FIGURE 3 and TABLE 4
Technology based M&As
Figure 3 shows the number of technology based M&As by the EU firms in the sample by
country and region of the target firm. The number of M&As has ranged between a low of 6
(2003) and a high of 28 (2007). While intra-country targets were most common in 2000-
2002, by 2007 M&As targeting firms form other EU countries, US and other developed
economies (e.g. Switzerland, Canada) became more important. Hence, M&A activity has
become more externally oriented over the years. In contrast, firms from Japan, as well as
those from emerging economies, have rarely been the target of EU firms'. Table 6 provides
some more detail on the main technology based M&As in the period. M&A activity involved
some mergers and acquisitions of major patent holding firms, such as the Aventis-Sanofi
merger, the merger between Alcatel and Lucent, and the acquisition of Schering by Bayer.
16
INSERT FIGURE 4 and TABLE 5 and TABLE 6
Figure 4 and Table 7 illustrate the technology based M&As of the non-EU firms in the
sample. The number of M&As has generally been somewhat lower than the number of
M&As by the EU firms, which contrasts with the pattern of technology alliances. There is no
rise in the number of M&As in recent years and the largest number of M&As (23) took place
in 2005. M&As with intra-country (mainly US) targets have been most frequent (between 50
and 90 percent of M&A activity), followed by M&As with EU targets. Targets from other
countries or regions have not been of importance. The largest M&A in terms of patent
holdings of the target firm has been the acquisition of Union Carbide by Dow Chemical in
2001 (Table 8). Other major M&As were the acquisition of Gillette by Procter & Gamble, the
acquisition of the Swedish pharmaceutical firm Pharmacia by Pfizer, and the acquisitions of
Amersham (GE), Advanced Cardiovascular (Abott) and Symbol Technologies (Motorola).
INSERT FIGURE 5 and TABLE 7 and TABLE 8
5. EMPIRICAL MODEL AND VARIABLES
The empirical model relates a measure of innovative performance (the number of patent
applications of the firm in a given year) to prior technology-based M&A and technology
alliance activity of the firm, controlling for R&D expenditures and other firm and
environmental features. The dependent variable, the number of patent applications with the
European Patent Office, is a count variable with only non-negative integer values. In this case,
nonlinear count data models are preferred to standard linear regression models as they
explicitly take into account the non-negativity and discreteness of the dependent variable.
Negative Binomial count data models, which control for over-dispersion in the dependent
variable, are used (Cameron and Trivedi, 1998). We used fixed effects panel data estimators
in all regression models to control for unobserved (time-invariant) firm characteristics such as
general managerial capabilities that could affect technological performance. Hence, the effects
of M&As and technology alliances should be interpreted as relating to the 'within' changes in
17
innovative performance and indicate to what extent increases or decreases in M&A and
alliance activity of a firm affect patent output.
We analyze innovative performance (patent applications) during the period 2001-2007 (seven
years).6 The panel is almost balanced, with on average more than 6 observations per firms and
a total number of observations of 917. Of these, 560 are for EU firms and 357 for non-EU
firms. In the analyses, we will examine whether there are differences between EU and non-EU
firms in the effects of M&As and alliances, by also estimating coefficients that are specific to
EU and non-EU firms.
The first key explanatory variable is the number of technology alliances in which the firm has
engaged. In assessing the effect of alliances, we take a moving window approach, assuming
that ‘ongoing’ alliances are likely to have an impact on innovative performance. We assumed an
average life span of alliances of 5 years, following conventional assumptions in alliance
research (Kogut 1988, 1989; Gulati, 1995, 1999; Stuart, 2000; Lavie, 2007). The variable
technology alliances measures the number of technology alliances established by the firm in
the years t-5 through t-1.
The variable technology-based M&As measures the number of M&As of the firm in t-1 and t-
2. A window of 2 years was chosen, as M&As often have short-term rationalization effects,
leading to a strong impact in the first few years.7 The patent activities of the target are counted
as output of the acquirer in the year t, subsequent to the merger or acquisition. Since the
analysis includes the R&D budget at the consolidated level (i.e. the R&D budget of the
merged firm) as an important control factor, acquisitions and mergers can only increase patent
output if they increase the (patent) productivity of R&D.
To examine the impact of intra-country and international technology sourcing strategies
through alliances and M&As, we distinguish alliances and M&As by country and region of
the alliance partners or target firms. We distinguish EU versus non-EU partners/targets, intra-
country vs. EU and non-EU partners/targets, and EU vs. emerging economy and developed
6 One year (2000) had to be excluded because the M&A data were not available with the required lag (see below). We use the filing year at the European Patent Office as indicative of the year of innovative output. Substituting the year of priority filing of a patent equivalent at other patent offices (priorty filings can predate EPO filings) did not qualitatively change the empirical results. 7 We experimented with including M&A variables with various lags. The stylized pattern found was one of a strong and similar impact of M&As in t-1 and t-2.
18
country partners/targets. In order to assess possible substitution or complementarity between
technology-based M&As and technology alliances, we include interactions between the M&A
and alliances variables. The interaction between alliances and M&As tests whether intensive
engagement in both types of strategies reduces their positive effect due to increasing demands
on management time and increasing complexity. The interaction between region-specific
alliances and M&As tests whether these strategies are alternative routes to international
knowledge sourcing, or whether they complement each other.
The empirical models control for other (time varying) firm-level factors that are likely to
impact on firms’ innovative performance. First, we control for differences in the scale of the
firms’ R&D expenditures, by including the dollar value of R&D expenditures in year t-1. In
other words, the analysis examines as to what extent alliances and M&As improve the
efficiency of R&D, controlling for the level of R&D. Second, we control for differences in the
prior patent activity of the firm. We include a measure of patent-R&D productivity, taking the
one-year lagged ratio of the number of firm patents to R&D expenditures. This variable
controls for firms' past technological activities and absorptive capacity, as well as for
differences in the propensity to apply for European patents. Finally, the empirical models
include time dummies (2001 as base category) to account for time-specific factors affecting
the innovative performance of the firms
Table 9 shows means and standard deviations of the variables and describes the definition of
the variables and appendix B contains a correlation table.
INSERT TABLE 9
5. EMPRICAL RESULTS
Results from our basic specification indicate that for our complete set of firms acquisitions do
not have any significant impact on performance, while alliances have a significantly positive
effect (Table 10, columns 1 and 2). This is in line with the existing evidence on the innovative
contributions of M&As and alliances: while the contribution of M&As to innovative
performance is far from clearly understood, most studies by and large confirm the positive
19
influence of alliances. We also find that a highly diversified portfolio of alliances and M&As
can be detrimental to performance: the coefficient for the interaction term of alliances and
acquisitions is negative and significant. This is consistent with the notion that increases in a
firm’s portfolio of alliances and acquisitions can increase the cost, and reduce the
effectiveness, of managing the portfolios and may create knowledge redundancies. Alliances
and M&As are substitutes in the innovative performance function and intensive engagement
in one technology sourcing strategy reduces the effectiveness of the other.
INSERT TABLE 10
When we look at the effect of EU vs. Non-EU alliance partners and acquisition targets, we get
a more nuanced picture (Tables 10, columns 3 and 4). Acquisitions of EU firms have a
significantly positive impact, while acquisition of non-EU firms, surprisingly, have a
significantly negative impact innovative performance. Engagement in technology alliances
with both EU and non-EU firms have a positive sign, but only the coefficient of alliances with
EU firms is significant in several specifications. Taken together, these findings suggest that
EU firms in particular are important targets and partners for effective technology acquisition
and knowledge integration. At the same time, the results suggest that there are knowledge
sourcing redundancies in the firms' M&A and alliance portfolios targeting the EU. The
interaction term between EU acquisitions and EU alliances is negative and significant.
Separating out intra-country M&As and alliances from the variables provides further insights
(columns 5 and 6). The significance of both EU (but not intra-country) and non-EU (but not
intra-country) acquisitions improve, while in contrast intra-country acquisitions have a
significantly negative impact. This appears to suggest that there are only limited technological
gains from acquisitions with same-country targets, and that acquisitions may be driven more
by other strategic considerations such as diversification or reducing domestic market
competition. The results for alliances show, as in the case of M&As, that EU alliances are
much more significant if intra-country alliances are separated out. Alliances with non-EU
partners and intra-country alliances have no significant effect on the other hand.
In columns 7 and 8 of Table 10, the non-EU alliance and M&A variables are split between
developed countries and emerging economies. Technological M&As in the developed regions
outside of the EU have a significantly negative effect on performance, while those in
20
emerging economies have no significant effect. The results for alliances show that alliances
with non-EU developed region partners have a clear positive impact on innovative
performance. This contrasts with a significantly negative effect of alliances with partners in
emerging economies. It may be that firms use these alliances to trade market access in
emerging economies for access to technology, such that alliance activity is focused on
adaptation efforts and diverts resources from research efforts that are most likely result in
patent activities.
INSERT TABLES 11a and 11b
To what extent are the above findings applicable to EU and non-EU firms? In order to answer
this question we estimated more elaborate models in which the M&A and alliance variables
are interacted with two dummy variables—one for EU firms and the other for non-EU firms.
Hence, we estimate separate coefficients for the effects of M&As and alliances for EU and
non-EU firms. The results are reported in Tables 11a and 11b. Compared to our earlier finding
that the overall effect of acquisitions is neutral, we find that for EU firms acquisitions have a
significantly positive impact, while for non-EU firms acquisitions have a significantly
negative overall impact (Table 11a, columns 1 and 2). Alliances, on the other hand, exert a
significantly positive performance effect for both EU firms and non-EU firms. The interaction
effects between alliances and M&As are not significant for EU or non-EU firms.
If we split the M&A and alliance variables between EU and non-EU targets or partner firms,
we observe that EU firms’ intra-EU acquisitions exert a significantly positive effect on
innovative performance (Table 11a, columns 3 and 4). For non-EU firms on the other hand,
there are strongly contrasting effects of acquisitions in the EU (significantly positive) and
acquisitions outside the EU (negative and significant). It appears therefore that the negative
effect of acquisitions of non-EU targets that we have observed in the full sample is solely
driven by the acquisitions of non-EU firms. With regard to alliances, partnerships with EU
firms improve the performance of non-EU firms, but no such significant impact is found for
alliances with non-EU firms. The effects of EU firms' alliances, whether they are with EU or
21
non-EU partners, are not significant, though the sign of the coefficients is positive.8
Furthermore, for EU firms, the joint use of M&As and alliances as technology sourcing tools
reduces innovative performance, as revealed by the negative and significant coefficient of the
interaction term of the two variables.
When we separate intra-country alliances and intra-country M&As we find that the positive
contribution of M&As with EU target firms to innovative performance is restricted to cross-
border M&As (Table 11b, columns 7 and 8). Intra-country acquisitions, as well as non-EU
acquisitions, do not have any significant impact on the performance of EU firms. For non-EU
firms, EU acquisitions have a positive impact but acquisition of targets in the home country
and acquisitions in other countries have a significantly negative effect. As to the effect of
alliances, the results confirm that for non-EU firms alliances with EU firms are an important
means of knowledge sourcing.
Finally, we split the non-EU alliance and M&A variables into M&As and alliances with
targets or partners in developed countries and in emerging economies (Table 11b, columns 5
and 6). We find that the effects of alliances and M&As with developed country partners are
broadly similar to the effects of alliances and M&As with all non-EU targets or partners. An
additional finding is that for non-EU firms, alliances with emerging economy partners
significantly reduce innovative performance.
6. CONCLUSIONS
The development of technology assets is crucial in an environment of intensifying global
competition and shortening product cycles. External knowledge acquisition and international
knowledge sourcing have become cornerstones of many firms’ R&D strategy as they allow a
broader search for sources of new technology and competitive strength. Two important means
of acquiring external technology are alliances and the acquisition of firms with technological
resources ('technology-based acquisitions'). Although there is an abundant literature on the
performance effects of M&As and the impact of alliances on innovative performance,
8 We note that part of the explanation for the higher standard errors of the alliance and M&A variables when distinguished by target or partner country and region, is due to the relatively high collinearity between these variables (see appendix B).
22
surprisingly little attention has been given to the joint effects of these two technology sourcing
modes on innovative performance.
In this paper, we examine to what extent strategic technology alliances and technology-based
mergers and acquisition (M&As) improve the innovative performance of firms. We analyze
the innovative performance (patent applications) of 104 EU firms that are leading in EU
manufacturing and services industries between 2001 and 2007, and compare this to the
performance of a sample (61) of non-EU firms with a strong presence in the EU. We consider
M&As and alliances as part of a broad portfolio of technology sourcing mechanisms and
focus on the effects of the geographic scope of (international) M&A and alliance activity.
Specifically, we examine to what extent the two modes of (international) technology sourcing
are complements or substitutes, and which strategy has the largest comparative impact on
performance.
The pattern of technology alliances of EU firm appears distinctly international, with US firms
as the most important partners, followed by firms from other EU countries. Although the
number of alliances of EU firms has been increasing in recent years, alliances are used less
frequently by EU firms as compared with the group of non-EU firms (which consist mainly of
firms based in the US and Japan). These US and Japanese firms are more frequently engaged
in alliances with their respective home country partner firms, while alliances with EU firms
are relatively less important. The pattern of technology based M&As of EU firms shows a
much greater EU orientation than the pattern of alliances, with EU-based targets responsible
for 50-80 percent of M&A activity. EU firms are relatively more active in technology based
M&As compared with the non-EU firms. The latter show a focus on US, and to a lesser
extent, EU targets.
Results of fixed effects panel data analysis -controlling for various other firm specific
characteristics affecting performance- suggest that both technology alliances and technology
based M&As can improve innovative performance. The empirical results, however, show
marked differences between the effects of the two sourcing modes for EU and non-EU firms,
and important differences with respect to the location of the partner or target firm. Overall (for
the full sample of firms), technology alliances improve innovative performance with the
strongest effects observed for alliances with EU firms. Technology based M&As with EU
targets have a positive impact, but in contrast, M&As with non-EU targets reduce innovative
23
performance. Similarly, alliances with firms based in emerging economies reduce, rather than
increase, innovative performance, while alliances with partners in developed countries have a
positive performance effect.
Once differences in the effectiveness of the sourcing strategies for EU and non-EU firms are
taken into account, a pattern occurs with primarily M&As contributing to the performance of
EU firms, but with cross-border M&As within the EU having the most robust impact. The
negative effect of M&As is confined to non-EU firms engaged in acquisitions outside the EU
or inside their home countries; non-EU firms' acquisitions of EU firms, in contrast, contribute
to innovative performance. In general, we observe that the technology sourcing strategies that
are relatively less utilized by these two groups of firms, i.e. technology-based acquisitions in
case of non-EU firms and technology alliances in case of EU firms, are also the strategies that
are relatively less effective for the respective groups of firms.
While the analysis showed that technology based M&As and technology alliances can jointly
improve innovative performance, the results also suggested that large and complex portfolios
of M&As and alliances can be detrimental to innovation. This is consistent with the view that
management and coordination complexities associated with large portfolios of sourcing
strategies is likely to lead to redundancies and duplication, while the lack of resources to
manage the portfolio can impair the firm's ability to implement and benefit from the sourcing
strategies. Specifically, we found evidence that simultaneous and intensive engagement in
alliances and M&As focused on one region (e.g. the EU) may reduce the effectiveness of each
individual sourcing mechanism. This suggests that alliances and M&As can function as
substitutes if they overlap in terms of knowledge sourcing objectives.
We conclude that technology based M&As and technology alliances can both improve
innovative performance, but that redundancies and intensive simultaneous use of both
sourcing modes have to be avoided. EU firms are not only accessing technology
internationally through M&As and alliances; they also are an important source of technology
sourcing by non-EU based firms. The results for EU firms suggest that restructuring through
technology based cross-border M&As within the EU may be as effective as R&D
collaboration and alliances to improve innovative performance and the productivity of R&D
operations. This holds for cross-border M&As in the EU, but not for intra-country M&As, for
which no positive performance effects are observed. This suggests that EU mergers and
24
competition policy should pay close attention to the R&D efficiencies and the consequences
for innovation in evaluating M&As in the EU. At the same time, technology alliances with
emerging economy partners (in particular India and China), which are on the rise in recent
years, appear to be neutral, if not detrimental, to innovative performance. It may be that firms
use these alliances to trade market access in emerging economies for access to technology,
such that alliance activity is focused on adaptation efforts and diverts resources from research
efforts that are most likely result in patent activities. The results suggest that further
internationalizing R&D collaboration in terms of the geographic scope of the partners is not
without risks and costs.
Our research has a number of limitations, which suggest a need for further research on this
subject. First, we examined innovative performance in terms of patent applications with the
European Patent Office. This is a natural choice given that the focus of this study is on the
comparative effectiveness of international technology sourcing strategies of EU firms. On the
other hand, it may potentially lead to bias if the analysis does not sufficiently control for the
potential characteristic of collaborations with EU partner firms and EU target firms to exhibit
a greater propensity to file for patents at the European Patent Office (as compared with non-
EU partners and targets). In further work, we aim to analyze the effects of technology
sourcing strategies using patents that are filed in Europe, the US and Japan ('Triadic' patents)
to investigate whether such bias exists.9 An alternative approach is to examine the financial
performance of firms rather than innovative performance. Second, while an advantage of our
sample is that it includes firms from a variety of industries, a drawback of this approach are
that the limited number of firms per industry does not allow investigating industry differences
in the role of technology based M&As and technology alliances. Potentially, some of these
industry differences may influence the differential findings for EU and non-EU firms, as the
distribution of the two groups of firms over industries is not identical. Investigating this in
detail will require the construction of even larger databases. Third, the analysis did not take
into account the importance and characteristics of alliance partners (e.g. in terms of their
knowledge base and the intensity of the collaboration) and the importance of M&As (the
knowledge stock of the targets). Examining these aspects in more detail may provide further
insights into the potential difficulties in 'digesting' (integrating) large or heterogeneous target
9 In a first robustness check, we estimated models on only those patents for which we could determine the existence of a patent family including US patent applications. This reduced patent numbers by about 40 percent. We found little systematic change in the empirical results, with again the most robust effect a positive influce of acquisitions of EU targets.
25
firms, and the role of technology overlap in reducing the effectiveness of sourcing strategies
to develop new technologies.10
REFERENCES
Ahuja, G., Katila, R., 2001. Technological acquisitions and the innovation performance of
acquiring firms: a longitudinal study, Strategic Management Journal, 22, 197–220.
Anand, B.N., and T. Khanna, 2000, Do firms learn to create value? The case of alliances,
Strategic Management Journal, vol. 21, pp. 295-315.
Archibugi, D. and Michie, J., 1995. The globalisation of technology: a new taxonomy.
Cambridge Journal of Economics 19, 121-40.
Arora, Ashish and Alfonso Gambardella. 1990. Complementarity and external linkages: the
strategies of the large firms in biotechnology. Journal of Industrial Economics 38, 361-
79.
Bamford JD, Ernst D., 2002. ‘Managing an alliance portfolio’. The McKinsey Quarterly 3: 29-
39.
Barney, J. B. 1999, How a firm’s capabilities affect boundary decisions, Sloan Management
Review, 40(3), 137–145.
Baum , J.A.C., T. Calabrese, B.S. Silverman, 2000, Don’t go it alone: alliance network
composition and startups’ performance in Canadian biotechnology, Strategic
Management Journal, 21 (3): 267-294.
Baum, J.A.C., T. Calabrese, B.S. Silverman, 2000. ‘Don’t go it alone: alliance network
composition and startups’ performance in Canadian biotechnology’. Strategic
Management Journal 21, 3, 267-294.
Baysinger, B. D. and R. E. Hoskisson, 1989. 'Diversification strategy and R&D intensity in
large multiproduct firms'. Acadenzy of Management Journal, 32, 310-332.
Belderbos R, Carree M, Lokshin B, 2006. ‘Complementarity in R&D Cooperation Strategies’.
Review of Industrial Organization, 28, 4, 401 - 426.
Belderbos, R, I. Bolat, J. Jacob, 2010, International Technology Alliances of EU firms, FP7
GlobInn Project, work package report 2.1.2, UNU-MERIT.
10 We investigated potential differences in sourcing strategies and their effectiveness across sectors by restricting the sample to medium and high tech industries. We found few changes compared with the results for the full sample.
26
Belderbos, Rene, Bart Leten and Shinya Suzuki, 2009, Does Academic Excellence Attract
Foreign R&D?, Global COE Hi-Stat Discussion Paper Series gd09-079, Institute for
Economic Research, Hitotsubashi University, Tokyo.
Belderbos, Rene, Elissavet Lykogianni and Reinhilde Veugelers, 2008, Strategic R&D
Location in European Manufacturing Industries, Review of World Economics, 14 (2), 1-
24.
Bertrand, O. and P. Zuniga, 2006. ‘R&D and M&A: are cross-border M&A different? An
investigation on OECD countries’. International Journal of Industrial Organization, 24,
2.
Bertrand, Olivier, 2009, Effects of foreign acquisitions on R&D activity: Evidence from firm-
level data for France, Research Policy, 38, 1021-1031
Bolton, Patrick, and Mathias Dewatripont, 1994. ‘The Firm as a Communication Network’.
Quarterly Journal of Economics, 115, 809-839.
Bönte, Werner, 2003, R&D and productivity: internal vs. external R&D – evidence from West
German manufacturing industries. Economics of Innovation and New Technology,
12(4), 343-360.
Cantwell, J., 1995. The globalisation of technology: What remains of the product cycle and
model?, Cambridge Journal of Economics, 19, 155-74. Reprinted in Archibugi and
Michie (eds) 1997.
Carayannopoulos, S and Auster, E.R, 2010. External knowledge sourcing in biotechnology
through acquisition versus alliance: A KBV approach, Research Policy 39, 254–267
Cassiman, B., Colombo, M., Garrone, P., and Veugelers, R., 2005. The impact of M&A on
the R&D process. An empirical analysis of the role of technological and market
relatedness. Research Policy, 34(2), 195-220.
Caves, R, E, 1989, Mergers, take overs and economic efficiency, International Journal of
Industrial Organization, 7: 151-174.
Chesbrough, Henry, 2003, The era of open innovation. Sloan Management Review, 44(3),
p35-41.
Chiesa, Vittorio, Raffaella Manzini, and Emauele Pizzurno, 2004, The externalization of
R&D activities and the growing market of product development services. R&D
Management, 34(1), 65-75.
Chung, S. A., Singh, H., Lee, K. (2000). Complementarity, status similarity and social capital
as drivers of alliance formation. Strategic Management Journal 21, 1-20.
27
Cloodt, M., Hagedoorn, J. and Van Kranenburg, H., 2006. Mergers and acquisitions: Their
effects on the innovative performance of companies in high-tech industries. Research
Policy, vol. 35(5), 642-654.
Cloodt, M., Hagedoorn, J., Kranenburg, H.V., 2006. Mergers and acquisitions: their effect on
the innovative performance of companies in high-tech industries, Research Policy, 35
(5), 642–654.
Coase, Ronald H., 1990. Accounting and the theory of the firm. Journal of Accounting and
Economics, vol. 12(1-3), 3-13, January.
De Man, A, P, and G. Duysters, 2003. ‘Transitory Alliances: An Instrument for surviving
turbulent industries?’. R&D Management, 33, 1, 49-58.
De Man, A, P, and G. Duysters, 2005, Collaboration and innovation: a review of the effects of
mergers, acquisitions and alliances on innovation, Technovation, 25(12), 1377-1387.
Duysters, G and Lokshin, B, 2007, Determinants of alliance portfolio complexity and its
effect on innovative performance of companies, Working paper No.33 UNU-MERIT
Duysters, G., and Hagedoorn, J., 2002. External Sources of Innovative Capabilities: The
Preferences for Strategic Alliances or Mergers and Acquisitions. Journal of
Management Studies, vol. 39, 167-188.
Duysters, G.M., Hagedoorn, J. (2000). Core competences and company performance in the
world-wide computer industry. Journal of High Technology Management Research 11
(1), 75–91.
Ernst, Holger and Vitt, Jan (2000) The influence of corporate acquisitions on the behaviour of
key inventors, R&D Management, 30:2, 105-120.
Faems, D., B. Van Looy, and K. Debackere, 2005, ‘Inter-organizational collaboration and
innovation: towards a portfolio approach’, Journal of Product Innovation Management,
22: 238-50.
Gemunden, H.G. and Ritter, T., 1997. ‘Managing Technological Networks: The Concept of
Network Competence’. In H.G. Gemunden, T. Ritter and A. Walter (eds) Relationships
and Networks in International Markets, 294–304. Oxford: Elsevier Science
Gilsing, V., B. Nooteboom, W. Vanhaverbeke, G. Duysters and A. van den Oord, 2008.
‘Network embeddedness and the exploration of novel technologies’. Technological
distance, betweenness centrality and density, Research Policy, 37, 1717-1731.
Gomes-Casseres B., 1996. ‘The Alliance Revolution: The New Shape of Business Rivalry’.
Harvard University Press: Cambridge, MA.
28
Granstrand, Ove, Erik Bohlin, C. Oskarson, N. Sjöberg, 1992, External technology acquisition
in large multitechnology corporations. R&D Management, 22(2), pp. 111-113.
Grimpe, Christoph., 2007. ‘Successful Product Development after Firm Acquisitions: The
Role of Research and Development’. Journal of Product Innovation Management, 24, 6,
614-628.
Gulati, R., 1995. Social structure and alliance formation patterns: a longitudinal analysis.
Administrative Science Quarterly, 40, 619–652.
Gulati, R, 1998. ‘Alliances and networks’. Strategic Management Journal, 19, 4, 293-317.
Gulati, R., 1999. Network location and learning: The influence of network resources and firm
capabilities on alliance formation. Strategic Management Journal, 20, 397–420.
Gulati, R., and H. Singh, 1998. ‘The architecture of cooperation: Managing coordination costs
and appropriation concerns in strategic alliances’, Administrative Science Quarterly, 43,
781–814.
Hagedoorn, J and Duysters, G 2002a, External sources of innovative capabilities: the
preference for strategic alliances or mergers and acquisitions, Journal of Management
Studies 39:2, 167-188.
Hagedoorn, J. 1993. Understanding the rationale of strategic technology partnering:
interorganizational modes of cooperation and sectoral differences. Strategic
Management Journal 14, 371–385.
Hagedoorn, J. 2002. Interfirm R&D partnerships: an overview of major trends and patterns
since 1960. Research Policy 31, 477-492.
Hagedoorn, J. and Schakenraad, J. 1994, The effect of strategic technology alliances on
company performance, Strategic Management Journal, 15, 291-311
Hagedoorn, J., Duysters, G., 2002b, The effect of mergers and acquisitions on the
technological performance of companies in a high-tech environment, Technology
Analysis & Strategic Management, 14, 68–85.
Hagedoorn, J., Link, A. and Vonortas N., 2001. Research partnerships, Research Policy 29
(4), 567–86.
Hall, B. H., and Vopel K., 1997. Innovation, market share, and market value. UC Berkeley,
NBER, and Mannheim U: photocopied.
Hall, Bronwyn, 1999, “Mergers and R&D Revisited,” mimeo, University of California at
Berkeley.
Hatzichronoglou, T., 1997. Revision of the high-technology sector and product classification,
STI Working Paper No. 1997, OECD, Paris.
29
Heimeriks, K. H. and Duysters, G. M., 2007. ‘Alliance Capability as Mediator between
Experience and Alliance Performance: An Empirical Investigation into the Alliance
Capability Development Process’, Journal of Management Studies, 44(1), 25–49.
Heimeriks, K.H., Klijn, E., Reuer, J. 2009. Building capabilities for alliance portfolios. Long
Range Planning 42, 1, 96-114.
Hennart, J. F., 1991. The transaction costs theory of joint ventures: an empirical study of
Japanese subsidiaries in the United States. Management Science 37 (4), 483–497.
Hennart, J. F., Reddy, S., 1997. The choice between mergers/acquisitions and joint ventures:
the case of Japanese investors in the United States. Strategic Management Journal 18,
1–12.
Hoang, H.T. and Rothaermel, F.T., 2005. ‘The effect of general and partner-specific alliance
experience on joint R&D project performance’. Academy of Management Journal, 48,
2, 332-345.
Hoffmann WH., 2005. ‘How to manage a portfolio of alliances’. Long Range Planning 38,2,
121-143.
Hoffmann, W. H., 2007. ‘Strategies for Managing a Portfolio of Alliances’, Strategic
Management Journal, 28, 827–56.
Killing, J. P., 1988. ‘Understanding alliances: The role of task and organizational complexity’.
In F. J. Contractor, & P. Lorange (Eds.), Cooperative strategies in international business
(pp. 55–68). Lexington, MA: Lexington Books.
Kogut, B., 1988, ‘Joint ventures: theoretical and empirical perspectives’, Strategic
Management Journal, 9: 319-332.
Kogut, B., H. Singh. 1988. The effect of national culture on the choice of entry mode. Journal
of International Business Studies,19(3) 411–432.
Lavie D, Miller SR., 2008. ‘Alliance portfolio internationalization and firm performance’.
Organization Science 19,4, 623-646.
Lavie, D and Miller, S.R, 2008, Alliance portfolio internationalization and firm performance,
Research Policy, 19(4), 623-646
Lavie, D., 2007. ‘Alliance Porfolios and Firm Performance: A study of value creation and
appropriation in the U.S. Software Industry’. Strategic Management Journal, 28, 1187–
1212.
Lokshin, Boris, Rene Belderbos, and Martin Carree, 2008, Internal and external R&D:
complements or substitutes? Evidence from a dynamic panel data model, Oxford
Bulletin of Economics and Statistics, 70 (3), 399-413,
30
Madhok, A., 1996. The organization of economic activity: transaction costs, firm capabilities,
and the nature of governance, Organization Science 7 (5), 577–590.
Marino L., K. Strandholm, H.K. Steensma and K.M. Weaver, 2002. ‘Harnessing complexity:
the moderating effect of national culture on entrepreneurial orientation and strategic
alliance portfolio complexity’, Entrepreneurship Theory and Practice, 26, 4, 145-161.
Medcof JW., 1997. ‘Why too many alliances end in divorce’. Long Range Planning, 30, 5,
718-732.
Mowery, D.C., Oxley, J.E., Silverman, B.S., 1998. Technological overlap and interfirm
cooperation: implications for the resource-based view of the firm, Research Policy 27,
507–523.
Narula, R. and J. Hagedoorn, 1999, Innovation through strategic alliances: Moving towards
international partnerships and contractual agreements. Technovation 19, 283 – 294.
Narula, R., Santangelo, G.D, 2008, Location, collocation and R&D alliances in the European
ICT Industry. Research Policy 38, 393-403.
Narula, Rajneesh, 2001, Choosing between internal and non-internal R&D activities: some
technological and economic factors. Technology Analysis and Strategic Management,
vol 13(3), pp. 365-387.
Nooteboom, B., 1992. ‘Information technology, transaction costs and the decision to "make or
buy’. Technology Analysis & Strategic Management, 4, 339-350.
OECD (2007). Intellectual Assets and International Investment: A stocktaking of the
evidence. Report to the OECD Investment Committee DAF/INV/WD(2007)6, Paris,
OECD.
OECD, 2001. New Patterns of Industrial Globalisation: cross-border mergers and acquisitions
and strategic alliances, OECD, Paris.
Overby, M. L., and Ozcan, S. 2006. ‘Partner diversity and shareholder value: A study of high-
tech multi-firm alliances’. From
ww.cbs.dk/content/download/36129/546394/file/Overby%20 Ozcan.pdf
Owen-Smith, J., Powell, W.W., 2004. Knowledge networks as channels and conduits: the
effects of spillovers in the Boston biotechnology community. Organization Science 15,
5–21.
Oxley, J. E., & Sampson, R. C., 2004. ‘The scope and governance of international R&D
alliances’, Strategic Management Journal, 25, 723–750.
31
Ozcan, C. P., & Eisenhardt, K. M., 2009. ‘Origins of alliance portfolios: Entrepreneurs,
network strategies, and firm performance’. Academy of Management Journal, 52, 246–
279.
Park, S. H., & Ungson, G. R., 2001. ‘Interfirm rivalry and managerial complexity: A
conceptual framework of alliance failure’. Organization Science, 12, 37–53.
Patel, P., and Pavitt, K., 1991. Large firms in the production of the world’s technology: an
important case of non-globalisation, Journal of International Business 22(1), 1-21.
Powell, W. W., K. W. Koput and L. Smith-Doerr, 1996. Inter-organizational collaboration
and the locus of innovation: Networks of learning in biotechnology. Administrative
Science Quarterly 41, 116–145.
Ravenscraft, D, J and Scherer, F, M, 1989, The profitability of mergers, International Journal
of Industrial Organization, 7: 101-116.
Reuer, J. and Zollo, M., 2005. ‘Termination Outcomes of Research Alliances’. Research
Policy 34, 1, 101-115.
Robson, M.J., C.S. Katsikeas and D.C. Bello,2008. ‘Drivers and performance outcomes of
trust in international strategic alliances: the role of organizational complexity’.
Organization Science, 19, 647-665.
Rowley, T, Behrens, D & Krackhardt, D. (2000) ‘Redundant governance structures: An
analysis of structural and relational embeddedness in the steel and semiconductor
industries’ Strategic Management Journal, 21, 369-386.
Sampson, R. C., 2007. ‘R&D Alliances and Firm Performance: The Impact of Technological
Diversity and Alliance Organization on Innovation’. Academy of Management Journal
50,2, 364-386.
Schilling, M.A., 2008. Understanding the alliance data. Strategic Management Journal, 30(3),
233-260.
Vanhaverbeke, W, Duysters, G and N. Noorderhaven (2002), External technology sourcing
through alliances or acquisitions: an analysis of the application-specific integrated
circuits industry, Organization Science, 13: 714-733.
Vassolo RS, Anand J, Folta TB., 2004. ‘Non-additivity in portfolios of exploration activities:
a real options-based analysis of equity alliances in biotechnology’. Strategic
Management Journal 25, 11, 1045-1061.
Villalonga, B., McGahan, A.M., 2005. The choice among acquisitions, alliances, and
divestitures, Strategic Management Journal 26 (13), 1183–1208.

32
Wassmer, U., 2008. ‘Alliance Portfolios: A Review and Research Agenda’. Journal of
Management, 0149206308328484.
33
Table 1. Number of firms by country of headquarters EU Number of firms Non-EU Number of firms Austria 3 Canada 1
Belgium 2 Japan 15
Denmark 3 Liechtenstein 1
Finland 6 Norway 3
France 21 South Africa 1
Germany 26 Switzerland 6
Great Britain 19 US 34
Ireland 2 Total 61 Italy 5
Luxembourg 1
Portugal 1
Spain 2
Sweden 5
The Netherlands 8
Total 104
34
Table 2. Number of firms by Sector
Sector EU
firms non-EU firms Sector
EU firms
non-EU firms
Manufacture of steel; steel tubes 2 0
Oils and fats 2 2
Non- ferrous metals 3 1 Dairy products 2 1 Clay Products 1 1 Fruit and vegetables 2 0 Cement, lime and plaster 2 0 Grain milling and starch 2 2 Articles of concrete and cement 2 0 Pasta 1 0 Glass 1 2 Bread, pastry and biscuits 2 1 Ceramics 3 0 Sugar 3 0 Chemical Products 4 1 Confectionery and ice cream 2 1 Paint & ink 3 1 Animal feed 1 3 Pharmaceuticals 3 2 Alcohol, spirits, wine and cider 2 1 Soap, detergents and toiletries 4 1 Beer 2 1
Manufacture of metal products 1 3 Soft drinks and water 2 2 Agricultural machinery 2 2 Tobacco 2 2 Manufacture of machine tools 4 1 Textiles 2 0
Computer and office equipment 0 4 Leather 2 0 Insulated wires and cables 3 1 Footwear 0 0 Electrical machinery 3 2 Clothing 1 0 Batteries and accumulators 1 2 Wood sawing 2 0 Electronic valves and tubes 2 1 Wood boards and wood products 2 0 Telecommunications equipment 4 1 Paper, pulp and articles of paper 4 0 Television and radio receivers 2 3 Publishing 3 0
Measuring & testing instruments 4 1 Rubber products and rubber tyres 3 2 Domestic electric appliances 3 1 Plastics 4 1 Lighting equipment and lamps 3 1 Musical instruments 1 2 Motor vehicles 4 2 Toys and sports goods 1 1 Motor vehicles parts 2 1 Services 0 0 Shipbuilding 2 1 Telecommunication services 5 0 Railway, locomotives and stock 3 1 IT services 1 4 Cycles and motor cycles 3 2 Retailing 1 0 Aerospace 5 0 Medical instruments 3 2 Optical instruments 1 3 Clocks and watches 1 2 Note: Because a firm can have a leading position in more than one industry, the numbers in the table add up to more than 165
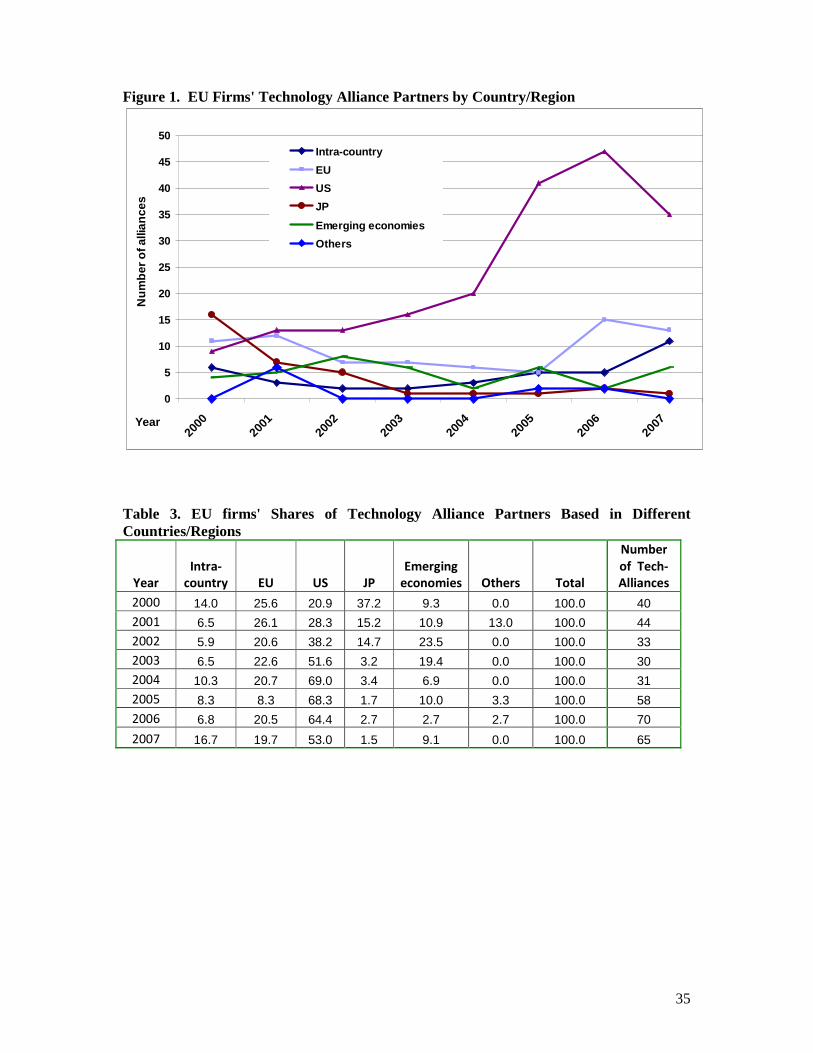
35
Figure 1. EU Firms' Technology Alliance Partners by Country/Region
0
5
10
15
20
25
30
35
40
45
50
2000
2001
2002
2003
2004
2005
2006
2007Year
Nu
mb
er o
f alli
ance
sIntra-country
EU
US
JP
Emerging economies
Others
Table 3. EU firms' Shares of Technology Alliance Partners Based in Different Countries/Regions
Year
Intra-
country EU US JP
Emerging
economies Others Total
Number
of Tech-
Alliances
2000 14.0 25.6 20.9 37.2 9.3 0.0 100.0 40
2001 6.5 26.1 28.3 15.2 10.9 13.0 100.0 44
2002 5.9 20.6 38.2 14.7 23.5 0.0 100.0 33
2003 6.5 22.6 51.6 3.2 19.4 0.0 100.0 30
2004 10.3 20.7 69.0 3.4 6.9 0.0 100.0 31
2005 8.3 8.3 68.3 1.7 10.0 3.3 100.0 58
2006 6.8 20.5 64.4 2.7 2.7 2.7 100.0 70
2007 16.7 19.7 53.0 1.5 9.1 0.0 100.0 65
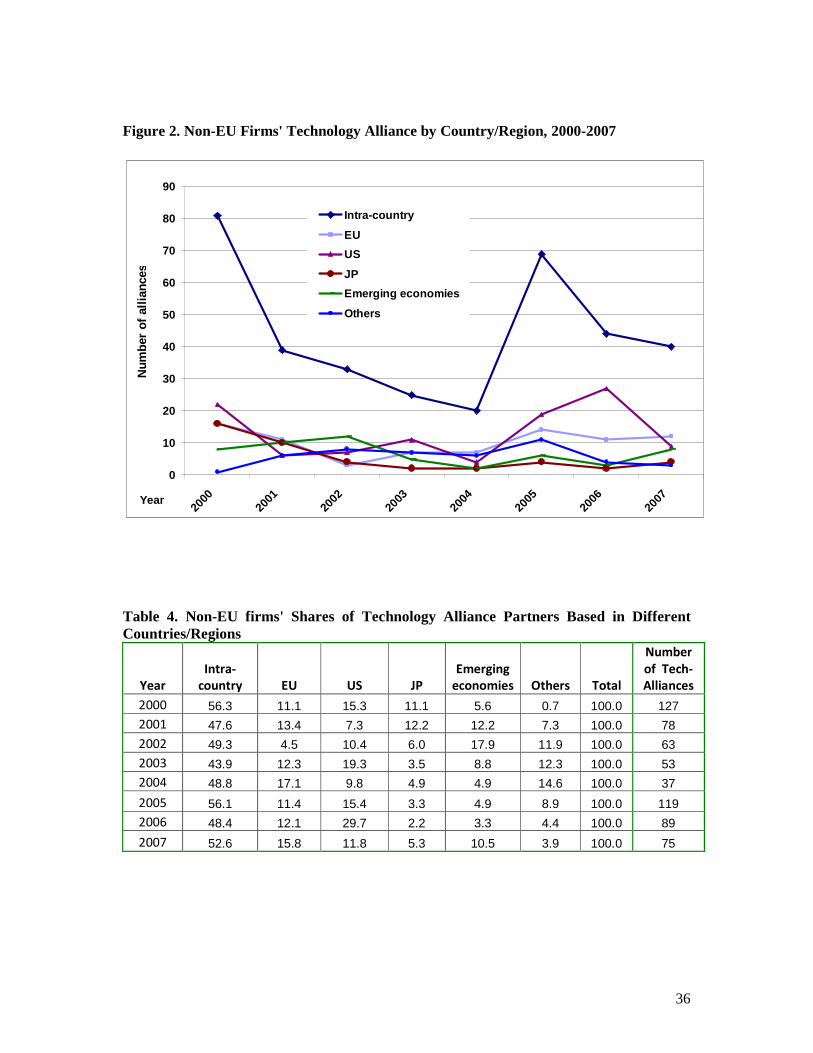
36
Figure 2. Non-EU Firms' Technology Alliance by Country/Region, 2000-2007
0
10
20
30
40
50
60
70
80
90
2000
2001
2002
2003
2004
2005
2006
2007Year
Num
ber
of a
llian
ces
Intra-country
EU
US
JP
Emerging economies
Others
Table 4. Non-EU firms' Shares of Technology Alliance Partners Based in Different Countries/Regions
Year
Intra-
country EU US JP
Emerging
economies Others Total
Number
of Tech-
Alliances
2000 56.3 11.1 15.3 11.1 5.6 0.7 100.0 127
2001 47.6 13.4 7.3 12.2 12.2 7.3 100.0 78
2002 49.3 4.5 10.4 6.0 17.9 11.9 100.0 63
2003 43.9 12.3 19.3 3.5 8.8 12.3 100.0 53
2004 48.8 17.1 9.8 4.9 4.9 14.6 100.0 37
2005 56.1 11.4 15.4 3.3 4.9 8.9 100.0 119
2006 48.4 12.1 29.7 2.2 3.3 4.4 100.0 89
2007 52.6 15.8 11.8 5.3 10.5 3.9 100.0 75
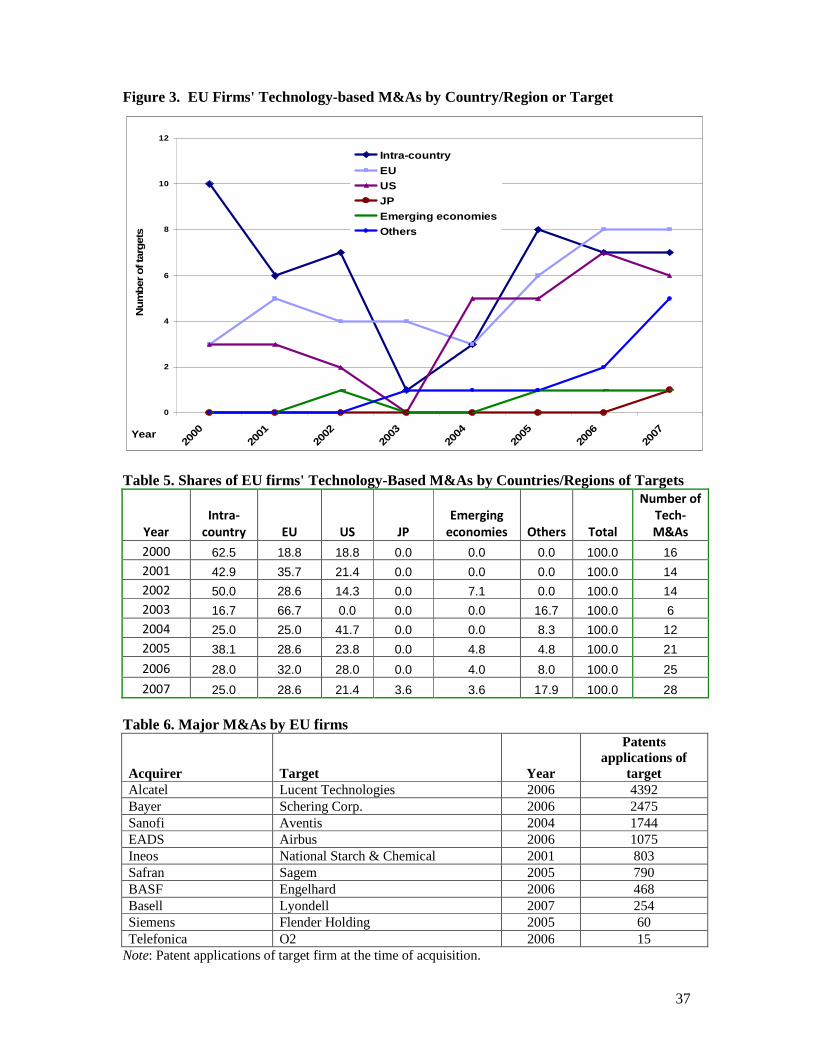
37
Figure 3. EU Firms' Technology-based M&As by Country/Region or Target
0
2
4
6
8
10
12
2000
2001
2002
2003
2004
2005
2006
2007Year
Num
ber
of t
arget
s
Intra-country
EU
US
JP
Emerging economies
Others
Table 5. Shares of EU firms' Technology-Based M&As by Countries/Regions of Targets
Year
Intra-
country EU US JP
Emerging
economies Others Total
Number of
Tech-
M&As
2000 62.5 18.8 18.8 0.0 0.0 0.0 100.0 16
2001 42.9 35.7 21.4 0.0 0.0 0.0 100.0 14
2002 50.0 28.6 14.3 0.0 7.1 0.0 100.0 14
2003 16.7 66.7 0.0 0.0 0.0 16.7 100.0 6
2004 25.0 25.0 41.7 0.0 0.0 8.3 100.0 12
2005 38.1 28.6 23.8 0.0 4.8 4.8 100.0 21
2006 28.0 32.0 28.0 0.0 4.0 8.0 100.0 25
2007 25.0 28.6 21.4 3.6 3.6 17.9 100.0 28 Table 6. Major M&As by EU firms
Acquirer Target Year
Patents applications of
target Alcatel Lucent Technologies 2006 4392 Bayer Schering Corp. 2006 2475 Sanofi Aventis 2004 1744 EADS Airbus 2006 1075 Ineos National Starch & Chemical 2001 803 Safran Sagem 2005 790 BASF Engelhard 2006 468 Basell Lyondell 2007 254 Siemens Flender Holding 2005 60 Telefonica O2 2006 15
Note: Patent applications of target firm at the time of acquisition.
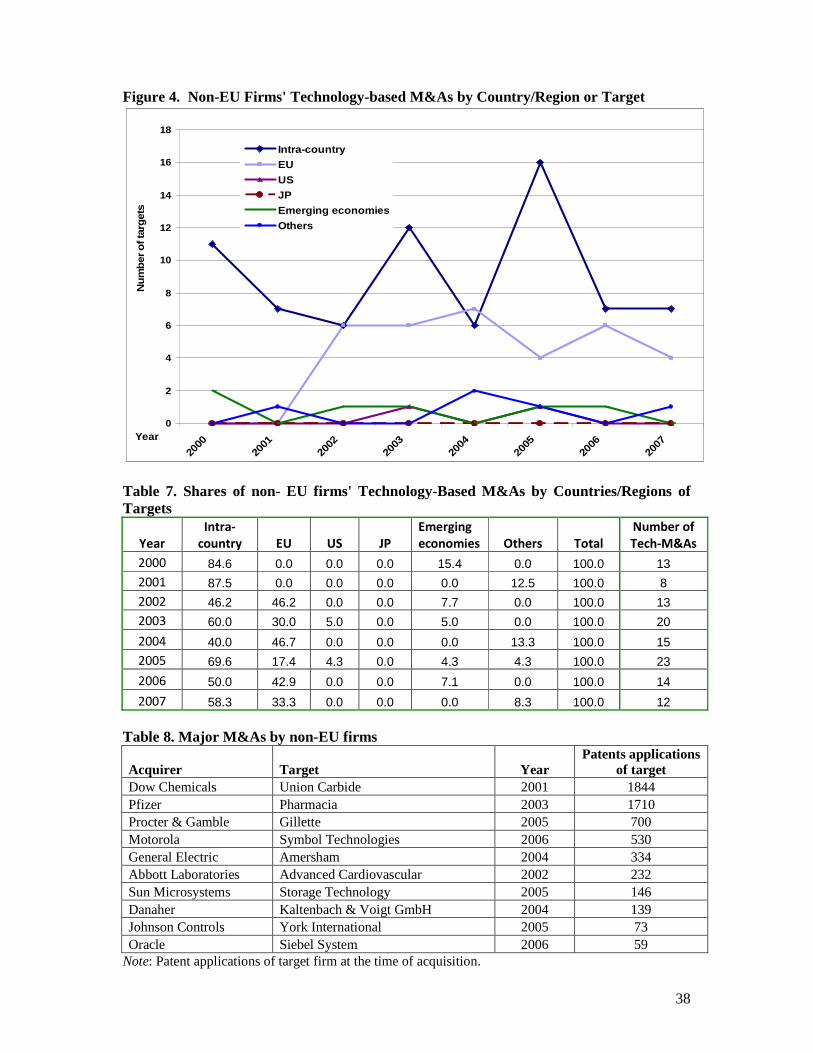
38
Figure 4. Non-EU Firms' Technology-based M&As by Country/Region or Target
0
2
4
6
8
10
12
14
16
18
2000
2001
2002
2003
2004
2005
2006
2007
Year
Nu
mb
er o
f tar
get
sIntra-country
EU
US
JP
Emerging economies
Others
Table 7. Shares of non- EU firms' Technology-Based M&As by Countries/Regions of Targets
Year
Intra-
country EU US JP
Emerging
economies Others Total
Number of
Tech-M&As
2000 84.6 0.0 0.0 0.0 15.4 0.0 100.0 13
2001 87.5 0.0 0.0 0.0 0.0 12.5 100.0 8
2002 46.2 46.2 0.0 0.0 7.7 0.0 100.0 13
2003 60.0 30.0 5.0 0.0 5.0 0.0 100.0 20
2004 40.0 46.7 0.0 0.0 0.0 13.3 100.0 15
2005 69.6 17.4 4.3 0.0 4.3 4.3 100.0 23
2006 50.0 42.9 0.0 0.0 7.1 0.0 100.0 14
2007 58.3 33.3 0.0 0.0 0.0 8.3 100.0 12 Table 8. Major M&As by non-EU firms
Acquirer Target Year Patents applications
of target Dow Chemicals Union Carbide 2001 1844 Pfizer Pharmacia 2003 1710 Procter & Gamble Gillette 2005 700 Motorola Symbol Technologies 2006 530 General Electric Amersham 2004 334 Abbott Laboratories Advanced Cardiovascular 2002 232 Sun Microsystems Storage Technology 2005 146 Danaher Kaltenbach & Voigt GmbH 2004 139 Johnson Controls York International 2005 73 Oracle Siebel System 2006 59
Note: Patent applications of target firm at the time of acquisition.
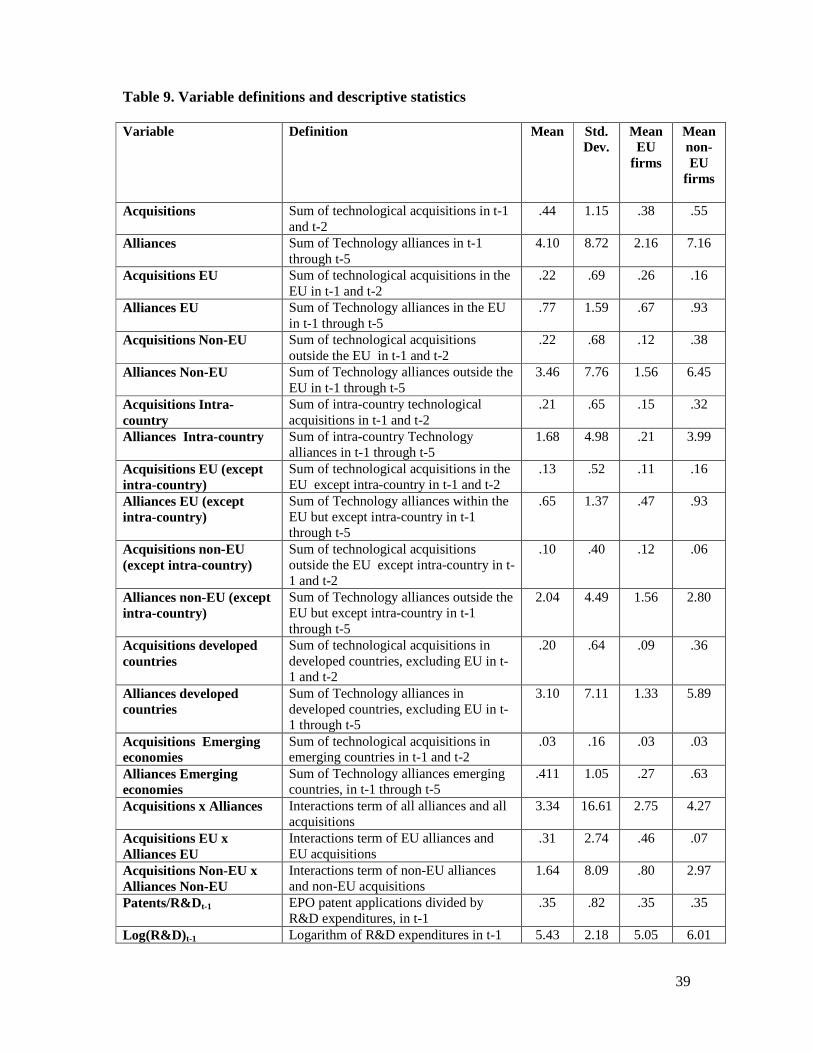
39
Table 9. Variable definitions and descriptive statistics
Variable Definition Mean Std. Dev.
Mean EU
firms
Mean non-EU
firms
Acquisitions Sum of technological acquisitions in t-1 and t-2
.44 1.15 .38 .55
Alliances
Sum of Technology alliances in t-1 through t-5
4.10 8.72 2.16 7.16
Acquisitions EU Sum of technological acquisitions in the EU in t-1 and t-2
.22 .69 .26 .16
Alliances EU Sum of Technology alliances in the EU in t-1 through t-5
.77 1.59 .67 .93
Acquisitions Non-EU Sum of technological acquisitions outside the EU in t-1 and t-2
.22 .68 .12 .38
Alliances Non-EU Sum of Technology alliances outside the EU in t-1 through t-5
3.46 7.76 1.56 6.45
Acquisitions Intra-country
Sum of intra-country technological acquisitions in t-1 and t-2
.21 .65 .15 .32
Alliances Intra-country Sum of intra-country Technology alliances in t-1 through t-5
1.68 4.98 .21 3.99
Acquisitions EU (except intra-country)
Sum of technological acquisitions in the EU except intra-country in t-1 and t-2
.13 .52 .11 .16
Alliances EU (except intra-country)
Sum of Technology alliances within the EU but except intra-country in t-1 through t-5
.65 1.37 .47 .93
Acquisitions non-EU (except intra-country)
Sum of technological acquisitions outside the EU except intra-country in t-1 and t-2
.10 .40 .12 .06
Alliances non-EU (except intra-country)
Sum of Technology alliances outside the EU but except intra-country in t-1 through t-5
2.04 4.49 1.56 2.80
Acquisitions developed countries
Sum of technological acquisitions in developed countries, excluding EU in t-1 and t-2
.20 .64 .09 .36
Alliances developed countries
Sum of Technology alliances in developed countries, excluding EU in t-1 through t-5
3.10 7.11 1.33 5.89
Acquisitions Emerging economies
Sum of technological acquisitions in emerging countries in t-1 and t-2
.03 .16 .03 .03
Alliances Emerging economies
Sum of Technology alliances emerging countries, in t-1 through t-5
.411 1.05 .27 .63
Acquisitions x Alliances Interactions term of all alliances and all acquisitions
3.34 16.61 2.75 4.27
Acquisitions EU x Alliances EU
Interactions term of EU alliances and EU acquisitions
.31 2.74 .46 .07
Acquisitions Non-EU x Alliances Non-EU
Interactions term of non-EU alliances and non-EU acquisitions
1.64 8.09 .80 2.97
Patents/R&Dt-1 EPO patent applications divided by R&D expenditures, in t-1
.35 .82 .35 .35
Log(R&D) t-1 Logarithm of R&D expenditures in t-1 5.43 2.18 5.05 6.01
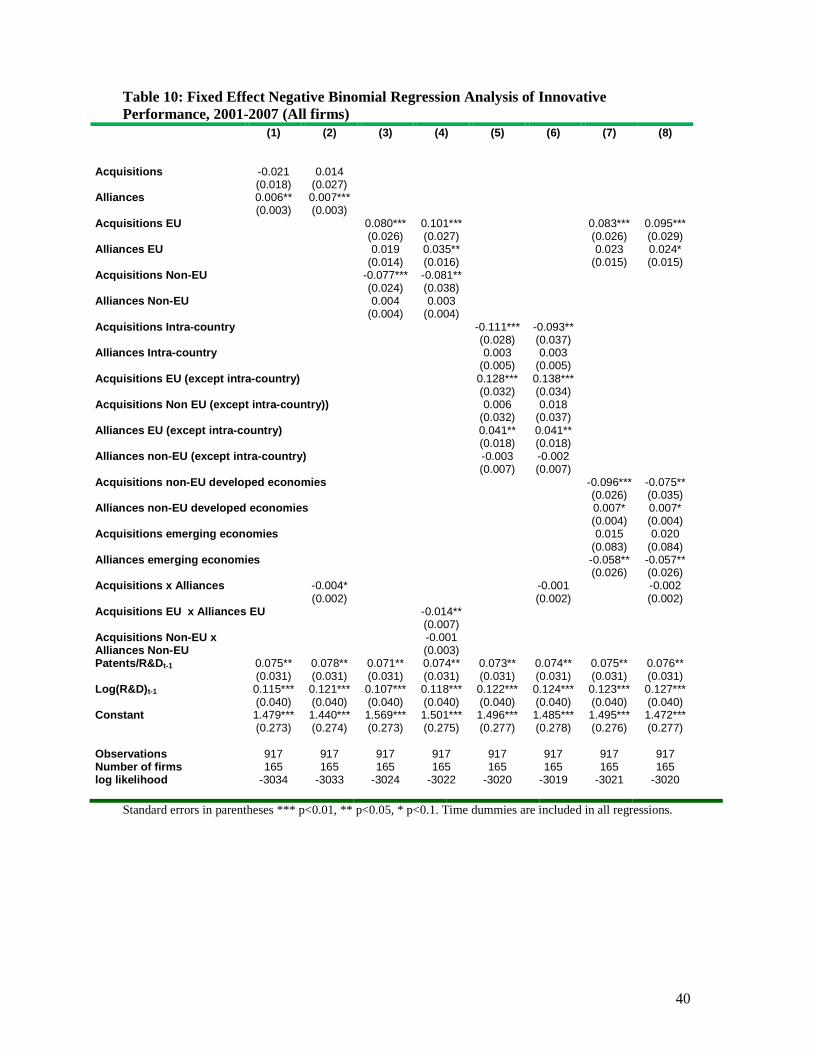
40
Table 10: Fixed Effect Negative Binomial Regression Analysis of Innovative Performance, 2001-2007 (All firms)
(1) (2) (3) (4) (5) (6) (7) (8)
Acquisitions -0.021 (0.018)
0.014 (0.027)
Alliances 0.006** (0.003)
0.007*** (0.003)
Acquisitions EU 0.080*** (0.026)
0.101*** (0.027)
0.083*** (0.026)
0.095*** (0.029)
Alliances EU 0.019 0.035** 0.023 0.024* (0.014) (0.016) (0.015) (0.015)
Acquisitions Non-EU -0.077*** (0.024)
-0.081** (0.038)
Alliances Non-EU 0.004 0.003 (0.004) (0.004)
Acquisitions Intra-country -0.111*** -0.093** (0.028) (0.037)
Alliances Intra-country 0.003 0.003 (0.005) (0.005)
Acquisitions EU (except intra-country) 0.128*** 0.138*** (0.032) (0.034)
Acquisitions Non EU (except intra-country)) 0.006 0.018 (0.032) (0.037)
Alliances EU (except intra-country) 0.041** 0.041** (0.018) (0.018)
Alliances non-EU (except intra-country) -0.003 -0.002 (0.007) (0.007)
Acquisitions non-EU developed economies -0.096*** -0.075** (0.026) (0.035)
Alliances non-EU developed economies 0.007* 0.007* (0.004) (0.004)
Acquisitions emerging economies 0.015 0.020 (0.083) (0.084)
Alliances emerging economies -0.058** -0.057** (0.026) (0.026)
Acquisitions x Alliances -0.004* (0.002)
-0.001 (0.002)
-0.002 (0.002)
Acquisitions EU x Alliances EU -0.014** (0.007)
Acquisitions Non-EU x Alliances Non-EU
-0.001 (0.003)
Patents/R&Dt-1 0.075** 0.078** 0.071** 0.074** 0.073** 0.074** 0.075** 0.076** (0.031) (0.031) (0.031) (0.031) (0.031) (0.031) (0.031) (0.031)
Log(R&D)t-1 0.115*** 0.121*** 0.107*** 0.118*** 0.122*** 0.124*** 0.123*** 0.127*** (0.040) (0.040) (0.040) (0.040) (0.040) (0.040) (0.040) (0.040)
Constant 1.479*** 1.440*** 1.569*** 1.501*** 1.496*** 1.485*** 1.495*** 1.472*** (0.273) (0.274) (0.273) (0.275) (0.277) (0.278) (0.276) (0.277) Observations 917 917 917 917 917 917 917 917 Number of firms 165 165 165 165 165 165 165 165 log likelihood -3034 -3033 -3024 -3022 -3020 -3019 -3021 -3020
Standard errors in parentheses *** p<0.01, ** p<0.05, * p<0.1. Time dummies are included in all regressions.
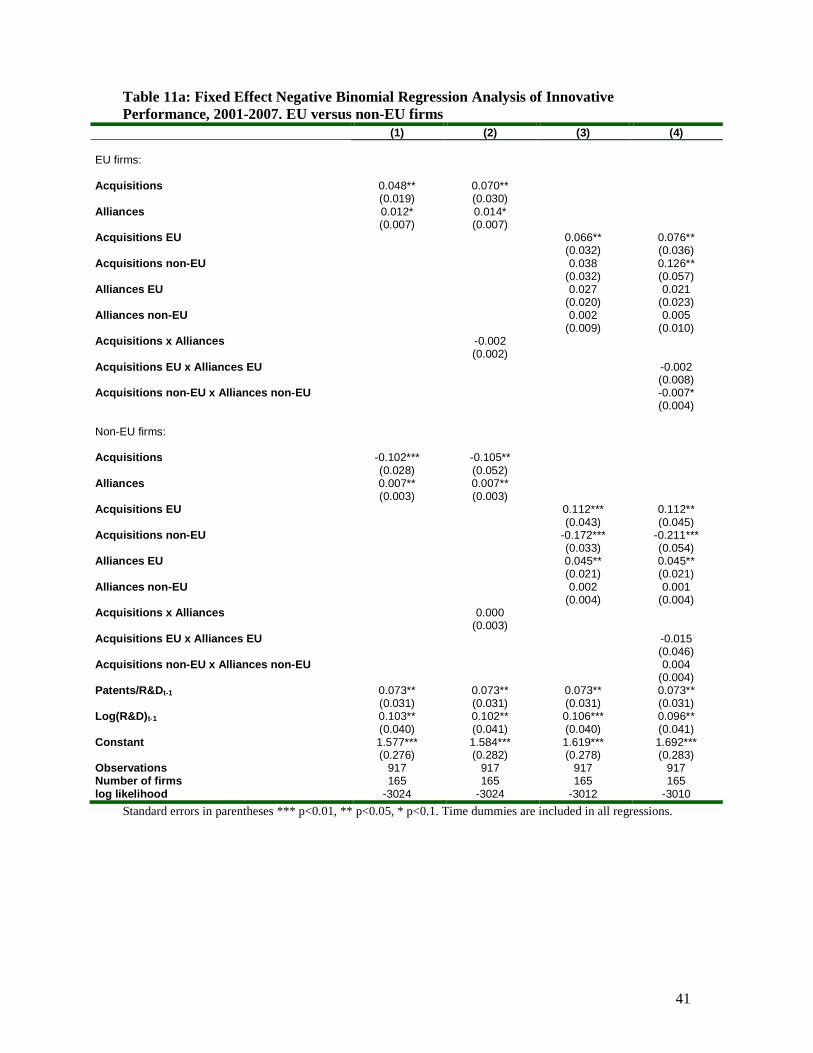
41
Table 11a: Fixed Effect Negative Binomial Regression Analysis of Innovative Performance, 2001-2007. EU versus non-EU firms
(1) (2) (3) (4) EU firms:
Acquisitions
0.048**
0.070**
(0.019) (0.030) Alliances 0.012* 0.014* (0.007) (0.007) Acquisitions EU 0.066** 0.076** (0.032) (0.036) Acquisitions non-EU 0.038 0.126** (0.032) (0.057) Alliances EU 0.027 0.021 (0.020) (0.023) Alliances non-EU 0.002 0.005 (0.009) (0.010) Acquisitions x Alliances -0.002 (0.002) Acquisitions EU x Alliances EU -0.002 (0.008) Acquisitions non-EU x Alliances non-EU -0.007* (0.004) Non-EU firms: Acquisitions -0.102*** -0.105** (0.028) (0.052) Alliances 0.007** 0.007** (0.003) (0.003) Acquisitions EU 0.112*** 0.112** (0.043) (0.045) Acquisitions non-EU -0.172*** -0.211*** (0.033) (0.054) Alliances EU 0.045** 0.045** (0.021) (0.021) Alliances non-EU 0.002 0.001 (0.004) (0.004) Acquisitions x Alliances 0.000 (0.003) Acquisitions EU x Alliances EU -0.015 (0.046) Acquisitions non-EU x Alliances non-EU 0.004 (0.004) Patents/R&Dt-1 0.073** 0.073** 0.073** 0.073** (0.031) (0.031) (0.031) (0.031) Log(R&D)t-1 0.103** 0.102** 0.106*** 0.096** (0.040) (0.041) (0.040) (0.041) Constant 1.577*** 1.584*** 1.619*** 1.692*** (0.276) (0.282) (0.278) (0.283) Observations 917 917 917 917 Number of firms 165 165 165 165 log likelihood -3024 -3024 -3012 -3010
Standard errors in parentheses *** p<0.01, ** p<0.05, * p<0.1. Time dummies are included in all regressions.
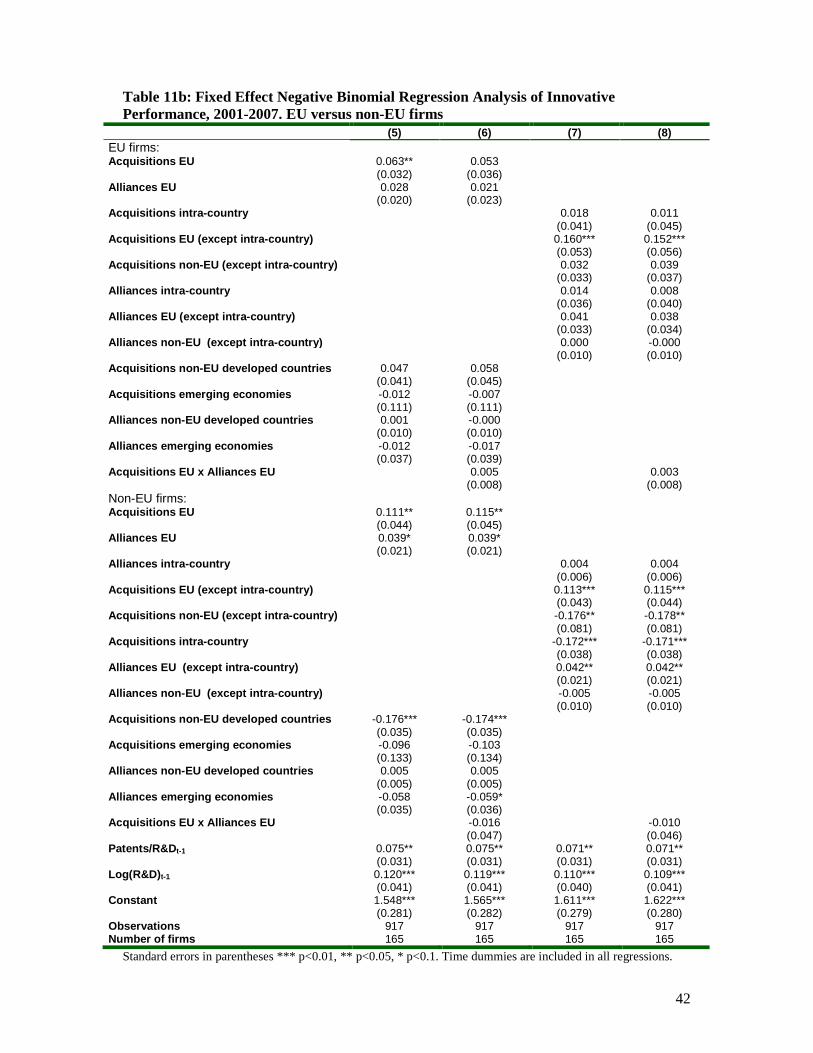
42
Table 11b: Fixed Effect Negative Binomial Regression Analysis of Innovative Performance, 2001-2007. EU versus non-EU firms
(5) (6) (7) (8) EU firms: Acquisitions EU 0.063** 0.053 (0.032) (0.036) Alliances EU 0.028 0.021 (0.020) (0.023) Acquisitions intra-country 0.018 0.011 (0.041) (0.045) Acquisitions EU (except intra-country) 0.160*** 0.152*** (0.053) (0.056) Acquisitions non-EU (except intra-country) 0.032 0.039 (0.033) (0.037) Alliances intra-country 0.014 0.008 (0.036) (0.040) Alliances EU (except intra-country) 0.041 0.038 (0.033) (0.034) Alliances non-EU (except intra-country) 0.000 -0.000 (0.010) (0.010) Acquisitions non-EU developed countries 0.047 0.058 (0.041) (0.045) Acquisitions emerging economies -0.012 -0.007 (0.111) (0.111) Alliances non-EU developed countries 0.001 -0.000 (0.010) (0.010) Alliances emerging economies -0.012 -0.017 (0.037) (0.039) Acquisitions EU x Alliances EU 0.005 0.003 (0.008) (0.008) Non-EU firms: Acquisitions EU 0.111** 0.115** (0.044) (0.045) Alliances EU 0.039* 0.039* (0.021) (0.021) Alliances intra-country 0.004 0.004 (0.006) (0.006) Acquisitions EU (except intra-country) 0.113*** 0.115*** (0.043) (0.044) Acquisitions non-EU (except intra-country) -0.176** -0.178** (0.081) (0.081) Acquisitions intra-country -0.172*** -0.171*** (0.038) (0.038) Alliances EU (except intra-country) 0.042** 0.042** (0.021) (0.021) Alliances non-EU (except intra-country) -0.005 -0.005 (0.010) (0.010) Acquisitions non-EU developed countries -0.176*** -0.174*** (0.035) (0.035) Acquisitions emerging economies -0.096 -0.103 (0.133) (0.134) Alliances non-EU developed countries 0.005 0.005 (0.005) (0.005) Alliances emerging economies -0.058 -0.059* (0.035) (0.036) Acquisitions EU x Alliances EU -0.016 -0.010 (0.047) (0.046) Patents/R&Dt-1 0.075** 0.075** 0.071** 0.071** (0.031) (0.031) (0.031) (0.031) Log(R&D)t-1 0.120*** 0.119*** 0.110*** 0.109*** (0.041) (0.041) (0.040) (0.041) Constant 1.548*** 1.565*** 1.611*** 1.622*** (0.281) (0.282) (0.279) (0.280) Observations 917 917 917 917 Number of firms 165 165 165 165
Standard errors in parentheses *** p<0.01, ** p<0.05, * p<0.1. Time dummies are included in all regressions.
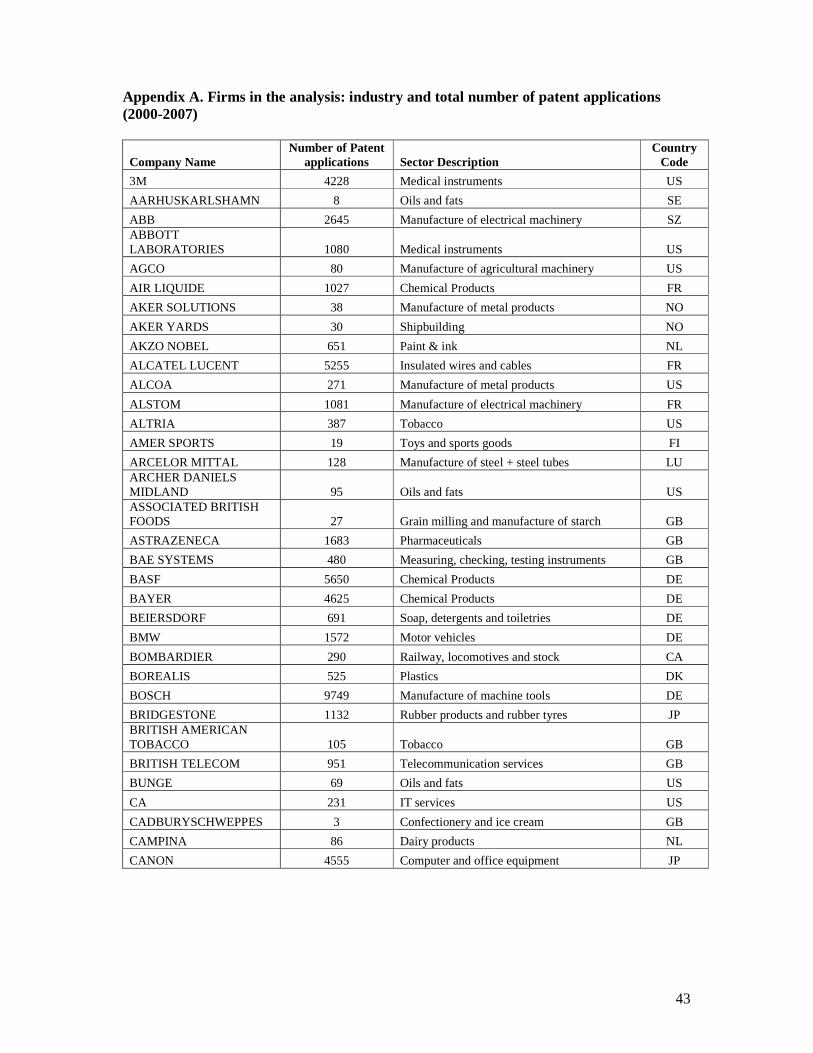
43
Appendix A. Firms in the analysis: industry and total number of patent applications (2000-2007)
Company Name Number of Patent
applications Sector Description Country
Code
3M 4228 Medical instruments US
AARHUSKARLSHAMN 8 Oils and fats SE
ABB 2645 Manufacture of electrical machinery SZ ABBOTT LABORATORIES 1080 Medical instruments US
AGCO 80 Manufacture of agricultural machinery US
AIR LIQUIDE 1027 Chemical Products FR
AKER SOLUTIONS 38 Manufacture of metal products NO
AKER YARDS 30 Shipbuilding NO
AKZO NOBEL 651 Paint & ink NL
ALCATEL LUCENT 5255 Insulated wires and cables FR
ALCOA 271 Manufacture of metal products US
ALSTOM 1081 Manufacture of electrical machinery FR
ALTRIA 387 Tobacco US
AMER SPORTS 19 Toys and sports goods FI
ARCELOR MITTAL 128 Manufacture of steel + steel tubes LU ARCHER DANIELS MIDLAND 95 Oils and fats US ASSOCIATED BRITISH FOODS 27 Grain milling and manufacture of starch GB
ASTRAZENECA 1683 Pharmaceuticals GB
BAE SYSTEMS 480 Measuring, checking, testing instruments GB
BASF 5650 Chemical Products DE
BAYER 4625 Chemical Products DE
BEIERSDORF 691 Soap, detergents and toiletries DE
BMW 1572 Motor vehicles DE
BOMBARDIER 290 Railway, locomotives and stock CA
BOREALIS 525 Plastics DK
BOSCH 9749 Manufacture of machine tools DE
BRIDGESTONE 1132 Rubber products and rubber tyres JP BRITISH AMERICAN TOBACCO 105 Tobacco GB
BRITISH TELECOM 951 Telecommunication services GB
BUNGE 69 Oils and fats US
CA 231 IT services US
CADBURYSCHWEPPES 3 Confectionery and ice cream GB
CAMPINA 86 Dairy products NL
CANON 4555 Computer and office equipment JP
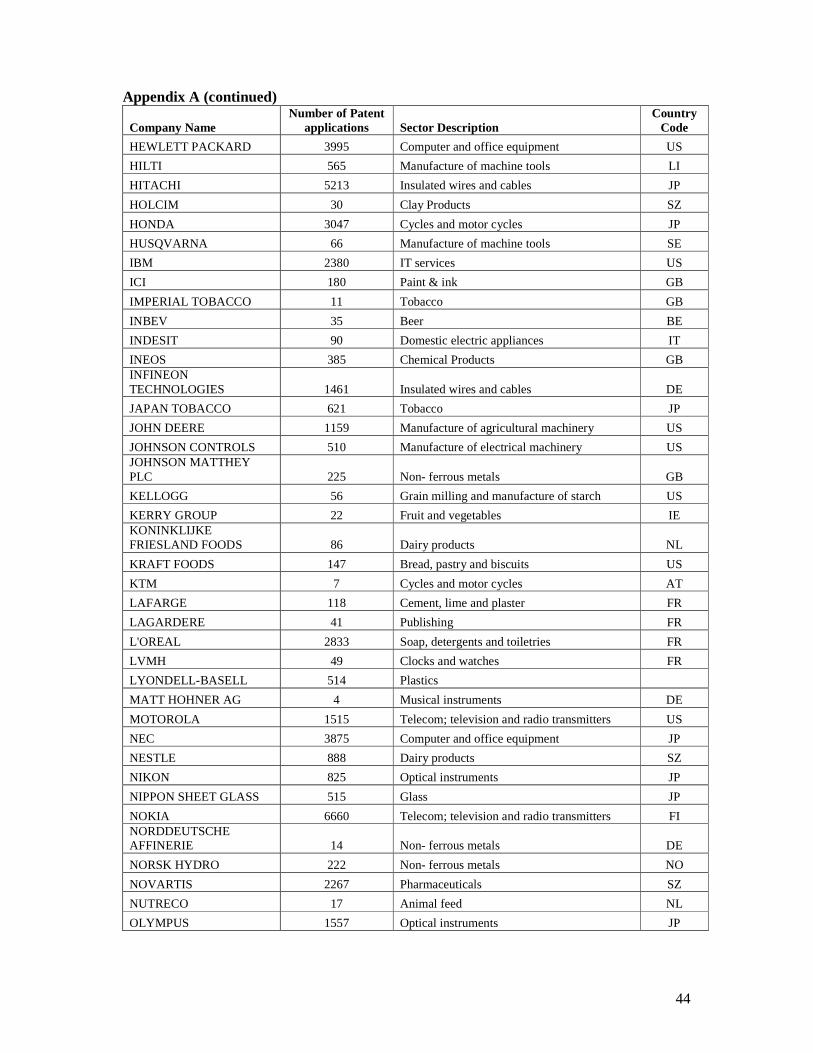
44
Appendix A (continued)
Company Name Number of Patent
applications Sector Description Country
Code
HEWLETT PACKARD 3995 Computer and office equipment US
HILTI 565 Manufacture of machine tools LI
HITACHI 5213 Insulated wires and cables JP
HOLCIM 30 Clay Products SZ
HONDA 3047 Cycles and motor cycles JP
HUSQVARNA 66 Manufacture of machine tools SE
IBM 2380 IT services US
ICI 180 Paint & ink GB
IMPERIAL TOBACCO 11 Tobacco GB
INBEV 35 Beer BE
INDESIT 90 Domestic electric appliances IT
INEOS 385 Chemical Products GB INFINEON TECHNOLOGIES 1461 Insulated wires and cables DE
JAPAN TOBACCO 621 Tobacco JP
JOHN DEERE 1159 Manufacture of agricultural machinery US
JOHNSON CONTROLS 510 Manufacture of electrical machinery US JOHNSON MATTHEY PLC 225 Non- ferrous metals GB
KELLOGG 56 Grain milling and manufacture of starch US
KERRY GROUP 22 Fruit and vegetables IE KONINKLIJKE FRIESLAND FOODS 86 Dairy products NL
KRAFT FOODS 147 Bread, pastry and biscuits US
KTM 7 Cycles and motor cycles AT
LAFARGE 118 Cement, lime and plaster FR
LAGARDERE 41 Publishing FR
L'OREAL 2833 Soap, detergents and toiletries FR
LVMH 49 Clocks and watches FR
LYONDELL-BASELL 514 Plastics
MATT HOHNER AG 4 Musical instruments DE
MOTOROLA 1515 Telecom; television and radio transmitters US
NEC 3875 Computer and office equipment JP
NESTLE 888 Dairy products SZ
NIKON 825 Optical instruments JP
NIPPON SHEET GLASS 515 Glass JP
NOKIA 6660 Telecom; television and radio transmitters FI NORDDEUTSCHE AFFINERIE 14 Non- ferrous metals DE
NORSK HYDRO 222 Non- ferrous metals NO
NOVARTIS 2267 Pharmaceuticals SZ
NUTRECO 17 Animal feed NL
OLYMPUS 1557 Optical instruments JP
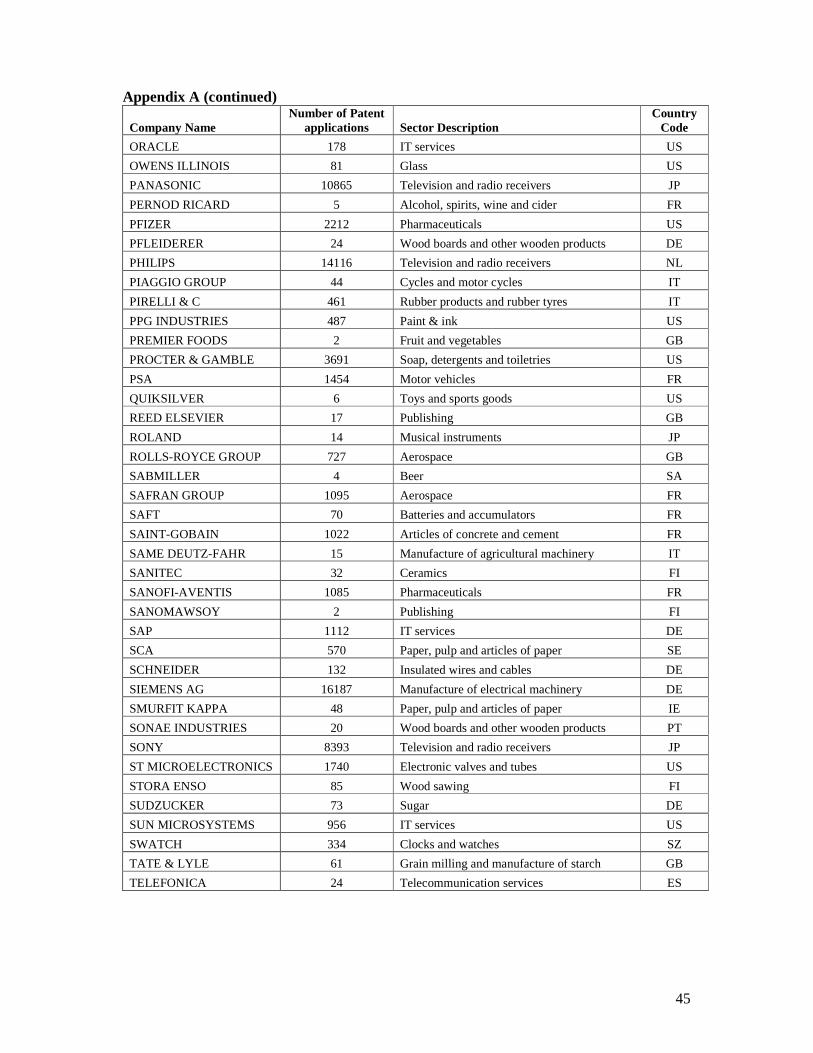
45
Appendix A (continued)
Company Name Number of Patent
applications Sector Description Country
Code
ORACLE 178 IT services US
OWENS ILLINOIS 81 Glass US
PANASONIC 10865 Television and radio receivers JP
PERNOD RICARD 5 Alcohol, spirits, wine and cider FR
PFIZER 2212 Pharmaceuticals US
PFLEIDERER 24 Wood boards and other wooden products DE
PHILIPS 14116 Television and radio receivers NL
PIAGGIO GROUP 44 Cycles and motor cycles IT
PIRELLI & C 461 Rubber products and rubber tyres IT
PPG INDUSTRIES 487 Paint & ink US
PREMIER FOODS 2 Fruit and vegetables GB
PROCTER & GAMBLE 3691 Soap, detergents and toiletries US
PSA 1454 Motor vehicles FR
QUIKSILVER 6 Toys and sports goods US
REED ELSEVIER 17 Publishing GB
ROLAND 14 Musical instruments JP
ROLLS-ROYCE GROUP 727 Aerospace GB
SABMILLER 4 Beer SA
SAFRAN GROUP 1095 Aerospace FR
SAFT 70 Batteries and accumulators FR
SAINT-GOBAIN 1022 Articles of concrete and cement FR
SAME DEUTZ-FAHR 15 Manufacture of agricultural machinery IT
SANITEC 32 Ceramics FI
SANOFI-AVENTIS 1085 Pharmaceuticals FR
SANOMAWSOY 2 Publishing FI
SAP 1112 IT services DE
SCA 570 Paper, pulp and articles of paper SE
SCHNEIDER 132 Insulated wires and cables DE
SIEMENS AG 16187 Manufacture of electrical machinery DE
SMURFIT KAPPA 48 Paper, pulp and articles of paper IE
SONAE INDUSTRIES 20 Wood boards and other wooden products PT
SONY 8393 Television and radio receivers JP
ST MICROELECTRONICS 1740 Electronic valves and tubes US
STORA ENSO 85 Wood sawing FI
SUDZUCKER 73 Sugar DE
SUN MICROSYSTEMS 956 IT services US
SWATCH 334 Clocks and watches SZ
TATE & LYLE 61 Grain milling and manufacture of starch GB
TELEFONICA 24 Telecommunication services ES
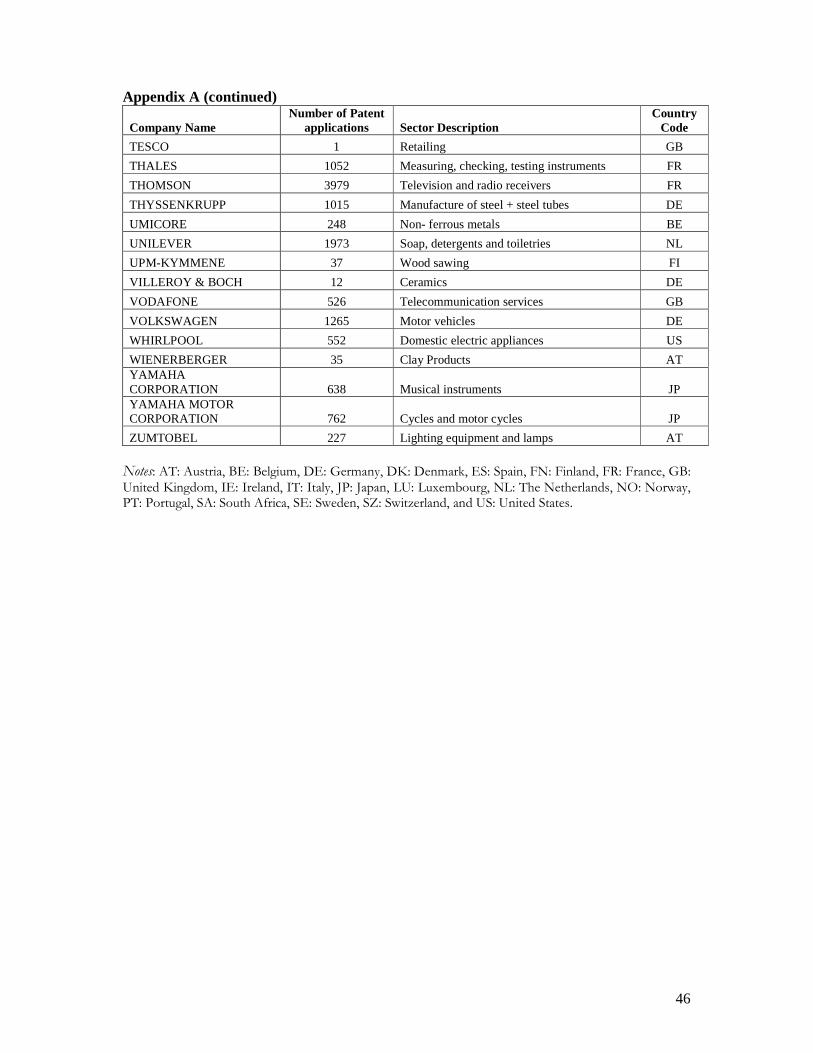
46
Appendix A (continued)
Company Name Number of Patent
applications Sector Description Country
Code
TESCO 1 Retailing GB
THALES 1052 Measuring, checking, testing instruments FR
THOMSON 3979 Television and radio receivers FR
THYSSENKRUPP 1015 Manufacture of steel + steel tubes DE
UMICORE 248 Non- ferrous metals BE
UNILEVER 1973 Soap, detergents and toiletries NL
UPM-KYMMENE 37 Wood sawing FI
VILLEROY & BOCH 12 Ceramics DE
VODAFONE 526 Telecommunication services GB
VOLKSWAGEN 1265 Motor vehicles DE
WHIRLPOOL 552 Domestic electric appliances US
WIENERBERGER 35 Clay Products AT YAMAHA CORPORATION 638 Musical instruments JP YAMAHA MOTOR CORPORATION 762 Cycles and motor cycles JP
ZUMTOBEL 227 Lighting equipment and lamps AT
Notes: AT: Austria, BE: Belgium, DE: Germany, DK: Denmark, ES: Spain, FN: Finland, FR: France, GB:
United Kingdom, IE: Ireland, IT: Italy, JP: Japan, LU: Luxembourg, NL: The Netherlands, NO: Norway, PT: Portugal, SA: South Africa, SE: Sweden, SZ: Switzerland, and US: United States.
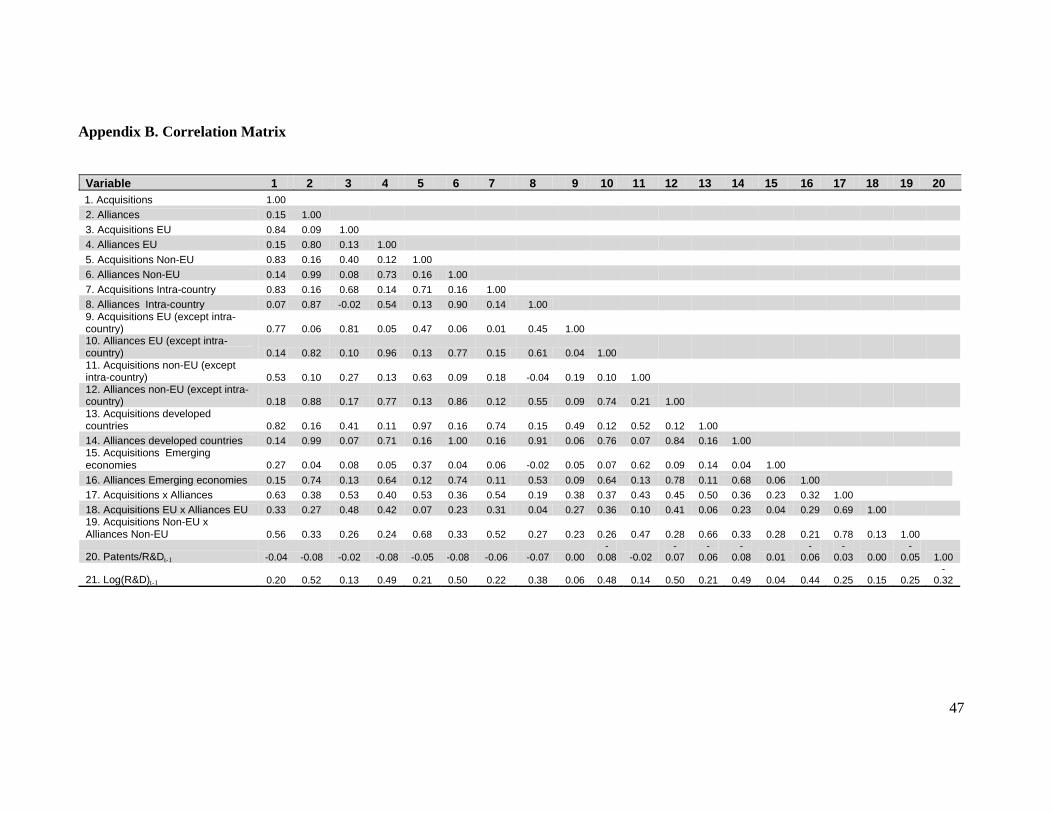
47
Appendix B. Correlation Matrix
Variable 1 2 3 4 5 6 7 8 9 10 11 12 13 14 15 16 17 18 19 20 1. Acquisitions 1.00
2. Alliances 0.15 1.00
3. Acquisitions EU 0.84 0.09 1.00
4. Alliances EU 0.15 0.80 0.13 1.00
5. Acquisitions Non-EU 0.83 0.16 0.40 0.12 1.00
6. Alliances Non-EU 0.14 0.99 0.08 0.73 0.16 1.00
7. Acquisitions Intra-country 0.83 0.16 0.68 0.14 0.71 0.16 1.00
8. Alliances Intra-country 0.07 0.87 -0.02 0.54 0.13 0.90 0.14 1.00 9. Acquisitions EU (except intra-country) 0.77 0.06 0.81 0.05 0.47 0.06 0.01 0.45 1.00 10. Alliances EU (except intra-country) 0.14 0.82 0.10 0.96 0.13 0.77 0.15 0.61 0.04 1.00 11. Acquisitions non-EU (except intra-country) 0.53 0.10 0.27 0.13 0.63 0.09 0.18 -0.04 0.19 0.10 1.00 12. Alliances non-EU (except intra-country) 0.18 0.88 0.17 0.77 0.13 0.86 0.12 0.55 0.09 0.74 0.21 1.00 13. Acquisitions developed countries 0.82 0.16 0.41 0.11 0.97 0.16 0.74 0.15 0.49 0.12 0.52 0.12 1.00
14. Alliances developed countries 0.14 0.99 0.07 0.71 0.16 1.00 0.16 0.91 0.06 0.76 0.07 0.84 0.16 1.00 15. Acquisitions Emerging economies 0.27 0.04 0.08 0.05 0.37 0.04 0.06 -0.02 0.05 0.07 0.62 0.09 0.14 0.04 1.00
16. Alliances Emerging economies 0.15 0.74 0.13 0.64 0.12 0.74 0.11 0.53 0.09 0.64 0.13 0.78 0.11 0.68 0.06 1.00
17. Acquisitions x Alliances 0.63 0.38 0.53 0.40 0.53 0.36 0.54 0.19 0.38 0.37 0.43 0.45 0.50 0.36 0.23 0.32 1.00
18. Acquisitions EU x Alliances EU 0.33 0.27 0.48 0.42 0.07 0.23 0.31 0.04 0.27 0.36 0.10 0.41 0.06 0.23 0.04 0.29 0.69 1.00 19. Acquisitions Non-EU x Alliances Non-EU 0.56 0.33 0.26 0.24 0.68 0.33 0.52 0.27 0.23 0.26 0.47 0.28 0.66 0.33 0.28 0.21 0.78 0.13 1.00
20. Patents/R&Dt-1 -0.04 -0.08 -0.02 -0.08 -0.05 -0.08 -0.06 -0.07 0.00 -
0.08 -0.02 -
0.07 -
0.06 -
0.08 0.01 -
0.06 -
0.03 0.00 -
0.05 1.00
21. Log(R&D)t-1 0.20 0.52 0.13 0.49 0.21 0.50 0.22 0.38 0.06 0.48 0.14 0.50 0.21 0.49 0.04 0.44 0.25 0.15 0.25 -
0.32