Embed Size (px)
Citation preview

Board of Governors General Conference
GOV/INF/2012/12-GC(56)/INF/6 Date: 15 August 2012
General Distribution Original: English
For official use only
Item 6(a) of the Board's provisional agenda (GOV/2012/34) Item 16 of the Conference's provisional agenda (GC(56)/1 and Add.1)
International Status and Prospects for Nuclear Power 2012
Report by the Director General
Summary
• General Conference resolution GC(55)/RES/12 requested the Secretariat to update in 2012 its
report on the International Status and Prospects of Nuclear Power (document GC(54)/INF/5,
issued in 2010), which provides a comprehensive overview of the international status and
prospects of nuclear power. This report responds to that resolution.
Atoms for Peace


GOV/INF/2012/12-GC(56)/INF/6 Page 1
International Status and Prospects for Nuclear Power 2012
Report by the Director General
A. Developments since 2010
1. After two years of small declines, global nuclear power capacity first increased by 4 GW(e) in
2010 to 375 gigawatts (GW(e)) and then dropped in 2011 to 368 GW(e) after the accident at the
Fukushima Daiichi nuclear power plant. In 2010, five new reactors were connected to the grid and one
was permanently retired. In 2011, seven new reactors were connected but thirteen were permanently
retired. Twelve of the thirteen retirements were directly due to the Fukushima Daiichi accident. The
number of construction starts on new reactors increased in 2010 for the seventh year in a row to 16,
but dropped in 2011 to 4.
2. Globally the Fukushima Daiichi accident is expected to slow the growth of nuclear power but not
reverse it. In the Agency’s 2011 updated low projection, global nuclear power capacity grows from
370 GW(e) today1 to 501 GW(e) in 2030, down 8% from what was projected in 2010. In the updated
high projection, capacity grows to 746 GW(e) in 2030, down 7% from 2010’s projection.
3. Among countries introducing nuclear power, interest remains high. Of the countries without
nuclear power that, before the Fukushima Daiichi accident, had strongly indicated their intentions to
proceed with nuclear power programmes, a few subsequently cancelled or revised their plans, others
took a ‘wait-and-see’ approach, but most continued with their plans. In September 2011, a nuclear
power plant went into operation in the Islamic Republic of Iran.
4. The 2011 edition of the ‘Red Book’, Uranium: Resources, Production and Demand, jointly
prepared by the Organisation for Economic Co-operation and Development’s (OECD’s) Nuclear
Energy Agency (NEA) and the IAEA, estimated identified conventional uranium resources at less than
$130/kg U at 5.3 Mt U, a decrease of 1.4% compared to the 2009 edition. At the projected 2012 rate of
consumption, the lifetime of 5.3 Mt U would be 78 years.
5. In December 2010, the Agency’s Board of Governors approved the establishment of an IAEA
low enriched uranium (LEU) bank to be funded by $150 million in voluntary contributions. The
Agency accepted an offer from Kazakhstan to host the bank. In February 2011, the agreement between
the Government of the Russian Federation and the Agency that established a low enriched uranium
(LEU) reserve in Angarsk, Russian Federation, entered into force. In March 2011, the Board of
Governors approved a proposal for a ‘Nuclear Fuel Assurance’ by the UK, cosponsored by the
__________________________________________________________________________________
1 30 June 2012.

GOV/INF/2012/12-GC(56)/INF/6 Page 2
European Union (EU), the Russian Federation and the USA. In August 2011, the American Assured
Fuel Supply became available in the USA. It comprises 230 tonnes of LEU with an enrichment of
4.95%.
6. In Finland, construction on the ONKALO underground rock characterization facility, a precursor
to a spent fuel repository, reached its final disposal depth in 2010. Posiva, the nuclear waste
management company, intends to submit the repository construction licence application in late 2012
and begin final disposal in 2020. The Swedish Nuclear Fuel and Waste Management Company (SKB)
submitted a licence application in March 2011 for the construction of a spent fuel repository in
Forsmark and estimates that final disposal could begin by 2025. The Council of the EU approved
“Council Directive 2011/70/Euratom of 19 July 2011 establishing a Community framework for the
responsible and safe management of spent fuel and radioactive waste”, which established harmonized
standards for all EU member countries and required them to establish national programmes and report
on progress to the European Commission (EC) by August 2015 and every three years thereafter.
7. Technology advances were reflected in 2011 in the connection to the grid, in China, of the
world’s first AP-1000. The 65 MW(th) (20 MW(e)) pool-type China Experimental Fast Reactor
(CEFR) was also connected to the grid in 2011. In Argentina, site excavation started in 2011 for the
27 MW(e) prototype plant for CAREM, a small pressurized water reactor (PWR) with all primary
components located inside the reactor vessel. South Africa’s plans for moving the pebble bed modular
reactor (PBMR) into the construction phase were halted in 2010 as a result, among other things, of
funding constraints in the wake of the global financial crisis. The project remains under a ‘care and
maintenance plan’ to protect the intellectual property and assets involved.
B. Current Status of Nuclear Power
B.1. Use of Nuclear Energy
8. In 2011, nuclear energy produced 12.3% of the world’s electricity and 5.1% of the total primary
energy used worldwide. Most electricity generation continues to be fuelled by fossil fuels.
9. Nuclear power has been used to produce electricity for public distribution since 1954, and
nuclear power plants have since operated in 33 countries.2 Currently, 30 countries operate 435
reactors, with a total capacity of 370 GW(e).3 A further 62 units, totalling 59.2 GW(e), are under
construction.4 During 2011, nuclear power produced 2517 billion kW•h of electricity. The industry
now has more than 14 700 reactor-years of experience.
10. The contribution of nuclear energy to total electricity generation varies considerably by region as
shown in Table B-1. In 2011, the highest share of nuclear generated electricity was 25.7% in Western
Europe. The lowest shares were 1.8% in the Middle East and South Asia and 0% in the Southeast Asia
__________________________________________________________________________________
2 Argentina, Armenia, Belgium, Brazil, Bulgaria, Canada, China, Czech Republic, Finland, France, Germany, Hungary, India, Islamic Republic of Iran, Italy, Japan, Kazakhstan, the Republic of Korea, Lithuania, Mexico, Netherlands, Pakistan, Romania, the Russian Federation, Slovakia, Slovenia, South Africa, Spain, Sweden, Switzerland, Ukraine, the United Kingdom and the United States of America.
3 These totals include 6 reactors in Taiwan, China, with a total capacity of 5018 MW(e).
4 Unless indicated otherwise, all such statistics are as of 30 June 2012.
GOV/INF/2012/12-GC(56)/INF/6 Page 3
and the Pacific region. Globally, nuclear power’s share of electricity generation has declined from
16% in 2002 to 12.3% in 2011.
TABLE B-1. Use (in EJ) and percentage contribution (%) of different types of fuel for electricity
generation in 2011
Region Thermal (a) Hydro Nuclear Renewables (b) Total
Use (EJ)
% Use (EJ)
% Use (EJ)
% Use (EJ)
% Use (EJ)
%
North America 30.2 63.0 2.6 15.6 9.6 18.8 1.0 2.6 43.4 100
Latin America 5.5 39.5 2.8 57.4 0.3 2.2 0.4 0.9 9.0 100 Western Europe 14.4 51.3 1.9 16.8 8.7 25.7 1.1 6.3 26.1 100 Eastern Europe 17.8 65.6 1.0 15.5 3.7 18.7 0.03 0.2 22.5 100 Africa 6.1 80.9 0.4 16.5 0.1 2.0 0.06 0.5 6.6 100 Middle East and South Asia
22.9 87.3 0.7 10.9 0.4 1.8 0.0 0.02 24.0 100
Southeast Asia and the Pacific
7.5 88.4 0.3 9.3 0.4 2.3 8.2 100
Far East 48.6 78.0 3.1 13.9 4.7 6.9 0.7 1.1 57.0 100 Total 152.9 68.2 12.8 17.4 27.5 12.3 3.7 2.1 196.8 100 (a) The column headed ‘Thermal’ is the total for solids, liquids, gases, biomass and waste. (b) The column headed ‘Renewables’ includes geothermal, wind, solar and tide energy.
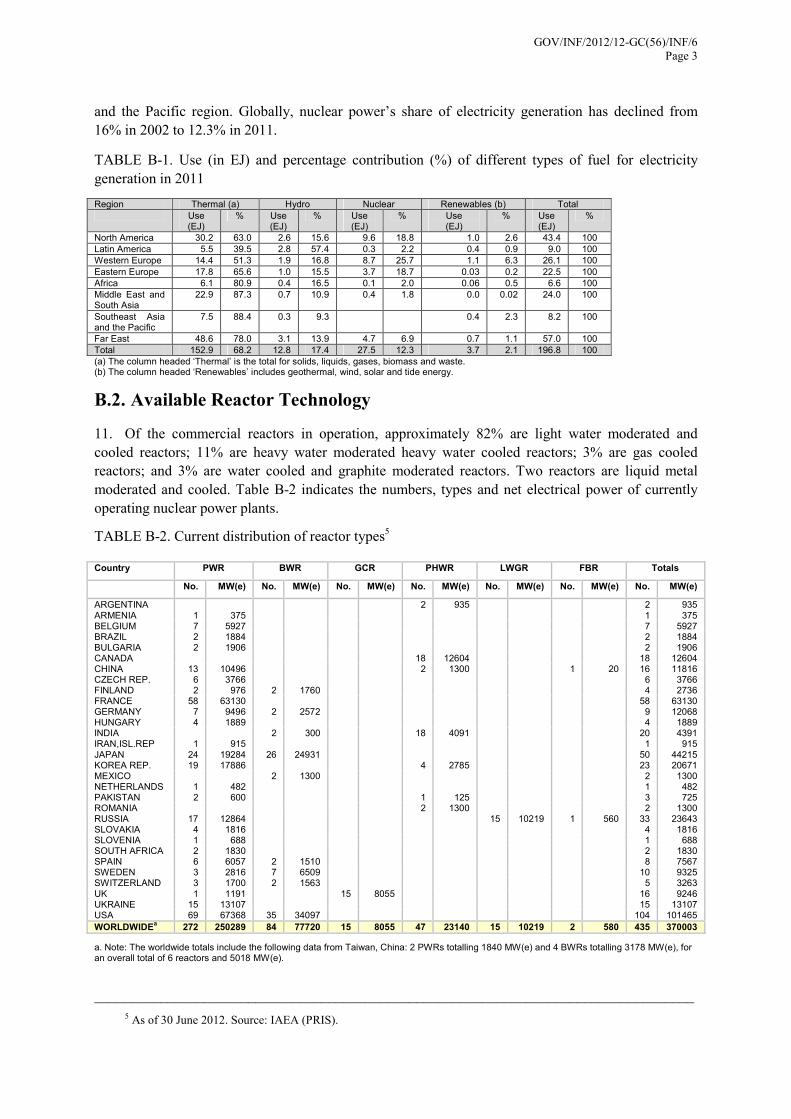
B.2. Available Reactor Technology
11. Of the commercial reactors in operation, approximately 82% are light water moderated and
cooled reactors; 11% are heavy water moderated heavy water cooled reactors; 3% are gas cooled
reactors; and 3% are water cooled and graphite moderated reactors. Two reactors are liquid metal
moderated and cooled. Table B-2 indicates the numbers, types and net electrical power of currently
operating nuclear power plants.
TABLE B-2. Current distribution of reactor types5 Country PWR BWR GCR PHWR LWGR FBR Totals
No. MW(e) No. MW(e) No. MW(e) No. MW(e) No. MW(e) No. MW(e) No. MW(e)
ARGENTINA 2 935 2 935 ARMENIA 1 375 1 375 BELGIUM 7 5927 7 5927 BRAZIL 2 1884 2 1884 BULGARIA 2 1906 2 1906 CANADA 18 12604 18 12604 CHINA 13 10496 2 1300 1 20 16 11816 CZECH REP. 6 3766 6 3766 FINLAND 2 976 2 1760 4 2736 FRANCE 58 63130 58 63130 GERMANY 7 9496 2 2572 9 12068 HUNGARY 4 1889 4 1889 INDIA 2 300 18 4091 20 4391 IRAN,ISL.REP 1 915 1 915 JAPAN 24 19284 26 24931 50 44215 KOREA REP. 19 17886 4 2785 23 20671 MEXICO 2 1300 2 1300 NETHERLANDS 1 482 1 482 PAKISTAN 2 600 1 125 3 725 ROMANIA 2 1300 2 1300 RUSSIA 17 12864 15 10219 1 560 33 23643 SLOVAKIA 4 1816 4 1816 SLOVENIA 1 688 1 688 SOUTH AFRICA 2 1830 2 1830 SPAIN 6 6057 2 1510 8 7567 SWEDEN 3 2816 7 6509 10 9325 SWITZERLAND 3 1700 2 1563 5 3263 UK 1 1191 15 8055 16 9246 UKRAINE 15 13107 15 13107 USA 69 67368 35 34097 104 101465
WORLDWIDEa 272 250289 84 77720 15 8055 47 23140 15 10219 2 580 435 370003
a. Note: The worldwide totals include the following data from Taiwan, China: 2 PWRs totalling 1840 MW(e) and 4 BWRs totalling 3178 MW(e), for an overall total of 6 reactors and 5018 MW(e).
__________________________________________________________________________________
5 As of 30 June 2012. Source: IAEA (PRIS).

GOV/INF/2012/12-GC(56)/INF/6 Page 4
12. The majority of operating reactors were designed in the late 1960s and 1970s and are not offered
commercially today. Reactor designs increased gradually in size, taking advantage of economies of
scale. Many of the earliest reactors, which started commercial operation in the 1950s, were 50 MW(e)
or smaller. Currently operating reactors range in size from less than 100 MW(e) up to 1500 MW(e).
The average reactor size in operation on 30 June 2012 was 851 MW(e).
13. Reactor technology available for use today is fundamentally based upon previous designs while
taking into account (1) sixty year lifespans, (2) simplified maintenance — on-line or during outages,
(3) easier and shorter construction, (4) inclusion of safety and reliability considerations at the earliest
stages of design, (5) modern technologies in digital control and the human-machine interface, (6)
safety system design guided by risk assessment, (7) simplicity, by reducing the number of rotating
components, (8) increased reliance on passive systems (gravity, natural circulation, accumulated
pressure, etc.), (9) addition of severe accident mitigating equipment, and (10) complete and
standardized designs with pre-licensing.
14. Although the industry has historically pursued economies of scale, the deployment of small and
medium sized reactors (SMRs) continues. “Small” means less than 300 MW(e). “Medium sized”
means between 300 MW(e) and 700 MW(e). SMRs are being developed to be used in isolated areas or
in small grids with limited interconnections such as exist in some developing countries, and to allow
smaller investments so as to reduce financial risks. Small, transportable reactors have been proposed to
allow power plants to be delivered as pre-constructed packages.
B.3. Human Resources
15. The projected growth in nuclear power discussed in Section C.4 will require a growing workforce
with the necessary skills. However, even in a number of countries with operating nuclear power plants,
nuclear education and training have experienced declines, and even for their currently operating
reactors, many countries face significant challenges to deal with expected attrition from the existing
workforce. For the USA, the Nuclear Energy Institute’s 2011 Nuclear Pipeline Survey shows a
potential 39% attrition rate over the next five years, equivalent to approximately 22 300 people.
Similar figures are reported for Europe by the European Human Resources Observatory for the
Nuclear Sector, which was created by the European Commission to track demand and supply for
nuclear experts within the European Union. The OECD/NEA’s 2012 Nuclear Education and Training:
From Concern to Capability notes that governments have recognized the challenge and Finland,
France, Spain, the UK and the USA, among others, have undertaken surveys to identify current and
future needs. Overall, while a number of national initiatives have been implemented to enhance
educational capability, the response to human resources challenges has been variable, and a more
consistent, international effort is still needed. In May 2011, the Agency initiated a Global Nuclear
Power Industry Workforce Survey to get accurate estimates of the current numbers of personnel
directly supporting nuclear operations. Data collection has been slow, and the survey has been kept
open into 2012 in order to collect more data.
16. Countries introducing nuclear power face particular human resources challenges, and they will
rely heavily on support from vendor countries for education and training for their first nuclear power
plants. The Agency can encourage coordination of the services offered by vendors and through
bilateral and multilateral arrangements, and can supplement their activities with workshops, review
services, the validation and enhancement of educational programmes, and assistance with workforce
planning and human resource development strategies. The USA recently provided a Nuclear Power
Human Resources (NPHR) modelling tool to the Agency, to be shared with Member States, especially
those considering introducing nuclear power. It estimates future human resources needs based on
national plans. The Agency has also fostered regional educational networks in the Asian (ANENT),

GOV/INF/2012/12-GC(56)/INF/6 Page 5
African (AFRA-NEST) and Latin-American and Caribbean regions (LANENT). These provide a
platform for collaboration and sharing best practices.
B.4. The Fuel Cycle, Waste and Decommissioning
17. The fuel cycle is normally divided into front-end activities (mining, conversion, enrichment and
fuel fabrication) to produce fuel assemblies for reactors and back-end activities to manage the spent
nuclear fuel and the nuclear waste (including storage, reprocessing and waste disposal).
B.4.1. Front end
18. The latest edition of the OECD/NEA–IAEA ‘Red Book’, Uranium 2011: Resources, Production
and Demand, estimated identified conventional uranium resources at less than $130/kg U at 5.3 Mt U,
a decrease of 1.4% compared to the previous edition, Uranium 2009: Resources, Production and
Demand. For reference, the spot price for uranium on 24 July 2012 was also $130/kg U.
19. Uranium production in 2010, the most recent year reported in the Red Book, was 54 670 t U, a
6% increase over 2009. Production in Kazakhstan, the world’s largest producer, increased by 27%.
Australia, Canada and Kazakhstan accounted for 62% of global production. These three countries, plus
Namibia, Niger, the Russian Federation, the USA and Uzbekistan, accounted for 92%. Provisional
figures indicate that final figures for 2011, when available, will show an increase over 2010 to about
57 230 t U.
20. Uranium consumption by the world’s nuclear power plants in 2010 was 63 875 t U. The World
Nuclear Association (WNA) estimated that consumption dropped in 2011 to 62 552 t U in the wake of
the accident at the Fukushima Daiichi nuclear power plant6 but projected that it would rebound in
2012 to 67 990 U.7 At the projected 2012 rate of consumption, the lifetime of 5.3 Mt U would be 78
years. This compares favourably to reserves of 30–50 years for other commodities (e.g. copper, zinc,
oil and natural gas).
21. Unconventional uranium resources and thorium further expand the resource base.
Unconventional resources include potentially recoverable uranium associated with phosphates,
nonferrous ores, carbonatite, black shale and lignite, resources from which uranium is only
recoverable as a minor by-product and uranium in seawater. In 2011, only a few countries (Chile,
Finland, Jordan, Mexico, Peru, South Africa and Sweden) mentioned or reported unconventional
uranium resources. Past estimates of potentially recoverable uranium associated with phosphates, non-
ferrous ores, carbonatite, black shale and lignite are of the order of 10 Mt U. Worldwide resources of
thorium have been estimated to be about 6 million tonnes. Although thorium has been used as fuel on
a demonstration basis, its broader use would depend on the commercial deployment of thorium fuelled
reactors, which is a gradual process.
22. Commercial scale plants to convert triuranium octaoxide (U3O8) to uranium hexafluoride (UF6)
operate in Canada, China, France, Russian Federation, UK and USA. Smaller conversion plants
operate in Argentina, Japan and Pakistan. Total world conversion capacity has remained constant at
around 75 000 tonnes of natural uranium per year. Total current demand for conversion services is in
the range of 59 000 to 65 000 t U per year.
__________________________________________________________________________________
6 WNA World Nuclear Power Reactors & Uranium Requirements, 1 January, 2012 (http://www.world-nuclear.org/info/reactors0112.html) Accessed 7 May 2012
7 World Nuclear Power Reactors & Uranium Requirements, April 2012 (http://world-nuclear.org/info/reactors0412.html) Accessed 7 May 2012

GOV/INF/2012/12-GC(56)/INF/6 Page 6
23. Total global enrichment capacity is about 65 million separative work units (SWUs) per year
compared to a total demand of approximately 45 million SWUs per year. Commercial scale plants
operate in China, France, Germany, Netherlands, Russian Federation, UK and USA. Smaller
enrichment plants operate in Argentina, Brazil, India, the Islamic Republic of Iran, Japan and Pakistan.
24. Several proposals have been advanced in recent years to better ensure uninterrupted nuclear fuel
supplies, particularly for countries introducing nuclear power. Most envision a central role for the
Agency. In December 2010, the Agency’s Board of Governors approved the establishment of an IAEA
LEU bank to be funded by $150 million in voluntary contributions pledged to the Agency. The
Agency accepted an offer from Kazakhstan to host the bank and formal negotiations on a host State
agreement began in 2012. In February 2011, the agreement between the Government of the Russian
Federation and the Agency that established an LEU reserve in Angarsk, Russian Federation, entered
into force. This reserve holds 120 tonnes of LEU and is located at the International Uranium
Enrichment Centre. In March 2011, the Board of Governors approved a proposal for a ‘Nuclear Fuel
Assurance’ by the UK, cosponsored by the EU, Russian Federation and USA. This introduced a draft
‘Model NFA Agreement’ by which a State supplying LEU or enrichment services could agree not to
interrupt supplies to recipients that comply with international obligations and published export
licensing standards. In August 2011, the American Assured Fuel Supply became available in the USA.
It comprises 230 tonnes of LEU with an enrichment of 4.95%.
25. The world’s capacity to fabricate fuel for light water reactors (LWRs), which use fuel with
enriched uranium, is about 13 000 t U per year (of enriched uranium in fuel assemblies). The demand
for such fuel is currently about 7 000 t U per year and expected to increase to about 9 500 t U per year
by 2020. Fabrication capacity for natural uranium fuel for pressurized heavy water reactors (PHWRs)
is about 4 000 t U per year; demand is about 3 000 t U per year.
26. Recycling provides a secondary nuclear fuel supply through the use of reprocessed uranium and
mixed oxide (MOX) fuel. The current fabrication capacity for MOX fuel is around 250 t of heavy
metal (HM). Worldwide, approximately 30 LWRs currently use MOX fuel.
B.4.2. Back end
27. Some countries see spent fuel as a waste product to be disposed of as high level waste (HLW).
Others see it as a resource for reprocessing and potential reuse. Currently a market for reprocessing
and reuse exists, but not for storage or disposal.
28. Because there are currently no operating disposal facilities for HLW, spent fuel inventories are
growing, and much of this spent fuel will have to be stored for longer periods than initially intended,
possibly longer than 100 years. In 2011, about 10 500 tonnes of heavy metal (HM) were discharged as
spent fuel from all nuclear power reactors. The total cumulative amount of spent fuel discharged
through December 2011 was approximately 350 500 t HM, of which about 240 000 t HM were stored.
The rest had been reprocessed. Global commercial reprocessing capacity was about 4 800 t HM per
year, spread across four countries, France, India, Russian Federation and the UK. In Japan,
construction of the 800 t HM/year commercial reprocessing plant at Rokkasho was almost complete
when work was suspended as a consequence of the earthquake and tsunami on 11 March 2011.
29. The countries that have made the most progress on disposal facilities for HLW are Finland,
France and Sweden. In Finland, construction on the ONKALO underground rock characterization
facility, a precursor to a spent fuel repository, reached its final disposal depth in 2010. Posiva, the
nuclear waste management company, intends to submit the repository construction licence application
in late 2012 and begin final disposal in 2020. In France, the national radioactive waste management
agency Andra signed a contract in January 2012 for the design of its future deep geological repository,
which is scheduled to start operation in 2025 in the Meuse/Haute-Marne region of eastern France. The

GOV/INF/2012/12-GC(56)/INF/6 Page 7
Swedish Nuclear Fuel and Waste Management Company (SKB) submitted a licence application in
March 2011 for the construction of a spent fuel repository in Forsmark and estimates that final
disposal could begin by 2025.
30. In the EU, in July 2011, the Council of the EU approved a Directive on spent fuel and radioactive
waste management that established harmonized standards for all EU member countries and required
them to establish national programmes and report on progress to the European Commission (EC) by
August 2015 and every three years thereafter.
31. In addition to HLW associated with spent fuel, low and intermediate level waste (LILW) is
generated throughout the fuel cycle. Treatment, conditioning and long term storage of LILW waste are
mature technologies and are normally done at the nuclear facilities where the waste is generated. A
number of countries already operate industrial scale LILW disposal facilities, and others are building
them. But some countries with operating nuclear power plants have not yet been able to site and
construct LILW disposal facilities, primarily due to a lack of political and public acceptance.
B.4.3. Decommissioning
32. Once power reactors reach the end of their lifecycle, they are decommissioned.
Decommissioning involves dismantling them in a controlled way and then managing and disposing of
the resultant radioactive waste.
33. There are three basic options: immediate dismantling, long term safe enclosure followed by
dismantling, and entombment, also called on-site or in-situ disposal. Entombment has generally been
limited to small installations. The choice between immediate dismantling and long term safe
enclosure depends on the availability of disposal facilities and uncertainty about their future
availability, the availability of funds (which may not be available for reactors that were shut down
earlier than planned or that were not required to accumulate such funds during their operating lives),
projected costs (which decline as radiation levels drop and technology improves), concerns about jobs
around shutdown reactors, the planned future use of the site (possibly for new reactors), the
preferences of interested stakeholders and the applicable national laws, regulations and spent fuel
management strategies.
34. As of December 2011, 124 power reactors were shut down. Of these, 16 had been fully
dismantled, 50 were in the process of being dismantled, 49 were being kept in safe enclosure mode, 3
had been entombed, and 6 did not yet have specified decommissioning strategies.
B.5. Industrial Capacity
35. The number of nuclear power reactors under construction peaked in 1979 at 233. It then dropped
to between 30 and 40 for 1995–2005 but has since risen to 62 as of 30 June 2012 (Fig. B-1). The
nuclear supply industry adjusted to the post-1980 decline largely through consolidation, particularly in
North America and Europe. Conversely, the capabilities of China, India and the Republic of Korea
have grown through localization and are expected to increasingly contribute to meeting the world’s
future need for nuclear construction expertise. This section highlights some recent developments to
expand industrial capacity to respond to the projected growth in nuclear power reported in
Section C.4.
36. The suppliers of heavy industrial equipment are in China, Czech Republic, France, Japan,
Republic of Korea and Russian Federation. New capacity is being built by Japan Steel Works (JSW)
and Japan Casting & Forging Corporation (JCFC) in Japan, by Shanghai Electric Group and
subsidiaries in China, by Bharat Forge in India, by Doosan in the Republic of Korea, by Le Creusot in

GOV/INF/2012/12-GC(56)/INF/6 Page 8
France, by Plzeň in the Czech Republic and by OMZ Izhora and ZiO-Podolsk in the Russian
Federation.
37. In Canada, the former, government owned reactor supplier Atomic Energy of Canada Limited
was partially privatized in 2011. The nuclear power reactor supply and nuclear services portion of the
company was sold to the engineering and construction group SNC-Lavalin and renamed Candu
Energy Inc. The remaining portion of the company retained the AECL name and now focuses on
research and development, design, engineering, specialized technology, waste management, and
decommissioning. It continues to own and operate the Chalk River nuclear laboratories.
38. In China in 2011, the State Nuclear Power Technology Corporation (SNPTC) and Shanghai
Nuclear Engineering Research and Design Institute (SNERDI), together with Westinghouse,
completed the preliminary design of the Chinese Advanced Power Reactor (CAP-1400), also called
the Large Advanced Passive PWR Nuclear Power Plant (LPP). This opens the possibility of China
exporting this design with Westinghouse’s cooperation.
39. The Republic of Korea is developing an exportable 1500 MW(e) advanced power reactor (APR+)
and the EU-APR 1400 for the European market, (see para. 86), and, in the Russian Federation, the
main reactor component supplier, OMZ, is doubling production capacity for large forgings at its
Komplekt-Atom-Izhora facility to three or four pressure vessels per year.
FIG. B-1. Number of reactors under construction (and total reactor capacity) from 1951 to 2010.
Source: IAEA (PRIS).
C. Prospects for the Future Application of Nuclear Energy
C.1. Prospects in Countries already using Nuclear Power
40. Table C-1 summarizes available information on the expansion plans of countries currently
operating nuclear power plants plus Lithuania, which has 43.5 reactor-years of operating experience
but, since Ignalina-2 was shut down at the end of 2009, no operating reactors. The table is based on
Member State presentations to the 2011 IAEA General Conference and other public expressions of
their positions.

GOV/INF/2012/12-GC(56)/INF/6 Page 9
C.2. Prospects in Countries considering the Introduction of Nuclear Power
41. Since the mid-2000s, developing countries have expressed a new or renewed interest in nuclear
power. While the Fukushima Daiichi accident caused some countries to change their positions and
some to take a ‘wait and see’ approach, interest continued among countries considering or planning for
nuclear power introduction.
42. Table C-2 shows the number of countries at different stages of nuclear power consideration or
development. Sometimes referred to as ‘nuclear newcomers’, some countries, such as Bangladesh,
Egypt and Vietnam, have in fact been planning for nuclear power for some time. Others, such as
Poland, are reviving the nuclear power option after plans had been curtailed when governments and
public opinion changed. Countries such as Jordan and Uruguay are considering or planning for nuclear
power for the first time. What they have in common is that they are all considering, planning or
starting nuclear power programmes, and have not connected a first nuclear power plant to the grid.
TABLE C-1. Positions of countries with operating nuclear power plants plus Lithuania
Category Number of
countries
New unit(s) under construction with more planned/proposed 11
New unit(s) under construction but the policy for more units is not established 2
No units under construction but with plans/proposals for building new unit(s) 10
No units under construction, and currently no plans/policy for building new units 4
Firm policy not to build new units and/or for closure of existing units 4
TABLE C-2. Positions of countries without operating nuclear power plants8
Description of group Number of Countries
2012
Number of Countries
2010
Number of Countries
2008
Considering a nuclear programme to meet identified energy needs with a strong indication of intention to proceed
14 14 14
Active preparation for a possible nuclear power programme with no final decision
6 7 7
Decided to introduce nuclear power and started preparing the appropriate infrastructure
6 10 5
New nuclear power plant ordered 3 2 0
New nuclear power plant under construction 0 1 1
43. Of the 29 countries considering or planning for nuclear power in 2012, 10 are from the Asia and
the Pacific region, 10 are from the Africa region, 7 are in Europe (mostly Eastern Europe) and 2 are in
Latin America.
__________________________________________________________________________________
8 Two additional groups were included in previous editions of this publication but not in this edition because they did not add substantially to an understanding of the rising expectations for nuclear power among developing countries. One group included countries that were not planning to introduce nuclear power but were interested in considering the associated issues, but it proved difficult to characterize trends and there were wide fluctuations in the numbers from year to year. A second group included countries where an invitation to bid to supply a nuclear power plant had been prepared, but this proved problematic because of countries that were choosing to order plants through direct bilateral agreements rather than through bids.

GOV/INF/2012/12-GC(56)/INF/6 Page 10
44. Even after the Fukushima Daichii accident, some countries have taken concrete steps toward
nuclear power introduction. In the United Arab Emirates (UAE), in 2011, the Emirates Nuclear
Energy Corporation invited bids for uranium, conversion and enrichment for the fuel for the UAE’s
first reactors. In Turkey, the project company Akkuyu Nukleer Santral Elektrik Uretim filed
applications for construction permits and a power generation licence. Belarus signed a contract with
the Russian Federation for the construction of two reactors, and Bangladesh signed an
intergovernmental agreement with the Russian Federation, also for two reactors. Vietnam signed a
loan agreement with the Russian Federation regarding financing of its first nuclear power plant and
announced its intention to undertake a similar agreement with Japan.
45. The Islamic Republic of Iran began commissioning of its first nuclear power plant at Bushehr in
September 2011, which marked the commissioning of the first nuclear power plant in a ‘newcomer’
country in 15 years.
46. The rate at which new countries joined the list of countries operating nuclear power plants was
fairly steady through the early 1980s as shown in Fig. C-1. Until the addition of the Islamic Republic
of Iran in 2011, only three countries had connected their first nuclear power plants to the grid in the
post-Chernobyl era — China, Mexico and Romania. The countries now planning for their first nuclear
power plants are doing so after an experience gap of 15 years. Of the countries considering or planning
for their first nuclear plant, 9 have explicitly expressed target dates for the first operation before 2030.
FIG. C-1. Number of countries operating, or having operated, nuclear power plants. Source IAEA
(PRIS)
47. Overall, Tables C-1 and C-2 are consistent with trends reflected in the Agency’s low and high
projections described below, i.e. there remains substantial uncertainty in projections about nuclear
power, and the growth in the use of nuclear power is projected to be driven more by expansion in
established nuclear power countries than by countries starting nuclear power programmes. The 9
countries that have explicitly expressed target dates for the first operation before 2030 lie between the
7 countries in the Agency’s low projection that would connect their first plant by 2030 and the 16
countries that would do so in the high projection.

GOV/INF/2012/12-GC(56)/INF/6 Page 11
C.3. Potential Drivers for the Introduction of Nuclear Power
48. The key factors that have driven rising interest in nuclear power since about 2005, and the
increase in construction starts shown in Fig. B-1, have not changed with the Fukushima Daiichi
accident: growing energy demand, especially for electricity; volatile fossil fuel prices; environmental
pressures and energy security concerns.
C.3.1. Demand
49. Global energy and electricity demands are set to grow for decades. No credible short or long term
energy assessment indicates otherwise. A growing world population and development aspirations in
the current developing world, where large parts of the population still lack access to electricity,
translate into even faster growth rates for electricity than for total primary energy demand. All studies
agree that most demand growth will occur in the developing countries.
50. The medium variant of the latest UN population projections estimates an additional 1.5 billion
people by 2030 and another 1 billion by 2050, bringing the world’s population to about 9.3 billion.9
The World Bank projects average annual growth for the world economy of 3.1% up to 2015 and 2.5%
between 2015 and 2030.10 Developing countries will grow fastest. Based on these two main drivers of
energy demand, the OECD’s International Energy Agency (IEA) projects an increase in electricity
demand from 21 300 TWh in 2010 to between 30 390 and 35 470 TWh by 2030 depending on
environmental policies. Eighty per cent of the growth would occur in the non-OECD countries.
Extending the analysis to 2050 results in an increase in electricity demand to between 37 660 and
46 190 TWh.11
C.3.2. Fossil fuel prices and economics
51. The volatility of international fossil fuel market prices around substantially elevated levels
remains a major concern in the developed and developing world alike. For many energy import
dependent developing countries, high fuel import prices drain their limited export revenue and hamper
economic development. Given rising global energy demand and a reluctance of major producers to
accelerate investment in exploration and additional production capacity, partly due to economic
uncertainty, high global price levels for fossil fuels are unlikely to ease up soon.
52. The commercialization of large volumes of shale gas recently in the USA, however, has turned
the tide of rising natural gas prices and upended the assumption that unconventional fossil resources
are necessarily more expensive than their conventional counterparts. Shale occurrences are plentiful in
many parts of the world, but their gas bearing nature varies greatly, making projections of
commercially available shale gas highly uncertain. There is also uncertainty about public acceptance
due to environment and health concerns about extraction using hydrofracking. As discussed in Section
C.3.3, the use of shale gas also generates carbon dioxide emissions, and shale gas that leaks to the
atmosphere is an even more potent direct greenhouse gas (GHG).
53. Economic development requires reliable affordable baseload electricity. Unlike fossil fuelled
electricity generation, for nuclear power the cost of fuel accounts for only a few per cent of the cost of
__________________________________________________________________________________
9 UNDESA (United Nations Department of Economic and Social Affairs). 2010. World Population Prospects. The 2010 Revision. [Online] Available from: http://esa.un.org/unpd/wpp/index.htm
10 World Bank. 2009. Global Economic Prospects: Commodities at the Crossroads, [Online] Available from: http://siteresources.worldbank.org/INTGEP2009/Resources/10363_WebPDF-w47.pdf
11 IEA (International Energy Agency). 2010. Energy Technology Perspectives 2010: Scenarios and Strategies to 2050. [Online] Available from: http://titania.sourceoecd.org/vl=13668216/cl=27/nw=1/rpsv/~6673/v2010n11/s1/p1

GOV/INF/2012/12-GC(56)/INF/6 Page 12
electricity. A doubling or tripling of uranium prices translates to only a 4–6% increase in generating
costs. In contrast, for fossil fuelled generation, a doubling of fuel costs raises total generating costs by
40–70%. Thus price volatility is a greater concern for fossil fuelled electricity generation.
C.3.3. Environment
54. On a life cycle basis, nuclear power emits only a few grams of GHGs per kWh. The full life cycle
includes uranium mining, milling, conversion, enrichment, fuel fabrication, power plant construction
and operation, reprocessing, conditioning of spent fuel, interim storage of radioactive waste and the
construction of final repositories. Life cycle emissions from the nuclear power chain are comparable
with the best renewable energy chains and at least one order of magnitude lower than fossil fuel
chains, as illustrated in Figure C-2. Overall, the Intergovernmental Panel on Climate Change (IPCC)
has estimated that nuclear power has the largest and lowest cost GHG reduction potential in the power
generation sector (IPCC, 2007).12
55. Nuclear power’s very low GHG emissions and its high potential for reducing GHG emissions
from the electricity sector contribute to increased interest in nuclear power. However, without a new
comprehensive, binding long term international environmental agreement to replace the Kyoto
Protocol, which was extended in December 2011 to at least 2017, not all investors in new nuclear
power plants can be sure of benefitting financially from nuclear power’s low GHG emissions.
FIG. C-2. Life cycle GHG emissions of different electricity generating options. Note the scale of the
right panel is one order of magnitude lower than the left panel.
56. In addition to its very low GHG emissions, nuclear power does not emit any noxious gases
during operation that create air pollutants like nitrogen oxides (NOX), sulphur dioxide (SO2) and
particulate matter emissions that cause harm to human health and are responsible for poor urban air
quality and regional acidification.
C.3.4. Energy security
57. Technology, fuel and energy source diversification and strategic storage have long been the
principal pillars of energy supply security. Nuclear power enhances supply security when it is part of a
__________________________________________________________________________________
12 IPCC, 2007: Climate Change 2007: Mitigation. Contribution of WGIII to the Fourth Assessment Report of the
Intergovernmental Panel on Climate Change [B. Metz, O.R. Davidson, P.R. Bosch, R. Dave, L.A. Meyer (eds)], Cambridge University Press, Cambridge, United Kingdom and New York, NY, USA.

GOV/INF/2012/12-GC(56)/INF/6 Page 13
country’s energy mix and, in most countries, nuclear expansion would increase diversity in the
electricity sector.
58. Uranium resources are both extensive and geographically diverse as described in Section B.4.
Identified conventional uranium resources recoverable at less than $130/kgU are sufficient to last
about 78 years at the projected 2012 consumption rate. Resources at higher costs and in additional
categories, e.g. ‘prognosticated and speculative resources’, add to the estimated resource base. And
reprocessing, recycling and the deployment of fast breeder technology would increase the longevity of
all resource categories by a factor of 60 to 70.
59. The energy density of nuclear fuel is much higher than fossil fuel, so smaller volumes are
required, which makes it easier to establish strategic inventories. In practice, the trend over the years
has been away from strategic stocks toward supply security based on a diverse well-functioning
market for uranium and fuel supply services. But the option of relatively low cost strategic inventories
remains available for countries that find it important.
60. The long service time of nuclear power plants and their stable generating costs for baseload
generation are additional aspects of energy security.
C.4. Projections in the Growth of Nuclear Power
61. The Agency publishes annually two updated projections for the global growth in nuclear power:
a low projection and a high projection. The 2011 updates allow for the effects of the Fukushima
Daiichi accident. In the updated low projection, the world’s installed nuclear power capacity grows
from 370 GW(e) today13 to 501 GW(e) in 2030, down 8% from what was projected in 2010. In the
updated high projection, capacity grows to 746 GW(e) in 2030, down 7% from 2010’s projection.
Table C-3 shows that projected growth is greatest in the Far East. Other regions with substantial
nuclear power programmes are Eastern Europe and the Middle East and South Asia.
TABLE C-3. Estimates of nuclear electricity generating capacity
Region 2010 2020 2030 2050
Low High Low High Low High
North America 113.8 119 126 111 149 120 200
Latin America 4.1 6.4 6.4 9 18 15 60
Western Europe 122.9 93 126 83 141 60 170
Eastern Europe 47.4 66 80 82 108 80 140
Africa 1.8 1.8 1.8 5 16 10 48
Middle East and South Asia 4.6 13 22 30 53 50 140
South East Asia and the Pacific 0 0 0 0 6 5 20
Far East 80.6 130 164 180 255 220 450
World total 375.3 429 525 501 746 560 1228
62. Figure C-3 compares the Agency’s projections to those of the OECD’s IEA and the WNA. The
IAEA’s low projection, the IEA’s current policies scenario and the WNA’s reference scenario all use
similar ‘business as usual’ assumptions and produce comparable results. The high scenarios from the
organizations are also comparable, as are the low nuclear scenarios of the IEA and WNA.
__________________________________________________________________________________
13 30 June 2012

GOV/INF/2012/12-GC(56)/INF/6 Page 14
FIG. C-3. Comparison of nuclear power projections by the IAEA (blue), the WNA (purple)14
and the
IEA (orange)15
. “450” designates a scenario in which the atmospheric concentration of GHGs is
limited to 450 parts per million.
63. The Global Energy Assessment (GEA), which was released by the International Institute for
Applied Systems Analysis, the GEA coordinator, at the UN Conference on Sustainable Development
in June 2012 (‘Rio+20’), also presents various future energy scenarios that include nuclear power. The
GEA scenarios are based on one economic development scenario but three different groups of energy
system transformations. The group GEA-Supply (GEA-S) rapidly scales up all supply-side options.
GEA-Efficiency (GEA-E) emphasizes efficiency improvements throughout the energy system and
solutions, including life-style changes, to limit energy demand. GEA-Mix (GEA-M) is a combination
of GEA-S and GEA-E. Within these groups, the GEA developed 60 alternative pathways that portray
multiple sensitivity analyses. Figure C-4 shows the ranges of nuclear power for the three groups over
time. Most of the GEA analyses were completed before the Fukushima Daiichi accident, and the lower
ends of the nuclear capacity ranges result from sensitivity analyses that purposely exclude nuclear
power by 2100. However, the low nuclear trajectories have also been interpreted as possible
consequences of the accident.
C.5. Non-Electric Applications
64. Non-electric applications include hydrogen production to, first, upgrade low quality petroleum
resources such as oil sands while offsetting carbon emissions associated with steam methane
reforming; second, support large scale production of synthetic liquid fuels based on biomass, coal, or
other carbon sources; and, third, serve directly as a vehicle fuel, most likely for light duty plug-in
hybrid hydrogen fuel cell vehicles. Nuclear energy can also be used in the petroleum industry for
extracting bitumen using steam-assisted gravity drainage (SAGD) or oil shale retorting.
65. Figure C-5 illustrates the benefits of cogeneration of electricity and heat, and the figure is in
principle applicable to other non-electric applications such as seawater desalination and hydrogen
production. There are currently 79 reactors operating in a cogeneration mode, and the potential for
applying this technology more widely appears promising. The more the development of nuclear power
plants and nearby industrial and other facilities can be coordinated such that the other facilities exploit
waste heat from the nuclear power plants, the greater the benefit of the power plant and the more
profitably it can be run. In addition, where seawater is available but fresh water is scarce, seawater
__________________________________________________________________________________
14 The Global Nuclear Fuel Market: Supply and Demand 2011–2030, WNA, London, 2011.
15 World Energy Outlook 2011, OECD-IEA, Paris, 2011.

GOV/INF/2012/12-GC(56)/INF/6 Page 15
desalination might provide both potable water and cost-effective industrial water for the nuclear power
plant itself.
FIG. C-4. Nuclear power developments across GEA-S, GEA-E and GEA-M. (Source: GEA, 2012).
FIG. C-5. Primary energy savings due to cogeneration compared to conventional separate energy
production.
E M S E M S E M S E M S
2010 2020 2030 2040 2050
Min 376 400 422 508 341 390 456 198 248 314 113 164 231
Max 376 542 544 543 797 802 799 1,134 1,232 1,230 1,725 1,866 2,185
Median 376 412 473 539 410 611 788 379 772 1,206 514 1,171 2,070
0
250
500
750
1,000
1,250
1,500
1,750
2,000
2,250
GWe
Min
Max
Median

GOV/INF/2012/12-GC(56)/INF/6 Page 16
D. Challenges for Nuclear Expansion
D.1. Financing
66. Compared particularly to natural gas fired power plants, nuclear power plants are relatively
expensive to build and relatively inexpensive to operate. They share this ‘front-loaded’ cost structure
with other technologies with low carbon emissions such as hydropower, wind power and solar power.
67. Nuclear power’s high upfront capital costs, its long lead times for planning, licensing and
construction, and its cost sensitivity to interest rates all pose financing challenges. Other things being
equal, nuclear power is therefore a more attractive investment if financing is available that can wait for
longer term returns (which is more characteristic of governments than private industry) and where
financial risks are lower due to more predictable electricity demand and prices, stable market
structures and strong political support.
68. Partly for these reasons, most of the 62 reactors under construction around the world are financed
directly by government owned utilities that have strong government support, access to resources, and
good credit ratings that allow more affordable borrowing and easier access to the international credit
market. This includes those countries where current and projected expansion in nuclear power is
centred, China, India, Republic of Korea and Russian Federation.
69. Privately owned utilities that are large and have strong balance sheets are participating in
building and financing a smaller number of new reactors, usually as partners in coalitions. The
Olkiluoto-3 and Fennovoima projects in Finland are examples of cooperative models, combining
corporate finance and project finance, where ownership and funding are shared among municipalities,
local utilities, industrial electricity consumers and strategic partners.
70. Developments in the UK and USA reflect the importance of predictability and stability to private
investors. Most new reactors in the USA have been proposed in US states with regulated electricity
markets, where some costs can be billed to the utilities’ customers even during construction and where
regulation increases the predictability of electricity prices. To increase private investment in nuclear
power in the UK, investors are exploring mechanisms, such as ‘contracts for difference’, and the
government is proposing legislation, both of which are designed to increase price predictability.
71. For countries starting nuclear programmes, the sources of financing are partly or fully in the
countries supplying the nuclear power plants. The UAE’s four new reactors are being financed by the
UAE Government and a Korean consortium led by the Korea Electric Power Corporation. In Turkey
the project company is co-owned by Turkey and the Russian Federation, and the costs of construction,
operation and decommissioning will be fully financed by the Russian side. In Bangladesh, Belarus and
Vietnam, agreements also specify that the bulk of the financing will come from the Russian
Federation.
72. None of the projections shown in Figure C-3 in Section C.4 requires nuclear power to expand
much faster than the rest of the electricity supply sector as a whole, so investment requirements will
not be significantly out of step with the overall sector. The challenges of scaling up the current
financing arrangements in expansion centres like China, India, Republic of Korea and Russian
Federation will likely be fewer than the challenges of ensuring the predictability of electricity demand,
prices, and strong political support that are important to encouraging private investment in some other
countries.

GOV/INF/2012/12-GC(56)/INF/6 Page 17
D.2. Safety and Reliability
73. Since March 2011, discussions on nuclear power plant safety have been dominated by the need to
identify and apply the lessons learned from the accident at the Fukushima Daiichi nuclear power plant.
74. The IAEA Ministerial Conference on Nuclear Safety was convened in June 2011 to discuss an
initial assessment of the accident, to consider the lessons that needed to be learned, to help launch a
process to enhance nuclear safety throughout the world and to consider ways to further strengthen the
response to nuclear accidents and emergencies. Many Member States have carried out reviews as part
of national safety assessments (often called ‘stress tests’) and have committed to completing any
remaining assessments promptly and implementing any necessary corrective action.
75. The preliminary insight gained from the accident was the need for regulators and operators of
nuclear power plants worldwide to review and strengthen, as needed: (a) protective measures against
extreme hazards like tsunamis; (b) power and cooling capabilities in the event of severe accidents; (c)
preparations to manage severe accidents; and (d) the design bases of plants, i.e. the assumptions about
a predetermined set of accidents to be taken into account.
76. Although there are lessons yet to be learned, action plans applying the accident’s preliminary
lessons have been developed at both the national and international level. The IAEA Action Plan16 on
Nuclear Safety defines a programme of work to strengthen the global nuclear safety framework. It was
adopted by the General Conference in September 2011 and defines 12 main actions.
77. Operationally, the level of nuclear power plant safety around the world remains high, as indicated
by safety indicators collected by the Agency and the World Association of Nuclear Operators.
Figure C-6 shows the total number of unplanned scrams, including both automatic and manual scrams,
per 7 000 hours of critical power reactor operation. This indicator monitors performance in reducing
the number of unplanned total reactor shutdowns and is commonly used to indicate progress in
improving plant safety. As shown in Figure C-6, there have been significant improvements in the last
decade, although not as dramatic as those in the 1990s. Nevertheless, the gap between the best and
worst performers is still large, and room for continued improvement exists. The increase from 2010 to
2011 is related to the high number of scrams triggered by the March 2011 earthquake in Japan.
D.3. Public Perception
78. Public acceptance of nuclear power in different countries and localities reflects how perceived
benefits compare with perceived risks. In the aftermath of the Fukushima Daiichi accident numerous
public opinion surveys were conducted, including two large multi-country surveys with similar
questions about whether respondents supported or opposed nuclear power17 or viewed nuclear power
favourably or unfavourably18. Approval rates varied greatly across countries and regions, from almost
total rejection in some countries to initial steep drops in approval rates followed by rebounds to pre-
Fukushima levels in others19. In many countries with operating reactors, polls also found differences
__________________________________________________________________________________
16 http://www.iaea.org/newscenter/focus/actionplan/
17 IPSOS (Ipsos Social Research Institute). 2011. Strong global opposition towards nuclear power. [Online] Available from: http://www.ipsos-mori.com/researchpublications/researcharchive/2817/Strong-global-opposition-towards-nuclear-power.aspx
18 Gallup. 2011. Impact of Japan Earthquake on Views about Nuclear Energy: Findings from a Gallup Snap Poll in 47 Countries by WIN-Gallup International. [Online] Available from: http://www.nrc.co.jp/report/pdf/110420_2.pdf. [Accessed 2012-04-26]
19 IPSOS (Ipsos Social Research Institute). 2012. After Fukushima; Global Opinion on Energy Policy. [Online] Available from: http://www.ipsos.com/public-affairs/sites/www.ipsos.com.public-affairs/files/Energy%20Article.pdf

GOV/INF/2012/12-GC(56)/INF/6 Page 18
between opinions about existing reactors, which were viewed favourably, and new reactors, which
were viewed less favourably.
FIG. C-6. Total number of unplanned scrams, including both automatic and manual scrams, that
occur per 7 000 hours of critical power reactor operation. Source: IAEA (PRIS).
79. The poll results underline the importance of providing transparent accessible information on the
consequences of the accident, preparations for future accidents, and all the risks and benefits of
nuclear power and other energy alternatives. Also important is strong stakeholder involvement,
including local governments, emergency services, regulators, unions and community organizations.
Finally, a better public understanding of radiation and of the radiation exposure continually
encountered in everyday life is fundamental to a balanced view of the health impacts of nuclear power.
D.4. Spent Fuel and Waste Management and Disposal
80. As summarized in Section B.4, there are currently no operating disposal facilities for HLW, and
spent fuel inventories are therefore growing. All spent fuel is initially stored under water in storage
pools at reactor facilities for between 9 months and several decades, depending on the storage
capacities of the pools. If the fuel is to be reprocessed, it is transported to a reprocessing facility and
stored there in buffer storage pools before being fed into the process. Fuel not destined for
reprocessing remains stored in the original reactor storage pools or is transported to separate ‘away
from reactor’ (AFR) fuel storage facilities. Despite their name, the AFR facilities may be either on a
part of the reactor site or at other dedicated sites. Currently there are around 120 operating commercial
AFR spent fuel storage facilities around the world, most of them being dry storage facilities at reactor
sites.
81. The challenge is to accelerate progress on building HLW disposal facilities and expand AFR
storage to accommodate the increased spent fuel inventories and extended storage times described in
Section B.4. The countries that have made the most progress on final disposal are Finland, France and
Sweden where facilities are scheduled to begin operation in 2020–2025. For other EU countries, as
noted in Section B.4, the Council of the EU approved a Directive in July 2011 that required all EU
member countries to establish national programmes on spent fuel and radioactive waste management
and report on progress to the EC by August 2015 and every three years thereafter.
D.5. Relationship between Electricity Grids and Reactor Technology
82. The maximum size for a new power plant, if grid stability problems are to be avoided, is
generally considered to be about 10% of the existing grid. Twelve of the 29 countries considering or

GOV/INF/2012/12-GC(56)/INF/6 Page 19
planning for nuclear power have grids of less than 5 GW(e), which would make them too small,
according to the 10% guideline, to accommodate most of the reactor designs on offer without
improved international grid interconnections. Although many designs below 600 MW(e) are in
development, commercial availability is limited. Grid issues may also limit technology options for
countries with grids smaller than 10 GW(e).
E. Development of Reactor and Fuel Cycle Technology
E.1. Light water reactors (LWRs)
83. Light water reactors (LWRs) dominate new construction. Fifty-four of the 62 units currently
under construction are LWRs.
84. The 26 reactors under construction in China include the European Pressurized Reactor (EPR), the
AP-1000 by Westinghouse, and indigenous PWR designs such as CNP-600, CPR-1000 and CAP-
1400. The China National Nuclear Corporation has also developed a CNP-1000 plant incorporating
experience from the design, construction and operation of the Qinshan and Daya Bay nuclear power
plants. The first two units began commercial operation in 2010 and 2011 at Ling’ao. The Shanghai
Nuclear Engineering Research and Design Institute (SNERDI) is developing the CAP-1400/1700
Advanced Passive Plant based on AP-1000 passive safety technology.
85. Japan operates 4 advanced boiling water reactors (ABWRs) and was building 2 more until the
accident at the Fukushima Daiichi nuclear power plant. Construction was indefinitely suspended.
Japan has a programme to develop the 1638 MW(e) ABWR-II with expected economies of scale
relative to current ABWRs. Commercial introduction of the ABWR-II is foreseen for the latter half of
the 2010s. Japan also has programmes to develop a high performance advanced boiling water reactor
(HP-ABWR) and a high performance advanced pressurized water reactor (HP-APWR). Both are on
the order of 1800 MW(e). A European version of the APWR, the EU-APWR, is also under
development and will be assessed for compliance with the European Utility Requirements.
86. In the Republic of Korea, 11 OPR1000 units are in operation and 1 is under construction. Based
on the OPR1000 design, Korea Hydro & Nuclear Power Company has developed an advanced power
reactor APR1000 and, for further economies of scale, an APR1400. APR1400 units are under
construction at Shin-Kori-3 and -4 and are planned at Shin-Ulchin-1 and -2 and Shin-Kori-5 and -6.
Four APR1400s have been ordered by the UAE. A European version of the APR1400, the EU-
APR1400, is being developed and will be assessed for compliance with the European Utility
Requirements. Design work has begun on the APR+, an advanced PWR of 1500 MW(e).
87. In France, AREVA Nuclear Power has designed the 1650 MW(e) European Pressurized Water
Reactor (EPR), which meets the European Utility Requirements. Four are under construction in China,
Finland and France. In partnership with E.ON, AREVA is developing the 1250 MW(e) KERENA
design, an advanced BWR with passive safety systems, and, in a joint venture with Mitsubishi Heavy
Industries, it is developing the 1150 MW(e) ATMEA-1 design, an advanced PWR with active safety
systems.
88. Westinghouse in the USA has developed the AP-1000 design, which received design certification
in 2006. Four AP-1000 units are currently under construction at the Sanmen and Haiyang sites in
China. The US Nuclear Regulatory Commission (NRC) is reviewing both GE-Hitachi Nuclear
Energy’s ABWR and Toshiba’s ABWR for design certification renewal. It is reviewing AREVA’s
US-EPR, Mitsubishi’s APWR and GE-Hitachi Nuclear Energy’s ESBWR for design certification.

GOV/INF/2012/12-GC(56)/INF/6 Page 20
89. In the Russian Federation, Atomenergoproekt/Gidropress is designing evolutionary WWER
plants with power levels ranging from 300 MW(e) to 1800 MW(e). Two WWER-1000 (V-320) units
and five WWER-1200 (NPP-2006) units are under construction. There are two WWER-1000 (V-320)
units operating in China (Tianwan-1 and -2), two in the Czech Republic (Temelin-1 and -2) and one in
the Islamic Republic of Iran.
E.2. Small and medium size power reactors (SMRs)
90. Currently, 131 SMRs operate in 26 countries, with a total capacity of 58.9 GW(e). Of the 62
reactors under construction, 14 are SMRs. Approximately 45 innovative SMR concepts are at some
stage of research and development.
91. Argentina is developing the CAREM reactor, a small, integral type pressurized LWR design with
all primary components located inside the reactor vessel and an electrical output of 150–300 MW(e).
Site excavation started in September 2011 for a 27 MW(e) CAREM prototype plant.
92. In France, the DCNS Company is developing Flexblue, a small modular underwater design of
50–250 MW(e) based on the French water cooled marine propulsion reactor.
93. The Republic of Korea’s system integrated modular advanced reactor (SMART) design has a
thermal capacity of 330 MW(th) and is intended for seawater desalination. Standard design approval is
expected from the national Nuclear Safety Commission by the end of 2012.
94. The Russian Federation is building two 35 MW(e) KLT-40S barge-mounted reactors to be used
for cogeneration of electricity and process heat. The KLT-40S is based on the commercial KLT-40
marine propulsion plant and is an advanced variant of the reactor that powers nuclear icebreakers. The
8.6 MW(e) ABV-6M is in the detailed design stage. It is an integral pressurized light water reactor
with natural circulation of the primary coolant. The 8.6 MW(e) RITM-200, currently in the detailed
design phase, is an integral reactor with forced circulation for nuclear icebreakers.
95. In the USA, four integral pressurized water SMRs are under development: mPower, NuScale,
Westinghouse’s SMR and Hi-SMUR 140. The mPower consists of 2–6 180 MW(e) modules. Its
design certification application to the US NRC is planned for 2013. NuScale Power envisages a
nuclear power plant of up to twelve 45 MW(e) modules. Its design certification application is also
planned for 2013. The Westinghouse SMR is a conceptual 225 MW(e) design incorporating passive
safety systems and proven components of the AP-1000. Development has also started on a more recent
SMR design, the Holtec Inherently Safe Modular Underground Reactor (Hi-SMUR 160), a
160 MW(e) reactor that relies on natural convection, thereby eliminating the need for coolant pumps
and dependence on external power sources.
E.3. Heavy water reactors (HWRs)
96. There are 47 HWRs in operation and 5 under construction. There are two types: the pressure tube
type and the reactor vessel type. Except for Atucha-1 in Argentina, all operating HWRs are the
pressure tube type. Of the 5 under construction, all but Atucha-2 are also the pressure tube type.
97. In January 2011, the Canadian Nuclear Safety Commission (CNSC) completed the pre-project
design review for the ACR-1000, making it the first advanced nuclear power reactor to have
completed such a design review by the CNSC. The ACR-1000, being developed by Candu Energy,
uses very high component standardization and slightly enriched uranium to compensate for the use of
light water as the primary coolant. The CNSC is currently conducting the pre-project design review for
the 700 MW(e) Enhanced CANDU-6 (EC 6) design. Candu Energy is also developing a CANDU
supercritical water cooled reactor (CANDU-SCWR).

GOV/INF/2012/12-GC(56)/INF/6 Page 21
98. In India, the Nuclear Power Corporation of India Limited (NPCIL) has developed an
evolutionary 700 MW(e) HWR. Four are currently under construction. The Bhabha Atomic Research
Centre (BARC) is finalizing the design of a 300 MW(e) advanced heavy water reactor (AHWR),
which will use thorium-based fuel, passive safety systems, heavy water moderation and boiling light
water coolant in vertical pressure tubes.
E.4. Gas cooled reactors (GCRs)
99. There are 14 advanced gas cooled reactors (AGRs) and 1 magnox reactor in operation, all in the
UK.
100. In China, an industrial scale modular demonstration plant called the high temperature reactor –
pebble bed module (HTR-PM) is at an advanced stage of development. An owner company has been
established, and components such as the primary system pressure vessels, steam generators, reactor
internals and helium blowers are being manufactured. The site has been prepared, and first concrete
will be poured once approval is received from the authorities.
101. The Republic of Korea is developing hydrogen production capabilities through the Nuclear
Hydrogen Development and Demonstration (NHDD) project. An R&D project to develop the key
technologies for producing hydrogen using the very high temperature reactor (VHTR) is under way. It
focuses on coupling the VHTR and the sulphur-iodine thermochemical process; high temperature
metal and graphite material data; the high pressure sulphur-iodine process; TRISO fuel manufacturing
and qualification; and computer code and design methods.
102. In South Africa, the pebble bed modular reactor project was abandoned in 2010. The company
Pebble Bed Modular Reactor (Pty) Limited still exists and will be maintained until at least 2013. Its
current role is to maintain the project’s intellectual property and develop appropriate strategies for
future customer and supplier engagement.
103. In the USA in February 2012, the Next Generation Nuclear Plant Industry Alliance Limited
announced its selection of the AREVA high temperature gas cooled reactor (HTGR) concept as the
best design for the next generation of nuclear plants. The Alliance’s member companies intend to
cooperate in designing, building and operating HTGR technology. AREVA’s concept is a prismatic
fuelled HTGR of about 625 MW(th) per module.
E.5. Fast reactors (FRs)
104. There are 2 fast reactors in operation, China’s 20 MW(e) experimental fast reactor (CEFR) and
the Russian Federation’s 560 MW(e) BN-600. Two more are under construction in India and the
Russian Federation.
105. The CEFR is a pool-type sodium cooled fast reactor (SFR). China is also developing CFR-1000,
a 1000 MW(e) SFR demonstration plant using MOX fuel.
106. Under its European Strategic Energy Technology Plan (SET-Plan), the European Commission
recently defined a two-track technological pathway for developing fast reactors. The first track is for
an SFR, and the second is for lead cooled and gas cooled fast reactors as longer term alternatives. The
related demonstration and implementation programme, the European Sustainable Nuclear Industrial
Initiative, foresees development of the French SFR prototype ASTRID and two demonstration plants,
ALFRED and ALLEGRO, for lead cooled and gas cooled technologies respectively. The programme
is also supported by a fast-spectrum subcritical irradiation facility, MYRRHA, in Belgium.
107. India is building a 500 MW(e) prototype fast breeder reactor (FBR) at Kalpakkam,
Commissioning is planned for early 2013. The Indian programme foresees the construction of several

GOV/INF/2012/12-GC(56)/INF/6 Page 22
FBR units around 2020-2025 and the development, after 2025, of fast reactors with metallic fuel and
higher breeding ratios.
108. Japan has been developing the 1500 MW(e) Japan sodium cooled fast reactor as part of its Fast
Reactor Cycle Technology (FaCT) project, and the Republic of Korea is carrying out a broad R&D
programme in support of the 600 MW(e) SFR KALIMER.
109. The Russian Federation is building BN-800 on the site where BN-600 currently operates.
BN-800’s commissioning phase is scheduled to begin in 2014. The Russian Federation recently
launched a new programme to develop an advanced SFR (BN-1200), the lead cooled BREST-OD-300,
the lead bismuth eutectic cooled SVBR-100, the related fuel cycles, and the new multipurpose
research sodium cooled fast reactor MBIR.
E.6. Nuclear Fuel Cycle and Supporting Technology Developments
110. New aqueous and non-aqueous spent fuel reprocessing technologies for LWRs are being
investigated, which would make it possible to significantly decrease waste generation. To test and
optimize the technologies under development, work is being conducted to establish pilot industrial
demonstration facilities.
111. For HLW disposal, development work is under way to investigate suitable sites and specific
engineered barriers and to perform safety assessments and implement the technology for encapsulation
and disposal.
F. Cooperation relating to the Expansion of Nuclear Energy and
Technology Development
112. The Generation IV International Forum (GIF), through a system of contracts and agreements,
coordinates research activities on six next generation nuclear energy systems selected in 2002 and
described in A Technology Roadmap for Generation IV Nuclear Energy Systems. The six are gas
cooled fast reactors (GFRs), lead cooled fast reactors (LFRs), molten salt reactors (MSRs), sodium
cooled fast reactors (SFRs), supercritical water cooled reactors (SCWRs) and very high temperature
reactors (VHTRs). They represent a variety of reactor, energy conversion and fuel cycle technologies.
Depending on their respective degrees of technical maturity, these systems are expected to become
available for commercial introduction between 2015 and 2030 or beyond. GIF currently has 13
members.20
113. The Agency’s International Project on Innovative Nuclear Reactors and Fuel Cycles (INPRO)
has 37 members.21 INPRO has four projects: (1) National Long-Range Nuclear Energy Strategies,
(2) Global Nuclear Energy Scenarios, (3) Technical and Institutional Innovations and (4) Policy and
INPRO Dialogue Forum.
__________________________________________________________________________________
20 Argentina, Brazil, Canada, China, Euratom, France, Japan, the Republic of Korea, South Africa, Switzerland, Russian Federation, UK and USA.
21 Algeria, Argentina, Armenia, Belarus, Belgium, Brazil, Bulgaria, Canada, Chile, China, the Czech Republic, Egypt, France, Germany, India, Indonesia, Israel, Italy, Japan, Jordan, the Republic of Korea, Kazakhstan, Malaysia, Morocco, the Netherlands, Pakistan, Poland, the Russian Federation, Slovakia, South Africa, Spain, Switzerland, Turkey, Ukraine, USA, Vietnam and the European Commission.

GOV/INF/2012/12-GC(56)/INF/6 Page 23
114. INPRO and GIF coordinate activities through a joint action plan that covers cooperation in the
following areas: general information exchange, synergies in evaluation methods (focusing on
proliferation resistance, safety and economics), cooperation in topical studies (including, inter alia,
non-electric applications, SMRs and human resources), global dialogue between nuclear technology
holders and users and joint activities, e.g. the second joint IAEA/INPRO/GIF workshop on safety
aspects of sodium cooled fast reactors, held in November 2011. As part of the joint action plan, the
Agency participates as an observer in the GIF Policy Group and as a member in GIF Working Groups.
115. The membership of the International Framework for Nuclear Energy Cooperation (IFNEC) has
grown to 31 participating22 and 30 observer countries and 3 observing international organizations,
including the Agency. IFNEC currently has two working groups, one on infrastructure development
and another on reliable fuel services.
116. The Multinational Design Evaluation Programme (MDEP) was launched in 2006 by the US NRC
and the French Nuclear Safety Authority (ASN). As of April 2012, MDEP membership includes
national regulatory authorities from 11 countries.23 MDEP pools the resources of these 11 nuclear
regulatory authorities to, first, cooperate on safety reviews of specific reactor designs and, second,
explore opportunities for harmonizing regulatory practices. MDEP has five working groups: on the
EPR, the AP1000, mechanical codes and standards, digital instrumentation and control (I&C), and
vendor inspection cooperation.
__________________________________________________________________________________
22 Argentina, Armenia, Australia, Bulgaria, Canada, China, Estonia, France, Germany, Ghana, Hungary, Italy, Japan, Jordan, Kazakhstan, Kenya, Republic of Korea, Kuwait, Lithuania, Morocco, Netherlands, Oman, Poland, Romania, Russian Federation, Senegal, Slovenia, UAE, Ukraine, UK and USA.
23 Canada, China, Finland, France, India, Japan, Republic of Korea, Russian Federation, South Africa, UK and USA.