Embed Size (px)
Citation preview

Board of Governors General Conference
GOV/INF/2014/13-GC(58)/INF/6 Date: 4 August 2014
General Distribution Original: English
For official use only
Item 16 of the Conference's provisional agenda (GC(58)/1, Add.1 and Add.2)
International Status and Prospects for Nuclear Power 2014
Report by the Director General
Summary
• General Conference resolution GC(55)/RES/12, issued in September 2011, requested the
Secretariat to continue to issue its report on the international status and prospects for nuclear
power every two years. This report responds to that resolution.
Atoms for Peace

GOV/INF/2014/13-GC(58)/INF/6 Page 1
International Status and Prospects for Nuclear Power 2014
Report by the Director General
A. Introduction
1. There are currently 435 operational nuclear power reactors in 30 countries around the world and
72 are under construction in 15 countries.1 Nuclear power generated 2359 terawatt-hours (TW·h) of
electricity in 2013, corresponding to less than 11% of world electricity production, the lowest value
since 1982. The share of renewable energy continues to expand, but fossil fuels, especially coal, are
still the global fuel of choice.
2. The International Ministerial Conference on Nuclear Power in the 21st Century2, organized by
the Agency in Saint Petersburg, Russian Federation, in June 2013, was the first major event to address
the outlook for nuclear power after the Fukushima Daiichi accident. It concluded that, for many
countries, nuclear power was a proven, clean, safe, and economical technology that would play an
increasingly important role in improving energy security, reducing the impact of volatile fossil fuel
prices and mitigating climate change. It recognized the leading role of the Agency in promoting
peaceful uses of nuclear technology, in establishing safety standards and security guidance, and in
promoting international cooperation and efforts to strengthen global nuclear safety, security and
safeguards. It also recognized that nuclear accidents have no borders and that nuclear safety must be
robust, effective and transparent.
3. The Agency’s low and high projections for global installed nuclear power capacity both indicate
an increase by 2030. Although since 2010 each projection has been lower than the one made the year
before, the long term potential remains high. There are 33 countries interested in introducing nuclear
power. Of the 30 countries already operating nuclear power plants (NPPs), 13 are either constructing
new ones or actively completing previously suspended constructions. A further 12 are actively
planning to either construct new plants or to complete suspended construction projects.
__________________________________________________________________________________
1 These figures are as of July 2014. Nuclear Technology Review 2014 (document GC(58)/INF/4) presents in detail the
status of nuclear power as of 31 December 2013. This report only includes highlights from it to provide a backdrop for nuclear power’s near and longer term prospects.
2 This conference was organized in cooperation with the Nuclear Energy Agency (NEA) of the Organisation for
Economic Co-operation and Development (OECD) and was hosted by the Russian Federation. With over 500 participants, including 38 Ministers, from more than 80 countries and international organizations, the event enjoyed a much higher attendance than its predecessors in 2005 and 2009. All statements and presentations of the Conference are available at: http://www-pub.iaea.org/iaeameetings/43049/International-Ministerial-Conference-on-Nuclear-Power-in-the-21st-Century.

GOV/INF/2014/13-GC(58)/INF/6 Page 2
B. Nuclear Power Today
B.1. The Evolving Context
4. The national and international policies, market and technological developments that set the stage
on which nuclear power competes are continuously shifting. This section highlights important changes
since International Status and Prospects for Nuclear Power 2012 (document GOV/INF/2012/12-
GC(56)/INF/6).
B.1.1. International Initiatives
5. Globally, renewable energy use is increasing due to improving economics, flexibility of use, and
low-carbon benefits. The Sustainable Energy for All (SE4ALL) initiative and the International
Renewable Energy Agency (IRENA) have gained influence over the past two years. Focusing on
renewable energy, they receive significant government and public support at the national and
international levels. Wind and solar generating capacities are growing at double-digit rates, often
enabled by substantial subsidies. ‘Technological learning’, or ‘learning by doing’, has substantially
reduced investment costs so that, in some locations, the generating costs for renewables are near grid
parity, not counting the costs of balancing their intermittency and non-dispatchability.
6. SE4ALL was launched by the United Nations Secretary-General in September 2011 to address
two urgent challenges: energy access and pollution. The fact that 1.3 billion people lack access to
electricity is a major barrier to eradicating poverty and sharing prosperity. Emissions of carbon
dioxide and other greenhouse gases from fossil fuels contribute to dangerous anthropogenic
interference with the climate system. Climate change puts us all at risk. The poor are the first to suffer,
and they suffer the most.
7. Established in 2009 as an intergovernmental organization to support countries in their transitions
to sustainable energy, IRENA has 132 member States and 37 States in accession. To advance
development, energy access, energy security and low-carbon economic growth, it promotes the use of
all forms of renewable energy, including bioenergy, geothermal, hydropower, ocean, solar and wind.
B.1.2. Trends in Energy Markets and Technology
8. The impacts of the 2008 financial crisis around the world, and the different rates at which those
most affected are recovering from it, are still the most important near term factors affecting energy
markets. The crisis principally reduced the growth of energy demand around the world.
9. Another important factor is the continued near-total shutdown of Japan’s nuclear reactors that
supplied about 30% of its electricity before the Fukushima Daiichi accident. Japan’s increased
consumption of fossil fuels to replace the lost power, coupled with the expansion of shale gas, has
caused major shifts in global imports and exports of, particularly, coal and natural gas.
10. Since 2012, the technological developments that have most affected projections of nuclear
power’s future concern fracking (for shale gas) and renewable energy, as discussed in Section B.1.1.
The impacts of these three developments on nuclear power’s prospects are discussed in Section C.
B.2. Current Status of Nuclear Power
11. Global nuclear electricity generation in 2013 was 2359 TW·h, 220 TW·h less than the average
for the first decade of the 21st century. This drop resulted mainly from decreases due to permanent and
temporary shutdowns in Japan (266 TW·h), permanent shutdowns in Germany (41 TW·h) and the
USA (17 TW·h), offset partly by increases in China (34 TW·h) and other countries.
GOV/INF/2014/13-GC(58)/INF/6 Page 3
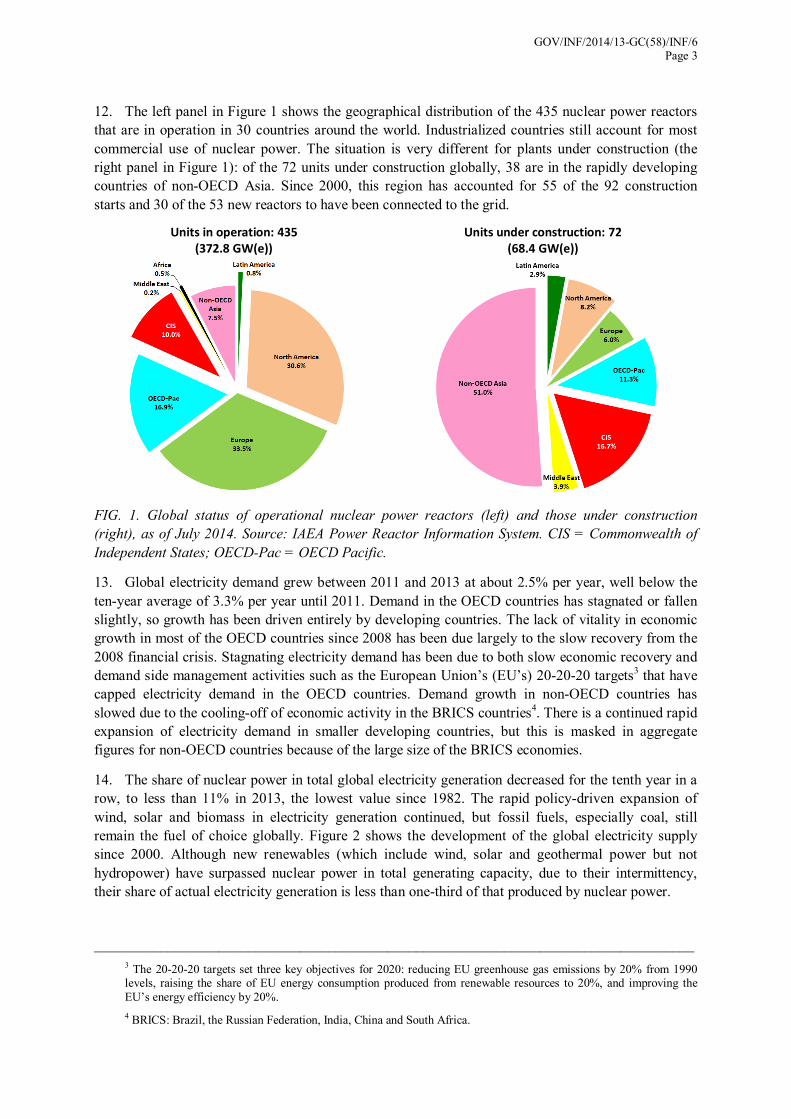
12. The left panel in Figure 1 shows the geographical distribution of the 435 nuclear power reactors
that are in operation in 30 countries around the world. Industrialized countries still account for most
commercial use of nuclear power. The situation is very different for plants under construction (the
right panel in Figure 1): of the 72 units under construction globally, 38 are in the rapidly developing
countries of non-OECD Asia. Since 2000, this region has accounted for 55 of the 92 construction
starts and 30 of the 53 new reactors to have been connected to the grid.
Units in operation: 435
(372.8 GW(e))
Units under construction: 72
(68.4 GW(e))
FIG. 1. Global status of operational nuclear power reactors (left) and those under construction
(right), as of July 2014. Source: IAEA Power Reactor Information System. CIS = Commonwealth of
Independent States; OECD-Pac = OECD Pacific.
13. Global electricity demand grew between 2011 and 2013 at about 2.5% per year, well below the
ten-year average of 3.3% per year until 2011. Demand in the OECD countries has stagnated or fallen
slightly, so growth has been driven entirely by developing countries. The lack of vitality in economic
growth in most of the OECD countries since 2008 has been due largely to the slow recovery from the
2008 financial crisis. Stagnating electricity demand has been due to both slow economic recovery and
demand side management activities such as the European Union’s (EU’s) 20-20-20 targets3 that have
capped electricity demand in the OECD countries. Demand growth in non-OECD countries has
slowed due to the cooling-off of economic activity in the BRICS countries4. There is a continued rapid
expansion of electricity demand in smaller developing countries, but this is masked in aggregate
figures for non-OECD countries because of the large size of the BRICS economies.
14. The share of nuclear power in total global electricity generation decreased for the tenth year in a
row, to less than 11% in 2013, the lowest value since 1982. The rapid policy-driven expansion of
wind, solar and biomass in electricity generation continued, but fossil fuels, especially coal, still
remain the fuel of choice globally. Figure 2 shows the development of the global electricity supply
since 2000. Although new renewables (which include wind, solar and geothermal power but not
hydropower) have surpassed nuclear power in total generating capacity, due to their intermittency,
their share of actual electricity generation is less than one-third of that produced by nuclear power.
__________________________________________________________________________________
3 The 20-20-20 targets set three key objectives for 2020: reducing EU greenhouse gas emissions by 20% from 1990 levels, raising the share of EU energy consumption produced from renewable resources to 20%, and improving the
EU’s energy efficiency by 20%.
4 BRICS: Brazil, the Russian Federation, India, China and South Africa.

GOV/INF/2014/13-GC(58)/INF/6 Page 4
FIG. 2. Global electricity supply by fuel, 2000–2013 (top), and share in global electricity generation
(bottom). Source: Adapted from International Energy Agency and BP.
15. Electricity demand in developing countries is approaching that of the industrialized countries and
will likely surpass them well before 2020. Unlike in regions with stagnating demand, rapidly growing
demand generally encourages the development of all locally available and appropriate electricity
generating options, including nuclear power.
16. Until recently, nuclear power has weathered the transition from regulated electricity markets to
liberalized (competitive) markets remarkably well. Existing NPPs proved to be competitive low-cost
generators, largely because their high initial up-front investment costs were fully depreciated and
operators had to bear only operating and fuel costs, which were low compared to those for fossil
fuelled generation. This cost advantage was the prime reason that utilities sought licence extensions
and performed safety upgrades and power uprates.
17. The situation has now changed: very low natural gas prices, particularly in the USA, caused by a
rapid shale gas expansion, have fundamentally transformed the energy economy. They have reduced
the competitiveness of commercial nuclear power.
18. The change is reflected in the recent and intended closures of NPPs in the USA. Despite being
licensed to operate to 2033, Dominion’s 574 MW(e) Kewaunee NPP closed in May 2013 only because
it was unable to compete in a liberalized market against cheap natural gas. Entergy announced the
retirement of its 604 MW(e) Vermont Yankee plant citing financial factors. These included low
wholesale electricity prices, which reduced the plant’s profitability and were driven largely by lower
natural gas prices, increased capital costs for maintenance, low compensation in the regional market
for maintaining dispatchable generating capacity, and the increased costs of complying with new
federal and regional regulations. As Vermont Yankee, like Kewaunee, was operating in a liberalized
electricity market, it could not recover such cost increases through regulated cost-of-service rates.
GOV/INF/2014/13-GC(58)/INF/6 Page 5
19. Although the trend of power uprates and renewed or extended licences for operating reactors
continued globally, there have been cases where extremely long and uncertain reviews by nuclear
regulators have resulted in early retirements rather than licence extensions. Stagnating or falling
electricity demand in some countries and low wholesale electricity prices have prompted some
operators to cancel even relatively low-cost uprates that had been planned.
20. Direct and indirect subsidies for renewable energy, especially wind, and renewable energy
directives undermine the economic viability of nuclear power, particularly in liberalized electricity
markets. As they boost the installed capacity of renewables, an increasing number of nuclear facilities
will become uneconomical at current wholesale prices, or will have strong incentives to shut down
early where significant investments are needed for extended operation and market prospects are bleak.
21. These factors — i.e. shale gas and the rapid growth in renewable energy driven by subsidies and
directives — affect nuclear power in liberalized markets in OECD countries with essentially zero
demand growth. The situation is fundamentally different in rapidly growing developing countries with
increasing electricity demand. They require the development of all locally available power options,
including nuclear. Nuclear power remains an important option for countries that put a high priority on
energy security and environmental protection at affordable and stable generating costs.
C. The Prospects for Nuclear Power
C.1. Plans in Countries Already Using Nuclear Power
22. Table 1 shows the expansion plans5 of countries currently operating NPPs plus Lithuania, which
has 43.5 reactor-years of operating experience but has no operating reactors since Ignalina-2 was shut
down in 2009. Of the 30 operating countries, 13 are either constructing new units or are completing
previously suspended construction projects. A further 12 are actively planning to build new units.
TABLE 1. Positions of countries with operating NPPs plus Lithuania (as of 30 June 2014).
Category Countries
New unit(s) under construction
Argentina, Brazil, China, Finland, France,
India, Japan, Republic of Korea, Pakistan, Russian Federation, Slovakia, Ukraine, USA
Construction restarts of suspended units Argentina, Brazil, Slovakia, Ukraine, USA
New unit(s) under construction with more planned/proposed
China, Finland, India, Republic of Korea, Russian Federation, Pakistan, USA
No units under construction but with
plans/proposals for building new unit(s)
Armenia, Bulgaria, Canada, Czech Republic, Hungary, Islamic Republic of Iran, Lithuania,
Romania, South Africa, Sweden, UK
Firm policy not to build new units and/or
for closure of existing units Belgium, Germany, Spain, Switzerland
__________________________________________________________________________________
5 Based on statements made by Member States at the 57th regular session of the General Conference in September 2013 and at other public forums.

GOV/INF/2014/13-GC(58)/INF/6 Page 6
C.2. Plans in Countries Considering or Introducing Nuclear Power
23. Table 2 shows that 33 countries6 are currently considering, planning or starting nuclear power
programmes, but have not connected a first NPP to the grid. Some, such as Bangladesh, Egypt and
Viet Nam, have been planning for nuclear power for some time. Others, such as Poland, are reviving
the nuclear option after plans had been curtailed when governments and public opinion changed.
Countries such as Jordan and Uruguay are considering or planning for nuclear power for the first time.
24. The table divides them into five groups, based on their infrastructure development according to
the Agency’s Milestones framework7. Countries in the most advanced stage, or Phase 3, are Belarus
and the United Arab Emirates (UAE), which have begun construction, and Turkey, which has ordered
its first NPP but not yet started construction. The six countries in the middle row have decided to
launch nuclear power programmes and are actively establishing the necessary infrastructure. The next
five have begun preparing for the introduction of nuclear power, although national decisions reflecting
broad political support are still pending. Making up the largest group, 19 countries want to make an
informed decision on the nuclear power option, and are acquiring information on nuclear infrastructure
development, ranging from legal and regulatory prerequisites to human resource requirements and
technology aspects.
TABLE 2. Positions of countries without operating NPPs.
Country Status Countries
First NPP construction started 2
First NPP ordered 1
Decision made, preparing infrastructure 6
Active preparation with no final decision 5
Considering nuclear power programme 19
C.3. Projections and Interpretations of Future Growth
25. The Agency publishes8 annually two updated projections for the world’s nuclear power
generating capacity, a low projection and a high projection. They are developed by experts from
around the world who are assembled by the Agency each spring. They consider all the operating
reactors, possible licence renewals, planned shutdowns and plausible construction projects foreseen
for the next several decades. They develop the projections on a project-by-project basis by assessing
__________________________________________________________________________________
6 Based on statements made by Member States at the 57th regular session of the General Conference in
September 2013 and at other public forums.
7 Milestones in the Development of a National Infrastructure for Nuclear Power, IAEA Nuclear Energy Series No. NG-G-3.1.
8 Energy, Electricity and Nuclear Power Estimates for the Period up to 2050, Reference Data Series No. 1 (IAEA-RDS-1), 2014 Edition.

GOV/INF/2014/13-GC(58)/INF/6 Page 7
the plausibility of each in light of, first, the low projection’s assumptions and, second, the high
projection’s assumptions.
26. This section briefly presents the results of this bottom-up exercise for both projections and then
interprets them taking into account the observations in the previous sections of this report.
C.3.1. The Low Projection
27. The low projection assumes that current trends will continue with few changes in policies
affecting nuclear power. It does not assume that all national targets for nuclear power will be achieved.
It is a ‘conservative but plausible’ projection.
28. Table 3 shows the results of the low projection, according to which, global nuclear power
capacity grows modestly from today’s 372 GW(e) to 401 GW(e) by 2030.9 This is 34 GW(e) less than
last year’s low projection for 2030 and 145 GW(e) less than the projection for 2030 made shortly
before the Fukushima Daiichi accident. The global totals, however, mask distinctly different regional
developments, as shown in the separate columns of Table 3. There are significant declines in North
America, Europe and OECD Pacific, stagnation in Africa, some growth in Latin America, CIS and
ASEAN and substantial expansion in the Middle East and non-OECD Asia.
TABLE 3. Low projection of nuclear power capacities by region in GW(e) installed up to 2030 based
on IAEA-RDS-1, 2014 Edition.
North
America
Latin
America
Europe CIS Africa Middle
East
OECD
Pacific
ASEAN Non-OECD
Asia
World
2013 112.6 4.1 125.0 37.1 1.9 0.9 63.1 0.0 27.0 371.7
2020 111.9 4.5 112.9 47.1 1.9 3.6 51.9 0.0 56.4 390.1
2025 98.4 5.9 82.7 48.1 1.9 6.6 51.6 0.0 83.7 378.9
2030 92.4 6.9 81.5 50.7 1.9 8.6 52.5 2.0 104.1 400.6
29. The low projection reflects a continuation of the slow and unsteady recovery from the global
economic and financial crisis of 2008 for about another five years before a longer period of sustained
but modest economic growth begins. In the short-to-medium term, large developing countries may
generally perform better than OECD countries due to strong domestic demand for goods and services
which would translate into above-average electricity demand. In contrast, electricity demand in the
OECD area is likely to continue to stagnate or grow very slowly.
30. Nuclear, wind and hydropower are among the lowest life cycle greenhouse gas (GHG) emitting
electricity generating technologies. Currently, there are only a few countries or regions where
investors in nuclear power are compensated for the technology’s climate mitigation benefits. In the
low projection, a stringent new globally binding climate change agreement will likely be delayed well
beyond the currently scheduled dates of 2015 for the agreement and 2020 for its entry into force.
Irrespective of a new international agreement, some countries and regions will continue to implement
low GHG energy strategies, but generally with a preference for renewables and efficiency measures.
Elsewhere, especially in most developing countries, coal would remain the fuel of choice for
electricity generation.
__________________________________________________________________________________
9 The projections include all available capacity that is classified by Member States as “operational” irrespective of
whether it is online or temporarily shutdown. In 2013, much of the Japanese capacity included in Table 3 under OECD Pacific was temporarily shutdown.

GOV/INF/2014/13-GC(58)/INF/6 Page 8
31. In the wake of the slow economic recovery, conservative capital markets would likely shy away
from financing the high upfront investment costs typical for nuclear power projects. While other
technologies, such as wind, solar and hydropower, share nuclear power’s front-loaded cost structure,
the large size of commercial nuclear units — 1000 to 1600 MW(e) compared to a few MW(e) per unit
for wind or solar power — makes financing these a challenge.
32. Only a few utilities exist globally with the financial depth and capitalization to finance an NPP
from their balance sheets. For many smaller economies, an NPP would account for a large share of
their annual gross domestic product. Financing would generally require external financial support.
While alternative, regional approaches, in which neighbouring countries share a first NPP, would both
lower each participant’s investment requirement and help overcome possible limitations associated
with small national grids, it is unlikely that such regional approaches would feature in the low
projection.
33. Financial risk management and mitigation measures, especially in liberalized markets, are not
universally available or applicable. Private sector sponsors of nuclear projects demand government
backed guarantees that allow them to recoup their investments. These can take several forms. These
include loan guarantees, long term power purchase agreements (PPAs) and contracts for difference
(CFDs). In a PPA, a public sector entity commits to buy a certain amount of electricity at a fixed price
over an extended period, e.g. 15 years or more. A PPA is an essential cornerstone of most build–own–
operate arrangements (e.g. Turkey’s Akkuyu NPP project). As applied to electricity sales, a CFD is a
contract between a utility and a private or public counterpart stipulating a floor and a ceiling price for
a kW·h. If the market price drops below the floor price, the counterpart compensates the utility for the
difference between the floor price and market price. If the market price is higher than the ceiling price,
the utility refunds the counterpart the difference between the market price and ceiling price. These
mechanisms (loan guarantees, PPAs and CFDs) offer investors and plant owners more predictable
revenue in liberalized electricity markets. However, nuclear power’s modest growth in liberalized
markets in the low projection is based on the assumption that there will be only isolated use of such
mechanisms.
34. For the countries that have begun constructing their first NPPs or have most of the necessary
arrangements in place, the sources of financing originate partly or fully from the vendor countries. The
UAE’s four new reactors are being financed by the UAE Government and a Korean consortium led by
the Korea Electric Power Corporation. In Turkey, the project company is co-owned by Turkey and the
Russian Federation, and the costs of construction, operation and decommissioning will be fully
financed by the Russian Federation. In Bangladesh, Belarus and Viet Nam, agreements also specify
that the bulk of the financing will come from the Russian Federation.
35. The expansion of shale gas production is spreading from the USA to other parts of the world. The
resulting low natural gas prices, together with increasing subsidized capacity for intermittent
renewable electricity generation, limits both growth prospects for nuclear power in some developed
countries and the economic lifetimes of some existing plants. Abundant shale gas would also cap coal
prices in local and international markets. Such developments are consistent with the results of the low
projection.
36. In some countries, policy decisions to introduce nuclear power, expand existing capacity or
replace retiring capacity were delayed due to the Fukushima Daiichi accident. Hence, the results of the
low projection are consistent with prolonged delays in new nuclear construction. Countries with
tentative phase-out plans that are assumed to follow through would also lead to the low growth shown
in the low projection.

GOV/INF/2014/13-GC(58)/INF/6 Page 9
37. The low projection’s regional differences and fairly small global annual growth of less than 0.5%
for the period up to 2030 replicate recent observations and trends in different markets as outlined in
Section B. The shift in nuclear growth from North America and Europe to the large developing
countries of particularly Asia is even more pronounced in the 2014 low projection than in previous
years.
38. Most of the capacity growth occurs in countries with existing nuclear power programmes. By
2030, the number of countries with operating NPPs will have grown from 30 to 35. Eight countries
will have been added to the group, accounting for 13 GW(e) of installed nuclear capacity in 2030.
Three countries (Armenia, Belgium and Germany), with a combined current capacity of 18.4 GW(e)10
,
will no longer be in the group in 2030.
C.3.2. The High Projection
39. The high projection assumes that the current financial and economic crises will be overcome
relatively soon and past rates of economic growth and electricity demand will resume. It assumes
stringent global policies to mitigate climate change.
40. According to the high projection (Table 4), global nuclear power capacity reaches 699 GW(e) by
2030, which would be 327 GW(e) more than in 2013. All regions contribute to the expansion, albeit at
different levels. After a minor initial decline, Europe reaches 144 GW(e) by 2030, some 10 GW(e)
higher than before the Fukushima Daiichi accident. North American capacity grows by 23%, from 113
GW(e) to 139 GW(e). Both regions experience distinct reversals of the declines predicted in the low
projections. The largest absolute expansion (170 GW(e)) occurs in Non-OECD Asia. Except for the
Association of Southeast Asian Nations (ASEAN) region, which grows from zero to 9.0 GW(e), the
largest relative increase occurs in the Middle East.
TABLE 4. High projection of nuclear power capacities by region in GW(e) installed up to 2030, based
on IAEA-RDS-1, 2014 Edition.
North
America
Latin
America
Europe CIS Africa Middle
East
OECD
Pacific
ASEAN Non-OECD
Asia
World
2013 112.6 4.1 125.0 37.1 1.9 0.9 63.1 0.0 27.0 371.7
2020 118.7 5.8 124.8 55.2 1.9 6.6 71.7 0.0 78.8 463.5
2025 124.2 7.9 130.0 63.6 1.9 11.4 81.2 2.0 135.6 557.7
2030 138.9 14.5 144.3 78.2 9.9 13.4 93.7 9.0 197.3 699.2
41. The diverse regional developments in Table 4 will include a large number of new countries that
will have successfully introduced nuclear power by 2030. Indeed, in the high projection, 19 new
countries, accounting for 36 GW(e) of capacity in 2030, bring the number of countries with operating
NPPs up to 47. Yet, as in the low projection, the capacity growth would be driven more by expansion
in established nuclear power countries than those starting new nuclear programmes.
42. Tentative phase-out intentions would not be followed through in Japan and Taiwan, China, nor
would other countries necessarily implement current phase-out decisions as originally scheduled.
43. The world economy would likely return to pre-crisis growth rates and patterns within the next
several years. Despite the improvements in electrical efficiency, global electricity demand grows,
mainly driven by emerging economies, several of which will have embarked on new or expanded their
__________________________________________________________________________________
10 The total includes the following data for Taiwan, China: 5032 GW(e).

GOV/INF/2014/13-GC(58)/INF/6 Page 10
nuclear power programmes. These growing economies can particularly benefit from low-carbon
energy sources for transportation, thus avoiding air pollution and carbon emissions.
44. A universally binding international agreement limiting GHG emissions would enter into force on
schedule in 2020. This would put world emissions on a trajectory consistent with the United Nations
Framework Convention on Climate Change objective of preventing dangerous anthropogenic
interference with the climate system, i.e. by limiting global temperature rise to less than 2°C compared
with pre-industrial times. Nuclear power would be recognized and accepted in many countries as a
cost-effective mitigation option.11
45. Although stringent climate mitigation policies would continue to support renewable energy and
efficiency measures, there would be increasing synergies between the traditional use of nuclear power
for baseload generation and the intermittent generation from wind and solar. The expected
commercialization of small and medium sized reactors (SMRs) by the mid-2020s could increase the
flexibility of NPP operation.
46. As coal is replaced, natural gas could be the balancing fuel between renewable energy and
nuclear power for several decades. Together, natural gas, renewables and nuclear power could bring
substantial climate benefits.
47. Other regions would experience the same trend seen earlier in Asia: with increased experience,
more construction is completed on schedule and on budget. Lessons learned from recent construction
of first-of-a-kind plants and their associated pitfalls have helped streamline the whole process from
planning to the end of construction, shortening construction times and reducing costs. A good track
record of project completions increases investor confidence and reinforces public support.
C.3.3. Comparing the High and Low Projections
48. Figure 3 compares the high and low projections and thus highlights the substantial uncertainty in
projections about nuclear power’s future. The current plans reported in Section C.2. lie within the
range covered by both projections. That is, 9 countries explicitly plan to connect their first NPP to the
grid by 2030, and this lies between the 7 that would do so in the low projection and the 18 that would
do so in the high projection. Despite nuclear’s share of global electricity generation declining in the
low projection to an estimated 9% by 2030, there still is absolute, though modest, growth in global
generation. The situation is different in the Asian regions where nuclear electricity generation
continues to grow at rates close to those for overall electricity growth.
49. In the high projection, the 2030 share of nuclear power in the total electricity supply is estimated
at 13%, slightly higher than its current share. This implies faster growth for nuclear power than for
electricity as a whole, and this relationship is more pronounced in developing countries than in the
OECD countries. Globally, the high projection would require 33–36 new reactors connected to the
grid every year starting around 2025. The highest number of new grid connections was 33 in 1984.
The current global manufacturing capacity, especially for heavy forgings, is estimated at 30–34
reactors per year and thus would not be a constraint in the high projection. Rather, the challenges
would be in ensuring strong political support and a level playing field for all electricity generating
options that made nuclear power’s comparative benefits as well as risks more visible to, and
understood by, investors and the public. In short, 33 grid connections by 2025 would require
immediate action today.
__________________________________________________________________________________
11 See Climate Change and Nuclear Power 2013, IAEA, 2013.

GOV/INF/2014/13-GC(58)/INF/6 Page 11
FIG. 3. Regional capacity developments in the low and high projections. Source: Based on
IAEA-RDS-1, 2014 Edition.
50. Extending both the low and the high projections beyond 2030 involves much bigger uncertainties
regarding the technical, economic and political developments that influence energy choices. Still, if
the main assumptions adopted in the two projections are maintained, the global nuclear power capacity
is estimated to reach 413 GW(e) in the low projection in 2050 and 1092 GW(e) in the high projection.
51. Even in the high projection, however, despite the sizeable increase between 2030 and 2050 of
393 GW(e), nuclear power would account for only a 5% share of the global generating capacity in
2050. The share would be much higher in terms of actual generation (12%) because nuclear power is
largely used for baseload generation.
D. Influential Factors
52. Future developments will probably fall somewhere between the low and high projections. While
the interpretations above connect key factors with one or the other projection, more possibilities exist.
For example, nuclear power and abundant natural gas are not necessarily mutually exclusive in the
high projection. Likewise, a new international environmental agreement on climate change would not
guarantee higher growth in nuclear capacity than in the low projection. Alternatively, nuclear power
might prosper in a low demand environment. This section comments on some of the factors that might
be important in determining whether future developments will be closer to the low or the high
projection.
53. Most important is the current and future safety record of all nuclear installations. A strong safety
record is essential for the public acceptance of nuclear power.
54. Equally important is strong non-partisan policy support for nuclear power in countries that are
operating and introducing nuclear energy. Frequently reopening the nuclear debate in public discourse
is a disincentive for investors, the public and the nuclear workforce. Delayed policy decisions in
introducing nuclear power reduce the incentives for pursuing a nuclear career.
55. Nuclear power’s high upfront capital costs, its long lead times for planning, licensing and
construction, and its cost sensitivity to interest rates all pose financing challenges. However, other
things being equal, it is an attractive investment for longer term returns (usually more acceptable to

GOV/INF/2014/13-GC(58)/INF/6 Page 12
governments than to private industry) and in countries where financial risks are lower due to
predictable electricity demand and prices, stable market structures and strong political support.
56. Delaying decisions may also lead to ‘lock-in’ effects. If non-nuclear alternatives are developed
that require distinctly different electricity supply and transmission infrastructures (e.g. dispersed
generation with the minimum transmission infrastructure), this could make it increasingly difficult to
add large nuclear units later on.
57. Operating licence extensions and power uprates of existing plants have been more economically
attractive and less controversial than new nuclear builds. The attractive economics are due to the
limited changes and safety upgrades associated with uprates and the fact that such plants are generally
depreciated. The reduced controversy is largely because the plants are known entities to the
surrounding communities. Although older designs undergo safety upgrades to meet the current safety
standards, they can never completely reach the level of the best available technology used in newly
built plants. This can create policy challenges requiring trade-offs between the safety and economics
of older and newer designs.
58. Demonstrated progress in the development and implementation of high level waste (HLW)
repositories could have a profound impact on the political and public acceptance of nuclear power.
Countries with clear waste management policies in place and visible progress towards operational
HLW repositories are among those with the highest levels of public acceptance.
59. The availability of SMRs could greatly expand the market potential of nuclear power, both in
countries with small or island grids and in countries with established nuclear power programmes with
stagnant electricity demand. SMRs could reduce the time to market and the financial exposure of
investors, making them easier to finance. Modular SMRs can be used to flexibly respond to demand
uncertainty and are also more suitable for non-electrical energy applications.
60. Future developments will depend on which of several precedents now being set are found to be
more compelling by various countries. On the one hand, Germany, a sophisticated technology-literate
economy, plans to phase out its nuclear power by 2022 and rely extensively on renewables and
efficiency improvements to meet its future energy demand. On the other hand, in 2012 the UAE
became the first country in 27 years to start constructing its first NPP, which it plans to connect to the
grid in 2017. As discussed in Section C.2., many other countries are planning to follow suit. How
successful these alternative approaches prove to be may significantly influence the choices of others.
61. Also important will be the future of policies promoting renewable energy as their costs, to both
taxpayers and consumers, evolve. Directives that require countries to increase the share of renewable
energy in their energy portfolios, supported by heavy subsidies, can impede the growth of nuclear
power once the share of renewable energy on the transmission system approaches 15 to 20 per cent.
Transmission system operators dispatch according to marginal generating costs. Having zero marginal
costs, wind and solar electricity are dispatched first, when available, pushing all other generation,
including nuclear power, further down the order of supply. Feed-in tariffs for, and offtake obligations
of, renewable electricity (whether the electricity is needed or not) further distort electricity markets
and drive system costs up.12
62. In addition, the intermittency and unpredictability of generation from renewable sources require
fast system responses (e.g. spinning reserves, ramping up and down, and depleting or replenishing
hydropower storage) to maintain system integrity and stability. The capability of ramping up and
__________________________________________________________________________________
12 Germany’s subsidies and feed-in tariffs for wind and solar electricity have led to the paradoxical situation that the country has both some of the lowest wholesale prices and some of the highest retail prices in the EU.

GOV/INF/2014/13-GC(58)/INF/6 Page 13
down over larger power ranges is not a typical feature of nuclear power, unless there are numerous
NPPs on the grid, as in France, in which case many plants can simultaneously adjust power levels over
a small range.
63. Nuclear power’s many environmental benefits can tilt the balance in its favour if the benefits can
be quantified in monetary terms and made visible to policymakers, investors and the public. As
already mentioned, stringent climate mitigation policies would improve the economics of nuclear
power relative to fossil fuelled generation as long as the technology is judged by its climate benefits,
which are on a par with those of other low GHG technologies.
64. Other benefits of nuclear power that may tip the balance in different countries are that it reduces
poor air quality, strengthens energy security and provides dispatchable baseload generation at stable
and predictable costs. Policies to combat air pollution, as recently announced in China, make fossil
fuelled generation more expensive than nuclear power and renewable energy. Policies to monetize
contributions to energy security could also make nuclear power more attractive. Finally, capacity
remuneration mechanisms or compensation for dispatchable generation would create additional
revenue for NPP owners.
65. No industry can survive in the longer run without innovation. Innovative plant designs and
advanced fuel cycles are the prime responsibility of the nuclear industry. Other aspects of innovation
such as new business models, financing schemes or creating a favourable investment climate fall in the
domain of other sectors. All nuclear designs are undergoing innovation to reduce costs and to enhance
safety. The commercialization of SMRs is one important area for enhanced research, development and
demonstration and may also be a determining factor as to whether the high projections cited earlier are
realized. The Nuclear Technology Review 2014 notes that 45 innovative SMR concepts are at various
stages of research, development and demonstration, and that several SMR designs are already under
construction.
66. Other designs, such as fast reactors and high temperature reactors, will not play a decisive role
before 2030 but could become important thereafter, especially when sustainability considerations call
for waste minimization (both in terms of volume and longevity) and for resource conservation.
67. Stakeholder involvement in nuclear policy formulation and investment decisions, especially with
potential safety implications, has become a central feature for successful and safe nuclear power
deployment. Stakeholder involvement has become indispensable for the development of a national
position in newcomer countries, and for the siting of new nuclear construction projects and HLW
repositories. It may also extend to the review of regulatory competence and efficiency.
68. Public acceptance is key for the future of nuclear power. Differences in acceptance levels across
different countries and localities reflect how the public weighs and perceives the benefits and risks of
nuclear power (usually in isolation from the risks and benefits of non-nuclear alternatives).
Comprehensive and transparent energy planning with stakeholder involvement and the inclusion of all
technology and fuel options accessible in a country help in adopting viable energy options.
Stakeholders from outside the nuclear community usually have a higher credibility with the public
than members of the community. Hence, they are better positioned to explain and communicate
radiation risks and impacts, and operational safety issues.
69. Nuclear power is at a paradoxical stage. On the one hand, it appears to have entered an era of
declining expectations. Each year since 2010, the Agency’s projections for the installed nuclear power
capacity in the world in 2030 have been lower than the projections made the year before (Fig. 4). Yet
Table 2 shows a wave of countries poised to introduce nuclear power, and the long term potential
remains high. Some of the economic, technological and political factors that may influence

GOV/INF/2014/13-GC(58)/INF/6 Page 14
developments in one direction or the other are outside the control of the nuclear industry or even
governments. On others, the industry, governments and even the Agency can have more influence.
FIG. 4: The Agency’s global low (top) and high (bottom) nuclear power projections. Source:
IAEA-RDS-1 editions 2005 to 2014.