Embed Size (px)
Citation preview
MARCH 2016
International Postgraduate Research Students:
The UK’s Competitive Advantage
32
Contents
6Executive summary
7Recommendations for policymakers and universities
91. Introduction
122. International PGR enrolment trends
173. Policy analysis: The UK market and
primary competitors
224. The international PGR student
experience in the UK
Contents
Contents
295. What has changed since 2008?
356. How does the UK international PGR
experience compare?
437. Decision-making factors for international
PGR students
468. What helps international PGR students to
choose?
499. How does UK international PGR student
choice differ from rival markets?
5210. Analysis and synthesis
54
Figure 5: ISB survey data – PGR cost-of-living satisfaction trends across key competitors, 2008–14
Figure 6: ISB survey data – PGR financial support satisfaction trends across key competitors, 2008–14
Figure 7: ISB survey data – PGR teaching opportunities satisfaction trends across key competitors, 2008–14
Figure 8: ISB survey data – PGR overall learning satisfaction trends across key competitors, 2008–14
Figure 9: ISB survey data – PGR overall satisfaction trends across key competitors, 2008–14
Figure 10: ISB survey data – decision factors for international PGR students in the UK, 2014–15
Table 27: ISB survey data – Importance of teacher reputation in decision making, by nationality
Table 28: ISB survey data – key decision-making factors for PGR students in the UK by nationality, 2013–14
Table 29: ISB survey data – decision factors for PGR students in the UK by field of study, 2013–14
Table 30: ISB survey data – key influences on PGR choice: percentages by nationality, 2014–15
Table 31: ISB survey data – key influences on PGR choice: nationality by perceived significance (ranked), 2014–15
Table 32: ISB survey data – countries considered by students choosing the UK, 2014–15
Table 33: ISB survey data – countries considered by PGR students before choosing the UK, 2008–14
Table 34: ISB survey data – location before commencing programme of study in the UK, 2014–15
Table 35: ISB survey data – key influences on international PGR student’s decisions: competitor comparisons, 2013–14
Appendix A: Recommendations from the 2008 Report, The UK’s Competitive Advantage: The Market for International Research Students (pp. 79, 80)
Appendix B: UK Non-EU PGR Student Population by field of study, 2013/14 v 2008/09
Appendix C: UK Non-EU PGR Student Population by domicile, 2013/14 v 2008/09
Appendix D: % International PGR students by domicile and field of study
Appendix E: PGR International Students: Funding of studies by country of study
Acknowledgements
Author: Will Archer
The report was supported by funding from the Department for Business, Innovation and Skills, UKTI, and the Higher Education Funding Council for England. The author and the UK HE International Unit would like to thank members of the Project Steering Group for their expert advice:
Professor Judith Lamie, Dr Shaun Curtis, Michael Peak, Vincenzo Raimo, Peter Clack, Dr David Stevens, Gordon Slaven, Dr Janet Ilieva, Cliff Hancock, Brian Johnson, Daniel Hurley, Charlene Allen, Jo Attwooll, Vikki Challen, Daniel Shah.
Contributors: Teresa Angulo, Kevin Brett, Stephen Darwin, Laura Dicken, Greg Gawinowski, Jessica Howlett, Richard Garrett, Rory Govan, Lynne Griffiths, Rachael Merola, Kyla Steenhart.
Index of tables and figures
Figure 1: Distribution of international students by destination country, 2012
Figure 2: International students by academic level – UK and competitors, 2013–14
Table 1: Numbers of international PGR students 2007–14 (and change in comparative share)
Table 2: New international student enrolments in the US, 2004–05 to 2013–14
Table 3: Total number of international students in Germany from all places of origin by academic levels in 2012–13
Figure 3: ISB survey structure
Table 4: ISB survey data on the international PGR arrival experience in the UK, 2014
Table 5: ISB survey data on the international PGR learning experience in the UK, 2014
Table 6: ISB survey data on the international PGR living experience in the UK, 2014
Table 7: ISB survey data on international PGR support services usage in the UK, 2014
Table 8: ISB survey data on international PGR satisfaction with support services in the UK, 2014
Table 9: ISB survey data – derived importance of the international PGR student experience in the UK, 2014
Figure 4: Closing the loop
Table 10: ISB survey data – overall measures of the UK international PGR student experience, 2008–14
Table 11: ISB survey data – decision-making factors for international PGR students in the UK, 2008–14
Table 12: ISB survey data – key influences for international PGR students in the UK, 2008–14
Table 13: ISB survey data – agent rating for international PGR students in the UK, 2008–14
Table 14: ISB survey data – application methods for international PGR students in the UK, 2008–14
Table 15: ISB survey data – application time/satisfaction for international PGR students in the UK, 2008–14
Table 16: ISB survey data – other countries considered by international PGR students in the UK, 2008–14
Table 17: ISB survey data – funding sources for international PGR students in the UK, 2008–14
Table 18: ISB survey data – the arrival experience for international PGR students in the UK, 2008–14
Table 19: ISB survey data – the learning experience for international PGR students in the UK, 2008–14
Table 20: ISB survey data – the living experience for international PGR students in the UK, 2008–14
Table 21: ISB survey data – support services for international PGR students in the UK, 2008–14
Table 22: ISB survey data – overall measures of PGR satisfaction across key competitors, 2013–14
Table 23: ISB survey data – PGR arrival experience satisfaction across key competitors, 2013–14
Table 24: ISB survey data – PGR learning experience satisfaction across key competitors, 2013–14
Table 25: ISB survey data – PGR living experience satisfaction across key competitors, 2013–14
Table 26: ISB survey data – PGR support services satisfaction across key competitors, 2013–14
76
Recommendation 1
The UK’s reputation for world class research has been built over centuries. The UK’s global leadership in the research student experience is here and now in an intensely competitive and rapidly-changing market context. There should be a coordinated national campaign, either from the sector or for the sector, to position the quality of the experience and the value of a UK research degree at the heart of messages to attract more of the most talented research students.
Recommendation 2
There is good developmental work in place at university level and increasingly at a coordinated sector level. Areas of sub-optimal performance in the research student experience should receive greater attention and further analysis, with monitoring and reporting of the effect of interventions, plus further sharing of good practice.
Recommendation 3
Evidence suggests that the UK’s position is less competitive given the current policy on immigration. Great researchers should have a lot to offer the UK economy while enriching the country’s intellectual capital. Whether in policy or perception, the current position will need to change for the UK to maintain its competitive advantage in attracting great research students.
Recommendation 4
Consider further development of preparatory research programmes to encourage international UG and PGT students (both UK-based and overseas) to continue on to further study in UK. Some form of coordinated national postgraduate support function to assist prospective international PGR students develop their research focus may also help attract enrolments.
Recommendation 5
In the ongoing development of destination sites and dedicated portals, agencies should highlight the advantages of a UK research degree, with clear content to assist students to connect quickly with prospective universities and supervisors, to bring their formative research intentions to fruition. This recommendation applies equally to universities’ websites.
Universities should ensure their web technologies and social media strategies enable prospective research students to see current and recent research, research leaders, research facilities, research students and alumni.
Recommendation 6
Universities should further encourage academics and staff to travel and speak internationally and to strengthen international relationships. For all the virtual connections and omnipresence of the web, individual connections remain vital components in the research student’s decision of where to study.
While nation to nation agreements are positive and university-level partnerships are a good thing, research relationships are individual. There should be more support and guidance for researchers to build and maintain research networks, noting the potential for recruitment.
Recommendation 7
Universities should consider formal processes for collecting and collating evidence of graduate outcomes and career trajectories by nationality and field of study, to more effectively demonstrate the PGR return on investment in career and/or financial terms.
This report on international postgraduate research students is part of a series commissioned by the UK Higher Education International Unit to systematically examine the UK’s market position with respect to international student recruitment and the international student experience. It complements two companion reports that look at the UK’s competitive advantage concerning international taught postgraduate students and international undergraduate students. It also refers back to the International Unit’s 2008 PGR Competitive Advantage Report1.
At a time when clarity of policy vision and a strong value proposition by universities are essential to maintain the UK’s impressive record in recruiting international postgraduate research (PGR) students, this report delivers important insights on key drivers for student decision-making and makes targeted recommendations for UK policymakers and universities.
The findings presented are based on international PGR student experience data derived from 116,148 responses from research students across host countries to i-graduate’s International Student Barometer (ISB), supported by statistics on international PGR student recruitment in the UK and major competitor countries, as well as a high-level analysis of key competitors’ government policies on recruitment, support and post-study employment.
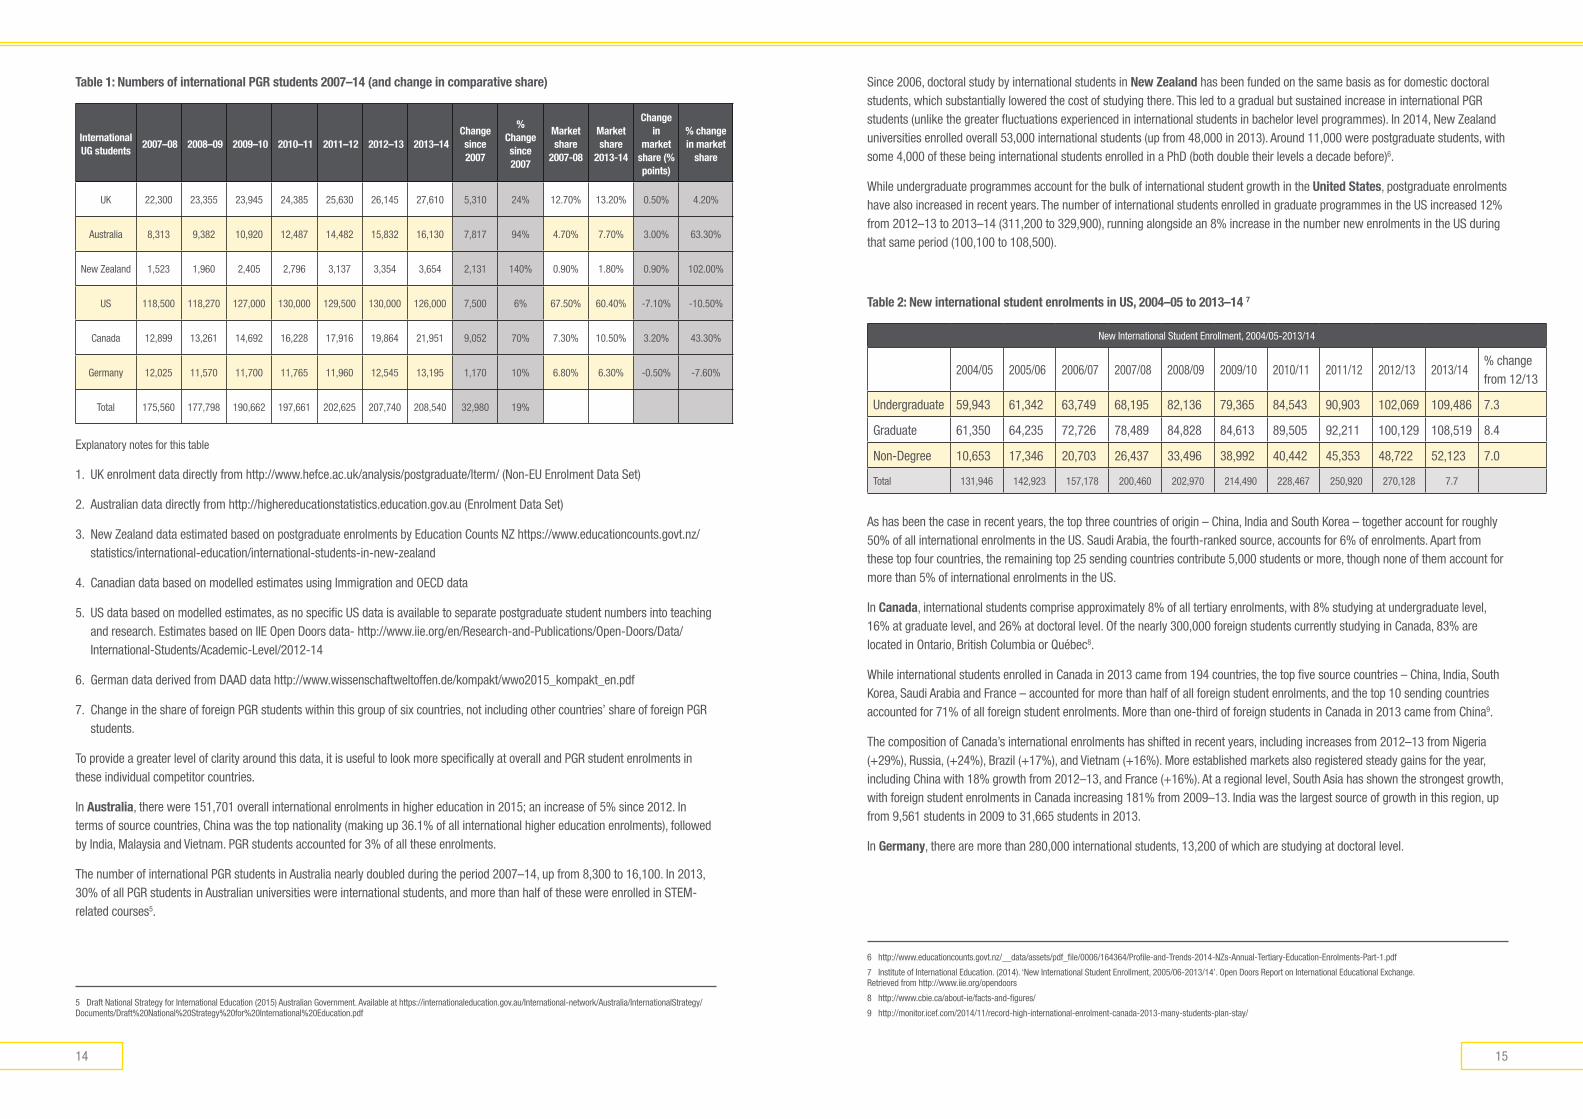
International PGR student numbers have increased by 24%, from 22,300 to 27,610 since 2007-08.
The UK has grown its share marginally (+4%) against major rivals. In this same period the US and Germany have grown numbers but lost market share (-10% and -8%).
In parallel with significant growth in numbers, since 2008 UK universities have driven up research student satisfaction across 81 of 85 measures of the PGR student experience. This includes improvements in all the six headline indicators: propensity to recommend, overall satisfaction, overall experience of arrival, learning, living and support. It records improvements against all 23 measures of the study experience, all 17 measures of arrival and orientation, 19 of 23 indicators of the living experience and all 16 measures of support services for research students.
1 ‘UUK (2008) The UK’s Competitive Advantage: The Market for International Research Students.
Can the UK claim to deliver a ‘world class’ experience for PGR students? The answer is yes: 90% of international PGR students are satisfied with their education in the UK.
Compared against its primary rivals for postgraduate research, the UK has the highest satisfaction ratings for the research student experience for the majority of all measures, rated #1 for 47 of 85 indicators, including course content, expert supervisors and research.
Together 85% of research students in the UK recommend their experience. Recommendation rates have increased by five percentage points since 2008 and are higher than those achieved in the USA, Canada, Australia and New Zealand.
Although the headlines are positive and encouraging, there is no room for complacency if the UK is to maintain comparative advantage and sustain growth in the intensely competitive global market for research talent.
Competition from key nations is getting stronger: The UK’s rivals in the international PGR marketplace have also recorded sharp improvements in recruitment and are adopting ambitious strategies to drive future growth.
Pressure points for the UK include visa processing, post-study work opportunities and the introduction of new graduate schemes: The report’s findings illustrate the success achieved by competitors who have adjusted their related policy settings to boost international student recruitment.
The importance of international PGR students extends far beyond their economic value: They are fundamental to the national research pipeline, they help to drive economic innovation and social improvement, and they offer universities a global network of the most highly-qualified influential alumni in research, university leadership and beyond.
It is hoped that this report contributes to better understanding of the competitive international PGR student landscape and drives growth for this critical component of teaching, research and knowledge exchange in the UK’s higher education system and broader economy.
exeCUtive sUmmARyReCommendAtions foR PolICymaKeRs and UnIveRsITIes
98
1. intRodUCtion
In 2008 the International Unit published The UK’s Competitive Advantage: The Market for International Research Students. This report examines what has changed since that time.
The 2008 report made eight national level recommendations. Just one has been implemented: direct approaches to governments that provide scholarships for their nationals. Of seven recommendations to universities, three have been fully implemented and the other four partially2.
This in itself tells a story. The UK’s universities compete on the world stage to attract the best research talent. Until now at least, research indicators are the primary measure of excellence, dominating all international rankings and driving funding. The best international postgraduate research students have a world of choice. So UK universities are acutely focused to persuade the best to head their way. This report delivers the evidence that they are both responsive and proactive, delivering a world class research student experience.
The success of the sector should not mask a weakness: there is almost no national coordination, sector alignment or collaboration to attract international research students (outside of funded programmes such as Newton or Ciência sem Fronteiras where Universities UK plays a management and support service role).
And there are weaknesses. Most notably in the regulatory regime around visas and immigration, but also significantly around the cost and funding of studies and opportunities to teach, and marginally in online resources and virtual learning.
Postgraduate research (PGR) is the smallest of the three main markets for international students. In the UK, PGR students represent about 10% of all non-EU enrolments. However, international PGR students are important beyond their number for two primary reasons.
Firstly, international PGR students represent the cream of academic talent. Their recruitment enables the UK to invest and benefit from the potential innovation their research yields. International PGR students also provide considerable additional value in lecturing and supporting teaching, to enhance the undergraduate and PGT student learning experience.
Secondly, international PGR students constitute a significant proportion of total PGR students in the UK, particularly in STEM fields. As such, they provide an important foundation to domestic research capability, assisting to sustain and broaden university research activities.
Therefore, despite it being a relatively smaller market for international students, recruitment of PGR students is not a marginal activity or optional extra. Instead, it is fundamental to the national research pipeline.
International graduates of UK PGR programmes offer rich prospective potential – either domestically or in their home countries – to drive economic innovation and social improvement. In the longer term, these graduates also offer UK universities an important global network of influential alumni. They are significant in their own right, and important in encouraging prospective international PGR students to follow in their footsteps.
At one level, this report was intended to update and expand upon the analysis presented in the 2008 report The UK’s Competitive Advantage: The Market for International Research Students. This provided an important snapshot of the competitive position of the UK in international PGR provision at that time. In addition to updating data, this report also examines some of the significant changes that have occurred in the intervening seven years. It therefore takes into account significant international student expansion in Canada and the US, as well as changes in policy and positioning in Australia and New Zealand and the slowing of growth in the UK.
2 See Appendix B
Recommendation 8
Universities and funders should consider strengthening the capacity of universities to educationally and administratively support PGR students. This could include central application management, formative support for PGR applicants and more central structures to support research supervision.
Recommendation 9
Given the intensely competitive environment, universities should establish strategies to ensure applications are processed expeditiously and that offers made to students are tracked in order to maximise conversation rates through to enrolment.
Recommendation 10
Universities, sector bodies and Government should consider a more substantive process for collecting and collating evidence of the decision making, influences and routes to postgraduate research study in the UK.
Recommendation 11
While the focus of this report in on traditional English-speaking markets for PGR study, it is important to note that significant ‘non-traditional hosts’ are pursuing ambitious strategies to grow academic research. Universities and the sector should track developments in these markets to identify challenges, opportunities and trends.
Recommendation 12
It would be useful for the sector, supported by government, to develop targeted strategies to better engage with governments that are developing schemes to sponsor local students to undertake research in leading universities overseas to ensure the UK’s research capabilities are well understood, as well as to more effectively facilitate the movement of grant recipients into UK universities.
1110
In order to provide insight into these important issues, this report considers the following questions:
- What are the international PGR enrolment trends in UK higher education and in key competitor countries? The competitor countries considered in this series are Australia, Canada, Germany, New Zealand and the US.
- How do UK policy responses toward the recruitment and maintenance of international PGR students compare with strategies adopted over recent years in competitor countries?
- What are the UK’s competitive advantages in terms of international PGR student funding and support, the international PGR student experience, and national visa and post-study employment policy?
- What matters most to international PGR students and how does the UK PGR experience compare to the experience of international students in competitor nations?
- What are the key influencers on PGR student choice and how does this differ versus rival markets?
- Recommended actions for policymakers and universities to consider: what policy changes might impact most positively on PGR recruitment?
The report’s methodology centres on considered analysis of a range of secondary data, including:
- Statistics on international PGR student recruitment in the UK and major competitor countries, institutional positioning and arrangements targeted at this population
- National and regional government policy on recruitment, support and post-study employment
- Survey data on the international PGR student experience.
The student experience data is derived from the International Student Barometer™ (ISB), the world’s largest survey of international student satisfaction and the global benchmark for the student experience3. The ISB offers a unique and rich source of cross-institutional, cross-country and longitudinal perspectives to inform this analysis.
3 The International Student Barometer is an initiative of The International Graduate Insight Group (i-graduate), part of Tribal Group PLC. www.i-graduate.org, www.tribalgroup.com
Other post-2008 developments are considered: the global surge in online and mobile access, widespread social media adoption by prospective students and universities, the streamlining of visa arrangements and, to a lesser degree, the increased use of education agents.
The UK has long been a world leader in international research and postgraduate research study. But this impressive track record cannot be taken for granted. In the 2012–13 academic year, the UK suffered an unexpected decline in the total number of international students enrolled in universities and colleges. This prompted critical debate about causes, competition and future prospects. Was the UK becoming a less attractive destination for prospective international students? Was recent UK policy on immigration and student employment after study a factor? How does the international student experience compare to that of major competitors?
In 2013–14, UK international student numbers revived, though 2014-15 saw another fall in overall non-EU enrolments, the number of non-EU PGR students continued to grow. Given the specific importance of international PGR students to the health of UK higher education, it is important to note that UK international PGR recruitment has generally bucked this recent decline, having achieved small but steady enrolment increases in recent years.
The broader context is less straightforward. Although the UK commands second place in terms of international PGR student volume behind the US, other competitor countries – most notably Australia and Canada – have grown their international PGR student numbers much faster than the UK. Indeed, recent data indicates that Canada is closing in on the total number of international PGR students attracted to the UK.
This inevitably prompts the question: how have these countries managed to attract larger numbers of international PGR students? For instance, to what extent do the comparatively generous funding schemes introduced in these competitor nations explain recruitment success, and how do these compare to what is on offer to PGR students in the UK?
Moreover, do post-study work arrangements in these countries encourage international PGR students to plan ahead, including permanent migration? And what do these approaches imply for future policy responses of government and universities to sustain and grow the UK’s share of the international PGR student market?
Finally, what strategies will best equip UK universities to successfully compete for international PGR students in the intensely contested global marketplace?
Conversely, the strengthening of local and transnational provision may erode the potential to recruit in some of the most significant source countries. At the same time, evidence of the fragmentation in research qualification structures generated by new entrants and online provision make the prospective recruitment environment volatile.
In this context, clarity of policy vision and a strong value proposition by universities will be essential to maintain the UK’s impressive record of recruiting international PGR students.
1312
2. InTeRnaTIonal PGR enRolmenT tRends
International postgraduate teaching student enrolments
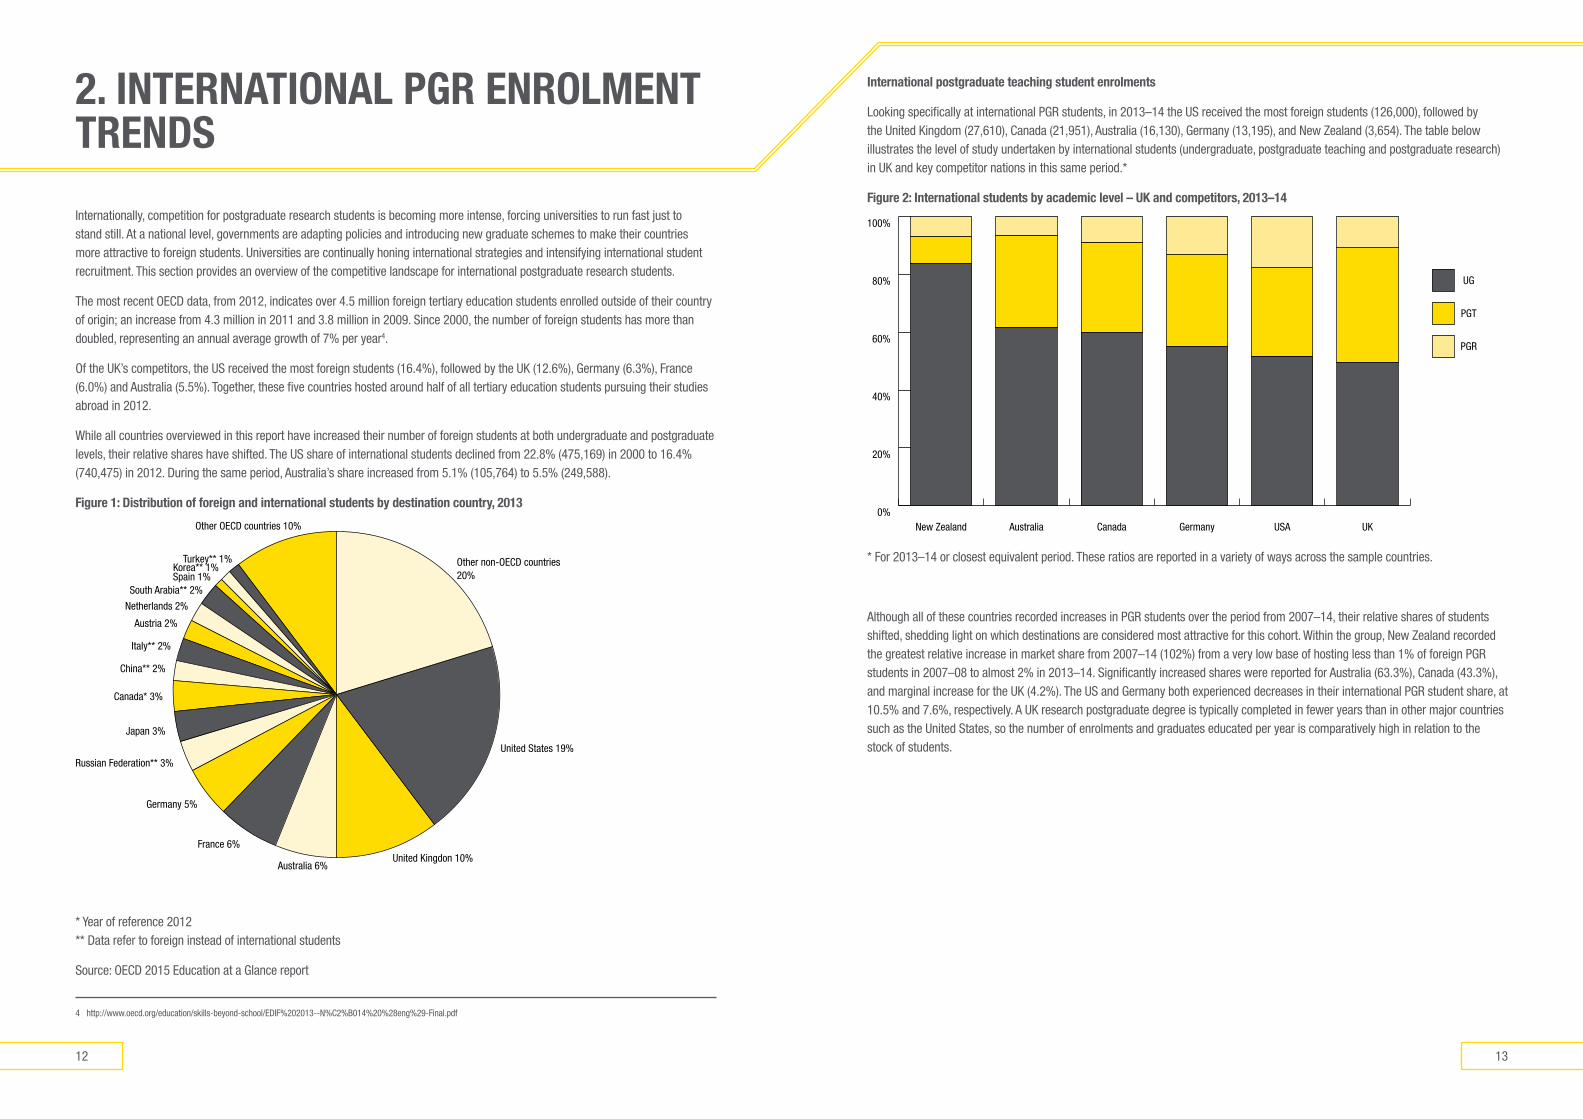
Looking specifically at international PGR students, in 2013–14 the US received the most foreign students (126,000), followed by the United Kingdom (27,610), Canada (21,951), Australia (16,130), Germany (13,195), and New Zealand (3,654). The table below illustrates the level of study undertaken by international students (undergraduate, postgraduate teaching and postgraduate research) in UK and key competitor nations in this same period.*
Figure 2: International students by academic level – UK and competitors, 2013–14
0%
20%
40%
60%
80%
100%
UKUSAGermanyCanadaAustraliaNew Zealand
UG
PGT
PGR
* For 2013–14 or closest equivalent period. These ratios are reported in a variety of ways across the sample countries.
Although all of these countries recorded increases in PGR students over the period from 2007–14, their relative shares of students shifted, shedding light on which destinations are considered most attractive for this cohort. Within the group, New Zealand recorded the greatest relative increase in market share from 2007–14 (102%) from a very low base of hosting less than 1% of foreign PGR students in 2007–08 to almost 2% in 2013–14. Significantly increased shares were reported for Australia (63.3%), Canada (43.3%), and marginal increase for the UK (4.2%). The US and Germany both experienced decreases in their international PGR student share, at 10.5% and 7.6%, respectively. A UK research postgraduate degree is typically completed in fewer years than in other major countries such as the United States, so the number of enrolments and graduates educated per year is comparatively high in relation to the stock of students.
Internationally, competition for postgraduate research students is becoming more intense, forcing universities to run fast just to stand still. At a national level, governments are adapting policies and introducing new graduate schemes to make their countries more attractive to foreign students. Universities are continually honing international strategies and intensifying international student recruitment. This section provides an overview of the competitive landscape for international postgraduate research students.
The most recent OECD data, from 2012, indicates over 4.5 million foreign tertiary education students enrolled outside of their country of origin; an increase from 4.3 million in 2011 and 3.8 million in 2009. Since 2000, the number of foreign students has more than doubled, representing an annual average growth of 7% per year4.
Of the UK’s competitors, the US received the most foreign students (16.4%), followed by the UK (12.6%), Germany (6.3%), France (6.0%) and Australia (5.5%). Together, these five countries hosted around half of all tertiary education students pursuing their studies abroad in 2012.
While all countries overviewed in this report have increased their number of foreign students at both undergraduate and postgraduate levels, their relative shares have shifted. The US share of international students declined from 22.8% (475,169) in 2000 to 16.4% (740,475) in 2012. During the same period, Australia’s share increased from 5.1% (105,764) to 5.5% (249,588).
Figure 1: distribution of foreign and international students by destination country, 2013
Other non-OECD countries20%
United States 19%
United Kingdon 10%Australia 6%
France 6%
Germany 5%
Russian Federation** 3%
Japan 3%
Canada* 3%
China** 2%
Italy** 2%
Austria 2%
Netherlands 2%
South Arabia** 2%Spain 1%Korea** 1%
Turkey** 1%
Other OECD countries 10%
* Year of reference 2012 ** Data refer to foreign instead of international students
Source: OECD 2015 Education at a Glance report
4 http://www.oecd.org/education/skills-beyond-school/EDIF%202013--N%C2%B014%20%28eng%29-Final.pdf
1514
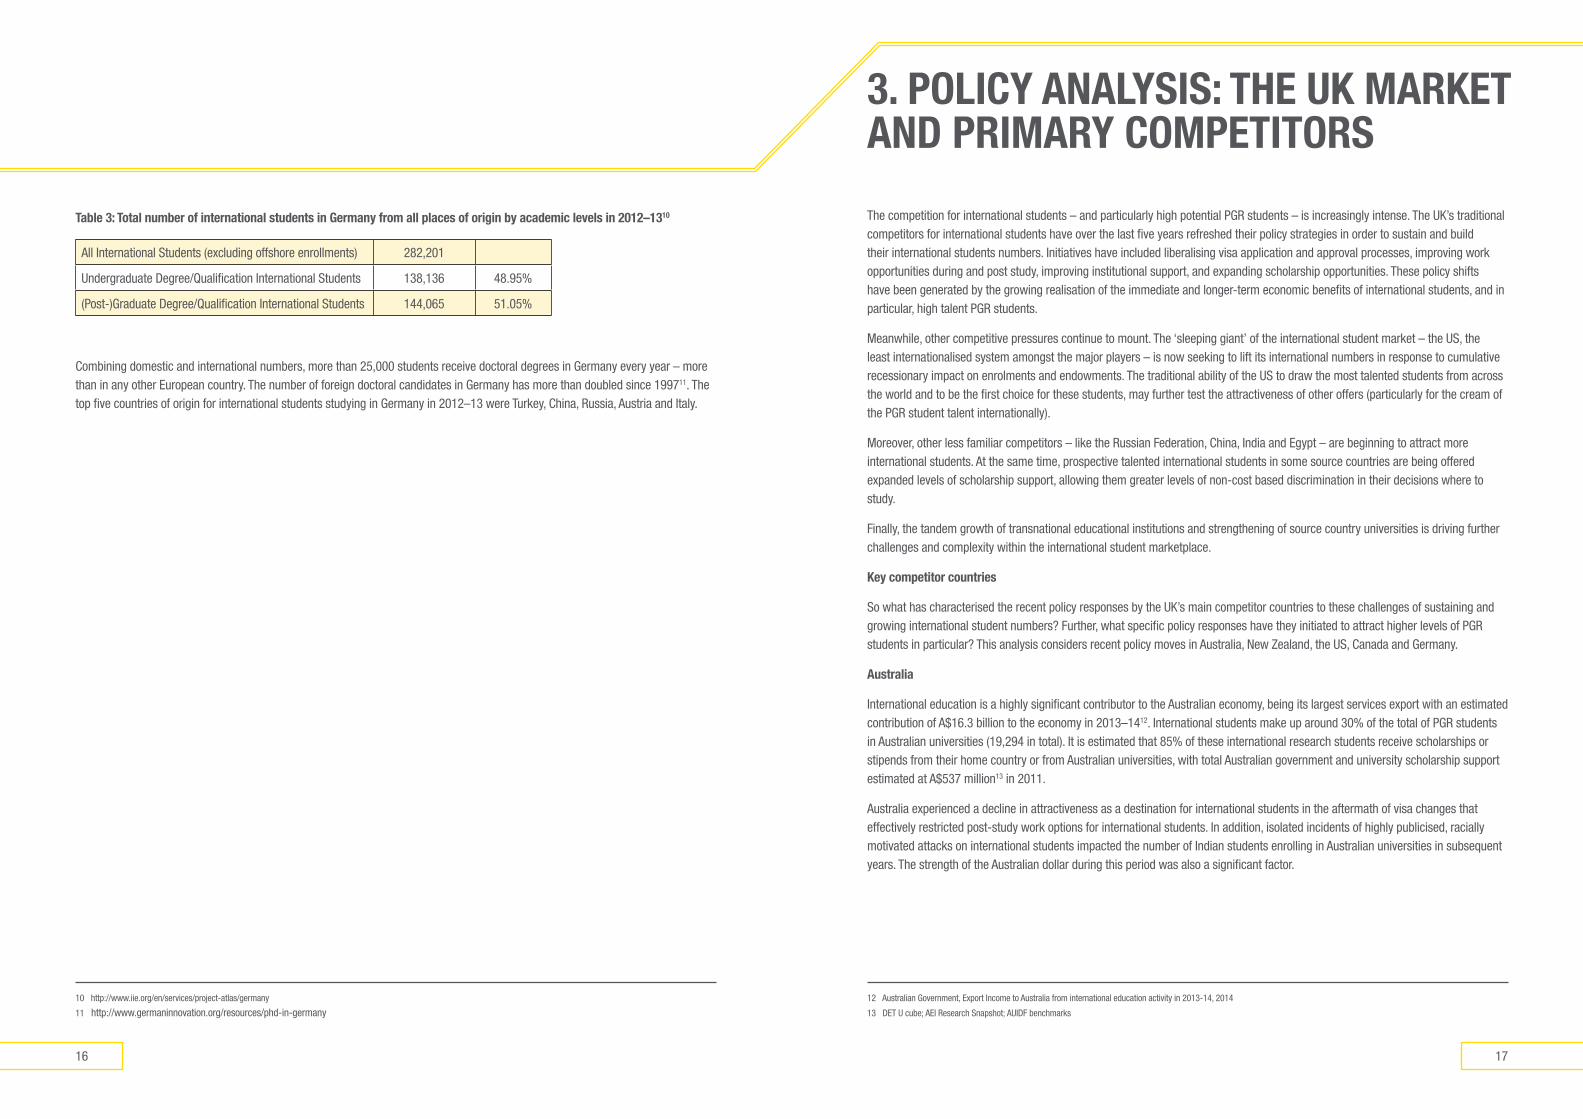
Since 2006, doctoral study by international students in new Zealand has been funded on the same basis as for domestic doctoral students, which substantially lowered the cost of studying there. This led to a gradual but sustained increase in international PGR students (unlike the greater fluctuations experienced in international students in bachelor level programmes). In 2014, New Zealand universities enrolled overall 53,000 international students (up from 48,000 in 2013). Around 11,000 were postgraduate students, with some 4,000 of these being international students enrolled in a PhD (both double their levels a decade before)6.
While undergraduate programmes account for the bulk of international student growth in the United states, postgraduate enrolments have also increased in recent years. The number of international students enrolled in graduate programmes in the US increased 12% from 2012–13 to 2013–14 (311,200 to 329,900), running alongside an 8% increase in the number new enrolments in the US during that same period (100,100 to 108,500).
Table 2: new international student enrolments in Us, 2004–05 to 2013–14 7
New International Student Enrollment, 2004/05-2013/14
2004/05 2005/06 2006/07 2007/08 2008/09 2009/10 2010/11 2011/12 2012/13 2013/14% change from 12/13
Undergraduate 59,943 61,342 63,749 68,195 82,136 79,365 84,543 90,903 102,069 109,486 7.3
Graduate 61,350 64,235 72,726 78,489 84,828 84,613 89,505 92,211 100,129 108,519 8.4
Non-Degree 10,653 17,346 20,703 26,437 33,496 38,992 40,442 45,353 48,722 52,123 7.0
Total 131,946 142,923 157,178 200,460 202,970 214,490 228,467 250,920 270,128 7.7
As has been the case in recent years, the top three countries of origin – China, India and South Korea – together account for roughly 50% of all international enrolments in the US. Saudi Arabia, the fourth-ranked source, accounts for 6% of enrolments. Apart from these top four countries, the remaining top 25 sending countries contribute 5,000 students or more, though none of them account for more than 5% of international enrolments in the US.
In Canada, international students comprise approximately 8% of all tertiary enrolments, with 8% studying at undergraduate level, 16% at graduate level, and 26% at doctoral level. Of the nearly 300,000 foreign students currently studying in Canada, 83% are located in Ontario, British Columbia or Québec8.
While international students enrolled in Canada in 2013 came from 194 countries, the top five source countries – China, India, South Korea, Saudi Arabia and France – accounted for more than half of all foreign student enrolments, and the top 10 sending countries accounted for 71% of all foreign student enrolments. More than one-third of foreign students in Canada in 2013 came from China9.
The composition of Canada’s international enrolments has shifted in recent years, including increases from 2012–13 from Nigeria (+29%), Russia, (+24%), Brazil (+17%), and Vietnam (+16%). More established markets also registered steady gains for the year, including China with 18% growth from 2012–13, and France (+16%). At a regional level, South Asia has shown the strongest growth, with foreign student enrolments in Canada increasing 181% from 2009–13. India was the largest source of growth in this region, up from 9,561 students in 2009 to 31,665 students in 2013.
In Germany, there are more than 280,000 international students, 13,200 of which are studying at doctoral level.
6 http://www.educationcounts.govt.nz/__data/assets/pdf_file/0006/164364/Profile-and-Trends-2014-NZs-Annual-Tertiary-Education-Enrolments-Part-1.pdf
7 Institute of International Education. (2014). ‘New International Student Enrollment, 2005/06-2013/14’. Open Doors Report on International Educational Exchange. Retrieved from http://www.iie.org/opendoors
8 http://www.cbie.ca/about-ie/facts-and-figures/
9 http://monitor.icef.com/2014/11/record-high-international-enrolment-canada-2013-many-students-plan-stay/
Table 1: numbers of international PGR students 2007–14 (and change in comparative share)
International UG students
2007–08 2008–09 2009–10 2010–11 2011–12 2012–13 2013–14Change since 2007
% Change since 2007
market share
2007-08
market share
2013-14
Change in
market share (% points)
% change in market
share
UK 22,300 23,355 23,945 24,385 25,630 26,145 27,610 5,310 24% 12.70% 13.20% 0.50% 4.20%
Australia 8,313 9,382 10,920 12,487 14,482 15,832 16,130 7,817 94% 4.70% 7.70% 3.00% 63.30%
New Zealand 1,523 1,960 2,405 2,796 3,137 3,354 3,654 2,131 140% 0.90% 1.80% 0.90% 102.00%
US 118,500 118,270 127,000 130,000 129,500 130,000 126,000 7,500 6% 67.50% 60.40% -7.10% -10.50%
Canada 12,899 13,261 14,692 16,228 17,916 19,864 21,951 9,052 70% 7.30% 10.50% 3.20% 43.30%
Germany 12,025 11,570 11,700 11,765 11,960 12,545 13,195 1,170 10% 6.80% 6.30% -0.50% -7.60%
Total 175,560 177,798 190,662 197,661 202,625 207,740 208,540 32,980 19%
Explanatory notes for this table
1. UK enrolment data directly from http://www.hefce.ac.uk/analysis/postgraduate/lterm/ (Non-EU Enrolment Data Set)
2. Australian data directly from http://highereducationstatistics.education.gov.au (Enrolment Data Set)
3. New Zealand data estimated based on postgraduate enrolments by Education Counts NZ https://www.educationcounts.govt.nz/statistics/international-education/international-students-in-new-zealand
4. Canadian data based on modelled estimates using Immigration and OECD data
5. US data based on modelled estimates, as no specific US data is available to separate postgraduate student numbers into teaching and research. Estimates based on IIE Open Doors data- http://www.iie.org/en/Research-and-Publications/Open-Doors/Data/International-Students/Academic-Level/2012-14
6. German data derived from DAAD data http://www.wissenschaftweltoffen.de/kompakt/wwo2015_kompakt_en.pdf
7. Change in the share of foreign PGR students within this group of six countries, not including other countries’ share of foreign PGR students.
To provide a greater level of clarity around this data, it is useful to look more specifically at overall and PGR student enrolments in these individual competitor countries.
In australia, there were 151,701 overall international enrolments in higher education in 2015; an increase of 5% since 2012. In terms of source countries, China was the top nationality (making up 36.1% of all international higher education enrolments), followed by India, Malaysia and Vietnam. PGR students accounted for 3% of all these enrolments.
The number of international PGR students in Australia nearly doubled during the period 2007–14, up from 8,300 to 16,100. In 2013, 30% of all PGR students in Australian universities were international students, and more than half of these were enrolled in STEM-related courses5.
5 Draft National Strategy for International Education (2015) Australian Government. Available at https://internationaleducation.gov.au/International-network/Australia/InternationalStrategy/Documents/Draft%20National%20Strategy%20for%20International%20Education.pdf
1716
The competition for international students – and particularly high potential PGR students – is increasingly intense. The UK’s traditional competitors for international students have over the last five years refreshed their policy strategies in order to sustain and build their international students numbers. Initiatives have included liberalising visa application and approval processes, improving work opportunities during and post study, improving institutional support, and expanding scholarship opportunities. These policy shifts have been generated by the growing realisation of the immediate and longer-term economic benefits of international students, and in particular, high talent PGR students.
Meanwhile, other competitive pressures continue to mount. The ‘sleeping giant’ of the international student market – the US, the least internationalised system amongst the major players – is now seeking to lift its international numbers in response to cumulative recessionary impact on enrolments and endowments. The traditional ability of the US to draw the most talented students from across the world and to be the first choice for these students, may further test the attractiveness of other offers (particularly for the cream of the PGR student talent internationally).
Moreover, other less familiar competitors – like the Russian Federation, China, India and Egypt – are beginning to attract more international students. At the same time, prospective talented international students in some source countries are being offered expanded levels of scholarship support, allowing them greater levels of non-cost based discrimination in their decisions where to study.
Finally, the tandem growth of transnational educational institutions and strengthening of source country universities is driving further challenges and complexity within the international student marketplace.
Key competitor countries
So what has characterised the recent policy responses by the UK’s main competitor countries to these challenges of sustaining and growing international student numbers? Further, what specific policy responses have they initiated to attract higher levels of PGR students in particular? This analysis considers recent policy moves in Australia, New Zealand, the US, Canada and Germany.
australia
International education is a highly significant contributor to the Australian economy, being its largest services export with an estimated contribution of A$16.3 billion to the economy in 2013–1412. International students make up around 30% of the total of PGR students in Australian universities (19,294 in total). It is estimated that 85% of these international research students receive scholarships or stipends from their home country or from Australian universities, with total Australian government and university scholarship support estimated at A$537 million13 in 2011.
Australia experienced a decline in attractiveness as a destination for international students in the aftermath of visa changes that effectively restricted post-study work options for international students. In addition, isolated incidents of highly publicised, racially motivated attacks on international students impacted the number of Indian students enrolling in Australian universities in subsequent years. The strength of the Australian dollar during this period was also a significant factor.
12 Australian Government, Export Income to Australia from international education activity in 2013-14, 2014
13 DET U cube; AEI Research Snapshot; AUIDF benchmarks
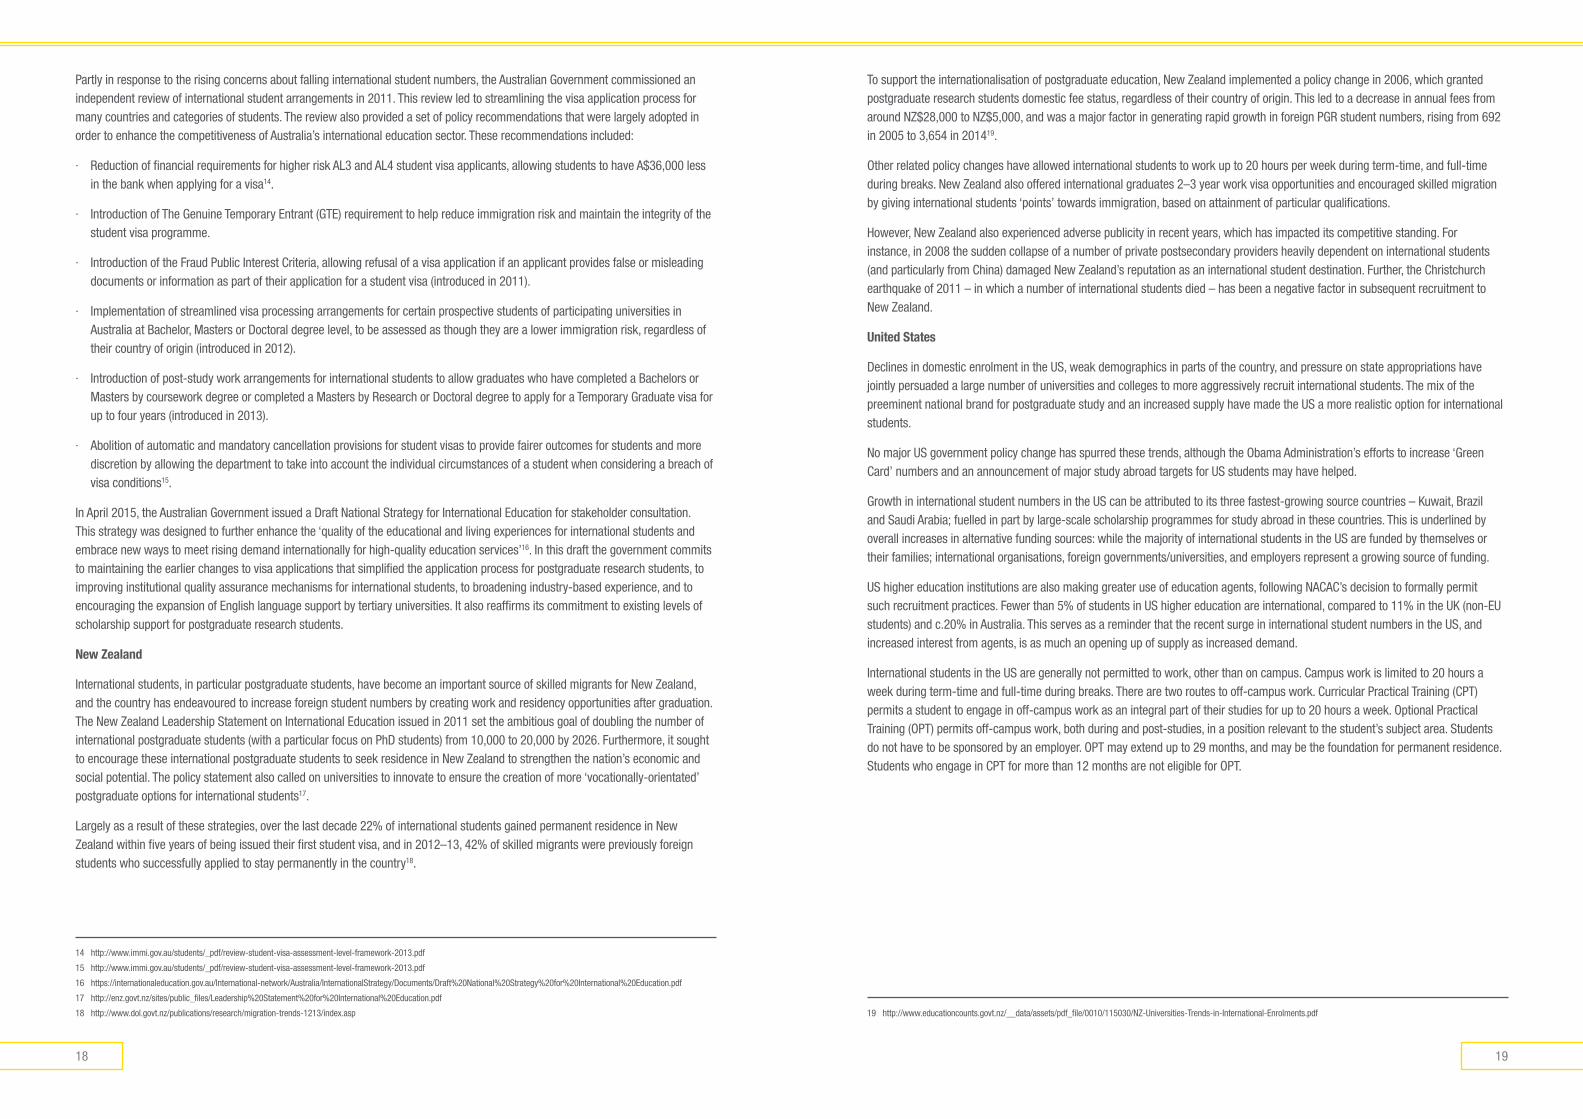
Table 3: Total number of international students in Germany from all places of origin by academic levels in 2012–1310
All International Students (excluding offshore enrollments) 282,201
Undergraduate Degree/Qualification International Students 138,136 48.95%
(Post-)Graduate Degree/Qualification International Students 144,065 51.05%
Combining domestic and international numbers, more than 25,000 students receive doctoral degrees in Germany every year – more than in any other European country. The number of foreign doctoral candidates in Germany has more than doubled since 199711. The top five countries of origin for international students studying in Germany in 2012–13 were Turkey, China, Russia, Austria and Italy.
10 http://www.iie.org/en/services/project-atlas/germany
11 http://www.germaninnovation.org/resources/phd-in-germany
3. PolICy analysIs: The UK maRKeT and PRImaRy ComPeTIToRs
1918
To support the internationalisation of postgraduate education, New Zealand implemented a policy change in 2006, which granted postgraduate research students domestic fee status, regardless of their country of origin. This led to a decrease in annual fees from around NZ$28,000 to NZ$5,000, and was a major factor in generating rapid growth in foreign PGR student numbers, rising from 692 in 2005 to 3,654 in 201419.
Other related policy changes have allowed international students to work up to 20 hours per week during term-time, and full-time during breaks. New Zealand also offered international graduates 2–3 year work visa opportunities and encouraged skilled migration by giving international students ‘points’ towards immigration, based on attainment of particular qualifications.
However, New Zealand also experienced adverse publicity in recent years, which has impacted its competitive standing. For instance, in 2008 the sudden collapse of a number of private postsecondary providers heavily dependent on international students (and particularly from China) damaged New Zealand’s reputation as an international student destination. Further, the Christchurch earthquake of 2011 – in which a number of international students died – has been a negative factor in subsequent recruitment to New Zealand.
United states
Declines in domestic enrolment in the US, weak demographics in parts of the country, and pressure on state appropriations have jointly persuaded a large number of universities and colleges to more aggressively recruit international students. The mix of the preeminent national brand for postgraduate study and an increased supply have made the US a more realistic option for international students.
No major US government policy change has spurred these trends, although the Obama Administration’s efforts to increase ‘Green Card’ numbers and an announcement of major study abroad targets for US students may have helped.
Growth in international student numbers in the US can be attributed to its three fastest-growing source countries – Kuwait, Brazil and Saudi Arabia; fuelled in part by large-scale scholarship programmes for study abroad in these countries. This is underlined by overall increases in alternative funding sources: while the majority of international students in the US are funded by themselves or their families; international organisations, foreign governments/universities, and employers represent a growing source of funding.
US higher education institutions are also making greater use of education agents, following NACAC’s decision to formally permit such recruitment practices. Fewer than 5% of students in US higher education are international, compared to 11% in the UK (non-EU students) and c.20% in Australia. This serves as a reminder that the recent surge in international student numbers in the US, and increased interest from agents, is as much an opening up of supply as increased demand.
International students in the US are generally not permitted to work, other than on campus. Campus work is limited to 20 hours a week during term-time and full-time during breaks. There are two routes to off-campus work. Curricular Practical Training (CPT) permits a student to engage in off-campus work as an integral part of their studies for up to 20 hours a week. Optional Practical Training (OPT) permits off-campus work, both during and post-studies, in a position relevant to the student’s subject area. Students do not have to be sponsored by an employer. OPT may extend up to 29 months, and may be the foundation for permanent residence. Students who engage in CPT for more than 12 months are not eligible for OPT.
19 http://www.educationcounts.govt.nz/__data/assets/pdf_file/0010/115030/NZ-Universities-Trends-in-International-Enrolments.pdf
Partly in response to the rising concerns about falling international student numbers, the Australian Government commissioned an independent review of international student arrangements in 2011. This review led to streamlining the visa application process for many countries and categories of students. The review also provided a set of policy recommendations that were largely adopted in order to enhance the competitiveness of Australia’s international education sector. These recommendations included:
· Reduction of financial requirements for higher risk AL3 and AL4 student visa applicants, allowing students to have A$36,000 less in the bank when applying for a visa14.
· Introduction of The Genuine Temporary Entrant (GTE) requirement to help reduce immigration risk and maintain the integrity of the student visa programme.
· Introduction of the Fraud Public Interest Criteria, allowing refusal of a visa application if an applicant provides false or misleading documents or information as part of their application for a student visa (introduced in 2011).
· Implementation of streamlined visa processing arrangements for certain prospective students of participating universities in Australia at Bachelor, Masters or Doctoral degree level, to be assessed as though they are a lower immigration risk, regardless of their country of origin (introduced in 2012).
· Introduction of post-study work arrangements for international students to allow graduates who have completed a Bachelors or Masters by coursework degree or completed a Masters by Research or Doctoral degree to apply for a Temporary Graduate visa for up to four years (introduced in 2013).
· Abolition of automatic and mandatory cancellation provisions for student visas to provide fairer outcomes for students and more discretion by allowing the department to take into account the individual circumstances of a student when considering a breach of visa conditions15.
In April 2015, the Australian Government issued a Draft National Strategy for International Education for stakeholder consultation. This strategy was designed to further enhance the ‘quality of the educational and living experiences for international students and embrace new ways to meet rising demand internationally for high-quality education services’16. In this draft the government commits to maintaining the earlier changes to visa applications that simplified the application process for postgraduate research students, to improving institutional quality assurance mechanisms for international students, to broadening industry-based experience, and to encouraging the expansion of English language support by tertiary universities. It also reaffirms its commitment to existing levels of scholarship support for postgraduate research students.
new Zealand
International students, in particular postgraduate students, have become an important source of skilled migrants for New Zealand, and the country has endeavoured to increase foreign student numbers by creating work and residency opportunities after graduation. The New Zealand Leadership Statement on International Education issued in 2011 set the ambitious goal of doubling the number of international postgraduate students (with a particular focus on PhD students) from 10,000 to 20,000 by 2026. Furthermore, it sought to encourage these international postgraduate students to seek residence in New Zealand to strengthen the nation’s economic and social potential. The policy statement also called on universities to innovate to ensure the creation of more ‘vocationally-orientated’ postgraduate options for international students17.
Largely as a result of these strategies, over the last decade 22% of international students gained permanent residence in New Zealand within five years of being issued their first student visa, and in 2012–13, 42% of skilled migrants were previously foreign students who successfully applied to stay permanently in the country18.
14 http://www.immi.gov.au/students/_pdf/review-student-visa-assessment-level-framework-2013.pdf
15 http://www.immi.gov.au/students/_pdf/review-student-visa-assessment-level-framework-2013.pdf
16 https://internationaleducation.gov.au/International-network/Australia/InternationalStrategy/Documents/Draft%20National%20Strategy%20for%20International%20Education.pdf
17 http://enz.govt.nz/sites/public_files/Leadership%20Statement%20for%20International%20Education.pdf
18 http://www.dol.govt.nz/publications/research/migration-trends-1213/index.asp
2120
Germany
In recent years, the German government has sought to improve the performance and competiveness of research and instruction through a variety of initiatives and programmes designed to attract more international students to its institutes of higher education. A series of programmes has been introduced to significantly lower the cost of study (including postgraduate research). In addition, a funded consortium was established to strengthen international research marketing. Since 2010, the consortium has designed a number of strategies to increase the international visibility of research opportunities in Germany, including German research universities and research funding programmes25.
In addition, a range of regionally focused activities was instituted to raise awareness of innovation in Germany in target markets, for example, South Korea (2006–07), India (2008–10) and Russia (2012–14)26. An Internet portal (www.research-in-germany.de) was developed to present information in English about research activities in Germany and is edited by the German Academic Exchange Service (DAAD). In 2011, the government introduced the Germany Scholarship for high achieving students. Recipients receive €300 per month; half supplied by private sponsors and half by the Federal Government. In the first year, around 10,000 students received this joint funding, with the objective of providing funding to up to 8% of all students at German universities (about 160,000)27 in the medium term.
25 http://www.bmbf.de/en/12159.php
26 http://www.bmbf.de/en/12159.php
27 http://www.bmbf.de/en/14332.php
Canada
As education is a provincial and territorial jurisdiction in Canada, there is no national education ministry. However, international education is an increasingly important priority for all provinces and has become a strategic part of public policy to achieve Canada’s diplomacy, trade and immigration objectives.
In January 2014, the federal government unveiled Canada’s first International Education Strategy (IES)20, outlining a pan-Canadian strategy to spur consensus across governments, organisations and universities. The IES sets out to double Canada’s international student population (from the 2011 level of 239,000 to 450,000 by 2022), primarily by focusing on priority education markets – Brazil, China, India, Mexico, North Africa and the Middle East and Vietnam – and reinforcing established markets. In addition, the strategy seeks to more effectively brand Canadian education to maximize success, to strengthen institutional research partnerships and educational exchanges, and leverage people-to-people ties.21
In 2006, the government created the Off Campus Work Permit, which allowed international students to apply for a permit to work off campus for up to 20 hours per week. Since 2006, the number of students holding a work permit has tripled, reaching 70,200 in 2012. In 2012, 7,797 international students from across Canada transitioned to permanent residency. While most international students still transition to PR through the Federal Skilled Worker Program, other options such as the Provincial Nominee Program and the Canadian Experience Class (launched in 2008) are increasingly used.
Regulatory changes in 2014 placed limitations on study permits to students attending universities designated by provinces and territories; the goal being to assure accountability within the international student programmes in Canada. Within this framework, foreign nationals at non-designated universities can still study on a visitor permit for up to six months, but they would not be eligible for Work Permit programs designed for international students (e.g. Co-op/Internship Work Permit Program, Off-Campus Work Permit Program, Post-Graduation Work Permit Program)22. In addition, the Off Campus Work Permit was integrated with the Study Permit in 2014, eliminating the need to apply for both separately. This allows graduates to gain the Canadian work experience needed to transition to permanent residence23.
Nationally, tuition fees in Canada have been rising: university fees for international students are now approximately twice those of Canadian students. The only provinces not to experience an increase were Newfoundland and Labrador, where a tuition fees freeze included international students. In the other provinces, fee increases for international undergraduate students ranged from 2.1% in Prince Edward Island to 6.9% in Ontario. For international graduate students, increases ranged from 1.0% in Alberta to 7.7% in Saskatchewan.
However, more recently, the provincial government in Ontario (who receive nearly half of Canada’s international graduate students) has agreed to release funding intended for domestic graduate students to allow universities to recruit more high talent international PGR students, thereby reducing their cost of study. This is with the clear intent of increasing the attractiveness of Ontario as a study destination, particularly for international PhD candidates24.
20 http://www.cbie-bcei.ca/news/one-year-later-progress-on-canadas-international-education-strategy/
21 http://monitor.icef.com/2014/11/record-high-international-enrolment-canada-2013-many-students-plan-stay/
22 http://www.amssa.org/files/AMSSA%20Info%20Sheet%20Issue%2012%20-%20International%20Students%20-%20Statistics%20and%20Trends.pdf
23 http://www.amssa.org/files/AMSSA%20Info%20Sheet%20Issue%2012%20-%20International%20Students%20-%20Statistics%20and%20Trends.pdf
24 http://www.theglobeandmail.com/news/national/international-students-to-receive-additional-funding-from-ontario/article25407883/
2322
The arrival experience
First impressions are vitally important – whether the student feels welcome or not, integrated or isolated, oriented or disorientated. For this reason, the ISB asks all PGR students in the first year of their studies 17 common questions about their arrival experience. In 2014–15, 3,511 PGR students answered questions in the arrival section.
The table below reflects a broadly positive picture, with at least three out of four students satisfied with the area of lowest comparative satisfaction, making friends from the UK. However, most participating universities will want to understand why one in four students are dissatisfied. Clearly the PGR experience can be a relatively solitary one. Yet for international students who have chosen the UK as their study destination, their legitimate hope and expectation would be that they make friends with students from the host country.
The areas where satisfaction is highest are reassuring: meeting supervisor/academic staff (95%), academic registration (90%), and dealing with the all-important finance office (90%).
Areas of comparative concern are dealing with the accommodation office (80%), the condition of accommodation, and the practical concern of opening a bank account in the UK.
Having stressed the importance of the welcome students receive, it is worth noting that only 76% of PGR students actually felt satisfied with that welcome. The truncated term ‘welcome’ refers specifically to the ‘meet and greet’ at the airport or rail station. As research students are unlikely to all arrive together, this can be more of a challenge than the welcome provided for students arriving for other levels of study.
Table 4: IsB survey data on the international PGR arrival experience in the UK, 2014
arrival experience
UK 2014
Accommodation Office 80%
Accommodation Condition 78%
Bank account 77%
Internet access 85%
Finance Office 90%
First night 83%
Formal welcome 88%
Home friends 88%
Host friends 75%
Local Orientation 86%
Meeting staff 95%
Other friends 89%
Registration 90%
Social activities 87%
Study sense 86%
University Orientation 88%
Welcome 76%
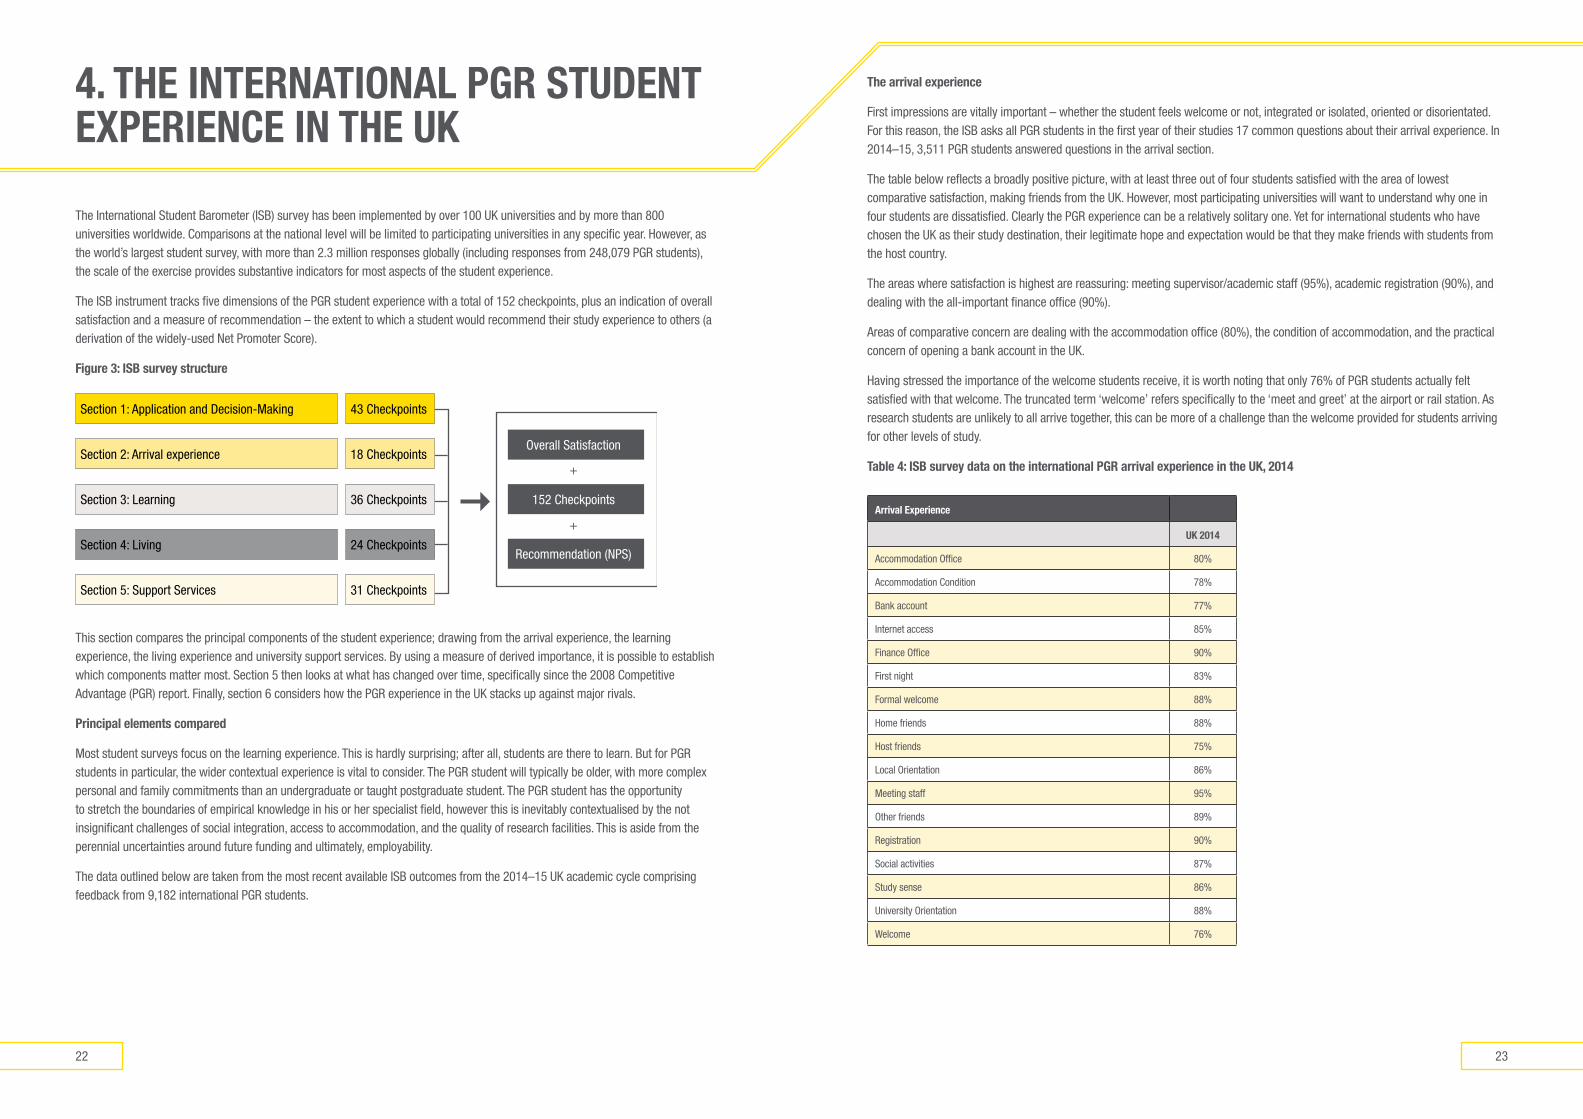
The International Student Barometer (ISB) survey has been implemented by over 100 UK universities and by more than 800 universities worldwide. Comparisons at the national level will be limited to participating universities in any specific year. However, as the world’s largest student survey, with more than 2.3 million responses globally (including responses from 248,079 PGR students), the scale of the exercise provides substantive indicators for most aspects of the student experience.
The ISB instrument tracks five dimensions of the PGR student experience with a total of 152 checkpoints, plus an indication of overall satisfaction and a measure of recommendation – the extent to which a student would recommend their study experience to others (a derivation of the widely-used Net Promoter Score).
Figure 3: IsB survey structure
Section 1: Application and Decision-Making 43 Checkpoints
Section 2: Arrival experience 18 Checkpoints
Section 3: Learning 36 Checkpoints
Section 4: Living 24 Checkpoints
Overall Satisfaction
+
+
152 Checkpoints
Recommendation (NPS)
Section 5: Support Services 31 Checkpoints
This section compares the principal components of the student experience; drawing from the arrival experience, the learning experience, the living experience and university support services. By using a measure of derived importance, it is possible to establish which components matter most. Section 5 then looks at what has changed over time, specifically since the 2008 Competitive Advantage (PGR) report. Finally, section 6 considers how the PGR experience in the UK stacks up against major rivals.
Principal elements compared
Most student surveys focus on the learning experience. This is hardly surprising; after all, students are there to learn. But for PGR students in particular, the wider contextual experience is vital to consider. The PGR student will typically be older, with more complex personal and family commitments than an undergraduate or taught postgraduate student. The PGR student has the opportunity to stretch the boundaries of empirical knowledge in his or her specialist field, however this is inevitably contextualised by the not insignificant challenges of social integration, access to accommodation, and the quality of research facilities. This is aside from the perennial uncertainties around future funding and ultimately, employability.
The data outlined below are taken from the most recent available ISB outcomes from the 2014–15 UK academic cycle comprising feedback from 9,182 international PGR students.
4. The InTeRnaTIonal PGR sTUdenT exPeRIenCe In The UK
2524
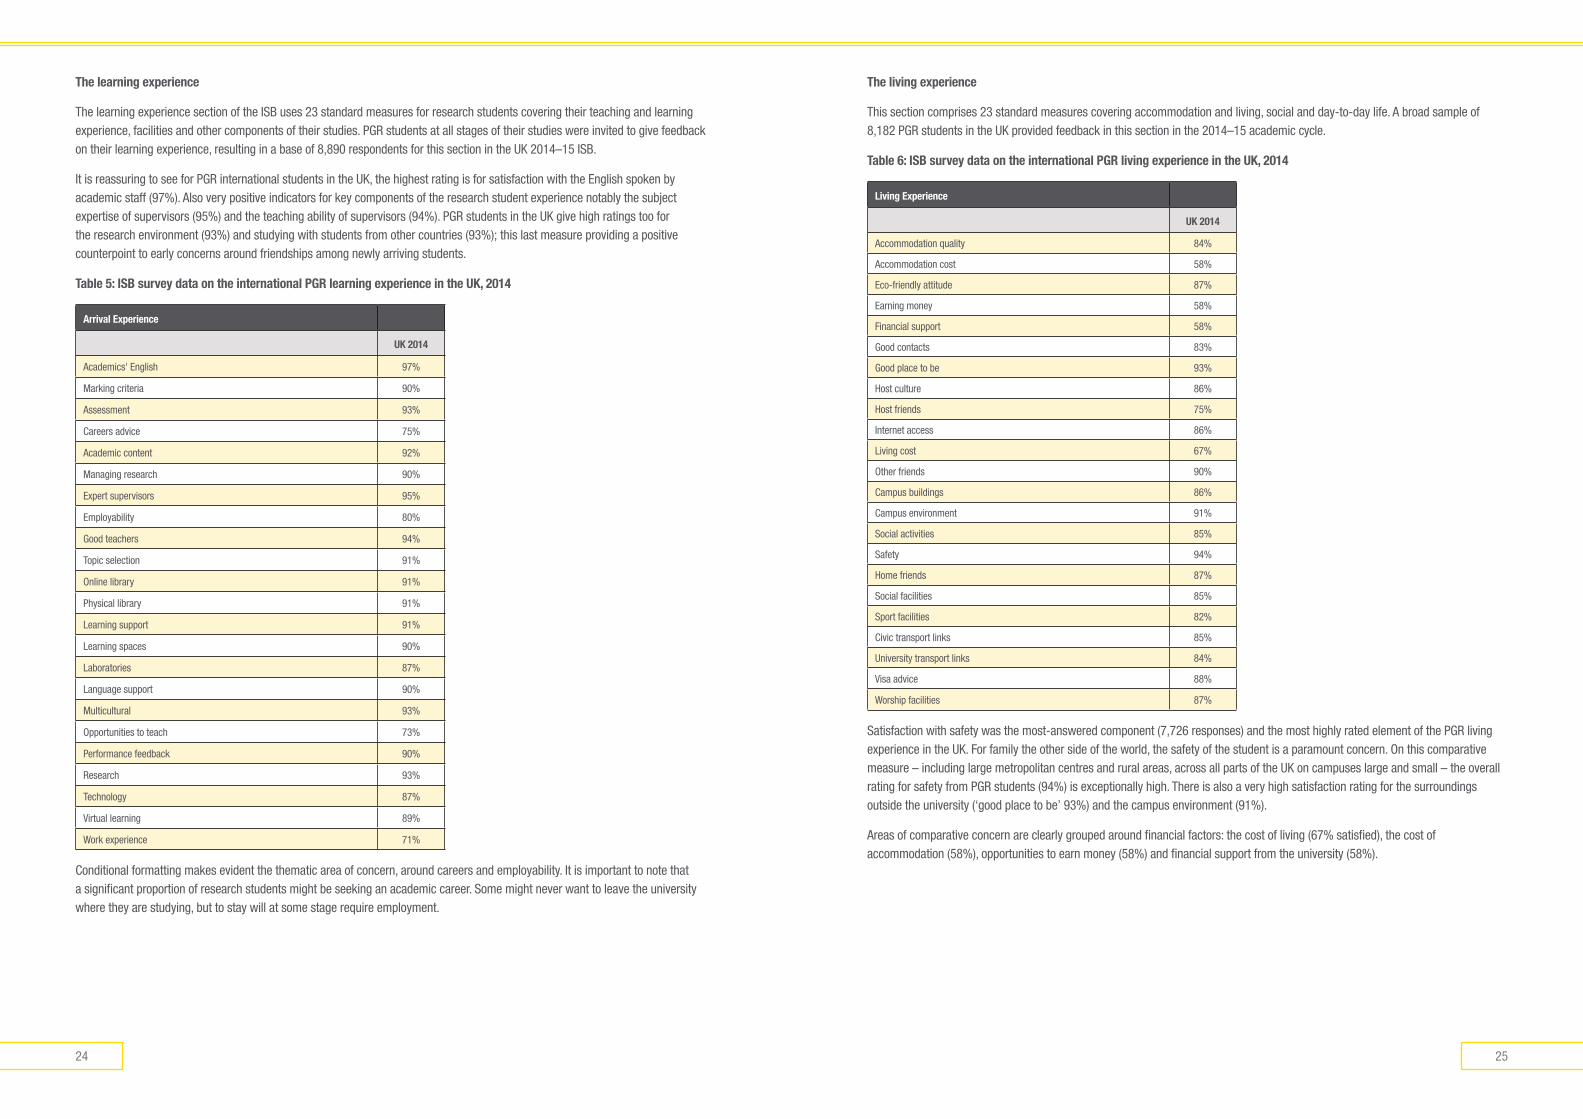
The living experience
This section comprises 23 standard measures covering accommodation and living, social and day-to-day life. A broad sample of 8,182 PGR students in the UK provided feedback in this section in the 2014–15 academic cycle.
Table 6: IsB survey data on the international PGR living experience in the UK, 2014
living experience
UK 2014
Accommodation quality 84%
Accommodation cost 58%
Eco-friendly attitude 87%
Earning money 58%
Financial support 58%
Good contacts 83%
Good place to be 93%
Host culture 86%
Host friends 75%
Internet access 86%
Living cost 67%
Other friends 90%
Campus buildings 86%
Campus environment 91%
Social activities 85%
Safety 94%
Home friends 87%
Social facilities 85%
Sport facilities 82%
Civic transport links 85%
University transport links 84%
Visa advice 88%
Worship facilities 87%
Satisfaction with safety was the most-answered component (7,726 responses) and the most highly rated element of the PGR living experience in the UK. For family the other side of the world, the safety of the student is a paramount concern. On this comparative measure – including large metropolitan centres and rural areas, across all parts of the UK on campuses large and small – the overall rating for safety from PGR students (94%) is exceptionally high. There is also a very high satisfaction rating for the surroundings outside the university (‘good place to be’ 93%) and the campus environment (91%).
Areas of comparative concern are clearly grouped around financial factors: the cost of living (67% satisfied), the cost of accommodation (58%), opportunities to earn money (58%) and financial support from the university (58%).
The learning experience
The learning experience section of the ISB uses 23 standard measures for research students covering their teaching and learning experience, facilities and other components of their studies. PGR students at all stages of their studies were invited to give feedback on their learning experience, resulting in a base of 8,890 respondents for this section in the UK 2014–15 ISB.
It is reassuring to see for PGR international students in the UK, the highest rating is for satisfaction with the English spoken by academic staff (97%). Also very positive indicators for key components of the research student experience notably the subject expertise of supervisors (95%) and the teaching ability of supervisors (94%). PGR students in the UK give high ratings too for the research environment (93%) and studying with students from other countries (93%); this last measure providing a positive counterpoint to early concerns around friendships among newly arriving students.
Table 5: IsB survey data on the international PGR learning experience in the UK, 2014
arrival experience
UK 2014
Academics' English 97%
Marking criteria 90%
Assessment 93%
Careers advice 75%
Academic content 92%
Managing research 90%
Expert supervisors 95%
Employability 80%
Good teachers 94%
Topic selection 91%
Online library 91%
Physical library 91%
Learning support 91%
Learning spaces 90%
Laboratories 87%
Language support 90%
Multicultural 93%
Opportunities to teach 73%
Performance feedback 90%
Research 93%
Technology 87%
Virtual learning 89%
Work experience 71%
Conditional formatting makes evident the thematic area of concern, around careers and employability. It is important to note that a significant proportion of research students might be seeking an academic career. Some might never want to leave the university where they are studying, but to stay will at some stage require employment.
2726
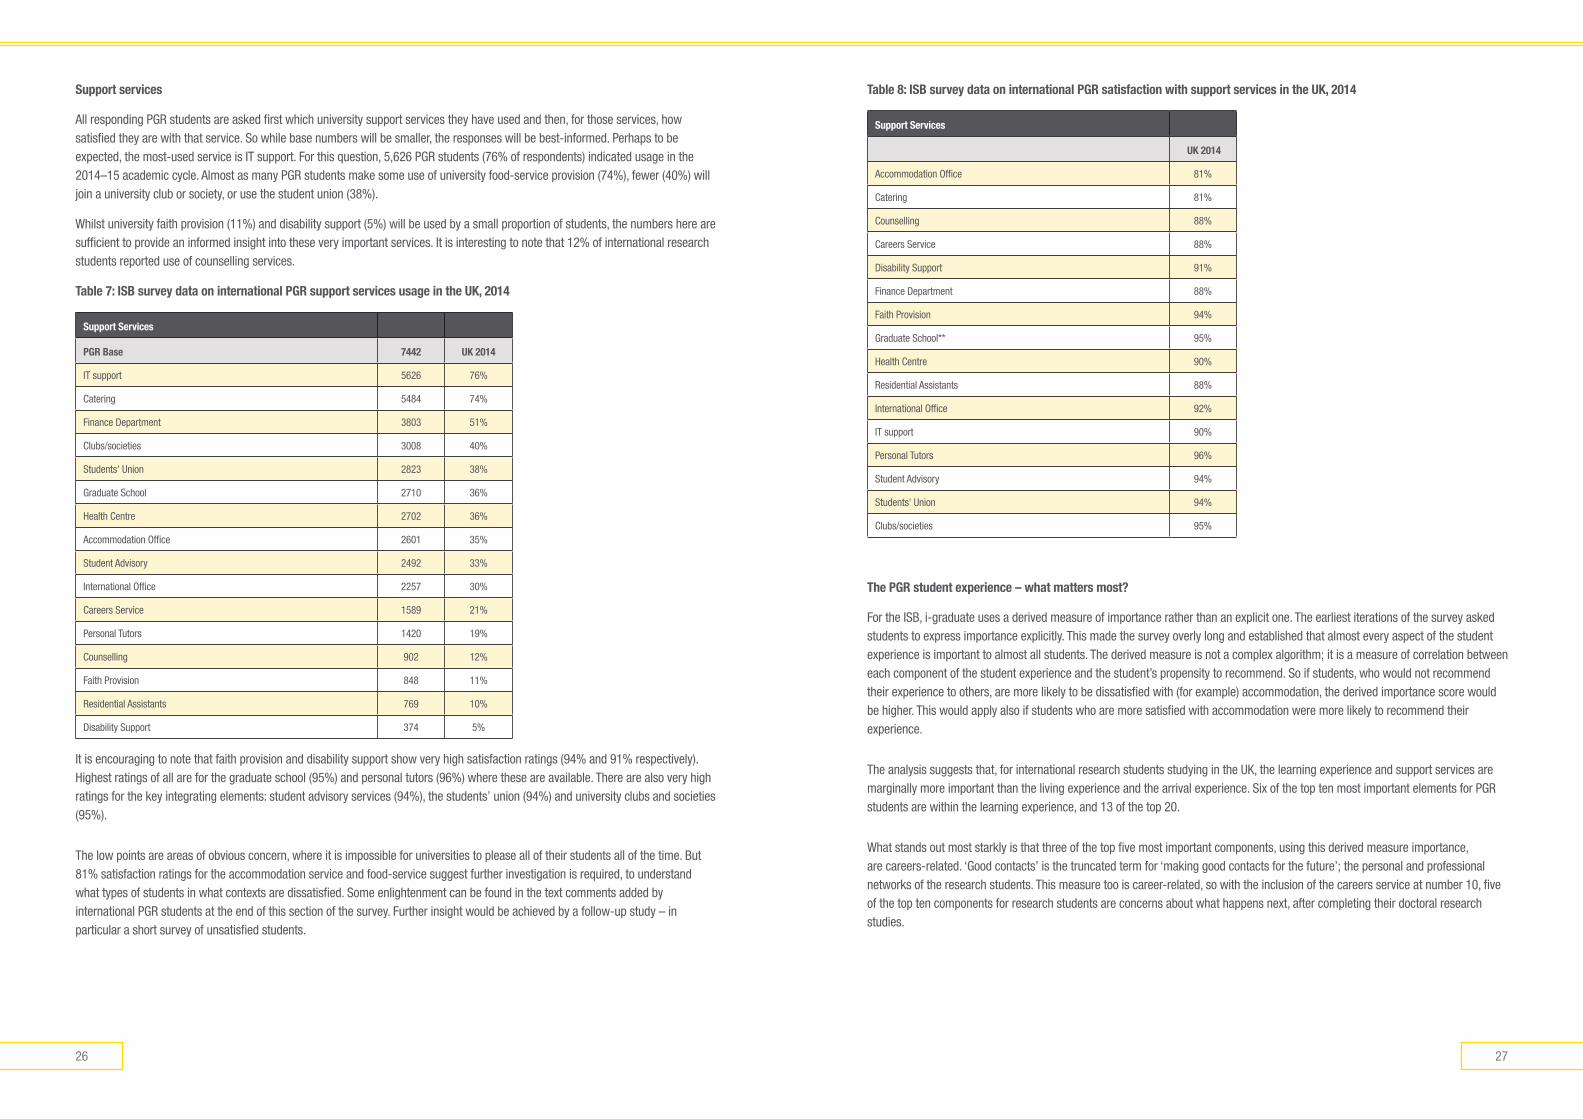
Table 8: IsB survey data on international PGR satisfaction with support services in the UK, 2014
support services
UK 2014
Accommodation Office 81%
Catering 81%
Counselling 88%
Careers Service 88%
Disability Support 91%
Finance Department 88%
Faith Provision 94%
Graduate School** 95%
Health Centre 90%
Residential Assistants 88%
International Office 92%
IT support 90%
Personal Tutors 96%
Student Advisory 94%
Students' Union 94%
Clubs/societies 95%
The PGR student experience – what matters most?
For the ISB, i-graduate uses a derived measure of importance rather than an explicit one. The earliest iterations of the survey asked students to express importance explicitly. This made the survey overly long and established that almost every aspect of the student experience is important to almost all students. The derived measure is not a complex algorithm; it is a measure of correlation between each component of the student experience and the student’s propensity to recommend. So if students, who would not recommend their experience to others, are more likely to be dissatisfied with (for example) accommodation, the derived importance score would be higher. This would apply also if students who are more satisfied with accommodation were more likely to recommend their experience.
The analysis suggests that, for international research students studying in the UK, the learning experience and support services are marginally more important than the living experience and the arrival experience. Six of the top ten most important elements for PGR students are within the learning experience, and 13 of the top 20.
What stands out most starkly is that three of the top five most important components, using this derived measure importance, are careers-related. ‘Good contacts’ is the truncated term for ‘making good contacts for the future’; the personal and professional networks of the research students. This measure too is career-related, so with the inclusion of the careers service at number 10, five of the top ten components for research students are concerns about what happens next, after completing their doctoral research studies.
support services
All responding PGR students are asked first which university support services they have used and then, for those services, how satisfied they are with that service. So while base numbers will be smaller, the responses will be best-informed. Perhaps to be expected, the most-used service is IT support. For this question, 5,626 PGR students (76% of respondents) indicated usage in the 2014–15 academic cycle. Almost as many PGR students make some use of university food-service provision (74%), fewer (40%) will join a university club or society, or use the student union (38%).
Whilst university faith provision (11%) and disability support (5%) will be used by a small proportion of students, the numbers here are sufficient to provide an informed insight into these very important services. It is interesting to note that 12% of international research students reported use of counselling services.
Table 7: IsB survey data on international PGR support services usage in the UK, 2014
support services
PGR Base 7442 UK 2014
IT support 5626 76%
Catering 5484 74%
Finance Department 3803 51%
Clubs/societies 3008 40%
Students' Union 2823 38%
Graduate School 2710 36%
Health Centre 2702 36%
Accommodation Office 2601 35%
Student Advisory 2492 33%
International Office 2257 30%
Careers Service 1589 21%
Personal Tutors 1420 19%
Counselling 902 12%
Faith Provision 848 11%
Residential Assistants 769 10%
Disability Support 374 5%
It is encouraging to note that faith provision and disability support show very high satisfaction ratings (94% and 91% respectively). Highest ratings of all are for the graduate school (95%) and personal tutors (96%) where these are available. There are also very high ratings for the key integrating elements: student advisory services (94%), the students’ union (94%) and university clubs and societies (95%).
The low points are areas of obvious concern, where it is impossible for universities to please all of their students all of the time. But 81% satisfaction ratings for the accommodation service and food-service suggest further investigation is required, to understand what types of students in what contexts are dissatisfied. Some enlightenment can be found in the text comments added by international PGR students at the end of this section of the survey. Further insight would be achieved by a follow-up study – in particular a short survey of unsatisfied students.
2928
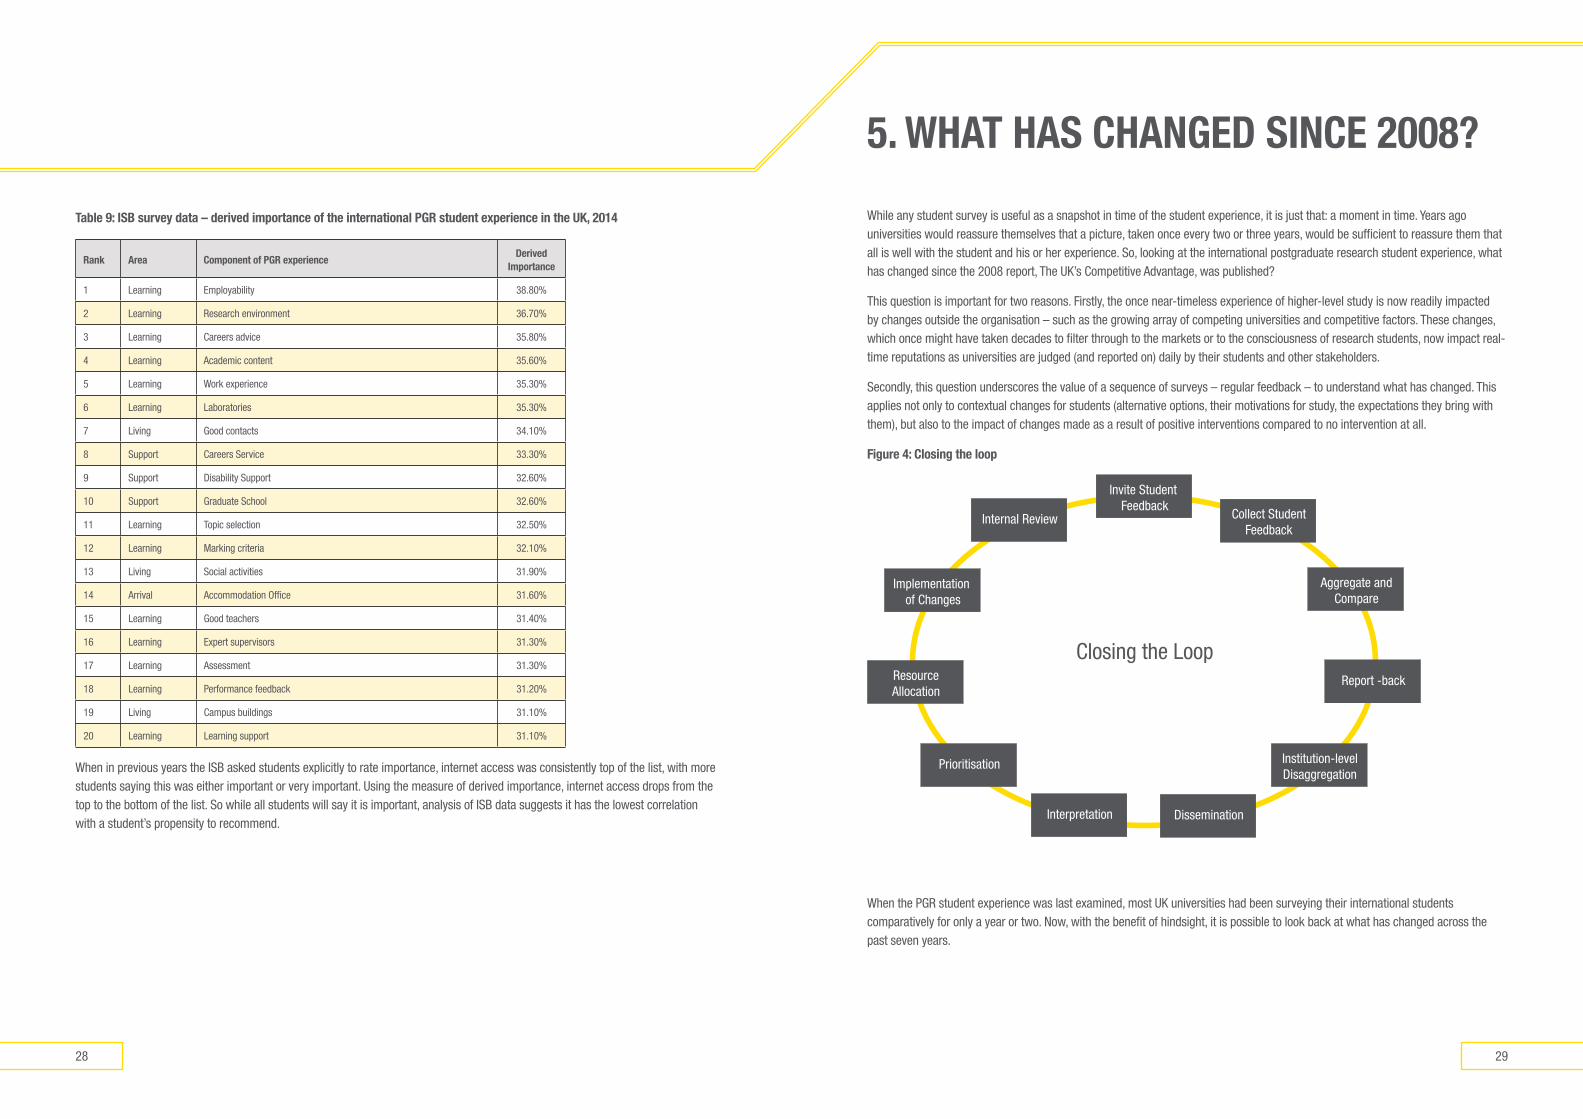
While any student survey is useful as a snapshot in time of the student experience, it is just that: a moment in time. Years ago universities would reassure themselves that a picture, taken once every two or three years, would be sufficient to reassure them that all is well with the student and his or her experience. So, looking at the international postgraduate research student experience, what has changed since the 2008 report, The UK’s Competitive Advantage, was published?
This question is important for two reasons. Firstly, the once near-timeless experience of higher-level study is now readily impacted by changes outside the organisation – such as the growing array of competing universities and competitive factors. These changes, which once might have taken decades to filter through to the markets or to the consciousness of research students, now impact real-time reputations as universities are judged (and reported on) daily by their students and other stakeholders.
Secondly, this question underscores the value of a sequence of surveys – regular feedback – to understand what has changed. This applies not only to contextual changes for students (alternative options, their motivations for study, the expectations they bring with them), but also to the impact of changes made as a result of positive interventions compared to no intervention at all.
Figure 4: Closing the loop
Invite Student Feedback
Closing the Loop
Collect StudentFeedback
Aggregate andCompare
Report -back
Institution-levelDisaggregation
DisseminationInterpretation
Prioritisation
ResourceAllocation
Implementation of Changes
Internal Review
When the PGR student experience was last examined, most UK universities had been surveying their international students comparatively for only a year or two. Now, with the benefit of hindsight, it is possible to look back at what has changed across the past seven years.
Table 9: IsB survey data – derived importance of the international PGR student experience in the UK, 2014
Rank area Component of PGR experiencederived
Importance
1 Learning Employability 38.80%
2 Learning Research environment 36.70%
3 Learning Careers advice 35.80%
4 Learning Academic content 35.60%
5 Learning Work experience 35.30%
6 Learning Laboratories 35.30%
7 Living Good contacts 34.10%
8 Support Careers Service 33.30%
9 Support Disability Support 32.60%
10 Support Graduate School 32.60%
11 Learning Topic selection 32.50%
12 Learning Marking criteria 32.10%
13 Living Social activities 31.90%
14 Arrival Accommodation Office 31.60%
15 Learning Good teachers 31.40%
16 Learning Expert supervisors 31.30%
17 Learning Assessment 31.30%
18 Learning Performance feedback 31.20%
19 Living Campus buildings 31.10%
20 Learning Learning support 31.10%
When in previous years the ISB asked students explicitly to rate importance, internet access was consistently top of the list, with more students saying this was either important or very important. Using the measure of derived importance, internet access drops from the top to the bottom of the list. So while all students will say it is important, analysis of ISB data suggests it has the lowest correlation with a student’s propensity to recommend.
5. WhaT has ChanGed sInCe 2008?
3130
Table 18: IsB survey data – the arrival experience for international PGR students in the UK, 2008–14
arrival experience
PGR 2008 2009 2010 2011 2012 2013 2014 Change
Accommodation Office 75% 74% 77% 75% 81% 83% 80% 17%
Accommodation Condition N/A N/A 77% 77% 79% 79% 78% 1%
Bank account 63% 62% 64% 72% 75% 77% 77% 14%
Internet access 84% 85% 82% 83% 84% 84% 85% 1%
Finance Office 79% 80% 86% 86% 87% 89% 90% 11%
First night 81% 81% 81% 84% 84% 83% 83% 1%
Formal welcome 85% 87% 87% 87% 89% 88% 88% 4%
Home friends 78% 79% 84% 83% 86% 85% 88% 9%
Host friends 75% 79% 74% 73% 74% 74% 75% 0%
Local Orientation 83% 86% 86% 86% 86% 86% 86% 3%
Meeting staff 91% 91% 95% 93% 94% 93% 95% 3%
Other friends 87% 89% 89% 88% 89% 90% 89% 3%
Registration 84% 84% 85% 86% 88% 90% 90% 6%
Social activities 83% 85% 83% 84% 85% 86% 87% 4%
Study sense 84% 85% 86% 86% 86% 84% 86% 1%
University Orientation 85% 85% 86% 86% 87% 87% 88% 4%
Welcome 72% 75% 71% 74% 76% 78% 76% 4%
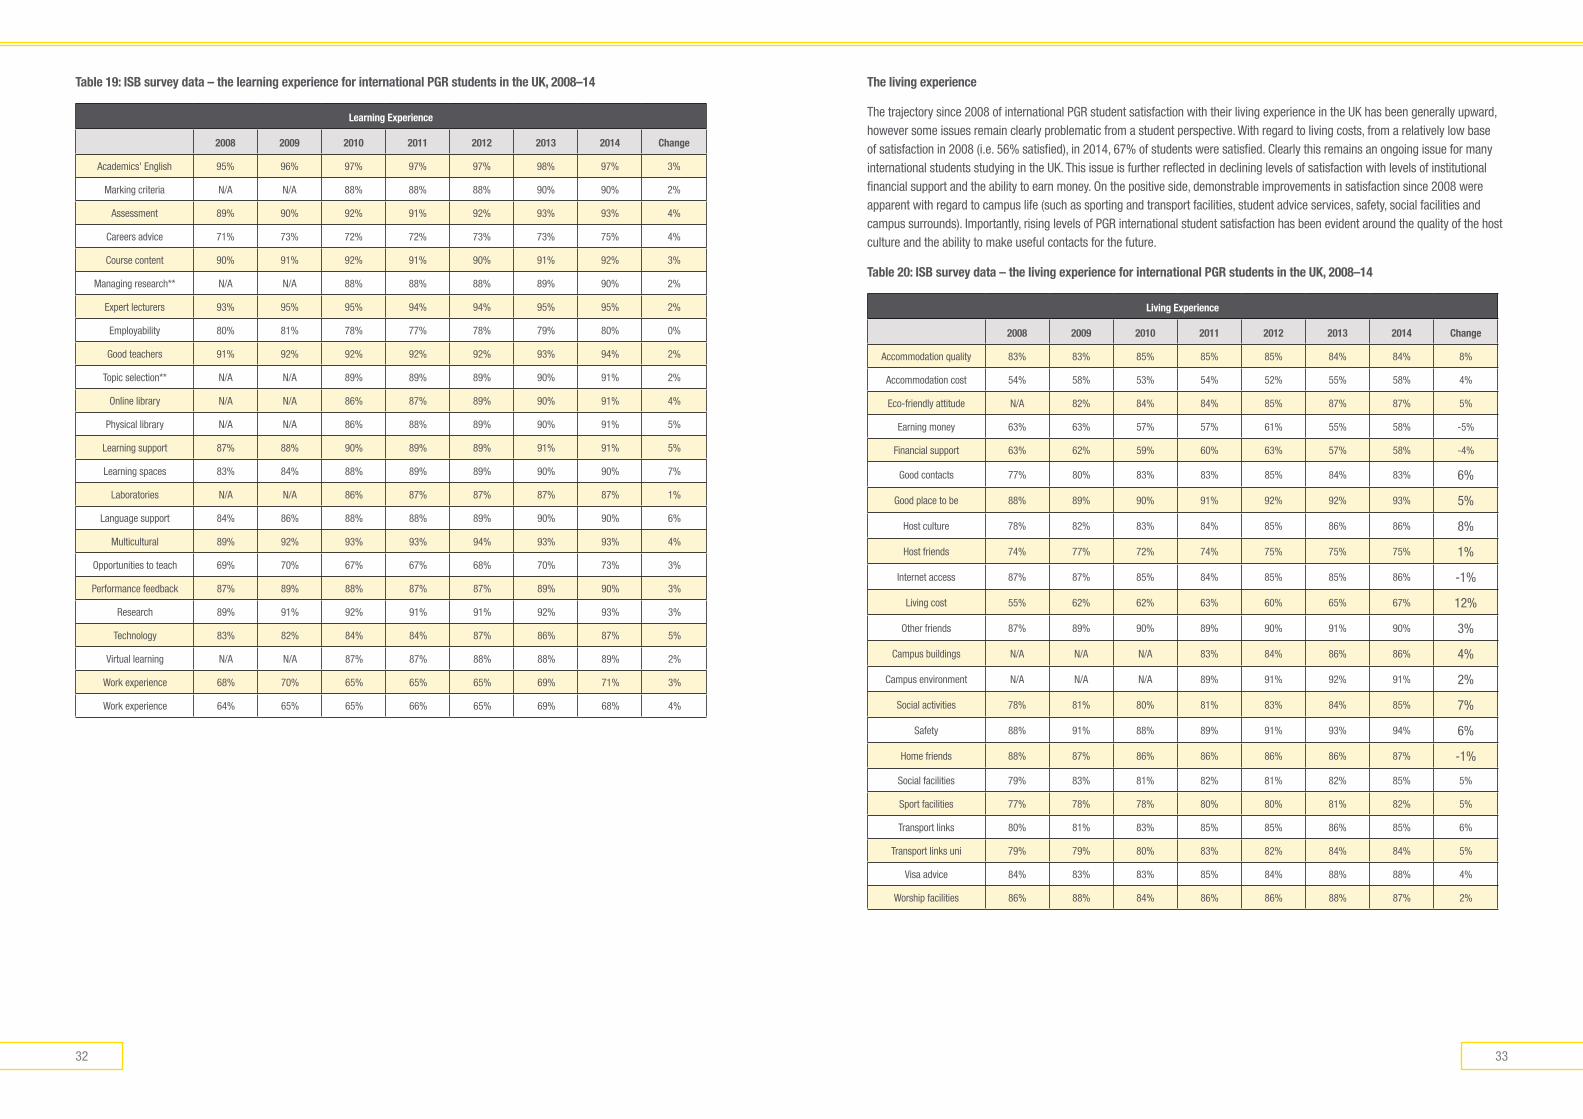
The learning experience
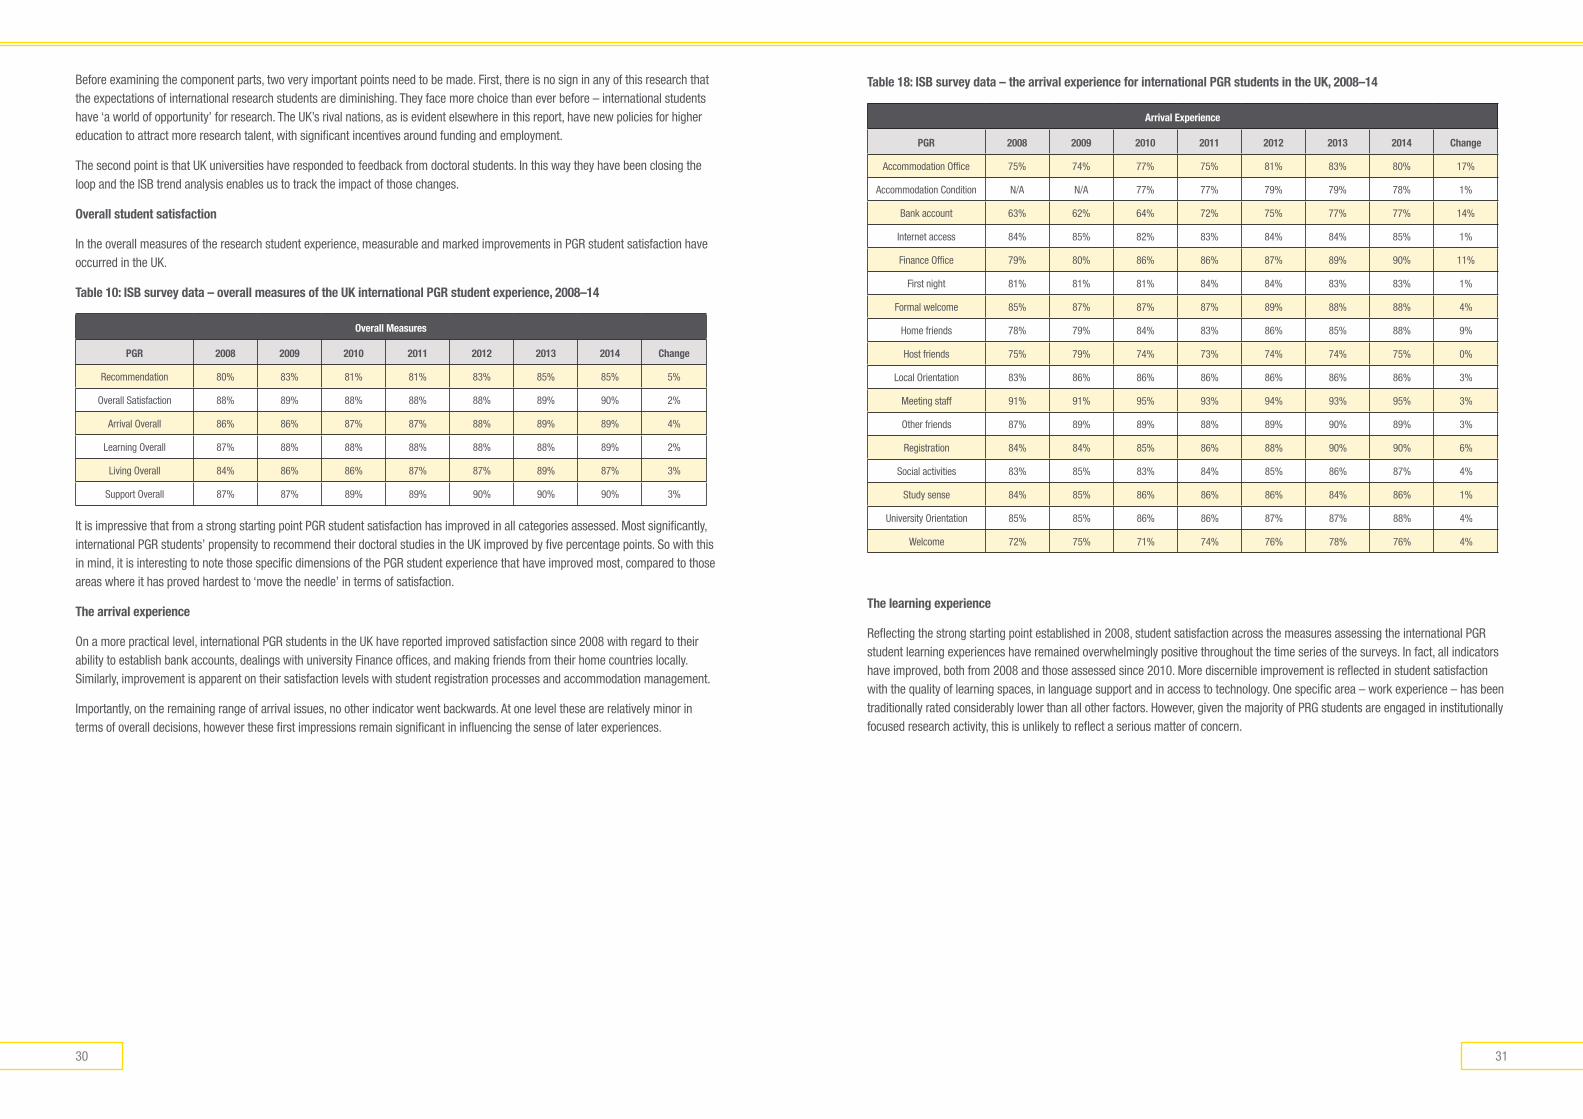
Reflecting the strong starting point established in 2008, student satisfaction across the measures assessing the international PGR student learning experiences have remained overwhelmingly positive throughout the time series of the surveys. In fact, all indicators have improved, both from 2008 and those assessed since 2010. More discernible improvement is reflected in student satisfaction with the quality of learning spaces, in language support and in access to technology. One specific area – work experience – has been traditionally rated considerably lower than all other factors. However, given the majority of PRG students are engaged in institutionally focused research activity, this is unlikely to reflect a serious matter of concern.
Before examining the component parts, two very important points need to be made. First, there is no sign in any of this research that the expectations of international research students are diminishing. They face more choice than ever before – international students have ‘a world of opportunity’ for research. The UK’s rival nations, as is evident elsewhere in this report, have new policies for higher education to attract more research talent, with significant incentives around funding and employment.
The second point is that UK universities have responded to feedback from doctoral students. In this way they have been closing the loop and the ISB trend analysis enables us to track the impact of those changes.
overall student satisfaction
In the overall measures of the research student experience, measurable and marked improvements in PGR student satisfaction have occurred in the UK.
Table 10: IsB survey data – overall measures of the UK international PGR student experience, 2008–14
overall measures
PGR 2008 2009 2010 2011 2012 2013 2014 Change
Recommendation 80% 83% 81% 81% 83% 85% 85% 5%
Overall Satisfaction 88% 89% 88% 88% 88% 89% 90% 2%
Arrival Overall 86% 86% 87% 87% 88% 89% 89% 4%
Learning Overall 87% 88% 88% 88% 88% 88% 89% 2%
Living Overall 84% 86% 86% 87% 87% 89% 87% 3%
Support Overall 87% 87% 89% 89% 90% 90% 90% 3%
It is impressive that from a strong starting point PGR student satisfaction has improved in all categories assessed. Most significantly, international PGR students’ propensity to recommend their doctoral studies in the UK improved by five percentage points. So with this in mind, it is interesting to note those specific dimensions of the PGR student experience that have improved most, compared to those areas where it has proved hardest to ‘move the needle’ in terms of satisfaction.
The arrival experience
On a more practical level, international PGR students in the UK have reported improved satisfaction since 2008 with regard to their ability to establish bank accounts, dealings with university Finance offices, and making friends from their home countries locally. Similarly, improvement is apparent on their satisfaction levels with student registration processes and accommodation management.
Importantly, on the remaining range of arrival issues, no other indicator went backwards. At one level these are relatively minor in terms of overall decisions, however these first impressions remain significant in influencing the sense of later experiences.
3332
The living experience
The trajectory since 2008 of international PGR student satisfaction with their living experience in the UK has been generally upward, however some issues remain clearly problematic from a student perspective. With regard to living costs, from a relatively low base of satisfaction in 2008 (i.e. 56% satisfied), in 2014, 67% of students were satisfied. Clearly this remains an ongoing issue for many international students studying in the UK. This issue is further reflected in declining levels of satisfaction with levels of institutional financial support and the ability to earn money. On the positive side, demonstrable improvements in satisfaction since 2008 were apparent with regard to campus life (such as sporting and transport facilities, student advice services, safety, social facilities and campus surrounds). Importantly, rising levels of PGR international student satisfaction has been evident around the quality of the host culture and the ability to make useful contacts for the future.
Table 20: IsB survey data – the living experience for international PGR students in the UK, 2008–14
living experience
2008 2009 2010 2011 2012 2013 2014 Change
Accommodation quality 83% 83% 85% 85% 85% 84% 84% 8%
Accommodation cost 54% 58% 53% 54% 52% 55% 58% 4%
Eco-friendly attitude N/A 82% 84% 84% 85% 87% 87% 5%
Earning money 63% 63% 57% 57% 61% 55% 58% -5%
Financial support 63% 62% 59% 60% 63% 57% 58% -4%
Good contacts 77% 80% 83% 83% 85% 84% 83% 6%
Good place to be 88% 89% 90% 91% 92% 92% 93% 5%
Host culture 78% 82% 83% 84% 85% 86% 86% 8%
Host friends 74% 77% 72% 74% 75% 75% 75% 1%
Internet access 87% 87% 85% 84% 85% 85% 86% -1%
Living cost 55% 62% 62% 63% 60% 65% 67% 12%
Other friends 87% 89% 90% 89% 90% 91% 90% 3%
Campus buildings N/A N/A N/A 83% 84% 86% 86% 4%
Campus environment N/A N/A N/A 89% 91% 92% 91% 2%
Social activities 78% 81% 80% 81% 83% 84% 85% 7%
Safety 88% 91% 88% 89% 91% 93% 94% 6%
Home friends 88% 87% 86% 86% 86% 86% 87% -1%
Social facilities 79% 83% 81% 82% 81% 82% 85% 5%
Sport facilities 77% 78% 78% 80% 80% 81% 82% 5%
Transport links 80% 81% 83% 85% 85% 86% 85% 6%
Transport links uni 79% 79% 80% 83% 82% 84% 84% 5%
Visa advice 84% 83% 83% 85% 84% 88% 88% 4%
Worship facilities 86% 88% 84% 86% 86% 88% 87% 2%
Table 19: IsB survey data – the learning experience for international PGR students in the UK, 2008–14
learning experience
2008 2009 2010 2011 2012 2013 2014 Change
Academics' English 95% 96% 97% 97% 97% 98% 97% 3%
Marking criteria N/A N/A 88% 88% 88% 90% 90% 2%
Assessment 89% 90% 92% 91% 92% 93% 93% 4%
Careers advice 71% 73% 72% 72% 73% 73% 75% 4%
Course content 90% 91% 92% 91% 90% 91% 92% 3%
Managing research** N/A N/A 88% 88% 88% 89% 90% 2%
Expert lecturers 93% 95% 95% 94% 94% 95% 95% 2%
Employability 80% 81% 78% 77% 78% 79% 80% 0%
Good teachers 91% 92% 92% 92% 92% 93% 94% 2%
Topic selection** N/A N/A 89% 89% 89% 90% 91% 2%
Online library N/A N/A 86% 87% 89% 90% 91% 4%
Physical library N/A N/A 86% 88% 89% 90% 91% 5%
Learning support 87% 88% 90% 89% 89% 91% 91% 5%
Learning spaces 83% 84% 88% 89% 89% 90% 90% 7%
Laboratories N/A N/A 86% 87% 87% 87% 87% 1%
Language support 84% 86% 88% 88% 89% 90% 90% 6%
Multicultural 89% 92% 93% 93% 94% 93% 93% 4%
Opportunities to teach 69% 70% 67% 67% 68% 70% 73% 3%
Performance feedback 87% 89% 88% 87% 87% 89% 90% 3%
Research 89% 91% 92% 91% 91% 92% 93% 3%
Technology 83% 82% 84% 84% 87% 86% 87% 5%
Virtual learning N/A N/A 87% 87% 88% 88% 89% 2%
Work experience 68% 70% 65% 65% 65% 69% 71% 3%
Work experience 64% 65% 65% 66% 65% 69% 68% 4%
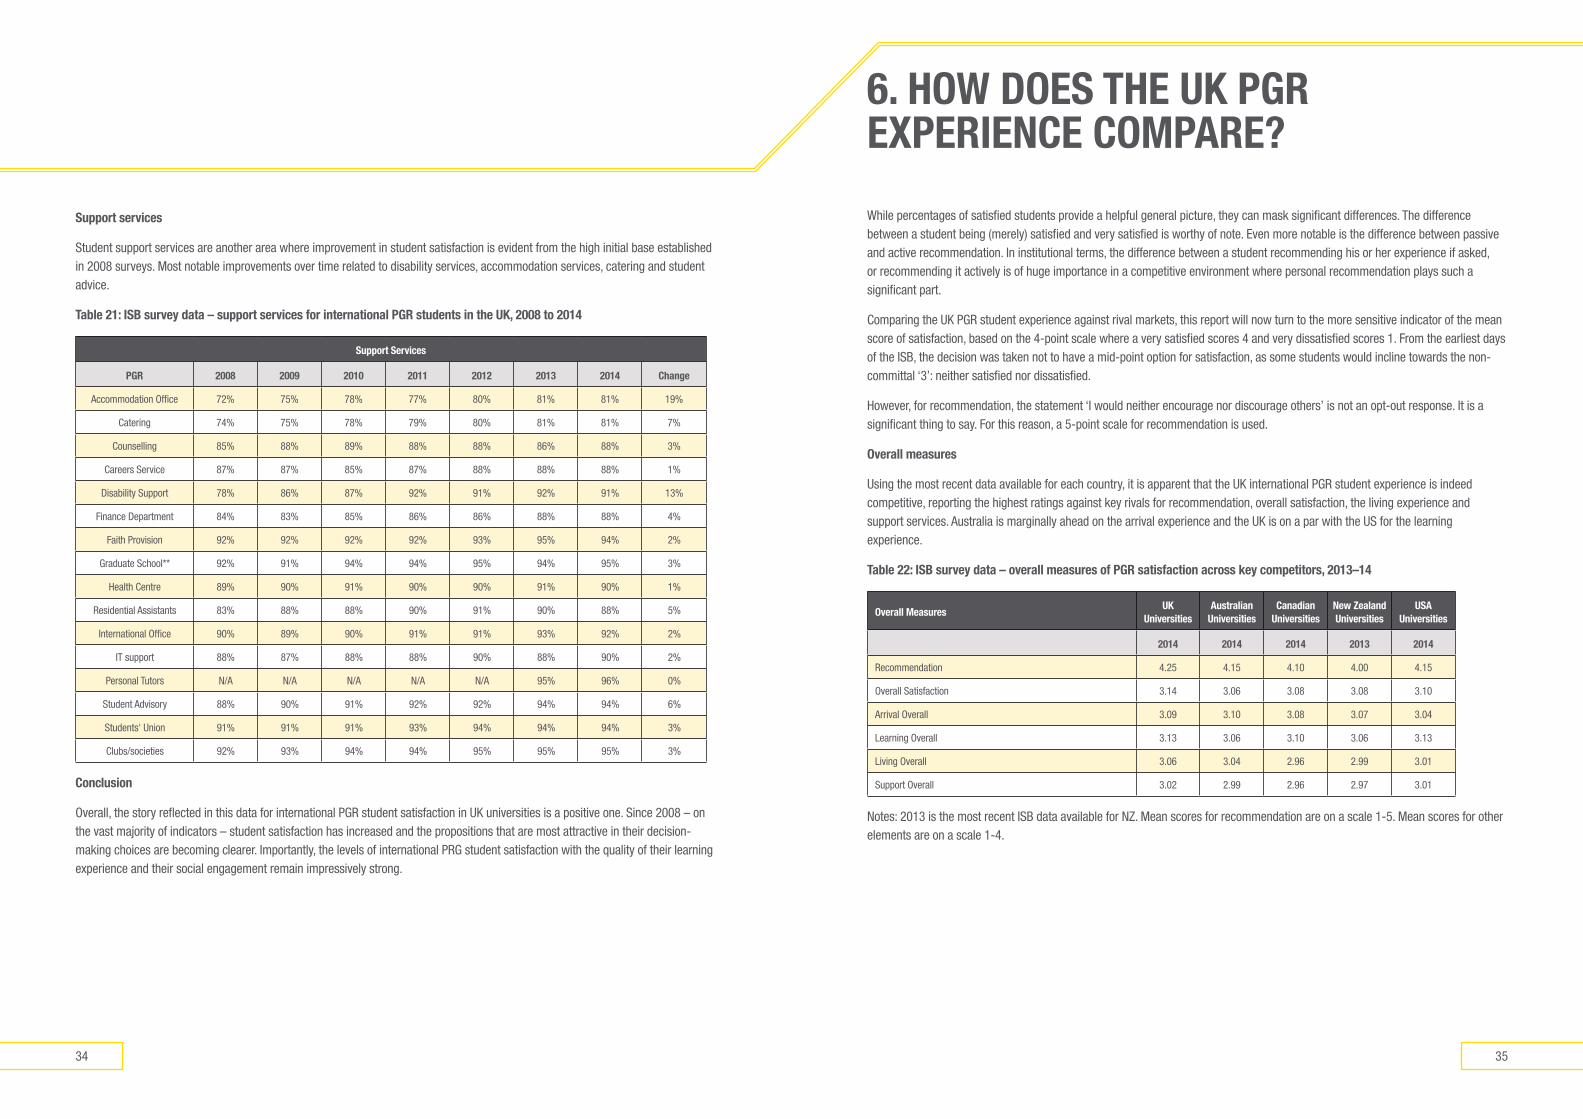
3534
6. hoW does The UK PGR exPeRIenCe ComPaRe?
While percentages of satisfied students provide a helpful general picture, they can mask significant differences. The difference between a student being (merely) satisfied and very satisfied is worthy of note. Even more notable is the difference between passive and active recommendation. In institutional terms, the difference between a student recommending his or her experience if asked, or recommending it actively is of huge importance in a competitive environment where personal recommendation plays such a significant part.
Comparing the UK PGR student experience against rival markets, this report will now turn to the more sensitive indicator of the mean score of satisfaction, based on the 4-point scale where a very satisfied scores 4 and very dissatisfied scores 1. From the earliest days of the ISB, the decision was taken not to have a mid-point option for satisfaction, as some students would incline towards the non-committal ‘3’: neither satisfied nor dissatisfied.
However, for recommendation, the statement ‘I would neither encourage nor discourage others’ is not an opt-out response. It is a significant thing to say. For this reason, a 5-point scale for recommendation is used.
overall measures
Using the most recent data available for each country, it is apparent that the UK international PGR student experience is indeed competitive, reporting the highest ratings against key rivals for recommendation, overall satisfaction, the living experience and support services. Australia is marginally ahead on the arrival experience and the UK is on a par with the US for the learning experience.
Table 22: IsB survey data – overall measures of PGR satisfaction across key competitors, 2013–14
overall measuresUK
Universitiesaustralian
UniversitiesCanadian
Universitiesnew Zealand Universities
UsA Universities
2014 2014 2014 2013 2014
Recommendation 4.25 4.15 4.10 4.00 4.15
Overall Satisfaction 3.14 3.06 3.08 3.08 3.10
Arrival Overall 3.09 3.10 3.08 3.07 3.04
Learning Overall 3.13 3.06 3.10 3.06 3.13
Living Overall 3.06 3.04 2.96 2.99 3.01
Support Overall 3.02 2.99 2.96 2.97 3.01
Notes: 2013 is the most recent ISB data available for NZ. Mean scores for recommendation are on a scale 1-5. Mean scores for other elements are on a scale 1-4.
support services
Student support services are another area where improvement in student satisfaction is evident from the high initial base established in 2008 surveys. Most notable improvements over time related to disability services, accommodation services, catering and student advice.
Table 21: IsB survey data – support services for international PGR students in the UK, 2008 to 2014
support services
PGR 2008 2009 2010 2011 2012 2013 2014 Change
Accommodation Office 72% 75% 78% 77% 80% 81% 81% 19%
Catering 74% 75% 78% 79% 80% 81% 81% 7%
Counselling 85% 88% 89% 88% 88% 86% 88% 3%
Careers Service 87% 87% 85% 87% 88% 88% 88% 1%
Disability Support 78% 86% 87% 92% 91% 92% 91% 13%
Finance Department 84% 83% 85% 86% 86% 88% 88% 4%
Faith Provision 92% 92% 92% 92% 93% 95% 94% 2%
Graduate School** 92% 91% 94% 94% 95% 94% 95% 3%
Health Centre 89% 90% 91% 90% 90% 91% 90% 1%
Residential Assistants 83% 88% 88% 90% 91% 90% 88% 5%
International Office 90% 89% 90% 91% 91% 93% 92% 2%
IT support 88% 87% 88% 88% 90% 88% 90% 2%
Personal Tutors N/A N/A N/A N/A N/A 95% 96% 0%
Student Advisory 88% 90% 91% 92% 92% 94% 94% 6%
Students' Union 91% 91% 91% 93% 94% 94% 94% 3%
Clubs/societies 92% 93% 94% 94% 95% 95% 95% 3%
Conclusion
Overall, the story reflected in this data for international PGR student satisfaction in UK universities is a positive one. Since 2008 – on the vast majority of indicators – student satisfaction has increased and the propositions that are most attractive in their decision-making choices are becoming clearer. Importantly, the levels of international PRG student satisfaction with the quality of their learning experience and their social engagement remain impressively strong.
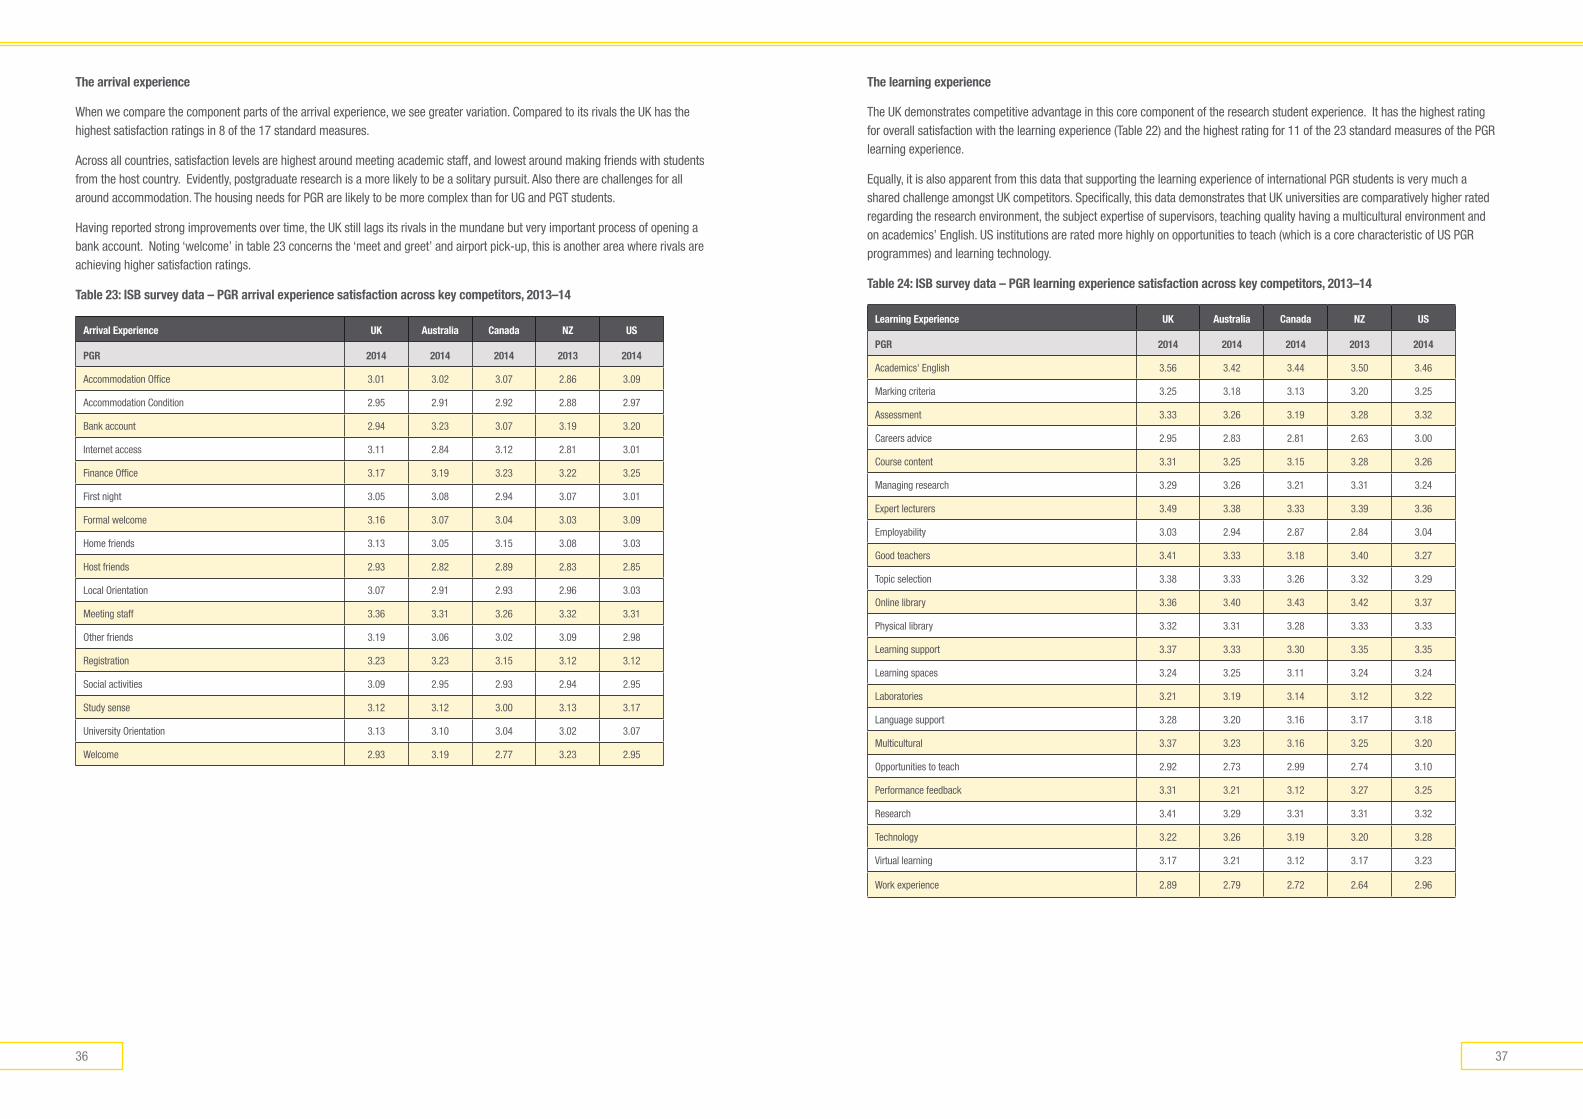
3736
The learning experience
The UK demonstrates competitive advantage in this core component of the research student experience. It has the highest rating for overall satisfaction with the learning experience (Table 22) and the highest rating for 11 of the 23 standard measures of the PGR learning experience.
Equally, it is also apparent from this data that supporting the learning experience of international PGR students is very much a shared challenge amongst UK competitors. Specifically, this data demonstrates that UK universities are comparatively higher rated regarding the research environment, the subject expertise of supervisors, teaching quality having a multicultural environment and on academics’ English. US institutions are rated more highly on opportunities to teach (which is a core characteristic of US PGR programmes) and learning technology.
Table 24: IsB survey data – PGR learning experience satisfaction across key competitors, 2013–14
learning experience UK australia Canada nZ Us
PGR 2014 2014 2014 2013 2014
Academics' English 3.56 3.42 3.44 3.50 3.46
Marking criteria 3.25 3.18 3.13 3.20 3.25
Assessment 3.33 3.26 3.19 3.28 3.32
Careers advice 2.95 2.83 2.81 2.63 3.00
Course content 3.31 3.25 3.15 3.28 3.26
Managing research 3.29 3.26 3.21 3.31 3.24
Expert lecturers 3.49 3.38 3.33 3.39 3.36
Employability 3.03 2.94 2.87 2.84 3.04
Good teachers 3.41 3.33 3.18 3.40 3.27
Topic selection 3.38 3.33 3.26 3.32 3.29
Online library 3.36 3.40 3.43 3.42 3.37
Physical library 3.32 3.31 3.28 3.33 3.33
Learning support 3.37 3.33 3.30 3.35 3.35
Learning spaces 3.24 3.25 3.11 3.24 3.24
Laboratories 3.21 3.19 3.14 3.12 3.22
Language support 3.28 3.20 3.16 3.17 3.18
Multicultural 3.37 3.23 3.16 3.25 3.20
Opportunities to teach 2.92 2.73 2.99 2.74 3.10
Performance feedback 3.31 3.21 3.12 3.27 3.25
Research 3.41 3.29 3.31 3.31 3.32
Technology 3.22 3.26 3.19 3.20 3.28
Virtual learning 3.17 3.21 3.12 3.17 3.23
Work experience 2.89 2.79 2.72 2.64 2.96
The arrival experience
When we compare the component parts of the arrival experience, we see greater variation. Compared to its rivals the UK has the highest satisfaction ratings in 8 of the 17 standard measures.
Across all countries, satisfaction levels are highest around meeting academic staff, and lowest around making friends with students from the host country. Evidently, postgraduate research is a more likely to be a solitary pursuit. Also there are challenges for all around accommodation. The housing needs for PGR are likely to be more complex than for UG and PGT students.
Having reported strong improvements over time, the UK still lags its rivals in the mundane but very important process of opening a bank account. Noting ‘welcome’ in table 23 concerns the ‘meet and greet’ and airport pick-up, this is another area where rivals are achieving higher satisfaction ratings.
Table 23: IsB survey data – PGR arrival experience satisfaction across key competitors, 2013–14
arrival experience UK australia Canada nZ Us
PGR 2014 2014 2014 2013 2014
Accommodation Office 3.01 3.02 3.07 2.86 3.09
Accommodation Condition 2.95 2.91 2.92 2.88 2.97
Bank account 2.94 3.23 3.07 3.19 3.20
Internet access 3.11 2.84 3.12 2.81 3.01
Finance Office 3.17 3.19 3.23 3.22 3.25
First night 3.05 3.08 2.94 3.07 3.01
Formal welcome 3.16 3.07 3.04 3.03 3.09
Home friends 3.13 3.05 3.15 3.08 3.03
Host friends 2.93 2.82 2.89 2.83 2.85
Local Orientation 3.07 2.91 2.93 2.96 3.03
Meeting staff 3.36 3.31 3.26 3.32 3.31
Other friends 3.19 3.06 3.02 3.09 2.98
Registration 3.23 3.23 3.15 3.12 3.12
Social activities 3.09 2.95 2.93 2.94 2.95
Study sense 3.12 3.12 3.00 3.13 3.17
University Orientation 3.13 3.10 3.04 3.02 3.07
Welcome 2.93 3.19 2.77 3.23 2.95
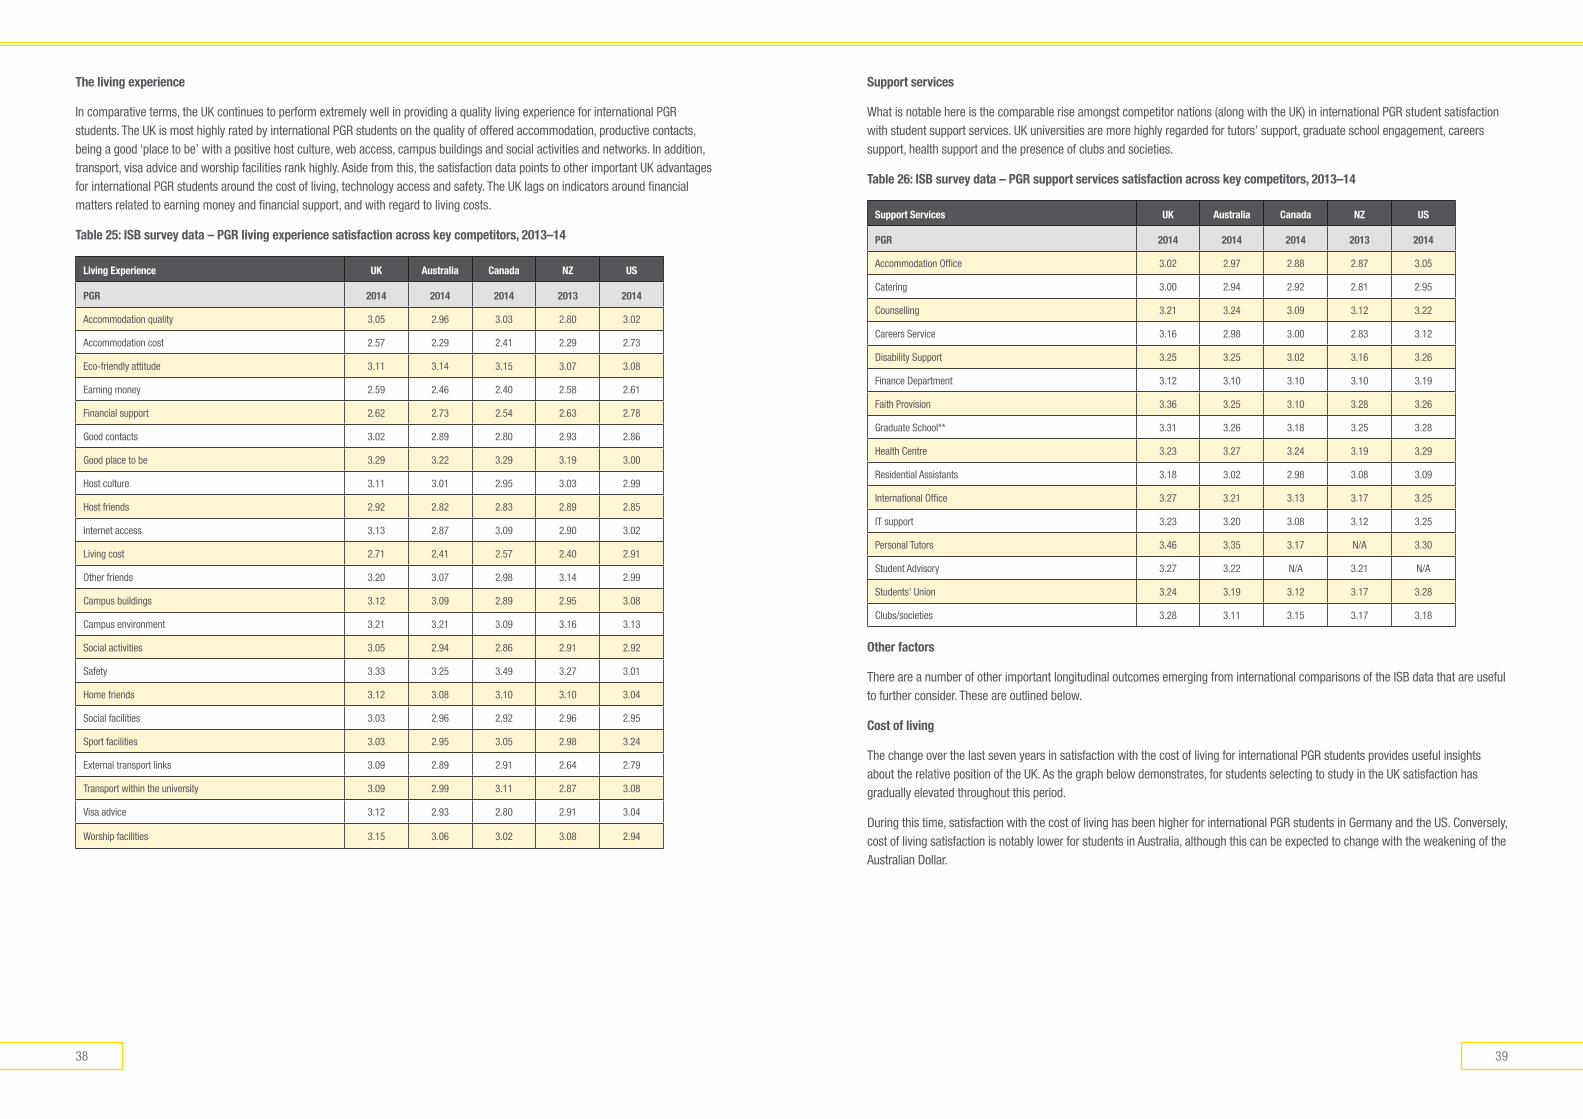
3938
support services
What is notable here is the comparable rise amongst competitor nations (along with the UK) in international PGR student satisfaction with student support services. UK universities are more highly regarded for tutors’ support, graduate school engagement, careers support, health support and the presence of clubs and societies.
Table 26: IsB survey data – PGR support services satisfaction across key competitors, 2013–14
support services UK australia Canada nZ Us
PGR 2014 2014 2014 2013 2014
Accommodation Office 3.02 2.97 2.88 2.87 3.05
Catering 3.00 2.94 2.92 2.81 2.95
Counselling 3.21 3.24 3.09 3.12 3.22
Careers Service 3.16 2.98 3.00 2.83 3.12
Disability Support 3.25 3.25 3.02 3.16 3.26
Finance Department 3.12 3.10 3.10 3.10 3.19
Faith Provision 3.36 3.25 3.10 3.28 3.26
Graduate School** 3.31 3.26 3.18 3.25 3.28
Health Centre 3.23 3.27 3.24 3.19 3.29
Residential Assistants 3.18 3.02 2.98 3.08 3.09
International Office 3.27 3.21 3.13 3.17 3.25
IT support 3.23 3.20 3.08 3.12 3.25
Personal Tutors 3.46 3.35 3.17 N/A 3.30
Student Advisory 3.27 3.22 N/A 3.21 N/A
Students' Union 3.24 3.19 3.12 3.17 3.28
Clubs/societies 3.28 3.11 3.15 3.17 3.18
other factors
There are a number of other important longitudinal outcomes emerging from international comparisons of the ISB data that are useful to further consider. These are outlined below.
Cost of living
The change over the last seven years in satisfaction with the cost of living for international PGR students provides useful insights about the relative position of the UK. As the graph below demonstrates, for students selecting to study in the UK satisfaction has gradually elevated throughout this period.
During this time, satisfaction with the cost of living has been higher for international PGR students in Germany and the US. Conversely, cost of living satisfaction is notably lower for students in Australia, although this can be expected to change with the weakening of the Australian Dollar.
The living experience
In comparative terms, the UK continues to perform extremely well in providing a quality living experience for international PGR students. The UK is most highly rated by international PGR students on the quality of offered accommodation, productive contacts, being a good ‘place to be’ with a positive host culture, web access, campus buildings and social activities and networks. In addition, transport, visa advice and worship facilities rank highly. Aside from this, the satisfaction data points to other important UK advantages for international PGR students around the cost of living, technology access and safety. The UK lags on indicators around financial matters related to earning money and financial support, and with regard to living costs.
Table 25: IsB survey data – PGR living experience satisfaction across key competitors, 2013–14
living experience UK australia Canada nZ Us
PGR 2014 2014 2014 2013 2014
Accommodation quality 3.05 2.96 3.03 2.80 3.02
Accommodation cost 2.57 2.29 2.41 2.29 2.73
Eco-friendly attitude 3.11 3.14 3.15 3.07 3.08
Earning money 2.59 2.46 2.40 2.58 2.61
Financial support 2.62 2.73 2.54 2.63 2.78
Good contacts 3.02 2.89 2.80 2.93 2.86
Good place to be 3.29 3.22 3.29 3.19 3.00
Host culture 3.11 3.01 2.95 3.03 2.99
Host friends 2.92 2.82 2.83 2.89 2.85
Internet access 3.13 2.87 3.09 2.90 3.02
Living cost 2.71 2.41 2.57 2.40 2.91
Other friends 3.20 3.07 2.98 3.14 2.99
Campus buildings 3.12 3.09 2.89 2.95 3.08
Campus environment 3.21 3.21 3.09 3.16 3.13
Social activities 3.05 2.94 2.86 2.91 2.92
Safety 3.33 3.25 3.49 3.27 3.01
Home friends 3.12 3.08 3.10 3.10 3.04
Social facilities 3.03 2.96 2.92 2.96 2.95
Sport facilities 3.03 2.95 3.05 2.98 3.24
External transport links 3.09 2.89 2.91 2.64 2.79
Transport within the university 3.09 2.99 3.11 2.87 3.08
Visa advice 3.12 2.93 2.80 2.91 3.04
Worship facilities 3.15 3.06 3.02 3.08 2.94
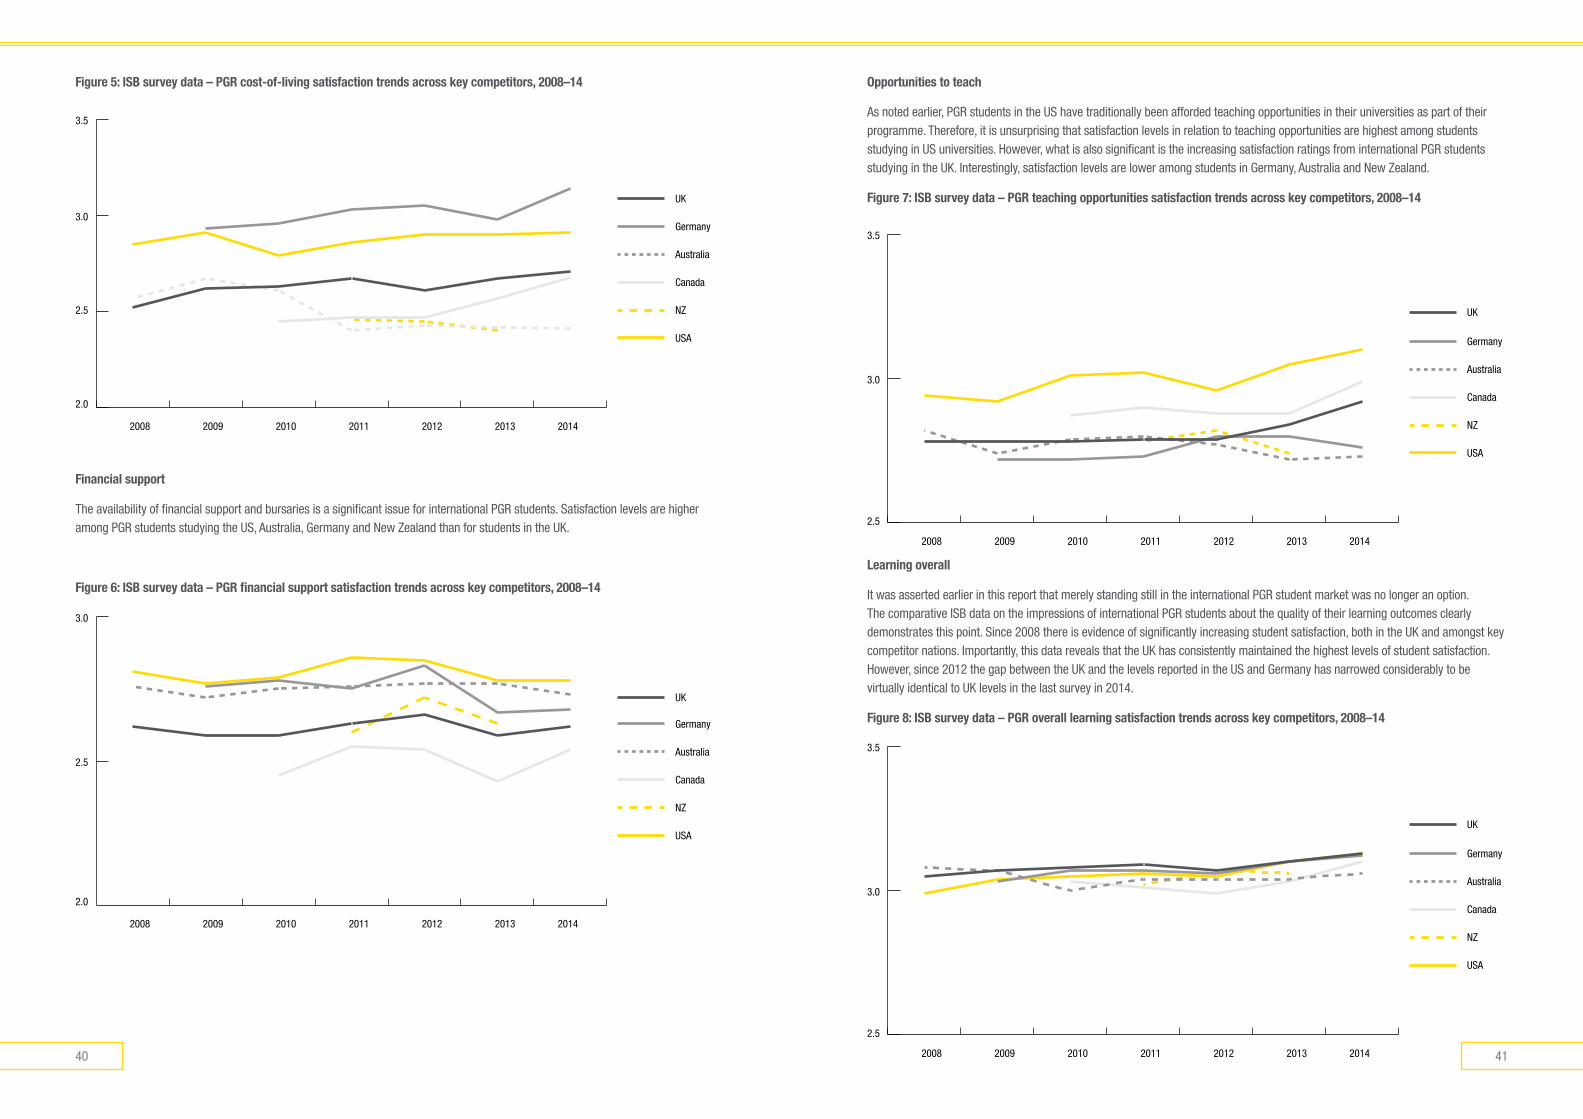
4140
opportunities to teach
As noted earlier, PGR students in the US have traditionally been afforded teaching opportunities in their universities as part of their programme. Therefore, it is unsurprising that satisfaction levels in relation to teaching opportunities are highest among students studying in US universities. However, what is also significant is the increasing satisfaction ratings from international PGR students studying in the UK. Interestingly, satisfaction levels are lower among students in Germany, Australia and New Zealand.
Figure 7: IsB survey data – PGR teaching opportunities satisfaction trends across key competitors, 2008–14
2.5
3.0
3.5
Germany
UK
Australia
Canada
NZ
USA
20142008 2009 2010 2011 2012 2013
learning overall
It was asserted earlier in this report that merely standing still in the international PGR student market was no longer an option. The comparative ISB data on the impressions of international PGR students about the quality of their learning outcomes clearly demonstrates this point. Since 2008 there is evidence of significantly increasing student satisfaction, both in the UK and amongst key competitor nations. Importantly, this data reveals that the UK has consistently maintained the highest levels of student satisfaction. However, since 2012 the gap between the UK and the levels reported in the US and Germany has narrowed considerably to be virtually identical to UK levels in the last survey in 2014.
Figure 8: IsB survey data – PGR overall learning satisfaction trends across key competitors, 2008–14
2.5
3.0
3.5
Germany
UK
Australia
Canada
NZ
USA
20142008 2009 2010 2011 2012 2013
Figure 5: IsB survey data – PGR cost-of-living satisfaction trends across key competitors, 2008–14
2.0
2.5
3.0
3.5
2008 2009 2010 2011 2012 2013
Germany
UK
Australia
Canada
NZ
USA
2014
2.5
2.0
3.0
3.5
Financial support
The availability of financial support and bursaries is a significant issue for international PGR students. Satisfaction levels are higher among PGR students studying the US, Australia, Germany and New Zealand than for students in the UK.
Figure 6: IsB survey data – PGR financial support satisfaction trends across key competitors, 2008–14
20142008 2009 2010 2011 2012 2013
2.5
Germany
Australia
Canada
NZ
USA
UK
2.0
3.0
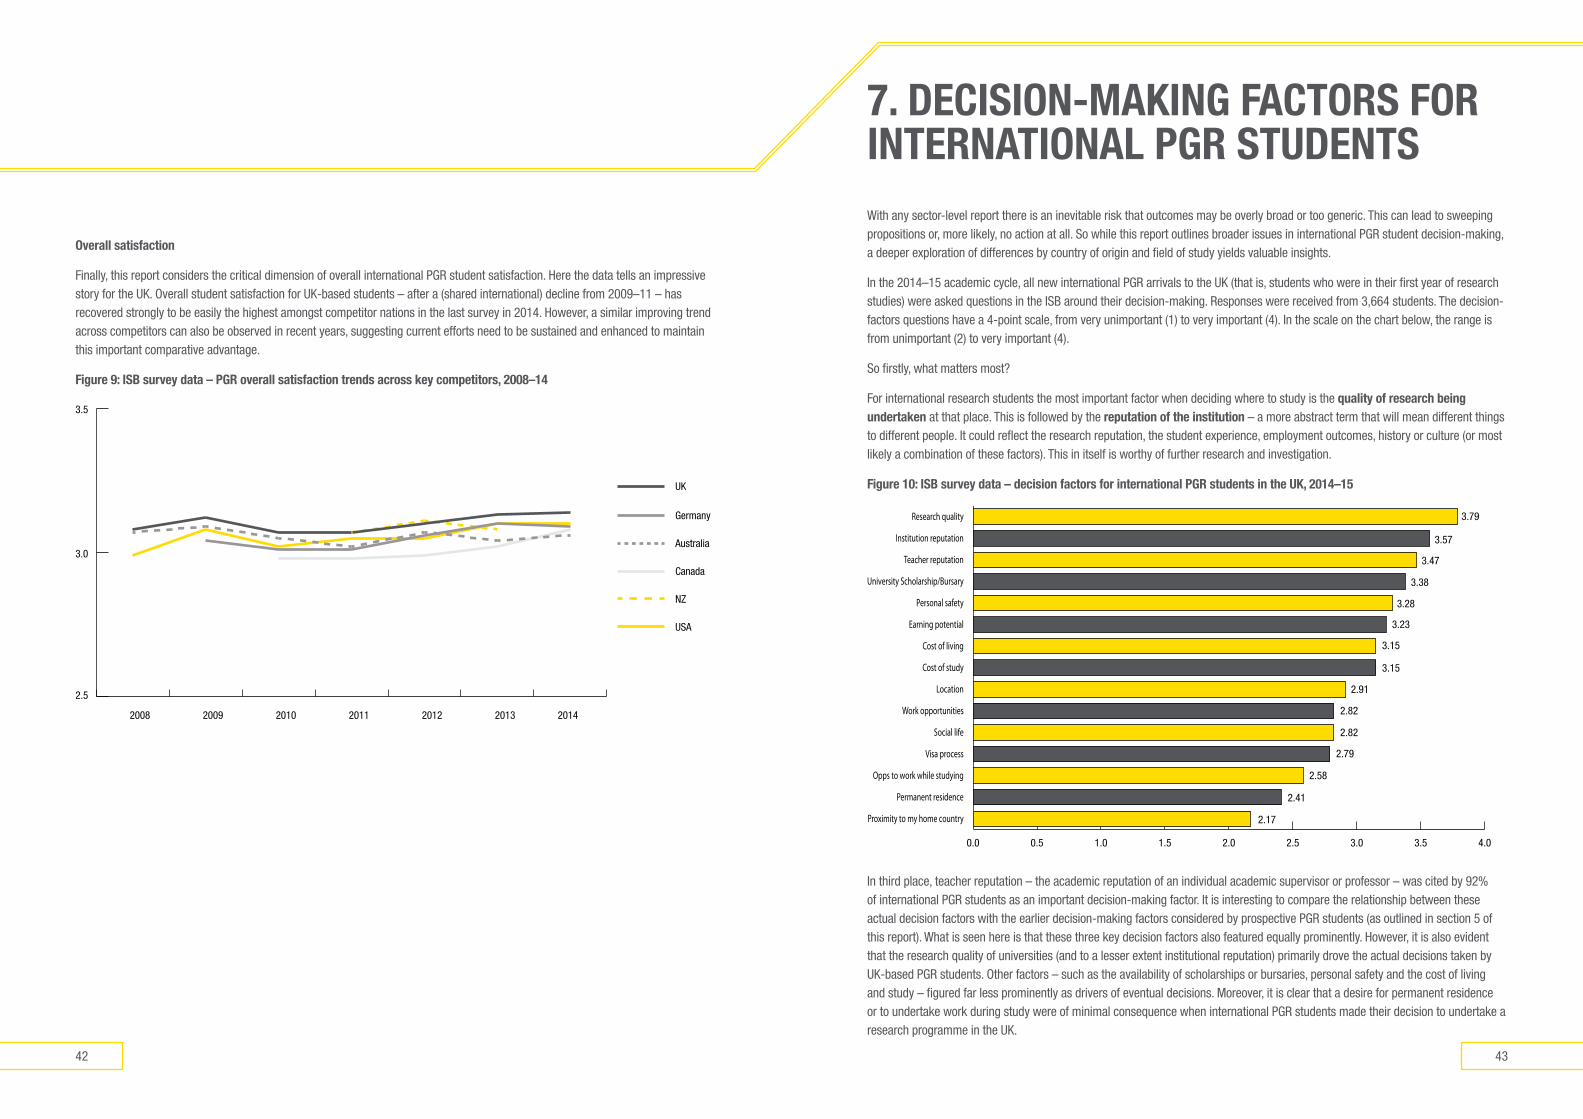
4342
With any sector-level report there is an inevitable risk that outcomes may be overly broad or too generic. This can lead to sweeping propositions or, more likely, no action at all. So while this report outlines broader issues in international PGR student decision-making, a deeper exploration of differences by country of origin and field of study yields valuable insights.
In the 2014–15 academic cycle, all new international PGR arrivals to the UK (that is, students who were in their first year of research studies) were asked questions in the ISB around their decision-making. Responses were received from 3,664 students. The decision-factors questions have a 4-point scale, from very unimportant (1) to very important (4). In the scale on the chart below, the range is from unimportant (2) to very important (4).
So firstly, what matters most?
For international research students the most important factor when deciding where to study is the quality of research being undertaken at that place. This is followed by the reputation of the institution – a more abstract term that will mean different things to different people. It could reflect the research reputation, the student experience, employment outcomes, history or culture (or most likely a combination of these factors). This in itself is worthy of further research and investigation.
Figure 10: IsB survey data – decision factors for international PGR students in the UK, 2014–15
0.0 0.5 1.0 1.5 2.0 2.5 3.0 3.5 4.0
Proximity to my home country
Permanent residence
Opps to work while studying
Visa process
Social life
Work opportunities
Location
Cost of study
Cost of living
Earning potential
Personal safety
University Scholarship/Bursary
Teacher reputation
Institution reputation
Research quality 3.79
3.57
3.47
3.38
3.28
3.23
3.15
3.15
2.91
2.82
2.82
2.79
2.58
2.41
2.17
In third place, teacher reputation – the academic reputation of an individual academic supervisor or professor – was cited by 92% of international PGR students as an important decision-making factor. It is interesting to compare the relationship between these actual decision factors with the earlier decision-making factors considered by prospective PGR students (as outlined in section 5 of this report). What is seen here is that these three key decision factors also featured equally prominently. However, it is also evident that the research quality of universities (and to a lesser extent institutional reputation) primarily drove the actual decisions taken by UK-based PGR students. Other factors – such as the availability of scholarships or bursaries, personal safety and the cost of living and study – figured far less prominently as drivers of eventual decisions. Moreover, it is clear that a desire for permanent residence or to undertake work during study were of minimal consequence when international PGR students made their decision to undertake a research programme in the UK.
overall satisfaction
Finally, this report considers the critical dimension of overall international PGR student satisfaction. Here the data tells an impressive story for the UK. Overall student satisfaction for UK-based students – after a (shared international) decline from 2009–11 – has recovered strongly to be easily the highest amongst competitor nations in the last survey in 2014. However, a similar improving trend across competitors can also be observed in recent years, suggesting current efforts need to be sustained and enhanced to maintain this important comparative advantage.
Figure 9: IsB survey data – PGR overall satisfaction trends across key competitors, 2008–14
2.5
3.0
3.5
Germany
UK
Australia
Canada
NZ
USA
20142008 2009 2010 2011 2012 2013
7. deCIsIon-maKInG FaCToRs FoR InTeRnaTIonal PGR sTUdenTs
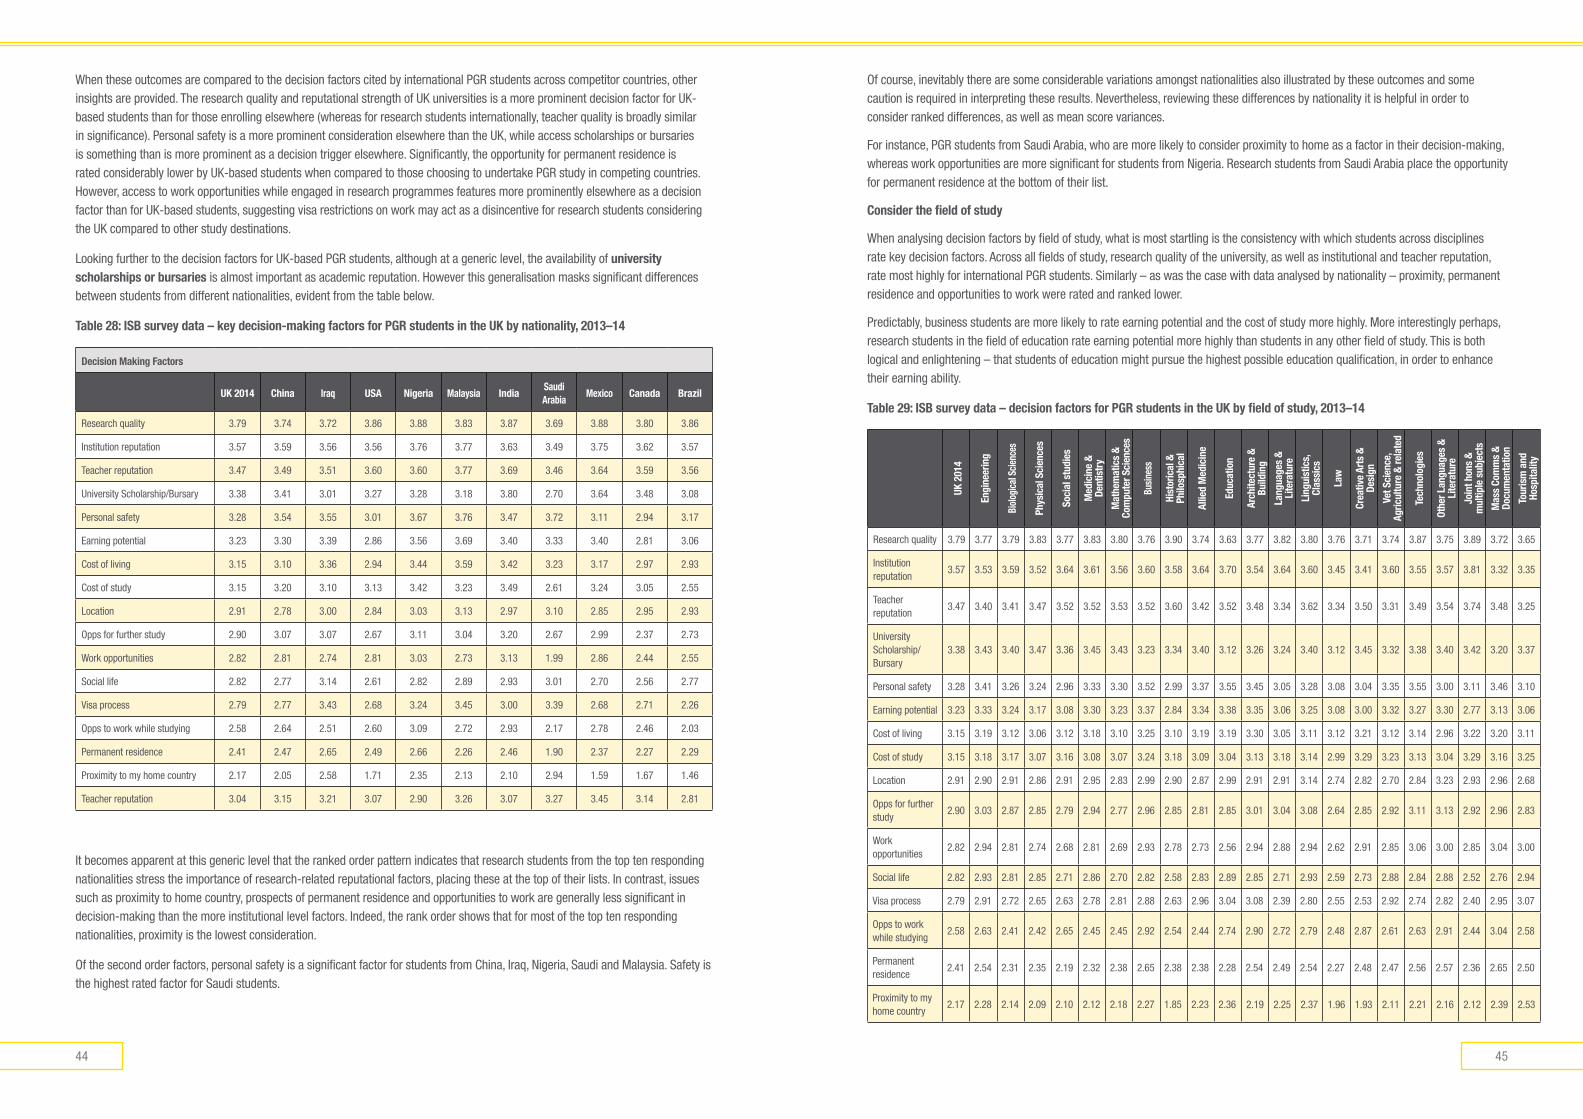
4544
When these outcomes are compared to the decision factors cited by international PGR students across competitor countries, other insights are provided. The research quality and reputational strength of UK universities is a more prominent decision factor for UK-based students than for those enrolling elsewhere (whereas for research students internationally, teacher quality is broadly similar in significance). Personal safety is a more prominent consideration elsewhere than the UK, while access scholarships or bursaries is something than is more prominent as a decision trigger elsewhere. Significantly, the opportunity for permanent residence is rated considerably lower by UK-based students when compared to those choosing to undertake PGR study in competing countries. However, access to work opportunities while engaged in research programmes features more prominently elsewhere as a decision factor than for UK-based students, suggesting visa restrictions on work may act as a disincentive for research students considering the UK compared to other study destinations.
Looking further to the decision factors for UK-based PGR students, although at a generic level, the availability of university scholarships or bursaries is almost important as academic reputation. However this generalisation masks significant differences between students from different nationalities, evident from the table below.
Table 28: IsB survey data – key decision-making factors for PGR students in the UK by nationality, 2013–14
decision making Factors
UK 2014 China Iraq UsA nigeria malaysia indiasaudi arabia
mexico Canada Brazil
Research quality 3.79 3.74 3.72 3.86 3.88 3.83 3.87 3.69 3.88 3.80 3.86
Institution reputation 3.57 3.59 3.56 3.56 3.76 3.77 3.63 3.49 3.75 3.62 3.57
Teacher reputation 3.47 3.49 3.51 3.60 3.60 3.77 3.69 3.46 3.64 3.59 3.56
University Scholarship/Bursary 3.38 3.41 3.01 3.27 3.28 3.18 3.80 2.70 3.64 3.48 3.08
Personal safety 3.28 3.54 3.55 3.01 3.67 3.76 3.47 3.72 3.11 2.94 3.17
Earning potential 3.23 3.30 3.39 2.86 3.56 3.69 3.40 3.33 3.40 2.81 3.06
Cost of living 3.15 3.10 3.36 2.94 3.44 3.59 3.42 3.23 3.17 2.97 2.93
Cost of study 3.15 3.20 3.10 3.13 3.42 3.23 3.49 2.61 3.24 3.05 2.55
Location 2.91 2.78 3.00 2.84 3.03 3.13 2.97 3.10 2.85 2.95 2.93
Opps for further study 2.90 3.07 3.07 2.67 3.11 3.04 3.20 2.67 2.99 2.37 2.73
Work opportunities 2.82 2.81 2.74 2.81 3.03 2.73 3.13 1.99 2.86 2.44 2.55
Social life 2.82 2.77 3.14 2.61 2.82 2.89 2.93 3.01 2.70 2.56 2.77
Visa process 2.79 2.77 3.43 2.68 3.24 3.45 3.00 3.39 2.68 2.71 2.26
Opps to work while studying 2.58 2.64 2.51 2.60 3.09 2.72 2.93 2.17 2.78 2.46 2.03
Permanent residence 2.41 2.47 2.65 2.49 2.66 2.26 2.46 1.90 2.37 2.27 2.29
Proximity to my home country 2.17 2.05 2.58 1.71 2.35 2.13 2.10 2.94 1.59 1.67 1.46
Teacher reputation 3.04 3.15 3.21 3.07 2.90 3.26 3.07 3.27 3.45 3.14 2.81
It becomes apparent at this generic level that the ranked order pattern indicates that research students from the top ten responding nationalities stress the importance of research-related reputational factors, placing these at the top of their lists. In contrast, issues such as proximity to home country, prospects of permanent residence and opportunities to work are generally less significant in decision-making than the more institutional level factors. Indeed, the rank order shows that for most of the top ten responding nationalities, proximity is the lowest consideration.
Of the second order factors, personal safety is a significant factor for students from China, Iraq, Nigeria, Saudi and Malaysia. Safety is the highest rated factor for Saudi students.
Of course, inevitably there are some considerable variations amongst nationalities also illustrated by these outcomes and some caution is required in interpreting these results. Nevertheless, reviewing these differences by nationality it is helpful in order to consider ranked differences, as well as mean score variances.
For instance, PGR students from Saudi Arabia, who are more likely to consider proximity to home as a factor in their decision-making, whereas work opportunities are more significant for students from Nigeria. Research students from Saudi Arabia place the opportunity for permanent residence at the bottom of their list.
Consider the field of study
When analysing decision factors by field of study, what is most startling is the consistency with which students across disciplines rate key decision factors. Across all fields of study, research quality of the university, as well as institutional and teacher reputation, rate most highly for international PGR students. Similarly – as was the case with data analysed by nationality – proximity, permanent residence and opportunities to work were rated and ranked lower.
Predictably, business students are more likely to rate earning potential and the cost of study more highly. More interestingly perhaps, research students in the field of education rate earning potential more highly than students in any other field of study. This is both logical and enlightening – that students of education might pursue the highest possible education qualification, in order to enhance their earning ability.
Table 29: IsB survey data – decision factors for PGR students in the UK by field of study, 2013–14
UK 2
014
engi
neer
ing
Biol
ogic
al s
cien
ces
Phys
ical
sci
ence
s
soci
al s
tudi
es
med
icin
e &
de
ntis
try
mat
hem
atic
s &
Co
mpu
ter s
cien
ces
Busin
ess
hist
oric
al &
Ph
ilosp
hica
l
Allie
d m
edic
ine
educ
atio
n
arch
itect
ure
&
Build
ing
lang
uage
s &
li
tera
ture
ling
uist
ics,
Cl
assi
cs
law
Crea
tive
arts
&
desi
gn
vet s
cien
ce,
agric
ultu
re &
rela
ted
Tech
nolo
gies
othe
r lan
guag
es &
li
tera
ture
Join
t hon
s &
m
ultip
le s
ubje
cts
mas
s Co
mm
s &
do
cum
enta
tion
Tour
ism
and
ho
spita
lity
Research quality 3.79 3.77 3.79 3.83 3.77 3.83 3.80 3.76 3.90 3.74 3.63 3.77 3.82 3.80 3.76 3.71 3.74 3.87 3.75 3.89 3.72 3.65
Institution reputation
3.57 3.53 3.59 3.52 3.64 3.61 3.56 3.60 3.58 3.64 3.70 3.54 3.64 3.60 3.45 3.41 3.60 3.55 3.57 3.81 3.32 3.35
Teacher reputation
3.47 3.40 3.41 3.47 3.52 3.52 3.53 3.52 3.60 3.42 3.52 3.48 3.34 3.62 3.34 3.50 3.31 3.49 3.54 3.74 3.48 3.25
University Scholarship/Bursary
3.38 3.43 3.40 3.47 3.36 3.45 3.43 3.23 3.34 3.40 3.12 3.26 3.24 3.40 3.12 3.45 3.32 3.38 3.40 3.42 3.20 3.37
Personal safety 3.28 3.41 3.26 3.24 2.96 3.33 3.30 3.52 2.99 3.37 3.55 3.45 3.05 3.28 3.08 3.04 3.35 3.55 3.00 3.11 3.46 3.10
Earning potential 3.23 3.33 3.24 3.17 3.08 3.30 3.23 3.37 2.84 3.34 3.38 3.35 3.06 3.25 3.08 3.00 3.32 3.27 3.30 2.77 3.13 3.06
Cost of living 3.15 3.19 3.12 3.06 3.12 3.18 3.10 3.25 3.10 3.19 3.19 3.30 3.05 3.11 3.12 3.21 3.12 3.14 2.96 3.22 3.20 3.11
Cost of study 3.15 3.18 3.17 3.07 3.16 3.08 3.07 3.24 3.18 3.09 3.04 3.13 3.18 3.14 2.99 3.29 3.23 3.13 3.04 3.29 3.16 3.25
Location 2.91 2.90 2.91 2.86 2.91 2.95 2.83 2.99 2.90 2.87 2.99 2.91 2.91 3.14 2.74 2.82 2.70 2.84 3.23 2.93 2.96 2.68
Opps for further study
2.90 3.03 2.87 2.85 2.79 2.94 2.77 2.96 2.85 2.81 2.85 3.01 3.04 3.08 2.64 2.85 2.92 3.11 3.13 2.92 2.96 2.83
Work opportunities
2.82 2.94 2.81 2.74 2.68 2.81 2.69 2.93 2.78 2.73 2.56 2.94 2.88 2.94 2.62 2.91 2.85 3.06 3.00 2.85 3.04 3.00
Social life 2.82 2.93 2.81 2.85 2.71 2.86 2.70 2.82 2.58 2.83 2.89 2.85 2.71 2.93 2.59 2.73 2.88 2.84 2.88 2.52 2.76 2.94
Visa process 2.79 2.91 2.72 2.65 2.63 2.78 2.81 2.88 2.63 2.96 3.04 3.08 2.39 2.80 2.55 2.53 2.92 2.74 2.82 2.40 2.95 3.07
Opps to work while studying
2.58 2.63 2.41 2.42 2.65 2.45 2.45 2.92 2.54 2.44 2.74 2.90 2.72 2.79 2.48 2.87 2.61 2.63 2.91 2.44 3.04 2.58
Permanent residence
2.41 2.54 2.31 2.35 2.19 2.32 2.38 2.65 2.38 2.38 2.28 2.54 2.49 2.54 2.27 2.48 2.47 2.56 2.57 2.36 2.65 2.50
Proximity to my home country
2.17 2.28 2.14 2.09 2.10 2.12 2.18 2.27 1.85 2.23 2.36 2.19 2.25 2.37 1.96 1.93 2.11 2.21 2.16 2.12 2.39 2.53
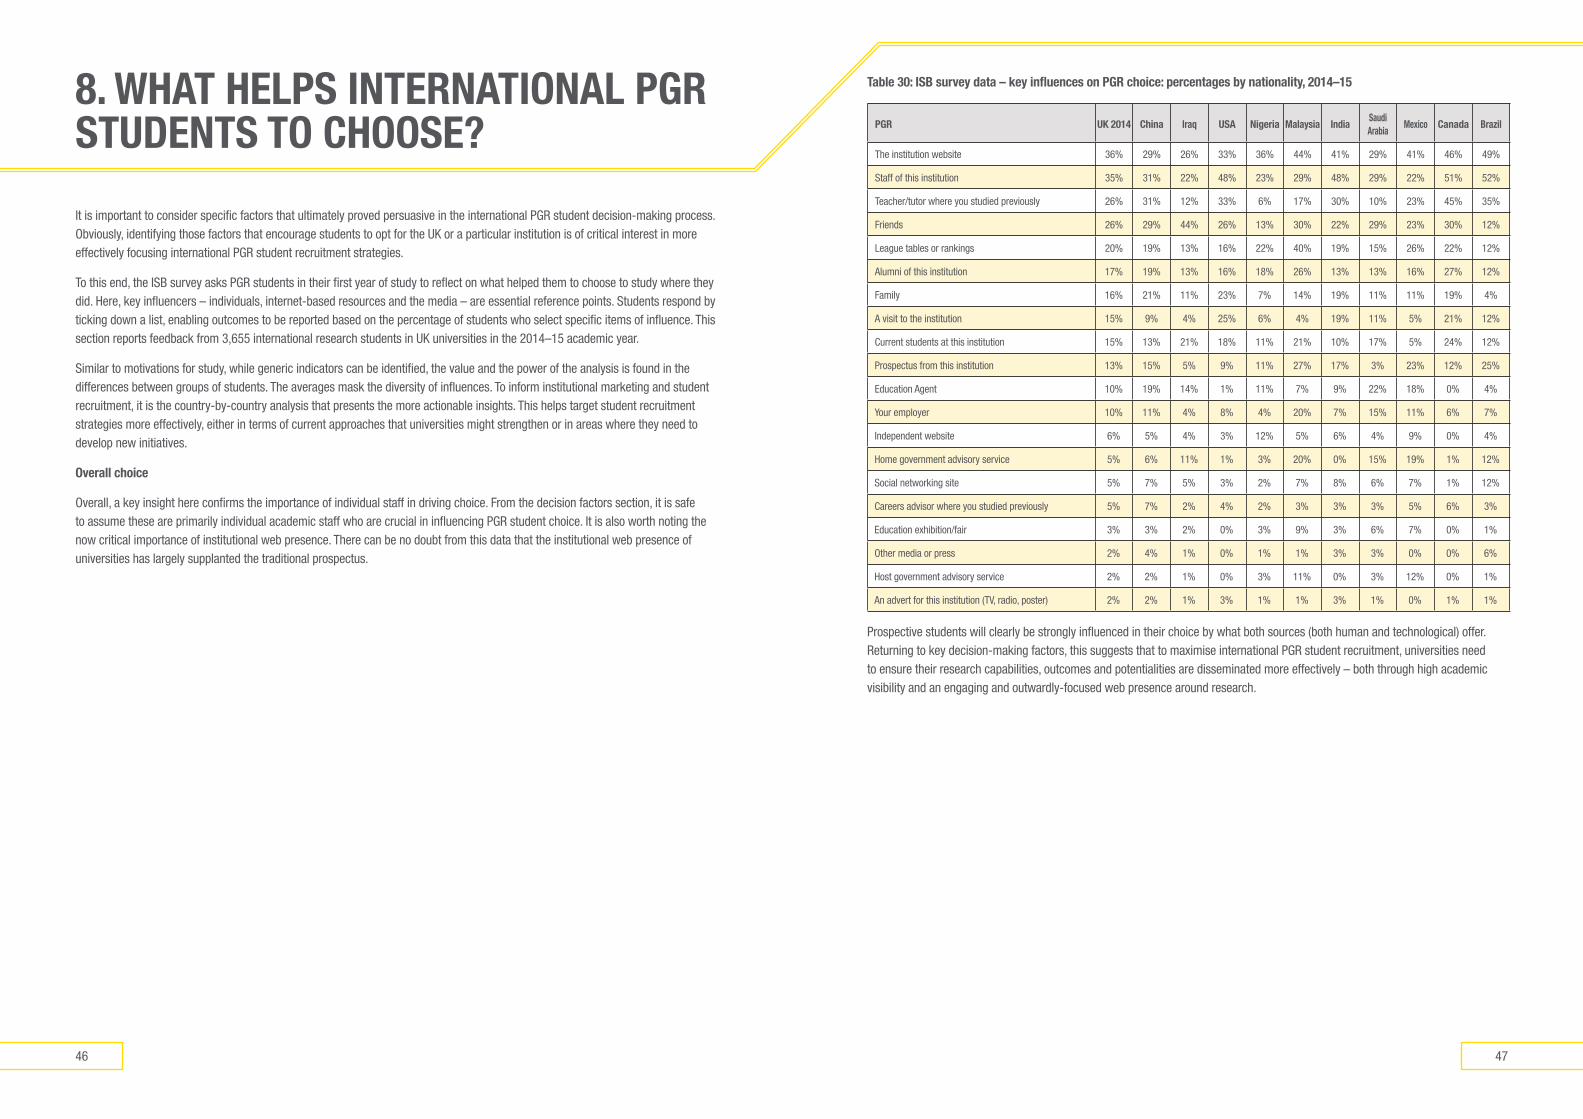
4746
Table 30: IsB survey data – key influences on PGR choice: percentages by nationality, 2014–15
PGR UK 2014 China Iraq UsA nigeria malaysia indiasaudi arabia
mexico Canada Brazil
The institution website 36% 29% 26% 33% 36% 44% 41% 29% 41% 46% 49%
Staff of this institution 35% 31% 22% 48% 23% 29% 48% 29% 22% 51% 52%
Teacher/tutor where you studied previously 26% 31% 12% 33% 6% 17% 30% 10% 23% 45% 35%
Friends 26% 29% 44% 26% 13% 30% 22% 29% 23% 30% 12%
League tables or rankings 20% 19% 13% 16% 22% 40% 19% 15% 26% 22% 12%
Alumni of this institution 17% 19% 13% 16% 18% 26% 13% 13% 16% 27% 12%
Family 16% 21% 11% 23% 7% 14% 19% 11% 11% 19% 4%
A visit to the institution 15% 9% 4% 25% 6% 4% 19% 11% 5% 21% 12%
Current students at this institution 15% 13% 21% 18% 11% 21% 10% 17% 5% 24% 12%
Prospectus from this institution 13% 15% 5% 9% 11% 27% 17% 3% 23% 12% 25%
Education Agent 10% 19% 14% 1% 11% 7% 9% 22% 18% 0% 4%
Your employer 10% 11% 4% 8% 4% 20% 7% 15% 11% 6% 7%
Independent website 6% 5% 4% 3% 12% 5% 6% 4% 9% 0% 4%
Home government advisory service 5% 6% 11% 1% 3% 20% 0% 15% 19% 1% 12%
Social networking site 5% 7% 5% 3% 2% 7% 8% 6% 7% 1% 12%
Careers advisor where you studied previously 5% 7% 2% 4% 2% 3% 3% 3% 5% 6% 3%
Education exhibition/fair 3% 3% 2% 0% 3% 9% 3% 6% 7% 0% 1%
Other media or press 2% 4% 1% 0% 1% 1% 3% 3% 0% 0% 6%
Host government advisory service 2% 2% 1% 0% 3% 11% 0% 3% 12% 0% 1%
An advert for this institution (TV, radio, poster) 2% 2% 1% 3% 1% 1% 3% 1% 0% 1% 1%
Prospective students will clearly be strongly influenced in their choice by what both sources (both human and technological) offer. Returning to key decision-making factors, this suggests that to maximise international PGR student recruitment, universities need to ensure their research capabilities, outcomes and potentialities are disseminated more effectively – both through high academic visibility and an engaging and outwardly-focused web presence around research.
It is important to consider specific factors that ultimately proved persuasive in the international PGR student decision-making process. Obviously, identifying those factors that encourage students to opt for the UK or a particular institution is of critical interest in more effectively focusing international PGR student recruitment strategies.
To this end, the ISB survey asks PGR students in their first year of study to reflect on what helped them to choose to study where they did. Here, key influencers – individuals, internet-based resources and the media – are essential reference points. Students respond by ticking down a list, enabling outcomes to be reported based on the percentage of students who select specific items of influence. This section reports feedback from 3,655 international research students in UK universities in the 2014–15 academic year.
Similar to motivations for study, while generic indicators can be identified, the value and the power of the analysis is found in the differences between groups of students. The averages mask the diversity of influences. To inform institutional marketing and student recruitment, it is the country-by-country analysis that presents the more actionable insights. This helps target student recruitment strategies more effectively, either in terms of current approaches that universities might strengthen or in areas where they need to develop new initiatives.
overall choice
Overall, a key insight here confirms the importance of individual staff in driving choice. From the decision factors section, it is safe to assume these are primarily individual academic staff who are crucial in influencing PGR student choice. It is also worth noting the now critical importance of institutional web presence. There can be no doubt from this data that the institutional web presence of universities has largely supplanted the traditional prospectus.
8. WhaT helPs InTeRnaTIonal PGR sTUdenTs To Choose?
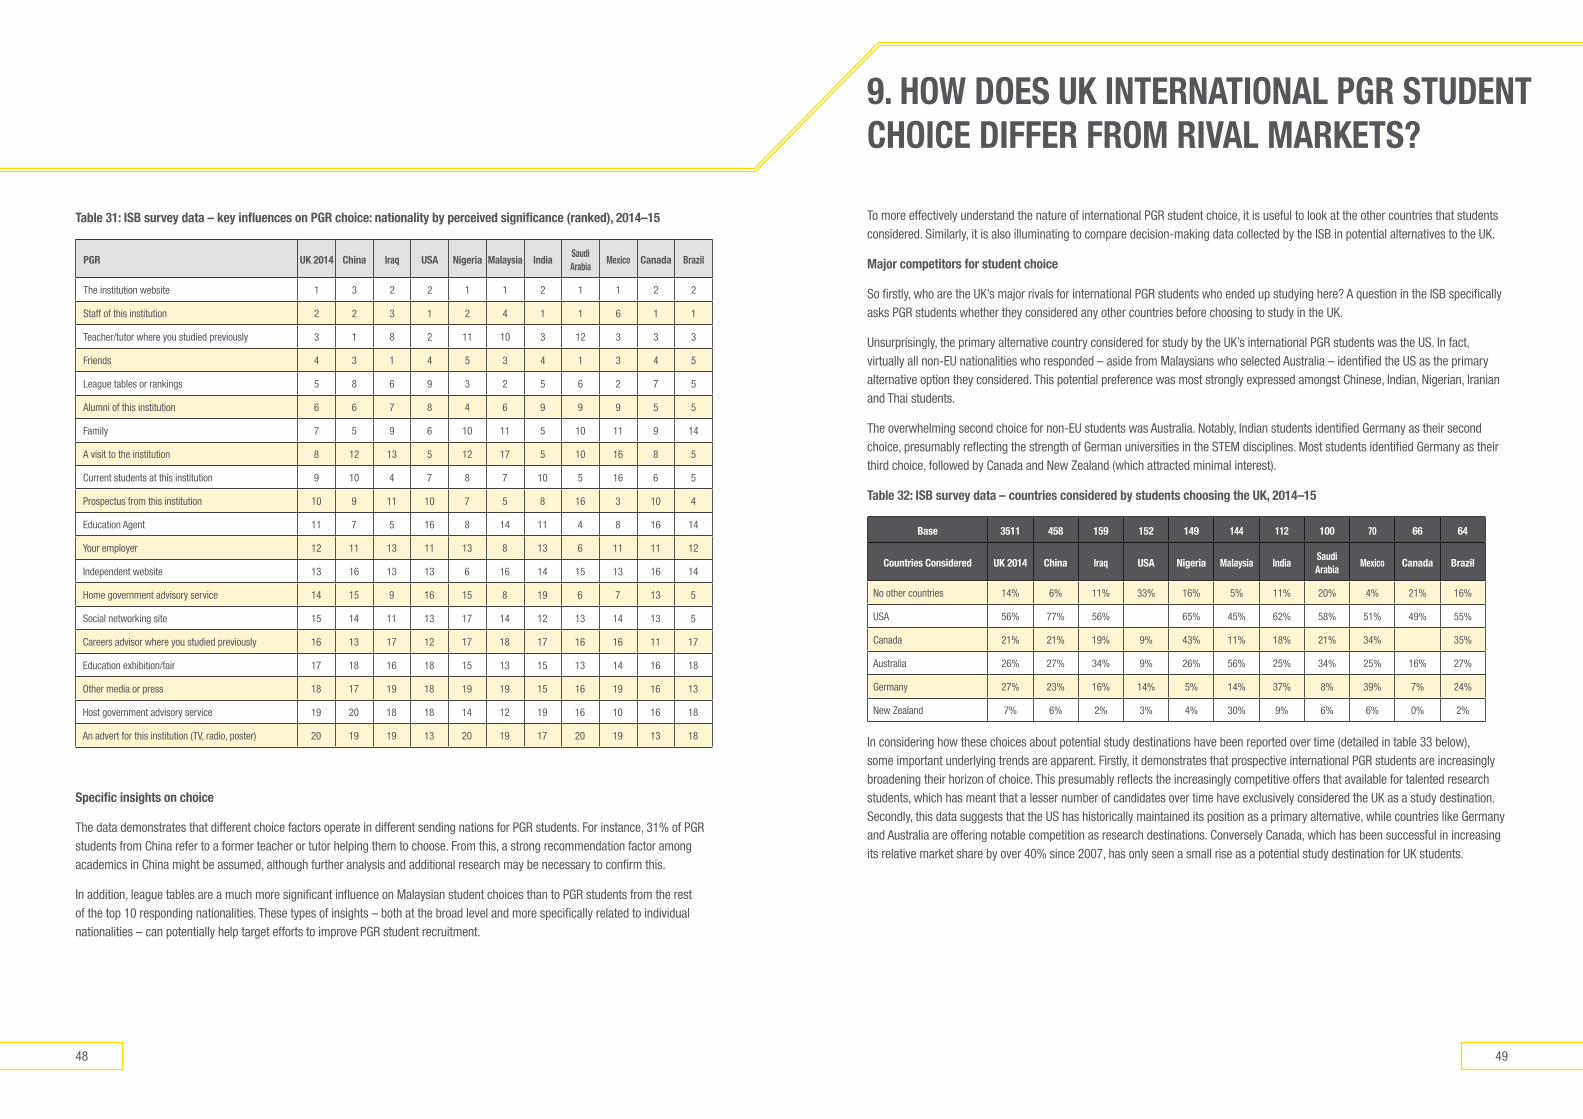
4948
To more effectively understand the nature of international PGR student choice, it is useful to look at the other countries that students considered. Similarly, it is also illuminating to compare decision-making data collected by the ISB in potential alternatives to the UK.
major competitors for student choice
So firstly, who are the UK’s major rivals for international PGR students who ended up studying here? A question in the ISB specifically asks PGR students whether they considered any other countries before choosing to study in the UK.
Unsurprisingly, the primary alternative country considered for study by the UK’s international PGR students was the US. In fact, virtually all non-EU nationalities who responded – aside from Malaysians who selected Australia – identified the US as the primary alternative option they considered. This potential preference was most strongly expressed amongst Chinese, Indian, Nigerian, Iranian and Thai students.
The overwhelming second choice for non-EU students was Australia. Notably, Indian students identified Germany as their second choice, presumably reflecting the strength of German universities in the STEM disciplines. Most students identified Germany as their third choice, followed by Canada and New Zealand (which attracted minimal interest).
Table 32: IsB survey data – countries considered by students choosing the UK, 2014–15
Base 3511 458 159 152 149 144 112 100 70 66 64
Countries Considered UK 2014 China Iraq UsA nigeria malaysia indiasaudi arabia
mexico Canada Brazil
No other countries 14% 6% 11% 33% 16% 5% 11% 20% 4% 21% 16%
USA 56% 77% 56% 65% 45% 62% 58% 51% 49% 55%
Canada 21% 21% 19% 9% 43% 11% 18% 21% 34% 35%
Australia 26% 27% 34% 9% 26% 56% 25% 34% 25% 16% 27%
Germany 27% 23% 16% 14% 5% 14% 37% 8% 39% 7% 24%
New Zealand 7% 6% 2% 3% 4% 30% 9% 6% 6% 0% 2%
In considering how these choices about potential study destinations have been reported over time (detailed in table 33 below), some important underlying trends are apparent. Firstly, it demonstrates that prospective international PGR students are increasingly broadening their horizon of choice. This presumably reflects the increasingly competitive offers that available for talented research students, which has meant that a lesser number of candidates over time have exclusively considered the UK as a study destination. Secondly, this data suggests that the US has historically maintained its position as a primary alternative, while countries like Germany and Australia are offering notable competition as research destinations. Conversely Canada, which has been successful in increasing its relative market share by over 40% since 2007, has only seen a small rise as a potential study destination for UK students.
Table 31: IsB survey data – key influences on PGR choice: nationality by perceived significance (ranked), 2014–15
PGR UK 2014 China Iraq UsA nigeria malaysia indiasaudi arabia
mexico Canada Brazil
The institution website 1 3 2 2 1 1 2 1 1 2 2
Staff of this institution 2 2 3 1 2 4 1 1 6 1 1
Teacher/tutor where you studied previously 3 1 8 2 11 10 3 12 3 3 3
Friends 4 3 1 4 5 3 4 1 3 4 5
League tables or rankings 5 8 6 9 3 2 5 6 2 7 5
Alumni of this institution 6 6 7 8 4 6 9 9 9 5 5
Family 7 5 9 6 10 11 5 10 11 9 14
A visit to the institution 8 12 13 5 12 17 5 10 16 8 5
Current students at this institution 9 10 4 7 8 7 10 5 16 6 5
Prospectus from this institution 10 9 11 10 7 5 8 16 3 10 4
Education Agent 11 7 5 16 8 14 11 4 8 16 14
Your employer 12 11 13 11 13 8 13 6 11 11 12
Independent website 13 16 13 13 6 16 14 15 13 16 14
Home government advisory service 14 15 9 16 15 8 19 6 7 13 5
Social networking site 15 14 11 13 17 14 12 13 14 13 5
Careers advisor where you studied previously 16 13 17 12 17 18 17 16 16 11 17
Education exhibition/fair 17 18 16 18 15 13 15 13 14 16 18
Other media or press 18 17 19 18 19 19 15 16 19 16 13
Host government advisory service 19 20 18 18 14 12 19 16 10 16 18
An advert for this institution (TV, radio, poster) 20 19 19 13 20 19 17 20 19 13 18
specific insights on choice
The data demonstrates that different choice factors operate in different sending nations for PGR students. For instance, 31% of PGR students from China refer to a former teacher or tutor helping them to choose. From this, a strong recommendation factor among academics in China might be assumed, although further analysis and additional research may be necessary to confirm this.
In addition, league tables are a much more significant influence on Malaysian student choices than to PGR students from the rest of the top 10 responding nationalities. These types of insights – both at the broad level and more specifically related to individual nationalities – can potentially help target efforts to improve PGR student recruitment.
9. hoW does UK InTeRnaTIonal PGR sTUdenT ChoICe dIFFeR FRom RIval maRKeTs?
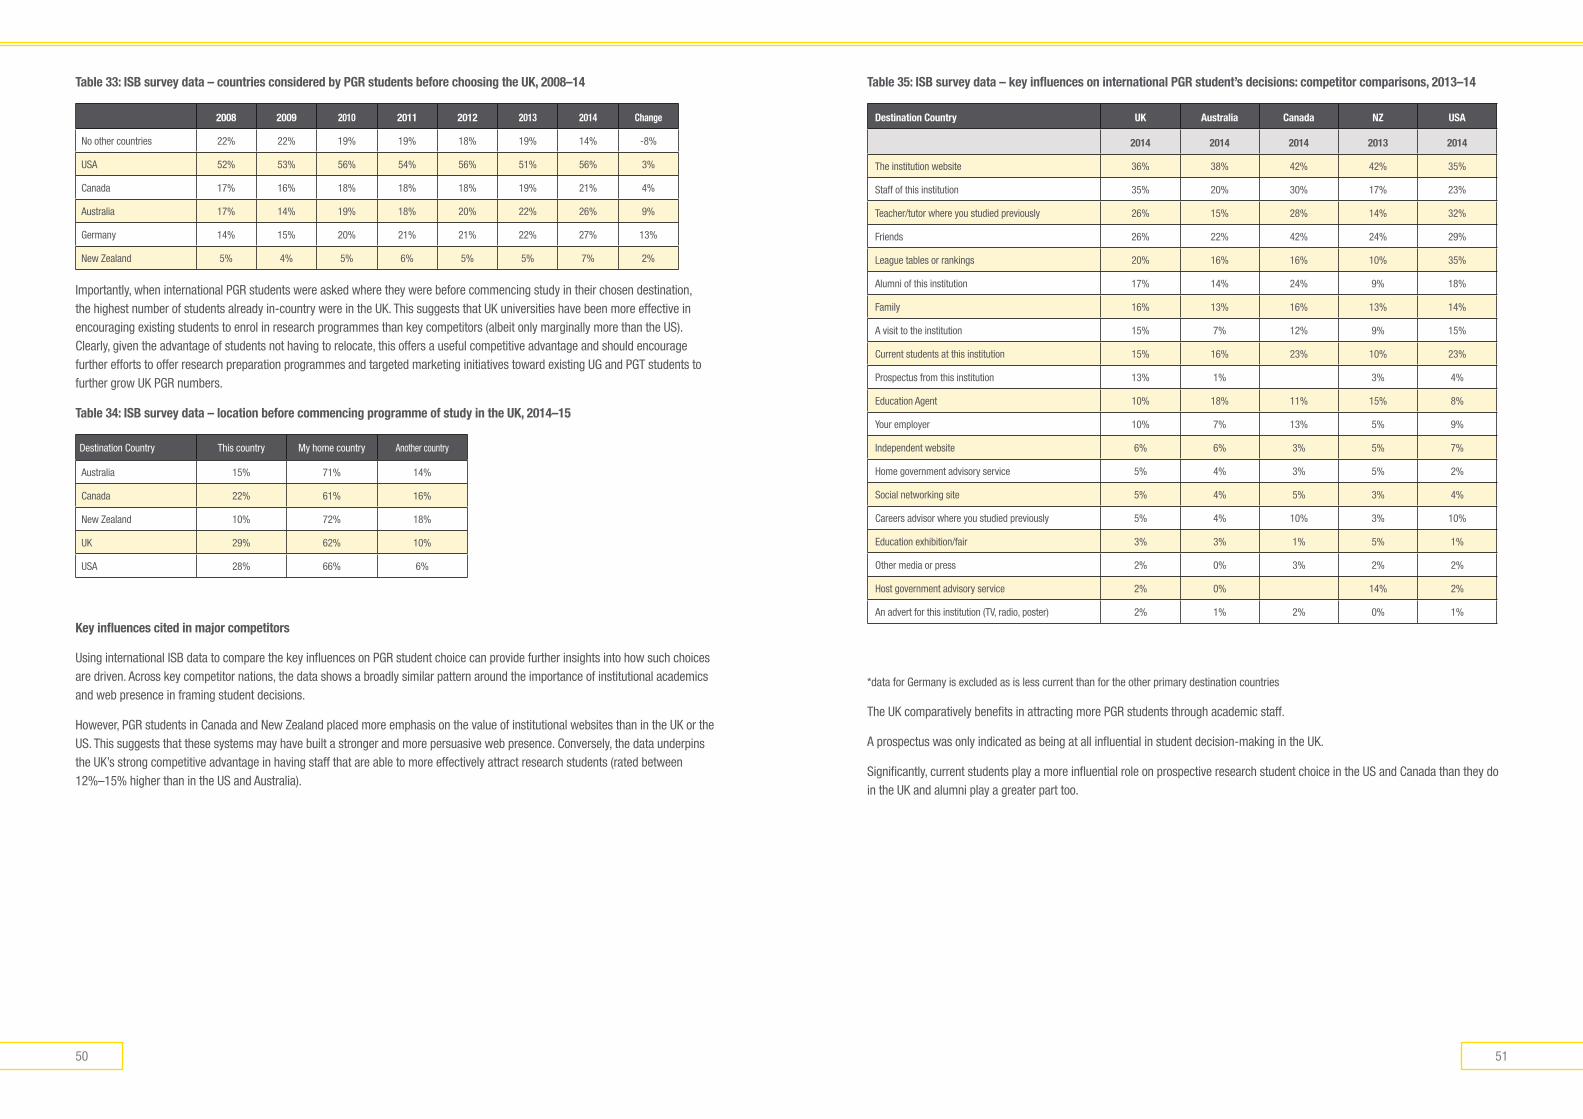
5150
Table 33: IsB survey data – countries considered by PGR students before choosing the UK, 2008–14
2008 2009 2010 2011 2012 2013 2014 Change
No other countries 22% 22% 19% 19% 18% 19% 14% -8%
USA 52% 53% 56% 54% 56% 51% 56% 3%
Canada 17% 16% 18% 18% 18% 19% 21% 4%
Australia 17% 14% 19% 18% 20% 22% 26% 9%
Germany 14% 15% 20% 21% 21% 22% 27% 13%
New Zealand 5% 4% 5% 6% 5% 5% 7% 2%
Importantly, when international PGR students were asked where they were before commencing study in their chosen destination, the highest number of students already in-country were in the UK. This suggests that UK universities have been more effective in encouraging existing students to enrol in research programmes than key competitors (albeit only marginally more than the US). Clearly, given the advantage of students not having to relocate, this offers a useful competitive advantage and should encourage further efforts to offer research preparation programmes and targeted marketing initiatives toward existing UG and PGT students to further grow UK PGR numbers.
Table 34: IsB survey data – location before commencing programme of study in the UK, 2014–15
Destination Country This country My home country Another country
Australia 15% 71% 14%
Canada 22% 61% 16%
New Zealand 10% 72% 18%
UK 29% 62% 10%
USA 28% 66% 6%
Key influences cited in major competitors
Using international ISB data to compare the key influences on PGR student choice can provide further insights into how such choices are driven. Across key competitor nations, the data shows a broadly similar pattern around the importance of institutional academics and web presence in framing student decisions.
However, PGR students in Canada and New Zealand placed more emphasis on the value of institutional websites than in the UK or the US. This suggests that these systems may have built a stronger and more persuasive web presence. Conversely, the data underpins the UK’s strong competitive advantage in having staff that are able to more effectively attract research students (rated between 12%–15% higher than in the US and Australia).
Table 35: IsB survey data – key influences on international PGR student’s decisions: competitor comparisons, 2013–14
destination Country UK australia Canada nZ UsA
2014 2014 2014 2013 2014
The institution website 36% 38% 42% 42% 35%
Staff of this institution 35% 20% 30% 17% 23%
Teacher/tutor where you studied previously 26% 15% 28% 14% 32%
Friends 26% 22% 42% 24% 29%
League tables or rankings 20% 16% 16% 10% 35%
Alumni of this institution 17% 14% 24% 9% 18%
Family 16% 13% 16% 13% 14%
A visit to the institution 15% 7% 12% 9% 15%
Current students at this institution 15% 16% 23% 10% 23%
Prospectus from this institution 13% 1% 3% 4%
Education Agent 10% 18% 11% 15% 8%
Your employer 10% 7% 13% 5% 9%
Independent website 6% 6% 3% 5% 7%
Home government advisory service 5% 4% 3% 5% 2%
Social networking site 5% 4% 5% 3% 4%
Careers advisor where you studied previously 5% 4% 10% 3% 10%
Education exhibition/fair 3% 3% 1% 5% 1%
Other media or press 2% 0% 3% 2% 2%
Host government advisory service 2% 0% 14% 2%
An advert for this institution (TV, radio, poster) 2% 1% 2% 0% 1%
*data for Germany is excluded as is less current than for the other primary destination countries
The UK comparatively benefits in attracting more PGR students through academic staff.
A prospectus was only indicated as being at all influential in student decision-making in the UK.
Significantly, current students play a more influential role on prospective research student choice in the US and Canada than they do in the UK and alumni play a greater part too.
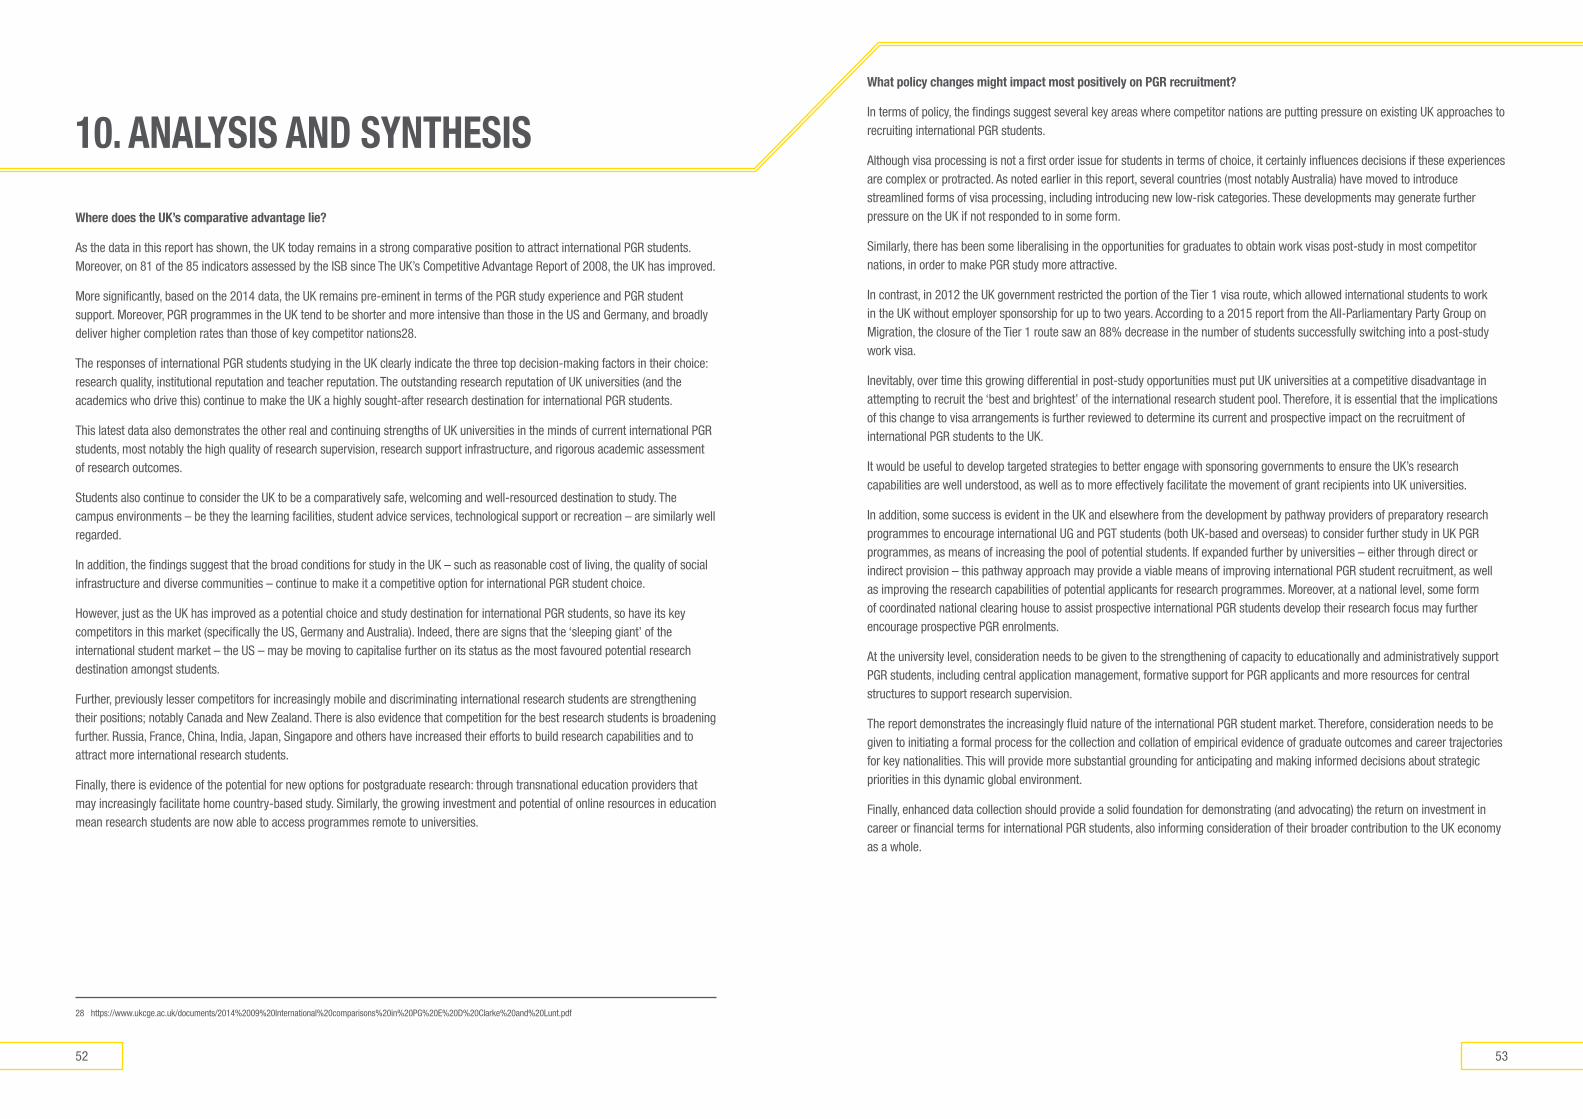
5352
What policy changes might impact most positively on PGR recruitment?
In terms of policy, the findings suggest several key areas where competitor nations are putting pressure on existing UK approaches to recruiting international PGR students.
Although visa processing is not a first order issue for students in terms of choice, it certainly influences decisions if these experiences are complex or protracted. As noted earlier in this report, several countries (most notably Australia) have moved to introduce streamlined forms of visa processing, including introducing new low-risk categories. These developments may generate further pressure on the UK if not responded to in some form.
Similarly, there has been some liberalising in the opportunities for graduates to obtain work visas post-study in most competitor nations, in order to make PGR study more attractive.
In contrast, in 2012 the UK government restricted the portion of the Tier 1 visa route, which allowed international students to work in the UK without employer sponsorship for up to two years. According to a 2015 report from the All-Parliamentary Party Group on Migration, the closure of the Tier 1 route saw an 88% decrease in the number of students successfully switching into a post-study work visa.
Inevitably, over time this growing differential in post-study opportunities must put UK universities at a competitive disadvantage in attempting to recruit the ‘best and brightest’ of the international research student pool. Therefore, it is essential that the implications of this change to visa arrangements is further reviewed to determine its current and prospective impact on the recruitment of international PGR students to the UK.
It would be useful to develop targeted strategies to better engage with sponsoring governments to ensure the UK’s research capabilities are well understood, as well as to more effectively facilitate the movement of grant recipients into UK universities.
In addition, some success is evident in the UK and elsewhere from the development by pathway providers of preparatory research programmes to encourage international UG and PGT students (both UK-based and overseas) to consider further study in UK PGR programmes, as means of increasing the pool of potential students. If expanded further by universities – either through direct or indirect provision – this pathway approach may provide a viable means of improving international PGR student recruitment, as well as improving the research capabilities of potential applicants for research programmes. Moreover, at a national level, some form of coordinated national clearing house to assist prospective international PGR students develop their research focus may further encourage prospective PGR enrolments.
At the university level, consideration needs to be given to the strengthening of capacity to educationally and administratively support PGR students, including central application management, formative support for PGR applicants and more resources for central structures to support research supervision.
The report demonstrates the increasingly fluid nature of the international PGR student market. Therefore, consideration needs to be given to initiating a formal process for the collection and collation of empirical evidence of graduate outcomes and career trajectories for key nationalities. This will provide more substantial grounding for anticipating and making informed decisions about strategic priorities in this dynamic global environment.
Finally, enhanced data collection should provide a solid foundation for demonstrating (and advocating) the return on investment in career or financial terms for international PGR students, also informing consideration of their broader contribution to the UK economy as a whole.
Where does the UK’s comparative advantage lie?
As the data in this report has shown, the UK today remains in a strong comparative position to attract international PGR students. Moreover, on 81 of the 85 indicators assessed by the ISB since The UK’s Competitive Advantage Report of 2008, the UK has improved.
More significantly, based on the 2014 data, the UK remains pre-eminent in terms of the PGR study experience and PGR student support. Moreover, PGR programmes in the UK tend to be shorter and more intensive than those in the US and Germany, and broadly deliver higher completion rates than those of key competitor nations28.
The responses of international PGR students studying in the UK clearly indicate the three top decision-making factors in their choice: research quality, institutional reputation and teacher reputation. The outstanding research reputation of UK universities (and the academics who drive this) continue to make the UK a highly sought-after research destination for international PGR students.
This latest data also demonstrates the other real and continuing strengths of UK universities in the minds of current international PGR students, most notably the high quality of research supervision, research support infrastructure, and rigorous academic assessment of research outcomes.
Students also continue to consider the UK to be a comparatively safe, welcoming and well-resourced destination to study. The campus environments – be they the learning facilities, student advice services, technological support or recreation – are similarly well regarded.
In addition, the findings suggest that the broad conditions for study in the UK – such as reasonable cost of living, the quality of social infrastructure and diverse communities – continue to make it a competitive option for international PGR student choice.
However, just as the UK has improved as a potential choice and study destination for international PGR students, so have its key competitors in this market (specifically the US, Germany and Australia). Indeed, there are signs that the ‘sleeping giant’ of the international student market – the US – may be moving to capitalise further on its status as the most favoured potential research destination amongst students.
Further, previously lesser competitors for increasingly mobile and discriminating international research students are strengthening their positions; notably Canada and New Zealand. There is also evidence that competition for the best research students is broadening further. Russia, France, China, India, Japan, Singapore and others have increased their efforts to build research capabilities and to attract more international research students.
Finally, there is evidence of the potential for new options for postgraduate research: through transnational education providers that may increasingly facilitate home country-based study. Similarly, the growing investment and potential of online resources in education mean research students are now able to access programmes remote to universities.
28 https://www.ukcge.ac.uk/documents/2014%2009%20International%20comparisons%20in%20PG%20E%20D%20Clarke%20and%20Lunt.pdf
10. analysIs and synThesIs
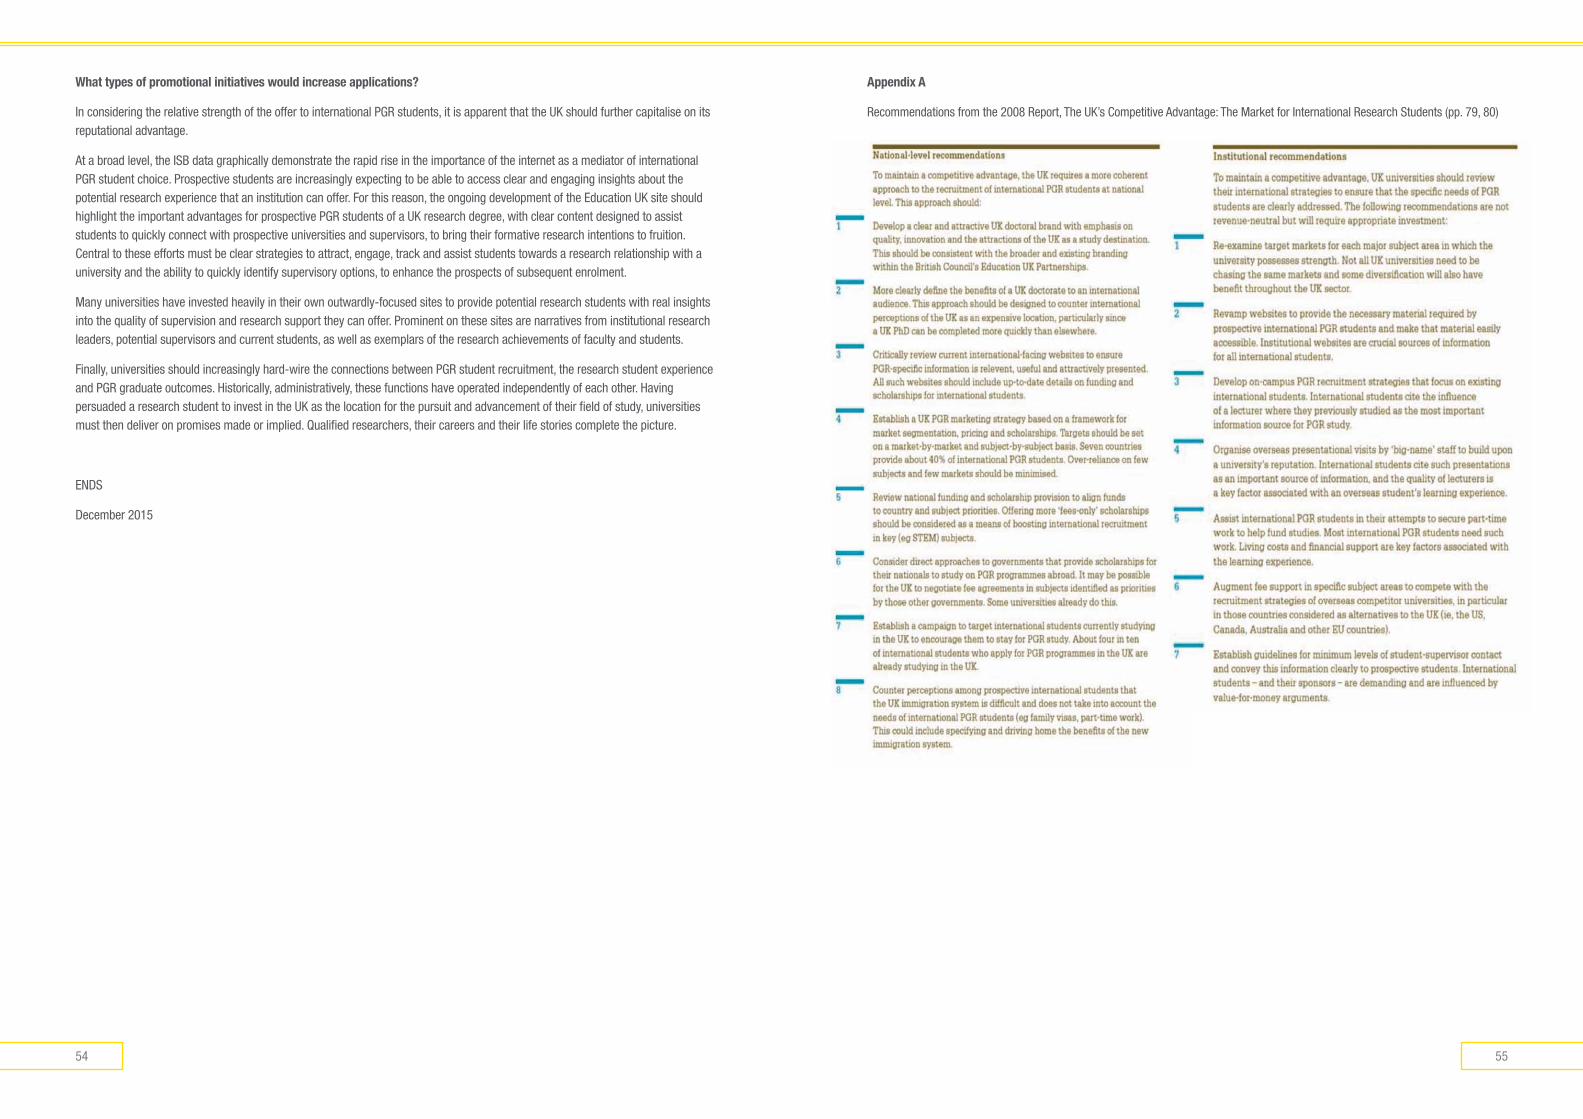
5554
appendix a
Recommendations from the 2008 Report, The UK’s Competitive Advantage: The Market for International Research Students (pp. 79, 80)
What types of promotional initiatives would increase applications?
In considering the relative strength of the offer to international PGR students, it is apparent that the UK should further capitalise on its reputational advantage.
At a broad level, the ISB data graphically demonstrate the rapid rise in the importance of the internet as a mediator of international PGR student choice. Prospective students are increasingly expecting to be able to access clear and engaging insights about the potential research experience that an institution can offer. For this reason, the ongoing development of the Education UK site should highlight the important advantages for prospective PGR students of a UK research degree, with clear content designed to assist students to quickly connect with prospective universities and supervisors, to bring their formative research intentions to fruition. Central to these efforts must be clear strategies to attract, engage, track and assist students towards a research relationship with a university and the ability to quickly identify supervisory options, to enhance the prospects of subsequent enrolment.
Many universities have invested heavily in their own outwardly-focused sites to provide potential research students with real insights into the quality of supervision and research support they can offer. Prominent on these sites are narratives from institutional research leaders, potential supervisors and current students, as well as exemplars of the research achievements of faculty and students.
Finally, universities should increasingly hard-wire the connections between PGR student recruitment, the research student experience and PGR graduate outcomes. Historically, administratively, these functions have operated independently of each other. Having persuaded a research student to invest in the UK as the location for the pursuit and advancement of their field of study, universities must then deliver on promises made or implied. Qualified researchers, their careers and their life stories complete the picture.
ENDS
December 2015
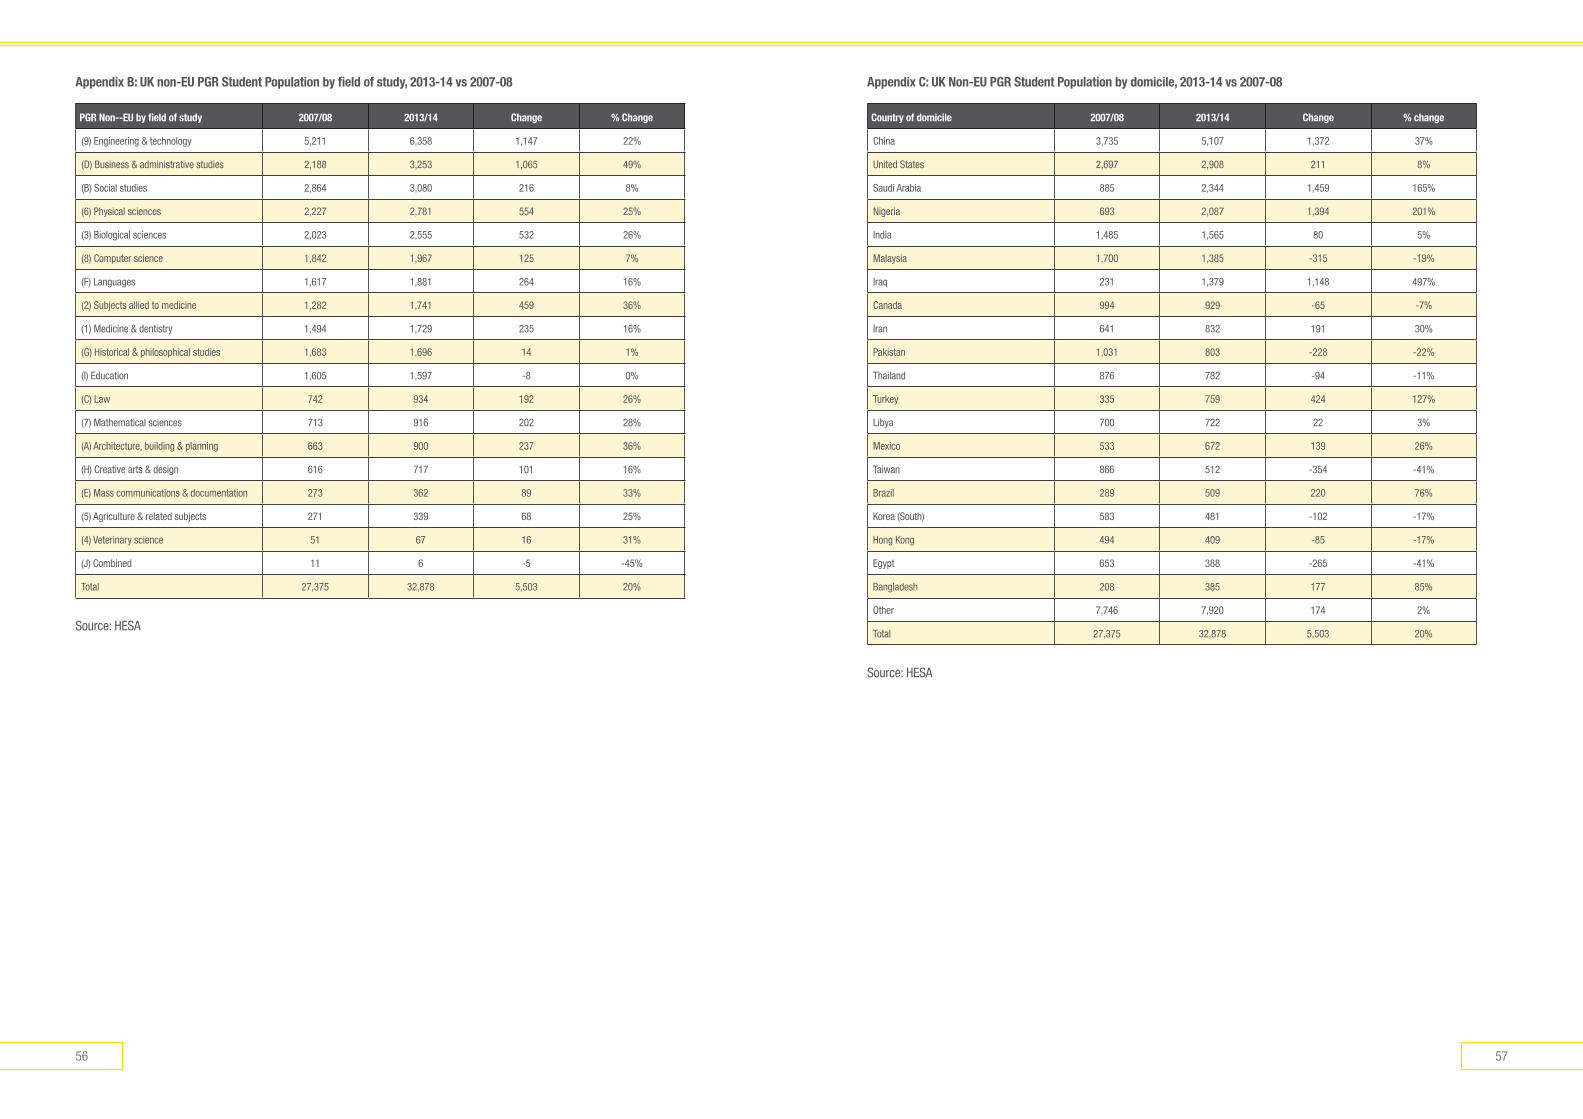
5756
appendix C: UK non-eU PGR student Population by domicile, 2013-14 vs 2007-08
Country of domicile 2007/08 2013/14 Change % change
China 3,735 5,107 1,372 37%
United States 2,697 2,908 211 8%
Saudi Arabia 885 2,344 1,459 165%
Nigeria 693 2,087 1,394 201%
India 1,485 1,565 80 5%
Malaysia 1,700 1,385 -315 -19%
Iraq 231 1,379 1,148 497%
Canada 994 929 -65 -7%
Iran 641 832 191 30%
Pakistan 1,031 803 -228 -22%
Thailand 876 782 -94 -11%
Turkey 335 759 424 127%
Libya 700 722 22 3%
Mexico 533 672 139 26%
Taiwan 866 512 -354 -41%
Brazil 289 509 220 76%
Korea (South) 583 481 -102 -17%
Hong Kong 494 409 -85 -17%
Egypt 653 388 -265 -41%
Bangladesh 208 385 177 85%
Other 7,746 7,920 174 2%
Total 27,375 32,878 5,503 20%
Source: HESA
appendix B: UK non-eU PGR student Population by field of study, 2013-14 vs 2007-08
PGR non--eU by field of study 2007/08 2013/14 Change % Change
(9) Engineering & technology 5,211 6,358 1,147 22%
(D) Business & administrative studies 2,188 3,253 1,065 49%
(B) Social studies 2,864 3,080 216 8%
(6) Physical sciences 2,227 2,781 554 25%
(3) Biological sciences 2,023 2,555 532 26%
(8) Computer science 1,842 1,967 125 7%
(F) Languages 1,617 1,881 264 16%
(2) Subjects allied to medicine 1,282 1,741 459 36%
(1) Medicine & dentistry 1,494 1,729 235 16%
(G) Historical & philosophical studies 1,683 1,696 14 1%
(I) Education 1,605 1,597 -8 0%
(C) Law 742 934 192 26%
(7) Mathematical sciences 713 916 202 28%
(A) Architecture, building & planning 663 900 237 36%
(H) Creative arts & design 616 717 101 16%
(E) Mass communications & documentation 273 362 89 33%
(5) Agriculture & related subjects 271 339 68 25%
(4) Veterinary science 51 67 16 31%
(J) Combined 11 6 -5 -45%
Total 27,375 32,878 5,503 20%
Source: HESA
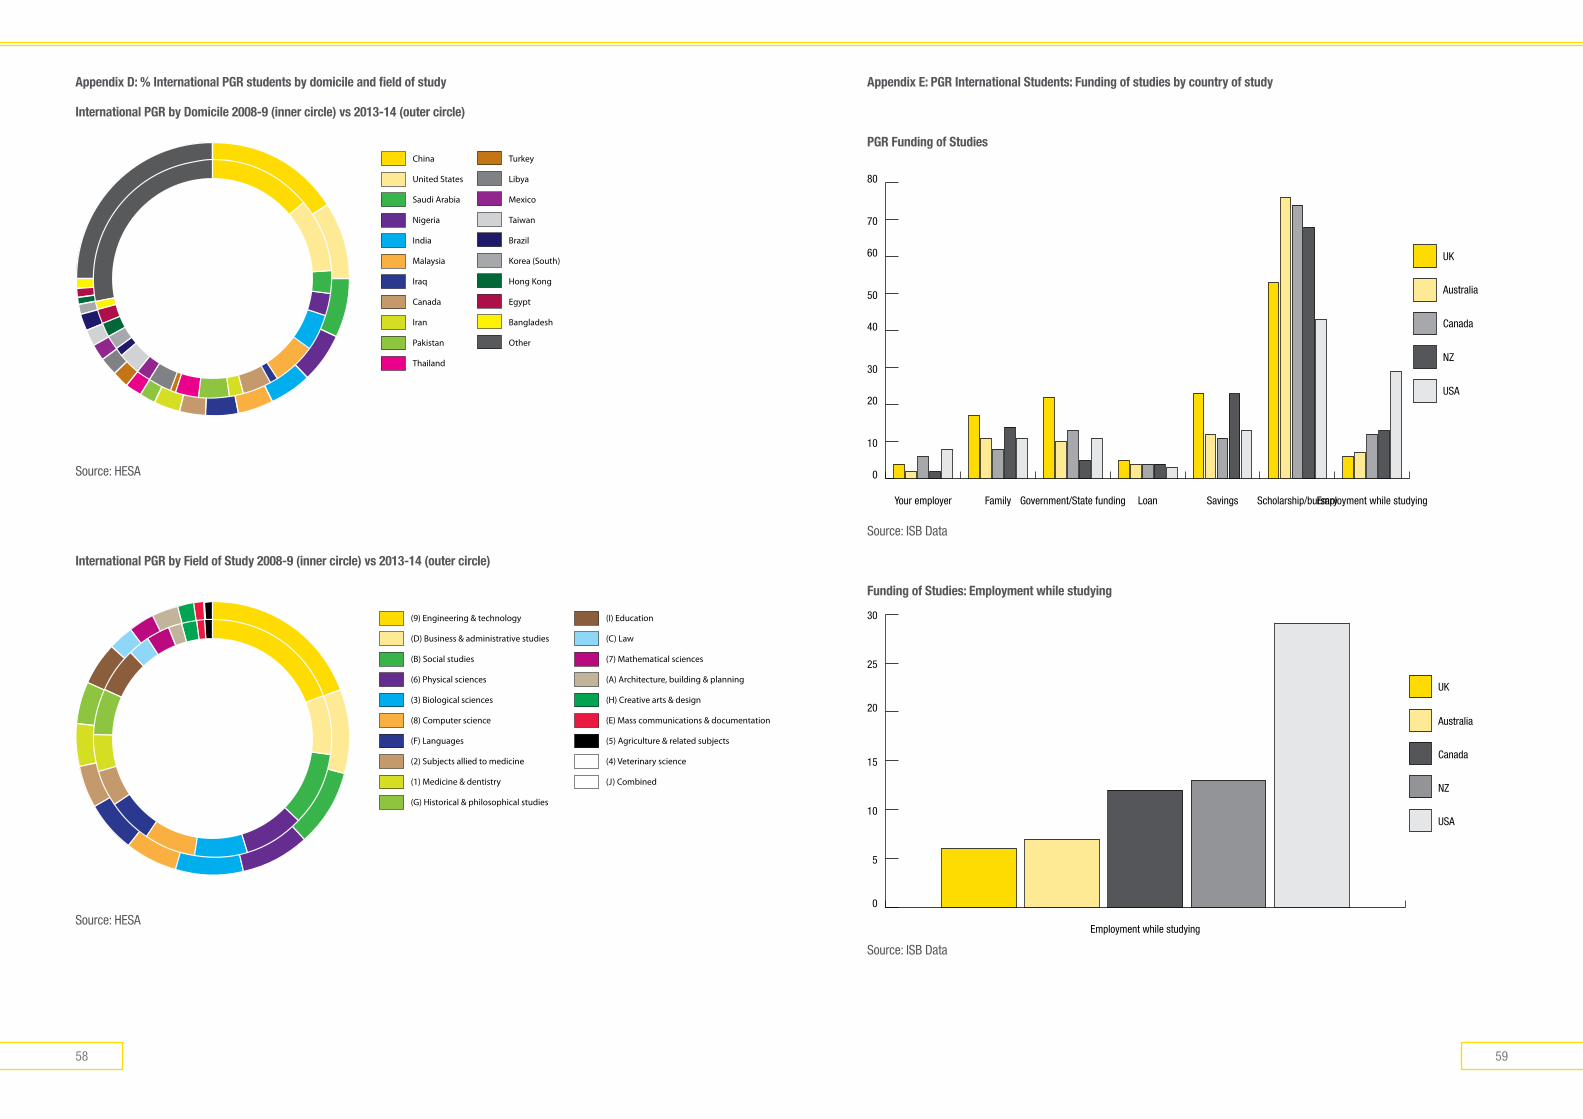
5958
appendix e: PGR International students: Funding of studies by country of study
PGR Funding of studies
0
10
20
30
40
50
60
70
80
Employment while studyingScholarship/bursarySavingsLoanGovernment/State fundingFamilyYour employer
Australia
Canada
UK
NZ
USA
Source: ISB Data
Funding of studies: employment while studying
0
5
10
15
20
25
30
Employment while studying
Australia
Canada
UK
NZ
USA
Source: ISB Data
appendix d: % International PGR students by domicile and field of study
International PGR by domicile 2008-9 (inner circle) vs 2013-14 (outer circle)
China
United States
Saudi Arabia
Nigeria
India
Malaysia
Iraq
Canada
Iran
Pakistan
Thailand
Turkey
Libya
Mexico
Taiwan
Brazil
Korea (South)
Hong Kong
Egypt
Bangladesh
Other
Source: HESA
International PGR by Field of study 2008-9 (inner circle) vs 2013-14 (outer circle)
(9) Engineering & technology
(D) Business & administrative studies
(B) Social studies
(6) Physical sciences
(3) Biological sciences
(8) Computer science
(F) Languages
(2) Subjects allied to medicine
(1) Medicine & dentistry
(G) Historical & philosophical studies
(I) Education
(C) Law
(7) Mathematical sciences
(A) Architecture, building & planning
(H) Creative arts & design
(E) Mass communications & documentation
(5) Agriculture & related subjects
(4) Veterinary science
(J) Combined
Source: HESA
december 2015
© Unauthorised copying of this document is not permitted. If you wish to copy this document please contact the UK HE International Unit for approval. While every effort has been made to ensure the accuracy and completeness of the material in this Annual Report, the authors and the UK Higher Education International Unit give no warranty in that regard and accept no liability for any loss of damage incurred through the use of, or reliance upon, this report or the information contained herein.
ISBN number: 978-1-84036-359-3
The UK he International UnitWoburn House 20 Tavistock Square London WC1H 9HQ
+44(0)20 7419 5421
www.international.ac.uk
@internationalUt