Embed Size (px)
Citation preview
International Osoyoos Lake Board of Control
2015 Annual Report to the
International Joint Commission

ii
Cover: Northern extent of Osoyoos Lake, where the Okanagan River enters the lake, 2015. View is to the east. Photograph by Alison Thorpe.

iii
TABLE OF CONTENTS
ACTIVITIES OF THE BOARD IN 2015 ............................................................................... 3
HYDROLOGIC CONDITIONS IN 2015 ............................................................................... 4
Drought Criteria ........................................................................................................ 4
Unusual Hydrologic Conditions in the Basin ................................................................... 5
Osoyoos Lake Levels ................................................................................................ 11
River Discharges ...................................................................................................... 13
APPENDIX: OSOYOOS LAKE LEVELS, INFLOWS, AND OUTFLOWS IN 2015 ......................... 15

iv
This page left intentionally blank.
1
International Osoyoos Lake Board of Control
2015 Annual Report to the
International Joint Commission
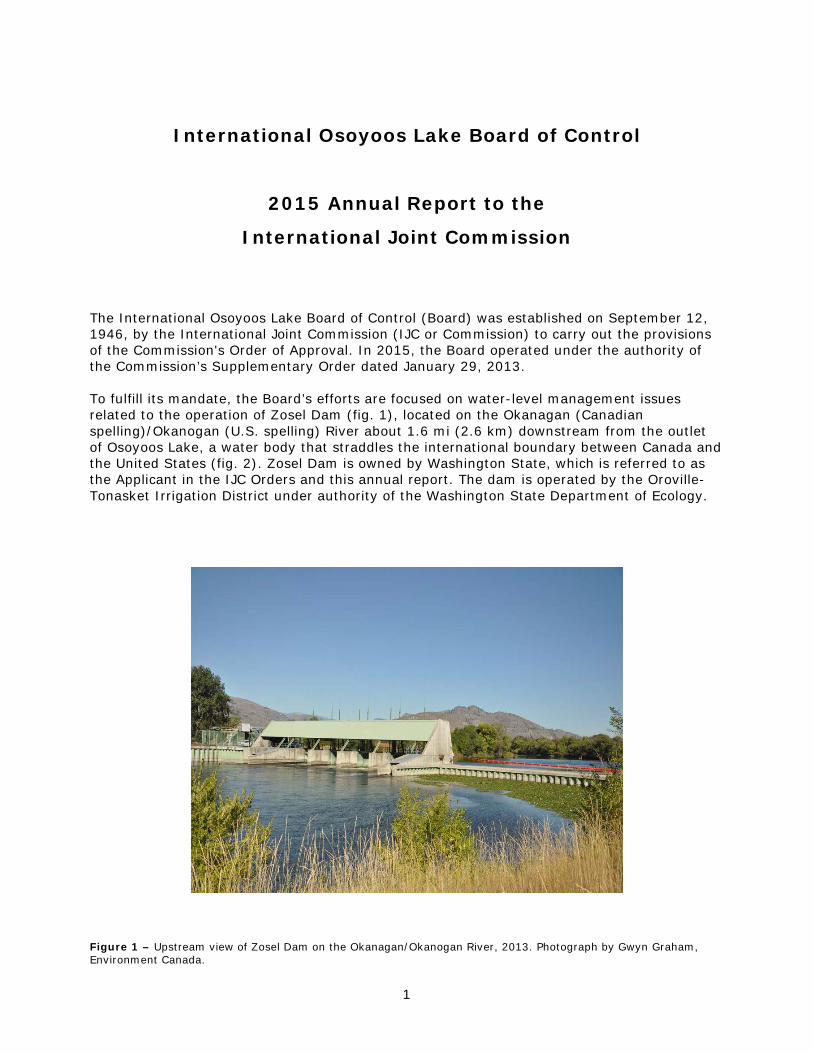
The International Osoyoos Lake Board of Control (Board) was established on September 12, 1946, by the International Joint Commission (IJC or Commission) to carry out the provisions of the Commission's Order of Approval. In 2015, the Board operated under the authority of the Commission’s Supplementary Order dated January 29, 2013. To fulfill its mandate, the Board’s efforts are focused on water-level management issues related to the operation of Zosel Dam (fig. 1), located on the Okanagan (Canadian spelling)/Okanogan (U.S. spelling) River about 1.6 mi (2.6 km) downstream from the outlet of Osoyoos Lake, a water body that straddles the international boundary between Canada and the United States (fig. 2). Zosel Dam is owned by Washington State, which is referred to as the Applicant in the IJC Orders and this annual report. The dam is operated by the Oroville-Tonasket Irrigation District under authority of the Washington State Department of Ecology.
Figure 1 – Upstream view of Zosel Dam on the Okanagan/Okanogan River, 2013. Photograph by Gwyn Graham, Environment Canada.

2
Figure 2 – Location of the Okanagan/Okanogan and Similkameen River watersheds.
3
ACTIVITIES OF THE BOARD IN 2015
At the request of the IJC, the Board nominated four local representatives from the Okanagan/Okanogan River watershed for Board membership to the IJC. All nominees were appointed by the IJC in September 2015, which expanded the Board from a total of six to ten members, with equal representation from Canada and the U.S. The new Canadian Board members are Sue McKortoff (Mayor, Town of Osoyoos) and Anna Warwick Sears (Executive Director, Okanagan Basin Water Board) and the new U.S. members are John Arterburn (Fisheries Biologist, Confederated Tribes of the Colville Reservation) and Ford Waterstrat (Board Member, Lake Osoyoos Association).
In 2015, the Board started holding quarterly conference calls; summaries of these calls are posted on the Board’s public website (http://ijc.org/en_/iolbc).
At the request of the IJC, the Board made final adjustments to the International Watershed Initiative (IWI) proposal for an educational documentary in July and the IJC signed a contract with the Washington State Department of Ecology in September to produce the documentary by autumn 2017.
The Board submitted an IWI proposal for funding support by the IJC of the 2015 Osoyoos Lake Water Science Forum. The IJC approved the proposal and provided funding for the conference.
On April 14, the Board notified the Applicant that the drought criteria in the IJC Order had not been met.
In late July, due to water-supply concerns in the Okanagan/Okanogan River watershed, the Board recommended to the IJC that it approve a Condition 10 variance under the Order, thereby allowing the Applicant to follow the drought rule curve for the remainder of 2015, even though the drought criteria in the IJC Order had not been met. The IJC approved the Condition 10 variance on July 28 and the Board notified the Applicant. The IJC issued a press release to announce the variance and the Board posted a notice on its public website. Details about the hydrologic conditions that led to the Condition 10 variance recommendation by the Board are described in the section “Hydrologic Conditions in 2015.”
The Board helped plan and participated in the Osoyoos Lake Water Science Forum in Osoyoos, BC, October 7-9, 2015.
The Board held its annual face-to-face Board meeting in Osoyoos, BC, on October 7, 2015, and its annual public meeting on October 8, 2015, as part of the Osoyoos Lake Water Science Forum. For the public meeting, the Board provided an overview of the IJC Order of Approval, and hydrologic conditions and rule-curve compliance in 2015. In addition, new Board member John Arterburn presented an overview of fisheries in the context of Zosel Dam.

4
Figure 3 – Selected IJC Commissioners, Board members and Secretaries at the Osoyoos Lake Water Science Forum, Oct. 7-9, 2015. From left to right: Gordon Walker (IJC co-chair, Canada), Marijke van Heeswijk (Board Secretary, U.S.), Gwyn Graham (Board Secretary, Canada), Ford Waterstrat (Board member, U.S.), Sue McKortoff (Board member, Canada), Bruno Tassone (Board Co-Chair, Canada), Cindi Barton (Board Co-Chair, U.S.), Col. John Buck (Board member, U.S), Glen Davidson (Board member, Canada), Anna Warwick Sears (Board member, Canada), Kris Kauffman (Board member, U.S.), John Arterburn (Board member, U.S.), Rich Moy (IJC Commissioner, U.S.).
The Board presented progress reports during the semi-annual IJC meetings on April 29 in Washington, DC, and October 28 in Ottawa, ON. The April meeting was attended in person by the chairs of the Canadian and U.S. sections of the Board, a U.S. Board member, and the secretaries of the Canadian and U.S. sections. The October meeting was attended in person by the chair of the Canadian section of the Board, a Canadian Board member, and the secretary of the U.S. section. Participants in the October meeting also took part in the International Watershed Initiative workshop in Ottawa, ON, on October 27.
Throughout the year, the Board posted a number of announcements on the Board’s section of the IJC website.
HYDROLOGIC CONDITIONS IN 2015
Drought Criteria
Condition 8 of the Commission's Supplementary Order of Approval dated January 29, 2013, provides three criteria for declaring a year of drought (table 1). In a year when the Board has declared a drought, the Osoyoos Lake level may be managed within a wider range from April through October as compared to non-drought years. (Drought year water-level ranges are discussed in the section “Osoyoos Lake Levels.”) Drought conditions were not in effect in 2015, as indicated by the forecasted values for the drought criteria in table 1. On July 28, however, the IJC approved a Condition 10 variance at the recommendation of the Board that gave the Applicant permission to follow the drought rule curve for the remainder of 2015 in recognition of unusual hydrologic conditions in the basin.
5
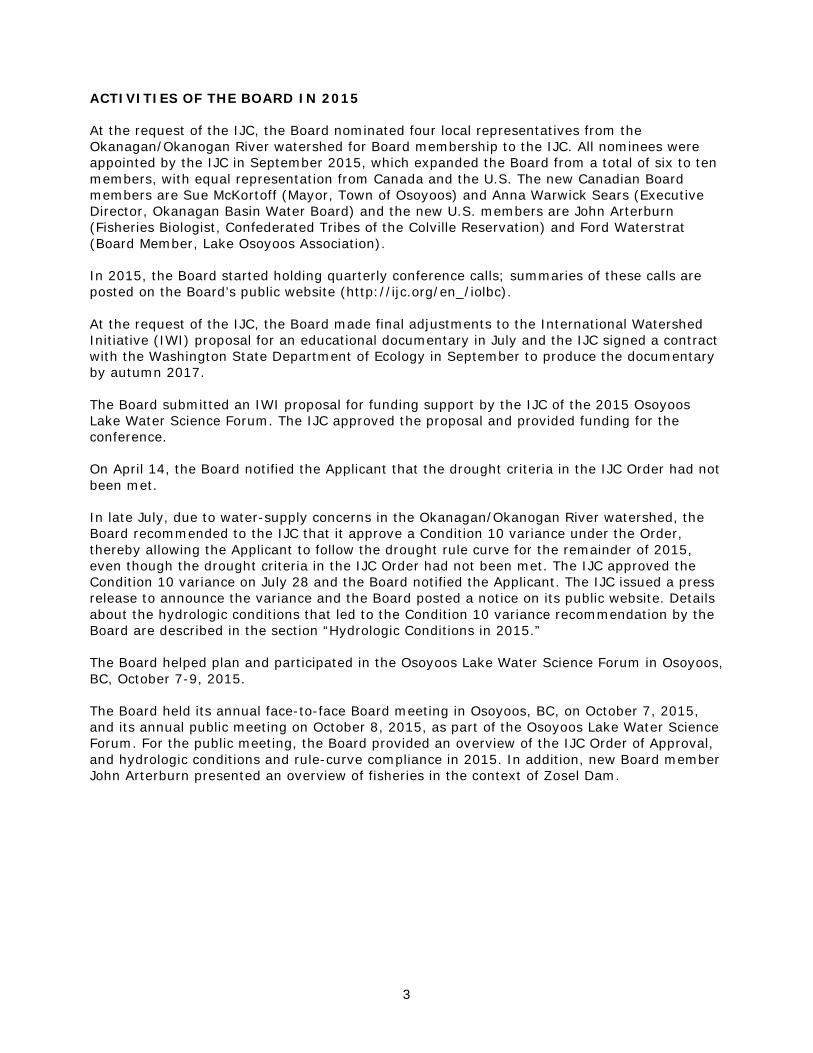
Table 1. Summary of drought criteria and forecasted and actual values in 2015. The Board declares a drought if condition 8(a) and either condition 8(b i) or 8(b ii) are met.
[ac-ft, acre-feet; ft, feet]
Criteria for declaring a drought
2015 Value forecasted in
(a) Early April (b) Early May
Drought criterion met?
Actual 2015
value
Condition 8(a) - Volume of flow in the Similkameen River at Nighthawk, WA, for the period April through July as calculated or forecasted by U.S. authorities is less than 1 million ac-ft
(a) 1,039,000 ac-ft (b) 831,000 ac-ft
(a) No (b) Yes 824,162 ac-ft
Condition 8(b i) - Net inflow to Okanagan Lake for the period April through July as calculated or forecasted by Canadian authorities is less than 195,000 ac-ft
(a) 396,000 ac-ft (b) 316,200 ac-ft
(a) No (b) No 234,247 ac-ft
Condition 8(b ii) - Level of Okanagan Lake in June or July is less than or is forecasted by Canadian authorities to be less than 1,122.6 ft (Canadian Geodetic Survey Datum)
(a) >1,126.6 ft (b) 1,123.3 ft
(a) No (b) No 1,123.31 ft
Unusual Hydrologic Conditions in the Basin
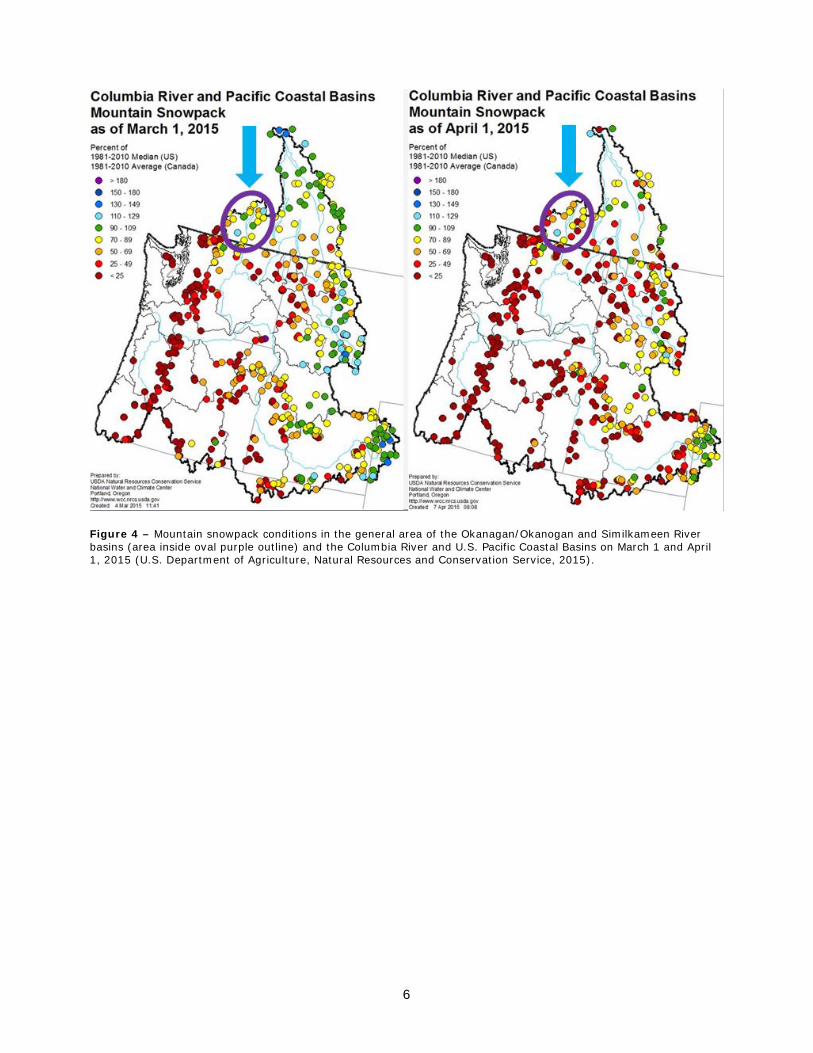
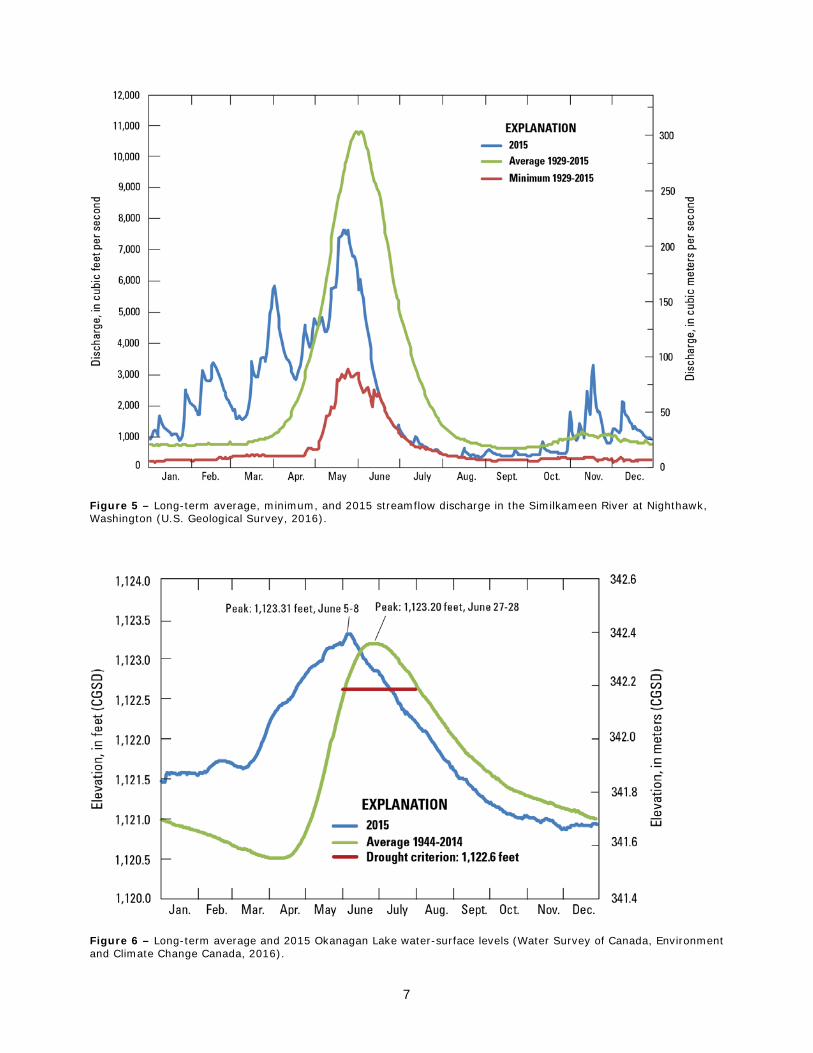
During the winter of 2014-15, precipitation amounts were about normal but above average temperatures resulted in snowpack accumulations in the region that were significantly less than normal (fig. 4). The elevated temperatures resulted in more precipitation in the form of rain during the winter months and above average runoff. This is illustrated by the above average streamflows from January through April in the Similkameen River (fig. 5), which is an unregulated tributary to the Okanogan River whose confluence with the Okanogan River is downstream from Zosel Dam (fig. 2). The elevated temperatures also meant that the reduced snowpack that accumulated during the winter started and finished melting earlier than usual, resulting in below average spring and early summer runoff. This is illustrated by the below average streamflows from May through July in the Similkameen River (fig. 5).
The pattern of increased streamflows in the winter and reduced streamflows in the spring and early summer occurred throughout the region, including the Okanagan/Okanogan River, and meant that reservoirs upstream of Osoyoos Lake filled to capacity earlier than normal. In particular, Okanagan Lake, which is the main summer water supply for the Canadian Okanagan and also largely provides the inflows to Osoyoos Lake, filled to capacity about three weeks ahead of normal (fig. 6).
6
Figure 4 – Mountain snowpack conditions in the general area of the Okanagan/Okanogan and Similkameen River basins (area inside oval purple outline) and the Columbia River and U.S. Pacific Coastal Basins on March 1 and April 1, 2015 (U.S. Department of Agriculture, Natural Resources and Conservation Service, 2015).
7
Figure 5 – Long-term average, minimum, and 2015 streamflow discharge in the Similkameen River at Nighthawk, Washington (U.S. Geological Survey, 2016).
Figure 6 – Long-term average and 2015 Okanagan Lake water-surface levels (Water Survey of Canada, Environment and Climate Change Canada, 2016).
8
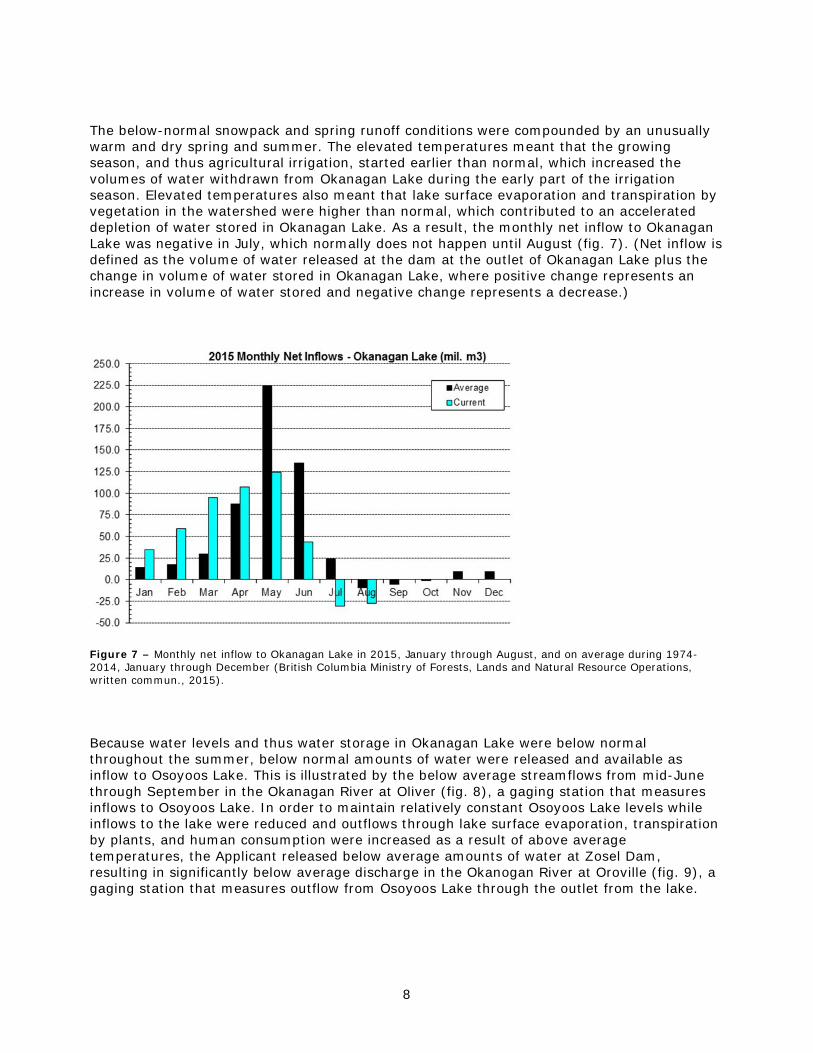
The below-normal snowpack and spring runoff conditions were compounded by an unusually warm and dry spring and summer. The elevated temperatures meant that the growing season, and thus agricultural irrigation, started earlier than normal, which increased the volumes of water withdrawn from Okanagan Lake during the early part of the irrigation season. Elevated temperatures also meant that lake surface evaporation and transpiration by vegetation in the watershed were higher than normal, which contributed to an accelerated depletion of water stored in Okanagan Lake. As a result, the monthly net inflow to Okanagan Lake was negative in July, which normally does not happen until August (fig. 7). (Net inflow is defined as the volume of water released at the dam at the outlet of Okanagan Lake plus the change in volume of water stored in Okanagan Lake, where positive change represents an increase in volume of water stored and negative change represents a decrease.)
Figure 7 – Monthly net inflow to Okanagan Lake in 2015, January through August, and on average during 1974-2014, January through December (British Columbia Ministry of Forests, Lands and Natural Resource Operations, written commun., 2015).
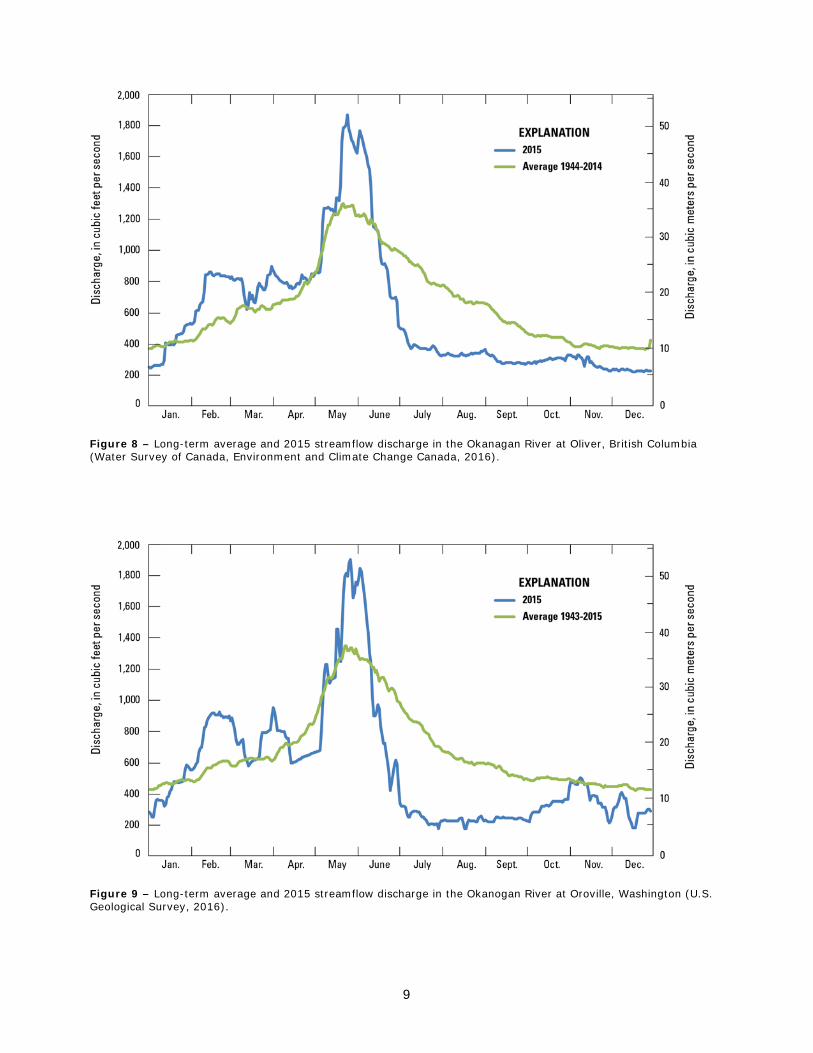
Because water levels and thus water storage in Okanagan Lake were below normal throughout the summer, below normal amounts of water were released and available as inflow to Osoyoos Lake. This is illustrated by the below average streamflows from mid-June through September in the Okanagan River at Oliver (fig. 8), a gaging station that measures inflows to Osoyoos Lake. In order to maintain relatively constant Osoyoos Lake levels while inflows to the lake were reduced and outflows through lake surface evaporation, transpiration by plants, and human consumption were increased as a result of above average temperatures, the Applicant released below average amounts of water at Zosel Dam, resulting in significantly below average discharge in the Okanogan River at Oroville (fig. 9), a gaging station that measures outflow from Osoyoos Lake through the outlet from the lake.
9
Figure 8 – Long-term average and 2015 streamflow discharge in the Okanagan River at Oliver, British Columbia (Water Survey of Canada, Environment and Climate Change Canada, 2016).
Figure 9 – Long-term average and 2015 streamflow discharge in the Okanogan River at Oroville, Washington (U.S. Geological Survey, 2016).
10
In April, shortly after the Board notified the Applicant that drought conditions were not in effect because the drought criteria of the IJC Order had not been met, Washington State expanded its drought declaration to include the U.S. part of the Okanagan/Okanogan River basin (table 2). As drought-like conditions progressively worsened and expanded north, by July the province of British Columbia declared drought conditions in the Canadian part of the Okanagan/Okanogan River basin (table 2). Throughout this time, the Board monitored hydrologic conditions in relation to Osoyoos Lake and in late July recommended to the IJC that it approve a Condition 10 variance under the Order, thereby allowing the Applicant to follow the drought rule curve (fig. 10) for the remainder of 2015, even though the Order’s drought criteria had not been met. The IJC approved the Condition 10 variance on July 28, which gave the Applicant permission to operate under the drought rule curve for the remainder of 2015.
In response, the Applicant tried to increase the Osoyoos Lake level in late summer to increase water storage for downstream use, but too little water was being released from Okanagan Lake or provided by tributary streams by then to be able to raise the water level significantly. In addition, little precipitation fell during late summer that could otherwise have been captured to help raise the water level in Osoyoos Lake.
Operation under the drought rule curve also gave the Applicant the option to decrease the Osoyoos Lake elevation to a level lower than under the standard rule curve. It meant that the Applicant could release more water from the lake to meet downstream water needs. The Applicant did not exercise this option, however, because even though the downstream flows in the Okanogan River were low, they remained sufficient to not adversely affect the ability of the Oroville-Tonasket Irrigation District to divert water.
11
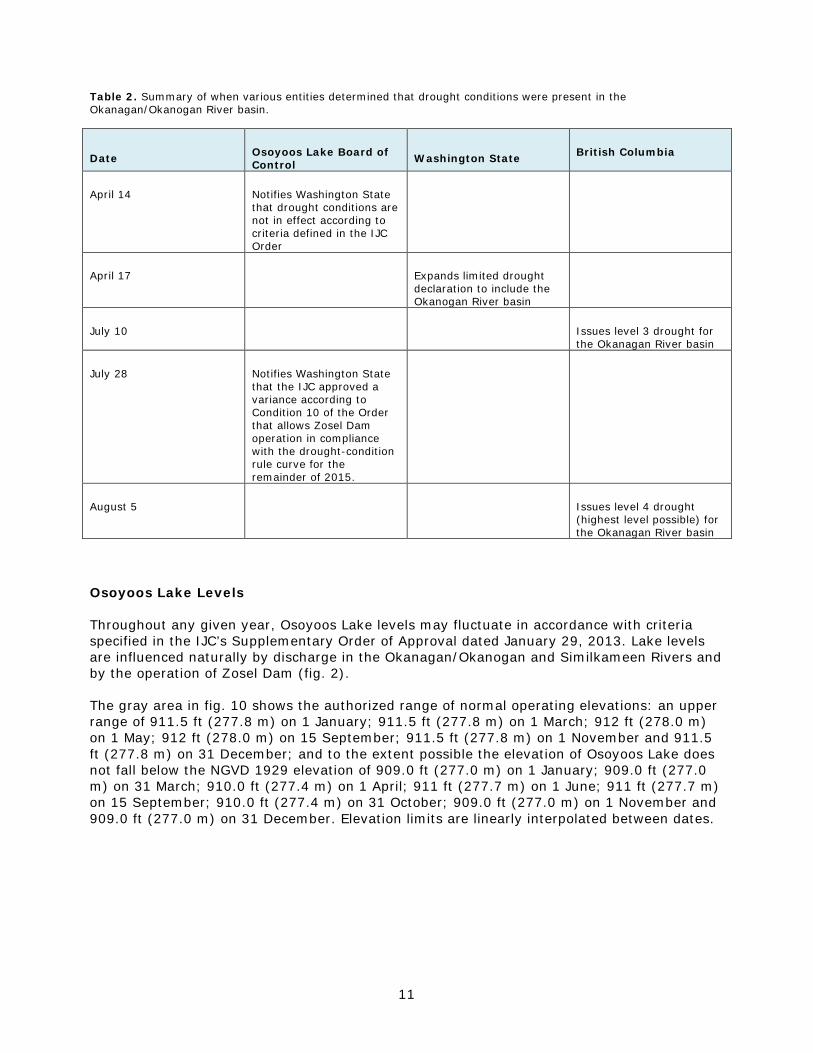
Table 2. Summary of when various entities determined that drought conditions were present in the Okanagan/Okanogan River basin.
Date Osoyoos Lake Board of Control Washington State British Columbia
April 14 Notifies Washington State that drought conditions are not in effect according to criteria defined in the IJC Order
April 17 Expands limited drought declaration to include the Okanogan River basin
July 10 Issues level 3 drought for the Okanagan River basin
July 28 Notifies Washington State that the IJC approved a variance according to Condition 10 of the Order that allows Zosel Dam operation in compliance with the drought-condition rule curve for the remainder of 2015.
August 5 Issues level 4 drought (highest level possible) for the Okanagan River basin
Osoyoos Lake Levels
Throughout any given year, Osoyoos Lake levels may fluctuate in accordance with criteria specified in the IJC’s Supplementary Order of Approval dated January 29, 2013. Lake levels are influenced naturally by discharge in the Okanagan/Okanogan and Similkameen Rivers and by the operation of Zosel Dam (fig. 2).
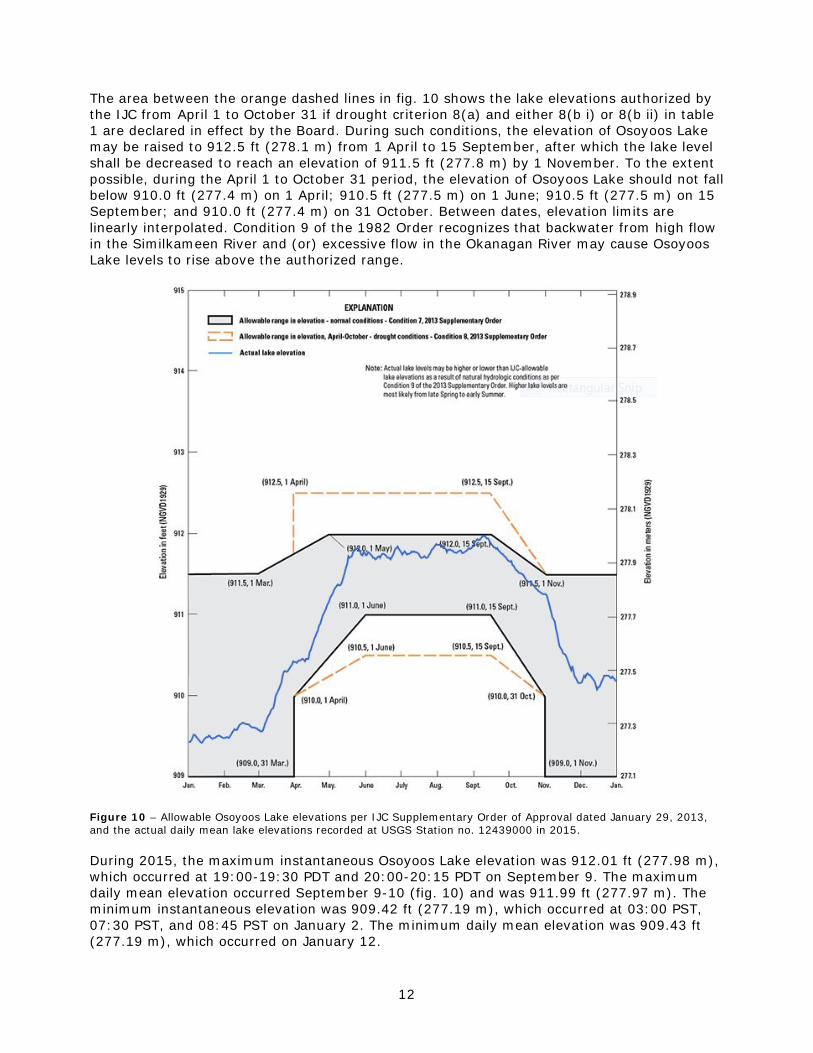
The gray area in fig. 10 shows the authorized range of normal operating elevations: an upper range of 911.5 ft (277.8 m) on 1 January; 911.5 ft (277.8 m) on 1 March; 912 ft (278.0 m) on 1 May; 912 ft (278.0 m) on 15 September; 911.5 ft (277.8 m) on 1 November and 911.5 ft (277.8 m) on 31 December; and to the extent possible the elevation of Osoyoos Lake does not fall below the NGVD 1929 elevation of 909.0 ft (277.0 m) on 1 January; 909.0 ft (277.0 m) on 31 March; 910.0 ft (277.4 m) on 1 April; 911 ft (277.7 m) on 1 June; 911 ft (277.7 m) on 15 September; 910.0 ft (277.4 m) on 31 October; 909.0 ft (277.0 m) on 1 November and 909.0 ft (277.0 m) on 31 December. Elevation limits are linearly interpolated between dates.
12
The area between the orange dashed lines in fig. 10 shows the lake elevations authorized by the IJC from April 1 to October 31 if drought criterion 8(a) and either 8(b i) or 8(b ii) in table 1 are declared in effect by the Board. During such conditions, the elevation of Osoyoos Lake may be raised to 912.5 ft (278.1 m) from 1 April to 15 September, after which the lake level shall be decreased to reach an elevation of 911.5 ft (277.8 m) by 1 November. To the extent possible, during the April 1 to October 31 period, the elevation of Osoyoos Lake should not fall below 910.0 ft (277.4 m) on 1 April; 910.5 ft (277.5 m) on 1 June; 910.5 ft (277.5 m) on 15 September; and 910.0 ft (277.4 m) on 31 October. Between dates, elevation limits are linearly interpolated. Condition 9 of the 1982 Order recognizes that backwater from high flow in the Similkameen River and (or) excessive flow in the Okanagan River may cause Osoyoos Lake levels to rise above the authorized range.
Figure 10 – Allowable Osoyoos Lake elevations per IJC Supplementary Order of Approval dated January 29, 2013, and the actual daily mean lake elevations recorded at USGS Station no. 12439000 in 2015.
During 2015, the maximum instantaneous Osoyoos Lake elevation was 912.01 ft (277.98 m), which occurred at 19:00-19:30 PDT and 20:00-20:15 PDT on September 9. The maximum daily mean elevation occurred September 9-10 (fig. 10) and was 911.99 ft (277.97 m). The minimum instantaneous elevation was 909.42 ft (277.19 m), which occurred at 03:00 PST, 07:30 PST, and 08:45 PST on January 2. The minimum daily mean elevation was 909.43 ft (277.19 m), which occurred on January 12.
13
While the maximum instantaneous water level exceeded the standard rule curve by 0.01 ft (0.003 m) for brief moments during the evening of September 9, it was within the limits of the drought rule curve that was in effect at the time. The maximum daily mean water level was less than the upper limit of the standard rule curve by 0.01 ft (0.003 m). In 2015, there were no deviations from the rule curves that were in effect and thus the Applicant was in compliance with the IJC’s 2013 Supplementary Order of Approval.
River Discharges
The maximum instantaneous discharge of the Okanogan River at Oroville (downstream from Zosel Dam) occurred on May 27 and was 1,930 cubic feet per second (cfs) (54.7 cubic meters per second [cms]) with a corresponding Osoyoos Lake elevation of 911.80 ft (277.92 m).
The maximum instantaneous discharge of the Similkameen River occurred on May 24 and was 7,770 cfs (220 cms). The maximum daily mean discharge of 7,600 cfs (215 cms) occurred on May 22 and 25. High flow in the Similkameen River created variable backwater at the Okanogan River at Oroville gaging station during May 17-June 1 and June 2-3. The annual mean flow in the Similkameen River was 1,999 cfs (56.6 cms) in 2015, which is 87 percent of the 87-year average flow. From 1929 through 2015, there were 28 years when the annual mean flow was less than 1,999 cfs (56.6 cms). The smallest annual mean flow of record occurred in 2001, when it was 1,030 cfs (29.2 cms).
Conditions 3 and 4 of the IJC Order of 1982 specify that the flow capacity of the Okanogan River channel between the outlet of Osoyoos Lake up to and including Zosel Dam be at least 2,500 cfs (70.8 cms) when the elevation of Osoyoos Lake is 913.0 ft (278.3 m) and there is no appreciable backwater effect from the Similkameen River. Hydrologic conditions in 2015 did not allow testing of compliance with these conditions because the Osoyoos Lake elevation did not reach 913.0 ft (278.3 m). In 2013, however, hydrologic conditions were such that compliance with these conditions was confirmed. In addition, no significant sediment-input events that may have reduced the channel capacity were observed in 2014 and 2015.
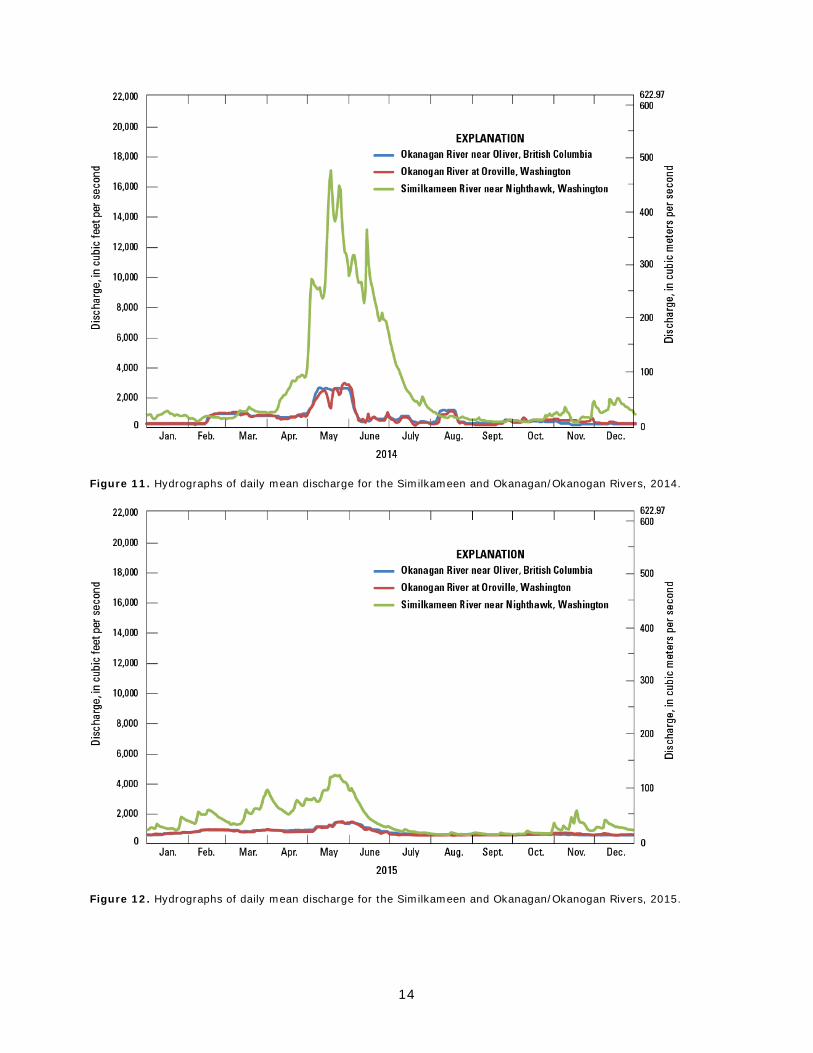
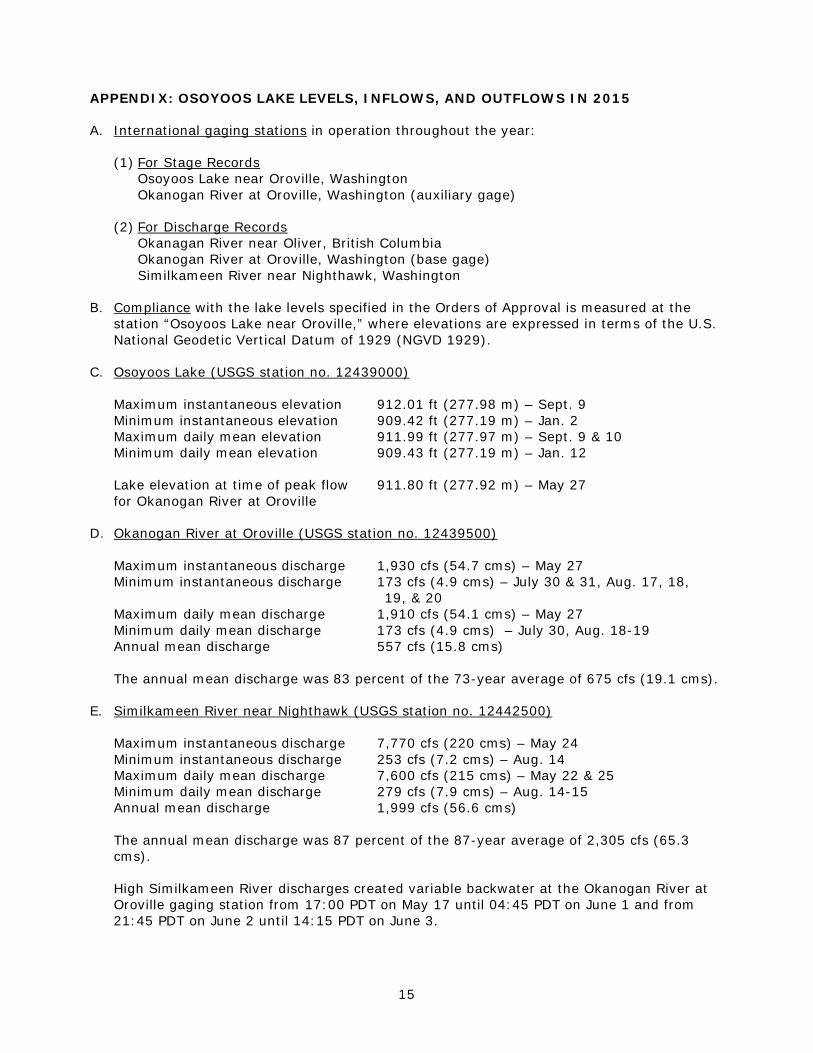
Data on Osoyoos Lake elevation and relevant river flows for 2015 are summarized in the appendix; the river hydrographs for 2014 and 2015 are depicted in figs. 11 and 12, respectively, and demonstrate that discharge in the Similkameen and Okanagan/Okanogan Rivers was significantly reduced in 2015 compared to 2014.
14
Figure 11. Hydrographs of daily mean discharge for the Similkameen and Okanagan/Okanogan Rivers, 2014.
Figure 12. Hydrographs of daily mean discharge for the Similkameen and Okanagan/Okanogan Rivers, 2015.
15
APPENDIX: OSOYOOS LAKE LEVELS, INFLOWS, AND OUTFLOWS IN 2015
A. International gaging stations in operation throughout the year:
(1) For Stage Records Osoyoos Lake near Oroville, Washington Okanogan River at Oroville, Washington (auxiliary gage)
(2) For Discharge Records Okanagan River near Oliver, British Columbia Okanogan River at Oroville, Washington (base gage) Similkameen River near Nighthawk, Washington
B. Compliance with the lake levels specified in the Orders of Approval is measured at the station “Osoyoos Lake near Oroville,” where elevations are expressed in terms of the U.S. National Geodetic Vertical Datum of 1929 (NGVD 1929).
C. Osoyoos Lake (USGS station no. 12439000) Maximum instantaneous elevation 912.01 ft (277.98 m) – Sept. 9 Minimum instantaneous elevation 909.42 ft (277.19 m) – Jan. 2 Maximum daily mean elevation 911.99 ft (277.97 m) – Sept. 9 & 10 Minimum daily mean elevation 909.43 ft (277.19 m) – Jan. 12
Lake elevation at time of peak flow 911.80 ft (277.92 m) – May 27 for Okanogan River at Oroville
D. Okanogan River at Oroville (USGS station no. 12439500) Maximum instantaneous discharge 1,930 cfs (54.7 cms) – May 27 Minimum instantaneous discharge 173 cfs (4.9 cms) – July 30 & 31, Aug. 17, 18, 19, & 20 Maximum daily mean discharge 1,910 cfs (54.1 cms) – May 27 Minimum daily mean discharge 173 cfs (4.9 cms) – July 30, Aug. 18-19 Annual mean discharge 557 cfs (15.8 cms) The annual mean discharge was 83 percent of the 73-year average of 675 cfs (19.1 cms).
E. Similkameen River near Nighthawk (USGS station no. 12442500) Maximum instantaneous discharge 7,770 cfs (220 cms) – May 24 Minimum instantaneous discharge 253 cfs (7.2 cms) – Aug. 14 Maximum daily mean discharge 7,600 cfs (215 cms) – May 22 & 25 Minimum daily mean discharge 279 cfs (7.9 cms) – Aug. 14-15 Annual mean discharge 1,999 cfs (56.6 cms) The annual mean discharge was 87 percent of the 87-year average of 2,305 cfs (65.3 cms).
High Similkameen River discharges created variable backwater at the Okanogan River at Oroville gaging station from 17:00 PDT on May 17 until 04:45 PDT on June 1 and from 21:45 PDT on June 2 until 14:15 PDT on June 3.