Embed Size (px)
Citation preview

D-dimer and Troponin T Biomarker in Acute Coronary Syndrome in Hilla City
Ali Kareem Hameed*, Ghafil Saihood Hassan, Amir Sahib Al-Mumin
University of Babylon, Hilla-Iraq
Abstract : The acute coronary syndrome (ACS) means the spectrum of many clinical conditions
attributed to obstruction of coronary arteries. The most common symptom is chest pain, begins from,
stable angina, unstable angina, to myocardial infarction.
The present study included 60 subjects . They were divided into two groups. First group included 30
patients with acute coronary syndrome . Second group included healthy subjects without acute coronary
syndrome acted as control group . Their range age was 40—60 years. They are diagnosed by specialist
doctor as random sample. The patients group presented in the ward setting from July 2015 to March
2016 in Shahid Al-Mihrab center in Margan Medical City/ Hilla.
Methods: 1-Blood sample for laboratory analysis.
2- Blood pressure measurement.
3-ECG measurement.
4-Echo measurement.
Results:
1-Mean D-Dimer level was increased significantly (P < 0.01) in patients group (96.19 ng/ml), compared
to control group (51.97 ng/ml).
2- The mean Troponin T level was increased significantly (P < 0.01) in patients group (136.57 pg/ml),
compared to control group (26.22 pg/ml).
3-The mean Glucose level was increased significantly (P < 0.01) in patients group (208.3 mg/dl),
compared to control group (129.11 mg/dl).
4- The mean left ventricular ejection fraction was decreased significantly (47.03 %) in patients group
compared to control person (55 – 80 %).
5-The mean high density lipoprotein (HDL) level was decreased high significant (P value <0.01) in
patients group (22.98 ± 2.12 mg/dl) compare to control group (33.39 ± 3.27).
6-The mean cholesterol level was increased significantly (p value < 0.05) in patients group (194.89 ±
13.43 mg /dl) compared to control group (151.75 ±12.06 mg/dl).
7- The mean triglyceride level was increased significantly (P value < 0.01) in patients group (207.7 5 ±
20.86 mg/dl) compared to control group (80.95 ± 4.74 mg/dl). See table 1.
8-The mean urea and creatinine levels were increased significantly in patients group (64.02 ± 6.94) (3.82
± 0.41) respectively compared to control group (53.61 ± 5.42) (1.26 ± 0.19). See table 2.
9-The mean Na and K ions levels were increased but not significant in patients group (20.08 ±2. 40)
(6.80 ±0.89) respectively compare to control group (16.50 ±1.95) (5.20 ± 0.72). See table 3.
10- Sensitivity of D-dimer = 77 %, while sensitivity of Troponin T = 70%. Specificity of D-dimer =
97%, while specificity of Troponin T = 90%.
Conclusions:
1-The mean D-dimer level was increased significantly in patients group, compared to control group.
2- The mean Troponin T level was increased significantly in patients group compared to control group.
International Journal of PharmTech Research CODEN (USA): IJPRIF, ISSN: 0974-4304, ISSN(Online): 2455-9563 Vol.9, No.11, pp 334-346, 2016
Ali Kareem Hameed et al /International Journal of PharmTech Research, 2016,9(11): 334-346. 335
3- The mean glucose level was increased significantly in patients group compared to control group.
4- The mean left ventricular ejection fraction was decreased 9.47 % from normal in patient group.
5-The mean cholesterol and triglyceride level were increased significantly except high density
lipoprotein (HDL) level decrease significantly in patients group compared to control group.
6- Sensitivity of D-dimer = 77 %, while sensitivity of Troponin T = 70%. Specificity of D-Dimer = 97%,
while specificity of Troponin T = 90%.
Keywords : D-dimer and Troponin T Biomarker, Acute Coronary Syndrome.
Introduction
Acute coronary syndrome is a term that encompasses both types of angina (Stable and unstable) and
myocardial infarction (MI). Unstable angina is characterized by new-onset or rapidly worsening angina
(crescendo angina), angina on minimal exertion or angina at rest in the absence of myocardial damage. In
contrast, MI occurs when symptoms occur at rest and there is elevation in cardiac troponin.1.
There are few reports using rapid measurement of D-dimer for the screening of acute cardiovascular
disease (ACVD) in the outpatient clinic for emergent patients. Therefore, prospective study was performed to
examine the utility of rapid D-dimer measurement in serum for the screening of ACVD in the emergency
setting and also to investigate the utility of rapid D-dimer measurement for the diagnosis of ACS. 2
Cardiovascular disease (CVD) is the single greatest cause of adult mortality in the western world. Over
the last decade many researches have focused on the identification of cardiac biomarkers that can be used for
the detection of cardiac distress. Initially, rupture of unstable coronary plaques results in intracoronary
thrombosis, where the thrombus (blood clot) leads to a reduction in blood flow (cardiac ischemia), thereby
restricting the supply of oxygen to the myocardium. The continuum of this myocardial ischemia is ACS which
ranges from unstable angina (associated with reversible myocardial injury) to MI with large areas of irreversible
damage (cardiac necrosis). ACS is mainly separated into two categories based on changes seen in the
electrocardiograms at presentation: ‘ST-segment elevation myocardial infarction’(STEMI) and ‘non-ST-
segment elevation ACS’ (NSTEACS). 3
Still, ECG, serial laboratory parameters including markers of myocardial necrosis, and other imaging
methods such as computed tomography, angiography, or magnetic resonance are essential for the diagnosis of
acute coronary syndrome.4
About 5% of patients who were discharged from the emergency department because of normal
electrocardiograms (ECG) were later diagnosed as having reliable cardiac markers that could be used to identify
these undiagnosed ACS patients before they are prematurely discharged from the emergency department. In this
respect, useful markers due to the role it plays in ACS pathophysiology. Troponin I is routinely used in the
diagnosis of ACS, but their levels are not elevated during the first few hours following symptom onset and their
usefulness in the early diagnosis of chest pain is disputable. D-dimer levels rise earlier than cardiac injury
markers (including myoglobin) in acute ischemic events because D-dimer is involved at an earlier stage in the
pathophysiological process of MI. D-dimer is an enzymatic degradation product that forms as a result of
plasmin lysis of cross- linked fibrin clots. The plasma level of D-dimer is important for assessing the patient’s
fibrinolytic status.5.
Chest pain is a very common reason for presentation to the emergency department, and the early
diagnosis and prognostic evaluation of acute chest pain must be carried out in this department: chest pain might
be the first and only symptom of acute coronary syndrome (ACS). The diagnosis of ischemic chest pain in the
emergency department is currently based on clinical history, serum enzyme levels and electrocardiogram (ECG)
findings. 6
Myocardial infarction (MI) and angina pectoris, have limited diagnostic value in the early stages of
these syndromes. Cardiac enzyme levels may take several hours to rise after pain onset and the ECG has
suboptimal sensitivity for the early diagnosis of MI.7.
Ali Kareem Hameed et al /International Journal of PharmTech Research, 2016,9(11): 334-346. 336
Causes of acute coronary syndrome (ACS):
The main causes are:
1-Narrowing of the proximal large arteries by atherosclerosis. When the luminal diameter of the large coronary
arteries is reduced by more than 60 -70% of normal, myocardial ischemia with hypoxia pain occurs even on
mild physical work or stress.
2- Another cause of diminished coronary flow is spastic (variant angina).
3- Mitral regurgitation.
4-Arrhythmia 8.
Risk factors of acute coronary syndrome:
The hypertension (HT), previous myocardial infarction (MI), diabetes mellitus (DM) type 2, alcohol
consumption, dyslipidemia and obesity. Alcohol consumption, dyslipidemia and obesity were seen in fewer
people, while HT was seen to occur in 82.3% of those with ACS. 9.
Cardiac biochemical markers:
D-dimer:
D-dimer levels are known to increase with age leading false positive especially in patients aged ≥ 80
years, so clinical usefulness is limited in elderly patients10
. D-dimer has been reported previously by several
investigations for the diagnosis of pulmonary thromboembolism, acute aortic dissection, and acute myocardial
infarction11
. The shock state could be elevated by D-dimer because of the activation of systemic inflammation 12
. For above reasons, it is low specificity and there is limitation in its usage as a single diagnostic procedure 13
.
D-dimer tests are broadly used as an excellent non-invasive triage biomarker in patients with acute
thoracic pain especially in the absence of an ischemic origin of the symptoms in order to rule out or identify
potential life-threatening differential diagnoses including acute aortic syndrome and pulmonary embolism14
.
Cardiac troponins:
Troponin T and I can be detected in blood as early as two to four hours after the onset of symptoms, but
elevation can be delayed for up to eight to twelve hours. This timing of elevation is similar to that of CK-MB
but persists longer, for of elevation is similar to that of CK-MB but persists longer, for up to five to 14, day 15
.
Troponin T is structural cardiac muscle proteins that are released during myocyte damage and necrosis,
in the diagnosis of acute myocardial infarction (AMI). Modern assays are extremely sensitive and can detect
very low levels of myocardial damage. Elevated plasma troponin concentrations are seen in other acute
conditions, such as pulmonary embolus, septic shock and acute pulmonary edema. So diagnosis of MI therefore
relies on the patient’s clinical presentation 1.
Both cardiac troponin I (cTn I) and cardiac troponin T (cTnT) are highly specific biomarkers for
myocardial tissue. Their detection in serum is a strong indicator for myocardial damage 16,17
.
In spite of their high specificity, elevated cardiac troponins have been shown to have possible links
with secondary conditions such as chronic renal failure, acute myocarditis, cardiomyopathy, congestive heart
failure (CHF), pulmonary embolism (PE), sepsis and left ventricular hypertrophy18
.
The American Heart Association (AHA), the American College of Cardiology (ACC), and the
European Society of Cardiology (ESC) guidelines agree that the preferred marker for myocardial necrosis is
cardiac troponin (I or T). Troponin has high clinical sensitivity and related to myocardial necrosis 9.
Cardiac troponin T is the preferred diagnostic tests for ACS, in particular non-ST-segment-elevation
MI20
.
Ali Kareem Hameed et al /International Journal of PharmTech Research, 2016,9(11): 334-346. 337
Differences between D-dimer and Troponin biomarker:
The Troponin is elevated at 3–4 hours after onset of symptoms. By contrast, D-dimer earlier rise than
common markers (cardiac troponin T and I) of cardiac injury 6.
Troponin T and I can be detected in blood as early as two to four hours after the onset of symptoms, but
elevation can be delayed for up to eight to twelve hours. This timing of elevation is similar to that of CK-MB
but persists longer, for of elevation is similar to that of CK-MB but persists longer, for up to five to 14, day 15
.
Potassium concentration:
Potassium is the major intracellular cation. It play an important part in generating of action potential and
allowing the propagation of the action potential. the normal concentration of potassium is 3.5 – 5 mmol/l 21
.
Sodium concentration:
The great majority of the body's sodium content is located in the extra cellular fluid (ECF), where it is most
abundant cation. The normal range concentration of sodium in plasma is 140 – 145 mmol/l. 21
. .
Plasma lipid and lipoproteins:
Five forms of lipid present in plasma:
1-Fatty acid, free fatty acids are carried mainly bound to albumin.
2-Triglycerides consist of glycerol, with three fatty acids.
3-Phospholipids, are complex lipids resembling triglycerides but containing phosphate and a
nitrogenous base.
4-Cholesterol has a steroid structure.
5-Lipoproteins.
Lipoproteins are classified according to their densities into:
A. High density lipoproteins (HDL), transport cholesterol from cells.
B. Low density lipoproteins (LDL), transport cholesterol to cells.
C. Very low density lipoproteins (VLDL), transport endogenous triglycerides from liver to the cells 21
. .
Urea and creatinine:
Amino acids derived from the breakdown of protein are deaminated to produce ammonia. Ammonia is
then converted to urea via liver enzymes. Therefore, the concentration of urea is dependent on protein intake,
adequate excretion of urea by the renal system. The majority of the creatinine is produced in the muscle. As a
result, the concentration of plasma creatinine is influenced by the patient's muscle mass. creatinine is less
affected by diet and more suitable as an indicator of renal function. The measurement of creatinine
concentrations in plasma depend on the filtration capacity of the glomerulus, also known as the glomerular
filtration rate (GFR). 22
.
Ejection fraction:
The fraction of end diastole that is ejected is called the ejection fraction which is equal to about 55 – 80
ml 23
.
Atherosclerosis:
It is a disease of the large and intermediate sized arteries in which fatty lesions called atheromatous
plaques develop on inside surfaces of the atrial walls. It is term that refers to thickened blood vessels of all size.

Ali Kareem Hameed et al /International Journal of PharmTech Research, 2016,9(11): 334-346. 338
Early abnormal in blood vessels is damage to the vascular endothelium. This damage increases the adhesion
molecules on endothelial cells and decreases their ability to release nitric oxide (NO) and other substances that
help prevent adhesion of macromolecules, platelets, and monocytes to the endothelium 24
.
Calcium component of the human body:
About 99% of calcium body is stored in the bone. Only 1% in the extracellular fluid (Plasma). With
acidosis, less calcium ions bind to the plasma proteins, conversely in alkalosis, a great amount of calcium ions
bind to plasma protein. So patients with alkalosis, are more susceptible to hypoglycemic tetany. The normal
concentration of calcium ions in the extracellular fluid is remains constant level is 10.0 mg/dl with range (8.5 –
10.5 mg/dl). Calcium ions in extracellular fluid are regulated by:
1-Parathyroid hormone on the bone.
2-Parathyroid hormone and Vitamin D on gastro intestinal tract (GIT).
3- Parathyroid hormone on urinary tract.
4- Plasma concentration of phosphate.
5- Metabolic alkalosis or acidosis. 24
.
Aim of study:
1-To evaluate acute coronary syndrome.
2- Use the D-dimer and Troponin T for the screening of ACVD in comparison with Troponin I
3- To measurement sensitivity and specialty of troponin and D-dimer biomarker.
4- To compare patients with acute coronary disease (ACD) to control persons.
Subjects and methods:
The study group included 60 subjects (30 male and 30 female). They are divided into two groups. First
group includes 30 patients with acute coronary syndrome . Second group includes healthy subjects without
acute coronary syndrome acted as control group. Their range age (40—60) years. They are diagnosed by
specialist doctor as random sample who presented in the ward setting from July 2015 to March 2016 in Shahid
Al-Mihrab center in Margan medical city/ Hilla.
Blood sample:
Five ml of venous blood sample were obtained from antecubital vein patients and control groups at
admission. Blood was taken under sterile conditions with 19-mm gauge. After cleaning and drying, a tourniquet
was applied just above the site of venipuncture, the patient was asked to make a fist a few times. Two ml of
blood was delivered in ethylene diamine tetra acetic acid (EDTA) tube; the tube was inverted several times to
mix the blood with anticoagulant to be used for biomarker test. The remaining three ml of blood delivered in to
clean plane tubes to be used for biochemical tests 25
.
D-dimer measurement:
Plasma samples taken from all subjects (the patient and control groups) were kept in deep freeze for
measurement of the plasma levels of D-dimer by Elisa manner26
.
Troponin T measurement:
Plasma samples taken from all subjects (the patient and control groups) were kept in deep freeze for
measurement of the plasma levels of Troponin T by Elisa manner 27
.
Ali Kareem Hameed et al /International Journal of PharmTech Research, 2016,9(11): 334-346. 339
3.2.4 - Blood pressure measurement.
An inflatable cuff attached to a mercury manometer (sphygmomanometer) was wrapped around the
arm and a stethoscope was placed over the brachial artery at elbow. The cuff was rapidly inflated until the
pressure in it is above the expected systolic pressure in the brachial artery. The pressure in the cuff was then
lowered slowly. The cuff pressure at which the sounds were first heard (Korotkoff sound phase 1), was the
systolic pressure (SBP). Diastolic blood pressure (DBP) was taken when the sound disappears (Korotkoff
sound phase5)1.
3.2.5 - ECG measurement:
To detect transmural infarction which is characterization by persistent ST elevation, new Q wave or
new left bundle branch block. ECG may show ST, or T wave changes including ST depression, transient ST
elevation and T wave Inversion1.
3.2.6- Echocardiography:
It is very useful technique for assessing left and right ventricular function such as ejection fraction and
to detect important complication such as cardiac rupture ventricular septal defect, mitral regurgitation, and
pericardial effusion1.
3.2.7 -Lipid profile measurement:
Measurement of cholesterol level:
Cholesterol level was measured in subject sera by using Reflotron plus instruments. Thirty two (32) µl
of serum was taken from each subject and was put in specific strips in the instrument. Automated result as
mg/dl was given. Cholesterol kit (Roche Company/ Germany) for Reflotron plus instrument was used.
Measurement of triglyceride level:
Triglyceride level was measured in subject sera by using Reflotron plus instruments. Thirty two (32) µl
of serum was taken from each subject and was put in specific strips in the instrument. Automated result as
mg/dl was given. Triglyceride kit (Roche Company/ Germany) for Reflotron plus instrument was used.
Measurement of HDL level:
High density lipoprotein (HDL) level was measured in subject sera by using Reflotron plus instruments.
Thirty two (32) µl of serum was taken from each subject and was put in specific strips in the instrument.
Automated result as mg/dl was given. High density lipoprotein kit (Roche Company/ Germany) for Reflotron
plus instrument was used.
3.2.8 -Measurement of random blood glucose:
Random blood glucose level was measured in subject sera by using Reflotron plus instruments. Thirty
two (32) µl of serum was taken from each subject and was put in specific strips in the instrument. Automated
result as mg/dl was given. Blood glucose kit (Roche Company/ Germany) for Reflotron plus instrument was
used.
3.2.9 -Measurement of urea and creatinine:
The measurement of creatinine and urea levels by using Reflotron plus instrument (Roche
company/Germany) creatinine kit for Reflotron was used to measure the level of creatinine. Similarly urea kit
for Reflotron was used to measure the level of urea.

Ali Kareem Hameed et al /International Journal of PharmTech Research, 2016,9(11): 334-346. 340
3.2.10 -Measurement of sodium and potassium levels in the blood:
Blood samples were centrifuged at 2000 r.p.m for 10 minutes, serum was digested by nitric acid (1:1)
and then diluted by deionized distilled water to 25 ml, standard solutions were prepared by using K cl and Na cl
to get standard curve for K and Na respectively. After that prepared samples were measured by flame
photometer (Jenway, PFP7/Germany) to detect absorbance for K and Na, the concentration expressed as (ppm)
which got it from standard curve.
Statistical analysis:
The statistical analysis was carried out for data on this experience according to Complete Randomized
Design 28
in order to determine the impact of health state of persons on D-Dimer, Troponin, cholesterol, urea,
glucose, Na, K. Using the mathematical model.
It was the comparison between the averages using the Duncan test (Duncan 1955) at the level of
probability of 5% or 1% to test the significant differences between the averages of traits and applying the SAS
method (2002).
Results:
1- Correlation of mean D-dimer level between control group and patients group.
Mean D-dimer level was increased high significant (P < 0.01) in patients group (96.19 ngm/ml),
compare to control group (51.97 ngm/ml). See figure 1.
Figure 1 : Correlation of mean D. dimer level between control group and patients group.
2- Correlation of mean Troponin T level between control group and patients group.
The mean Troponin T level was increased high significant (P < 0.01) in patients group (136 pgm/ml),
compare to control group (26.22 pgm/ml). See figure 2.
0
50
100
150
1
51.97
96.19
D.dimer
Total Control Total Patient

Ali Kareem Hameed et al /International Journal of PharmTech Research, 2016,9(11): 334-346. 341
Figure 2: Correlation of mean Troponin T level between control group and patients group.
3- Correlation of mean glucose level between control group and patients group.
The mean glucose level was increased high significantly (P < 0.01) in patients group (208.3 mg/l),
compare to control group (129.11 mg/dl). See figure3.
Figure 3 : Correlation of mean glucose level between control group and patients group.
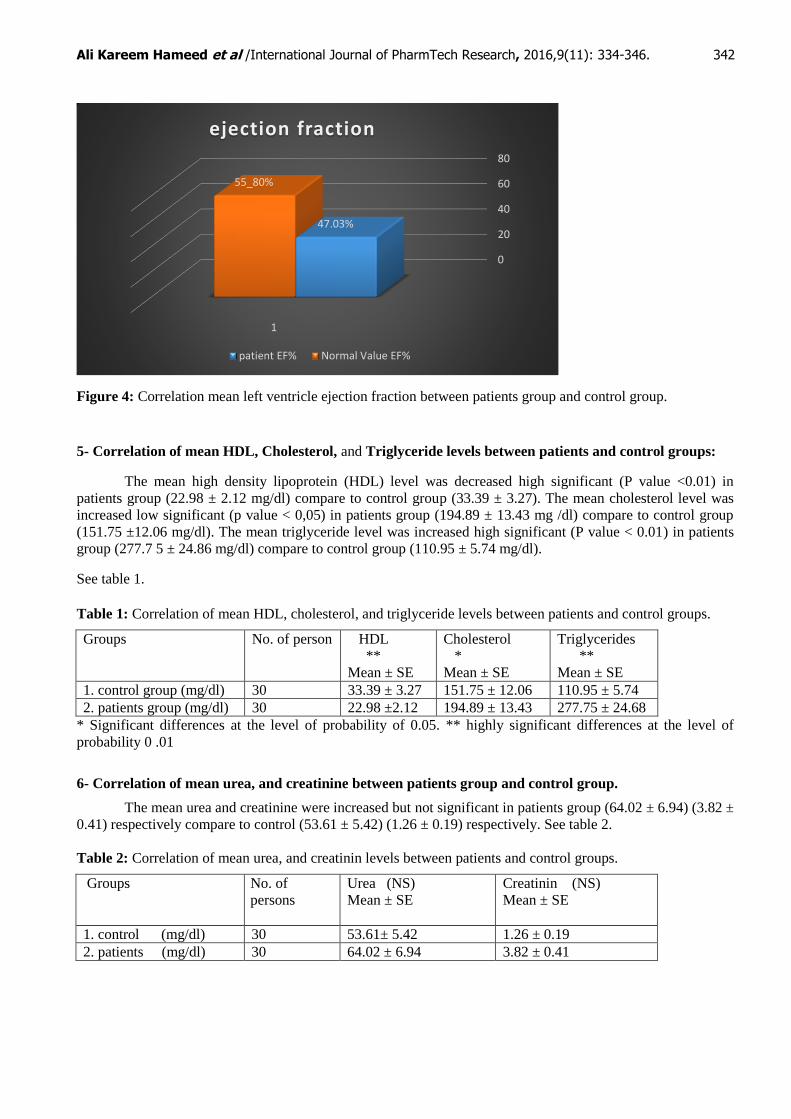
4- Correlation of mean LVEF between normal and patient persons:
Left ventricular ejection fraction =55 -80% in normal person, while mean ejection fraction in acute
coronary patients = 47.03%. See figure 4.
0
50
100
150
1
26.22
136.57
Troponin T
Total Control Total Patient
0
50
100
150
200
250
1
129.11
208.3
Glucose Level
Total Control Total Patient
Ali Kareem Hameed et al /International Journal of PharmTech Research, 2016,9(11): 334-346. 342
Figure 4: Correlation mean left ventricle ejection fraction between patients group and control group.
5- Correlation of mean HDL, Cholesterol, and Triglyceride levels between patients and control groups:
The mean high density lipoprotein (HDL) level was decreased high significant (P value <0.01) in
patients group (22.98 ± 2.12 mg/dl) compare to control group (33.39 ± 3.27). The mean cholesterol level was
increased low significant (p value < 0,05) in patients group (194.89 ± 13.43 mg /dl) compare to control group
(151.75 ±12.06 mg/dl). The mean triglyceride level was increased high significant (P value < 0.01) in patients
group (277.7 5 ± 24.86 mg/dl) compare to control group (110.95 ± 5.74 mg/dl).
See table 1.
Table 1: Correlation of mean HDL, cholesterol, and triglyceride levels between patients and control groups.
Groups No. of person
HDL
**
Mean ± SE
Cholesterol
*
Mean ± SE
Triglycerides
**
Mean ± SE
1. control group (mg/dl) 30 33.39 ± 3.27 151.75 ± 12.06 110.95 ± 5.74
2. patients group (mg/dl) 30 22.98 ±2.12 194.89 ± 13.43 277.75 ± 24.68
* Significant differences at the level of probability of 0.05. ** highly significant differences at the level of
probability 0 .01
6- Correlation of mean urea, and creatinine between patients group and control group.
The mean urea and creatinine were increased but not significant in patients group (64.02 ± 6.94) (3.82 ±
0.41) respectively compare to control (53.61 ± 5.42) (1.26 ± 0.19) respectively. See table 2.
Table 2: Correlation of mean urea, and creatinin levels between patients and control groups.
Groups No. of
persons
Urea (NS)
Mean ± SE
Creatinin (NS)
Mean ± SE
1. control (mg/dl) 30 53.61± 5.42 1.26 ± 0.19
2. patients (mg/dl) 30 64.02 ± 6.94 3.82 ± 0.41
0
20
40
60
80
1
47.03%
55_80%
ejection fraction
patient EF% Normal Value EF%

Ali Kareem Hameed et al /International Journal of PharmTech Research, 2016,9(11): 334-346. 343
7- The correlation of mean Na ions and K ions between patients group and control group.
The mean Na ions and K ions were increased but not significant in patients group (20.08 ±2. 40) (6.80
±0.89) respectively compare to control group (16.50 ±1.95) (5.20 ± 0.72) respectively. See table 3.
Table 3: The correlation of Na ions and K ions levels between patients and control groups.
Groups No. of persons Na (NS)
Mean ± SE
K (NS)
Mean ± SE
Control 30 16.50 ± 1.95 (mmol/L) 5.20 ± 0.72 (mmol/L)
Patients 30 20.08 ± 2.40 (mmol/L) 6.80 ± 0.89 (mmol/L)
8 - Sensitivity and Specificity:
Sensitivity of D-dimer = number positive subject/ number of disease x
100 = 23/ 30 x 100 = 77 %
Sensitivity of Troponin T = number of positive subject / number of disease
x100 = 21/30 x 100 = 70%.
Specificity of D-dimer = number of negative subjects / number of control
group x 100= 29 /30 x 100 = 97%
Specificity of Troponin T = number of negative subject / number of control
group x 100 = 27 / 30 x 100 = 90%
Discussion:
1-The mean D-dimer level increase significantly (P < 0.05) in patients group, compare to control group in
acute coronary syndrome, figure 1.
This result was agree with previous result by (29) in which there was statically significant difference in
the level of D-dimer (P <0.001) between patients group and control group, with different sample size (Orak et1
al., study, patients group 153, and control group 88).
2- The mean troponin T level was increased significantly (P < 0.01) in patients group compare to control
group, figure 2.
This result was agree with (30) who mentioned that cardiac troponin T was elevated in patients of acute
coronary syndrome compared with control (P <0, 001). Different degree of significant may be due to different
size of samples and different races.
3- The mean Glucose level was increased significantly (P < 0.01) in patients group compare to control
group, figure 3.
This result agree with result of 31
who mentioned that glucose intolerance is common in Japanese
patients, high prevalence of hyperglycemia which was primary caused by impaired insulin secretion with acute
coronary syndrome who were no previously diagnosed with diabetes.
4-The mean high density lipoprotein (HDL) level was increased significantly (P value <0.01) in control
group compare to patient group. The mean cholesterol level was increased significantly (p value < 0.05) in
patients group compare to control group. The mean triglyceride level was increased significantly (P value
< 0.01) in patients group compare to control group, table 1.
This result in current study agree with study performed by 32
, who stated that there were low level of
HDL, high level of cholesterol and high level of triglyceride in patients group at high risk of cardiovascular
disease.

Ali Kareem Hameed et al /International Journal of PharmTech Research, 2016,9(11): 334-346. 344
5-The mean urea and creatinine were increased but not significant in patients group compare to control
group. See table 2.
This result was agreed with 33
, who mentioned that an increased level of BUN is more significant risk
factor for ACS outcome than that of creatinine.
6-The mean Na ions and K ions were increased but not significant in patients group compare to control
group. See table 3.
The study by 34
who mentioned that the levels of serum sodium were showing significant increase in
patients of acute coronary syndrome. This result agrees with present study with different in size of samples.
While serum potassium showed significant decrease in patients of acute coronary syndrome by Faraj study,
may be due to diuretic therapy associated with decrease serum potassium level.
7- Sensitivity of D-Dimer = 77 %, while sensitivity of Troponin T = 70%. Specificity of D-Dimer = 97%,
while specificity of Troponin T = 90%. So D-Dimer can be used as biomarker in detection of cardiac injury
better than Troponin T.
8- Left ventricular ejection fraction =55 -80% in normal person, while mean ejection fraction in acute
coronary patients = 47.03%. This result agrees with Bosch and Theroux, 2005, Who said that lef ventricular
fraction is 48% in patients with non ST-segment elevation in acute coronary syndrom because injury of
myocardium tissue.
Recommendation:
1- Our study need to be confirmed in larger group in future studies.
2- Use D-Dimer to detect acute coronary syndrome and acute myocardial infarction instead of troponin T as
biomarker because specificity of D-dimer was 96 % while specificity of troponin T was 90 %, also D-Dimer
was detected earlier rise than common markers of cardiac injury.
3- Restrict of exercise in patients of myocardial infarction for six weeks and stop of smoking.
4-Reduce weight gain by regular exercise and lower hyperlipidemia.
5-Treat hypertensive and diabetic patient properly to prevent risk factors.
References:
1. Colledge NR, Walker BR, Ralston SH, 2010. Davidson's principle and practice of medicine, 21st
edition, Churchil and Elsivier Company.
2. Tokita Y, Kusssama Y, Kodani E, Tadera T, Nakagomi A, Atarashi H, and Mizuno K, 2009. Utility of
rapid D-dimer measurement for screening of acute cardiovascular disease in the emergency setting.
Cardiology; 53: 334 – 340.
3. McDonnell B., Hearty S., Leonard P., O'Kennedy R., 2009. Cardiac biomarkers and the case for point-
of-care testing. Clinical Biochemistry; 42: 549 –561.
4. Hamm CW, Bassand JP, Agewall S, et al, 2011. ESC guidelines for the management of acute coronary
syndromes in patients presenting without persistent ST-segment elevation. Eur Heart J.; 32(23):2999–
3054.
5. Rao KM, Pieper CS, Currie MS, et al., 1994. Variability of plasma IL-6 and cross-linked fibrin dimers
over time in community dwelling elderly ubjects. Am J Clin Pathol; 102: 802 – 805.
6. Bayes-Genis A, Mateo J, Santalo M, et al., 2000. D-dimer is an early diagnostic marker of coronary
ischemia in patients with chest pain. Am Heart J.; 140(3):379–84.
7. Norell M, Lythall D, Goghlan G, et al., 1992. Limited value of the resting electrocardiogram in
assessing patients with recent onset chest pain: lessons from a chest pain clinic. Br Heart J; 67: 53 – 56.
Ali Kareem Hameed et al /International Journal of PharmTech Research, 2016,9(11): 334-346. 345
8. Silbernagl S, and Lang F, 2006. Color Atlas of pathophysiology, international edition by Thieme
Company, New York.
9. Babu AS, Haneef M, and Noone MS, 2010. Risk factors among patients with acute coronary syndrome
in rural Kerada. Indian J Community Med; 35 (2): 364 – 365.
10. Verma N, Willcke P, Bicsan P, Lebiedz P, Pavenstadt H, Kumpers P, 2014. Age –adjusted D-dimer cut-
off to diagnose thromboembolic events: validation emergency department. Med Klin Intensivmed
Notfind; 109 (2): 121 – 128.
11. Akutsu K, Sato N, Yamamoto T, Morita N, Takagi H, Fujita N, Tanaka K, Takano T, 2005. A rapid
bedside D-dimer assay (cardiac D-dimer) for screening of clinically suspected acute aortic dissection. ?
12. Daun EJ, Ariëns RAS, 2004. Fibrinogen and fibrin clot structure in diabetes. Herz.; 29: 470-479.
13. Szymanski FM, Karpinski G, Filipiak KJ, et al., 2013. Usefulness of the D-dimer concentration as
predictor of mortality in patients with out-of-hospital cardiac arrest. A m J Cardiol.;112 (4): 467 – 471.
14. Hahne K, Lebiedz P, and Breukmann F, 2014. Impact of D-dimers on the differential diagnosis of acute
chest pain. Cardiology; 8(2): 1 – 4.
15. Anderson, J., Adams, C., Antman, E., Bridges, C.R., Califf, R.M. et al. (2007). Angina/Non-ST-
Elevation Myocardial Infarction. Circulation; 116: 803-877.
16. Amodio G, Antonelli G, Varraso L, Ruggieri V, Di Serio F, 2007. Clinical impact of the troponin 99th
percentile cut-off and clinical utility of myoglobin measurement in the early management of chest pain
patients admitted to the emergency cardiology department. Coron Artery Dis.; 18: 181–186.
17. Mahmarian JJ, 2007. The troponin conundrum: clarification through stress myocardial perfusion
SPECT. J Nucl Cardiol;14: 6–8.
18. Hamwi SM, Sharma AK, Weissman NJ, et al, 2003. Troponin-I elevation in patients with increased left
ventricular mass. Am J Cardiol.; 92:88–90.
19. Thygesen K, Alpert JS, and White HD, 2007. Universal definition of myocardial infarction. J Am Coll
Cardiol;50: 2173–95.
20. Mahajian VS, Jarolim P, 2011. How to interpret elevated cardiac troponin levels. Circulation; 124:2350
– 2354.
21. Barrett KE, Barman SM, Boitano S, Brook HL, 2016. Ganong's review of medical physiology, 25th
edition, international edition by McGraw Hill Company.
22. Salazar JH, 2014. Overview of urea and creatinine. Lab Med; 45 (1): e19 – e20.
23. Bullock J, Boyle J, Wang MB, 2001. Fourth edition physiology, by A Wolters Kluwer Company, USA.
24. Hall JE, 2016. Textbook of medical physiology, Thirteenth edition, international edition, ELSEVIER
company, Philadephia.
25. Lewis SM, Bain BJ, Bates IB, 2006. Dacie and Lewis practical haematology, tenth edition, Elsevier
Company.
26. Human D-dimer ELISA kit, Elabscience Biotech CO., LTD.. Lot No AK0015JUL28013. 28-07-2015.
27. Human Troponin T ELISA kit. Elabscience Biotech CO., LTD.. Lot No AK0015JUL28013 28-07-
2015.
28. AL-Rawi, Kh.M., Khalaf-Allah A.M. (2000).Design and Analysis of Agricultural Experiments. Dar
AL-Kutob press for printing and publishing.
29. Orak M, Ustundag M, Guloglu C, Alyan O, Sayhan MB, 2010. The role of serum D-dimer level in the
diagnosis of patients admitted to the emergency department complaining of chest pain. J Int Med Res.;
38(5): 1772 – 1779.
30. Reddy GC, Kusumanjali G, Sharada A.H.R, and Rao P, 2004. Cardiac troponin T levels in cardiac and
non cardiac disease. Indian Journal of Clinical Biochemistry;19 (2) 91-94
31. Hashimto k, Ikewaki K, Yagi H, Nagasama, Imamoto S, Shibata T, Mochizuki S, 2005. Glucose
intolerance is common in Japanes patients with acute coronary syndrome who were no previously
diagnosed with diabetes. Diabetes Care; 28: 1182 – 1186.
32. Chapman MJ, Girsberg HN, Amarence P, et al., 2011. European Atherosclerosis Society Consensus
Panel. Triglyceride-rich lipoproteins and high-density lipoprotein cholesterol in patients at high risk of
cardiovascular disease: evidence and guidance for management. Eur Heart J; 32:1345-1361.
33. Saygitov RT, Glezer MG and Semakina SV, 2010. Blood urea nitrogen and creatinine levels at
admission for mortality risk assessment in patients with acute coronary syndromes. Emerg Med J;27:
105-109.

Ali Kareem Hameed et al /International Journal of PharmTech Research, 2016,9(11): 334-346. 346
34. Faraj HR, 2015. Clinical study of some electrolyte (sodium, chloride and potassium) with patients in
acute coronary syndrome (ACS) in Thi-Qar Governorate, Iraq. International Journal of Current
Microbiology and Applied Sciences; 4 (3): 700 – 705.
*****