Embed Size (px)
Citation preview

This article was originally published in a journal published byElsevier, and the attached copy is provided by Elsevier for the
author’s benefit and for the benefit of the author’s institution, fornon-commercial research and educational use including without
limitation use in instruction at your institution, sending it to specificcolleagues that you know, and providing a copy to your institution’s
administrator.
All other uses, reproduction and distribution, including withoutlimitation commercial reprints, selling or licensing copies or access,
or posting on open internet sites, your personal or institution’swebsite or repository, are prohibited. For exceptions, permission
may be sought for such use through Elsevier’s permissions site at:
http://www.elsevier.com/locate/permissionusematerial
Autho
r's
pers
onal
co
py
International Journal of Impact Engineering 34 (2007) 1683–1704
Analytical calculation of blast-induced strains to buried pipelines
George P. Kouretzisa, George D. Bouckovalasa,�, Charis J. Gantesb
aDepartment of Geotechnical Engineering, Faculty of Civil Engineering, National Technical University of Athens, 9, Iroon Polytehniou Street
GR-157 80, Athens, GreecebDepartment of Structural Engineering, Faculty of Civil Engineering, National Technical University of Athens, 9, Iroon Polytehniou Street
GR-157 80, Athens, Greece
Received 24 August 2005; received in revised form 14 May 2006; accepted 30 August 2006
Available online 15 November 2006
Abstract
The aim of this paper is to introduce a robust methodology for the analytical calculation of strains in flexible buried
pipelines due to surface point-source blasts. Following a brief bibliographic overview regarding the characteristics of
ground waves produced by surface explosions, a method used to model wave propagation with radial attenuation and
spherical front is presented. Strains due to P- and Rayleigh waves, which dominate the waveform generated by an
explosion, are accordingly calculated by modeling the pipeline as a three-dimensional (3-D) cylindrical thin shell and
ignoring soil–structure interaction. To simplify the design procedure, a set of easy-to-use relations for the calculation of
maximum strains and their position along the pipeline axis is supplied. The derived expressions are evaluated through
comparison against 3-D dynamic numerical analyses, field strain measurements in flexible pipelines due to a series of full
scale blasts, and state-of-practice design methods. Comparisons show that the proposed methodology provides improved
accuracy at no major expense of simplicity, as well as the advantage of properly accounting for the effect of local soil
conditions.
r 2006 Elsevier Ltd. All rights reserved.
Keywords: Blast; Buried pipelines; Shell theory; Design; Safety distance
1. Introduction
Despite the remarkable expansion in the use of buried pipeline networks over the last few years, limitedfresh literature refers to their design against ground shock wave propagation. In fact, seismic design of buriedpipelines is still based on the expressions proposed by Newmark [1] and Kuesel [2]. This is due to the fact thatearthquake induced ground motion is rarely strong enough to affect steel pipelines, as proven by their in situresponse in various earthquakes. Nevertheless, accidental or intended surface explosions (e.g. an accident in anexplosive storage facility or routine quarry blasts) may generate ground waves with significant amplitude inshort distance from the source of the explosion, much larger than that originating from a strong earthquake,and prove threatening for the pipeline. The precise calculation of the safety distance from the source of a
ARTICLE IN PRESS
www.elsevier.com/locate/ijimpeng
0734-743X/$ - see front matter r 2006 Elsevier Ltd. All rights reserved.
doi:10.1016/j.ijimpeng.2006.08.008
�Corresponding author. Tel.: +30210 772 3780; fax: +30210 772 3428.
E-mail address: [email protected] (G.D. Bouckovalas).

Autho
r's
pers
onal
co
py
potentially threatening explosion could be of outmost importance for the rational design of a pipeline, as over-conservative estimates can lead to unnecessary re-routing, and to a disproportionate increase in the cost of theproject.
The design of pipelines against blasts is based today either on analytical relations originally proposed forseismic waves with plane front and constant amplitude [3] or by an empirical relation initially proposed byEsparza et al. [4] and lately embraced by the ASCE-ALA guidelines [5]. It is realized that the first approach is arather crude approximation, which was merely employed to provide conservative estimates in the absence ofany problem-specific solutions. On the contrary, the later approach has been developed specifically for theproblem at hand, based on an experimental database for blast-induced strains on instrumented pipe segments.Nevertheless, this approach is purely empirical, and consequently its range of application should be limited toconditions similar to the conditions prevailing in the relevant experiments.
This paper aims at filling this gap in the modern literature by presenting a new analytical methodology forcalculating strains in buried pipelines due to surface point-source blasts. The proposed methodologyincorporates three-dimensional (3-D) thin shell theory for the accurate modeling of the pipeline response andproperly accounts for the spherical front and the radial attenuation of ground vibration induced by blastwaves. The methodology is mainly intended for the design of buried steel pipelines, but its assumptions arealso valid for flexible pipelines made of other materials such as PVC.
It is acknowledged that the theoretical derivation of pipeline strains with the proposed methodology israther complex, and difficult to follow during this, necessarily concise, presentation. For this reason, emphasisis placed upon the basic assumptions of the methodology, while the analytical results are evaluated with theaid of 3-D dynamic numerical simulations of the pipeline response, and compared to field strain measurementsin flexible pipelines due to a series of full-scale blasts [6]. Furthermore, easy-to-use design relations areestablished for use in practical applications.
2. Ground shock waves induced by a surface explosion
In a simple way, surface point-source blasts may be simulated as a time-dependent vertical point load actingon the surface of a homogeneous, isotropic, elastic half space (Fig. 1a). This is commonly referred as Lamb’sproblem, after the name of the researcher who first formulated it and solved it [7]. Keeping in mind that the
ARTICLE IN PRESS
x
y
z
r
F(t)
P
radi
al p
artic
le v
eloc
ity
0 0.2 0.4 0.6 0.8
time (sec)
vert
ical
par
ticle
vel
ocity
amplified
time
F
-T/2 T/20
(a)
(b) (c)
�
Fig. 1. (a) Definition of the cylindrical coordinate system used in the analytical evaluation of the response of an elastic half-space to the
concentrated dynamic load shown in (b). Typical resulting peak particle velocity time histories are illustrated in (c) (after Mooney [8]).
G.P. Kouretzis et al. / International Journal of Impact Engineering 34 (2007) 1683–17041684
Autho
r's
pers
onal
co
py
load, as well as the geometry, is vertically axisymmetric, the transverse component of ground displacement isneglected and the dynamic equations of motion are solved in the two-dimensional (2-D) space, i.e. in thevertical plane through the center of the explosion.
Mooney [8] was among the first researchers to provide a series of closed-form solutions for the calculationof the displacements and velocities resulting from the application of a bell-shaped load pulse, described byEq. (1) (Fig. 1b):
F tð Þ ¼ F cos2pt
T
� �where � T=2ptpT=2, (1)
where F and T are the amplitude and the total duration of the pulse, respectively, while t stands for time.Mooney’s predictions show that both the radial as well as the vertical component of particle velocity
attenuate exponentially with the distance from the source. The relation between the peak particle velocity Vmax
and the distance R can be written under the general form [8]
Vmax ¼ E R�n. (2)
Constant E is a function of the load and the medium characteristics, while the attenuation exponent n
depends on the properties of the half-space as well as the radial distance. Namely, n in the near field obtainsvalues between 1.27 and 0.84, and is further reduced between 0.72 and 0.42 at larger radial distances. Thepredicted response in the near field reflects the attenuation of compressional (P) waves, while in the far field itreflects the slower attenuation of surface Rayleigh (R) waves.
Fig. 1c illustrates two typical particle velocity time histories, one for the radial and the other for the verticalcomponent of the ground motion, obtained from the analytical solution of Mooney [8]. It should be noted thatboth time histories refer to the far-field, a fact that justifies the rather long time lag between the arrival of thetwo waveforms, and the small amplitude of the P-wave with respect to the amplitude of the Rayleigh wave. Byexamining both waveforms, it is observed that:
(a) as expected, the arrival of P waves precedes the arrival of Rayleigh waves,(b) the amplitude of the vertical component of the P wave is negligible compared to the amplitude of its radial
component,(c) the arrival of Rayleigh waves is signaled by a smooth positive (upward) change of the vertical velocity and
a steep negative (downward) change in the radial velocity,(d) S-waves are overshadowed by the practically concurrent arrival of Rayleigh waves with larger amplitude.
It should be reminded here that all the above are valid for an elastic medium. In fact, actual soil behavior iselasto-plastic and its hysteretic damping cannot be considered in an analytical solution. Non-linear dynamicnumerical analyses [9] verify that the value of the attenuation exponent is associated with the propagation of Pwaves in the near field and Rayleigh waves in larger distances, as suggested by the analytical solution.However, the numerically predicted attenuation rates depend on the soil characteristics, and are much largerthan the analytically predicted ones [9,10].
A number of empirical attenuation relations in the general form of Eq. (2) have been proposed in theliterature for the approximate calculation of the peak particle velocity. However, most of them concern deepunderground explosions at purely rock sites, and are not directly applicable to the problem studied herein.Only a few publications (e.g. [6,11–13]) refer to wave propagation from surface or near-surface blasts andpropose relations which are applicable to soil and rock formations alike.
3. Methodology outline and assumptions
As mentioned above, the proposed methodology applies to long and flexible cylindrical pipelines. In moredetail, the following assumptions are adopted with regard to the pipeline behavior:
(a) The inertia and kinematic interaction effects between the buried pipeline and the surrounding soil can beignored. Theoretical arguments and numerical simulations plead for the general validity of the former
ARTICLE IN PRESSG.P. Kouretzis et al. / International Journal of Impact Engineering 34 (2007) 1683–1704 1685
Autho
r's
pers
onal
co
py
statement regarding inertia effects [14], while the importance of kinematic interaction effects can bechecked on a case-by-case basis via the flexibility index:
F ¼2Em 1� n2l
� �D=2� �3
El 1þ nmð Þt3s, (3)
where Em is the Young’s modulus of the surrounding soil, El the Young’s modulus of the pipe material,nm the Poisson’s ratio of the surrounding soil, nl the Poisson’s ratio of the pipe material, ts the thickness ofthe cross-section, and D the pipe diameter.The flexibility index is related to the ability of the lining to resist distortion from the ground [15]. Values ofthe flexibility index higher than 20 are obtained for most common pipelines, indicating that ignoringoverall the soil–structure interaction is a sound engineering approach [6,16,17]. Moreover, keeping in mindthat, even in very stiff soil or rock formations, the wavelength of blast-induced strong motion does notexceed 10m [3], i.e. it is much smaller than typical pipeline diameters, wave scattering effects in thesoil–pipeline boundary are considered negligible, and are ignored herein. As a result from the above, thepipeline here is assumed to fully conform to the ground motion, and its displacements are considered equalto those of the surrounding soil. The validity of this assumption is also verified experimentally via blast-induced displacement time history measurements on flexible pipelines and in the surrounding soil,presented by Siskind et al. [6].
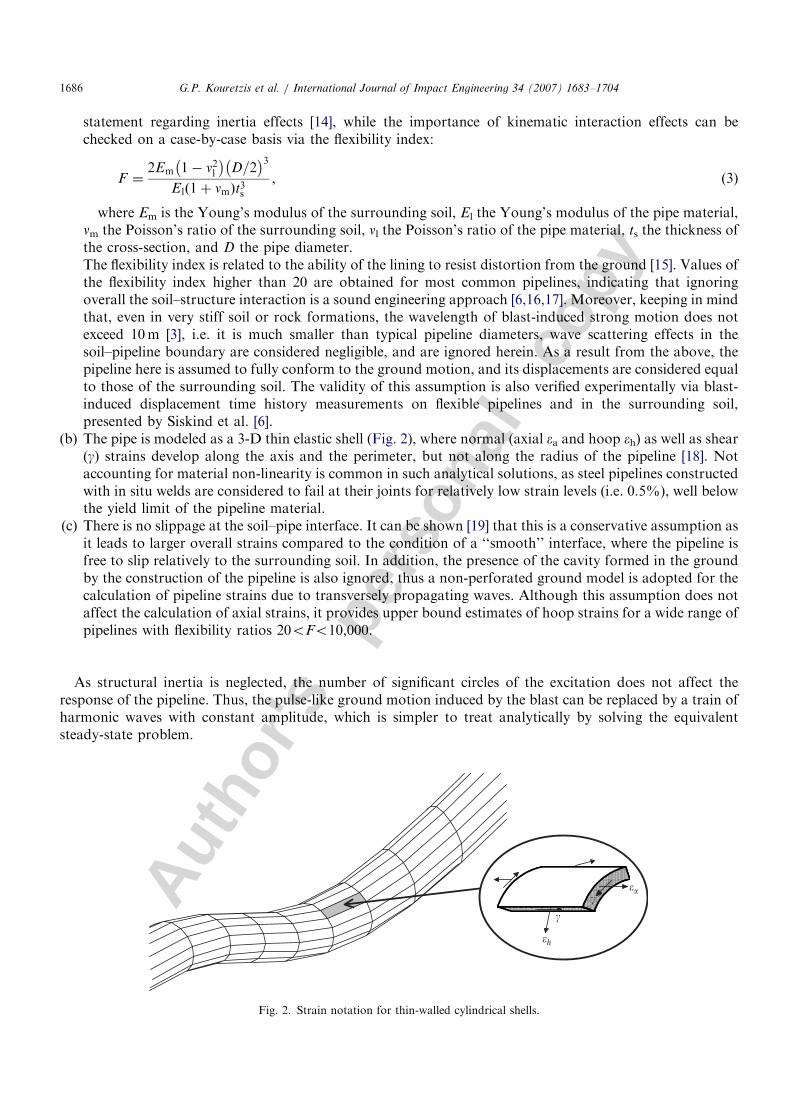
(b) The pipe is modeled as a 3-D thin elastic shell (Fig. 2), where normal (axial ea and hoop eh) as well as shear(g) strains develop along the axis and the perimeter, but not along the radius of the pipeline [18]. Notaccounting for material non-linearity is common in such analytical solutions, as steel pipelines constructedwith in situ welds are considered to fail at their joints for relatively low strain levels (i.e. 0.5%), well belowthe yield limit of the pipeline material.
(c) There is no slippage at the soil–pipe interface. It can be shown [19] that this is a conservative assumption asit leads to larger overall strains compared to the condition of a ‘‘smooth’’ interface, where the pipeline isfree to slip relatively to the surrounding soil. In addition, the presence of the cavity formed in the groundby the construction of the pipeline is also ignored, thus a non-perforated ground model is adopted for thecalculation of pipeline strains due to transversely propagating waves. Although this assumption does notaffect the calculation of axial strains, it provides upper bound estimates of hoop strains for a wide range ofpipelines with flexibility ratios 20oFo10,000.
As structural inertia is neglected, the number of significant circles of the excitation does not affect theresponse of the pipeline. Thus, the pulse-like ground motion induced by the blast can be replaced by a train ofharmonic waves with constant amplitude, which is simpler to treat analytically by solving the equivalentsteady-state problem.
ARTICLE IN PRESS
�h
��
�
�
Fig. 2. Strain notation for thin-walled cylindrical shells.
G.P. Kouretzis et al. / International Journal of Impact Engineering 34 (2007) 1683–17041686
Autho
r's
pers
onal
co
py
Ground waves are assumed to propagate from the center of the point-source explosion with a sphericalwave front. The attenuation of the peak particle velocity with the distance from the source, regardless of thewave type that it is attributed to, is quantitatively described by Eq. (2). For harmonic waves, Eq. (2) can be re-written in terms of displacement as
Amax ¼ A R=d� ��n
, (4)
where
A ¼ E=2pn� �
d�n (5)
is the maximum ground displacement at the projection of the explosion source on the pipe (Point O in Fig. 3),n is the frequency of the harmonic wave, d is the distance of the explosion source from the pipe axis (Fig. 3),and
R ¼ffiffiffiffiffiffiffiffiffiffiffiffiffiffiffiz2 þ d2
p. (6)
If the elevation of the pipeline axis relatively to the source of the explosion is equal to H, distance d isexpressed as
d ¼
ffiffiffiffiffiffiffiffiffiffiffiffiffiffiffiffiffid2h þH2
q, (7)
where dh is the horizontal distance between the pipeline and the point source. However, for the case of near-surface blasts examined here, H is considered much smaller than dh and will be neglected hereafter.
In the following sections, strains on the pipeline are computed analytically by considering the action of P-and Rayleigh waves, that appear to dominate the response in small and larger distances from the source of theexplosion, respectively [8,9].
4. Strain analysis for P waves
Consider a harmonic P wave propagating with spherical front in the horizontal plane and a pipelineconstructed at horizontal distance d from the center of the explosion (Fig. 3). Referring to a polar coordinatesystem originating from the center of the explosion, the corresponding ground motion can be expressedanalytically as
uR ¼ Amax sin2pL
R� Cpt� �� �
, (8)
where Cp is the propagation velocity of P waves, L ¼ CpT the wavelength, T the wave period, Amax themaximum ground displacement at radial distance R from the source, and t stands for time.
To aid the analytical computation of strains, ground displacement is vectorially decomposed into twocomponents (Fig. 3): one with motion parallel to the undeformed pipe axis and the other with motionperpendicular to it. As the deformation of the surrounding soil is transferred unaltered to the buried structure,the displacements induced on each point of a 3-D cylindrical shell with radius r equal to the radius of thepipeline will be
ux ¼ Amax cos o sin2pL
R0 � Cpt� �� �
, (9)
uy ¼ 0, (10)
uz ¼ Amax sin o sin2pL
R0 � Cpt� �� �
, (11)
where
o ¼ arctanz
d þ r sin y
and R0 ¼
ffiffiffiffiffiffiffiffiffiffiffiffiffiffiffiffiffiffiffiffiffiffiffiffiffiffiffiffiffiffiffiffiffiffiffiffiffiz2 þ d þ r sin yð Þ
2
q. (12)
ARTICLE IN PRESSG.P. Kouretzis et al. / International Journal of Impact Engineering 34 (2007) 1683–1704 1687
Autho
r's
pers
onal
co
py
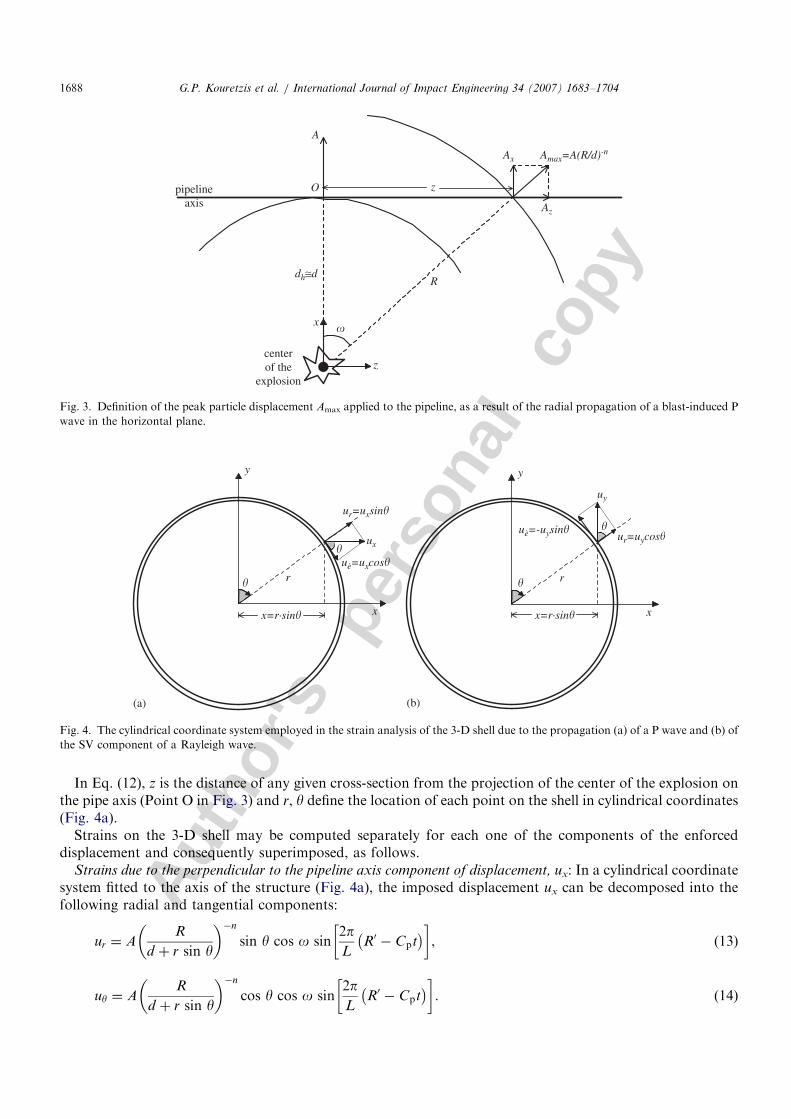
In Eq. (12), z is the distance of any given cross-section from the projection of the center of the explosion onthe pipe axis (Point O in Fig. 3) and r, y define the location of each point on the shell in cylindrical coordinates(Fig. 4a).
Strains on the 3-D shell may be computed separately for each one of the components of the enforceddisplacement and consequently superimposed, as follows.
Strains due to the perpendicular to the pipeline axis component of displacement, ux: In a cylindrical coordinatesystem fitted to the axis of the structure (Fig. 4a), the imposed displacement ux can be decomposed into thefollowing radial and tangential components:
ur ¼ AR
d þ r sin y
�n
sin y cos o sin2pL
R0 � Cpt� �� �
, (13)
uy ¼ AR
d þ r sin y
�n
cos y cos o sin2pL
R0 � Cpt� �� �
. (14)
ARTICLE IN PRESS
x
y
ux
�
ur=uxsin�
uè=uxcos��
r
x=r·sin� x
y
uy
�
ur=uycos�uè=-uysin� �
r
x=r·sin�
(a) (b)
Fig. 4. The cylindrical coordinate system employed in the strain analysis of the 3-D shell due to the propagation (a) of a P wave and (b) of
the SV component of a Rayleigh wave.
z
x
Amax=A(R/d)-nAx
Az
pipelineaxis
A
dh≅dR
z
centerof the
explosion
�
O
Fig. 3. Definition of the peak particle displacement Amax applied to the pipeline, as a result of the radial propagation of a blast-induced P
wave in the horizontal plane.
G.P. Kouretzis et al. / International Journal of Impact Engineering 34 (2007) 1683–17041688

Autho
r's
pers
onal
co
py
According to the ‘‘elastic thin shell’’ assumption adopted herein [18], the corresponding strains in thestructure are calculated from the stress–displacement equations in cylindrical coordinates as
�a ¼ �zz ¼quz
qz¼ 0, (15)
�h ¼ �yy ¼1
r
quy
qyþ
ur
r¼
A
LR3R=d� ��n
� cos2 y 2d2pR cos2pL
R� Cpt� �� �
� Lz2 1þ nð Þ sin2pL
R� Cpt� �� �
, ð16Þ
g ¼ gyz ¼1
r
quz
qyþ
quy
qz¼
Azd
LR3R=d� ��n
� cos y 2pR cos2pL
R� Cpt� �� �
� L 1þ nð Þ sin2pL
R� Cpt� �� �
. ð17Þ
The resulting Eqs. (16) and (17) that provide the strains on the shell have been simplified by assuming thatthe radius of the pipeline r is small compared to the distance from the explosion d:
d þ r sin y � d or R0 � R. (18)
Strains due to the parallel to the pipeline axis component of displacement, uz: The harmonic displacement uz
induced to the shell (Eq. (11)) leads to the development of the following strains:
�a ¼ �zz ¼quz
qz¼
A
LR3R=d� ��n
� 2pz2R cos2pL
R� Cpt� �� �
þ L d2� nz2
� �sin
2pL
R� Cpt� �� �
, ð19Þ
�h ¼ �yy ¼1
r
quy
qyþ
ur
r¼ 0, (20)
g ¼ gyz ¼1
r
quz
qyþ
quy
qz¼
Az
dLR3R=d� ��n
� cos y 2d2pR cos2pL
R� Cpt� �� �
þ L �d2þ nz2
� �sin
2pL
R� Cpt� �� �
. ð21Þ
The shear strain calculated from Eq. (21) is in phase with the shear strain resulting from the ux componentof motion (Eq. (17)). Thus, the total shear strain on the cross-section will result from the superposition of theexpressions of Eqs. (21) and (17) or
g ¼Az
dLR3R=d� ��n
cos y 4d2pR cos2pL
R� Cpt� �� �
þL �d2 2þ nð Þ þ nz2� �
sin2pL
R� Cpt� �� �
. ð22Þ
Comparison with numerical analyses: To check the accuracy of the above analytical calculations, the effect ofblast-induced P waves on a cylindrical thin shell was simulated with a dynamic 3-D FEM analysis, conductedwith the commercially available code ANSYS [20]. It is clarified in advance that the aim of this comparisonwas not to check the validity of the assumptions, but only to check the complex mathematics that underlay thecomputation of shell strains.
Fig. 5 presents the geometry of the pipeline and the applied ground displacements resulting from the radialpropagation of a harmonic P wave with infinite duration. More specifically, the pipeline is modeled as a thin-walled cylindrical segment of 1m external diameter and 20mm wall thickness, at 10m distance from the centerof the explosion. Taking advantage of symmetry with regard to the projection of the center of the explosion onthe pipeline axis, only one-half of the pipeline segment is considered for the analysis, with a length of 30m
ARTICLE IN PRESSG.P. Kouretzis et al. / International Journal of Impact Engineering 34 (2007) 1683–1704 1689

Autho
r's
pers
onal
co
py(Fig. 5). The cylinder is discretized with 4-node shell elements with membrane and bending capabilities,using 16 equally sized, 0.4m long, elements per cross-section. The pipe material is considered to be isotropic,linear elastic with Young’s modulus El ¼ 210,000MPa, specific weight gl ¼ 75 kN/m3 and Poisson’s rationl ¼ 0.20. Note that the exact values of gl, El and nl are of absolutely no importance to the numerical results, asseismic strain components ea, eh and g are directly related to the imposed displacements alone (e.g. Eqs.(15)–(17)).
The displacement time history is harmonic, corresponding to a wave with period T ¼ 0.1 s and propagationvelocity C ¼ 100m/s. The amplitude of the strong motion attenuates exponentially with the distance from thesource according to Eq. (4), with A ¼ 1m and n ¼ 2.
As the pipeline fully conforms to the ground motion, the displacement of each node of the 3-D shell isconsidered equal to the corresponding ground displacement. Hence, in the Cartesian coordinate system thatwas adopted for the preceding strain analysis of the pipeline (Fig. 3), the displacement time histories applied atnode i are expressed by
ux;i ¼ ARi
xi
�n
sin oi sin2pL
Ri � Ctð Þ
� �, (23)
uz;i ¼ ARi
xi
�n
cos oi sin2pL
Ri � Ctð Þ
� �(24)
and
uy;i ¼ yx;i ¼ yy;i ¼ yz;i ¼ 0. (25)
In the above equations Ri ¼ffiffiffiffiffiffiffiffiffiffiffiffiffiffiffiz2i þ x2
i
p, oi ¼ arctan(zi/xi), while xi, zi are the coordinates of each node at the
aforementioned Cartesian system. It must be noted here that the amplitude of the ground motion is graduallyincreasing with time, and the maximum value is attained after 8 full cycles (Fig. 5). This provision is necessary
ARTICLE IN PRESS
0 0.4 0.8 1.2 1.6 2
time
-0.8
-0.4
0
0.4
0.8
u x, u
z
L=30m
D =1.0
0m
0.02m
0.40m
zi
pipeline cross-section y
zx
ux
uz
strong motion
axis ofsymmetryd =10m
center of theexplosion
Fig. 5. Mesh discretization of the 3-D numerical model and dynamically imposed displacements on a random node (this figure is out of
scale).
G.P. Kouretzis et al. / International Journal of Impact Engineering 34 (2007) 1683–17041690
Autho
r's
pers
onal
co
py
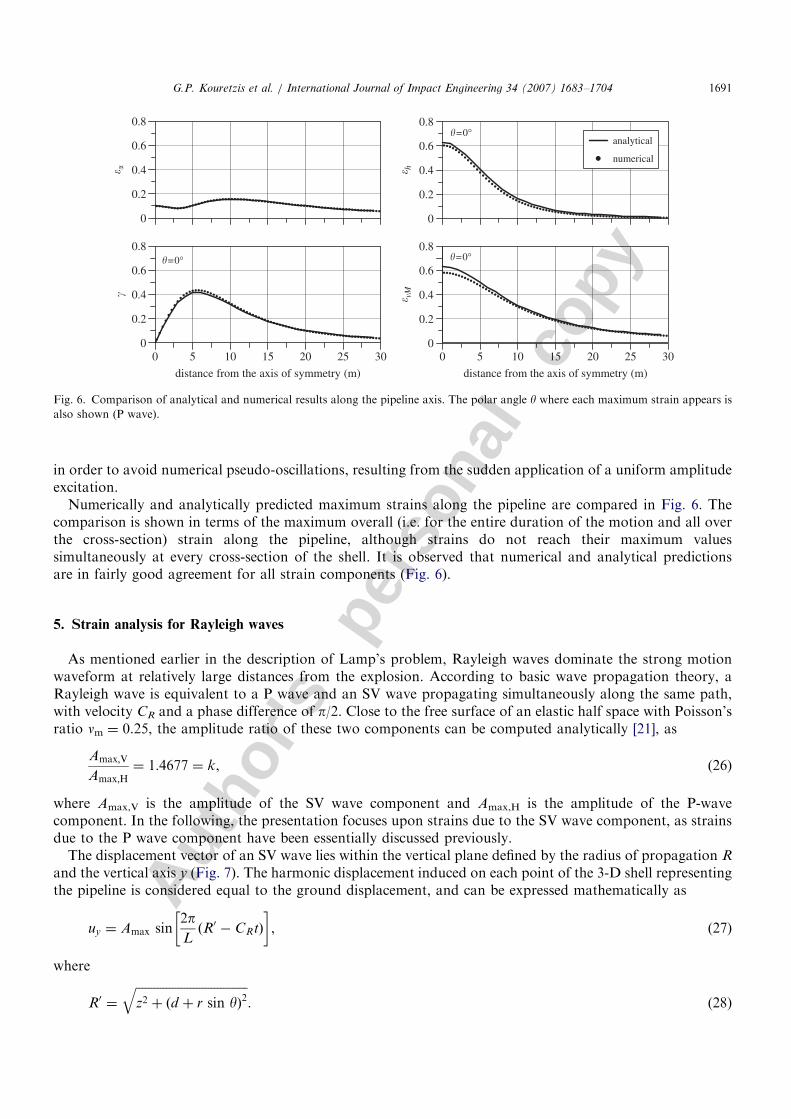
in order to avoid numerical pseudo-oscillations, resulting from the sudden application of a uniform amplitudeexcitation.
Numerically and analytically predicted maximum strains along the pipeline are compared in Fig. 6. Thecomparison is shown in terms of the maximum overall (i.e. for the entire duration of the motion and all overthe cross-section) strain along the pipeline, although strains do not reach their maximum valuessimultaneously at every cross-section of the shell. It is observed that numerical and analytical predictionsare in fairly good agreement for all strain components (Fig. 6).
5. Strain analysis for Rayleigh waves
As mentioned earlier in the description of Lamp’s problem, Rayleigh waves dominate the strong motionwaveform at relatively large distances from the explosion. According to basic wave propagation theory, aRayleigh wave is equivalent to a P wave and an SV wave propagating simultaneously along the same path,with velocity CR and a phase difference of p/2. Close to the free surface of an elastic half space with Poisson’sratio nm ¼ 0.25, the amplitude ratio of these two components can be computed analytically [21], as
Amax;V
Amax;H¼ 1:4677 ¼ k, (26)
where Amax,V is the amplitude of the SV wave component and Amax,H is the amplitude of the P-wavecomponent. In the following, the presentation focuses upon strains due to the SV wave component, as strainsdue to the P wave component have been essentially discussed previously.
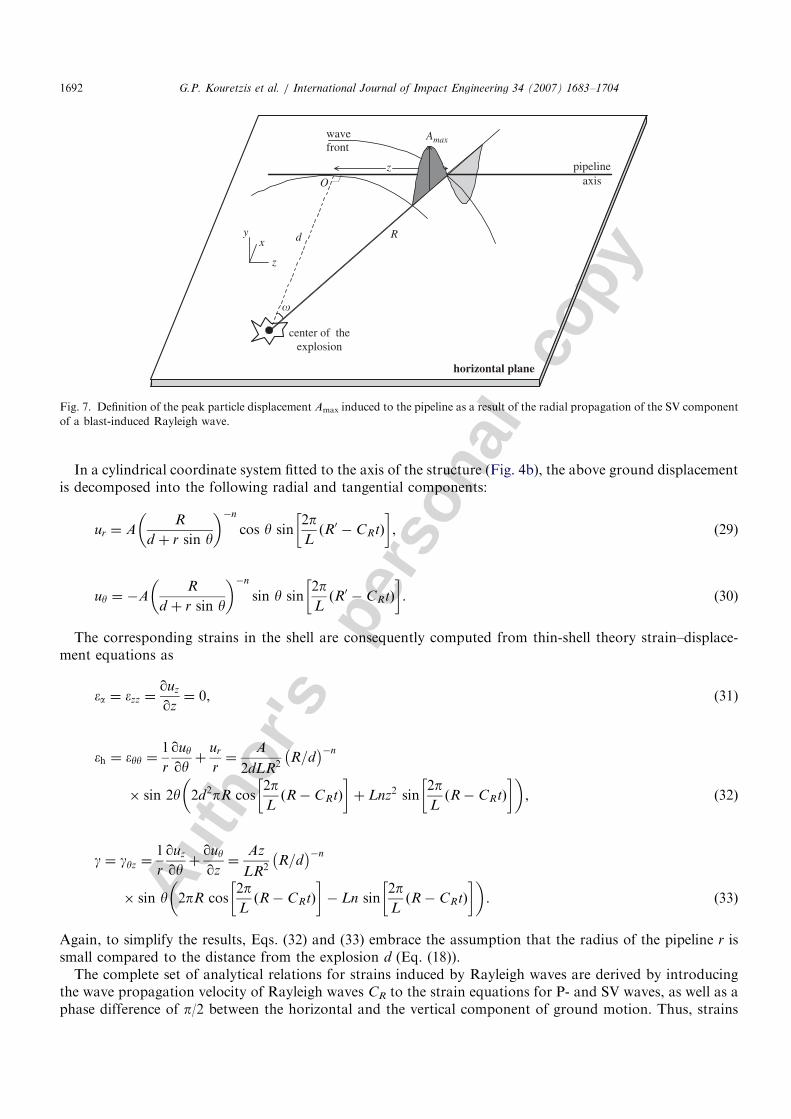
The displacement vector of an SV wave lies within the vertical plane defined by the radius of propagation R
and the vertical axis y (Fig. 7). The harmonic displacement induced on each point of the 3-D shell representingthe pipeline is considered equal to the ground displacement, and can be expressed mathematically as
uy ¼ Amax sin2pL
R0 � CRtð Þ
� �, (27)
where
R0 ¼
ffiffiffiffiffiffiffiffiffiffiffiffiffiffiffiffiffiffiffiffiffiffiffiffiffiffiffiffiffiffiffiffiffiffiffiffiffiz2 þ d þ r sin yð Þ
2
q. (28)
ARTICLE IN PRESS
0
0.2
0.4
0.6
0.8
� h
0 5 10 15 20 25 30
distance from the axis of symmetry (m)
0
0.2
0.4
0.6
0.8
0 5 10 15 20 25 30
distance from the axis of symmetry (m)
0
0.2
0.4
0.6
0.8
� vM
0
0.2
0.4
0.6
0.8
analytical
numerical
�=0° �=0°
�=0°
� ��
Fig. 6. Comparison of analytical and numerical results along the pipeline axis. The polar angle y where each maximum strain appears is
also shown (P wave).
G.P. Kouretzis et al. / International Journal of Impact Engineering 34 (2007) 1683–1704 1691
Autho
r's
pers
onal
co
py
In a cylindrical coordinate system fitted to the axis of the structure (Fig. 4b), the above ground displacementis decomposed into the following radial and tangential components:
ur ¼ AR
d þ r sin y
�n
cos y sin2pL
R0 � CRtð Þ
� �, (29)
uy ¼ �AR
d þ r sin y
�n
sin y sin2pL
R0 � CRtð Þ
� �. (30)
The corresponding strains in the shell are consequently computed from thin-shell theory strain–displace-ment equations as
�a ¼ �zz ¼quz
qz¼ 0, (31)
�h ¼ �yy ¼1
r
quy
qyþ
ur
r¼
A
2dLR2R=d� ��n
� sin 2y 2d2pR cos2pL
R� CRtð Þ
� �þ Lnz2 sin
2pL
R� CRtð Þ
� � , ð32Þ
g ¼ gyz ¼1
r
quz
qyþ
quy
qz¼
Az
LR2R=d� ��n
� sin y 2pR cos2pL
R� CRtð Þ
� �� Ln sin
2pL
R� CRtð Þ
� � . ð33Þ
Again, to simplify the results, Eqs. (32) and (33) embrace the assumption that the radius of the pipeline r issmall compared to the distance from the explosion d (Eq. (18)).
The complete set of analytical relations for strains induced by Rayleigh waves are derived by introducingthe wave propagation velocity of Rayleigh waves CR to the strain equations for P- and SV waves, as well as aphase difference of p/2 between the horizontal and the vertical component of ground motion. Thus, strains
ARTICLE IN PRESS
d R
Amax
pipelineaxis
center of theexplosion
z
z
xy
wavefront
horizontal plane
O
�
Fig. 7. Definition of the peak particle displacement Amax induced to the pipeline as a result of the radial propagation of the SV component
of a blast-induced Rayleigh wave.
G.P. Kouretzis et al. / International Journal of Impact Engineering 34 (2007) 1683–17041692

Autho
r's
pers
onal
co
py
due to the compressional (P) Rayleigh wave component are
�a ¼Amax;H
LR3R=d� ��n
2pz2R cos2pL
R� CRtð Þ
� �
þL d2� nz2
� �sin
2pL
R� CRtð Þ
� �, ð34Þ
g ¼Amax;Hz
dLR3R=d� ��n
cos y 4d2pR cos2pL
R� CRtð Þ
� �
þL �d2 2þ nð Þ þ nz2� �
sin2pL
R� CRtð Þ
� �ð35Þ
�h ¼Amax;H
LR3R=d� ��n
cos2 y 2d2pR cos2pL
R� CRtð Þ
� �
þLz2 1þ nð Þ sin2pL
R� CRtð Þ
� �. ð36Þ
In addition, strains due to the shear (SV) Rayleigh wave component are
g ¼Amax;Vz
LR2R=d� ��n
sin y �2pR sin2pL
R� CRtð Þ
� �� Ln cos
2pL
R� CRtð Þ
� � , (37)
�h ¼Amax;V
2dLR2R=d� ��n
sin 2y �2d2pR sin2pL
R� CRtð Þ
� �
þLnz2 cos2pL
R� CRtð Þ
� �. ð38Þ
Total shear and hoop strains on the shell due to the propagation of a Rayleigh wave can be computed from thesuperposition of Eqs. ((35) and (37)) and ((36) and (38)), respectively:
g ¼Amax;Vz
LR2R=d� ��n
0BB@ 1
�k
4dp cos y� L � n � sin y
� cos
2pL
R� CRtð Þ
� �
þ
1
�k
L �d2 2þ nð Þ þ nz2� �
cos y� 2pdR2 sin y
dR
8>><>>:
9>>=>>; sin
2pL
R� CRtð Þ
� �1CCA ð39Þ
�h ¼Amax;V
LR2R=d� ��n
1
�k
4d3p cos2 yþ L � n � z2 sin 2y
2d
8>><>>:
9>>=>>; cos
2pL
R� CRtð Þ
� �0BB@
þ
1
�k
Lz2 1þ nð Þ cos2 y� pdR2 sin 2y
R
8>><>>:
9>>=>>; sin
2pL
R� CRtð Þ
� �1CCA ð40Þ
where k is taken from Eq. (26).Comparison with numerical results: Results obtained by employing the proposed methodology for a
Rayleigh wave are consequently compared with the results of a FEM analysis with computer codeANSYS [20]. The pipe model is the same as described above for P waves, but the displacement excitationapplied to the nodes of the 3-D shell is now described by the following equations, referring to the global
ARTICLE IN PRESSG.P. Kouretzis et al. / International Journal of Impact Engineering 34 (2007) 1683–1704 1693
Autho
r's
pers
onal
co
py
coordinate system of Fig. 5:
ux;i ¼1
kA
Ri
xi
�n
sin oi sin2pL
Ri � Ctð Þ
� �, (41)
uy;i ¼ ARi
xi
�n
sin2pL
Ri � Ctð Þ þ p=2� �
, (42)
uz;i ¼1
kA
Ri
xi
�n
cos oi sin2pL
Ri � Ctð Þ
� �(43)
and
yx;i ¼ yy;i ¼ yz;i ¼ 0 while k ¼ 1:4677. (44)
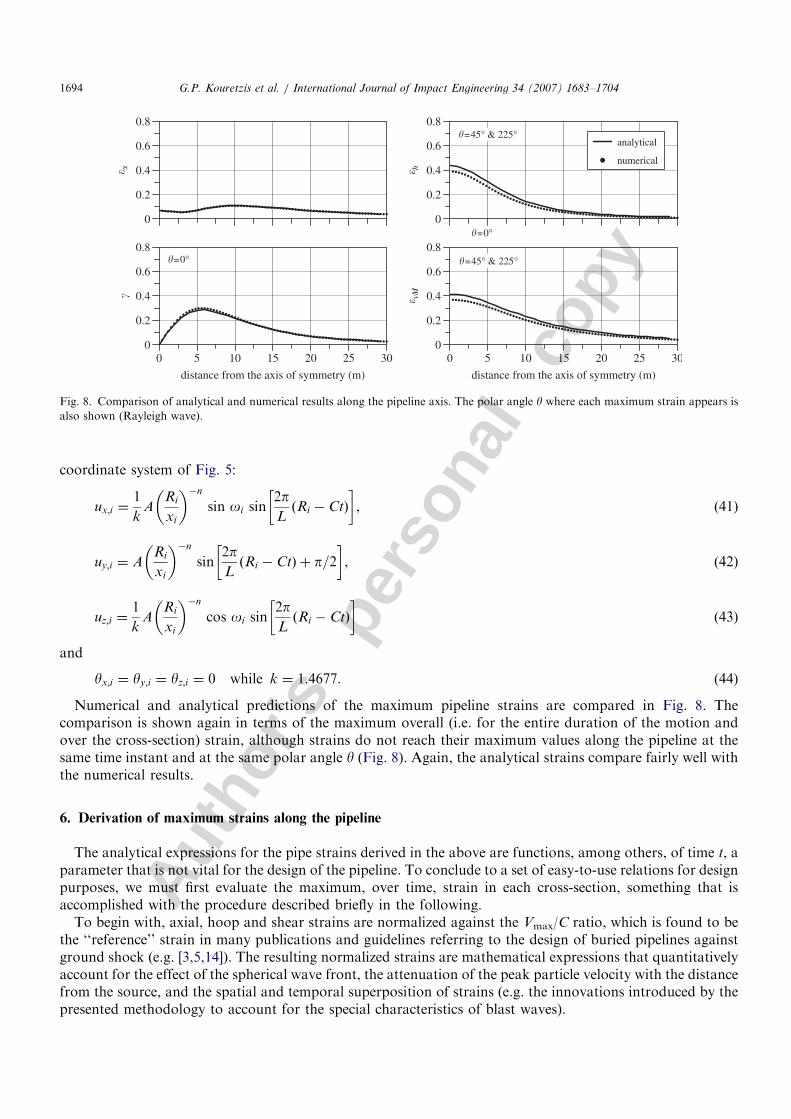
Numerical and analytical predictions of the maximum pipeline strains are compared in Fig. 8. Thecomparison is shown again in terms of the maximum overall (i.e. for the entire duration of the motion andover the cross-section) strain, although strains do not reach their maximum values along the pipeline at thesame time instant and at the same polar angle y (Fig. 8). Again, the analytical strains compare fairly well withthe numerical results.
6. Derivation of maximum strains along the pipeline
The analytical expressions for the pipe strains derived in the above are functions, among others, of time t, aparameter that is not vital for the design of the pipeline. To conclude to a set of easy-to-use relations for designpurposes, we must first evaluate the maximum, over time, strain in each cross-section, something that isaccomplished with the procedure described briefly in the following.
To begin with, axial, hoop and shear strains are normalized against the Vmax/C ratio, which is found to bethe ‘‘reference’’ strain in many publications and guidelines referring to the design of buried pipelines againstground shock (e.g. [3,5,14]). The resulting normalized strains are mathematical expressions that quantitativelyaccount for the effect of the spherical wave front, the attenuation of the peak particle velocity with the distancefrom the source, and the spatial and temporal superposition of strains (e.g. the innovations introduced by thepresented methodology to account for the special characteristics of blast waves).
ARTICLE IN PRESS
0
0.2
0.4
0.6
0.8
� h
0 5 10 15 20 25 30
distance from the axis of symmetry (m)
0
0.2
0.4
0.6
0.8
0 5 10 15 20 25 30
distance from the axis of symmetry (m)
0
0.2
0.4
0.6
0.8
� vM
0
0.2
0.4
0.6
0.8
analytical
numerical
�=45° & 225°
� ��
�=0°
�=0°
�=45° & 225°
Fig. 8. Comparison of analytical and numerical results along the pipeline axis. The polar angle y where each maximum strain appears is
also shown (Rayleigh wave).
G.P. Kouretzis et al. / International Journal of Impact Engineering 34 (2007) 1683–17041694

Autho
r's
pers
onal
co
py
The procedure for the derivation of the maximum, over time, normalized strains for each wave type andeach strain component is a rather lengthy mathematical procedure. To limit the extent of the presentation,only the course of action for calculating the maximum normalized axial strain �na;max for P waves is presented indepth in the following.
Dividing Eq. (19) with the (Vmax/Cp) ¼ (2pAmax/L) ratio yields the normalized axial strain:
��a ¼R=d� ��n
2pR32pz2R cos
2pL
R� Cpt� �� �
þ L d2� nz2
� �sin
2pL
R� Cpt� �� �
. (45)
Subsequently, the following mathematical treatment is adopted to reduce the number of independentvariables: the distance z from the projection of the center of the explosion measured along the axis of pipeline,and the distance from the center of the explosion to the pipeline axis d (Fig. 3) are divided by the wavelengthL:
z� ¼ z=L, (46)
d� ¼ d=L, (47)
while
R� ¼ffiffiffiffiffiffiffiffiffiffiffiffiffiffiffiffiffiffiffiz�2 þ d�2
p. (48)
In this way, 2 rather than 3 independent variables will appear in the mathematical expression for normalizedstrain. Substituting Eqs. (46) and (47) into Eq. (45) yields
��a ¼ R�=d�� ��n z�2
R�2cos 2p R� �
Cpt
T
� �þ
d�2 � nz�2� �
2pR�3sin 2p R� �
Cpt
T
� � !. (49)
The maximization of Eq. (49) with respect to its temporal variables (that is the time t and the wavepropagation velocity Cp) requires the computation of the time instant when ��a becomes maximum along thepipeline axis. This is accomplished by algebraically solving the differential equation:
q��a=qt ¼ 0 (50)
with the aid of the computer program Mathematica [22]. As ��a is a harmonic function, Eq. (50) is satisfied byan infinite series of roots that have a phase difference of 2p. Those roots correspond to the time instances whenthe axial strain acquires its maximum value in a cross-section defined by z*. Here, we are interested in thesequentially first one of the series of solutions, which represents the first time instant that the axial strain willbecome maximum. From those first four (4) feasible roots of Eq. (50):
t ¼ TR� �T
2parccos �
2pz�2R�ffiffiffiffiffiffiffiffiffiffiffiffiffiffiffiffiffiffiffiffiffiffiffiffiffiffiffiffiffiffiffiffiffiffiffiffiffiffiffiffiffiffiffiffiffiffiffiffiffiffiffiffiffid�2 � nz�2� �2
þ 4p2z�4R�2q
0B@
1CA (51)
we keep the one that when substituted in Eq. (49) will provide the maximum ��a value in each cross-section ofthe pipeline, through the entire duration of the ground shock, namely,
��a;max ¼
R�=d�� ��n
4p2z�4R�2 þ d�2 � nz�2� � ffiffiffiffiffiffiffiffiffiffiffiffiffiffiffiffiffiffiffiffiffiffiffiffiffiffiffi
d�2 � nz�2� �2q
2pR�3ffiffiffiffiffiffiffiffiffiffiffiffiffiffiffiffiffiffiffiffiffiffiffiffiffiffiffiffiffiffiffiffiffiffiffiffiffiffiffiffiffiffiffiffiffiffiffiffiffiffiffiffiffi4p2z�4R�2 þ d�2 � nz�2
� �2q . (52)
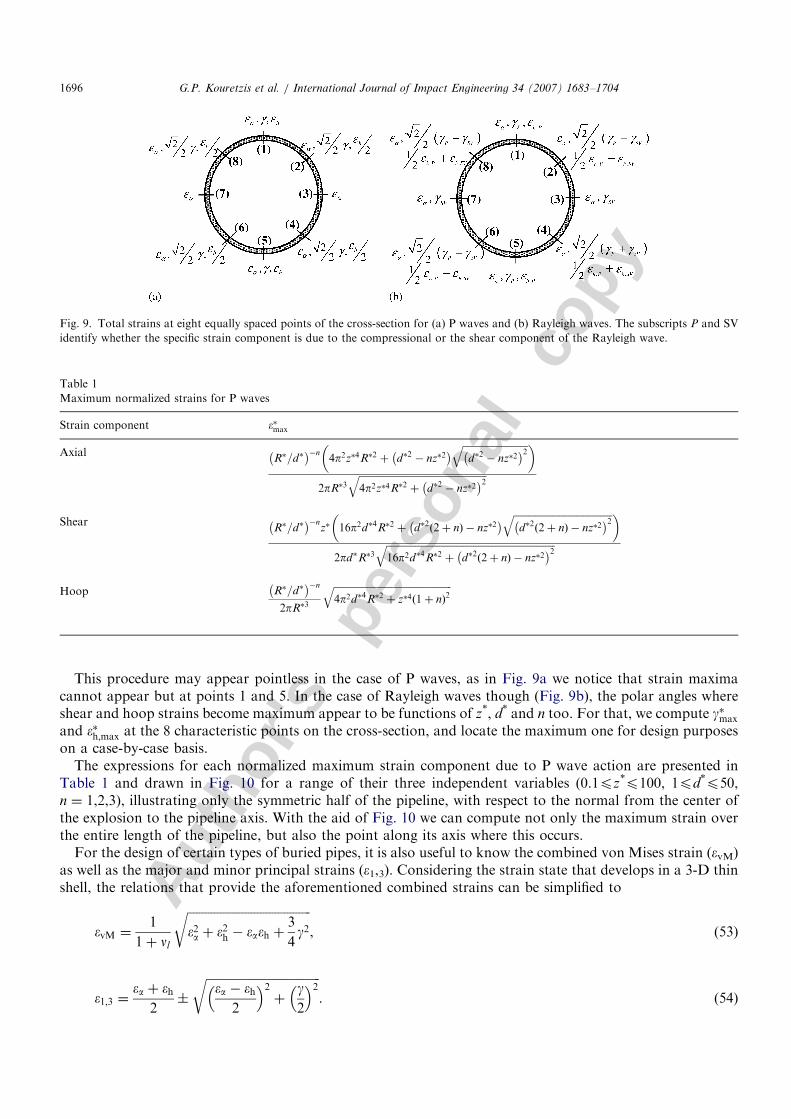
The same general concept is employed in the computation of normalized maximum shear and hoop strains,for both P- and Rayleigh waves. However, the latter strain components do not retain a uniform value alongthe cross-section as the axial strain does, but appear to be functions of the polar angle y too (Eqs. (16), (17)and (39), (40)). As the introduction of the extra independent variable y would make the abovementionedmathematical computation cumbersome, an approximate procedure is applied here: shear and hoop strainsare computed at 8 characteristic points of the cross-section, with polar angles y spaced at p/4 (Fig. 9), and thehighest among these 8 values are considered to be the maximum shear or hoop strain in the cross-section.
ARTICLE IN PRESSG.P. Kouretzis et al. / International Journal of Impact Engineering 34 (2007) 1683–1704 1695
Autho
r's
pers
onal
co
pyThis procedure may appear pointless in the case of P waves, as in Fig. 9a we notice that strain maxima
cannot appear but at points 1 and 5. In the case of Rayleigh waves though (Fig. 9b), the polar angles whereshear and hoop strains become maximum appear to be functions of z*, d* and n too. For that, we compute g�max
and ��h;max at the 8 characteristic points on the cross-section, and locate the maximum one for design purposeson a case-by-case basis.
The expressions for each normalized maximum strain component due to P wave action are presented inTable 1 and drawn in Fig. 10 for a range of their three independent variables (0.1pz*p100, 1pd*p50,n ¼ 1,2,3), illustrating only the symmetric half of the pipeline, with respect to the normal from the center ofthe explosion to the pipeline axis. With the aid of Fig. 10 we can compute not only the maximum strain overthe entire length of the pipeline, but also the point along its axis where this occurs.
For the design of certain types of buried pipes, it is also useful to know the combined von Mises strain (evM)as well as the major and minor principal strains (e1,3). Considering the strain state that develops in a 3-D thinshell, the relations that provide the aforementioned combined strains can be simplified to
�vM ¼1
1þ nl
ffiffiffiffiffiffiffiffiffiffiffiffiffiffiffiffiffiffiffiffiffiffiffiffiffiffiffiffiffiffiffiffiffiffiffiffiffiffiffiffiffi�2a þ �
2h � �a�h þ
3
4g2
r, (53)
�1;3 ¼�a þ �h
2�
ffiffiffiffiffiffiffiffiffiffiffiffiffiffiffiffiffiffiffiffiffiffiffiffiffiffiffiffiffiffiffiffiffiffiffiffiffiffi�a � �h
2
� �2þ
g2
� �2r. (54)
ARTICLE IN PRESS
Fig. 9. Total strains at eight equally spaced points of the cross-section for (a) P waves and (b) Rayleigh waves. The subscripts P and SV
identify whether the specific strain component is due to the compressional or the shear component of the Rayleigh wave.
Table 1
Maximum normalized strains for P waves
Strain component ��max
AxialR�=d�� ��n
4p2z�4R�2 þ d�2 � nz�2� � ffiffiffiffiffiffiffiffiffiffiffiffiffiffiffiffiffiffiffiffiffiffiffiffiffiffiffi
d�2 � nz�2� �2q
2pR�3ffiffiffiffiffiffiffiffiffiffiffiffiffiffiffiffiffiffiffiffiffiffiffiffiffiffiffiffiffiffiffiffiffiffiffiffiffiffiffiffiffiffiffiffiffiffiffiffiffiffiffiffiffi4p2z�4R�2 þ d�2 � nz�2
� �2q
ShearR�=d�� ��n
z� 16p2d�4R�2 þ d�2ð2þ nÞ � nz�2� � ffiffiffiffiffiffiffiffiffiffiffiffiffiffiffiffiffiffiffiffiffiffiffiffiffiffiffiffiffiffiffiffiffiffiffiffiffiffiffiffiffi
d�2ð2þ nÞ � nz�2� �2q
2pd�R�3ffiffiffiffiffiffiffiffiffiffiffiffiffiffiffiffiffiffiffiffiffiffiffiffiffiffiffiffiffiffiffiffiffiffiffiffiffiffiffiffiffiffiffiffiffiffiffiffiffiffiffiffiffiffiffiffiffiffiffiffiffiffiffiffiffiffiffiffiffiffi16p2d�4R�2 þ d�2ð2þ nÞ � nz�2
� �2q
Hoop R�=d�� ��n
2pR�3
ffiffiffiffiffiffiffiffiffiffiffiffiffiffiffiffiffiffiffiffiffiffiffiffiffiffiffiffiffiffiffiffiffiffiffiffiffiffiffiffiffiffiffiffiffiffiffiffiffi4p2d�4R�2 þ z�4ð1þ nÞ2
q
G.P. Kouretzis et al. / International Journal of Impact Engineering 34 (2007) 1683–17041696

Autho
r's
pers
onal
co
py
The complexity of Eqs. (53) and (54) (that is if we substitute the expressions for each strain component),makes the derivation of analytical expressions for the normalized von Mises and principal strains quitecomplicated. Still, by implementing the equations into a simple computer code, we can numerically calculatethe maximum normalized von Mises and principal strains at the characteristic points of Fig. 9, by using asmall space and time step for the superposition of their components. Plots for ��vM;max and �
�1;max computed this
way for P waves are also presented in Fig. 10, for the same range of parameters used for the basic straincomponents. It must be noted that strains due to static loads (e.g. internal pressure) were overlooked inthe computation of ��vM;max and ��1;max. If such strains are of the order of magnitude of blast-inducedpipeline strains, Eqs. (53) and (54) must be properly re-written for the calculation of design von Mises andprincipal strains.
ARTICLE IN PRESS
0
0.2
0.4
0.6
0.8
1
� �,m
ax∗
n=1 n=2 n=3
0
0.2
0.4
0.6
0.8
1
� max
∗
n=1 n=2 n=3
0
0.2
0.4
0.6
0.8
1
� h,m
ax∗
n=1 n=2 n=3
0
0.2
0.4
0.6
0.8
1
� vM
,max
∗ (for
vl=
0)
n=1 n=2 n=3
0.1 1 10 100
z∗
0
0.2
0.4
0.6
0.8
1
� 1,m
ax∗
n=1
0.1 1 10 100
z∗
n=2
0.1 1 10 100
z∗
n=3
d∗=1
25
10
20
d∗=50
d∗=1
25
10
20
d∗=50
d∗=1
2510
20
d∗=50
d∗=1
25
10
20
d∗=50
d∗=1
25
10
20
d∗=50
d∗=1
25
10
20
d∗=50
d∗=1
25
10
20
d∗=50
d∗=1
25
10
20
d∗=50
d∗=1
25
10
20
d∗=50
d∗=1
2 5 10 20
d∗=50
d∗=1
2 5 10 20
d∗=50
d∗=1
2 5 10 20
d∗=50
d∗=1 2 5 10 20d∗=50
d∗=1
2 5 10 20
d∗=50
d∗=1
2 5 10 20
d∗=50
Fig. 10. Distribution of maximum (over time) normalized strains along the pipeline axis, for different ground attenuation exponents and
distances from the explosion.
G.P. Kouretzis et al. / International Journal of Impact Engineering 34 (2007) 1683–1704 1697
Autho
r's
pers
onal
co
py
To reduce the size of the presentation, the graphical representation of the maximum normalized strains forRayleigh waves is omitted. However, the mathematical expressions that correspond to the total axial, shearand hoop strain at the characteristic points of Fig. 9b are presented in Appendix A.
7. Design relations
The rather complicated analytical relations for the maximum normalized strains and the plethora of therequired nomograms to substitute them make the calculation of maximum strains rather cumbersome for thedesign engineer. On the other hand, two important remarks, emerging from Fig. 10, can lead to furthersimplification of the proposed relations for design strains:
(a) the maximum normalized strain is not a function of the normalized distance d*, and(b) the position znmax along the axis of the pipeline where the maximum strain occurs appears to be
independent, or in other cases, linearly dependent to the normalized distance d*.
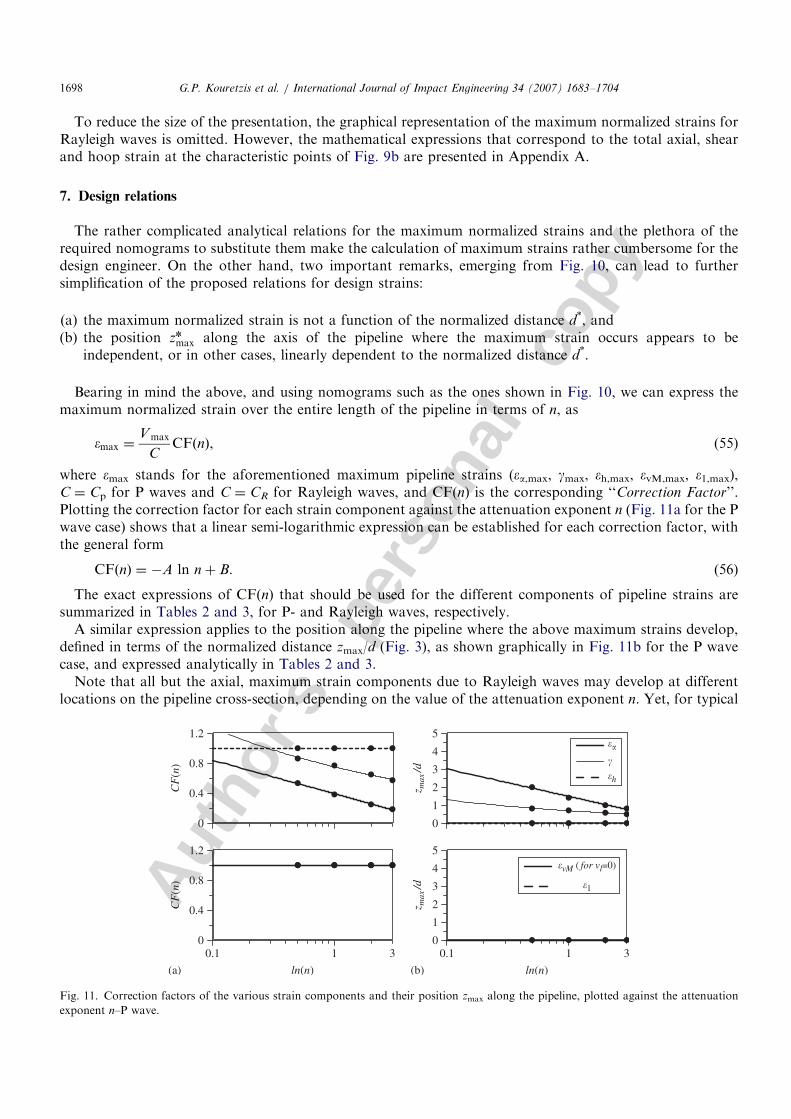
Bearing in mind the above, and using nomograms such as the ones shown in Fig. 10, we can express themaximum normalized strain over the entire length of the pipeline in terms of n, as
�max ¼Vmax
CCF nð Þ, (55)
where emax stands for the aforementioned maximum pipeline strains (ea,max, gmax, eh,max, evM,max, e1,max),C ¼ Cp for P waves and C ¼ CR for Rayleigh waves, and CF(n) is the corresponding ‘‘Correction Factor’’.Plotting the correction factor for each strain component against the attenuation exponent n (Fig. 11a for the Pwave case) shows that a linear semi-logarithmic expression can be established for each correction factor, withthe general form
CF nð Þ ¼ �A ln nþ B. (56)
The exact expressions of CF(n) that should be used for the different components of pipeline strains aresummarized in Tables 2 and 3, for P- and Rayleigh waves, respectively.
A similar expression applies to the position along the pipeline where the above maximum strains develop,defined in terms of the normalized distance zmax/d (Fig. 3), as shown graphically in Fig. 11b for the P wavecase, and expressed analytically in Tables 2 and 3.
Note that all but the axial, maximum strain components due to Rayleigh waves may develop at differentlocations on the pipeline cross-section, depending on the value of the attenuation exponent n. Yet, for typical
ARTICLE IN PRESS
0
0.4
0.8
1.2
CF
(n)
0
1
2
3
4
5
z max
/d
0.1 1
ln(n)
0
0.4
0.8
1.2
CF
(n)
0.1 1
ln(n)
0
1
2
3
4
5
z max
/d
�h
�vM ( for vl=0)
�1
(b)
3
(a)
3
��
�
Fig. 11. Correction factors of the various strain components and their position zmax along the pipeline, plotted against the attenuation
exponent n–P wave.
G.P. Kouretzis et al. / International Journal of Impact Engineering 34 (2007) 1683–17041698
Autho
r's
pers
onal
co
pyground conditions with 1.5ono3.0, the maximum shear strain occurs at point 1 of the cross-section (Fig. 9),while the maximum hoop, von Mises and major principal strains at points 2&4. The corresponding CF(n) andzmax/d relations are shade-marked in Table 3.
8. Comparison with field tests
Validation of the proposed methodology is attempted through comparison to actual pipeline strainmeasurements due to full scale blasts. The aforementioned measurements were preformed by the US Bureauof Mines and the State of Indiana in cooperation with AMAX Coal Co. and its consultants, to monitor theeffects of coal mine overburden blasting on nearby pipelines [6].
Results from 29 blasts of up to 950 kg per delay are shown in Figs. 12a and b, in terms of measured axialand hoop strains in 2 of the tested buried pipelines: one 50.8 cm diameter, 6.63mm wall thickness steel pipelineand one 21.9 cm PVC pipeline with 8.43mm wall thickness, located at distances from 20 to 1064m from thenearest blast source of each test. These 2 pipelines were selected out of a total of 5 pipelines installed during thetest blasts, since they are the only ones for which the flexibility criterion (Eq. (3)) is met, as noted by Siskindet al. [6]. Local soil conditions consist of a 12-m deep shale layer, covered with a 2-m layer of clayley soil.The pipelines were buried under 1m of excavated clayley soil, while the depth of detonation varied from13 to 20m.
The proposed analytical expressions for the calculation of axial and hoop strains (Eqs. (34) and (40),respectively) due to Rayleigh waves were employed for each blast test, as more appropriate for the distancesconsidered. The case-specific attenuation relation derived by Siskind et al. [6] was used for the calculation of
ARTICLE IN PRESS
Table 2
Simplified expressions for the calculation of the Correction Factor of each strain component and the position of the maximum along the
pipeline axis-P wave
Strain component CF(n) zmax/d
Axial �0.195 ln n+0.392 �0.66 ln n+1.489
Shear �0.162 ln n+0.758 �0.177 ln n+0.7
Hoop 1 0
Von Mises 1/(1+nl) 0
Principal 71 0
Table 3
Simplified expressions for the calculation of the Correction Factor of each strain component and the position of the maximum along the
pipeline axis-Rayleigh wave (for k ¼ 1.4677)
Strain component CF(n) zmax/d
Axial �0.133 ln n+0.267 �0.661 ln n+1.489
Shear-position 1a �0.11 ln n+0.516 �0.176 ln n+0.697
Shear-positions 2 and 4a �0.127 ln n+0.498 �0.275 ln n+0.82
Shear-position 3a �0.165 ln n+0.503 �0.469 ln n+1.052
Hoop-position 1a 0.681 0
Hoop-positions 2 and 4a 0.694 0
Hoop-position 3a 0 —
Von Mises-position 1a 0.681/(1+nl) 0
Von Mises-positions 2 and 4a 0.694/(1+nl) 0
Von Mises-position 3a (�0.143 ln n+0.435)/(1+nl) �0.456 ln n+1.052/(1+nl)Principal-position 1a 70.681 0
Principal-positions 2&4a 70.694 0
Principal-position 3a �0.115 ln n70.295 �0.456 ln n+1.052
aPositions 1–4 refer to the cross-section of the pipeline and are defined in Fig. 9b.
G.P. Kouretzis et al. / International Journal of Impact Engineering 34 (2007) 1683–1704 1699

Autho
r's
pers
onal
co
py
the peak particle velocity at the position of the pipeline, namely,
Vmaxðm=sÞ ¼ 3:22R
W 0:333
�1:33, (57)
where R is the distance from the nearest blast hole (in m) and W is the charge per delay (in kg). The peakparticle displacement Amax was calculated from the peak particle velocity using the following expression, validfor harmonic waves:
Amax ¼LR
2pVmax
CR
, (58)
where the Rayleigh wave propagation in shale, CR, was taken to be equal to 800m/s, while the wavelength LR,was considered equal to 40m, based on the mean frequency content of the strong motion recordings reportedby Sisking et al. [6].
ARTICLE IN PRESS
1 10 100
scaled distance (m/kg0.333)
0.1
1
10
100
1000
� h (�m
m/m
m)
0.1
1
10
100
1000
� � (�m
m/m
m)
50.8 cm steel
21.9 cm PVC
Dowding [3]
Esparza et al. [4]
proposed
0.1 1 10 100 1000measured �h (�mm/mm)
0.1
1
10
100
1000
pred
icte
d � h
(�m
m/m
m)
Dowding [3]
Esparzaet al. [4]
proposed
Y=X
0.1 1 10 100 1000
measured �� (�mm/mm)
0.1
1
10
100
1000
pred
icte
d � �
(�m
m/m
m)
200
(a)
(b)
(c) (d)
Fig. 12. Comparison of the results of the proposed methodology and of the current state-of-practice with field strain measurements
presented by Siskind et al. [6].
G.P. Kouretzis et al. / International Journal of Impact Engineering 34 (2007) 1683–17041700
Autho
r's
pers
onal
co
py
Axial and hoop strains measured in the field and calculated by the proposed methodology are drawn inFigs. 12a and b, respectively, against the scaled distance of the pipeline from the nearest source blast, whiletheir correlation is illustrated in Figs. 12c and d, in an one-on-one comparison.
In addition to the proposed methodology, strains on the pipelines are computed using the empirical relationproposed by Esparza et al. [4] for single-point source, as well as the simplified expression adopted by Dowding[3]. The exact relations and the input data used for these parallel predictions are given in Appendix B.
From Fig. 12 it is observed that results of the proposed methodology are generally compatible with theexperimental measurements. On the other hand, the expression adopted by Dowding [3] provides an upperbound of measured axial strains, while the empirical expression of Esparza et al. [4] provides reasonablyaccurate results for relatively small-scaled distances (o20m/kg0.333), but underestimates axial and hoopstrains thereafter.
To further investigate the potential effect of local soil conditions on pipeline strains, let us consider thefictitious case where the 50.8 cm steel pipeline considered in Siskind et al. [6] experiments is constructed nearthe surface of a wet clay layer, with Cs ¼ 250m/s, and is subjected to a series of point source detonations of1000 kg TNT in distances of 5, 10, 20 and 100m from the pipeline.
Calculation of pipeline strains with all three methodologies follows the same workflow as described above.However, attenuation of the peak particle ground velocity in this case is much slower compared to the softrock formation encountered in Siskind et al. experiments. Namely, for detonation of 1000 kg of TNT in wetclay the peak particle velocity is computed as [11]
Vmaxðm=sÞ ¼ 16:08RðmÞ
7300:333
�1:35. (59)
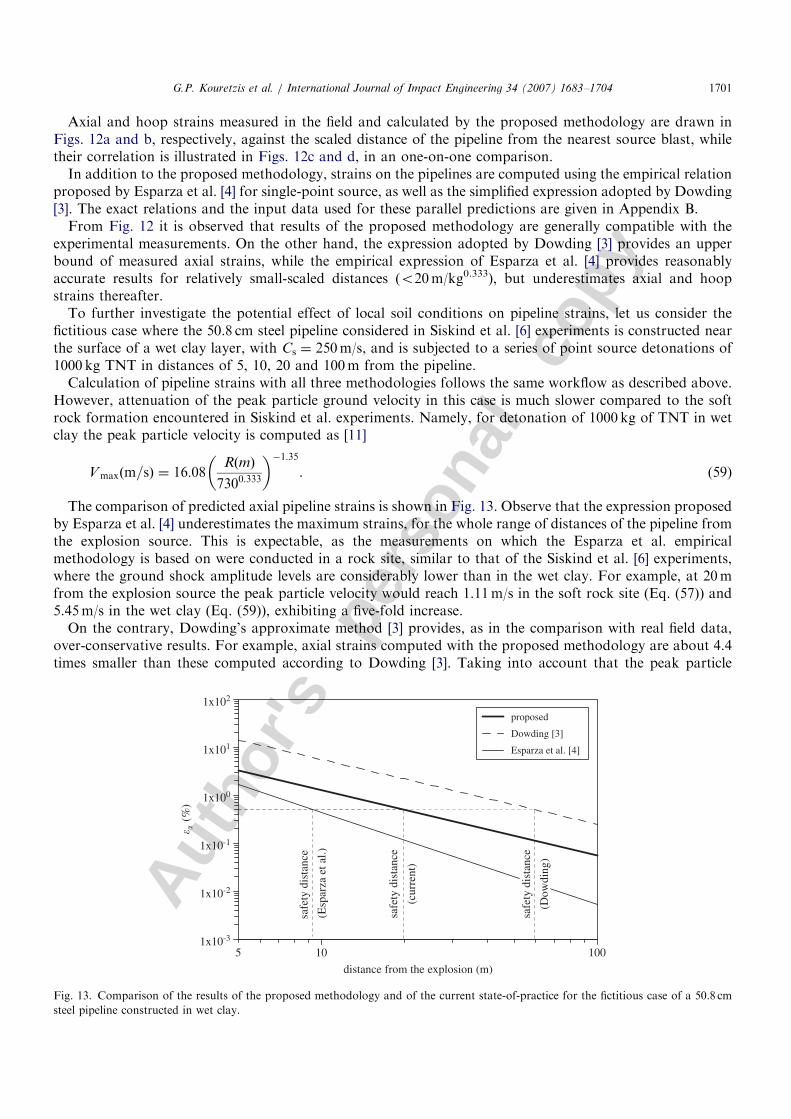
The comparison of predicted axial pipeline strains is shown in Fig. 13. Observe that the expression proposedby Esparza et al. [4] underestimates the maximum strains, for the whole range of distances of the pipeline fromthe explosion source. This is expectable, as the measurements on which the Esparza et al. empiricalmethodology is based on were conducted in a rock site, similar to that of the Siskind et al. [6] experiments,where the ground shock amplitude levels are considerably lower than in the wet clay. For example, at 20mfrom the explosion source the peak particle velocity would reach 1.11m/s in the soft rock site (Eq. (57)) and5.45m/s in the wet clay (Eq. (59)), exhibiting a five-fold increase.
On the contrary, Dowding’s approximate method [3] provides, as in the comparison with real field data,over-conservative results. For example, axial strains computed with the proposed methodology are about 4.4times smaller than these computed according to Dowding [3]. Taking into account that the peak particle
ARTICLE IN PRESS
10 100
distance from the explosion (m)
1x10⁻³
1x10⁻²
1x10⁻¹
1x100
1x101
1x10²
� � (
%)
proposed
Dowding [3]
Esparza et al. [4]
safe
ty d
ista
nce
(cur
rent
)
safe
ty d
ista
nce
(Dow
ding
)
5
safe
ty d
ista
nce
(Esp
arza
et a
l.)
Fig. 13. Comparison of the results of the proposed methodology and of the current state-of-practice for the fictitious case of a 50.8 cm
steel pipeline constructed in wet clay.
G.P. Kouretzis et al. / International Journal of Impact Engineering 34 (2007) 1683–1704 1701
Autho
r's
pers
onal
co
py
velocity in both sets of predictions is calculated by the same expression (Eq. (59)), it may be concluded that theobserved divergences are attributed to the fact that Dowding’s analytical expression for axial strain does notaccount for the wave spherical front.
A feeling of how important such differences may become is obtained when the different methodologies areused to back-calculate the safety distance of the pipeline from the presumed explosion (Fig. 13). Supposingthat the steel pipeline under consideration is constructed with peripheral in situ welds, the maximum axialstrain on the cross-section should not exceed 0.5%. For that strain limit, the safety distance to meet thisrequirement according to the results of the proposed methodology is 20m, while it increases to 60m, i.e. athree-fold increase, when Dowding’s expression is adopted (Fig. 13).
9. Summary and conclusions
An analytical methodology to calculate blast-induced strains in buried pipelines has been presented,employing 3-D thin elastic shell theory in the analysis of the structure. Furthermore, compared to existinganalytical and empirical methods, the proposed one takes consistently into account the special characteristicsof blast-induced ground shock waves i.e. the spherical front and the soil-dependant exponential attenuation oftheir amplitude with the distance from the source. Simple design relations are provided to aid the practicalapplication of the method.
The proposed relations have been evaluated against field measurements of blast-induced axial and hooppipeline strains reported in the literature. In addition, a thorough comparison was made with two methodsfrequently used in current practice: these of Dowding [3] and Esparza et al. [4]. In conclusion, it was found thatthe proposed method has achieved improved accuracy at no major expense of simplicity. In comparison,Dowding’s methodology, which was originally developed for seismic waves with a plane instead of a sphericalfront, provides consistently higher estimates of pipeline strains. On the other hand, the empirical methodologyof Esparza et al. provides comparable predictions for relatively short distances from the blast and stiff-dryground conditions, simulating the conditions prevailed in the field experiments which were used to calibratethe method. Nevertheless, it may considerably underestimate pipeline strains for longer distances, or wet soilconditions where the ground shock attenuation becomes slower.
Appendix A. Maximum normalized strains for Rayleigh waves
Axial strain:
p
R�=d�� ��n
4p2z�4R�2 þ d�2 � nz�2� � ffiffiffiffiffiffiffiffiffiffiffiffiffiffiffiffiffiffiffiffiffiffiffiffiffiffiffi
d�2 � nz�2� �2q
2pR�3ffiffiffiffiffiffiffiffiffiffiffiffiffiffiffiffiffiffiffiffiffiffiffiffiffiffiffiffiffiffiffiffiffiffiffiffiffiffiffiffiffiffiffiffiffiffiffiffiffiffiffiffiffi4p2z�4R�2 þ d�2 � nz�2
� �2q .
Shear strain-position (1):
p
R�=d�� ��n
z� 16p2d�4R�2 þ d�2ð2þ nÞ � nz�2� � ffiffiffiffiffiffiffiffiffiffiffiffiffiffiffiffiffiffiffiffiffiffiffiffiffiffiffiffiffiffiffiffiffiffiffiffiffiffiffiffiffi
d�2ð2þ nÞ � nz�2� �2q
2pd�R�3ffiffiffiffiffiffiffiffiffiffiffiffiffiffiffiffiffiffiffiffiffiffiffiffiffiffiffiffiffiffiffiffiffiffiffiffiffiffiffiffiffiffiffiffiffiffiffiffiffiffiffiffiffiffiffiffiffiffiffiffiffiffiffiffiffiffiffiffiffiffi16p2d�4R�2 þ d�2ð2þ nÞ � nz�2
� �2q .
Shear strain-position (2):
ffiffiffi2p
z� R�=d�� �1�n
4pR�4
d�R�ð4d�pp�nsÞffiffiffiffiffiffiffiffiffiffiffiffiffiffiffiffiffiffiffiffiffiffi�4d�ppþnsð Þ2pffiffiffiffiffiffiffiffiffiffiffiffiffiffiffiffiffiffiffiffiffiffiffiffiffiffiffiffiffiffiffiffiffiffiffiffiffiffiffiffiffiffiffiffiffiffiffiffiffiffiffiffiffiffiffiffiffiffiffiffiffiffiffiffiffiffiffiffiffiffiffiffiffiffiffiffiffiffiffiffiffiffiffiffiffiffiffiffiffiffiffiffiffiffiffiffiffiffiffiffiffiffiffiffiffiffiffiffiffiffiffiffiffiffiffiffiffiffiffiffiffiffiffiffiffiffiffiffiffiffiffiffiffiffiffiffiffi
�4np2�3n2p2þ16d�2p2p2þ8d�pps�4d�nppsþn2s2þ4d�2p2s2þnp�2d�psð Þ
2z�2
d�2þ4d�2ð1þnÞ2p2
R�2
qþ d�2ð2þ nÞpþ 2d�3ps� npz�2 þ 2d�psz�2� � ffiffiffiffiffiffiffiffiffiffiffiffiffiffiffiffiffiffiffiffiffiffiffiffiffiffiffiffiffiffiffiffiffiffiffiffiffiffiffiffiffiffiffiffiffiffiffiffiffiffiffiffiffiffiffiffiffiffiffiffiffiffiffiffiffiffiffiffiffiffiffiffiffiffiffiffiffiffiffiffiffiffiffiffiffiffiffiffiffiffiffiffiffiffiffiffiffiffiffiffiffiffiffiffiffiffiffiffi
1� �4d�ppþnsð Þ2
�4np2 � 3n2p2 þ 16d�2p2p2 þ 8d�pps� 4d�npps
þn2s2 þ 4d�2p2s2 þnp�2d�psð Þ
2z�2
d�2þ
4d�2ð1þnÞ2p2
R�2
vuuuuut
0BBBBBBBBB@
1CCCCCCCCCA.
ARTICLE IN PRESSG.P. Kouretzis et al. / International Journal of Impact Engineering 34 (2007) 1683–17041702
Autho
r's
pers
onal
co
py
Shear strain-position (3):
sR�=d�� ��n
z�
2pR�2
ffiffiffiffiffiffiffiffiffiffiffiffiffiffiffiffiffiffiffiffiffiffiffiffiffin2 þ 4p2R�2
p.
Shear stain-position (4):
ffiffiffi2p
z� R�=d�� �1�n
4pR�4
d�R�ð4d�ppþ nsÞ
ffiffiffiffiffiffiffiffiffiffiffiffiffiffiffiffiffiffiffiffiffiffiffiffiffiffiffiffið4d�ppþ nsÞ2
qffiffiffiffiffiffiffiffiffiffiffiffiffiffiffiffiffiffiffiffiffiffiffiffiffiffiffiffiffiffiffiffiffiffiffiffiffiffiffiffiffiffiffiffiffiffiffiffiffiffiffiffiffiffiffiffiffiffiffiffiffiffiffiffiffiffiffiffiffiffiffiffiffiffiffiffiffiffiffiffiffiffiffiffiffiffiffiffiffiffiffiffiffiffiffiffiffiffiffiffiffiffiffiffiffiffiffiffiffiffiffiffiffiffiffiffiffiffiffiffiffiffiffiffiffiffiffiffiffiffiffiffiffiffiffiffiffiffiffiffiffiffiffiffiffiffiffiffiffiffiffiffiffiffiffiffiffiffiffiffiffiffiffiffiffiffiffiffiffiffiffiffiffiffiffiffiffiffiffiffiffiffiffiffiffiffiffiffiffiffiffiffiffiffiffiffiffiffiffiffi�4np2 � 3n2p2 þ 16d�2p2p2 � 8d�ppsþ 4d�nppsþ n2s2 þ 4d�2p2s2 þ npþ2d�psð Þ2z�2
d�2þ
4d�2ð1þ nÞ2p2
R�2
s
þ �d�2ð2þ nÞpþ 2d�3psþ npz�2 þ 2d�psz�2� � ffiffiffiffiffiffiffiffiffiffiffiffiffiffiffiffiffiffiffiffiffiffiffiffiffiffiffiffiffiffiffiffiffiffiffiffiffiffiffiffiffiffiffiffiffiffiffiffiffiffiffiffiffiffiffiffiffiffiffiffiffiffiffiffiffiffiffiffiffiffiffiffiffiffiffiffiffiffiffiffiffiffiffiffiffiffiffiffiffiffiffiffiffiffiffiffiffiffiffiffiffiffiffiffiffiffiffiffiffiffiffiffiffiffiffiffiffiffiffiffiffiffi
1�4d�ppþ nsð Þ
2
�4np2 � 3n2p2 þ 16d�2p2p2 � 8d�ppsþ 4d�nppsþ n2s2
þ4d�2p2s2 þnpþ2d�psð Þ
2z�2
d�2þ
4d�2ð1þnÞ2p2
R�2
vuuuuuut
0BBBBBBBBBBBBBB@
1CCCCCCCCCCCCCCA
.
Hoop strain-position (1):
pR�=d�� ��n
2pR�3
ffiffiffiffiffiffiffiffiffiffiffiffiffiffiffiffiffiffiffiffiffiffiffiffiffiffiffiffiffiffiffiffiffiffiffiffiffiffiffiffiffiffiffiffiffiffiffiffi4p2d�4R�2 þ z�4ð1þ nÞ2
q.
Hoop strain-position (2):
R�=d�� �1�n
4pR�4
R�2 2ffiffi2p
d�3pp�nsz�2ð Þ
ffiffiffiffiffiffiffiffiffiffiffiffiffiffiffiffiffiffiffiffiffiffiffiffiffiffiffiffiffiffiffi2ffiffi2p
d�3pp�nsz�2ð Þ2
qffiffiffiffiffiffiffiffiffiffiffiffiffiffiffiffiffiffiffiffiffiffiffiffiffiffiffiffiffiffiffiffiffiffiffiffiffiffiffiffiffiffiffiffiffiffiffiffiffiffiffiffiffiffiffiffiffiffiffiffiffiffiffiffiffiffiffiffiffiffiffiffiffiffiffiffiffiffiffiffiffiffiffiffiffiffiffiffiffiffiffiffiffiffiffiffiffiffiffiffiffiffiffiffiffiffiffiffiffiffiffiffiffiffiffiffiffiffiffiffiffiffiffiffiffiffiffiffiffiffiffiffiffiffiffiffiffiffiffiffiffiffiffiffiffiffiffiffiffiffiffiffiffi4d�8p2 2p2þs2ð Þþ4d�3pz�2
ffiffi2p
psR�2þ2d�3p p2þs2ð Þþd�ps2z�2ð Þþd�2z�4 2ð1þnÞ2p2þn2s2ð Þþn2s2z�6pþd� 2d�3psþ
ffiffiffi2pð1þ nÞpz�2 þ 2d�psz�2
� � ffiffiffiffiffiffiffiffiffiffiffiffiffiffiffiffiffiffiffiffiffiffiffiffiffiffiffiffiffiffiffiffiffiffiffiffiffiffiffiffiffiffiffiffiffiffiffiffiffiffiffiffiffiffiffiffiffiffiffiffiffiffiffiffiffiffiffiffiffiffiffiffiffiffiffiffiffiffiffiffiffiffiffiffiffiffiffiffiffiffiffiffiffiffiffiffiffiffiffiffiffiffiffiffiffiffiffiffiffiffiffiffiffiffiffiffiffiffiffiffiffiffiffiffiffiffiffiffiffiffiffiffiffiffiffiffiffiffiffiffiffiffiffiffiffiffiffi1�
R�2 2ffiffi2p
d�3pp�nsz�2ð Þ2
4d�8p2ð2p2 þ s2Þ þ 4d�3pz�2ffiffiffi2p
psR�2 þ 2d�3p p2 þ s2� �
þ d�ps2z�2� �
þd�2z�4 2ð1þ nÞ2p2 þ n2s2� �
þ n2s2z�6
vuuuut
0BBBBBBBB@
1CCCCCCCCA.
Hoop strain-position (4):
R�=d�� �1�n
4pR�4
R�2 2ffiffi2p
d�3ppþnsz�2ð Þ
ffiffiffiffiffiffiffiffiffiffiffiffiffiffiffiffiffiffiffiffiffiffiffiffiffiffiffiffiffiffiffi2ffiffi2p
d�3ppþnsz�2ð Þ2
qffiffiffiffiffiffiffiffiffiffiffiffiffiffiffiffiffiffiffiffiffiffiffiffiffiffiffiffiffiffiffiffiffiffiffiffiffiffiffiffiffiffiffiffiffiffiffiffiffiffiffiffiffiffiffiffiffiffiffiffiffiffiffiffiffiffiffiffiffiffiffiffiffiffiffiffiffiffiffiffiffiffiffiffiffiffiffiffiffiffiffiffiffiffiffiffiffiffiffiffiffiffiffiffiffiffiffiffiffiffiffiffiffiffiffiffiffiffiffiffiffiffiffiffiffiffiffiffiffiffiffiffiffiffiffiffiffiffiffiffiffiffiffiffiffiffiffiffiffiffiffiffiffiffiffiffi4d�8p2 2p2þs2ð Þþ4d�3pz�2 �
ffiffi2p
psR�2þ2d�3p p2þs2ð Þþd�ps2z�2ð Þþd�2z�4 2ð1þnÞ2p2þn2s2ð Þþn2s2z�6p�d� �2d�3psþ
ffiffiffi2pð1þ nÞpz�2 � 2d�psz�2
� � ffiffiffiffiffiffiffiffiffiffiffiffiffiffiffiffiffiffiffiffiffiffiffiffiffiffiffiffiffiffiffiffiffiffiffiffiffiffiffiffiffiffiffiffiffiffiffiffiffiffiffiffiffiffiffiffiffiffiffiffiffiffiffiffiffiffiffiffiffiffiffiffiffiffiffiffiffiffiffiffiffiffiffiffiffiffiffiffiffiffiffiffiffiffiffiffiffiffiffiffiffiffiffiffiffiffiffiffiffiffiffiffiffiffiffiffiffiffiffiffiffiffiffiffiffiffiffiffiffiffiffiffiffiffiffiffiffiffiffiffiffiffiffiffiffiffiffiffiffiffiffiffi1�
R�2 2ffiffi2p
d�3ppþnsz�2ð Þ2
4d�8p2 2p2 þ s2� �
þ 4d�3pz�2 �ffiffiffi2p
psR�2 þ 2d�3p p2 þ s2� �
þ d�ps2z�2� �
þd�2z�4 2ð1þ nÞ2p2 þ n2s2� �
þ n2s2z�6
vuuuut
0BBBBBBBB@
1CCCCCCCCA
(1): p ¼ Amax,H/Amax and s ¼ Amax,V/Amax (2): positions 1–4 refer to the cross-section of the pipeline and aredefined in Fig. 9b
Appendix B. Prediction of field-measured strains using the current design practice
Calculation of strains using the methodology proposed by Esparza et al. [4]: Esparza et al. [4] suggestthat axial and hoop stresses on steel pipelines due to nearby blasts can be computed using thefollowing empirical relation, derived from the statistical evaluation of a series of field tests for single andmulti-shot blasts:
s ¼ 4:44E lK4W effffiffiffiffiffiffiffiffiEltsp
RK5
K6
, (B.1)
where El is the Young’s modulus of steel (in psf), ts the pipe wall thickness (in ft), Weff the effectiveweight of the explosives (in pounds), accounting for the orientation of the explosives relatively to thepipeline, R the distance between the pipe and the explosives, grater than 2 pipe diameters, and Ki empiricalcoefficients.
ARTICLE IN PRESSG.P. Kouretzis et al. / International Journal of Impact Engineering 34 (2007) 1683–1704 1703

Autho
r's
pers
onal
co
py
The problem examined herein, due to the delayed-type blasts, corresponds to the single-point source case ofEsparza et al.’s relation, as also remarked by Siskind et al. [6], so Eq. (B.1) becomes
s ¼ 4:44� 4:393� 109 psf1 0:98� 2207:5 poundsð Þffiffiffiffiffiffiffiffiffiffiffiffiffiffiffiffiffiffiffiffiffiffiffiffiffiffiffiffiffiffiffiffiffiffiffiffiffiffiffiffiffiffiffiffiffiffiffiffiffiffiffiffiffiffi
4:393� 109 psf � 0:0328 ftp
R ftð Þ½ 2:5
!0:77
. (B.2)
The strains corresponding to the stresses computed from Eq. (B.2) are presented in Figs. 12a and b, and arecorrelated to measured strains in Figs. 12c and d, next to results of the proposed methodology.
Calculation of strains using the methodology proposed by Dowding [3]: For the calculation of blast-inducedaxial strains Dowding [3] adopts the following approximate expression, originally proposed for the seismicverification of buried pipelines and tunnels [1]:
�a ¼ Vmax=C, (B.3)
where Vmax is calculated from Eq. (57) for various distances from the explosion and C ¼ 800m/s. Axialstrains calculated from Eq. (B.3) are also presented in Fig. 12a and compared to the measured axial strains inFig. 12c.
References
[1] Newmark NM. Problems in wave propagation in soil and rock. In: Proceedings of the International Symposium on Wave
Propagation and Dynamic Properties of Earth Materials. Albuquerque, NM: University of New Mexico Press; August 23–25, 1968.
p. 7–26.
[2] Kuesel TR. Earthquake design criteria for subways. J Struct Div ASCE 1969;ST6:1213–31.
[3] Dowding CH. Blast vibration monitoring and control. Englewood Cliffs, NJ: Prentice-Hall Inc.; 1985.
[4] Esparza ED, Westine PS, Wenzel AB. Pipeline response to buried explosive detonations, vol. 1. Southwest Research Institute Report
to the American Gas Association, AGA Project, PR-15-109, 1981.
[5] American Lifelines Alliance. Guidelines for the design of buried steel pipes. New York: ASCE; July 2001.
[6] Siskind DE, Stagg MS, Wiegand JE, Schulz DL. Surface mine blasting near pressurized transmission pipelines. Report of
Investigations RI9523, to US Department of Interior, Bureau of Mines, 1994.
[7] Lamb H. On the propagation of tremors over the surface of an elastic solid. Philos Trans R Soc London Ser A 1904(203):1–42.
[8] Mooney HM. Some numerical predictions for Lamb’s problem. Bull Seismol Soc Am 1974;64:473.
[9] Samoreli DG. Elasto-plastic analysis of the propagation of blast waves into the ground. Diploma thesis, Geotechnical Division,
Faculty of Civil Engineering, NTUA, 1998 [in Greek].
[10] Wu C, Hao H. Modeling of simultaneous ground shock and airblast pressure on nearby structures from surface explosions. Int J
Impact Eng 2005;31:699–717.
[11] TM5-855-1. Design and analysis of hardened structures to conventional weapons effects. The Departments of Army, Air Force and
Navy and the Defence Special Weapons Agency, USA, 1998.
[12] Negmatullaev SKh, Todorovska MI, Trifunac MD. Simulation of strong earthquake motion by explosions-experiments at the Lyaur
testing range in Tajikistan. Soil Dyn Earthquake Eng 1999;18:189–207.
[13] Henrych J. The dynamics of explosion and its use. Amsterdam: Elsevier; 1979.
[14] European Committee for Standardisation. Eurocode 8: Design of structures for earthquake resistance. Part 4—Silos, Tanks and
Pipelines. Draft No. 2, September 2003.
[15] Hoeg K. Stresses against underground structural cylinders. J Soil Mech Found Div ASCE 1968;94, SM4:833–58.
[16] Hendron Jr AJ, Fernandez G. Dynamic and static considerations for underground chambers. Seismic design of embankments and
caverns. New York: ASCE; 1983. p. 157–197.
[17] O’Rourke MJ, Liu X. Response of buried pipelines subject to earthquake effects. Monograph Series MCEER 1999.
[18] Kelkar VS, Sewell RT. Fundamentals of the analysis and design of shell structures. Englewood Cliffs, NJ: Prentice-Hall Inc.; 1987.
[19] Kouretzis GP, Bouckovalas GD, Gantes CJ. 3-D shell analysis of cylindrical underground structures under seismic shear (S) wave
action. Soil Dyn Earthquake Eng 2006;26:909–21.
[20] Ansys Inc. ANSYS 9.0 Documentation, 2004.
[21] Ewing WM, Jardesky WS, Press F. Elastic waves in layered media. New York: McGraw-Hill; 1957.
[22] Wolfram Research Inc. Mathematica 4.0 User’s Manual. 1999.
ARTICLE IN PRESSG.P. Kouretzis et al. / International Journal of Impact Engineering 34 (2007) 1683–17041704


![Tech Space Journal [Vol- 4, Issue- 34].pdf](https://img.pdfslide.us/doc/110x75/577ca7231a28abea748c4039/tech-space-journal-vol-4-issue-34pdf.jpg)