Embed Size (px)
Citation preview
lable at ScienceDirect
International Journal of Impact Engineering 71 (2014) 17e33
Contents lists avai
International Journal of Impact Engineering
journal homepage: www.elsevier .com/locate/ i j impeng
Review
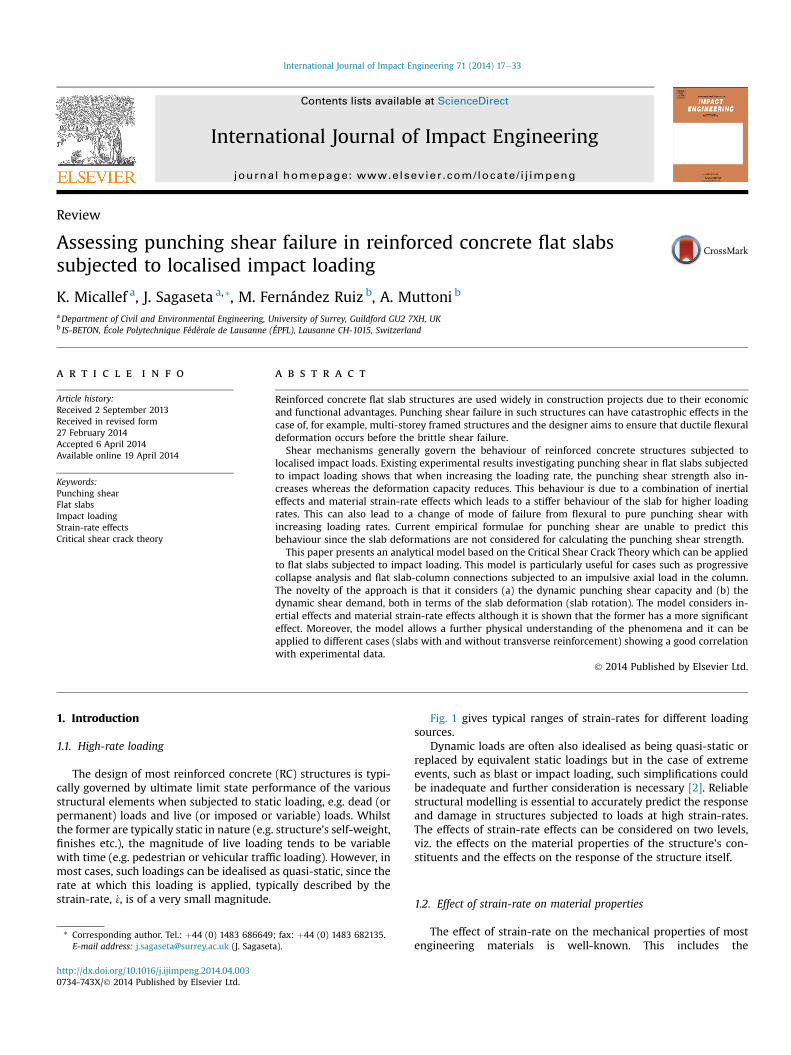
Assessing punching shear failure in reinforced concrete flat slabssubjected to localised impact loading
K. Micallef a, J. Sagaseta a,*, M. Fernández Ruiz b, A. Muttoni b
aDepartment of Civil and Environmental Engineering, University of Surrey, Guildford GU2 7XH, UKb IS-BETON, École Polytechnique Fédérale de Lausanne (ÉPFL), Lausanne CH-1015, Switzerland
a r t i c l e i n f o
Article history:Received 2 September 2013Received in revised form27 February 2014Accepted 6 April 2014Available online 19 April 2014
Keywords:Punching shearFlat slabsImpact loadingStrain-rate effectsCritical shear crack theory
* Corresponding author. Tel.: þ44 (0) 1483 686649E-mail address: [email protected] (J. Sagaset
http://dx.doi.org/10.1016/j.ijimpeng.2014.04.0030734-743X/� 2014 Published by Elsevier Ltd.
a b s t r a c t
Reinforced concrete flat slab structures are used widely in construction projects due to their economicand functional advantages. Punching shear failure in such structures can have catastrophic effects in thecase of, for example, multi-storey framed structures and the designer aims to ensure that ductile flexuraldeformation occurs before the brittle shear failure.
Shear mechanisms generally govern the behaviour of reinforced concrete structures subjected tolocalised impact loads. Existing experimental results investigating punching shear in flat slabs subjectedto impact loading shows that when increasing the loading rate, the punching shear strength also in-creases whereas the deformation capacity reduces. This behaviour is due to a combination of inertialeffects and material strain-rate effects which leads to a stiffer behaviour of the slab for higher loadingrates. This can also lead to a change of mode of failure from flexural to pure punching shear withincreasing loading rates. Current empirical formulae for punching shear are unable to predict thisbehaviour since the slab deformations are not considered for calculating the punching shear strength.
This paper presents an analytical model based on the Critical Shear Crack Theory which can be appliedto flat slabs subjected to impact loading. This model is particularly useful for cases such as progressivecollapse analysis and flat slab-column connections subjected to an impulsive axial load in the column.The novelty of the approach is that it considers (a) the dynamic punching shear capacity and (b) thedynamic shear demand, both in terms of the slab deformation (slab rotation). The model considers in-ertial effects and material strain-rate effects although it is shown that the former has a more significanteffect. Moreover, the model allows a further physical understanding of the phenomena and it can beapplied to different cases (slabs with and without transverse reinforcement) showing a good correlationwith experimental data.
� 2014 Published by Elsevier Ltd.
1. Introduction Fig. 1 gives typical ranges of strain-rates for different loading
1.1. High-rate loading
The design of most reinforced concrete (RC) structures is typi-cally governed by ultimate limit state performance of the variousstructural elements when subjected to static loading, e.g. dead (orpermanent) loads and live (or imposed or variable) loads. Whilstthe former are typically static in nature (e.g. structure’s self-weight,finishes etc.), the magnitude of live loading tends to be variablewith time (e.g. pedestrian or vehicular traffic loading). However, inmost cases, such loadings can be idealised as quasi-static, since therate at which this loading is applied, typically described by thestrain-rate, _3, is of a very small magnitude.
; fax: þ44 (0) 1483 682135.a).
sources.Dynamic loads are often also idealised as being quasi-static or
replaced by equivalent static loadings but in the case of extremeevents, such as blast or impact loading, such simplifications couldbe inadequate and further consideration is necessary [2]. Reliablestructural modelling is essential to accurately predict the responseand damage in structures subjected to loads at high strain-rates.The effects of strain-rate effects can be considered on two levels,viz. the effects on the material properties of the structure’s con-stituents and the effects on the response of the structure itself.
1.2. Effect of strain-rate on material properties
The effect of strain-rate on the mechanical properties of mostengineering materials is well-known. This includes the
Nomenclature
Latin lower casea penetration constant, [T�2]b penetration constant, [L�2]b0 punching control perimeter, [L]c1 tension softening constant, [e]c2 tension softening constant, [e]cs0 slab initial damping co-efficient, [M T�1]cs slab damping co-efficient, [M T�1]dg concrete maximum aggregate size, [L]dg0 reference concrete aggregate size, [L]dv shear-resisting slab effective depth, [L]d slab effective depth, [L]fc concrete compressive strength, [M L�1 T�2]fc0 reference concrete compressive strength, [M L�1 T�2]fct concrete tensile strength, [M L�1 T�2]fy steel reinforcement yield stress, [M L�1 T�2]g acceleration due to gravity, [L T�2]hi drop height of impactor, [L]hs slab thickness, [L]kc contact stiffness, [M T�2]ks0 slab initial stiffness, [M T�2]ks slab stiffness, [M T�2]mi mass of impactor, [M]ms0 slab initial mass, [M]ms slab mass, [M]rc column radius, [L]rs position of zero bending moment with respect to
support axis, [L]rs0 initial position of zero bending moment during contact
time, [L]t time, [T]tc contact time, [T]tE time to peak response, [T]ui(t) impactor displacement, [L]_uiðtÞ impactor velocity, [L T�1]€uiðtÞ impactor acceleration, [L T�2]us(t) slab displacement, [L]_usðtÞ slab velocity, [L T�1]€usðtÞ slab acceleration, [L T�2]vc concrete shear wave velocity, [L T�1]w crack width, [L]wc maximum crack width, [L]
Latin upper caseAx projected contact areas in the X direction for an unit
crack area, [e]Ay projected contact areas in the Y direction for an unit
crack area, [e]A impactor section pressure, [M L�1 T�2]Ec concrete elastic modulus, [M L�1 T�2]Es steel reinforcement elastic modulus, [M L�1 T�2]Gc concrete shear modulus, [M L�1 T�2]GF fracture energy, [M T�2]GF0 reference fracture energy, [M T�2]K material constant, [M�1 L2 T2]Leff slab effective span, [L]MRd unit slab flexural capacity, [M L T�2]Msd unit slab bending moment, [M L T�2]N crack normal force component, [M L T�2]P(t) contact force, [M L T�2]_P loading rate, [M L T�3]P’ section limiting load, [M L T�2]Ri impactor radius, [L]S crack shear force component, [M L T�2]V penetration velocity, [L T�1]V ’ velocity factor, [e]V0 impactor initial velocity, [L T�1]V* velocity constant, [L T�1]Vd shear force, [M L T�2]VR punching shear strength, [M L T�2]X penetration depth, [L]€X penetration acceleration, [L T�2]
Greek lower caseb shear modulus retention factor, [e]g concrete dilatation angle, [e]d crack separation, [L]_3 strain-rate, [T�1]m co-efficient of friction, [e]n Poisson’s ratio, [e]r flexural reinforcement ratio, [e]rc concrete density, [M L�3]rv shear reinforcement ratio, [-]sca concrete aggregate interlock normal stress, [M L�1 T�2]sct concrete tensile stress, [M L�1 T�2]sp cement paste plasticisation stress, [M L�1 T�2]sca concrete aggregate interlock shear stress, [M L�1 T�2]4(x) slab deformed configuration shape function, [e]f reinforcement bar diameter, [L]j slab rotation, [e]jR slab rotation at failure, [e]
K. Micallef et al. / International Journal of Impact Engineering 71 (2014) 17e3318
constituents of RC structures, namely the concrete and the steelreinforcement.
1.2.1. Concrete propertiesIt has been shown by many researchers (e.g. Refs. [3e11]) that
the tensile and compressive strengths of concrete both increasewith loading rate. A very comprehensive review of experimentaldata in this respect has been carried out by Cotsovos and Pavlovi�c[12].
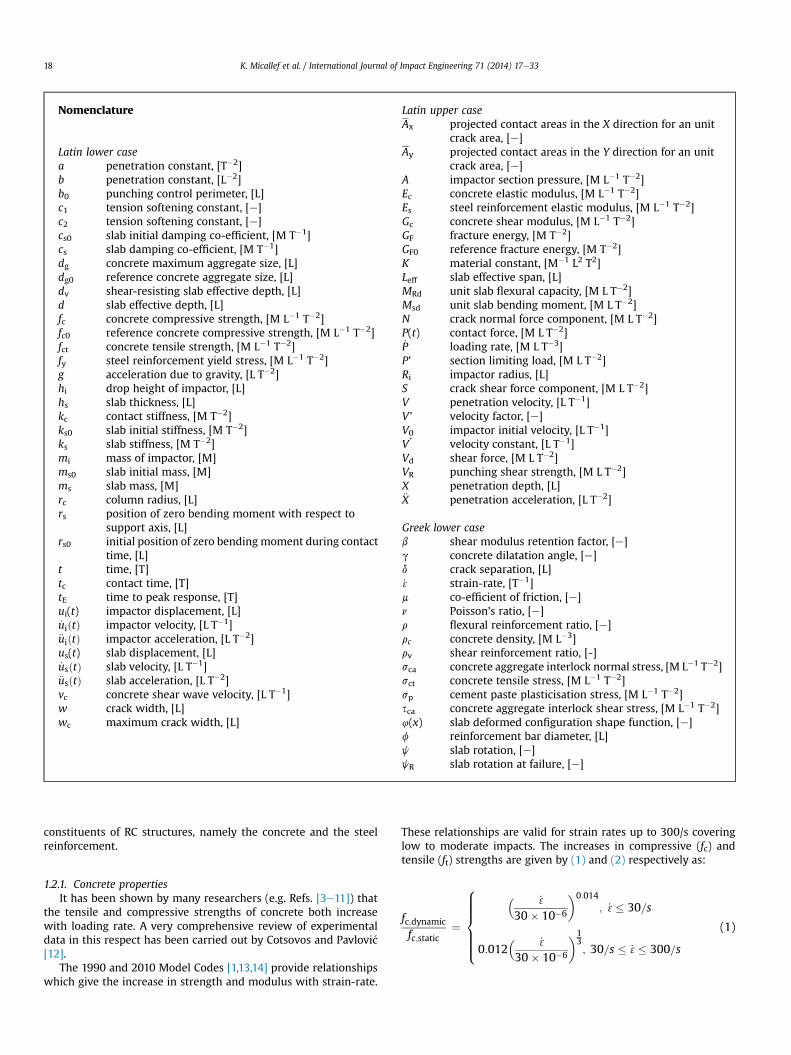
The 1990 and 2010 Model Codes [1,13,14] provide relationshipswhich give the increase in strength and modulus with strain-rate.
These relationships are valid for strain rates up to 300/s coveringlow to moderate impacts. The increases in compressive (fc) andtensile (ft) strengths are given by (1) and (2) respectively as:
fc;dynamic
fc;static¼
8>>>>><>>>>>:
� _3
30� 10�6
�0:014
; _3� 30=s
0:012� _3
30� 10�6
�13; 30=s � _3� 300=s
(1)
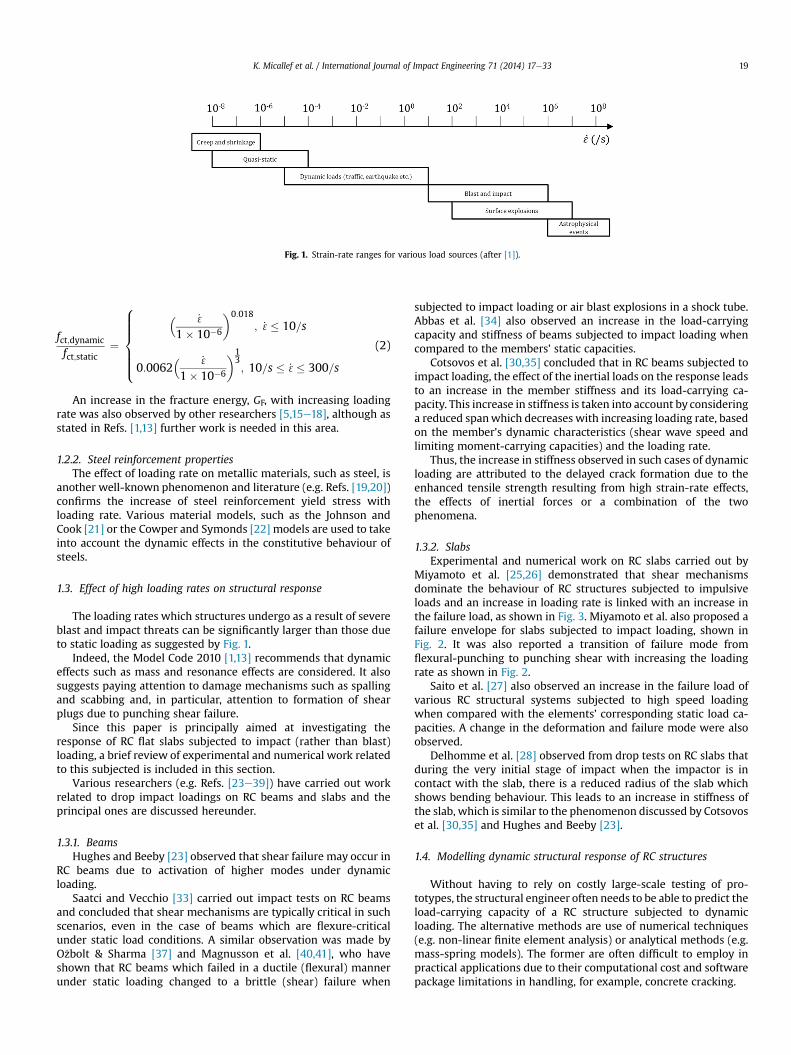
Fig. 1. Strain-rate ranges for various load sources (after [1]).
K. Micallef et al. / International Journal of Impact Engineering 71 (2014) 17e33 19
fct;dynamic
fct;static¼
8>>>>><>>>>>:
� _3
1� 10�6
�0:018
; _3� 10=s
0:0062� _3
1� 10�6
�13; 10=s � _3� 300=s
(2)
An increase in the fracture energy, GF, with increasing loadingrate was also observed by other researchers [5,15e18], although asstated in Refs. [1,13] further work is needed in this area.
1.2.2. Steel reinforcement propertiesThe effect of loading rate on metallic materials, such as steel, is
another well-known phenomenon and literature (e.g. Refs. [19,20])confirms the increase of steel reinforcement yield stress withloading rate. Various material models, such as the Johnson andCook [21] or the Cowper and Symonds [22] models are used to takeinto account the dynamic effects in the constitutive behaviour ofsteels.
1.3. Effect of high loading rates on structural response
The loading rates which structures undergo as a result of severeblast and impact threats can be significantly larger than those dueto static loading as suggested by Fig. 1.
Indeed, the Model Code 2010 [1,13] recommends that dynamiceffects such as mass and resonance effects are considered. It alsosuggests paying attention to damage mechanisms such as spallingand scabbing and, in particular, attention to formation of shearplugs due to punching shear failure.
Since this paper is principally aimed at investigating theresponse of RC flat slabs subjected to impact (rather than blast)loading, a brief review of experimental and numerical work relatedto this subjected is included in this section.
Various researchers (e.g. Refs. [23e39]) have carried out workrelated to drop impact loadings on RC beams and slabs and theprincipal ones are discussed hereunder.
1.3.1. BeamsHughes and Beeby [23] observed that shear failure may occur in
RC beams due to activation of higher modes under dynamicloading.
Saatci and Vecchio [33] carried out impact tests on RC beamsand concluded that shear mechanisms are typically critical in suchscenarios, even in the case of beams which are flexure-criticalunder static load conditions. A similar observation was made byO�zbolt & Sharma [37] and Magnusson et al. [40,41], who haveshown that RC beams which failed in a ductile (flexural) mannerunder static loading changed to a brittle (shear) failure when
subjected to impact loading or air blast explosions in a shock tube.Abbas et al. [34] also observed an increase in the load-carryingcapacity and stiffness of beams subjected to impact loading whencompared to the members’ static capacities.
Cotsovos et al. [30,35] concluded that in RC beams subjected toimpact loading, the effect of the inertial loads on the response leadsto an increase in the member stiffness and its load-carrying ca-pacity. This increase in stiffness is taken into account by consideringa reduced spanwhich decreases with increasing loading rate, basedon the member’s dynamic characteristics (shear wave speed andlimiting moment-carrying capacities) and the loading rate.
Thus, the increase in stiffness observed in such cases of dynamicloading are attributed to the delayed crack formation due to theenhanced tensile strength resulting from high strain-rate effects,the effects of inertial forces or a combination of the twophenomena.
1.3.2. SlabsExperimental and numerical work on RC slabs carried out by
Miyamoto et al. [25,26] demonstrated that shear mechanismsdominate the behaviour of RC structures subjected to impulsiveloads and an increase in loading rate is linked with an increase inthe failure load, as shown in Fig. 3. Miyamoto et al. also proposed afailure envelope for slabs subjected to impact loading, shown inFig. 2. It was also reported a transition of failure mode fromflexural-punching to punching shear with increasing the loadingrate as shown in Fig. 2.
Saito et al. [27] also observed an increase in the failure load ofvarious RC structural systems subjected to high speed loadingwhen compared with the elements’ corresponding static load ca-pacities. A change in the deformation and failure mode were alsoobserved.
Delhomme et al. [28] observed from drop tests on RC slabs thatduring the very initial stage of impact when the impactor is incontact with the slab, there is a reduced radius of the slab whichshows bending behaviour. This leads to an increase in stiffness ofthe slab, which is similar to the phenomenon discussed by Cotsovoset al. [30,35] and Hughes and Beeby [23].
1.4. Modelling dynamic structural response of RC structures
Without having to rely on costly large-scale testing of pro-totypes, the structural engineer often needs to be able to predict theload-carrying capacity of a RC structure subjected to dynamicloading. The alternative methods are use of numerical techniques(e.g. non-linear finite element analysis) or analytical methods (e.g.mass-spring models). The former are often difficult to employ inpractical applications due to their computational cost and softwarepackage limitations in handling, for example, concrete cracking.
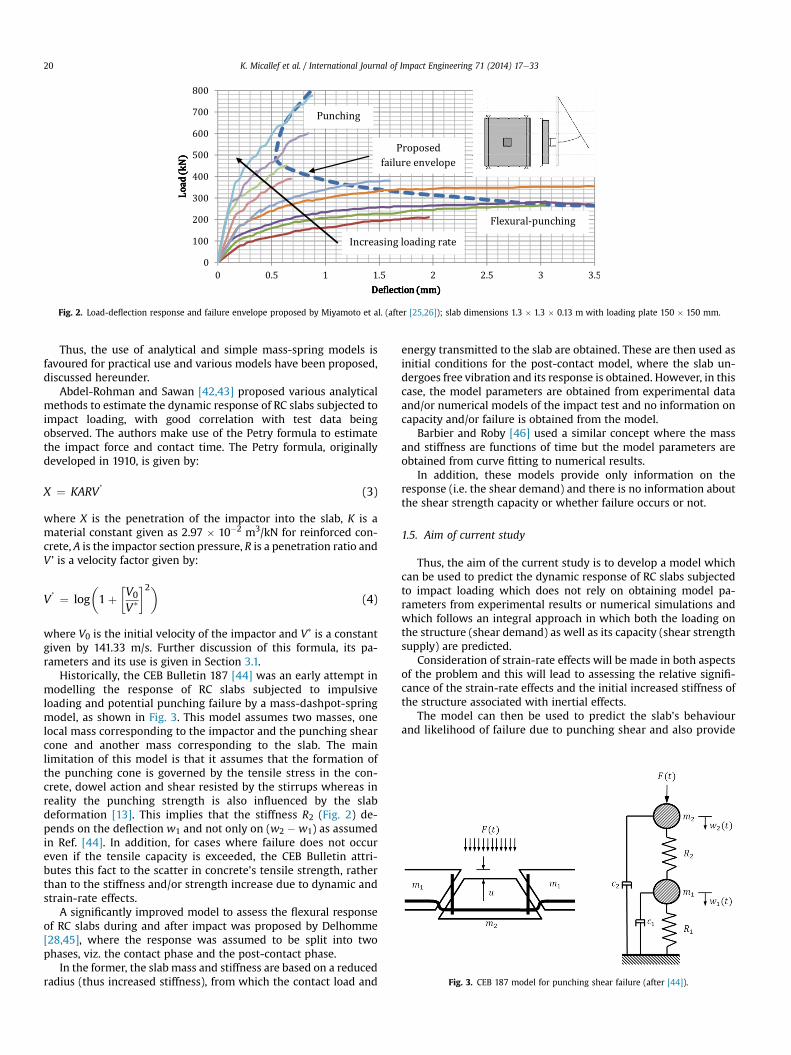
Fig. 2. Load-deflection response and failure envelope proposed by Miyamoto et al. (after [25,26]); slab dimensions 1.3 � 1.3 � 0.13 m with loading plate 150 � 150 mm.
Fig. 3. CEB 187 model for punching shear failure (after [44]).
K. Micallef et al. / International Journal of Impact Engineering 71 (2014) 17e3320
Thus, the use of analytical and simple mass-spring models isfavoured for practical use and various models have been proposed,discussed hereunder.
Abdel-Rohman and Sawan [42,43] proposed various analyticalmethods to estimate the dynamic response of RC slabs subjected toimpact loading, with good correlation with test data beingobserved. The authors make use of the Petry formula to estimatethe impact force and contact time. The Petry formula, originallydeveloped in 1910, is given by:
X ¼ KARV ’ (3)
where X is the penetration of the impactor into the slab, K is amaterial constant given as 2.97 � 10�2 m3/kN for reinforced con-crete, A is the impactor section pressure, R is a penetration ratio andV ’ is a velocity factor given by:
V ’ ¼ log�1þ
�V0
V*
�2�(4)
where V0 is the initial velocity of the impactor and V* is a constantgiven by 141.33 m/s. Further discussion of this formula, its pa-rameters and its use is given in Section 3.1.
Historically, the CEB Bulletin 187 [44] was an early attempt inmodelling the response of RC slabs subjected to impulsiveloading and potential punching failure by a mass-dashpot-springmodel, as shown in Fig. 3. This model assumes two masses, onelocal mass corresponding to the impactor and the punching shearcone and another mass corresponding to the slab. The mainlimitation of this model is that it assumes that the formation ofthe punching cone is governed by the tensile stress in the con-crete, dowel action and shear resisted by the stirrups whereas inreality the punching strength is also influenced by the slabdeformation [13]. This implies that the stiffness R2 (Fig. 2) de-pends on the deflection w1 and not only on (w2 � w1) as assumedin Ref. [44]. In addition, for cases where failure does not occureven if the tensile capacity is exceeded, the CEB Bulletin attri-butes this fact to the scatter in concrete’s tensile strength, ratherthan to the stiffness and/or strength increase due to dynamic andstrain-rate effects.
A significantly improved model to assess the flexural responseof RC slabs during and after impact was proposed by Delhomme[28,45], where the response was assumed to be split into twophases, viz. the contact phase and the post-contact phase.
In the former, the slab mass and stiffness are based on a reducedradius (thus increased stiffness), from which the contact load and
energy transmitted to the slab are obtained. These are then used asinitial conditions for the post-contact model, where the slab un-dergoes free vibration and its response is obtained. However, in thiscase, the model parameters are obtained from experimental dataand/or numerical models of the impact test and no information oncapacity and/or failure is obtained from the model.
Barbier and Roby [46] used a similar concept where the massand stiffness are functions of time but the model parameters areobtained from curve fitting to numerical results.
In addition, these models provide only information on theresponse (i.e. the shear demand) and there is no information aboutthe shear strength capacity or whether failure occurs or not.
1.5. Aim of current study
Thus, the aim of the current study is to develop a model whichcan be used to predict the dynamic response of RC slabs subjectedto impact loading which does not rely on obtaining model pa-rameters from experimental results or numerical simulations andwhich follows an integral approach in which both the loading onthe structure (shear demand) as well as its capacity (shear strengthsupply) are predicted.
Consideration of strain-rate effects will be made in both aspectsof the problem and this will lead to assessing the relative signifi-cance of the strain-rate effects and the initial increased stiffness ofthe structure associated with inertial effects.
The model can then be used to predict the slab’s behaviourand likelihood of failure due to punching shear and also provide
K. Micallef et al. / International Journal of Impact Engineering 71 (2014) 17e33 21
information about the levels of deformation at failure. Theapplication is illustrated by various case studies RC slabs withand without transverse reinforcement and low to moderateimpacts.
It should be noted at this point that the source of impact load-ings being considered in this paper is due to impactors which arerelatively rigid and thus non-deformable (e.g. impulsive axial loadin column such as in a progress collapse scenario, falling debris on aslab, falling objects on a slab and rock falls); such impact loadingsare termed as ‘hard impacts’ in the CEB Bulletin 187 [44] and in thiscase it is assumed that the kinetic energy imparted by the impactoris entirely absorbed by the deformation of the struck body, i.e., theRC slab.
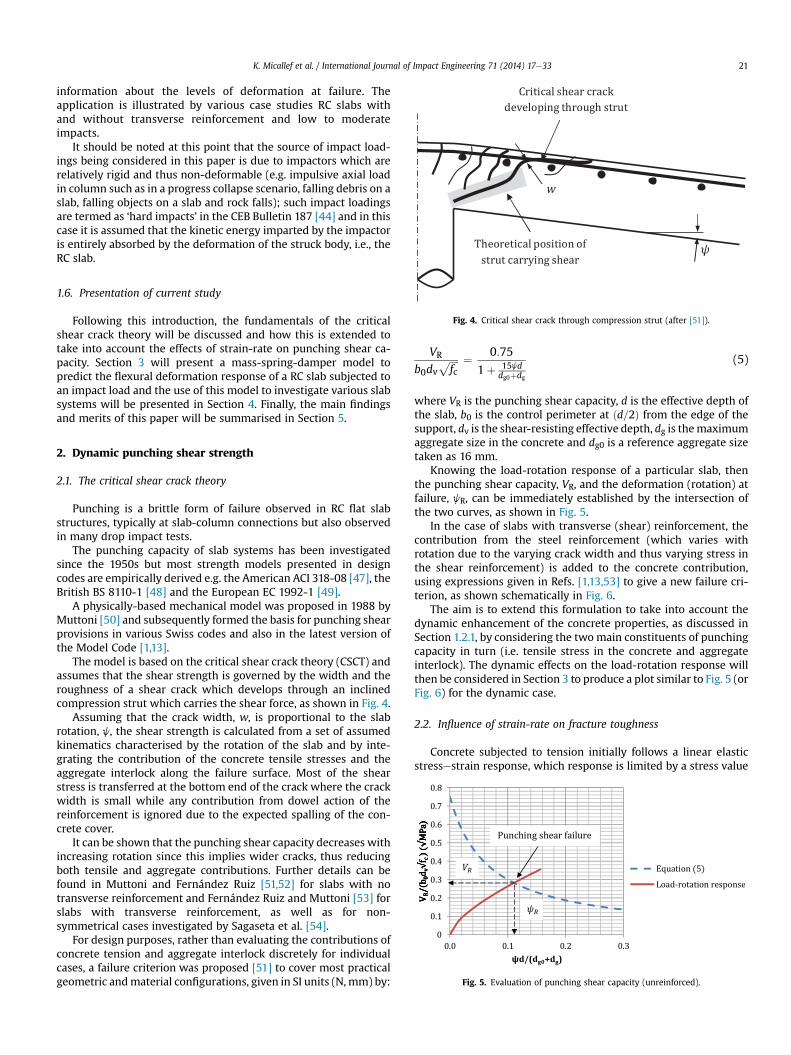
Fig. 4. Critical shear crack through compression strut (after [51]).
1.6. Presentation of current study
Following this introduction, the fundamentals of the criticalshear crack theory will be discussed and how this is extended totake into account the effects of strain-rate on punching shear ca-pacity. Section 3 will present a mass-spring-damper model topredict the flexural deformation response of a RC slab subjected toan impact load and the use of this model to investigate various slabsystems will be presented in Section 4. Finally, the main findingsand merits of this paper will be summarised in Section 5.
Fig. 5. Evaluation of punching shear capacity (unreinforced).
2. Dynamic punching shear strength
2.1. The critical shear crack theory
Punching is a brittle form of failure observed in RC flat slabstructures, typically at slab-column connections but also observedin many drop impact tests.
The punching capacity of slab systems has been investigatedsince the 1950s but most strength models presented in designcodes are empirically derived e.g. the American ACI 318-08 [47], theBritish BS 8110-1 [48] and the European EC 1992-1 [49].
A physically-based mechanical model was proposed in 1988 byMuttoni [50] and subsequently formed the basis for punching shearprovisions in various Swiss codes and also in the latest version ofthe Model Code [1,13].
The model is based on the critical shear crack theory (CSCT) andassumes that the shear strength is governed by the width and theroughness of a shear crack which develops through an inclinedcompression strut which carries the shear force, as shown in Fig. 4.
Assuming that the crack width, w, is proportional to the slabrotation, j, the shear strength is calculated from a set of assumedkinematics characterised by the rotation of the slab and by inte-grating the contribution of the concrete tensile stresses and theaggregate interlock along the failure surface. Most of the shearstress is transferred at the bottom end of the crack where the crackwidth is small while any contribution from dowel action of thereinforcement is ignored due to the expected spalling of the con-crete cover.
It can be shown that the punching shear capacity decreases withincreasing rotation since this implies wider cracks, thus reducingboth tensile and aggregate contributions. Further details can befound in Muttoni and Fernández Ruiz [51,52] for slabs with notransverse reinforcement and Fernández Ruiz and Muttoni [53] forslabs with transverse reinforcement, as well as for non-symmetrical cases investigated by Sagaseta et al. [54].
For design purposes, rather than evaluating the contributions ofconcrete tension and aggregate interlock discretely for individualcases, a failure criterion was proposed [51] to cover most practicalgeometric andmaterial configurations, given in SI units (N,mm) by:
VR
b0dvffiffiffiffifc
p ¼ 0:75
1þ 15jddg0þdg
(5)
where VR is the punching shear capacity, d is the effective depth ofthe slab, b0 is the control perimeter at ðd=2Þ from the edge of thesupport, dv is the shear-resisting effective depth, dg is themaximumaggregate size in the concrete and dg0 is a reference aggregate sizetaken as 16 mm.
Knowing the load-rotation response of a particular slab, thenthe punching shear capacity, VR, and the deformation (rotation) atfailure, jR, can be immediately established by the intersection ofthe two curves, as shown in Fig. 5.
In the case of slabs with transverse (shear) reinforcement, thecontribution from the steel reinforcement (which varies withrotation due to the varying crack width and thus varying stress inthe shear reinforcement) is added to the concrete contribution,using expressions given in Refs. [1,13,53] to give a new failure cri-terion, as shown schematically in Fig. 6.
The aim is to extend this formulation to take into account thedynamic enhancement of the concrete properties, as discussed inSection 1.2.1, by considering the two main constituents of punchingcapacity in turn (i.e. tensile stress in the concrete and aggregateinterlock). The dynamic effects on the load-rotation response willthen be considered in Section 3 to produce a plot similar to Fig. 5 (orFig. 6) for the dynamic case.
2.2. Influence of strain-rate on fracture toughness
Concrete subjected to tension initially follows a linear elasticstressestrain response, which response is limited by a stress value
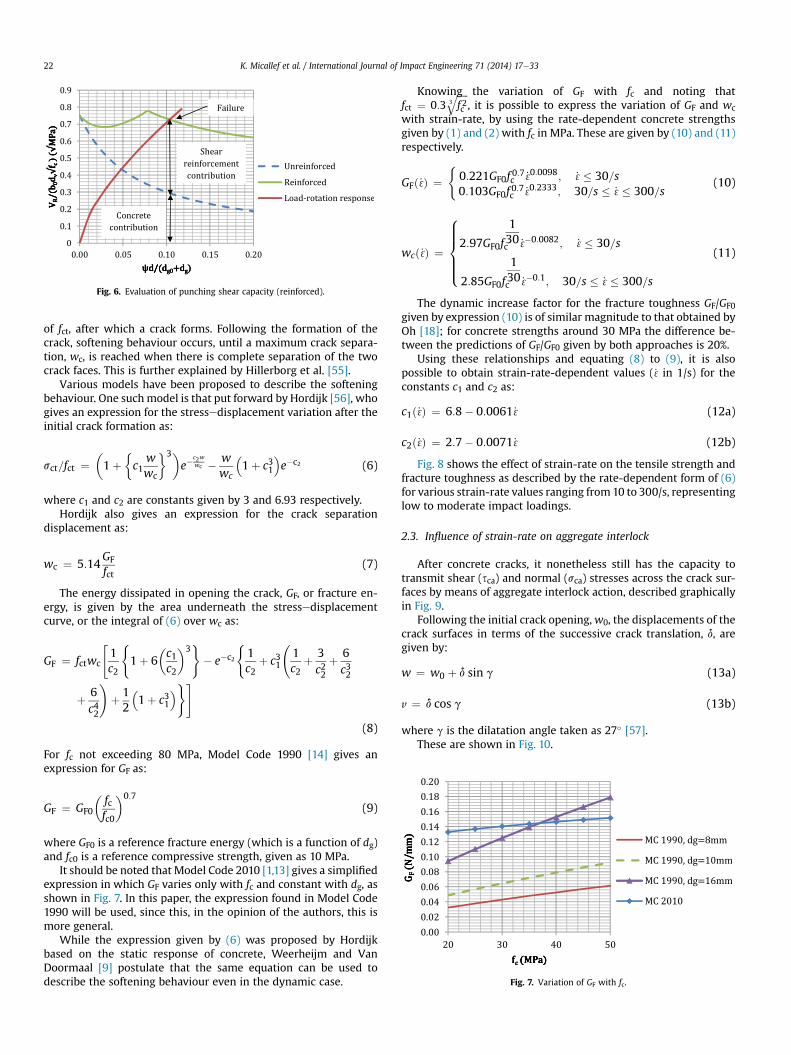
Fig. 6. Evaluation of punching shear capacity (reinforced).
Fig. 7. Variation of GF with fc.
K. Micallef et al. / International Journal of Impact Engineering 71 (2014) 17e3322
of fct, after which a crack forms. Following the formation of thecrack, softening behaviour occurs, until a maximum crack separa-tion, wc, is reached when there is complete separation of the twocrack faces. This is further explained by Hillerborg et al. [55].
Various models have been proposed to describe the softeningbehaviour. One suchmodel is that put forward by Hordijk [56], whogives an expression for the stressedisplacement variation after theinitial crack formation as:
sct=fct ¼�1þ
�c1
wwc
3�e�
c2wwc � w
wc
�1þ c31
e�c2 (6)
where c1 and c2 are constants given by 3 and 6.93 respectively.Hordijk also gives an expression for the crack separation
displacement as:
wc ¼ 5:14GF
fct(7)
The energy dissipated in opening the crack, GF, or fracture en-ergy, is given by the area underneath the stressedisplacementcurve, or the integral of (6) over wc as:
GF ¼ fctwc
"1c2
(1þ 6
�c1c2
�3)
� e�c2
(1c2
þ c31
1c2
þ 3c22
þ 6c32
þ 6c42
!þ 12
�1þ c31
)#
(8)
For fc not exceeding 80 MPa, Model Code 1990 [14] gives anexpression for GF as:
GF ¼ GF0
�fcfc0
�0:7
(9)
where GF0 is a reference fracture energy (which is a function of dg)and fc0 is a reference compressive strength, given as 10 MPa.
It should be noted that Model Code 2010 [1,13] gives a simplifiedexpression in which GF varies only with fc and constant with dg, asshown in Fig. 7. In this paper, the expression found in Model Code1990 will be used, since this, in the opinion of the authors, this ismore general.
While the expression given by (6) was proposed by Hordijkbased on the static response of concrete, Weerheijm and VanDoormaal [9] postulate that the same equation can be used todescribe the softening behaviour even in the dynamic case.
Knowing the variation of GF with fc and noting thatfct ¼ 0:3
ffiffiffiffiffif 2c
3q
, it is possible to express the variation of GF and wcwith strain-rate, by using the rate-dependent concrete strengthsgiven by (1) and (2) with fc in MPa. These are given by (10) and (11)respectively.
GFð_3Þ ¼(
0:221GF0f 0:7c _30:0098; _3� 30=s0:103GF0f 0:7c _30:2333; 30=s � _3� 300=s
(10)
wcð_3Þ ¼
8>>>><>>>>:2:97GF0f
130c _3�0:0082; _3� 30=s
2:85GF0f
130c _3�0:1; 30=s � _3� 300=s
(11)
The dynamic increase factor for the fracture toughness GF/GF0given by expression (10) is of similar magnitude to that obtained byOh [18]; for concrete strengths around 30 MPa the difference be-tween the predictions of GF/GF0 given by both approaches is 20%.
Using these relationships and equating (8) to (9), it is alsopossible to obtain strain-rate-dependent values (_3 in 1/s) for theconstants c1 and c2 as:
c1ð_3Þ ¼ 6:8� 0:0061_3 (12a)
c2ð_3Þ ¼ 2:7� 0:0071_3 (12b)
Fig. 8 shows the effect of strain-rate on the tensile strength andfracture toughness as described by the rate-dependent form of (6)for various strain-rate values ranging from10 to 300/s, representinglow to moderate impact loadings.
2.3. Influence of strain-rate on aggregate interlock
After concrete cracks, it nonetheless still has the capacity totransmit shear (sca) and normal (sca) stresses across the crack sur-faces by means of aggregate interlock action, described graphicallyin Fig. 9.
Following the initial crack opening,w0, the displacements of thecrack surfaces in terms of the successive crack translation, d, aregiven by:
w ¼ w0 þ d sin g (13a)
v ¼ d cos g (13b)
where g is the dilatation angle taken as 27� [57].These are shown in Fig. 10.
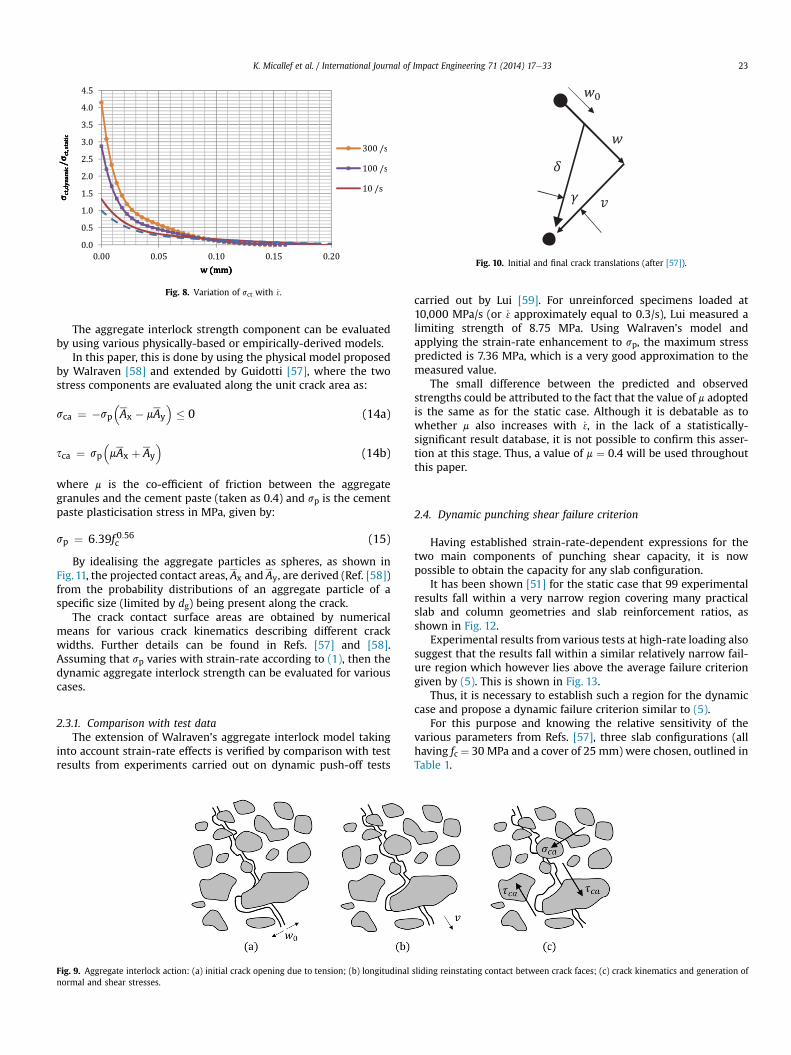
Fig. 8. Variation of sct with _3.
Fig. 10. Initial and final crack translations (after [57]).
K. Micallef et al. / International Journal of Impact Engineering 71 (2014) 17e33 23
The aggregate interlock strength component can be evaluatedby using various physically-based or empirically-derived models.
In this paper, this is done by using the physical model proposedby Walraven [58] and extended by Guidotti [57], where the twostress components are evaluated along the unit crack area as:
sca ¼ �sp�Ax � mAy
� 0 (14a)
sca ¼ sp�mAx þ Ay
(14b)
where m is the co-efficient of friction between the aggregategranules and the cement paste (taken as 0.4) and sp is the cementpaste plasticisation stress in MPa, given by:
sp ¼ 6:39f 0:56c (15)
By idealising the aggregate particles as spheres, as shown inFig. 11, the projected contact areas, Ax and Ay, are derived (Ref. [58])from the probability distributions of an aggregate particle of aspecific size (limited by dg) being present along the crack.
The crack contact surface areas are obtained by numericalmeans for various crack kinematics describing different crackwidths. Further details can be found in Refs. [57] and [58].Assuming that sp varies with strain-rate according to (1), then thedynamic aggregate interlock strength can be evaluated for variouscases.
2.3.1. Comparison with test dataThe extension of Walraven’s aggregate interlock model taking
into account strain-rate effects is verified by comparison with testresults from experiments carried out on dynamic push-off tests
Fig. 9. Aggregate interlock action: (a) initial crack opening due to tension; (b) longitudinalnormal and shear stresses.
carried out by Lui [59]. For unreinforced specimens loaded at10,000 MPa/s (or _3approximately equal to 0.3/s), Lui measured alimiting strength of 8.75 MPa. Using Walraven’s model andapplying the strain-rate enhancement to sp, the maximum stresspredicted is 7.36 MPa, which is a very good approximation to themeasured value.
The small difference between the predicted and observedstrengths could be attributed to the fact that the value of m adoptedis the same as for the static case. Although it is debatable as towhether m also increases with _3, in the lack of a statistically-significant result database, it is not possible to confirm this asser-tion at this stage. Thus, a value of m ¼ 0.4 will be used throughoutthis paper.
2.4. Dynamic punching shear failure criterion
Having established strain-rate-dependent expressions for thetwo main components of punching shear capacity, it is nowpossible to obtain the capacity for any slab configuration.
It has been shown [51] for the static case that 99 experimentalresults fall within a very narrow region covering many practicalslab and column geometries and slab reinforcement ratios, asshown in Fig. 12.
Experimental results from various tests at high-rate loading alsosuggest that the results fall within a similar relatively narrow fail-ure region which however lies above the average failure criteriongiven by (5). This is shown in Fig. 13.
Thus, it is necessary to establish such a region for the dynamiccase and propose a dynamic failure criterion similar to (5).
For this purpose and knowing the relative sensitivity of thevarious parameters from Refs. [57], three slab configurations (allhaving fc ¼ 30 MPa and a cover of 25 mm) were chosen, outlined inTable 1.
sliding reinstating contact between crack faces; (c) crack kinematics and generation of
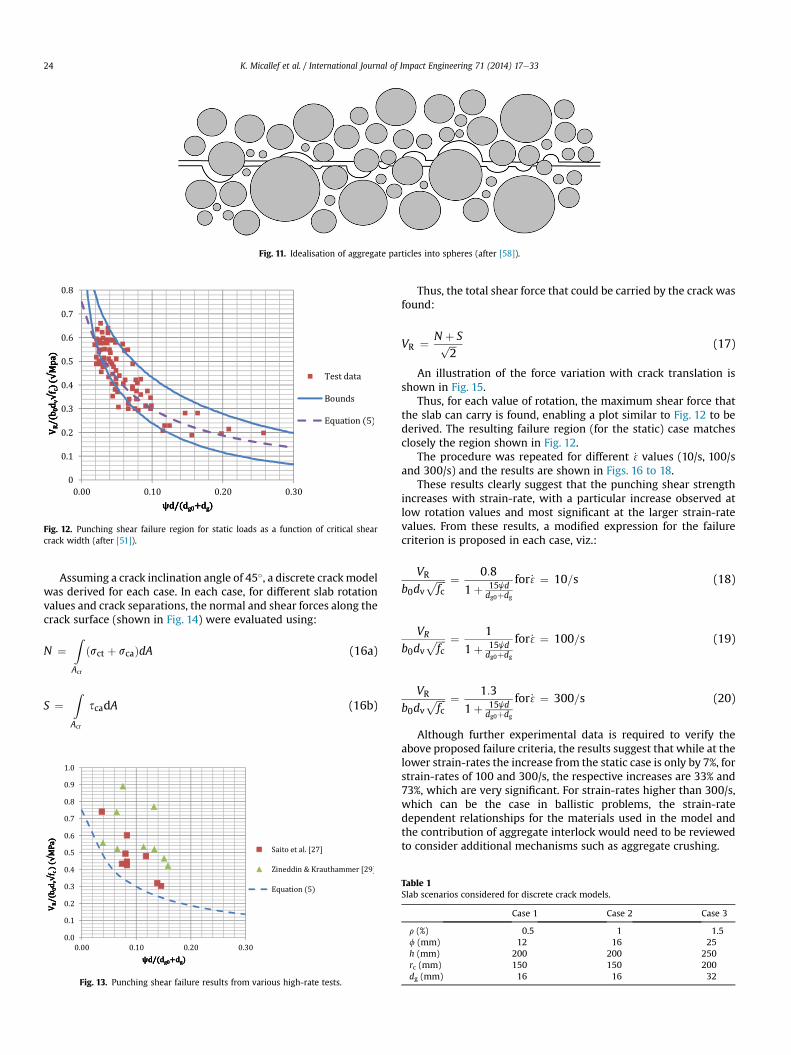
Fig. 11. Idealisation of aggregate particles into spheres (after [58]).
Fig. 12. Punching shear failure region for static loads as a function of critical shearcrack width (after [51]).
K. Micallef et al. / International Journal of Impact Engineering 71 (2014) 17e3324
Assuming a crack inclination angle of 45�, a discrete crackmodelwas derived for each case. In each case, for different slab rotationvalues and crack separations, the normal and shear forces along thecrack surface (shown in Fig. 14) were evaluated using:
N ¼ZAcr
sct þ scað ÞdA (16a)
S ¼ZAcr
scadA (16b)
Fig. 13. Punching shear failure results from various high-rate tests.
Thus, the total shear force that could be carried by the crack wasfound:
VR ¼ N þ Sffiffiffi2
p (17)
An illustration of the force variation with crack translation isshown in Fig. 15.
Thus, for each value of rotation, the maximum shear force thatthe slab can carry is found, enabling a plot similar to Fig. 12 to bederived. The resulting failure region (for the static) case matchesclosely the region shown in Fig. 12.
The procedure was repeated for different _3values (10/s, 100/sand 300/s) and the results are shown in Figs. 16 to 18.
These results clearly suggest that the punching shear strengthincreases with strain-rate, with a particular increase observed atlow rotation values and most significant at the larger strain-ratevalues. From these results, a modified expression for the failurecriterion is proposed in each case, viz.:
VR
b0dvffiffiffiffifc
p ¼ 0:8
1þ 15jddg0þdg
for_3¼ 10=s (18)
VR
b0dvffiffiffiffifc
p ¼ 1
1þ 15jddg0þdg
for_3¼ 100=s (19)
VR
b0dvffiffiffiffifc
p ¼ 1:3
1þ 15jddg0þdg
for_3¼ 300=s (20)
Although further experimental data is required to verify theabove proposed failure criteria, the results suggest that while at thelower strain-rates the increase from the static case is only by 7%, forstrain-rates of 100 and 300/s, the respective increases are 33% and73%, which are very significant. For strain-rates higher than 300/s,which can be the case in ballistic problems, the strain-ratedependent relationships for the materials used in the model andthe contribution of aggregate interlock would need to be reviewedto consider additional mechanisms such as aggregate crushing.
Table 1Slab scenarios considered for discrete crack models.
Case 1 Case 2 Case 3
r (%) 0.5 1 1.5f (mm) 12 16 25h (mm) 200 200 250rc (mm) 150 150 200dg (mm) 16 16 32
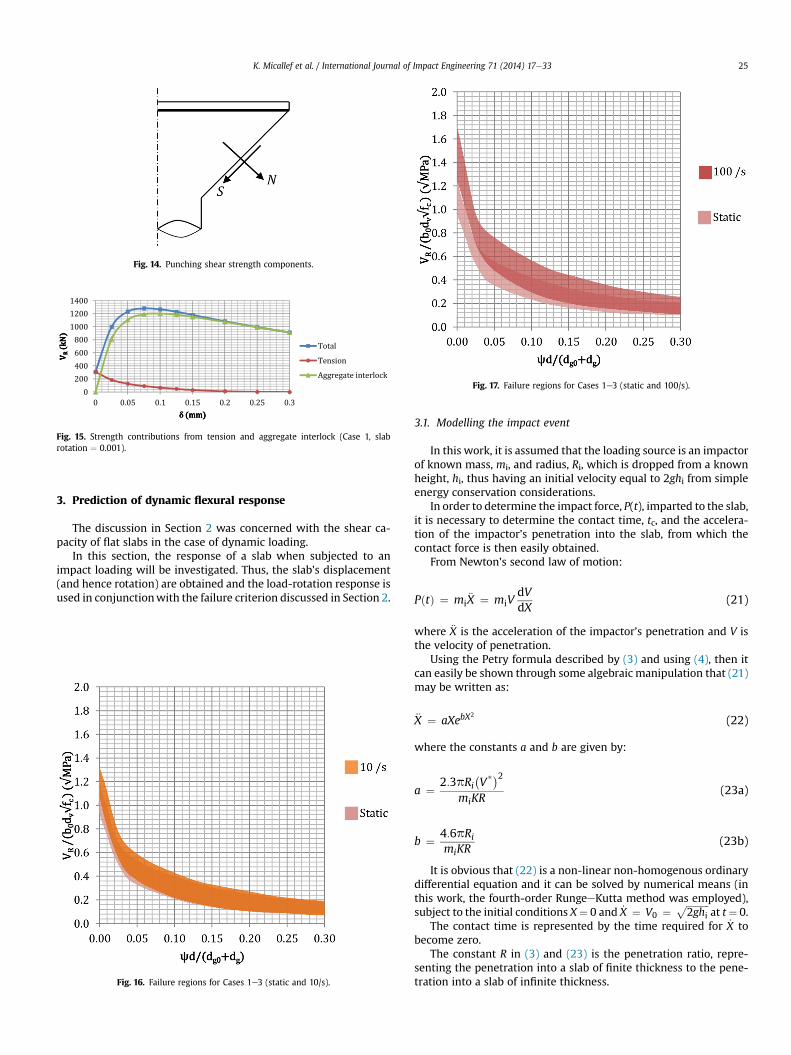
Fig. 14. Punching shear strength components.
Fig. 15. Strength contributions from tension and aggregate interlock (Case 1, slabrotation ¼ 0.001).
Fig. 17. Failure regions for Cases 1e3 (static and 100/s).
K. Micallef et al. / International Journal of Impact Engineering 71 (2014) 17e33 25
3. Prediction of dynamic flexural response
The discussion in Section 2 was concerned with the shear ca-pacity of flat slabs in the case of dynamic loading.
In this section, the response of a slab when subjected to animpact loading will be investigated. Thus, the slab’s displacement(and hence rotation) are obtained and the load-rotation response isused in conjunctionwith the failure criterion discussed in Section 2.
Fig. 16. Failure regions for Cases 1e3 (static and 10/s).
3.1. Modelling the impact event
In this work, it is assumed that the loading source is an impactorof known mass, mi, and radius, Ri, which is dropped from a knownheight, hi, thus having an initial velocity equal to 2ghi from simpleenergy conservation considerations.
In order to determine the impact force, P(t), imparted to the slab,it is necessary to determine the contact time, tc, and the accelera-tion of the impactor’s penetration into the slab, from which thecontact force is then easily obtained.
From Newton’s second law of motion:
PðtÞ ¼ mi€X ¼ miV
dVdX
(21)
where €X is the acceleration of the impactor’s penetration and V isthe velocity of penetration.
Using the Petry formula described by (3) and using (4), then itcan easily be shown through some algebraic manipulation that (21)may be written as:
€X ¼ aXebX2
(22)
where the constants a and b are given by:
a ¼ 2:3pRi�V*�2
miKR(23a)
b ¼ 4:6pRimiKR
(23b)
It is obvious that (22) is a non-linear non-homogenous ordinarydifferential equation and it can be solved by numerical means (inthis work, the fourth-order RungeeKutta method was employed),subject to the initial conditions X¼ 0 and _X ¼ V0 ¼
ffiffiffiffiffiffiffiffiffiffi2ghi
pat t¼ 0.
The contact time is represented by the time required for _X tobecome zero.
The constant R in (3) and (23) is the penetration ratio, repre-senting the penetration into a slab of finite thickness to the pene-tration into a slab of infinite thickness.
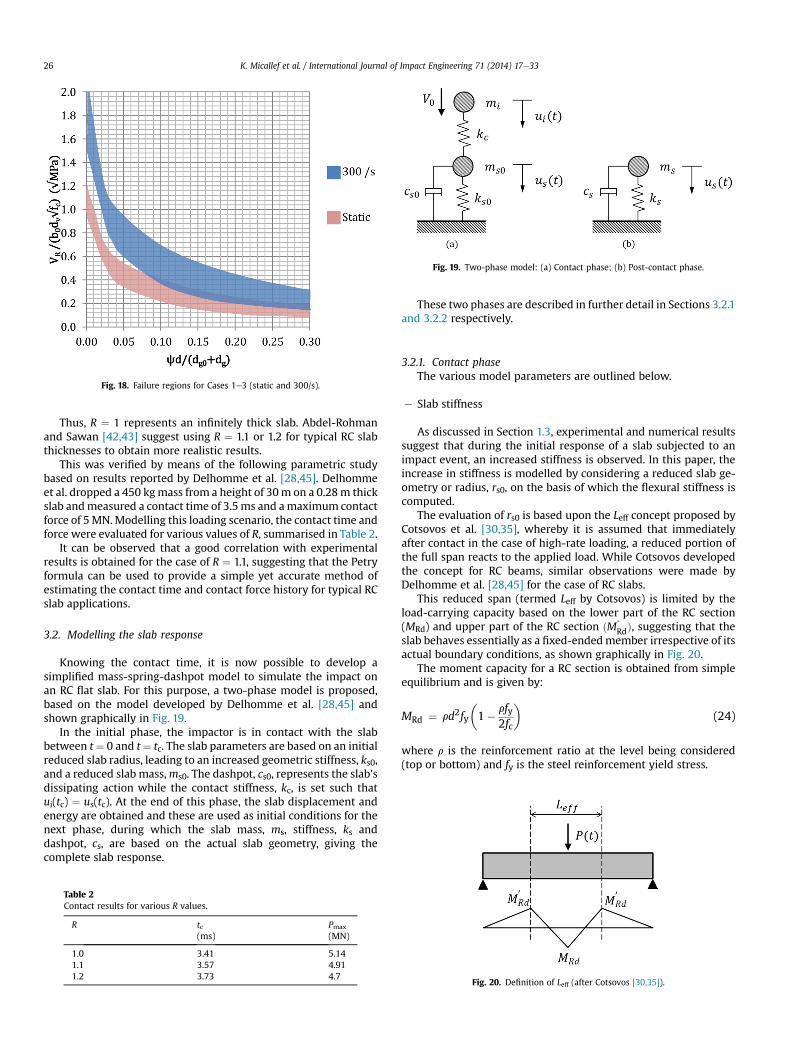
Fig. 18. Failure regions for Cases 1e3 (static and 300/s).
Fig. 19. Two-phase model: (a) Contact phase; (b) Post-contact phase.
K. Micallef et al. / International Journal of Impact Engineering 71 (2014) 17e3326
Thus, R ¼ 1 represents an infinitely thick slab. Abdel-Rohmanand Sawan [42,43] suggest using R ¼ 1.1 or 1.2 for typical RC slabthicknesses to obtain more realistic results.
This was verified by means of the following parametric studybased on results reported by Delhomme et al. [28,45]. Delhommeet al. dropped a 450 kgmass from a height of 30m on a 0.28m thickslab andmeasured a contact time of 3.5ms and amaximum contactforce of 5MN.Modelling this loading scenario, the contact time andforce were evaluated for various values of R, summarised in Table 2.
It can be observed that a good correlation with experimentalresults is obtained for the case of R ¼ 1.1, suggesting that the Petryformula can be used to provide a simple yet accurate method ofestimating the contact time and contact force history for typical RCslab applications.
3.2. Modelling the slab response
Knowing the contact time, it is now possible to develop asimplified mass-spring-dashpot model to simulate the impact onan RC flat slab. For this purpose, a two-phase model is proposed,based on the model developed by Delhomme et al. [28,45] andshown graphically in Fig. 19.
In the initial phase, the impactor is in contact with the slabbetween t¼ 0 and t¼ tc. The slab parameters are based on an initialreduced slab radius, leading to an increased geometric stiffness, ks0,and a reduced slab mass,ms0. The dashpot, cs0, represents the slab’sdissipating action while the contact stiffness, kc, is set such thatui(tc) ¼ us(tc). At the end of this phase, the slab displacement andenergy are obtained and these are used as initial conditions for thenext phase, during which the slab mass, ms, stiffness, ks anddashpot, cs, are based on the actual slab geometry, giving thecomplete slab response.
Table 2Contact results for various R values.
R tc(ms)
Pmax
(MN)
1.0 3.41 5.141.1 3.57 4.911.2 3.73 4.7
These two phases are described in further detail in Sections 3.2.1and 3.2.2 respectively.
3.2.1. Contact phaseThe various model parameters are outlined below.
e Slab stiffness
As discussed in Section 1.3, experimental and numerical resultssuggest that during the initial response of a slab subjected to animpact event, an increased stiffness is observed. In this paper, theincrease in stiffness is modelled by considering a reduced slab ge-ometry or radius, rs0, on the basis of which the flexural stiffness iscomputed.
The evaluation of rs0 is based upon the Leff concept proposed byCotsovos et al. [30,35], whereby it is assumed that immediatelyafter contact in the case of high-rate loading, a reduced portion ofthe full span reacts to the applied load. While Cotsovos developedthe concept for RC beams, similar observations were made byDelhomme et al. [28,45] for the case of RC slabs.
This reduced span (termed Leff by Cotsovos) is limited by theload-carrying capacity based on the lower part of the RC section(MRd) and upper part of the RC section ðM’
RdÞ, suggesting that theslab behaves essentially as a fixed-endedmember irrespective of itsactual boundary conditions, as shown graphically in Fig. 20.
The moment capacity for a RC section is obtained from simpleequilibrium and is given by:
MRd ¼ rd2fy
�1� rfy
2fc
�(24)
where r is the reinforcement ratio at the level being considered(top or bottom) and fy is the steel reinforcement yield stress.
Fig. 20. Definition of Leff (after Cotsovos [30,35]).
K. Micallef et al. / International Journal of Impact Engineering 71 (2014) 17e33 27
The limiting moment capacity at the top of the section is eitherthe moment capacity which can be generated by any reinforcementpresent at the top of the section as determined by (24) or thesection’s cracking moment (Mcr) for the case of a section of thick-ness hs with no top reinforcement, given by:
Mcr ¼ fcth2s6
(25)
Defining the velocity, vc, at which shear waves travel throughconcrete as:
vc ¼ffiffiffiffiffiffiGc
rc
s(26)
where Gc is the concrete shear modulus and rc is the concretedensity, it is possible to find the time, Dt, required to reach thelimiting moment capacities as per Fig. 20 as:
Dt ¼ Leff2vc
(27)
Defining P’ as the load required forM’Rd to be generated at the slab’s
upper face, then.
P’ ¼ 8M’Rd
Leff(28)
If _P is the loading rate (obtained from the Petry formula asdescribed in Section 3.1), then P’ is simply given by _PDt. Using thisexpression, (27) and (28), Leff is found as.
Leff ¼ M’Rdvc_P
(29)
Thus, from (29), Lefff1= _P for any given section, confirmingphysical observations that the stiffness is observed to increase (i.e.Leff decreases) with increasing loading rate.
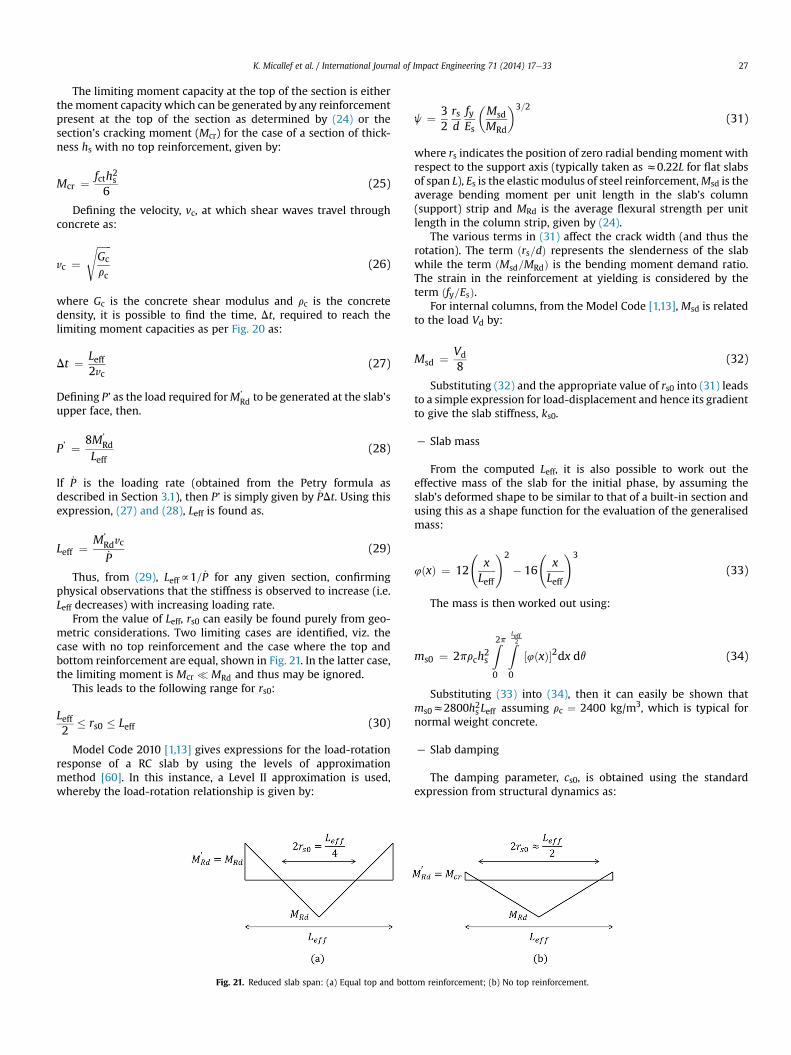
From the value of Leff, rs0 can easily be found purely from geo-metric considerations. Two limiting cases are identified, viz. thecase with no top reinforcement and the case where the top andbottom reinforcement are equal, shown in Fig. 21. In the latter case,the limiting moment is Mcr � MRd and thus may be ignored.
This leads to the following range for rs0:
Leff2
� rs0 � Leff (30)
Model Code 2010 [1,13] gives expressions for the load-rotationresponse of a RC slab by using the levels of approximationmethod [60]. In this instance, a Level II approximation is used,whereby the load-rotation relationship is given by:
Fig. 21. Reduced slab span: (a) Equal top and bott
j ¼ 32rsd
fyEs
�MsdMRd
�3=2(31)
where rs indicates the position of zero radial bending moment withrespect to the support axis (typically taken as z0.22L for flat slabsof span L), Es is the elastic modulus of steel reinforcement,Msd is theaverage bending moment per unit length in the slab’s column(support) strip and MRd is the average flexural strength per unitlength in the column strip, given by (24).
The various terms in (31) affect the crack width (and thus therotation). The term ðrs=dÞ represents the slenderness of the slabwhile the term ðMsd=MRdÞ is the bending moment demand ratio.The strain in the reinforcement at yielding is considered by theterm ðfy=EsÞ.
For internal columns, from the Model Code [1,13], Msd is relatedto the load Vd by:
Msd ¼ Vd8
(32)
Substituting (32) and the appropriate value of rs0 into (31) leadsto a simple expression for load-displacement and hence its gradientto give the slab stiffness, ks0.
e Slab mass
From the computed Leff, it is also possible to work out theeffective mass of the slab for the initial phase, by assuming theslab’s deformed shape to be similar to that of a built-in section andusing this as a shape function for the evaluation of the generalisedmass:
4ðxÞ ¼ 12
xLeff
!2
� 16
xLeff
!3
(33)
The mass is then worked out using:
ms0 ¼ 2prch2s
Z2p0
ZLeff20
½4ðxÞ�2dx dq (34)
Substituting (33) into (34), then it can easily be shown thatms0z2800h2s Leff assuming rc ¼ 2400 kg/m3, which is typical fornormal weight concrete.
e Slab damping
The damping parameter, cs0, is obtained using the standardexpression from structural dynamics as:
om reinforcement; (b) No top reinforcement.
K. Micallef et al. / International Journal of Impact Engineering 71 (2014) 17e3328
cs0 ¼ 2zms0
ffiffiffiffiffiffiffiffiffiks0ms0
s(35)
where z is the structure’s damping co-efficient, which depends onthe structural type.
Further discussion on the value of this parameter is done inSection 4.
e Contact stiffness
Finally, the contact stiffness, kc, is set such that the impactor’sand slab’s displacement are equal at t ¼ tc and by assuming theHertz contact law given by:
Fc ¼ kcðui � usÞ3=2 (36)
The value of contact stiffness is obtained by an iterative processuntil it has a value such that the above condition is satisfied.
e Governing equations of motion
Having established all the mass, spring and damping parame-ters, it is now possible to write the governing equations of motionfor the first phase:(
mið€ui þ gÞ þ kcðui � usÞ3=2 ¼ 0ms0€us þ cs0 _us þ ks0us � kcðui � usÞ3=2 ¼ 0
(37)
The system of equations shown in (37) is solved by numericalmeans (e.g. fourth-order RungeeKutta method), subject to theinitial conditions us ¼ 0 and _ui ¼
ffiffiffiffiffiffiffiffiffiffi2ghi
pat t ¼ 0.
At the end of the contact phase, the slab displacement us isobtained and this is used as an initial condition for the post-contactphase. In addition, the strain and kinetic energy in the slab are alsoevaluated from which the slab velocity is obtained.
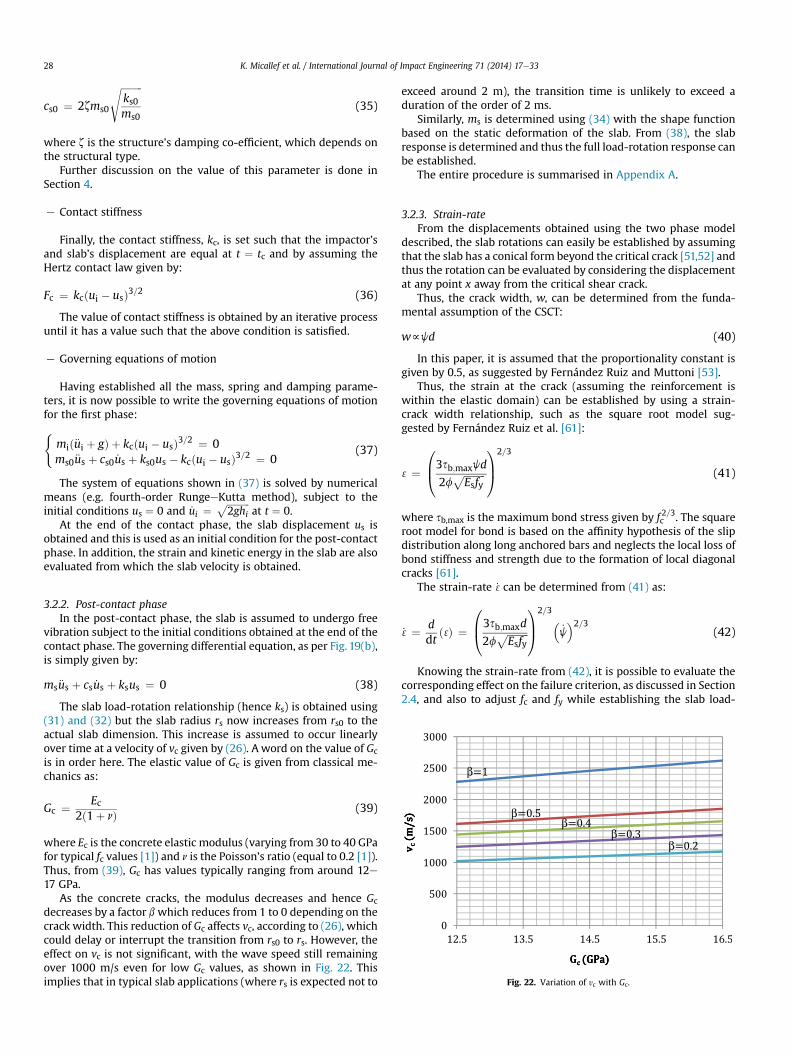
Fig. 22. Variation of yc with Gc.
3.2.2. Post-contact phaseIn the post-contact phase, the slab is assumed to undergo free
vibration subject to the initial conditions obtained at the end of thecontact phase. The governing differential equation, as per Fig. 19(b),is simply given by:
ms€us þ cs _us þ ksus ¼ 0 (38)
The slab load-rotation relationship (hence ks) is obtained using(31) and (32) but the slab radius rs now increases from rs0 to theactual slab dimension. This increase is assumed to occur linearlyover time at a velocity of vc given by (26). A word on the value of Gcis in order here. The elastic value of Gc is given from classical me-chanics as:
Gc ¼ Ec2ð1þ nÞ (39)
where Ec is the concrete elastic modulus (varying from 30 to 40 GPafor typical fc values [1]) and n is the Poisson’s ratio (equal to 0.2 [1]).Thus, from (39), Gc has values typically ranging from around 12e17 GPa.
As the concrete cracks, the modulus decreases and hence Gcdecreases by a factor bwhich reduces from 1 to 0 depending on thecrack width. This reduction of Gc affects vc, according to (26), whichcould delay or interrupt the transition from rs0 to rs. However, theeffect on vc is not significant, with the wave speed still remainingover 1000 m/s even for low Gc values, as shown in Fig. 22. Thisimplies that in typical slab applications (where rs is expected not to
exceed around 2 m), the transition time is unlikely to exceed aduration of the order of 2 ms.
Similarly, ms is determined using (34) with the shape functionbased on the static deformation of the slab. From (38), the slabresponse is determined and thus the full load-rotation response canbe established.
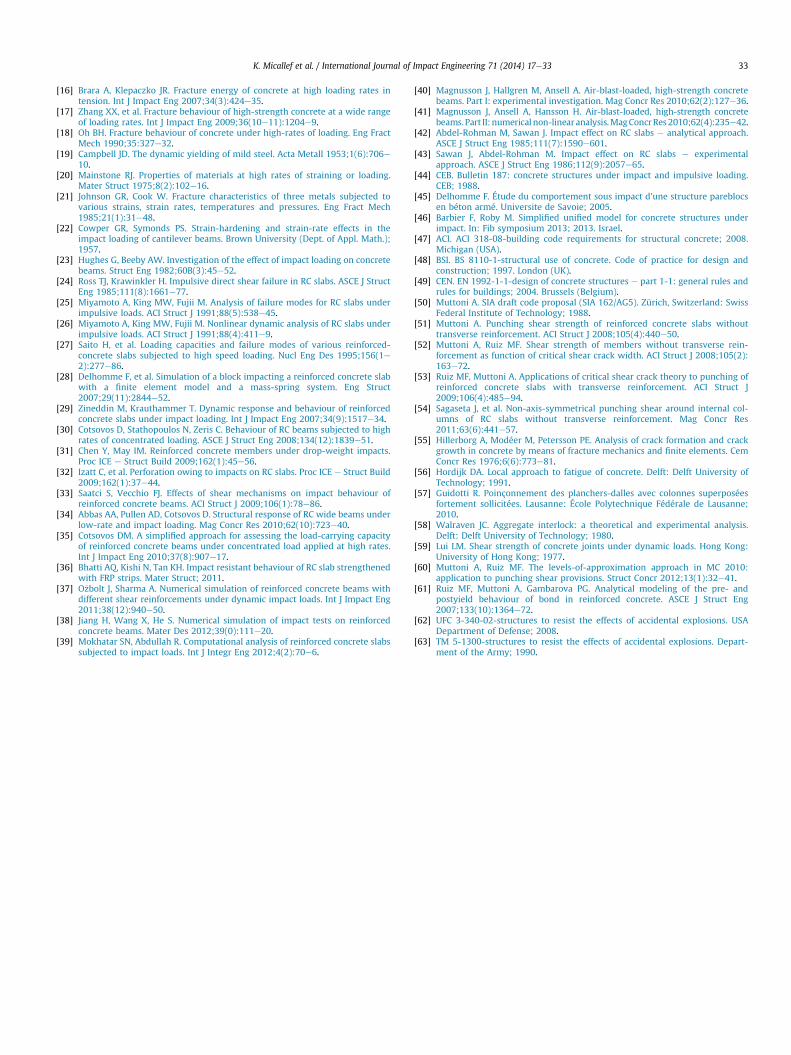
The entire procedure is summarised in Appendix A.
3.2.3. Strain-rateFrom the displacements obtained using the two phase model
described, the slab rotations can easily be established by assumingthat the slab has a conical form beyond the critical crack [51,52] andthus the rotation can be evaluated by considering the displacementat any point x away from the critical shear crack.
Thus, the crack width, w, can be determined from the funda-mental assumption of the CSCT:
wfjd (40)
In this paper, it is assumed that the proportionality constant isgiven by 0.5, as suggested by Fernández Ruiz and Muttoni [53].
Thus, the strain at the crack (assuming the reinforcement iswithin the elastic domain) can be established by using a strain-crack width relationship, such as the square root model sug-gested by Fernández Ruiz et al. [61]:
3¼
0B@3sb;maxjd
2fffiffiffiffiffiffiffiffiffiEsfy
p1CA
2=3
(41)
where sb,max is the maximum bond stress given by f 2=3c . The squareroot model for bond is based on the affinity hypothesis of the slipdistribution along long anchored bars and neglects the local loss ofbond stiffness and strength due to the formation of local diagonalcracks [61].
The strain-rate _3can be determined from (41) as:
_3¼ ddt
ð 3Þ ¼
0B@3sb;maxd
2fffiffiffiffiffiffiffiffiffiEsfy
p1CA
2=3�_j2=3
(42)
Knowing the strain-rate from (42), it is possible to evaluate thecorresponding effect on the failure criterion, as discussed in Section2.4, and also to adjust fc and fy while establishing the slab load-
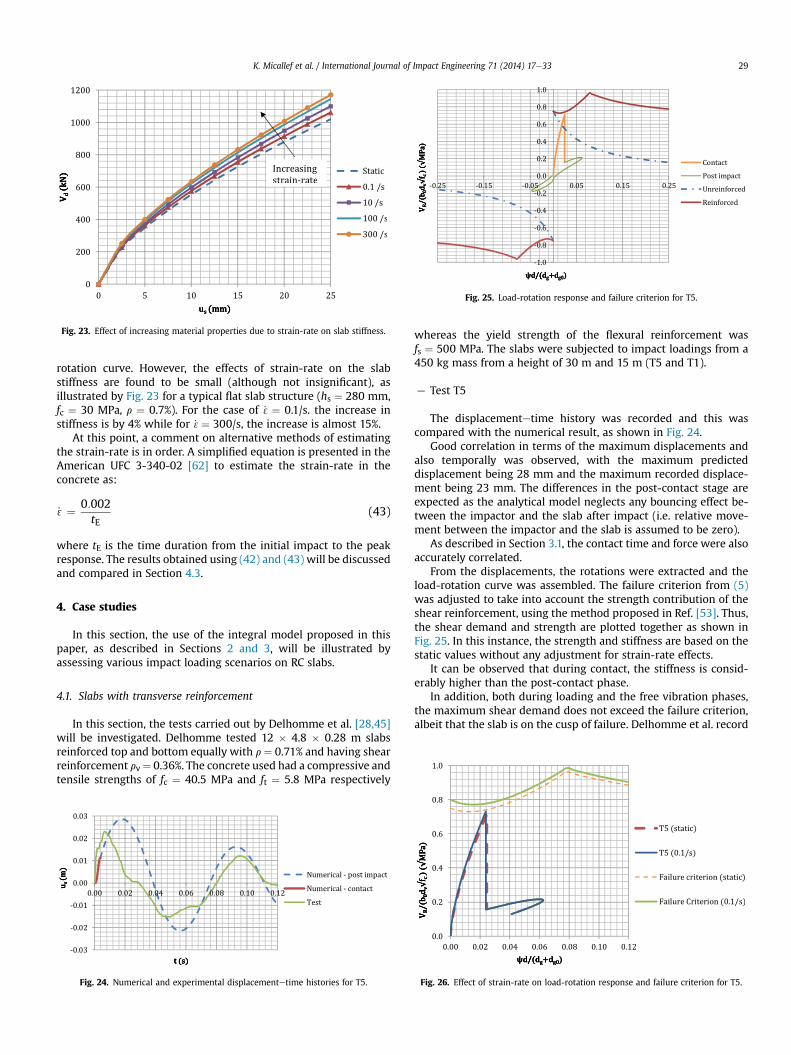
Fig. 23. Effect of increasing material properties due to strain-rate on slab stiffness.
Fig. 25. Load-rotation response and failure criterion for T5.
K. Micallef et al. / International Journal of Impact Engineering 71 (2014) 17e33 29
rotation curve. However, the effects of strain-rate on the slabstiffness are found to be small (although not insignificant), asillustrated by Fig. 23 for a typical flat slab structure (hs ¼ 280 mm,fc ¼ 30 MPa, r ¼ 0.7%). For the case of _3¼ 0.1/s. the increase instiffness is by 4% while for _3¼ 300/s, the increase is almost 15%.
At this point, a comment on alternative methods of estimatingthe strain-rate is in order. A simplified equation is presented in theAmerican UFC 3-340-02 [62] to estimate the strain-rate in theconcrete as:
_3¼ 0:002tE
(43)
where tE is the time duration from the initial impact to the peakresponse. The results obtained using (42) and (43) will be discussedand compared in Section 4.3.
4. Case studies
In this section, the use of the integral model proposed in thispaper, as described in Sections 2 and 3, will be illustrated byassessing various impact loading scenarios on RC slabs.
4.1. Slabs with transverse reinforcement
In this section, the tests carried out by Delhomme et al. [28,45]will be investigated. Delhomme tested 12 � 4.8 � 0.28 m slabsreinforced top and bottom equally with r ¼ 0.71% and having shearreinforcement rv¼ 0.36%. The concrete used had a compressive andtensile strengths of fc ¼ 40.5 MPa and ft ¼ 5.8 MPa respectively
Fig. 24. Numerical and experimental displacementetime histories for T5.
whereas the yield strength of the flexural reinforcement wasfs ¼ 500 MPa. The slabs were subjected to impact loadings from a450 kg mass from a height of 30 m and 15 m (T5 and T1).
e Test T5
The displacementetime history was recorded and this wascompared with the numerical result, as shown in Fig. 24.
Good correlation in terms of the maximum displacements andalso temporally was observed, with the maximum predicteddisplacement being 28 mm and the maximum recorded displace-ment being 23 mm. The differences in the post-contact stage areexpected as the analytical model neglects any bouncing effect be-tween the impactor and the slab after impact (i.e. relative move-ment between the impactor and the slab is assumed to be zero).
As described in Section 3.1, the contact time and force were alsoaccurately correlated.
From the displacements, the rotations were extracted and theload-rotation curve was assembled. The failure criterion from (5)was adjusted to take into account the strength contribution of theshear reinforcement, using the method proposed in Ref. [53]. Thus,the shear demand and strength are plotted together as shown inFig. 25. In this instance, the strength and stiffness are based on thestatic values without any adjustment for strain-rate effects.
It can be observed that during contact, the stiffness is consid-erably higher than the post-contact phase.
In addition, both during loading and the free vibration phases,the maximum shear demand does not exceed the failure criterion,albeit that the slab is on the cusp of failure. Delhomme et al. record
Fig. 26. Effect of strain-rate on load-rotation response and failure criterion for T5.
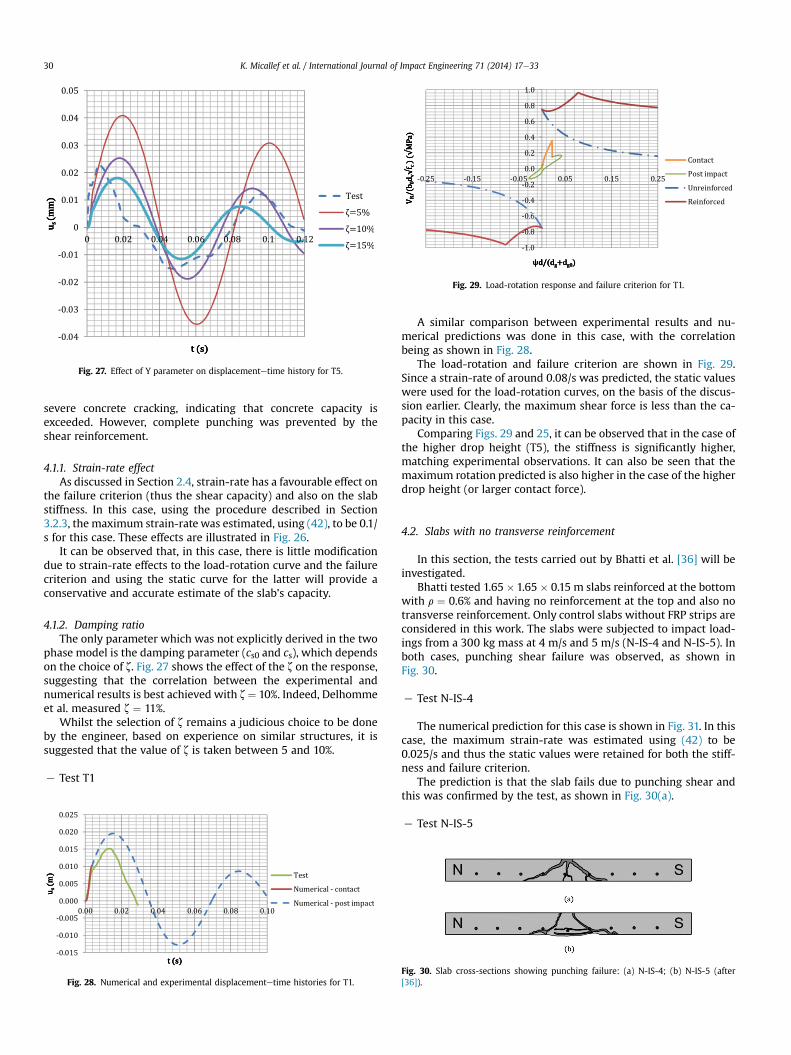
Fig. 27. Effect of Y parameter on displacementetime history for T5.
Fig. 29. Load-rotation response and failure criterion for T1.
K. Micallef et al. / International Journal of Impact Engineering 71 (2014) 17e3330
severe concrete cracking, indicating that concrete capacity isexceeded. However, complete punching was prevented by theshear reinforcement.
4.1.1. Strain-rate effectAs discussed in Section 2.4, strain-rate has a favourable effect on
the failure criterion (thus the shear capacity) and also on the slabstiffness. In this case, using the procedure described in Section3.2.3, the maximum strain-rate was estimated, using (42), to be 0.1/s for this case. These effects are illustrated in Fig. 26.
It can be observed that, in this case, there is little modificationdue to strain-rate effects to the load-rotation curve and the failurecriterion and using the static curve for the latter will provide aconservative and accurate estimate of the slab’s capacity.
4.1.2. Damping ratioThe only parameter which was not explicitly derived in the two
phase model is the damping parameter (cs0 and cs), which dependson the choice of z. Fig. 27 shows the effect of the z on the response,suggesting that the correlation between the experimental andnumerical results is best achieved with z¼ 10%. Indeed, Delhommeet al. measured z ¼ 11%.
Whilst the selection of z remains a judicious choice to be doneby the engineer, based on experience on similar structures, it issuggested that the value of z is taken between 5 and 10%.
e Test T1
Fig. 28. Numerical and experimental displacementetime histories for T1.
A similar comparison between experimental results and nu-merical predictions was done in this case, with the correlationbeing as shown in Fig. 28.
The load-rotation and failure criterion are shown in Fig. 29.Since a strain-rate of around 0.08/s was predicted, the static valueswere used for the load-rotation curves, on the basis of the discus-sion earlier. Clearly, the maximum shear force is less than the ca-pacity in this case.
Comparing Figs. 29 and 25, it can be observed that in the case ofthe higher drop height (T5), the stiffness is significantly higher,matching experimental observations. It can also be seen that themaximum rotation predicted is also higher in the case of the higherdrop height (or larger contact force).
4.2. Slabs with no transverse reinforcement
In this section, the tests carried out by Bhatti et al. [36] will beinvestigated.
Bhatti tested 1.65 � 1.65 � 0.15 m slabs reinforced at the bottomwith r ¼ 0.6% and having no reinforcement at the top and also notransverse reinforcement. Only control slabs without FRP strips areconsidered in this work. The slabs were subjected to impact load-ings from a 300 kg mass at 4 m/s and 5 m/s (N-IS-4 and N-IS-5). Inboth cases, punching shear failure was observed, as shown inFig. 30.
e Test N-IS-4
The numerical prediction for this case is shown in Fig. 31. In thiscase, the maximum strain-rate was estimated using (42) to be0.025/s and thus the static values were retained for both the stiff-ness and failure criterion.
The prediction is that the slab fails due to punching shear andthis was confirmed by the test, as shown in Fig. 30(a).
e Test N-IS-5
Fig. 30. Slab cross-sections showing punching failure: (a) N-IS-4; (b) N-IS-5 (after[36]).
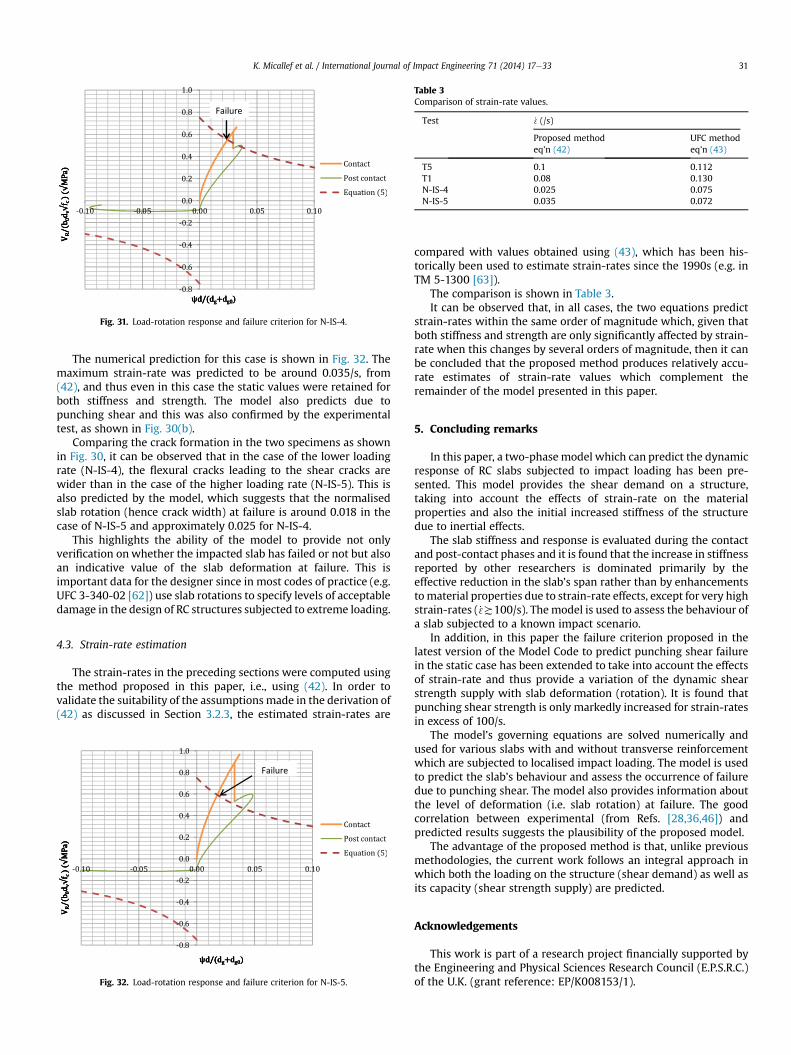
Fig. 31. Load-rotation response and failure criterion for N-IS-4.
Table 3Comparison of strain-rate values.
Test _3(/s)
Proposed methodeq’n (42)
UFC methodeq’n (43)
T5 0.1 0.112T1 0.08 0.130N-IS-4 0.025 0.075N-IS-5 0.035 0.072
K. Micallef et al. / International Journal of Impact Engineering 71 (2014) 17e33 31
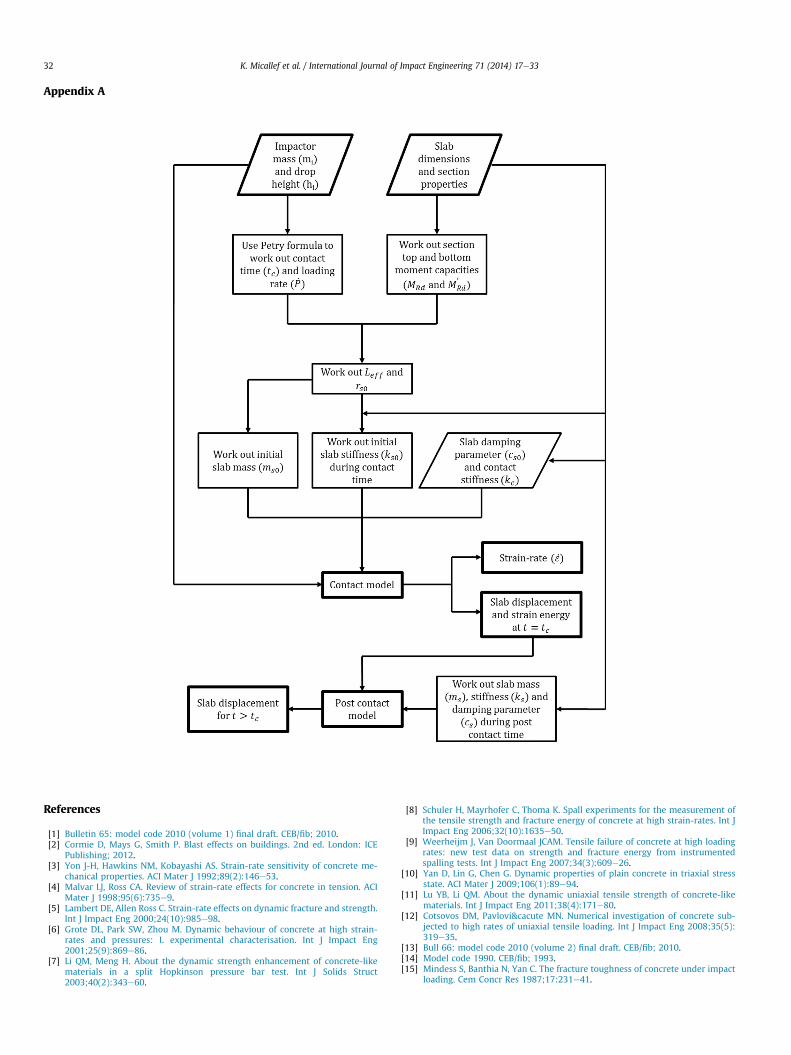
The numerical prediction for this case is shown in Fig. 32. Themaximum strain-rate was predicted to be around 0.035/s, from(42), and thus even in this case the static values were retained forboth stiffness and strength. The model also predicts due topunching shear and this was also confirmed by the experimentaltest, as shown in Fig. 30(b).
Comparing the crack formation in the two specimens as shownin Fig. 30, it can be observed that in the case of the lower loadingrate (N-IS-4), the flexural cracks leading to the shear cracks arewider than in the case of the higher loading rate (N-IS-5). This isalso predicted by the model, which suggests that the normalisedslab rotation (hence crack width) at failure is around 0.018 in thecase of N-IS-5 and approximately 0.025 for N-IS-4.
This highlights the ability of the model to provide not onlyverification on whether the impacted slab has failed or not but alsoan indicative value of the slab deformation at failure. This isimportant data for the designer since in most codes of practice (e.g.UFC 3-340-02 [62]) use slab rotations to specify levels of acceptabledamage in the design of RC structures subjected to extreme loading.
4.3. Strain-rate estimation
The strain-rates in the preceding sections were computed usingthe method proposed in this paper, i.e., using (42). In order tovalidate the suitability of the assumptions made in the derivation of(42) as discussed in Section 3.2.3, the estimated strain-rates are
Fig. 32. Load-rotation response and failure criterion for N-IS-5.
compared with values obtained using (43), which has been his-torically been used to estimate strain-rates since the 1990s (e.g. inTM 5-1300 [63]).
The comparison is shown in Table 3.It can be observed that, in all cases, the two equations predict
strain-rates within the same order of magnitude which, given thatboth stiffness and strength are only significantly affected by strain-rate when this changes by several orders of magnitude, then it canbe concluded that the proposed method produces relatively accu-rate estimates of strain-rate values which complement theremainder of the model presented in this paper.
5. Concluding remarks
In this paper, a two-phasemodel which can predict the dynamicresponse of RC slabs subjected to impact loading has been pre-sented. This model provides the shear demand on a structure,taking into account the effects of strain-rate on the materialproperties and also the initial increased stiffness of the structuredue to inertial effects.
The slab stiffness and response is evaluated during the contactand post-contact phases and it is found that the increase in stiffnessreported by other researchers is dominated primarily by theeffective reduction in the slab’s span rather than by enhancementstomaterial properties due to strain-rate effects, except for very highstrain-rates (_3a100/s). Themodel is used to assess the behaviour ofa slab subjected to a known impact scenario.
In addition, in this paper the failure criterion proposed in thelatest version of the Model Code to predict punching shear failurein the static case has been extended to take into account the effectsof strain-rate and thus provide a variation of the dynamic shearstrength supply with slab deformation (rotation). It is found thatpunching shear strength is only markedly increased for strain-ratesin excess of 100/s.
The model’s governing equations are solved numerically andused for various slabs with and without transverse reinforcementwhich are subjected to localised impact loading. The model is usedto predict the slab’s behaviour and assess the occurrence of failuredue to punching shear. The model also provides information aboutthe level of deformation (i.e. slab rotation) at failure. The goodcorrelation between experimental (from Refs. [28,36,46]) andpredicted results suggests the plausibility of the proposed model.
The advantage of the proposed method is that, unlike previousmethodologies, the current work follows an integral approach inwhich both the loading on the structure (shear demand) as well asits capacity (shear strength supply) are predicted.
Acknowledgements
This work is part of a research project financially supported bythe Engineering and Physical Sciences Research Council (E.P.S.R.C.)of the U.K. (grant reference: EP/K008153/1).
K. Micallef et al. / International Journal of Impact Engineering 71 (2014) 17e3332
Appendix A
References
[1] Bulletin 65: model code 2010 (volume 1) final draft. CEB/fib; 2010.[2] Cormie D, Mays G, Smith P. Blast effects on buildings. 2nd ed. London: ICE
Publishing; 2012.[3] Yon J-H, Hawkins NM, Kobayashi AS. Strain-rate sensitivity of concrete me-
chanical properties. ACI Mater J 1992;89(2):146e53.[4] Malvar LJ, Ross CA. Review of strain-rate effects for concrete in tension. ACI
Mater J 1998;95(6):735e9.[5] Lambert DE, Allen Ross C. Strain-rate effects on dynamic fracture and strength.
Int J Impact Eng 2000;24(10):985e98.[6] Grote DL, Park SW, Zhou M. Dynamic behaviour of concrete at high strain-
rates and pressures: I. experimental characterisation. Int J Impact Eng2001;25(9):869e86.
[7] Li QM, Meng H. About the dynamic strength enhancement of concrete-likematerials in a split Hopkinson pressure bar test. Int J Solids Struct2003;40(2):343e60.
[8] Schuler H, Mayrhofer C, Thoma K. Spall experiments for the measurement ofthe tensile strength and fracture energy of concrete at high strain-rates. Int JImpact Eng 2006;32(10):1635e50.
[9] Weerheijm J, Van Doormaal JCAM. Tensile failure of concrete at high loadingrates: new test data on strength and fracture energy from instrumentedspalling tests. Int J Impact Eng 2007;34(3):609e26.
[10] Yan D, Lin G, Chen G. Dynamic properties of plain concrete in triaxial stressstate. ACI Mater J 2009;106(1):89e94.
[11] Lu YB, Li QM. About the dynamic uniaxial tensile strength of concrete-likematerials. Int J Impact Eng 2011;38(4):171e80.
[12] Cotsovos DM, Pavlovi&cacute MN. Numerical investigation of concrete sub-jected to high rates of uniaxial tensile loading. Int J Impact Eng 2008;35(5):319e35.
[13] Bull 66: model code 2010 (volume 2) final draft. CEB/fib; 2010.[14] Model code 1990. CEB/fib; 1993.[15] Mindess S, Banthia N, Yan C. The fracture toughness of concrete under impact
loading. Cem Concr Res 1987;17:231e41.
K. Micallef et al. / International Journal of Impact Engineering 71 (2014) 17e33 33
[16] Brara A, Klepaczko JR. Fracture energy of concrete at high loading rates intension. Int J Impact Eng 2007;34(3):424e35.
[17] Zhang XX, et al. Fracture behaviour of high-strength concrete at a wide rangeof loading rates. Int J Impact Eng 2009;36(10e11):1204e9.
[18] Oh BH. Fracture behaviour of concrete under high-rates of loading. Eng FractMech 1990;35:327e32.
[19] Campbell JD. The dynamic yielding of mild steel. Acta Metall 1953;1(6):706e10.
[20] Mainstone RJ. Properties of materials at high rates of straining or loading.Mater Struct 1975;8(2):102e16.
[21] Johnson GR, Cook W. Fracture characteristics of three metals subjected tovarious strains, strain rates, temperatures and pressures. Eng Fract Mech1985;21(1):31e48.
[22] Cowper GR, Symonds PS. Strain-hardening and strain-rate effects in theimpact loading of cantilever beams. Brown University (Dept. of Appl. Math.);1957.
[23] Hughes G, Beeby AW. Investigation of the effect of impact loading on concretebeams. Struct Eng 1982;60B(3):45e52.
[24] Ross TJ, Krawinkler H. Impulsive direct shear failure in RC slabs. ASCE J StructEng 1985;111(8):1661e77.
[25] Miyamoto A, King MW, Fujii M. Analysis of failure modes for RC slabs underimpulsive loads. ACI Struct J 1991;88(5):538e45.
[26] Miyamoto A, King MW, Fujii M. Nonlinear dynamic analysis of RC slabs underimpulsive loads. ACI Struct J 1991;88(4):411e9.
[27] Saito H, et al. Loading capacities and failure modes of various reinforced-concrete slabs subjected to high speed loading. Nucl Eng Des 1995;156(1e2):277e86.
[28] Delhomme F, et al. Simulation of a block impacting a reinforced concrete slabwith a finite element model and a mass-spring system. Eng Struct2007;29(11):2844e52.
[29] Zineddin M, Krauthammer T. Dynamic response and behaviour of reinforcedconcrete slabs under impact loading. Int J Impact Eng 2007;34(9):1517e34.
[30] Cotsovos D, Stathopoulos N, Zeris C. Behaviour of RC beams subjected to highrates of concentrated loading. ASCE J Struct Eng 2008;134(12):1839e51.
[31] Chen Y, May IM. Reinforced concrete members under drop-weight impacts.Proc ICE e Struct Build 2009;162(1):45e56.
[32] Izatt C, et al. Perforation owing to impacts on RC slabs. Proc ICE e Struct Build2009;162(1):37e44.
[33] Saatci S, Vecchio FJ. Effects of shear mechanisms on impact behaviour ofreinforced concrete beams. ACI Struct J 2009;106(1):78e86.
[34] Abbas AA, Pullen AD, Cotsovos D. Structural response of RC wide beams underlow-rate and impact loading. Mag Concr Res 2010;62(10):723e40.
[35] Cotsovos DM. A simplified approach for assessing the load-carrying capacityof reinforced concrete beams under concentrated load applied at high rates.Int J Impact Eng 2010;37(8):907e17.
[36] Bhatti AQ, Kishi N, Tan KH. Impact resistant behaviour of RC slab strengthenedwith FRP strips. Mater Struct; 2011.
[37] O�zbolt J, Sharma A. Numerical simulation of reinforced concrete beams withdifferent shear reinforcements under dynamic impact loads. Int J Impact Eng2011;38(12):940e50.
[38] Jiang H, Wang X, He S. Numerical simulation of impact tests on reinforcedconcrete beams. Mater Des 2012;39(0):111e20.
[39] Mokhatar SN, Abdullah R. Computational analysis of reinforced concrete slabssubjected to impact loads. Int J Integr Eng 2012;4(2):70e6.
[40] Magnusson J, Hallgren M, Ansell A. Air-blast-loaded, high-strength concretebeams. Part I: experimental investigation. Mag Concr Res 2010;62(2):127e36.
[41] Magnusson J, Ansell A, Hansson H. Air-blast-loaded, high-strength concretebeams. Part II: numerical non-linearanalysis.MagConcrRes2010;62(4):235e42.
[42] Abdel-Rohman M, Sawan J. Impact effect on RC slabs e analytical approach.ASCE J Struct Eng 1985;111(7):1590e601.
[43] Sawan J, Abdel-Rohman M. Impact effect on RC slabs e experimentalapproach. ASCE J Struct Eng 1986;112(9):2057e65.
[44] CEB. Bulletin 187: concrete structures under impact and impulsive loading.CEB; 1988.
[45] Delhomme F. Étude du comportement sous impact d’une structure pareblocsen béton armé. Universite de Savoie; 2005.
[46] Barbier F, Roby M. Simplified unified model for concrete structures underimpact. In: Fib symposium 2013; 2013. Israel.
[47] ACI. ACI 318-08-building code requirements for structural concrete; 2008.Michigan (USA).
[48] BSI. BS 8110-1-structural use of concrete. Code of practice for design andconstruction; 1997. London (UK).
[49] CEN. EN 1992-1-1-design of concrete structures e part 1-1: general rules andrules for buildings; 2004. Brussels (Belgium).
[50] Muttoni A. SIA draft code proposal (SIA 162/AG5). Zürich, Switzerland: SwissFederal Institute of Technology; 1988.
[51] Muttoni A. Punching shear strength of reinforced concrete slabs withouttransverse reinforcement. ACI Struct J 2008;105(4):440e50.
[52] Muttoni A, Ruiz MF. Shear strength of members without transverse rein-forcement as function of critical shear crack width. ACI Struct J 2008;105(2):163e72.
[53] Ruiz MF, Muttoni A. Applications of critical shear crack theory to punching ofreinforced concrete slabs with transverse reinforcement. ACI Struct J2009;106(4):485e94.
[54] Sagaseta J, et al. Non-axis-symmetrical punching shear around internal col-umns of RC slabs without transverse reinforcement. Mag Concr Res2011;63(6):441e57.
[55] Hillerborg A, Modéer M, Petersson PE. Analysis of crack formation and crackgrowth in concrete by means of fracture mechanics and finite elements. CemConcr Res 1976;6(6):773e81.
[56] Hordijk DA. Local approach to fatigue of concrete. Delft: Delft University ofTechnology; 1991.
[57] Guidotti R. Poinçonnement des planchers-dalles avec colonnes superposéesfortement sollicitées. Lausanne: École Polytechnique Fédérale de Lausanne;2010.
[58] Walraven JC. Aggregate interlock: a theoretical and experimental analysis.Delft: Delft University of Technology; 1980.
[59] Lui LM. Shear strength of concrete joints under dynamic loads. Hong Kong:University of Hong Kong; 1977.
[60] Muttoni A, Ruiz MF. The levels-of-approximation approach in MC 2010:application to punching shear provisions. Struct Concr 2012;13(1):32e41.
[61] Ruiz MF, Muttoni A, Gambarova PG. Analytical modeling of the pre- andpostyield behaviour of bond in reinforced concrete. ASCE J Struct Eng2007;133(10):1364e72.
[62] UFC 3-340-02-structures to resist the effects of accidental explosions. USADepartment of Defense; 2008.
[63] TM 5-1300-structures to resist the effects of accidental explosions. Depart-ment of the Army; 1990.