Embed Size (px)
Citation preview
Title: A Study on Optimum Distribution of Story Shear Force Coefficient forSeismic Design of Multi-story Structure
Authors: Sang-Hoon Oh, Pusan National UniversityJongsoo Jeon, Pusan National University
Subject: Seismic
Keywords: SeismicShear
Publication Date: 2014
Original Publication: International Journal of High-Rise Buildings Volume 3 Number 2
Paper Type: 1. Book chapter/Part chapter2. Journal paper3. Conference proceeding4. Unpublished conference paper5. Magazine article6. Unpublished
© Council on Tall Buildings and Urban Habitat / Sang-Hoon Oh; Jongsoo Jeon
ctbuh.org/papers
International Journal of High-Rise Buildings
June 2014, Vol 3, No 2, 121-145International Journal of
High-Rise Buildingswww.ctbuh-korea.org/ijhrb/index.php
A Study on Optimum Distribution of Story Shear Force Coefficient
for Seismic Design of Multi-story Structure
Sang Hoon Oh and Jongsoo Jeon†
Department of Architectural Engineering, Pusan National University, Korea
Abstract
The story shear force distributions of most seismic design codes generally reflect the influences of higher vibration modesbased on the elastic deformations of structures. However, as the seismic design allows for the plastic behavior of a structure,the story shear force distribution shall be effective after it is yielded due to earthquake excitation. Hence this study conductednumerical analyses on the story shear force distributions of most seismic design codes to find out the characteristics of howa structure is damaged between stories. Analysis results show that the more forces are distributed onto high stories, the lowerits concentration is and the more energy is absorbed. From the results, this study proposes the optimum story shear forcedistribution and its calculation formula that make the damages uniformly distributed onto whole stories. Consequently, the storydamage distribution from the optimum calculation formula was considerably more stable than existing seismic design codes.
Keywords: Optimum distribution of story shear force coefficient, Accumulative plastic deformation ratio
1. Introduction
Typically, the story shear force acting horizontally on a
multi-story structure is proportionally calculated to the
height of and weight acting upon each story. However, if
dynamic load such as earthquake is acting on it, this rule
does not apply to the distributed load acting upon every
story under the influence of higher vibration modes. For
this reason, seismic design code of several countries
around the world analyze the characteristics of load dis-
tribution caused by higher vibration modes in various
ways and provide various forms of the modification fac-
tor of the story shear force distribution accordingly.
Most of the seismic design code around the world use
the analysis method based on Elastic Strain Range such
as Response Spectrum Analysis Method and Mode
Superposition Method in order to analyze the effects of
higher vibration modes. Since the plastic deformation is
allowed in seismic design in some degree up to the col-
lapse of building, the needs for securing the enough sta-
bility arise in consideration of elastic deformation as well
as the behaviors after the occurrence of plastic deforma-
tion in analyzing the seismic load.
By conducting the static and dynamic response analy-
ses based on the calculation formula for the story shear
force distribution, which is proposed by the seismic design
code of several countries, in this paper we weigh the
behaviors of a multi-story structure including plastic de-
formation, and analyze the characteristics of damage dis-
tribution caused by vibratory ground motion. Based on
these results, the point of this paper is to propose the op-
timized calculation formula for the story shear force dis-
tribution in order to improve the seismic performance by
distributing the seismic load evenly on all stories.
2. Comparisons of Story Shear Force Distri- bution of Seismic Design Code around the World
This study adopted the criteria for seismic design codes
shown in Table 2-1.
2.1. Calculation formula for the story shear force
distribution
The design procedure of the story shear force by the
equivalent static analysis method comprises two parts:
calculating the base shear, occurring on the lowest part of
a structure by seismic load and calculating the story shear
force by distributing the seismic load to all stories. The
†Corresponding author: Jongsoo JeonTel: +82-51-510-7608; Fax: +82-51-514-2230E-mail: [email protected]
Table 2-1. The seismic design code of several countriesused for this study
Seismicdesign code
Proposed CountryProposed
Year
KBC20093) Republic of Korea 2009
IBC20064) USA(Integrated) 2006
UBC975) USA(West) 1997
AIJ6)Japan (Architectural Institute
of Japan : AIJ)1981
NZS11707) New Zealand 2003
122 Sang Hoon Oh and Jongsoo Jeon | International Journal of High-Rise Buildings
story shear force distribution is determined during the
distribution process of seismic load, and the seismic
design code of several countries propose the story shear
force distribution considering the effects of higher vibra-
tion modes by applying the modification coefficient during
this process. The base shear calculation formula and the
seismic load distribution formula, used in this study and
proposed by the seismic design code, are as shown in
Table 2-2 and 2-3 respectively.
2.2. Comparing and weighing the story shear force
distribution
Examining the story shear force calculation formula of
the seismic design code around the world reveals that the
base shear calculation formula and the seismic load dis-
tribution formula are not in constant manner, which in
turn affect the size and distribution type of the story shear
force in various forms. For this reason, we specify struc-
ture models, as shown in Table 2-4, calculate the story
shear force based on each seismic design code, and com-
Table 2-2. Base shear calculation formula of the seismic design code
Category Base shear calculation formula
KBC2009 V=0.01 or more
IBC2006 (T>TL) (T≤TL) V=0.01 or more
UBC97 , ,
NZS1170
AIJ
Table 2-3. Lateral story forces of the seismic design code
Category Lateral story forces distribution formula Reflection methods of higher vibration modes
KBC2009
Applying the distribution factor according tothe period of structure
IBC2006
UBC97 Applying the horizontal force acting on roof story
NZS1170 Applying the horizontal load acting on roof story
AIJ , story shear force distribution factor according tovertical valid weight ratio
Table 2-4. Structural conditions for calculating the story shear force distributions
Category Structural design requirements
Use General Office Building
Structure Classification Steel ordinary moment frames
Shape Plane (width × height) = 8m × 8m / story height = 3m
Weight (Sum of general dead load and live load : )
Area & Ground characteristics Using the most dominant region and modulus subgrade reaction in each standard
Stories(Aspect Ratio) 3-story (1.125), 5-story (1.875), 10-story (3.75), 20-story (7.5)
min V{SD1
R
EI-----⎝ ⎠⎛ ⎞T------------- W,⋅= V
SDS
R
EI-----⎝ ⎠⎛ ⎞--------- W⋅
⎭⎪⎬⎪⎫
=
min V{SD1
R
EI-----⎝ ⎠⎛ ⎞T------------- W,⋅= V
SD1TL
R
EI-----⎝ ⎠⎛ ⎞T2
--------------- W⋅
⎭⎪⎬⎪⎫
= min V{SD1
R
EI-----⎝ ⎠⎛ ⎞T------------- W,⋅= V
SDS
R
EI-----⎝ ⎠⎛ ⎞--------- W⋅
⎭⎪⎬⎪⎫
=
VCvI
RT--------W= Vmax
2.5Cal
R----------------W= Vmin 0.11CalW=
V Ch T1u,( )SpRZLuWt=
Qi ZRtAiCoΣWi=
Fx
Wx hxk
Σi=1
nWi hi
k-------------------- V⋅=
Fx
Wx hxk
Σi=1
nWi hi
k-------------------- V⋅=
Fx
V Ft–( )Wx hx
Σi=1
nWihi
----------------------------=
Fx Ft 0.92VWx hx
Σi=1
nWi hi
-------------------+=
Ai 11
α i
-------- α i–⎝ ⎠⎛ ⎞+
2T
1 3T+-------------×= α i Σ
Wi
WT
-------=⎝ ⎠⎛ ⎞
A Study on Optimum Distribution of Story Shear Force Coefficient for Seismic Design of Multi-story Structure 123
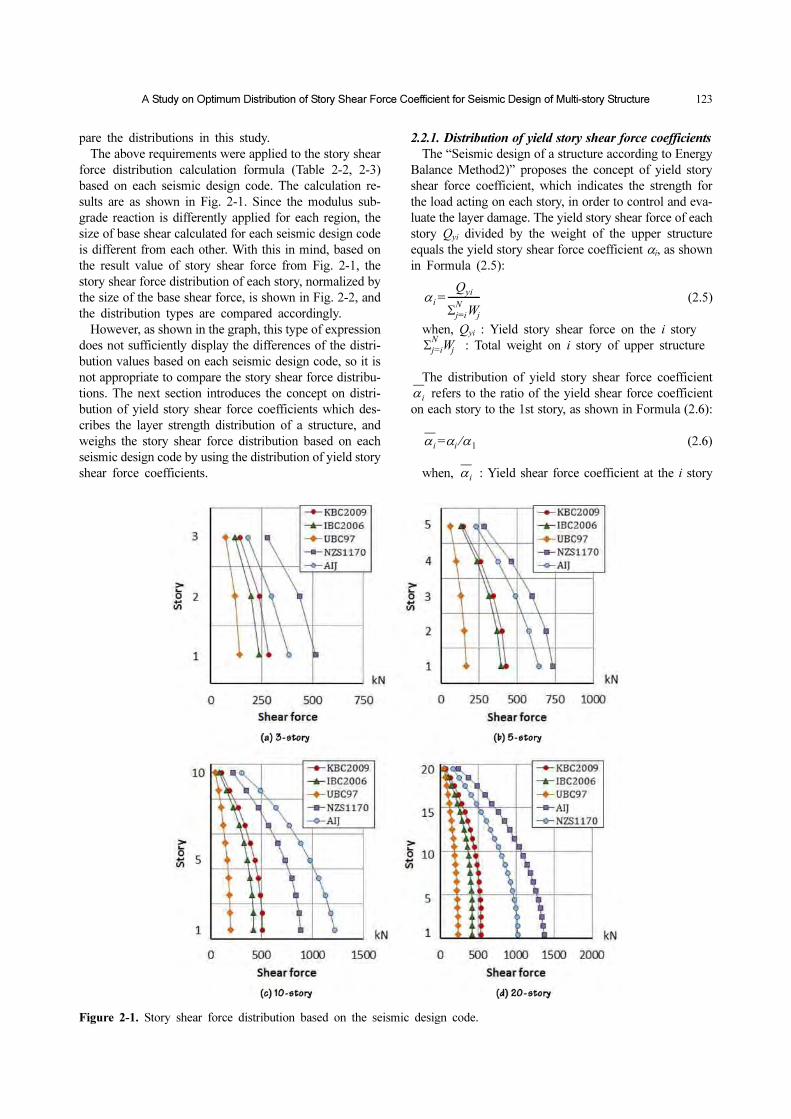
pare the distributions in this study.
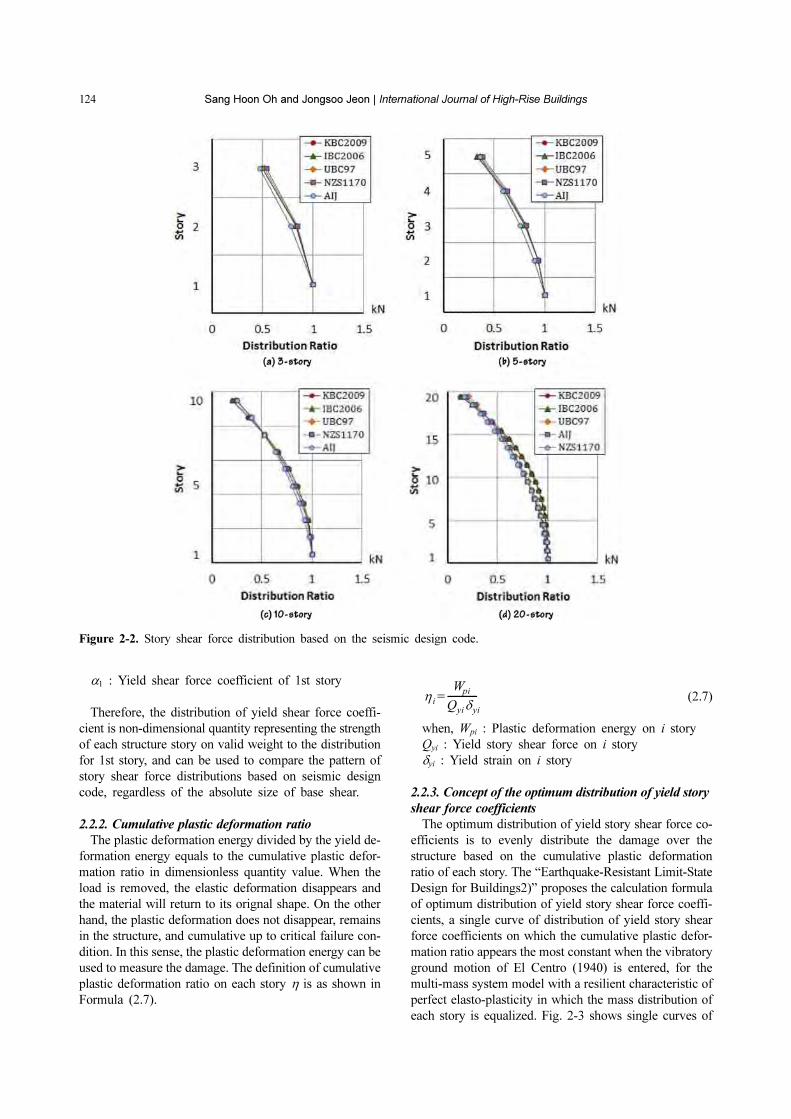
The above requirements were applied to the story shear
force distribution calculation formula (Table 2-2, 2-3)
based on each seismic design code. The calculation re-
sults are as shown in Fig. 2-1. Since the modulus sub-
grade reaction is differently applied for each region, the
size of base shear calculated for each seismic design code
is different from each other. With this in mind, based on
the result value of story shear force from Fig. 2-1, the
story shear force distribution of each story, normalized by
the size of the base shear force, is shown in Fig. 2-2, and
the distribution types are compared accordingly.
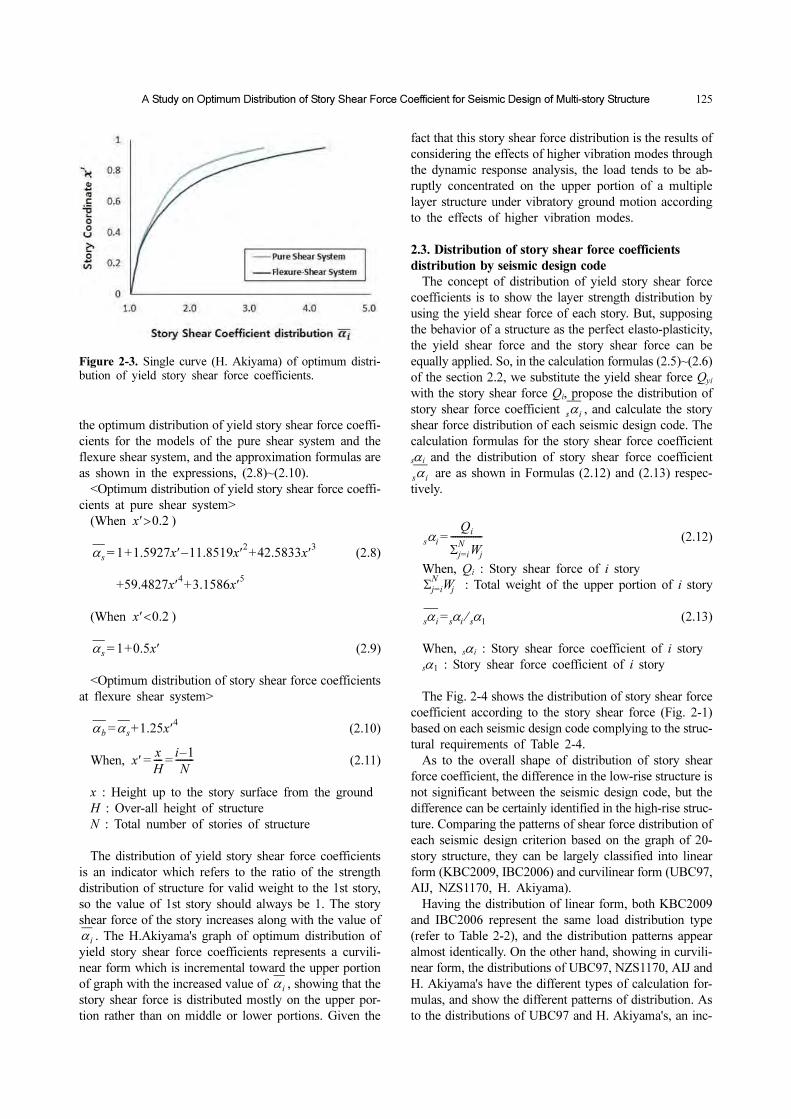
However, as shown in the graph, this type of expression
does not sufficiently display the differences of the distri-
bution values based on each seismic design code, so it is
not appropriate to compare the story shear force distribu-
tions. The next section introduces the concept on distri-
bution of yield story shear force coefficients which des-
cribes the layer strength distribution of a structure, and
weighs the story shear force distribution based on each
seismic design code by using the distribution of yield story
shear force coefficients.
2.2.1. Distribution of yield story shear force coefficients
The “Seismic design of a structure according to Energy
Balance Method2)” proposes the concept of yield story
shear force coefficient, which indicates the strength for
the load acting on each story, in order to control and eva-
luate the layer damage. The yield story shear force of each
story Qyi divided by the weight of the upper structure
equals the yield story shear force coefficient αi, as shown
in Formula (2.5):
(2.5)
when, Qyi : Yield story shear force on the i story
: Total weight on i story of upper structure
The distribution of yield story shear force coefficient
refers to the ratio of the yield shear force coefficient
on each story to the 1st story, as shown in Formula (2.6):
(2.6)
when, : Yield shear force coefficient at the i story
α i
Qyi
Σj=i
NWj
--------------=
Σj=i
NWj
α i
α i αi α1⁄=
α i
Figure 2-1. Story shear force distribution based on the seismic design code.
124 Sang Hoon Oh and Jongsoo Jeon | International Journal of High-Rise Buildings
α1 : Yield shear force coefficient of 1st story
Therefore, the distribution of yield shear force coeffi-
cient is non-dimensional quantity representing the strength
of each structure story on valid weight to the distribution
for 1st story, and can be used to compare the pattern of
story shear force distributions based on seismic design
code, regardless of the absolute size of base shear.
2.2.2. Cumulative plastic deformation ratio
The plastic deformation energy divided by the yield de-
formation energy equals to the cumulative plastic defor-
mation ratio in dimensionless quantity value. When the
load is removed, the elastic deformation disappears and
the material will return to its orignal shape. On the other
hand, the plastic deformation does not disappear, remains
in the structure, and cumulative up to critical failure con-
dition. In this sense, the plastic deformation energy can be
used to measure the damage. The definition of cumulative
plastic deformation ratio on each story η is as shown in
Formula (2.7).
(2.7)
when, Wpi : Plastic deformation energy on i story
Qyi : Yield story shear force on i story
δyi : Yield strain on i story
2.2.3. Concept of the optimum distribution of yield story
shear force coefficients
The optimum distribution of yield story shear force co-
efficients is to evenly distribute the damage over the
structure based on the cumulative plastic deformation
ratio of each story. The “Earthquake-Resistant Limit-State
Design for Buildings2)” proposes the calculation formula
of optimum distribution of yield story shear force coeffi-
cients, a single curve of distribution of yield story shear
force coefficients on which the cumulative plastic defor-
mation ratio appears the most constant when the vibratory
ground motion of El Centro (1940) is entered, for the
multi-mass system model with a resilient characteristic of
perfect elasto-plasticity in which the mass distribution of
each story is equalized. Fig. 2-3 shows single curves of
η i
Wpi
Qyiδyi
-------------=
Figure 2-2. Story shear force distribution based on the seismic design code.
A Study on Optimum Distribution of Story Shear Force Coefficient for Seismic Design of Multi-story Structure 125
the optimum distribution of yield story shear force coeffi-
cients for the models of the pure shear system and the
flexure shear system, and the approximation formulas are
as shown in the expressions, (2.8)~(2.10).
<Optimum distribution of yield story shear force coeffi-
cients at pure shear system>
(When )
(2.8)
(When )
(2.9)
<Optimum distribution of story shear force coefficients
at flexure shear system>
(2.10)
When, (2.11)
x : Height up to the story surface from the ground
H : Over-all height of structure
N : Total number of stories of structure
The distribution of yield story shear force coefficients
is an indicator which refers to the ratio of the strength
distribution of structure for valid weight to the 1st story,
so the value of 1st story should always be 1. The story
shear force of the story increases along with the value of
. The H.Akiyama's graph of optimum distribution of
yield story shear force coefficients represents a curvili-
near form which is incremental toward the upper portion
of graph with the increased value of , showing that the
story shear force is distributed mostly on the upper por-
tion rather than on middle or lower portions. Given the
fact that this story shear force distribution is the results of
considering the effects of higher vibration modes through
the dynamic response analysis, the load tends to be ab-
ruptly concentrated on the upper portion of a multiple
layer structure under vibratory ground motion according
to the effects of higher vibration modes.
2.3. Distribution of story shear force coefficients
distribution by seismic design code
The concept of distribution of yield story shear force
coefficients is to show the layer strength distribution by
using the yield shear force of each story. But, supposing
the behavior of a structure as the perfect elasto-plasticity,
the yield shear force and the story shear force can be
equally applied. So, in the calculation formulas (2.5)~(2.6)
of the section 2.2, we substitute the yield shear force Qyi
with the story shear force Qi, propose the distribution of
story shear force coefficient , and calculate the story
shear force distribution of each seismic design code. The
calculation formulas for the story shear force coefficient
sα i and the distribution of story shear force coefficient
are as shown in Formulas (2.12) and (2.13) respec-
tively.
(2.12)
When, Qi : Story shear force of i story
: Total weight of the upper portion of i story
(2.13)
When, sα i : Story shear force coefficient of i story
sα1 : Story shear force coefficient of i story
The Fig. 2-4 shows the distribution of story shear force
coefficient according to the story shear force (Fig. 2-1)
based on each seismic design code complying to the struc-
tural requirements of Table 2-4.
As to the overall shape of distribution of story shear
force coefficient, the difference in the low-rise structure is
not significant between the seismic design code, but the
difference can be certainly identified in the high-rise struc-
ture. Comparing the patterns of shear force distribution of
each seismic design criterion based on the graph of 20-
story structure, they can be largely classified into linear
form (KBC2009, IBC2006) and curvilinear form (UBC97,
AIJ, NZS1170, H. Akiyama).
Having the distribution of linear form, both KBC2009
and IBC2006 represent the same load distribution type
(refer to Table 2-2), and the distribution patterns appear
almost identically. On the other hand, showing in curvili-
near form, the distributions of UBC97, NZS1170, AIJ and
H. Akiyama's have the different types of calculation for-
mulas, and show the different patterns of distribution. As
to the distributions of UBC97 and H. Akiyama's, an inc-
x′ 0.2>
αs 1 1.5927x′ 11.8519x′2– 42.5833x′3+ +=
+59.4827x′4 3.1586x′5+
x′ 0.2<
αs 1 0.5x′+=
αb α s 1.25x′4+=
x′x
H----
i 1–
N--------= =
α i
α i
αs i
αs i
αs i
Qi
Σj=i
NWj
--------------=
Σj=i
NWj
αs i αs i αs 1⁄=
Figure 2-3. Single curve (H. Akiyama) of optimum distri-bution of yield story shear force coefficients.
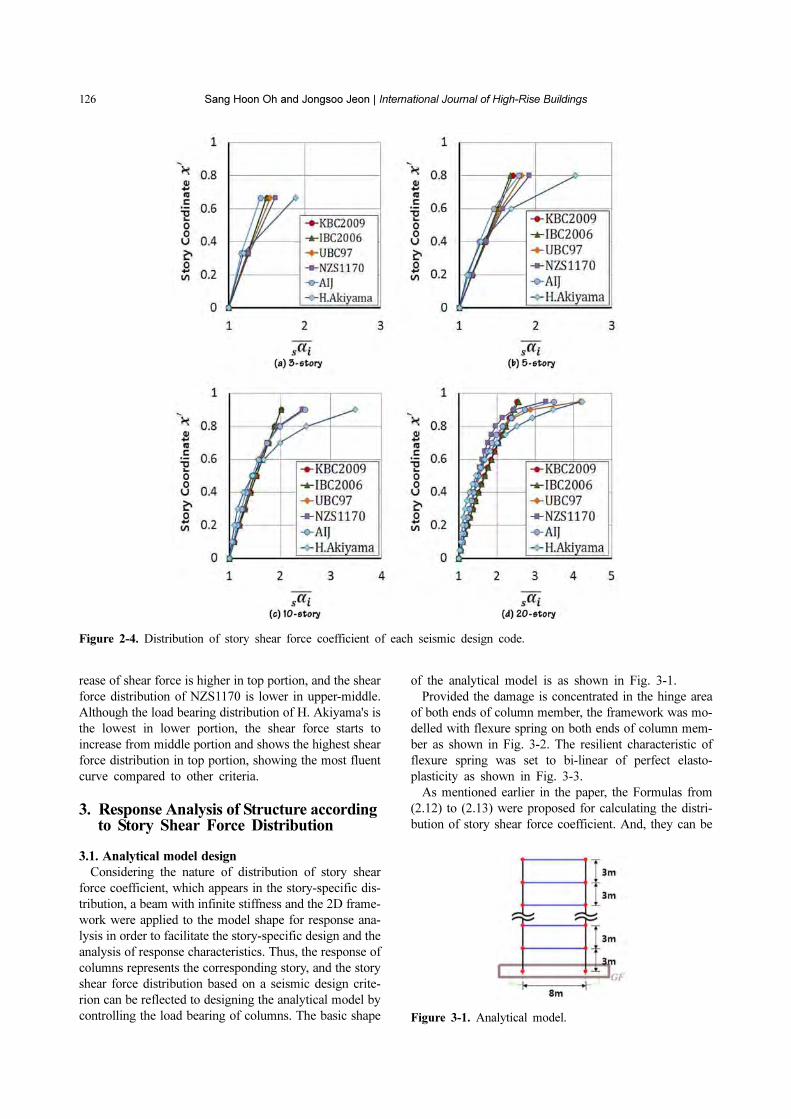
126 Sang Hoon Oh and Jongsoo Jeon | International Journal of High-Rise Buildings
rease of shear force is higher in top portion, and the shear
force distribution of NZS1170 is lower in upper-middle.
Although the load bearing distribution of H. Akiyama's is
the lowest in lower portion, the shear force starts to
increase from middle portion and shows the highest shear
force distribution in top portion, showing the most fluent
curve compared to other criteria.
3. Response Analysis of Structure according to Story Shear Force Distribution
3.1. Analytical model design
Considering the nature of distribution of story shear
force coefficient, which appears in the story-specific dis-
tribution, a beam with infinite stiffness and the 2D frame-
work were applied to the model shape for response ana-
lysis in order to facilitate the story-specific design and the
analysis of response characteristics. Thus, the response of
columns represents the corresponding story, and the story
shear force distribution based on a seismic design crite-
rion can be reflected to designing the analytical model by
controlling the load bearing of columns. The basic shape
of the analytical model is as shown in Fig. 3-1.
Provided the damage is concentrated in the hinge area
of both ends of column member, the framework was mo-
delled with flexure spring on both ends of column mem-
ber as shown in Fig. 3-2. The resilient characteristic of
flexure spring was set to bi-linear of perfect elasto-
plasticity as shown in Fig. 3-3.
As mentioned earlier in the paper, the Formulas from
(2.12) to (2.13) were proposed for calculating the distri-
bution of story shear force coefficient. And, they can be
Figure 2-4. Distribution of story shear force coefficient of each seismic design code.
Figure 3-1. Analytical model.
A Study on Optimum Distribution of Story Shear Force Coefficient for Seismic Design of Multi-story Structure 127
summarized for the story shear force Qi as shown in For-
mula (3.1).
(3.1)
When, zα1 : Story shear force coefficient on 1st story
according to the local conditions
: Distribution of story shear force coefficient on i
story
: Total weight of upper structure on i story
The factor zα1 defines the size of the base shear of a
structure. Since the ground conditions and the scale of the
expected earthquake are different depending on the regi-
on, the value of zα1 should be applied accordingly. This
Qi αz 1αs iΣj=i
NWj=
αs i
Σj=i
NWj
Figure 3-2. Modeling of column member. Figure 3-3. Resilient characteristic of perfect elasto-plasticity.
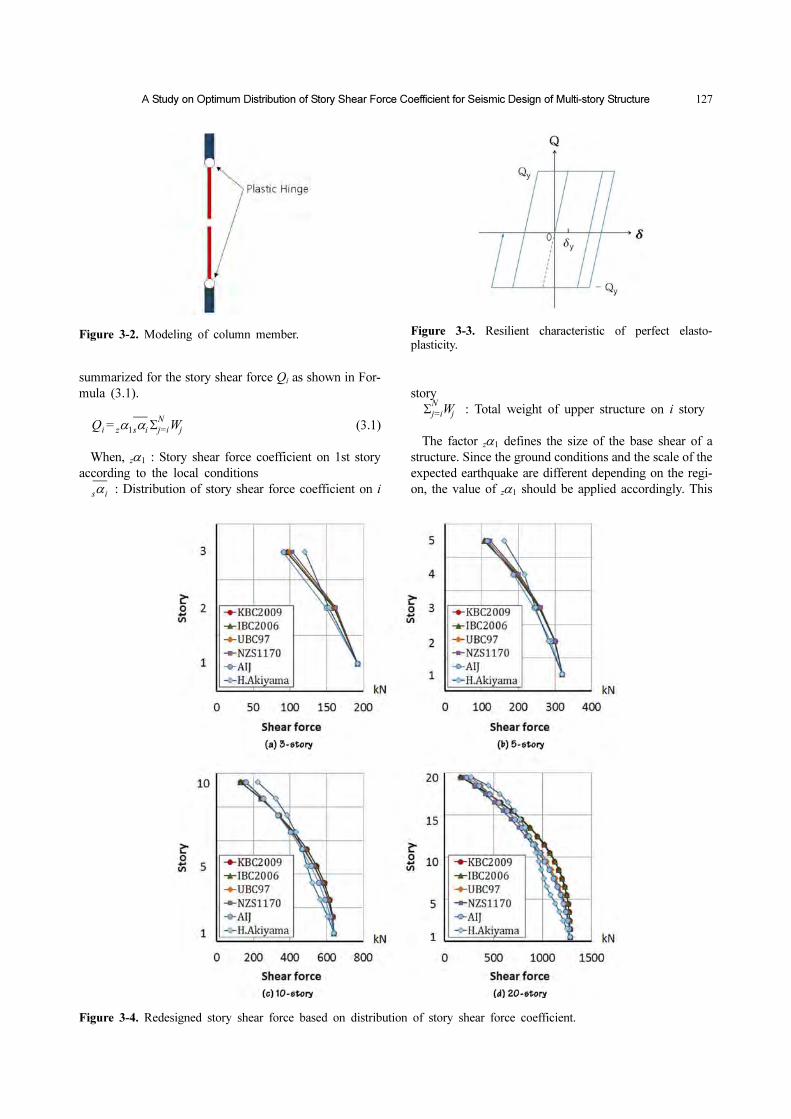
Figure 3-4. Redesigned story shear force based on distribution of story shear force coefficient.
128 Sang Hoon Oh and Jongsoo Jeon | International Journal of High-Rise Buildings
study is based on the domestic regional conditions, and
the number 0.1 was applied to all analytical models con-
sidering that the zα1 values of buildings (three-story to
twenty-story) vary between 0.07 and 0.14.
After applying the distribution of story shear force
coefficient based on each seismic design criterion to the
proposed formula, as shown in Formula (3.1), the result
of remodeling the story shear force distribution of each
analytical model is as shown in Fig. 3-4.
As to the distribution of the story shear force of each
analytical model, the story shear force of the models KBC
2009 and IBC2006 with low load bearding increase ap-
pears high in middle as well as lower portions and low in
upper portion compared to other criteria. The shear force
distributions of the models UBC97, NZS1170, AIJ and H.
Akiyama drastically increase in upper portion, and tend to
be concentrated in top portion. The H. Akiyama's model
has a noticeable difference in which the story shear force
is low in lower portion and high in upper portion appear-
ing in tertiary curve.
The size of the framework member was designed by
using the story shear force of the each analytical model
calculated based on the distribution of story shear force
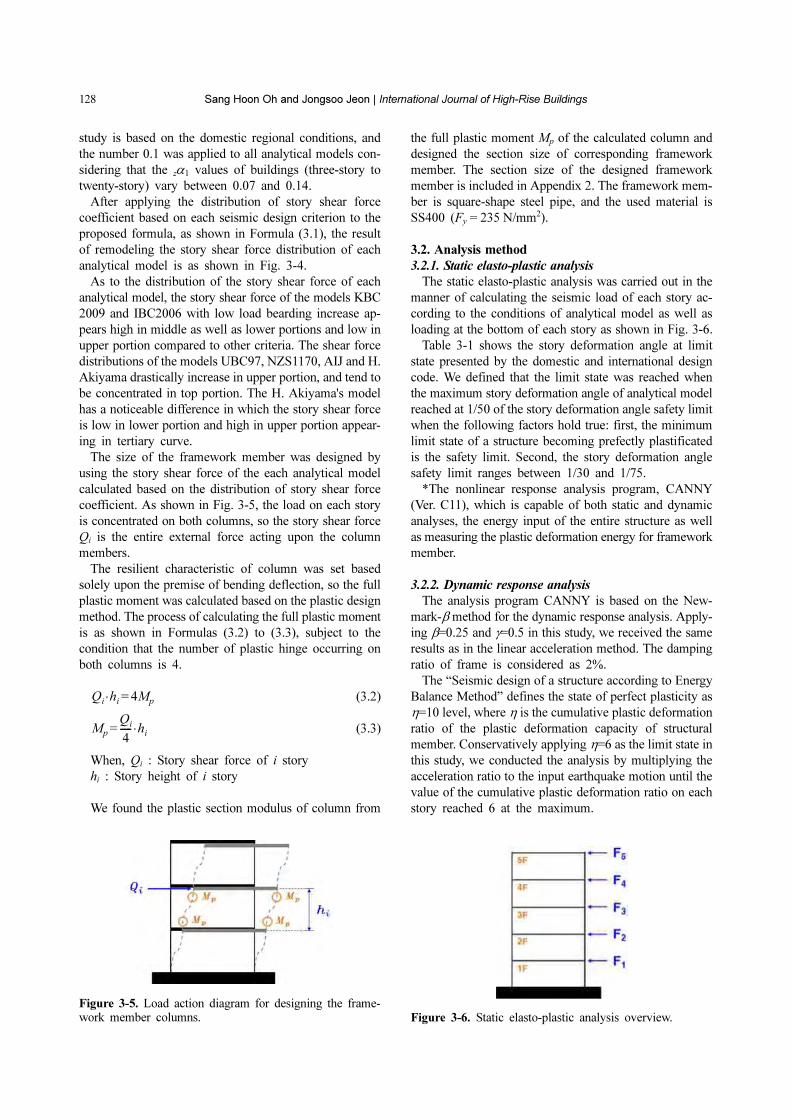
coefficient. As shown in Fig. 3-5, the load on each story
is concentrated on both columns, so the story shear force
Qi is the entire external force acting upon the column
members.
The resilient characteristic of column was set based
solely upon the premise of bending deflection, so the full
plastic moment was calculated based on the plastic design
method. The process of calculating the full plastic moment
is as shown in Formulas (3.2) to (3.3), subject to the
condition that the number of plastic hinge occurring on
both columns is 4.
(3.2)
(3.3)
When, Qi : Story shear force of i story
hi : Story height of i story
We found the plastic section modulus of column from
the full plastic moment Mp of the calculated column and
designed the section size of corresponding framework
member. The section size of the designed framework
member is included in Appendix 2. The framework mem-
ber is square-shape steel pipe, and the used material is
SS400 (Fy = 235 N/mm2).
3.2. Analysis method
3.2.1. Static elasto-plastic analysis
The static elasto-plastic analysis was carried out in the
manner of calculating the seismic load of each story ac-
cording to the conditions of analytical model as well as
loading at the bottom of each story as shown in Fig. 3-6.
Table 3-1 shows the story deformation angle at limit
state presented by the domestic and international design
code. We defined that the limit state was reached when
the maximum story deformation angle of analytical model
reached at 1/50 of the story deformation angle safety limit
when the following factors hold true: first, the minimum
limit state of a structure becoming prefectly plastificated
is the safety limit. Second, the story deformation angle
safety limit ranges between 1/30 and 1/75.
*The nonlinear response analysis program, CANNY
(Ver. C11), which is capable of both static and dynamic
analyses, the energy input of the entire structure as well
as measuring the plastic deformation energy for framework
member.
3.2.2. Dynamic response analysis
The analysis program CANNY is based on the New-
mark-β method for the dynamic response analysis. Apply-
ing β=0.25 and γ=0.5 in this study, we received the same
results as in the linear acceleration method. The damping
ratio of frame is considered as 2%.
The “Seismic design of a structure according to Energy
Balance Method” defines the state of perfect plasticity as
η=10 level, where η is the cumulative plastic deformation
ratio of the plastic deformation capacity of structural
member. Conservatively applying η=6 as the limit state in
this study, we conducted the analysis by multiplying the
acceleration ratio to the input earthquake motion until the
value of the cumulative plastic deformation ratio on each
story reached 6 at the maximum.
Qi hi⋅ 4Mp=
Mp
Qi
4----- hi⋅=
Figure 3-5. Load action diagram for designing the frame-work member columns. Figure 3-6. Static elasto-plastic analysis overview.
A Study on Optimum Distribution of Story Shear Force Coefficient for Seismic Design of Multi-story Structure 129
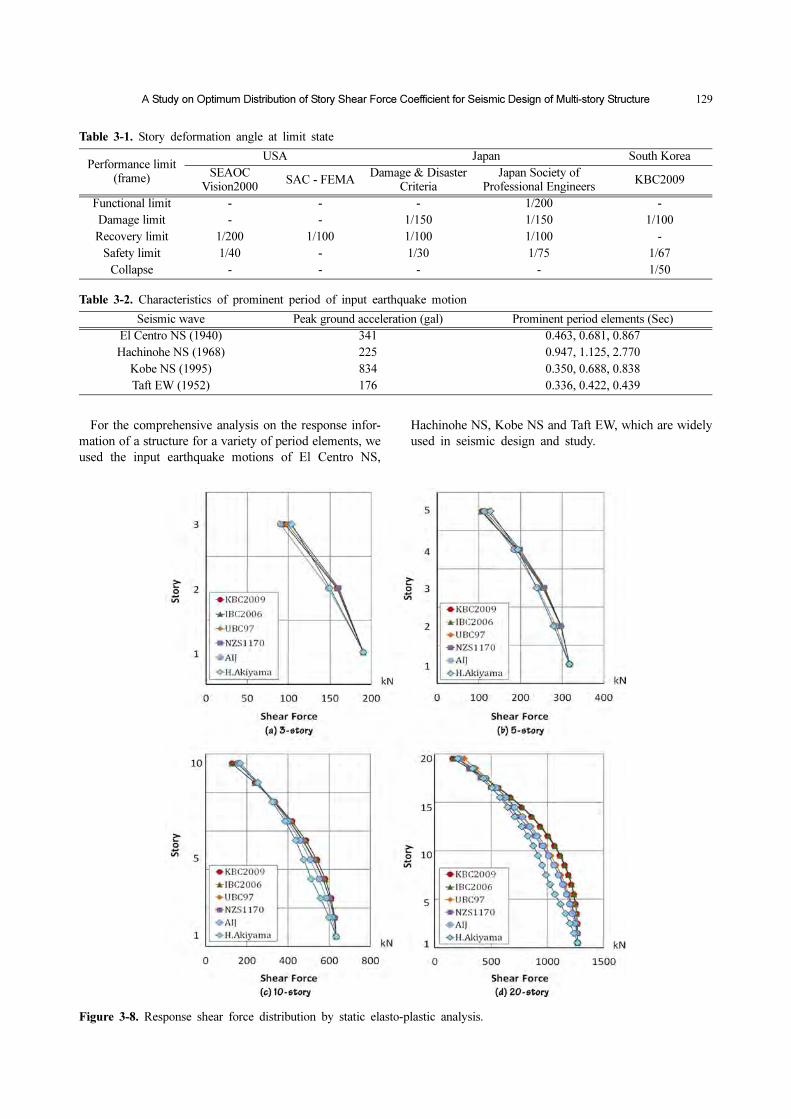
For the comprehensive analysis on the response infor-
mation of a structure for a variety of period elements, we
used the input earthquake motions of El Centro NS,
Hachinohe NS, Kobe NS and Taft EW, which are widely
used in seismic design and study.
Table 3-1. Story deformation angle at limit state
Performance limit(frame)
USA Japan South Korea
SEAOCVision2000
SAC - FEMADamage & Disaster
CriteriaJapan Society of
Professional EngineersKBC2009
Functional limit - - - 1/200 -
Damage limit - - 1/150 1/150 1/100
Recovery limit 1/200 1/100 1/100 1/100 -
Safety limit 1/40 - 1/30 1/75 1/67
Collapse - - - - 1/50
Table 3-2. Characteristics of prominent period of input earthquake motion
Seismic wave Peak ground acceleration (gal) Prominent period elements (Sec)
El Centro NS (1940) 341 0.463, 0.681, 0.867
Hachinohe NS (1968) 225 0.947, 1.125, 2.770
Kobe NS (1995) 834 0.350, 0.688, 0.838
Taft EW (1952) 176 0.336, 0.422, 0.439
Figure 3-8. Response shear force distribution by static elasto-plastic analysis.
130 Sang Hoon Oh and Jongsoo Jeon | International Journal of High-Rise Buildings
3.3. Analysis result
3.3.1. Static elasto-plastic analysis
The response shear force graph of each seismic design
code based on the static elasto-plastic analysis is as shown
in Fig. 3-8. The response shear forces are not that differ-
ent depending on the seismic design code, but they are
somewhat different in high-rise models. Based on the 20-
story analytical model, the response shear forces of KBC
2009 and IBC2006 appear high in middle portion, and
those of UBC97, NZS1170, AIJ and H. Akiyama appear
low in middle portion with high in upper portion. As to
the response shear force in top portion, UBC97 was the
most prominent. The H.Akiyama's distribution was a little
lower than those of other criteria, but its response shear
force in upper portion was at a level comparable with
others.
The distribution trend of response shear force by static
elasto-plastic analysis appeared almost similar to the ana-
lysis results of story shear force graph (refer to Fig. 3-4).
This was because the effects of higher vibration modes
were not properly reflected according to the seismic load
due to the stress redistribution occurring under the static
load. Thus, the response characteristics analysis by static
elasto-plastic analysis was just to confirm the load-carrying
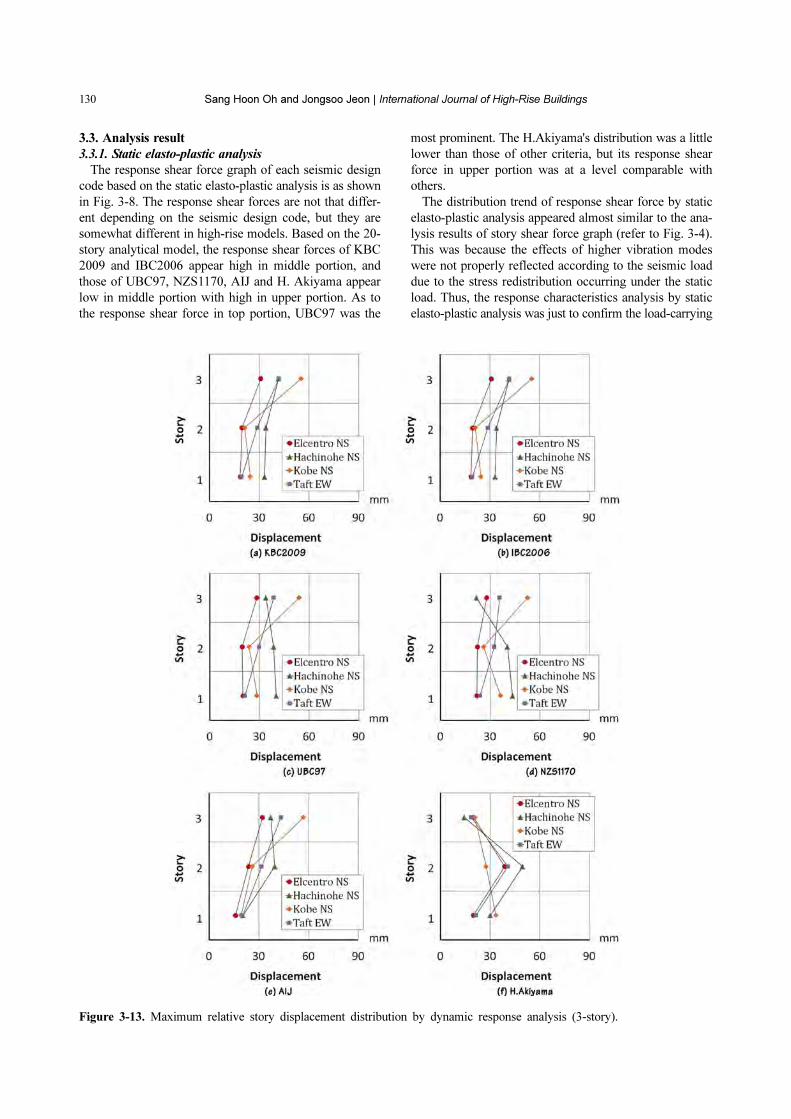
Figure 3-13. Maximum relative story displacement distribution by dynamic response analysis (3-story).
A Study on Optimum Distribution of Story Shear Force Coefficient for Seismic Design of Multi-story Structure 131
capacity of each story and thought to have low reliability
as an indicator in verifying the seismic performance of a
structure.
3.3.2. Dynamic response analysis
The maximum relative story displacement of a story-
specific analytical model by dynamic response analysis is
as shown in Figs. 3-13 to 3-14. In case of 3-story model,
the models KBC2009 and IBC2006 show the relatively
uniform distribution of relative story displacement, and
the H. Akiyama model, which distributed the shear force
the most in upper portion, shows its displacement tended
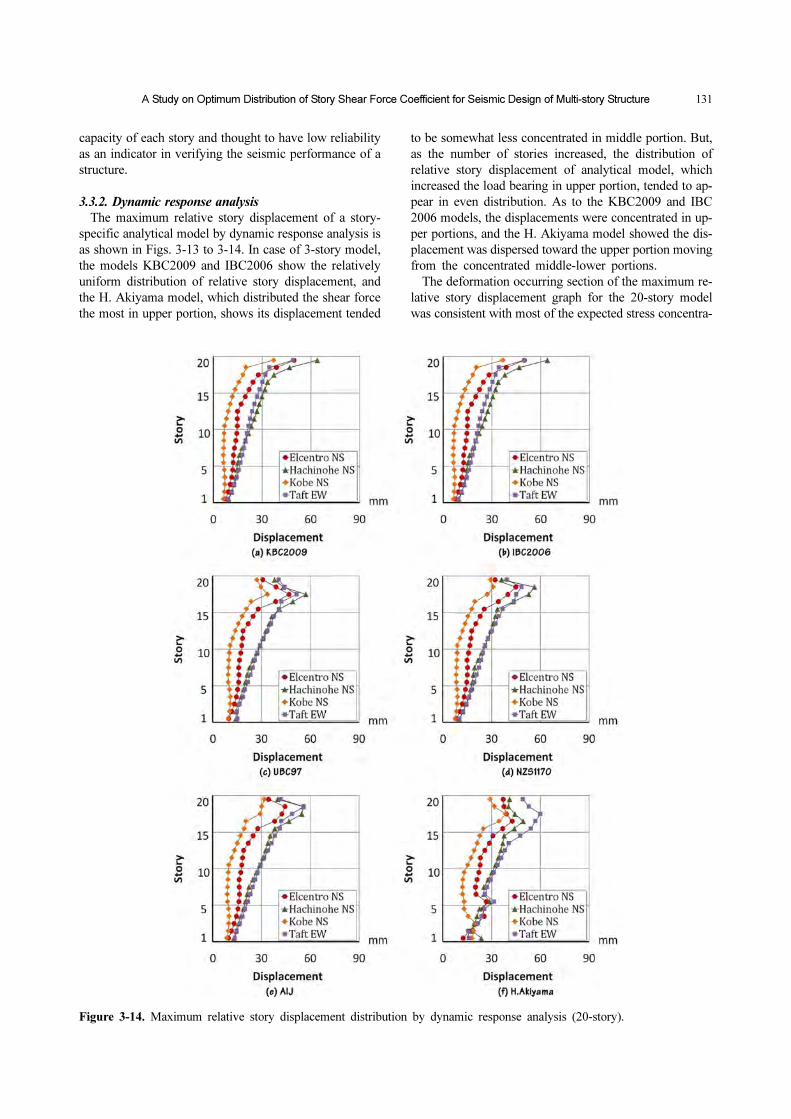
to be somewhat less concentrated in middle portion. But,
as the number of stories increased, the distribution of
relative story displacement of analytical model, which
increased the load bearing in upper portion, tended to ap-
pear in even distribution. As to the KBC2009 and IBC
2006 models, the displacements were concentrated in up-
per portions, and the H. Akiyama model showed the dis-
placement was dispersed toward the upper portion moving
from the concentrated middle-lower portions.
The deformation occurring section of the maximum re-
lative story displacement graph for the 20-story model
was consistent with most of the expected stress concentra-
Figure 3-14. Maximum relative story displacement distribution by dynamic response analysis (20-story).
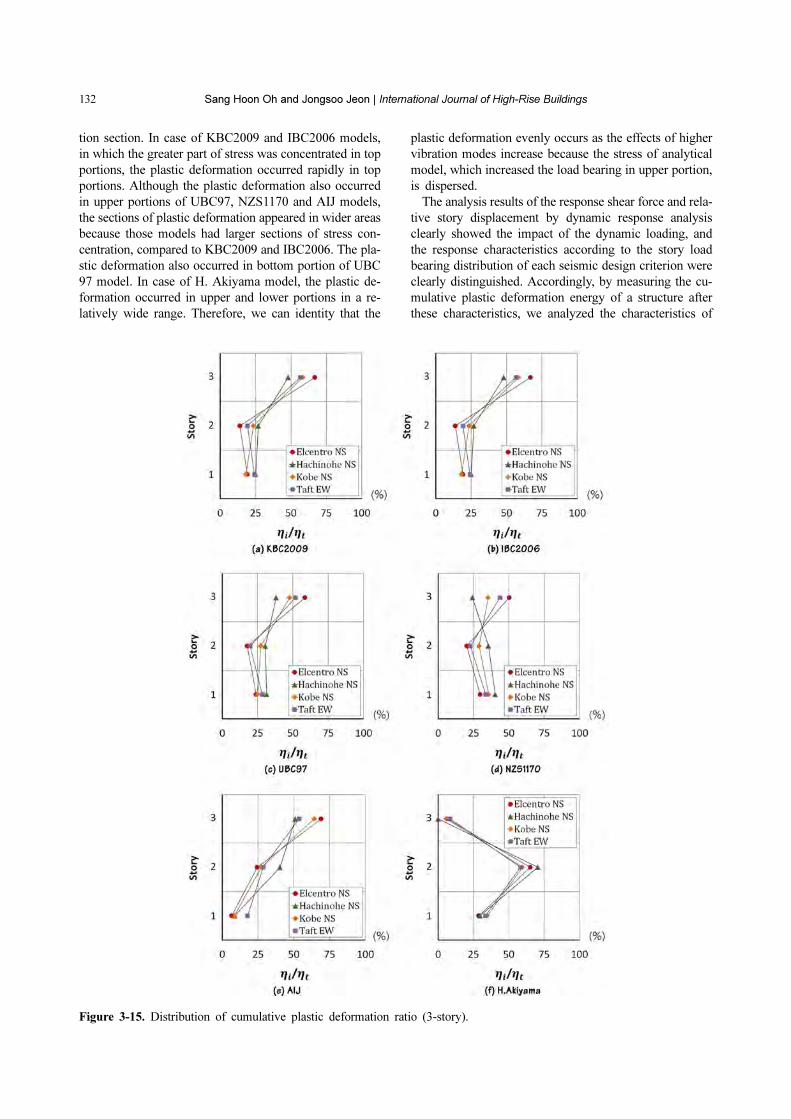
132 Sang Hoon Oh and Jongsoo Jeon | International Journal of High-Rise Buildings
tion section. In case of KBC2009 and IBC2006 models,
in which the greater part of stress was concentrated in top
portions, the plastic deformation occurred rapidly in top
portions. Although the plastic deformation also occurred
in upper portions of UBC97, NZS1170 and AIJ models,
the sections of plastic deformation appeared in wider areas
because those models had larger sections of stress con-
centration, compared to KBC2009 and IBC2006. The pla-
stic deformation also occurred in bottom portion of UBC
97 model. In case of H. Akiyama model, the plastic de-
formation occurred in upper and lower portions in a re-
latively wide range. Therefore, we can identity that the
plastic deformation evenly occurs as the effects of higher
vibration modes increase because the stress of analytical
model, which increased the load bearing in upper portion,
is dispersed.
The analysis results of the response shear force and rela-
tive story displacement by dynamic response analysis
clearly showed the impact of the dynamic loading, and
the response characteristics according to the story load
bearing distribution of each seismic design criterion were
clearly distinguished. Accordingly, by measuring the cu-
mulative plastic deformation energy of a structure after
these characteristics, we analyzed the characteristics of
Figure 3-15. Distribution of cumulative plastic deformation ratio (3-story).
A Study on Optimum Distribution of Story Shear Force Coefficient for Seismic Design of Multi-story Structure 133
layer damage distribution based on each seismic design
criterion. As for the damage assessment criterion, the cu-
mulative plastic deformation ratio (refer to Formula 2.7)
by plastic deformation energy at limit state was used, and
the story distribution values for the cumulative plastic
deformation ratio of the entire structure are as shown in
Figs. 3-15 to 3-18.
The overall layer damage distribution showed similari-
ties to the graph of maximum relative story displacement,
but showed the damage concentration due to the cumula-
tive plastic deformation. In case of 3-story model, some
damage was concentrated on upper portions of KBC2009
and IBC2006 models, while AIJ model showed the dis-
tribution on 1st story the least, and most damage was con-
centrated on 2nd story of H.Akiyama model unlike other
criteria.
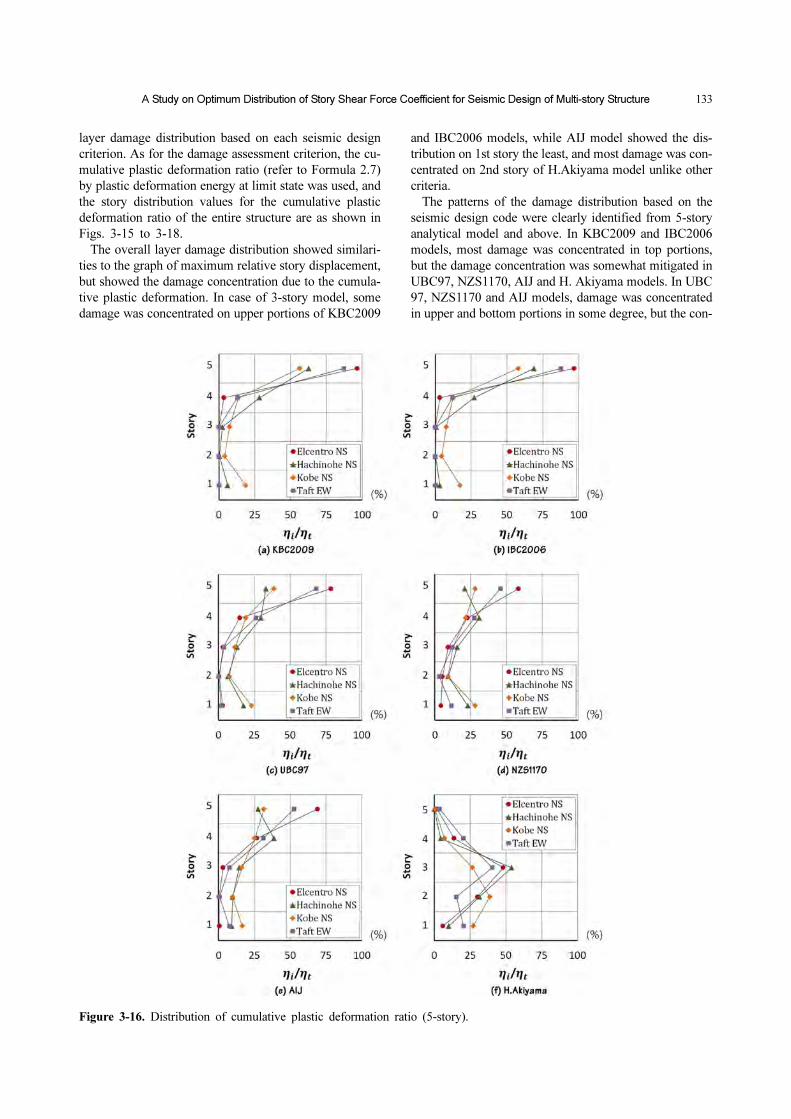
The patterns of the damage distribution based on the
seismic design code were clearly identified from 5-story
analytical model and above. In KBC2009 and IBC2006
models, most damage was concentrated in top portions,
but the damage concentration was somewhat mitigated in
UBC97, NZS1170, AIJ and H. Akiyama models. In UBC
97, NZS1170 and AIJ models, damage was concentrated
in upper and bottom portions in some degree, but the con-
Figure 3-16. Distribution of cumulative plastic deformation ratio (5-story).
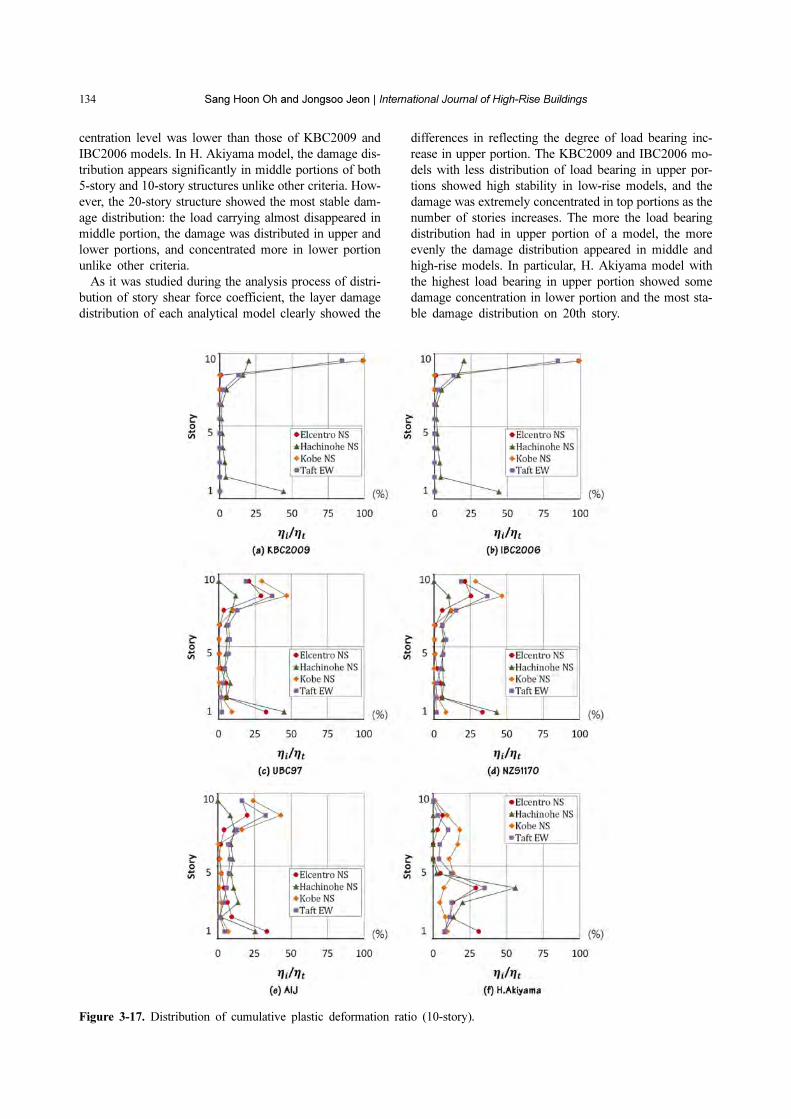
134 Sang Hoon Oh and Jongsoo Jeon | International Journal of High-Rise Buildings
centration level was lower than those of KBC2009 and
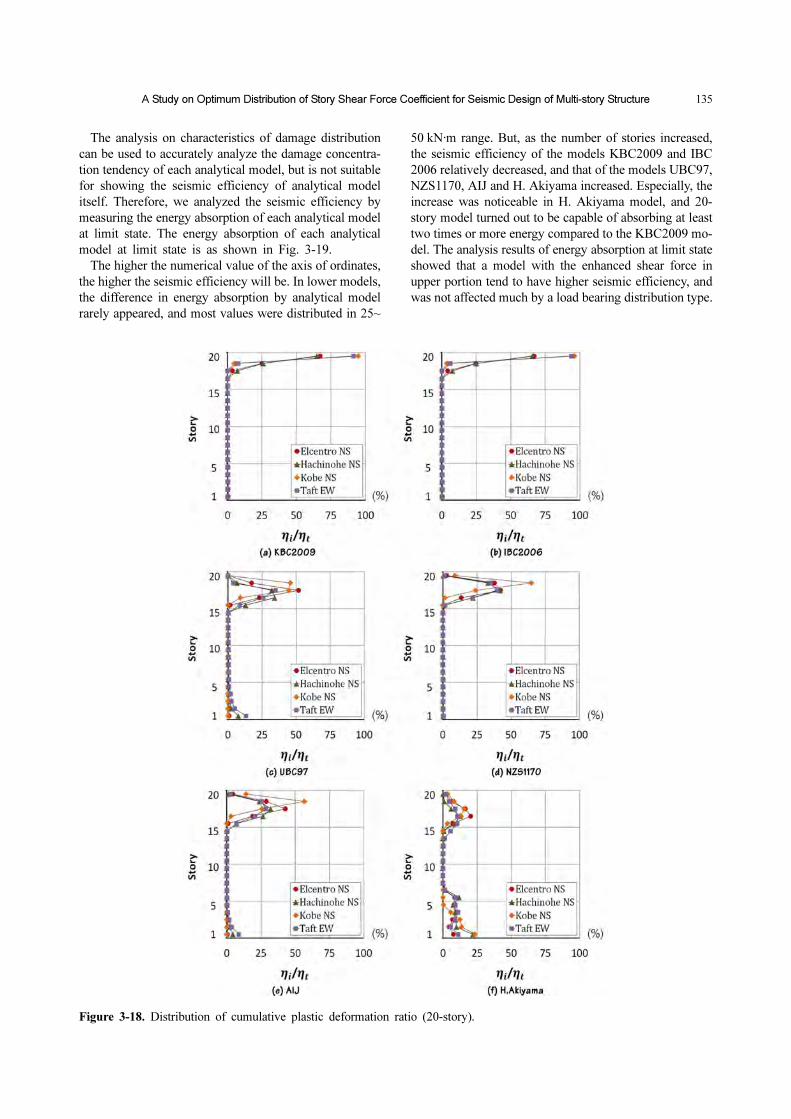
IBC2006 models. In H. Akiyama model, the damage dis-
tribution appears significantly in middle portions of both
5-story and 10-story structures unlike other criteria. How-
ever, the 20-story structure showed the most stable dam-
age distribution: the load carrying almost disappeared in
middle portion, the damage was distributed in upper and
lower portions, and concentrated more in lower portion
unlike other criteria.
As it was studied during the analysis process of distri-
bution of story shear force coefficient, the layer damage
distribution of each analytical model clearly showed the
differences in reflecting the degree of load bearing inc-
rease in upper portion. The KBC2009 and IBC2006 mo-
dels with less distribution of load bearing in upper por-
tions showed high stability in low-rise models, and the
damage was extremely concentrated in top portions as the
number of stories increases. The more the load bearing
distribution had in upper portion of a model, the more
evenly the damage distribution appeared in middle and
high-rise models. In particular, H. Akiyama model with
the highest load bearing in upper portion showed some
damage concentration in lower portion and the most sta-
ble damage distribution on 20th story.
Figure 3-17. Distribution of cumulative plastic deformation ratio (10-story).
A Study on Optimum Distribution of Story Shear Force Coefficient for Seismic Design of Multi-story Structure 135
The analysis on characteristics of damage distribution
can be used to accurately analyze the damage concentra-
tion tendency of each analytical model, but is not suitable
for showing the seismic efficiency of analytical model
itself. Therefore, we analyzed the seismic efficiency by
measuring the energy absorption of each analytical model
at limit state. The energy absorption of each analytical
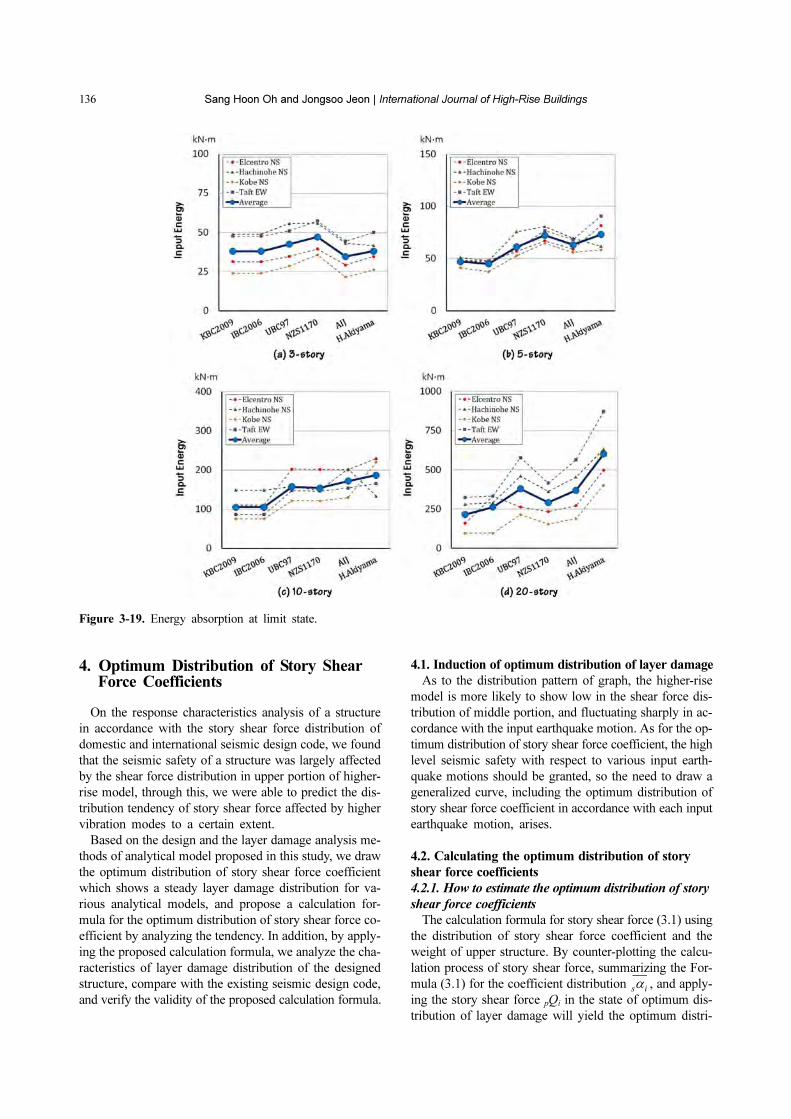
model at limit state is as shown in Fig. 3-19.
The higher the numerical value of the axis of ordinates,
the higher the seismic efficiency will be. In lower models,
the difference in energy absorption by analytical model
rarely appeared, and most values were distributed in 25~
50 kN·m range. But, as the number of stories increased,
the seismic efficiency of the models KBC2009 and IBC
2006 relatively decreased, and that of the models UBC97,
NZS1170, AIJ and H. Akiyama increased. Especially, the
increase was noticeable in H. Akiyama model, and 20-
story model turned out to be capable of absorbing at least
two times or more energy compared to the KBC2009 mo-
del. The analysis results of energy absorption at limit state
showed that a model with the enhanced shear force in
upper portion tend to have higher seismic efficiency, and
was not affected much by a load bearing distribution type.
Figure 3-18. Distribution of cumulative plastic deformation ratio (20-story).
136 Sang Hoon Oh and Jongsoo Jeon | International Journal of High-Rise Buildings
4. Optimum Distribution of Story Shear Force Coefficients
On the response characteristics analysis of a structure
in accordance with the story shear force distribution of
domestic and international seismic design code, we found
that the seismic safety of a structure was largely affected
by the shear force distribution in upper portion of higher-
rise model, through this, we were able to predict the dis-
tribution tendency of story shear force affected by higher
vibration modes to a certain extent.
Based on the design and the layer damage analysis me-
thods of analytical model proposed in this study, we draw
the optimum distribution of story shear force coefficient
which shows a steady layer damage distribution for va-
rious analytical models, and propose a calculation for-
mula for the optimum distribution of story shear force co-
efficient by analyzing the tendency. In addition, by apply-
ing the proposed calculation formula, we analyze the cha-
racteristics of layer damage distribution of the designed
structure, compare with the existing seismic design code,
and verify the validity of the proposed calculation formula.
4.1. Induction of optimum distribution of layer damage
As to the distribution pattern of graph, the higher-rise
model is more likely to show low in the shear force dis-
tribution of middle portion, and fluctuating sharply in ac-
cordance with the input earthquake motion. As for the op-
timum distribution of story shear force coefficient, the high
level seismic safety with respect to various input earth-
quake motions should be granted, so the need to draw a
generalized curve, including the optimum distribution of
story shear force coefficient in accordance with each input
earthquake motion, arises.
4.2. Calculating the optimum distribution of story
shear force coefficients
4.2.1. How to estimate the optimum distribution of story
shear force coefficients
The calculation formula for story shear force (3.1) using
the distribution of story shear force coefficient and the
weight of upper structure. By counter-plotting the calcu-
lation process of story shear force, summarizing the For-
mula (3.1) for the coefficient distribution , and apply-
ing the story shear force pQi in the state of optimum dis-
tribution of layer damage will yield the optimum distri-
αs i
Figure 3-19. Energy absorption at limit state.
A Study on Optimum Distribution of Story Shear Force Coefficient for Seismic Design of Multi-story Structure 137
bution of story shear force coefficient, . The calcula-
tion formula of optimum distribution of story shear force
coefficient is as shown in Formula (4.1).
(4.1)
When, : Optimum distribution of story shear force
coefficient
pQi : Story shear force of i story in the state of optimum
distribution of layer damage
zα1 : Story shear force coefficient of 1st story depen-
ding on local conditions
: Total weight of upper portion of i story
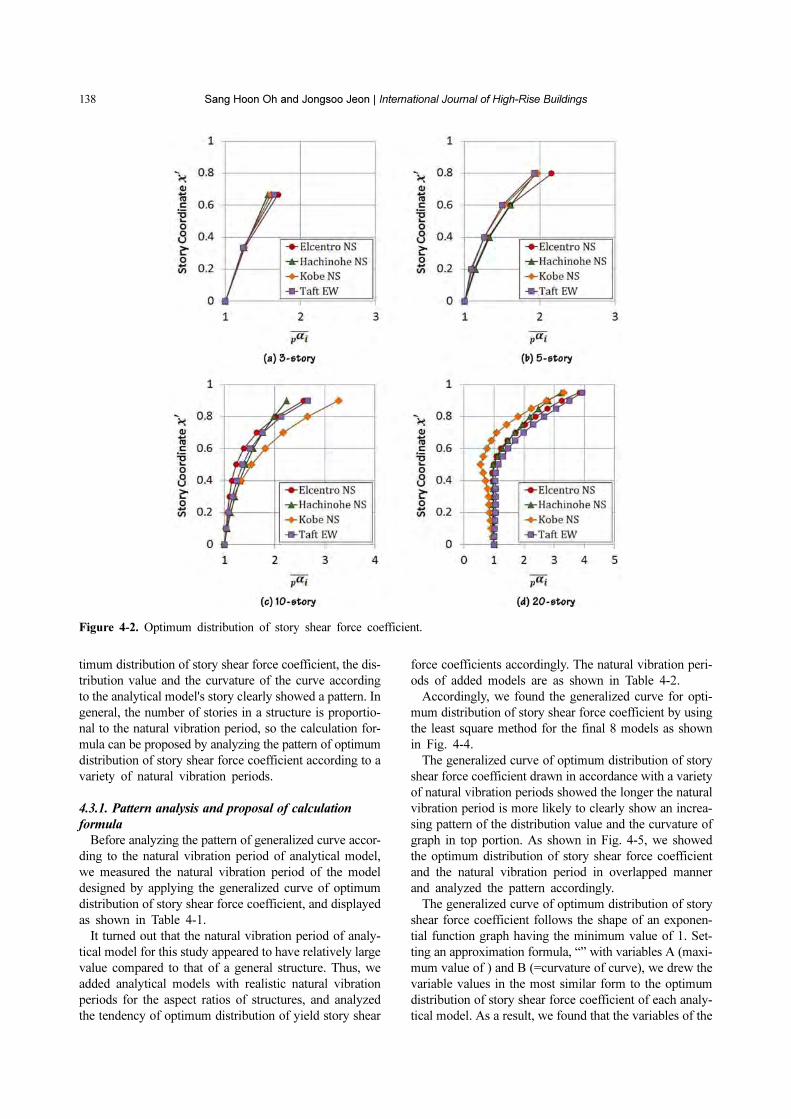
By using the above formula, the optimum distribution
of story shear force coefficient in accordance with
each input earthquake motion is estimated, and the graph
is as shown in Fig. 4-2.
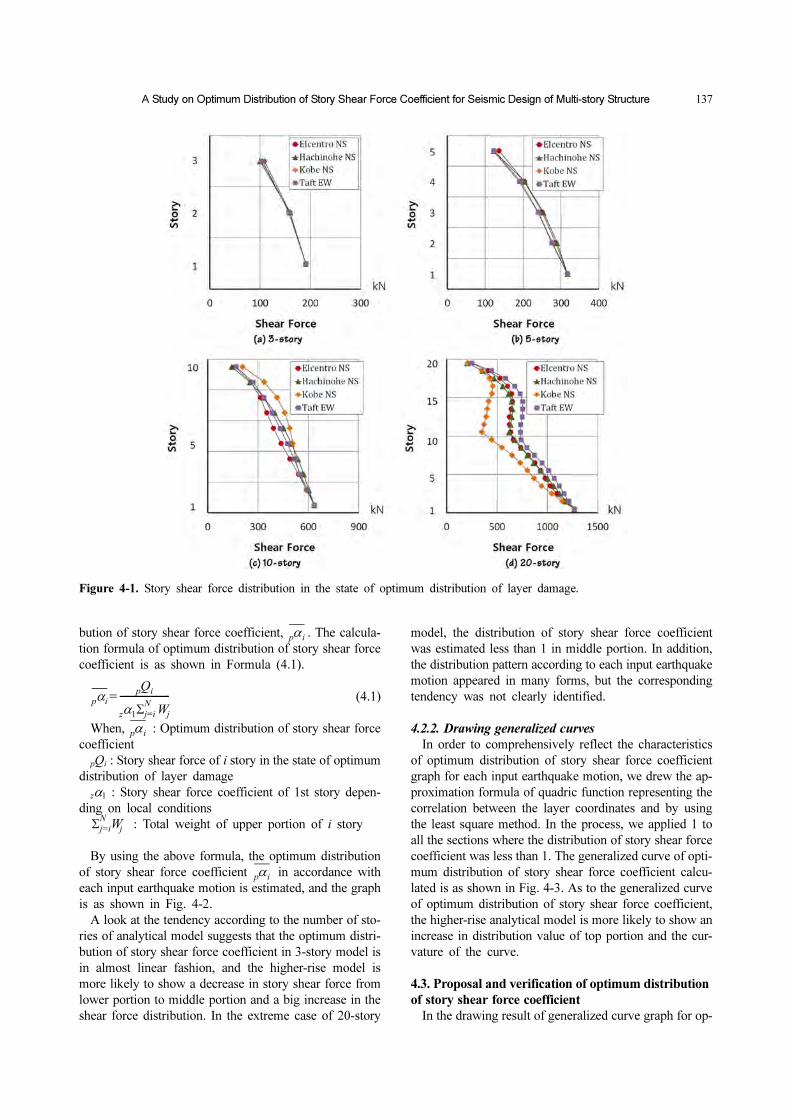
A look at the tendency according to the number of sto-
ries of analytical model suggests that the optimum distri-
bution of story shear force coefficient in 3-story model is
in almost linear fashion, and the higher-rise model is
more likely to show a decrease in story shear force from
lower portion to middle portion and a big increase in the
shear force distribution. In the extreme case of 20-story
model, the distribution of story shear force coefficient
was estimated less than 1 in middle portion. In addition,
the distribution pattern according to each input earthquake
motion appeared in many forms, but the corresponding
tendency was not clearly identified.
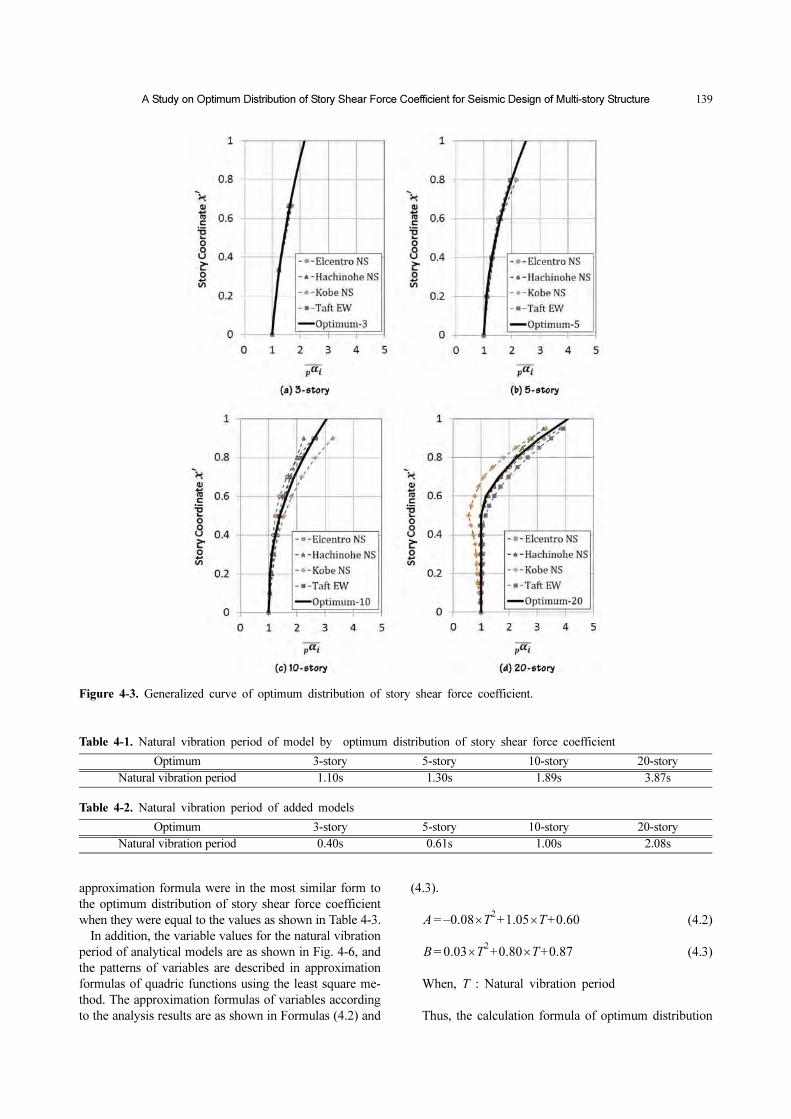
4.2.2. Drawing generalized curves
In order to comprehensively reflect the characteristics
of optimum distribution of story shear force coefficient
graph for each input earthquake motion, we drew the ap-
proximation formula of quadric function representing the
correlation between the layer coordinates and by using
the least square method. In the process, we applied 1 to
all the sections where the distribution of story shear force
coefficient was less than 1. The generalized curve of opti-
mum distribution of story shear force coefficient calcu-
lated is as shown in Fig. 4-3. As to the generalized curve
of optimum distribution of story shear force coefficient,
the higher-rise analytical model is more likely to show an
increase in distribution value of top portion and the cur-
vature of the curve.
4.3. Proposal and verification of optimum distribution
of story shear force coefficient
In the drawing result of generalized curve graph for op-
αp i
αp i
Qp i
αz 1Σj=i
NWj
----------------------=
αp i
Σj=i
NWj
αp i
Figure 4-1. Story shear force distribution in the state of optimum distribution of layer damage.
138 Sang Hoon Oh and Jongsoo Jeon | International Journal of High-Rise Buildings
timum distribution of story shear force coefficient, the dis-
tribution value and the curvature of the curve according
to the analytical model's story clearly showed a pattern. In
general, the number of stories in a structure is proportio-
nal to the natural vibration period, so the calculation for-
mula can be proposed by analyzing the pattern of optimum
distribution of story shear force coefficient according to a
variety of natural vibration periods.
4.3.1. Pattern analysis and proposal of calculation
formula
Before analyzing the pattern of generalized curve accor-
ding to the natural vibration period of analytical model,
we measured the natural vibration period of the model
designed by applying the generalized curve of optimum
distribution of story shear force coefficient, and displayed
as shown in Table 4-1.
It turned out that the natural vibration period of analy-
tical model for this study appeared to have relatively large
value compared to that of a general structure. Thus, we
added analytical models with realistic natural vibration
periods for the aspect ratios of structures, and analyzed
the tendency of optimum distribution of yield story shear
force coefficients accordingly. The natural vibration peri-
ods of added models are as shown in Table 4-2.
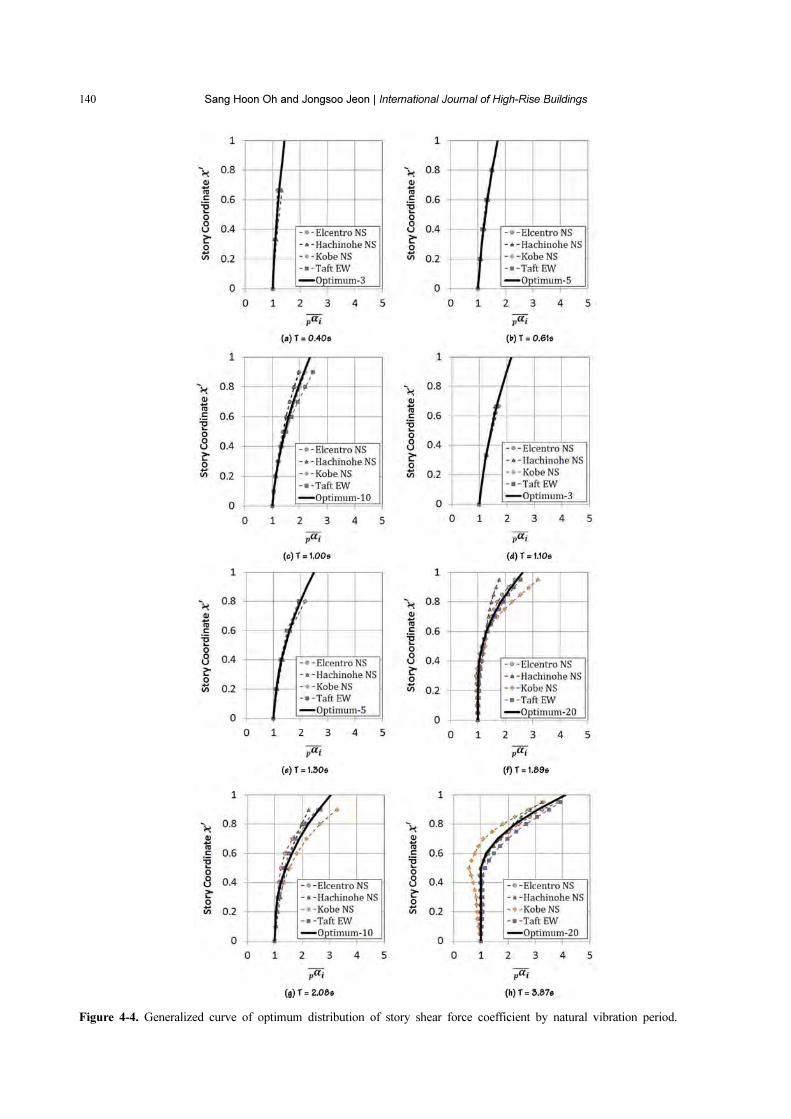
Accordingly, we found the generalized curve for opti-
mum distribution of story shear force coefficient by using
the least square method for the final 8 models as shown
in Fig. 4-4.
The generalized curve of optimum distribution of story
shear force coefficient drawn in accordance with a variety
of natural vibration periods showed the longer the natural
vibration period is more likely to clearly show an increa-
sing pattern of the distribution value and the curvature of
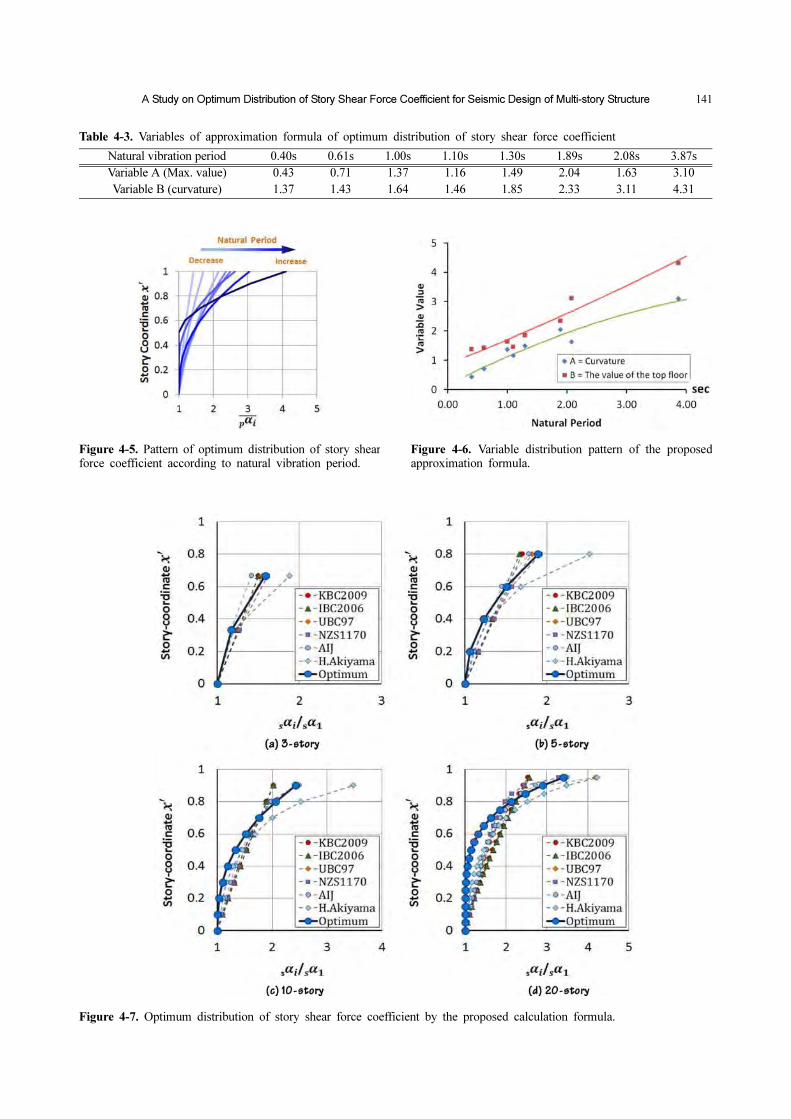
graph in top portion. As shown in Fig. 4-5, we showed
the optimum distribution of story shear force coefficient
and the natural vibration period in overlapped manner
and analyzed the pattern accordingly.
The generalized curve of optimum distribution of story
shear force coefficient follows the shape of an exponen-
tial function graph having the minimum value of 1. Set-
ting an approximation formula, “” with variables A (maxi-
mum value of ) and B (=curvature of curve), we drew the
variable values in the most similar form to the optimum
distribution of story shear force coefficient of each analy-
tical model. As a result, we found that the variables of the
Figure 4-2. Optimum distribution of story shear force coefficient.
A Study on Optimum Distribution of Story Shear Force Coefficient for Seismic Design of Multi-story Structure 139
approximation formula were in the most similar form to
the optimum distribution of story shear force coefficient
when they were equal to the values as shown in Table 4-3.
In addition, the variable values for the natural vibration
period of analytical models are as shown in Fig. 4-6, and
the patterns of variables are described in approximation
formulas of quadric functions using the least square me-
thod. The approximation formulas of variables according
to the analysis results are as shown in Formulas (4.2) and
(4.3).
(4.2)
(4.3)
When, T : Natural vibration period
Thus, the calculation formula of optimum distribution
A 0.08– T2× 1.05+ T× 0.60+=
B 0.03 T2× 0.80+ T× 0.87+=
Figure 4-3. Generalized curve of optimum distribution of story shear force coefficient.
Table 4-1. Natural vibration period of model by optimum distribution of story shear force coefficient
Optimum 3-story 5-story 10-story 20-story
Natural vibration period 1.10s 1.30s 1.89s 3.87s
Table 4-2. Natural vibration period of added models
Optimum 3-story 5-story 10-story 20-story
Natural vibration period 0.40s 0.61s 1.00s 2.08s
140 Sang Hoon Oh and Jongsoo Jeon | International Journal of High-Rise Buildings
Figure 4-4. Generalized curve of optimum distribution of story shear force coefficient by natural vibration period.
A Study on Optimum Distribution of Story Shear Force Coefficient for Seismic Design of Multi-story Structure 141
Figure 4-5. Pattern of optimum distribution of story shearforce coefficient according to natural vibration period.
Table 4-3. Variables of approximation formula of optimum distribution of story shear force coefficient
Natural vibration period 0.40s 0.61s 1.00s 1.10s 1.30s 1.89s 2.08s 3.87s
Variable A (Max. value) 0.43 0.71 1.37 1.16 1.49 2.04 1.63 3.10
Variable B (curvature) 1.37 1.43 1.64 1.46 1.85 2.33 3.11 4.31
Figure 4-6. Variable distribution pattern of the proposedapproximation formula.
Figure 4-7. Optimum distribution of story shear force coefficient by the proposed calculation formula.
142 Sang Hoon Oh and Jongsoo Jeon | International Journal of High-Rise Buildings
of story shear force coefficient described by the variable
analysis according to the approximation formula in an ex-
ponential function form and the natural vibration period is
as shown in Formula (4.4), and through this, the compa-
rison between the graph of optimum distribution of story
shear force coefficient estimated and that of story shear
force coefficient based on the domestic and international
seismic design code is as shown in Fig. 4-7.
(4.4)
When, : Height up to the i story from the ground
T : Natural vibration period
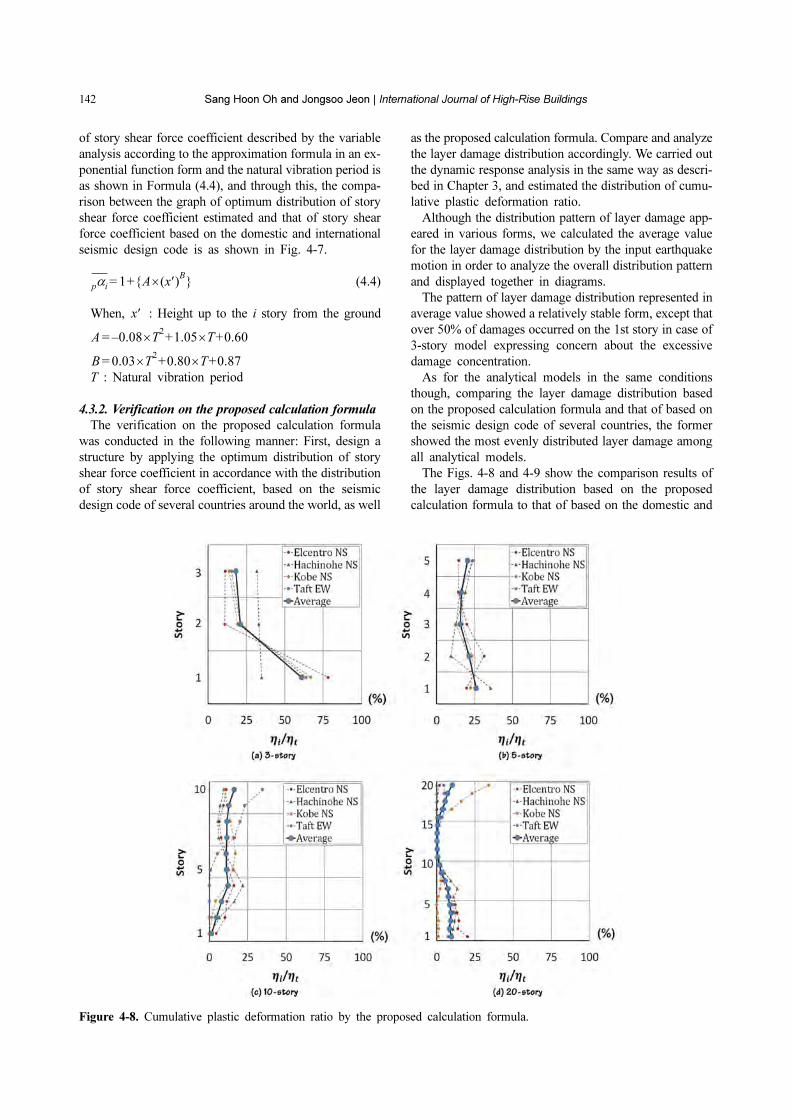
4.3.2. Verification on the proposed calculation formula
The verification on the proposed calculation formula
was conducted in the following manner: First, design a
structure by applying the optimum distribution of story
shear force coefficient in accordance with the distribution
of story shear force coefficient, based on the seismic
design code of several countries around the world, as well
as the proposed calculation formula. Compare and analyze
the layer damage distribution accordingly. We carried out
the dynamic response analysis in the same way as descri-
bed in Chapter 3, and estimated the distribution of cumu-
lative plastic deformation ratio.
Although the distribution pattern of layer damage app-
eared in various forms, we calculated the average value
for the layer damage distribution by the input earthquake
motion in order to analyze the overall distribution pattern
and displayed together in diagrams.
The pattern of layer damage distribution represented in
average value showed a relatively stable form, except that
over 50% of damages occurred on the 1st story in case of
3-story model expressing concern about the excessive
damage concentration.
As for the analytical models in the same conditions
though, comparing the layer damage distribution based
on the proposed calculation formula and that of based on
the seismic design code of several countries, the former
showed the most evenly distributed layer damage among
all analytical models.
The Figs. 4-8 and 4-9 show the comparison results of
the layer damage distribution based on the proposed
calculation formula to that of based on the domestic and
αp i 1 A x′( )B×{ }+=
x′
A 0.08– T2× 1.05+ T× 0.60+=
B 0.03 T2× 0.80+ T× 0.87+=
Figure 4-8. Cumulative plastic deformation ratio by the proposed calculation formula.
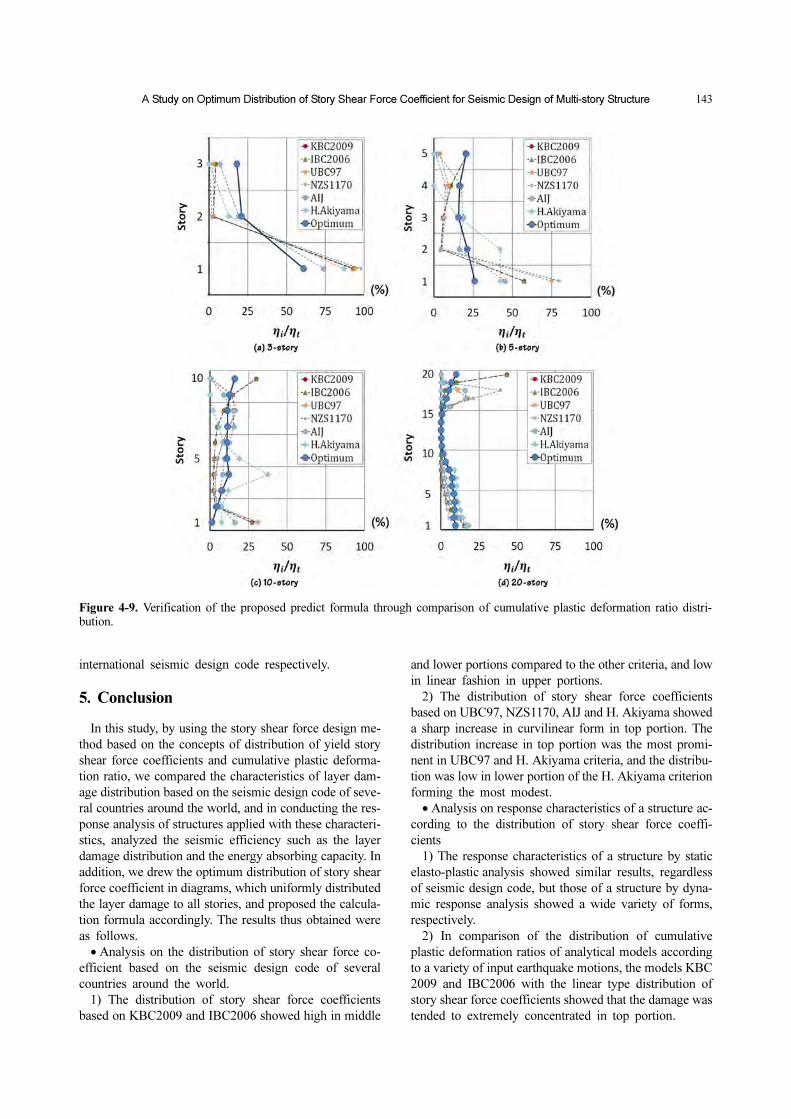
A Study on Optimum Distribution of Story Shear Force Coefficient for Seismic Design of Multi-story Structure 143
international seismic design code respectively.
5. Conclusion
In this study, by using the story shear force design me-
thod based on the concepts of distribution of yield story
shear force coefficients and cumulative plastic deforma-
tion ratio, we compared the characteristics of layer dam-
age distribution based on the seismic design code of seve-
ral countries around the world, and in conducting the res-
ponse analysis of structures applied with these characteri-
stics, analyzed the seismic efficiency such as the layer
damage distribution and the energy absorbing capacity. In
addition, we drew the optimum distribution of story shear
force coefficient in diagrams, which uniformly distributed
the layer damage to all stories, and proposed the calcula-
tion formula accordingly. The results thus obtained were
as follows.
• Analysis on the distribution of story shear force co-
efficient based on the seismic design code of several
countries around the world.
1) The distribution of story shear force coefficients
based on KBC2009 and IBC2006 showed high in middle
and lower portions compared to the other criteria, and low
in linear fashion in upper portions.
2) The distribution of story shear force coefficients
based on UBC97, NZS1170, AIJ and H. Akiyama showed
a sharp increase in curvilinear form in top portion. The
distribution increase in top portion was the most promi-
nent in UBC97 and H. Akiyama criteria, and the distribu-
tion was low in lower portion of the H. Akiyama criterion
forming the most modest.
• Analysis on response characteristics of a structure ac-
cording to the distribution of story shear force coeffi-
cients
1) The response characteristics of a structure by static
elasto-plastic analysis showed similar results, regardless
of seismic design code, but those of a structure by dyna-
mic response analysis showed a wide variety of forms,
respectively.
2) In comparison of the distribution of cumulative
plastic deformation ratios of analytical models according
to a variety of input earthquake motions, the models KBC
2009 and IBC2006 with the linear type distribution of
story shear force coefficients showed that the damage was
tended to extremely concentrated in top portion.
Figure 4-9. Verification of the proposed predict formula through comparison of cumulative plastic deformation ratio distri-bution.
144 Sang Hoon Oh and Jongsoo Jeon | International Journal of High-Rise Buildings
3) The models UBC97, NZS1170, AIJ and H. Akiyama
with the distribution of story shear force coefficients in
curvilinear form showed that the layer damage was rela-
tively well dispersed compared to the models KBC2009
and IBC2006. In analyzing the layer damage intensity and
the energy absorption at limit state, the seismic efficiency
of H.Akiyama model with the largest increase in distri-
bution of story shear force coefficients in top portion was
excellent.
• Proposal and verification on the calculation formula
for optimum distribution of story shear force coefficients
1) We drew the optimum distribution of story shear for-
ce coefficients, implementing the optimum distribution of
layer damage in which the damage distribution uniformly
appears on all stories for analytical models having a vari-
ety of natural vibration periods, and proposed the calcula-
tion formula with variables resulted from analyzing the
optimum distribution of story shear force according to the
changes of natural vibration periods.
2) The layer damage distribution of analytical model
applied with the proposed calculation formula of opti-
mum distribution of story shear force coefficients showed
a relatively uniform distribution, but the damage was some-
what concentrated in bottom portion of 3-story model.
3) With the analytical models in the same conditions,
the layer damage distribution by the proposed calculation
formula showed the most equitable form in comparison to
the layer damage distribution obtained from the distribu-
tion of story shear force coefficients based on the seismic
design code of several countries, and in case of the 3-
story model which had some damage concentration, the
layer damage distribution by the proposed calculation for-
mula showed the most relaxed form.
However, the analytical models in this study have been
simplified for the purpose of designing story-specific
framework member and response analysis, so a study
needed to be conducted in consideration of realistic mem-
ber size, the collapse type of a structure, the behaviors of
a structure due to the influence of gravity, etc. In addition,
based on this study, the complementary measures on the
proposed calculation formulas for optimum distribution
of story shear force coefficients needed to be taken by ex-
panding the scope of research on a wider range of aspect
ratios and input earthquake motions, etc.
References
Akiyama Hiroshi, “Earthquake-Resistant Limit-State Design
for Buildings”, Tokyo Univ. Press, 1985.
“KOREAN BUILDING CODE - STRUCTURAL”, Ministry
of Construction & Transportation (Republic of Korea),
2009.
“International Building Code”, International Code Council
(USA), 2006.
“Uniform Building Code”, International Conference of Buil-
ding Officials (USA), 1997.
Architectural Institute of Japan, “AIJ recommendations for
loads on buildings” (Japan), 1996/
Australia/New Zealand Standard 1170.4, New Zealand Stan-
dard (New Zealand), 2003.
“Study on the concept of performance-based seismic design
and control of seismic response”, Ministry of Science and
Technology (Republic of Korea), 2000.
J. S. Jeon, and S. H. Oh, “A Comparative Study on Story
Damage Distribution of Domestic and Foreign Seismic
Design Codes”, Busan Ulsan Gyeongnam Chapter of
Architectural Institute of Korea - Workshop Presentation
File, 8(1), pp. 126~129, 2012.
D. G. Lee, Y. W. Shin, and S. Y. Lee, “The Effect of Higher
Vibration Modes on the Design Seismic Load”, Compu-
tational Structural Engineering Institute of Korea - Work-
shop Presentation File, pp. 73~78, 1990.
G. H. Park, D. G. Lee, and S. G. Lee, “Vertical Distribution
of Seismic Loads for Multistory Building Structures”,
Journal of the Architectural Institute of Korea, 7(5), pp.
239~250, 1991.
S. C. Jeong, and S. D. Kim, “Evaluation of the Story Seismic
Load for Bearing Wall Type Structures”, Architectural
Institute of Korea - Workshop Presentation File, 12(2),
pp. 449~452, 1992.
K. J. Joo, and Y. W. Kim, “A Study on Distribution of Seis-
mic Load for Dual System”, Architectural Institute of
Korea - Workshop Presentation File, 13(1), pp. 279~282,
1993.
J. H. Park, “(A) Study on the Calculation of the Design
Seismic Load Considering Dynamic Effect”, Dep. of Ar-
chitectural Engineering Graduate school of Engineering,
Kon-Kuk University, 1995.
J. H. Hwang, Y. S. Cheon, and L. H. Lee, “The vertical distri-
bution of lateral seismic forces to account for the contri-
bution of the higher modes”, Journal of the Architectural
Institute of Korea Structure & Construction, 16(7), pp. 3-
8, 2000.
G. H. Park, “A Study on the Vertical Distribution of Seismic
Load for Equivalent Static Analysis of Shear Wall Type
Building Structures”, The Regional Association of Archi-
tectural Institute of Korea, 7(2), pp. 69~77, 2005.
Y. B. Kim, H. K. Park, and D. H. Jeon, “Establishing Appro-
priate Seismic Force Distribution on Multistory Building
Structures Subjected to Seismic Excitations”, Journal of
the Architectural Institute of Korea, 10(12), pp. 219~224,
1994.
S. H. Oh, H. S. Yoo, and T. S. Moon, “Damage Distribution
Rule of Weak Beam Type Multi-Story Steel Frames Influ-
enced by Strength and Stiffness Ratios of Beam and Co-
lumn”, Journal of the Earthquake Engineering Society of
Korea, 9(5), pp. 53~61, 2005.
D. H. Jeon, and Inoue Yutaka, “On Optimum Distribution of
Seismic Force Coefficients for Nonlinear High-rise Buil-
dings Subjected to Earthquake Excitations”, Architectural
Institute of Korea - Workshop Presentation File, 11(2),
pp. 425~428, 1991.
S. H. Oh, Satoshi Yamada, and Hiroshi Akiyama, “Damage
Distribution Rule of Weak Beam Type Multi-Story Steel
Frames Influenced by Strength and Stiffness Ratios of
A Study on Optimum Distribution of Story Shear Force Coefficient for Seismic Design of Multi-story Structure 145
Beam and Cloumn”, AIJ, No. 506, pp. 171~177, 1998.
Freeman, S., Sasaki, K., and Paret, T., “Multi-Mode Pushover
Procedure (MMP) - A Method to Identify the Effects of
Higher Modes in a Pushover Analysis”, Proceedings of
the 6th National Conference on Earthquake Engineering,
EERI, Seattle, Washington, 1998.
Chopra, A. K, and Goel, R. K, “A modal pushover analysis
procedure to estimate seismic demands for buildings: the-
ory and preliminary evaluation”, Pacific Earthquake Engi-
neering Research Center, University of California, Berke-
ley, 2001.
Goman Ho, Peng Liu, and Michael Liu, “Parametric Analysis
and Design Engine for Tall Building Structures”, Interna-
tional Journal of High-Rise Buildings, 1(1), pp. 53~59,
Korean Council on Tall Building and Urban Habitat
(CTBUH), 2012.
D. H. Lee, T. J. Kim, J. H. Kim, and D. E. Kang, “State of
Practice of Performance-Based Seismic Design in Korea”,
International Journal of High-Rise Buildings, 1(3), pp.
195~201, CTBUH, 2012.
Carl E. Grigorian and Mark Grigorian, “Drift Control for
Multistory Moment Frames under Lateral Loading”, Inter-
national Journal of High-Rise Buildings, 2(4), pp. 355~
365, CTBUH, 2013.