Embed Size (px)
Citation preview
International Journal of Heat and Mass Transfer 53 (2010) 1128–1138
Contents lists available at ScienceDirect
International Journal of Heat and Mass Transfer
journal homepage: www.elsevier .com/locate / i jhmt
Stochastic modeling and direct simulation of the diffusion mediafor polymer electrolyte fuel cells
Yun Wang a,*, Sungchan Cho a, Ralf Thiedmann b, Volker Schmidt b, Werner Lehnert c, Xuhui Feng a
a Renewable Energy Resources Lab (RERL) and National Fuel Cell Research Center, Department of Mechanical and Aerospace Engineering,The University of California, Irvine, CA 92697-3975, USAb Institute of Stochastics, Ulm University, 89069 Ulm, Germanyc Forschungszentrum Jülich GmbH, 52425 Jülich, Germany
a r t i c l e i n f o
Article history:Available online 11 December 2009
Keywords:Polymer electrolyte fuel cellGas diffusion layerDirect simulationStochastic modeling
0017-9310/$ - see front matter � 2009 Elsevier Ltd. Adoi:10.1016/j.ijheatmasstransfer.2009.10.044
* Corresponding author. Tel.: +1 949 824 6004; faxE-mail address: [email protected] (Y. Wang).
a b s t r a c t
This paper combines the stochastic-model-based reconstruction of the gas diffusion layer (GDL) of poly-mer electrolyte fuel cells (PEFCs) and direct simulation to investigate the pore-level transport withinGDLs. The carbon-paper-based GDL is modeled as a stack of thin sections with each section describedby planar two-dimensional random line tessellations which are further dilated to three dimensions.The reconstruction is based on given GDL data provided by scanning electron microscopy (SEM) images.With the constructed GDL, we further introduce the direct simulation of the coupled transport processesinside the GDL. The simulation considers the gas flow and species transport in the void space, electroniccurrent conduction in the solid, and heat transfer in both phases. Results indicate a remarkable distinc-tion in tortuosities of gas diffusion passage and solid matrix across the GDL with the former �1.2 and thelatter �13.8. This difference arises from the synthetic microstructure of GDL, i.e. the lateral alignmentnature of the thin carbon fiber, allowing the solid-phase transport to occur mostly in lateral direction.Extensive discussion on the tortuosity is also presented. The numerical tool can be applied to investigatethe impact of the GDL microstructure on pore-level transport and scrutinize the macroscopic approachvastly adopted in current fuel cell modeling.
� 2009 Elsevier Ltd. All rights reserved.
1. Introduction
Fuel cells, converting the chemical energy stored in fuels di-rectly and efficiently to electricity via electrochemical activity,have become the focus of new energy development due to theirnoteworthy features of high efficiency and low emissions [1–3].Among all types of fuel cells, the polymer electrolyte fuel cells(PEFCs), also called polymer electrolyte membrane (PEM) fuel cells,have captured the public attention for both mobile and portableapplications [4,5].
Among the PEFC components, the gas diffusion layer (GDL)plays an important role of electronic connection between the bipo-lar plate with channel-land structure and the electrode. In addi-tion, the GDL performs the following functions essential to fuelcell operation: passage for reactant transport and heat/water re-moval, mechanical support to the membrane electrode assembly(MEA), and protection of the catalyst layer from corrosion or ero-sion caused by flows or other factors [6,7]. Physical processes inGDLs, in addition to diffusion, include bypass flow induced by in-plane pressure difference between neighboring channels [8,9],
ll rights reserved.
: +1 949 824 8585.
through-plane flow due to mass source/sink by electrochemicalreactions [10,11], heat transfer [12,13], heat pipe phenomena[14], two-phase flow [14–18], and electron transport [19–21], tolist just a few.
The carbon paper is a common GDL material used in PEFCs. It isnon-woven carbon-fiber-based porous media, where carbon fibersare randomly placed and bonded by binders. Fig. 1 shows a pictureof carbon papers. Modeling the transport inside GDLs is an essen-tial part of a fuel cell model due to the vital role of GDLs. Currenteffort in modeling is overwhelmingly through the macroscopicdescription. This approach assumes a homogenous structure ofGDL and therefore defines several effective parameters accountingfor micro structural features, e.g. porosity and permeability. Theseparameters are also adopted for modeling other GDL materials, e.g.the carbon cloth and Sigracet GDLs, and set differently according totheir structural characteristics.
Transport in the GDL, e.g. water and oxygen diffusion, are clo-sely related to fuel cell voltage loss, e.g. the mass transport and oh-mic losses. Typically, diffusion dominates gaseous speciestransport in GDLs. Convection may be induced by the local masssink/source due to the reaction activities in the catalyst layer[11]. The convection contributes little comparing with the diffusiveone in most cases [11,22]. Some special designs [8,9] are reported,

Nomenclature
C molar concentration of species k, mol/m3
D species diffusivity, m2/sF Faraday’s constant, 96,487 C/equivalentI current density, A/cm2
J transfer current density, A/cm3
K permeability, m2
P pressure, PaR universal gas constant, 8.134 J/mol KT temperature, K~u velocity vector, m/s
Greeksa net water flux per proton fluxq density, kg/m3
U phase potential, Ve porositys�
shear stress, N/m2
r electronic or ionic conductivity, S/m
Superscripts and subscriptsc cathodeD diffusiong gas phaseGDL gas diffusion layerk specieso gas channel inlet value; reference values solid
Y. Wang et al. / International Journal of Heat and Mass Transfer 53 (2010) 1128–1138 1129
where convection plays an important role. In addition to speciestransport, the reaction heat is removed via the GDL, primarily byheat conduction in the solid matrix. Recently, liquid water trans-port within GDLs received much attention. Liquid may block thepore space, hampering reactant supply. Liquid flow in GDLs is pri-marily driven by the capillary action. Its macroscopic modeling iscommonly based on the Darcy’s law and the knowledge of the cap-illary pressure in porous media [18].
Though great efforts have been made to investigate the macro-scopic phenomena, few are proposed to study the pore-level trans-port within the GDL. The macroscopic model requires empiricalcorrelations such as the effective coefficients to account for theporous media property. These correlations can be developed fromthe pore-level information obtained from direct modeling/simula-tion. In addition, the pore-level study can provide fundamental de-tails regarding interaction between transport and pore structure,which is beyond the capability of a usual macroscopic model.The direct simulation is a powerful numerical tool for studyingthe transport in porous media. Some also named it the directnumerical simulation (DNS) [23–25]. To distinguish with the termsin the computational fluid dynamics (CFD), e.g. in the turbulentsimulation, we follow Kaviany [26,27] and choose the term of di-rect simulation for this numerical technique. The direct simulationrequires precisely capturing the GDL morphology. Several tech-niques have been applied to acquire synthetic microstructures ofGDLs [28–32]. An important aspect of a suitable GDL-reconstruc-tion model is the possibility of fitting it to real data. This paper em-ploys the stochastic model of GDLs developed in [28]. The optimalparameters of the fitted fiber model are gained using 2D projection
Fig. 1. Microscope images of the carbon p
images from electron microscopy. Therefore in Ref. [28] propersegmentation algorithms are applied to obtain the required struc-tural information from these 2D images. This means that the modelis fitted with respect to structural characteristics but not with re-spect to physical properties. The direct simulation model basedon realizations of this stochastic GDL approach is further intro-duced to study the pore-level phenomena. The fact that the modelis fitted to real data using only structural information of realimages allows the unbiased computations of physical parametersas will be done in this paper. A typical porosity of �0.78 of GDLsis considered, which is close to the state of GDLs without compres-sion or the part of the GDL under the channel [32]. We consider atypical fuel cell operating condition and solve the fluid, species,heat and electron equations simultaneously within the GDL.Pore-level information is presented and discussed.
2. Stochastic modeling of GDLs
In this section we give a short description of the stochastic mul-ti-layer model for reconstructing the GDL microstructure that isbased on tools from stochastic geometry [34,35]. For detailsregarding this model and its implementation we refer to Ref. [28].
2.1. Modeling of the fiber system
A look at Fig. 1 leads to an impression that the carbon fibers ofToray paper can be approximated by horizontally orientatedstraight lines (assume negligible curvature) which are dilated withrespect to 3D. This can also be verified through the production
aper diffusion media used in PEFCs.

1130 Y. Wang et al. / International Journal of Heat and Mass Transfer 53 (2010) 1128–1138
process of the carbon-paper-based GDL, where fibers are disposed‘‘almost” horizontally. In addition, it is assumed that the fiber sys-tem can be seen as a stack of several thin sections consisting ofsuch horizontally/laterally orientated fibers which are allowed tointerpenetrate. Therefore the fiber system is modeled as a stackof independent and identically distributed layers, where adjacentlayers are just touching each other. Note that this assumption isa simplification in comparison to the real GDL because the fibersin one thin section are crossing each other to a small extent, whichis neglected in the model. Here, the fibers within a given thin sec-tion are seen as mutually penetrating cylinders or filaments. In [28]it was shown that despite of these simplifications the structure ofthis model and the structure of physically measured 3D data ofsuch GDLs are very similar. In [36], tortuosity describing character-istics, pore size distributions, and connectivity properties of thepore space have been computed for the model and also for real(physically) measured 3D data. The results for the model and thereal measured 3D data are also very close together with respectto such transport relevant properties. So this model seems to beappropriate for the here considered kind of GDL.
The model for the fibers in each section is based on Poisson linetessellations (PLT) in the plane. A planar line tessellation is a set ofcells n1, n2, . . . generated by intersecting lines l1, l2, . . . scattered inthe plane. A line ln in the plane can be represented by its normalform, i.e. its orthogonal signed distance to the origin xn and itsdirection mn measured as the angle to the x-axis (see Fig. 2(a)).Thus a line tessellation can be seen as an independently markedpoint process (X1, M1), (X2, M2), . . . where in case of a PLT the ran-dom distances X1, X2, . . . form a homogeneous Poisson point pro-cess on the real line with intensity k > 0. The random variablesM1, M2, . . ., describing the directions, are uniformly distributed inthe interval [0, p) and mutually independent as well as indepen-dent from the Poisson point process. The PLT is then the set of ran-dom polygons N1, N2, . . . created by the random lines (X1, M1), (X2,M2), . . . (see Fig. 2(b)). The PLT is completely described by oneparameter, the intensity of the Poisson point process k > 0, whichcan be interpreted as the mean total edge length per unit area ofthe PLT.
Fig. 2. (a) Construction of a line
Fig. 3. Schematic display of the multi-layer model: (a
The lines of the PLT are one-dimensional objects. To get a 3Dmodel for the fibers the lines are dilated with respect to 3D [35].Mathematically this can be described by the Minkowski sumwhich is defined for two sets A � R3 and B � R3 by
A� B ¼ faþ b : a 2 A; b 2 Bg ð1Þ
To model a complete layer of the multi-layer model, the set of alledges
S@Ni is dilated by a structuring element Cr, e.g. a ball with ra-
dius r or a cube with side length 2r, centered at the origin. The cubeseems in some cases to be the most realistic approximation becauseof the resolution of the discretized model. This was shown in Ref.[28], where the spherical contact distribution (see Ref. [35]) was ap-plied. In the following a fiber diameter of 7.5 lm and a voxel reso-lution of 1.5 lm will be considered, following the real 3D GDL datain [28]. This implies that the fiber diameters have to be modeled by5 voxels.
The complete multi-layer model consists then of a stack of suchdilated PLTs (see Fig. 3), where all layers are assumed to be inde-pendent and identically distributed. Adjacent layers are just touch-ing each other.
2.2. Modeling of the binder
The fibers of the GDL are adhered by means of a binder, which isintroduced in the manufacturing process and can be treated as thinfilms bounded by fibers. The binder is modeled by an independentfilling of cells, i.e. a cell of the underlying PLT is chosen to containbinder with probability p 2 [0, 1] (see Fig. 4).
2.2.1. Structural fitting of the multi-layer model to real dataThe considered model for fibers and binder leads to the follow-
ing formulae for the volume fractions as described in Refs. [28] and[36], respectively. For notation we use 2r for describing the sidelength of the cube which is used to dilate the lines of the PLT, c de-notes the intensity of the PLT in each layer, and p denotes the prob-ability that a cell is filled with binder. The expected volumefraction of fibers Vfiber(c, r) is then given by
and (b) a cell Nn of a PLT.
) one layer, (b) two layers, and (c) several layers.

Fig. 4. (a) Cells without binder and (b) some cells filled with binder.
Y. Wang et al. / International Journal of Heat and Mass Transfer 53 (2010) 1128–1138 1131
Vfiberðc; rÞ ¼ 1� expð�2rcÞ ð2Þ
The expected volume fraction of binder Vbinder(c, r, p) is given by
Vbinderðc; r;pÞ ¼ p expð�2rcÞ ð3Þ
Additionally, the relationship e = 1 � (Vfiber(c, r) + Vbinder(c, r, p))holds, where e denotes the (mean) porosity of the consideredGDL. In [28], the value c was estimated from 2D SEM images forthe here considered material where a non-interactive segmentationalgorithm for the detection of the top section has been applied.From the segmented data the intensity of the PLT was then esti-mated by 0.025. From 3D images of the same kind of material,gained by means of synchrotron tomography, in [28] the (mean)porosity e was estimated 78%. This value of e for Toray 090 GDLstructures is also known from the literature [33]. If these valuesare plugged in the above given relationship, the estimated valuefor p is 0.059 which corresponds to a volume fraction of binder of4.9% in the 3D GDL structure. A realization of the complete modelcan be seen in Fig. 5. A validation of the model with its fitted param-eters was done in [28] by the spherical contact distribution func-tion, see [35]. This characteristic describes the minimum distanceof an arbitrarily chosen point of the pore space to the fiber or bindersystem, respectively. Additionally, in [36] it is reported that themodel and real measured 3D data are also very similar with respectto tortuosity describing characteristics, pore size distribution, andconnectivity properties of the pore space.
3. Direct simulation
3.1. Mathematical modeling
In this section, a small representative GDL is considered fornumerical simulation (see Fig. 5). One side surface of the GDL nor-mal to x direction attaches the catalyst layer or MPL (microscopiclayer), while the other in connection to the channel/land region.The physical transports within GDLs are linked to the electrochem-ical activities in the catalyst layer, where the following electro-chemical reaction takes place
O2 þ 4e� þ 4Hþ ! 2H2Oþ heat ð4Þ
The reaction consumes oxygen, protons, and electrons, and pro-duces both heat and water. Among these species, the electron andoxygen supplies rely on the GDL, while heat and water are removedvia both GDL and the electrolyte membrane. In addition, the elec-tronic current is conducted through the solid matrix of carbon fi-bers, oxygen and water transport in the void, while heat transferoccurs in both phases. When excess water is present, liquid waterwill emerge, flooding the electrode and GDL. Two-phase (liquid–gas) transport in fuel cell GDL is a complex phenomenon. It hasbeen widely investigated in fuel cell literature, mostly in the macro-
scopic view, and the research is still on-going. In this paper, our fo-cus is placed on introduction of the combination of the stochasticmodeling and direct simulation; therefore we exclude the liquidtransport in the work. The results can benefit the study of thelow-humidity operation and transport characteristics of the carbonpaper GDL.
3.1.1. Void spaceThe void space in the GDL is mostly interconnected and allows
gas flow. In the direct simulation of GDL, a fine mesh is applied thatis able to distinguish the void and solid. In the void space, the Na-vier–Stokes equation can be applied to describe the fluid motion
@qðgÞ
@tþr � qðgÞ~uðgÞ
� �¼ 0 ð5Þ
@qðgÞ~uðgÞ
@tþr � qðgÞ~uðgÞ~uðgÞ
� �� �¼ �rPðgÞ þ r � s� ð6Þ
Note that the quantities in the above are defined at the pore level,therefore macroscopic characteristics of porosity and permeabilityno longer appear in the equation.
The void pores also provide passages for species transport. Inaddition to the convection induced by the mass flow, diffusion isa major mechanism for water and oxygen transport. At the pore le-vel of the GDL, the molecular diffusion still dominates and thetransport equations can be unified as
@Ck
@tþr � ð~uðgÞCkÞ ¼ r � ðDkrCkÞ ð7Þ
where the superscript k denotes species and the diffusion coeffi-cient Dk depends on the local condition
Dk ¼ Dk0
T353
� �3=2 1P
� �ð8Þ
Note that different to the macroscopic model no modifications ofthe diffusion coefficient are needed in the direct simulation descrip-tion. The characteristics of the GDL structure are already containedin the fine mesh of the direct simulation.
In addition, in the gaseous phase heat transfer occurs and theenergy equation reads
qðgÞcðgÞp@TðgÞ
@tþr � qðgÞcðgÞp ~uðgÞTðgÞ
� ¼ r � ðkðgÞrTðgÞÞ ð9Þ
3.1.2. Solid phaseThe solid matrix consists of the carbon fibers and binder. The
solid matrix is the media for the electron transport, which can bedescribed by
0 ¼ r � ðrsrUðsÞÞ ð10Þ
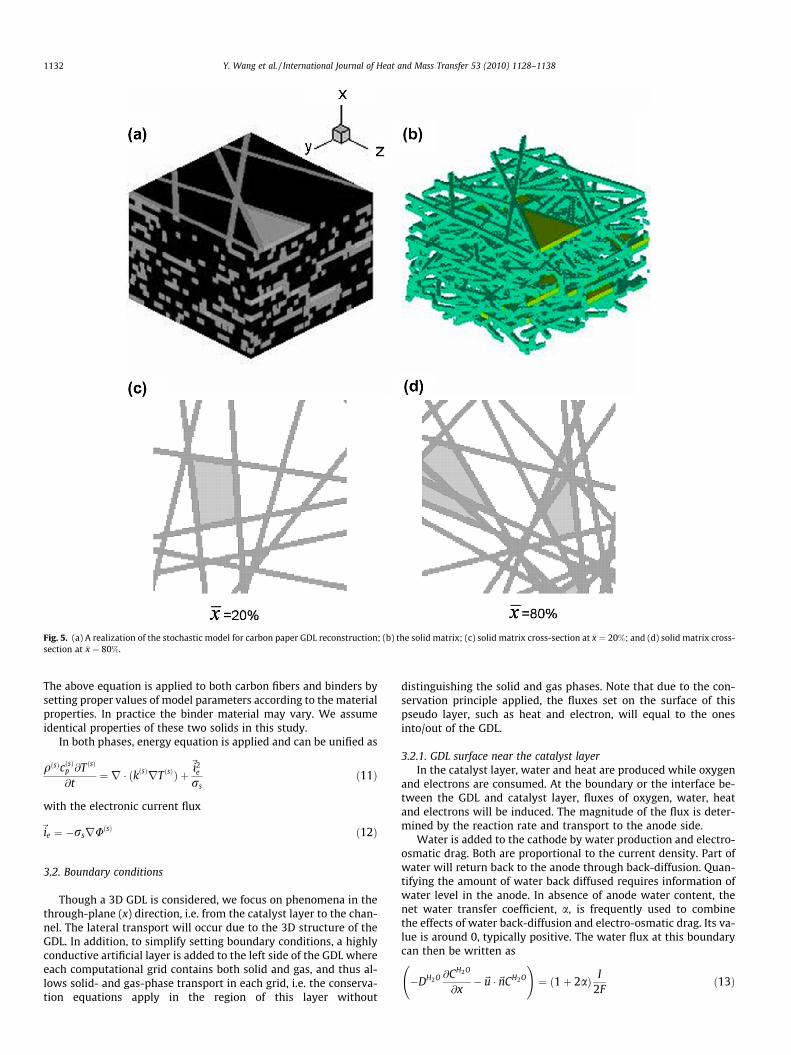
Fig. 5. (a) A realization of the stochastic model for carbon paper GDL reconstruction; (b) the solid matrix; (c) solid matrix cross-section at �x ¼ 20%; and (d) solid matrix cross-section at �x ¼ 80%.
1132 Y. Wang et al. / International Journal of Heat and Mass Transfer 53 (2010) 1128–1138
The above equation is applied to both carbon fibers and binders bysetting proper values of model parameters according to the materialproperties. In practice the binder material may vary. We assumeidentical properties of these two solids in this study.
In both phases, energy equation is applied and can be unified as
qðsÞcðsÞp @TðsÞ
@t¼ r � ðkðsÞrTðsÞÞ þ
~i2e
rsð11Þ
with the electronic current flux
~ie ¼ �rsrUðsÞ ð12Þ
3.2. Boundary conditions
Though a 3D GDL is considered, we focus on phenomena in thethrough-plane (x) direction, i.e. from the catalyst layer to the chan-nel. The lateral transport will occur due to the 3D structure of theGDL. In addition, to simplify setting boundary conditions, a highlyconductive artificial layer is added to the left side of the GDL whereeach computational grid contains both solid and gas, and thus al-lows solid- and gas-phase transport in each grid, i.e. the conserva-tion equations apply in the region of this layer without
distinguishing the solid and gas phases. Note that due to the con-servation principle applied, the fluxes set on the surface of thispseudo layer, such as heat and electron, will equal to the onesinto/out of the GDL.
3.2.1. GDL surface near the catalyst layerIn the catalyst layer, water and heat are produced while oxygen
and electrons are consumed. At the boundary or the interface be-tween the GDL and catalyst layer, fluxes of oxygen, water, heatand electrons will be induced. The magnitude of the flux is deter-mined by the reaction rate and transport to the anode side.
Water is added to the cathode by water production and electro-osmatic drag. Both are proportional to the current density. Part ofwater will return back to the anode through back-diffusion. Quan-tifying the amount of water back diffused requires information ofwater level in the anode. In absence of anode water content, thenet water transfer coefficient, a, is frequently used to combinethe effects of water back-diffusion and electro-osmatic drag. Its va-lue is around 0, typically positive. The water flux at this boundarycan then be written as
�DH2O @CH2O
@x�~u �~nCH2O
!¼ ð1þ 2aÞ I
2Fð13Þ
Y. Wang et al. / International Journal of Heat and Mass Transfer 53 (2010) 1128–1138 1133
where F is the Faraday constant and I current density. In fuel celloperation, I may vary spatially according to local operatingcondition.
Oxygen is consumed in the cathode. In real case, a small amountof oxygen may cross the membrane reaching the anode. Neglectingthe oxygen cross-over, its flux at the boundary can be expressedaccording to its consumption rate
�DO2@CO2
@x�~u �~nCO2
!¼ � I
4Fð14Þ
In the cathode, electrons are consumed in the electrochemicalreaction in Eq. (4). The electrolyte membrane typically has an ex-tremely low electronic conductivity, therefore most studies onlyconsider electrons from the GDL side. Following the same assump-tion, the electronic current at the boundary can then be written as
�rs@UðsÞ
@x¼ I ð15Þ
Mass flows will be induced in the cathode due to the reactionactivities. Ref. [11] identifies three major mechanisms that maycontribute the mass source/sink in the gas phase. Based on theirevaluation, electro-osmatic drag and back-diffusion may play animportant role in the induced mass flow. This mass source/sink oc-curs in the catalyst layer, which, expressed as rate per volume, canbe derived as
Sm ¼ MH2Or � ðDH2O;effm rCH2OÞ þMO2
j4F�MH2O j
2F�MH2Or
� nd
Fi*
p
� �ð16Þ
where j is the transfer current density and ip
*
the protonic currentflux. j also varies from place to place including across the catalystlayer [37]. An integral can be taken for the above equation acrossthe catalyst layer to obtain the surface flux. Again by adopting thenet water transfer coefficient a, the mass flux can be set
�q~u �~n ¼ I2F
MH2 þ aIF
MH2O� �
ð17Þ
The produced heat is taken away from the electrode via theGDL. Most of heat is generated in the cathode due to the irrevers-ible process. Other heating mechanisms such as Joule heat arisingfrom the ionic resistance and anode reaction heat also occur in theMEA. The heat in the MEA is removed via both anode and cathodeGDLs. Assuming half of the heat enters the cathode GDL, theboundary condition for energy equation can be written as
�k@T@x�~u �~nqCpT ¼ 1
2ðEo� VcellÞI ð18Þ
where Eo is defined as � D�h2F and represents the EMF (electromotive
force) that all the energy from hydrogen/oxygen, the ‘calorific va-lue’, heating value, or enthalpy of formation, were transformed intoelectrical energy with water vapor as the reaction product.
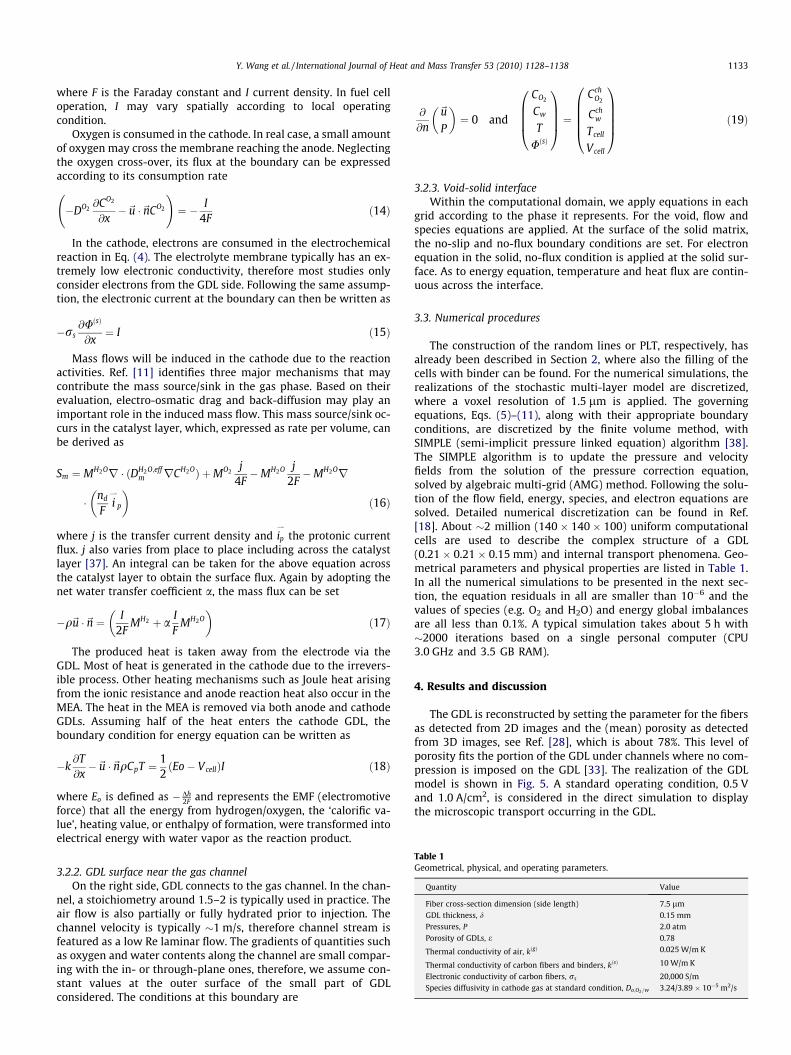
Table 1Geometrical, physical, and operating parameters.
Quantity Value
Fiber cross-section dimension (side length) 7.5 lmGDL thickness, d 0.15 mmPressures, P 2.0 atm
Porosity of GDLs, e 0.78
Thermal conductivity of air, kðgÞ 0.025 W/m K
Thermal conductivity of carbon fibers and binders, kðsÞ 10 W/m K
Electronic conductivity of carbon fibers, rs 20,000 S/mSpecies diffusivity in cathode gas at standard condition, Do;O2=w 3.24/3.89 � 10�5 m2/s
3.2.2. GDL surface near the gas channelOn the right side, GDL connects to the gas channel. In the chan-
nel, a stoichiometry around 1.5–2 is typically used in practice. Theair flow is also partially or fully hydrated prior to injection. Thechannel velocity is typically �1 m/s, therefore channel stream isfeatured as a low Re laminar flow. The gradients of quantities suchas oxygen and water contents along the channel are small compar-ing with the in- or through-plane ones, therefore, we assume con-stant values at the outer surface of the small part of GDLconsidered. The conditions at this boundary are
@
@n
~u
P
� �¼ 0 and
CO2
Cw
T
UðsÞ
0BBB@
1CCCA ¼
CchO2
Cchw
Tcell
Vcell
0BBBB@
1CCCCA ð19Þ
3.2.3. Void-solid interfaceWithin the computational domain, we apply equations in each
grid according to the phase it represents. For the void, flow andspecies equations are applied. At the surface of the solid matrix,the no-slip and no-flux boundary conditions are set. For electronequation in the solid, no-flux condition is applied at the solid sur-face. As to energy equation, temperature and heat flux are contin-uous across the interface.
3.3. Numerical procedures
The construction of the random lines or PLT, respectively, hasalready been described in Section 2, where also the filling of thecells with binder can be found. For the numerical simulations, therealizations of the stochastic multi-layer model are discretized,where a voxel resolution of 1.5 lm is applied. The governingequations, Eqs. (5)–(11), along with their appropriate boundaryconditions, are discretized by the finite volume method, withSIMPLE (semi-implicit pressure linked equation) algorithm [38].The SIMPLE algorithm is to update the pressure and velocityfields from the solution of the pressure correction equation,solved by algebraic multi-grid (AMG) method. Following the solu-tion of the flow field, energy, species, and electron equations aresolved. Detailed numerical discretization can be found in Ref.[18]. About �2 million (140 � 140 � 100) uniform computationalcells are used to describe the complex structure of a GDL(0.21 � 0.21 � 0.15 mm) and internal transport phenomena. Geo-metrical parameters and physical properties are listed in Table 1.In all the numerical simulations to be presented in the next sec-tion, the equation residuals in all are smaller than 10�6 and thevalues of species (e.g. O2 and H2O) and energy global imbalancesare all less than 0.1%. A typical simulation takes about 5 h with�2000 iterations based on a single personal computer (CPU3.0 GHz and 3.5 GB RAM).
4. Results and discussion
The GDL is reconstructed by setting the parameter for the fibersas detected from 2D images and the (mean) porosity as detectedfrom 3D images, see Ref. [28], which is about 78%. This level ofporosity fits the portion of the GDL under channels where no com-pression is imposed on the GDL [33]. The realization of the GDLmodel is shown in Fig. 5. A standard operating condition, 0.5 Vand 1.0 A/cm2, is considered in the direct simulation to displaythe microscopic transport occurring in the GDL.

1134 Y. Wang et al. / International Journal of Heat and Mass Transfer 53 (2010) 1128–1138
Fig. 6 shows the velocity distributions at three typical locations.It can be seen that the local velocity can reach �0.001 m/s causedby the mass addition in the cathode, mostly velocity is order-of-magnitude smaller, which is consistent with the prediction bythe macroscopic models [11,18]. The carbon fibers are 7.5 lm indiameter, therefore the flow can easily go around the fibers. How-ever, the binders are typically flat connecting fibers and have muchlarger blocking areas than a single fiber, forcing the flow to go hor-izontally/laterally. Strong flows are indicated near the interstitialspace primarily due to blockage of the binders. This figure alsoindicates that the flow is highly non-uniform due to the stochasticmicrostructure of the GDL. Despite that local flow may reach0.003 m/s, the induced convective transport of species is weakcomparing with the diffusion as indicated by the local Pecletnumber
Pe ¼ udGDL
Dg< 0:1 ð20Þ
In addition, through the average pressure drop one can obtain thethrough-plane permeability K of 3.1 � 10�12 m2 for this part of por-ous media using the Darcy’s law
~u ¼ �KlrP ð21Þ
This value is consistent with that used in the literature [6,18,39] andis slightly lower than the one calculated from the Carman–Kozenymodel primarily due to the role of the binder
K ¼ e3
180ð1� eÞ2d2 ð22Þ
In addition, Fig. 7 displays the flow distributions for two differ-ent net water transfer coefficients, a ¼ 0:5 and � 0:5. At the caseof a ¼ 0:5, more water mass is added to the cathode, which mayhappen at the beginning of the cathode channel when dry condi-tion is applied in the cathode while the anode is fed with hydrogenat high humidification. Such an example can be found in Ref. [11].Due to the increased mass addition, the magnitude of the inducedvelocity is significantly increased (over 5 times). This is also consis-
Fig. 6. Flow fields at different portions of the GDL for a ¼ 0:05: (a) �z ¼ 0:25; (b) �z ¼ 0:5; agray region denotes the solid with the light gray being the carbon fibers and the dark t
tent with the conclusion from Ref. [11], which shows that wateractivity plays vital role in the mass flow in GDLs. Despite of theflow magnitude, the flow direction varies little. For the other case,i.e. a ¼ �0:5, the flow reverses with slightly smaller magnitude inits velocity. The case of a negative a frequently happens for thecounter flow near the cathode outlet and anode inlet, where abun-dance of produced water can diffuse to the anode to humidify thedry hydrogen. As mass is withdrawn in the cathode in this case, theflow will be promoted from the channel to the catalyst layer. As theflow conductance is determined by the structure of solid matrixwhich is the same as the case of the positive a, the flow distribu-tion is similar to Fig. 7(a) except the direction.
Fig. 8 shows the temperature distributions at the three locationsof the GDL. As the thermal conductivity of the solid matrix is sev-eral-order-of-magnitude higher than the air, heat conductionmostly takes place via the randomly placed fibers. Therefore, tem-perature varies in all the directions (x, y, and z directions) as indi-cated in this figure. In addition, the temperature variation withinthe local pore 4Td is �0.2 K. The locations of carbon fibers areindistinguishable from voids in the contours. This can be explainedby the small pore dimension and negligible convection in the gasphase. Note that the temperature variation through the GDL, thesystem level 4TL, is only �1 K, which is comparable to the poreone 4Td, raising the concern of local thermal equilibrium [26]. Inaddition, the4TL of �1 K is consistent with our previous predictionand analysis [14,22].
Fig. 9 shows the oxygen concentration contours in the void. Asmall variation of the oxygen content, �1 mol/m3, in thethrough-plane direction is indicated. In addition, a low oxygenconcentration appears in the lower-left corner of Fig. 9(a), whichcan be explained by the local binder blockage (see Fig. 6(a)). Sim-ilar contours can be drawn for water vapor concentration exceptthat the gradients reverse. Also from the structure of the diffusionmedia it is evident that the tortuosity of the pore space is muchsmaller than that of the solid matrix. This characteristic can be de-fined as the ratio of the mean effective path length through thepore space of a porous material and the material thickness[40,41]. In the literature, the tortuosity is usually described as aproperty of porous media, defined as the ratio of the actual path
nd (c) �z ¼ 0:75. �z is the dimensionless distance in z direction ranging from 0 to 1. Thehe binders.

Fig. 7. Flow fields at the portion (�z ¼ 0:5) of the GDL for (a) a ¼ 0:5 and (b) a ¼ �0:5.
Fig. 8. Temperature contours at different portions of the GDL for a ¼ 0:05: (a) �z ¼ 0:25; (b) �z ¼ 0:5; and (c) �z ¼ 0:75. �z is the dimensionless distance in z direction.
Y. Wang et al. / International Journal of Heat and Mass Transfer 53 (2010) 1128–1138 1135
length through the pores to the shortest distance between twopoints, which lowers in combination with the porosity the effectivemass transport in the medium
Dk;effg ¼ e
sDk
g ð23Þ
The above formula was suggested from the straight-capillary-tubemodel [42] and volume averaging [43]. Note that several empiricaland analytical relations between the porosity and the tortuosity ex-ist because in contrast to the porosity the tortuosity can not be
measured directly [44]. Another relationship Dk;effg ¼ e
s2 Dkg as indi-
cated from the incline-capillary-tube model [45] is also frequentlyused [46,47]. Furthermore, it was shown that the tortuosity maybe a function of the temperature, the diffusing species and the pres-sure [40,48]. Besides this, Sharratt and Mann [49] indicated that thetortuosity may depend on the Thiele modulus if reactions take placeinside the porous structures (which is not the case here). Therefore,the tortuosity as defined in Eq. (23) is not a unique defined materialconstant but a parameter which takes into account several effects.For this reason we would like to name the tortuosity defined above

Fig. 9. Oxygen distributions at different portions of the GDL for a ¼ 0:05: (a) �z ¼ 0:25; (b) �z ¼ 0:5; and (c) �z ¼ 0:75. �z is the dimensionless distance in z direction.
1136 Y. Wang et al. / International Journal of Heat and Mass Transfer 53 (2010) 1128–1138
as a ‘‘transport-based” tortuosity which takes into account thedynamics of the gas transport. In contrast to this in Ref. [36] tortu-osity is introduced as a (uniquely defined) local material character-istic which was calculated based on the stochastic model of the GDL.It is also worthy to note that the ‘‘transport-based” tortuosity is ofsignificance when dealing with transport phenomena in the GDL.
Due to the anisotropic GDL material the tortuosity differs inthrough-plane and the in-plane directions. We will focus here onthe through-plane one. The ‘‘transport-based” through-plane tor-tuosity as calculated with the direct simulation results in an aver-age value of s = 1.2. (Notice, that only a small cutout with a smallamount of binder was considered.) This is in good agreement withthe calculations presented in Ref. [53]. They also examined Toraymaterial but used a slightly different model for the material. Theysimulated the mass transport using the Lattice–Boltzmann tech-nique. In order to determine the tortuosity they computed the flowpath length and averaged over the actual lengths of the flow linesand the flow lines weighted by flux, respectively. Both methods re-sulted in values which are very close to each other, the fluxweighted tortuosity slightly lower. As can be seen in Fig. 11 ofRef. [53] the calculated tortuosity is about s = 1.19.
Considering the tortuosity as defined in [36] and calculating itsvalue from geometric arguments as was done in Ref. [36] results inslightly higher values. The tortuosities were calculated in three dif-ferent ways. In the first case the tortuosity was calculated as theshortest pathways from one side to the other side which resultsin a mean value of s = 1.73. In the other two cases these pathwayswere weighted with the capacity (s = 1.71) and the area (s = 1.73),respectively.
Only for comparison the well-known Bruggemann equationwould result in s = 1.13 but this relation is unsuitable for describ-ing this kind of porous structure (see e.g. [41]). Overall it can besaid, that all calculated tortuosities are in the same order of mag-nitude, the tortuosities calculated from pure geometric argumentsshow the highest values. The reason for the deviations is due to thedifferent calculation procedures. The direct simulation (and theLattice–Boltzmann simulation) calculate the tortuosity with thehelp of mass transport processes in the fibrous structure and aretherefore directly linked to the standard definition of the tortuosity
but the information about the structure of the material underobservation is limited.
If calculating the tortuosity from pure geometric argumentsusing the weighted graph of the pore structure, one gets informa-tion about the structure of the material (e.g. tortuosity distribu-tion) but the results are not directly linked to mass transport. Inorder to link the two tortuosities together further examinationsare necessary which are beyond the scope of this paper.
In addition, several studies report utilizing electrical propertiesin the study of flow through porous media [50,51]. The MacMullinnumber is defined to measure the ratio of resistance of the porousmedia saturated with an electrolyte to the bulk resistance of the
same electrolyte [50,51], i.e. Dkg
Dk;effg
for a specific species. This ratio
was also called the formation resistivity factor in an earlier workby Archie [52]. In Eq. (23), the MacMullin number is implicitly de-fined as s
e, and its value from the direct simulation is �1.6 for thecarbon paper considered.
Fig. 10 shows the oxygen and temperature profiles at the crossline of the mid-planes in z and x directions for botha ¼ 0:05 and 0:5. These two cases indicate similar flow distribu-tion but with quite different magnitudes. For the oxygen, the con-centration along this line shows a small variation in each case,which is attributed to the diffusion that dominates the mass trans-port. The random solid matrix either leads to blockage of the diffu-sion or varies local flow, leading to fluctuation of oxygenconcentration from place to place. The case of the higher a showsa lower oxygen profile. This can be explained by the fact that ahigher a induces a stronger flow towards the gas channel (seeFigs. 6(b) and 7(a)). Note that the convection by the flow is againstthe direction of oxygen diffusion for the reaction. Again the differ-ence is small (�0.1 mol/m3) due to the relatively weak convectionforce. Fig. 10(b) presents the temperature profiles, showing thetwo are very close with the case of a ¼ 0:5 slightly lower. This isdue to the fact that the flow from the electrode delivers thermalenergy therefore helps heat removal, however the amount is smalland most is still removed by the highly conductive carbon fiber.Temperature variation near the solid–gas interface is moderate,indicating little heat is transferred between two phases partly

Fig. 11. Electronic phase potential distributions at different portions of the GDL for a ¼ 0:05: (a) �z ¼ 0:25; (b) �z ¼ 0:5; and (c) �z ¼ 0:75, where �z is the dimensionless distancein z direction ranging from 0 to 1.
=0.5
=0.05
αα
Solid matrix location
y0 0.2 0.4 0.6 0.8 111.4
11.5
11.6
11.7
11.8
11.9
=0.05
y
O2
conc
entra
tion
(mol
/m3 )
(a)
V3
V3=0.5=0.05
αα
Solid matrix location
y
Tem
pera
ture
(K)
V3
V3=0.5=0.05
αα V3
0 0.2 0.4 0.6 0.8 1353.2
353.4
353.6
353.8
354
354.2
V3=0.5=0.05
y
(b)
αα
Fig. 10. Distributions of quantities at the cross line of the planes �z ¼ 0:5 and �x ¼ 0:5: (a) the oxygen concentration and (b) temperature. �z and �x are the dimensionlessdistances in z and x directions, respectively.
Y. Wang et al. / International Journal of Heat and Mass Transfer 53 (2010) 1128–1138 1137
due to the small gas heat capacity. However, the gas temperature islargely affected by the neighboring carbon fiber due to the smallscale of the pore.
Fig. 11 displays the electronic phase potential distributions inthe solid matrix at the three locations. Though the figure showsdisconnected solid matrix, the fibers are connected in the 3D struc-ture. A small but discernible drop of the electronic phase potentialcan be observed from the electrode side to the channel. This is be-cause though the carbon fiber is a good thermal conductor, thehighly tortuous nature of the solid matrix leads to non-negligibleohmic resistance. Similar to oxygen transport in the pore, electrontransport totally relies on the highly tortuous solid matrix. Thehigh tortuosity arises from the fact that the fibers are arranged inthe in-plane direction and the through-plane conduction only oc-curs at the joint points of fibers. By applying a similar approach
as Eq. (23) reffs ¼ ð1�eÞ
ssrs
� , the tortuosity ss is 13.8 for the solid ma-
trix. Again from previous discussion, this tortuosity is referred tothe ‘‘transport-based” one and may slightly deviate from the mate-rial intrinsic property. Further, the obtained tortuosity is for thethrough-plane transport, which may be different with the in-planeone as the carbon paper is anisotropic. Ref. [6] indicates that thethrough-plane conductivity is an-order-of-magnitude lower thanthe in-plane one. This figure shows that the unique structure ofthe carbon paper, the high through-plane tortuosity, may be a ma-jor reason for the relatively lower conductivity in the through-plane direction.
5. Conclusions
This paper combined the stochastic modeling for reconstructionof microstructure of GDLs and direct simulation for study of themass transport at the pore level. A stochastic model was applied

1138 Y. Wang et al. / International Journal of Heat and Mass Transfer 53 (2010) 1128–1138
for the carbon-paper-based GDL, which models the GDL as a stackof thin sections with each section described by planar two-dimen-sional random line tessellations extended to three dimensions bydilation. The direct simulation was then introduced to the recon-structed GDL structure to simulate the flow and species transportin the void, electronic current conduction in the solid matrix, andheat transfer in both phases. Standard conditions of fuel cells areconsidered in the simulation. Distributions of the flow, species con-centration, temperature, and electronic phase potential in the GDLare presented at the pore level. Simulation results indicated thatthe through-plane tortuosity of the solid matrix is an-order-of-magnitude larger than the one of the pore structure. The predictedvalues of tortuosity and permeability are in good agreement withthe ones in the literature. In addition, diffusion dominates the spe-cies transport in the pore even at high values of net water transfercoefficient. The developed numerical tools can be applied to inves-tigate the pore-level phenomena within the carbon-paper-basedGDL. Future study includes investigation of the different realiza-tions of porous materials which allows a statistical analysis ofthe numerical simulation results and the influence of the compres-sion over the GDL on in-plane and through-plane mass transport.
Acknowledgements
This research has been supported by the Faculty Career Devel-opment Award at UCI and the German Federal Ministry for Educa-tion and Science (BMBF) under Grant No. 03SF0324.
References
[1] M.L. Perry, T.F. Fuller, Conjugated and Fullerene-Containing Polymers forElectronic and Photonic Applications: Advanced Syntheses andMicrolithographic Fabrications, J. Electrochem. Soc. 149 (2002) S59–S67.
[2] J. Larminie, A. Dicks, Fuel Cell Systems Explained, second ed., John Wiley &Sons, 2003.
[3] C.Y. Wang, Fundamental models for fuel cell engineering, Chem. Rev. 104(2004) 4727–4765.
[4] P. Costamagna, S. Srinivasan, Quantum jumps in the PEMFC science andtechnology from the 1960s to the year 2000: Part I. Fundamental scientificaspects, J. Power Sources 102 (2001) 242–252.
[5] P. Costamagna, S. Srinivasan, Quantum jumps in the PEMFC science andtechnology from the 1960s to the year 2000: Part II. Engineering, technologydevelopment and application aspects, J. Power Sources 102 (2001) 253–269.
[6] M. Mathias, J. Roth, J. Fleming, W. Lehnert, Diffusion Media Materials andCharacterization, in: W. Vielstich, H. Gasteiger, A. Lamm (Eds.), Handbook ofFuel Cells: Fundamentals Technology and Applications, vol. 3, John Wiley &Sons, 2003.
[7] C.H. Hartnig, L. Jörissen, J. Kerres, W. Lehnert, J. Scholta, Polymer electrolytemembrane fuel cells (PEMFC), in: M. Gasik (Ed.), Materials for Fuel Cells,Woodhead Publishing Limited, 2008.
[8] J.S. Yi, T.V. Nguyen, Multi-Component Transport in Porous Electrodes in ProtonExchange Membrane Fuel Cells Using the Interdigitated Gas Distributors, J.Electrochem. Soc. 146 (1999) 38.
[9] Y. Wang, C.Y. Wang, Simulations of Flow and Transport Phenomena in aPolymer Electrolyte Fuel Cell under Low-Humidity Operations, J. PowerSources 147 (2005) 148.
[10] S. Dutta, S. Shimpalee, J.W. Van Zee, Three-dimensional numerical simulationof straight channel PEM fuel cells, J. Appl. Electrochem. 30 (2000) 135.
[11] Y. Wang, C.Y. Wang, Modeling Polymer Electrolyte Fuel Cells with LargeDensity and Velocity Changes, J. Electrochem. Soc. 152 (2) (2005) A445.
[12] S. Mazumder, J.V. Cole, Rigorous 3-D mathematical modeling of PEM fuel cells,J. Electrochem. Soc. 150 (2003) 1503.
[13] J.J. Hwang, Thermal-electrochemical modelling porous electrodes of a PEMfuel cell, J. Electrochem. Soc. 153 (2006) A216.
[14] Y. Wang, C.Y. Wang, A Non-Isothermal, Two-Phase Model for PolymerElectrolyte Fuel Cells, J. Electrochem. Soc. 153 (2006) A1193.
[15] E. Birgersson, M. Noponen, M. Vynnycky, Analysis of a Two-Phase Non-Isothermal Model for a PEFC, J. Electrochem. 152 (2005) A1021.
[16] U. Pasaogullari, C.Y. Wang, Two-phase transport and the role of microporouslayer in Polymer Electrolyte Fuel Cells, J. Electrochem. Soc. 151 (2004) A399.
[17] J.-H. Nam, M. Kaviany, Effective diffusivity and water-saturation distributionin single- and two-layer PEMFC diffusion medium, Int. J. Heat Mass Transfer 46(2003) 4595.
[18] Y. Wang, Modeling of two-phase transport in the diffusion media of polymerelectrolyte fuel cells, J. Power Sources 185 (2008) 261–271.
[19] D.M. Bernardi, M.W. Verbrugge, A Mathematical Model of the Solid-Polymer-Electrolyte Fuel Cell, J. Electrochem. Soc. 139 (1992) 2477.
[20] H. Meng, C.Y. Wang, Electron transport in PEFCs, J. Electrochem. Soc. 151(2004) A358.
[21] H. Meng, A three-dimensional PEM fuel cell model with consistent treatmentof water transport in MEA, J. Power Sources 162 (2006) 426.
[22] Y. Wang, Analysis of the Key Parameters in the Cold Start of PolymerElectrolyte Fuel Cells, J. Electrochem. Soc. 154 (2007) B1041–B1048.
[23] P.P. Mukherjee, C.Y. Wang, Stochastic Microstructure Reconstruction andDirect Numerical Simulation of the PEFC Catalyst Layer, J. Electrochem. Soc.153 (2006) A840.
[24] M. Piller, G. Schena, M. Nolich, S. Favretto, F. Radaelli, E. Rossi, Analysis ofHydraulic Permeability in Porous Media: From High Resolution X-rayTomography to Direct Numerical Simulation, Transp. Porous Media 80(2009) 57.
[25] V.P. Schulz, P.P. Mukherjee, J. Becker, A. Wiegmann, C.Y. Wang, NumericalEvaluation of Effective Gas Diffusivity - Saturation Dependence ofUncompressed and Compressed Gas Diffusion Media in PEFCs, ECS Trans. 3(2006) 1069.
[26] M. Kaviaty, Principles of Heat Transfer in Porous Media, second ed., Springer,1999.
[27] M. Kaviany, Principles of Convective Heat Transfer, second ed., Springer, 2001.[28] R. Thiedmann, F. Fleischer, Ch. Hartnig, W. Lehnert, V. Schmidt, Stochastic
3Dmodeling of the GDL structure in PEM fuel cells based on thin sectiondetections, J. Electrochem. Soc. 155 (2008) B391–B399.
[29] V.P. Schulz, J. Becker, A. Wiegmann, P.P. Mukherjee, C.-Y. Wang, Modeling ofTwo-phase Behavior in the Gas Diffusion Medium of Polymer Electrolyte FuelCells via Full Morphology Approach, J. Electrochem. Soc. 154 (4) (2007) B419–B426.
[30] G. Inoue, Y. Matsukuma, M. Minemoto, in: Proceedings of the Second EuropeanFuel Cell Technology and Applications Conference, EFC2007-39024, 2007.
[31] M. Yoneda, M. Takimoto, S. Koshizuka, ECS Trans. 11 (2007) 629–635.[32] G. Inoue, T. Yoshimoto, Y. Matsukuma, M. Minemoto, Development of
simulated gas diffusion layer of polymer electrolyte fuel cells and evaluationof its structure, J. Power Sources 175 (2008) 145–158.
[33] J.T. Gostick, M.W. Fowler, M.A. Ioannidis, M.D. Pritzker, Y.M. Volfkovich, A.Sakars, Capillary pressure and hydrophilic porosity in gas diffusion layers forpolymer electrolyte fuel cells, J. Power Sources 156 (2006) 375–387.
[34] R. Schneider, W. Weil, Stochastic and Integral Geometry, Springer, Berlin,2008.
[35] D. Stoyan, W.S. Kendall, J. Mecke, Stochastic Geometry and its Applications,second ed., John Wiley & Sons, Chichester, 1995.
[36] R. Thiedmann, Ch. Hartnig, I. Manke, V. Schmidt, W. Lehnert, J. Electrochem.Soc. 156 (11) (2009) B1339–B1347.
[37] Y. Wang, X. Feng, Analysis of Reaction Rates in the Cathode Electrode ofPolymer Electrolyte Fuel Cells Part I: Single-Layer Electrodes, J. Electrochem.Soc. 155 (12) (2008) B1289–B1295.
[38] S.V. Patankar, Numerical Heat Transfer and Fluid Flow, Hemisphere, New York,1980.
[39] J.P. Feser, A.K. Prasad, S.G. Advani, Experimental characterization of in-planepermeability of gas diffusion layers, J. Power Sources 162 (2006) 1226–1231.
[40] F. Keil, Diffusion und Chemische Reaktionen in der Gas/Feststoff–Katalyse,Springer, Berlin, 1999.
[41] L. Shen, Z. Chen, Critical review of the impact of tortuosity on diffusion, Chem.Eng. Sci. 62 (2007) 3748–3755.
[42] M.R.J. Wyllie, M.B. Spangler, Application of electrical resistivity measurementsto problem of fluid flow in porous media, Am. Assoc. Pet. Geol. Bull. 36 (1952)359.
[43] S. Liu, J.H. Masliyah, in: K. Vafai (Ed.), Handbook of Porous Media, CRC Press,Boca Raton, FL, 2005, pp. 81–140.
[44] Y.S. Wua, L.J. van Vliet, H.W. Frijlink, K. van der Voort Maarschalk, Thedetermination of relative path length as a measure for tortuosity in compactsusing image analysis, Eur. J. Pharm. Sci. 28 (2006) 433–440.
[45] D. Cornell, D.L. Katz, Flow of gases through consolidated porous media, Ind.Eng. Chem. 45 (1953) 2145.
[46] K.M. Abraham, Directions in secondary lithium battery research anddevelopment, Electrochim. Acta 38 (1993) 1233.
[47] D. Djian, F. Alloin, S. Martinet, H. Lignier, J.Y. Sanchez, Lithium-ion batterieswith high charge rate capacity: Influence of the porous separator, J. PowerSources 172 (2007) 416.
[48] S.K. Bhatia, Stochastic theory of transport in inhomogeneous media, Chem.Eng. Sci. 41 (1986) 1311.
[49] P.N. Sharratt, R. Mann, Some observations on the variation of tortuosity withThiele modulus and pore size distribution, Chem. Eng. Sci. 42 (7) (1987) 1565–1576.
[50] R.B. MacMullin, G.A. Muccini, Characteristics of porous beds and structures,AIChE J. 2 (1956) 393.
[51] M.J. Martinez, S. Shimpalee, J.W. Van Zee, Measurement of MacMullinNumbers for PEMFC Gas-Diffusion Media, J. Electrochem. Soc. 156 (2009) B80.
[52] G.E. Archie, The electrical resistivity log as an aid in determining somereservoir characteristics, Trans. Am. Inst. Min. Metall. Pet. Eng. 146 (1942) 54.
[53] L. Hao, P. Chen, Lattice Boltzmann simulations of anisotropic permeabilities incarbon paper gas diffusion layers, J. Power Sources 186 (2009) 104–114.