Embed Size (px)
Citation preview
International Journal of Heat and Mass Transfer 76 (2014) 337–349
Contents lists available at ScienceDirect
International Journal of Heat and Mass Transfer
journal homepage: www.elsevier .com/locate / i jhmt
An experimental study of density ratio effects on the film coolinginjection from discrete holes by using PIV and PSP techniques
http://dx.doi.org/10.1016/j.ijheatmasstransfer.2014.04.0280017-9310/� 2014 Elsevier Ltd. All rights reserved.
⇑ Corresponding author. Tel.: +1 515 294 0094.E-mail address: [email protected] (H. Hu).
Blake Johnson, Wei Tian, Kai Zhang, Hui Hu ⇑Department of Aerospace Engineering, Iowa State University, Ames, IA 50011-2271, United States
a r t i c l e i n f o a b s t r a c t
Article history:Received 11 December 2013Received in revised form 11 April 2014Accepted 14 April 2014
Keywords:Film cooling of turbine bladesCooling effectiveness quantificationEffects of coolant-to-mainstream densityratioPIV measurementsPSP techniqueMass transfer analog
An experimental study was conducted to investigate the performance of film cooling injection from a rowof circular holes spaced laterally across a flat test plate. While a high-resolution Particle Image Velocime-try (PIV) system was used to conduct detailed flow field measurements to quantify the dynamic mixingprocess between the coolant jet stream and the mainstream flows, Pressure Sensitive Paint (PSP) tech-nique was used to map the corresponding adiabatic film cooling effectiveness on the surface of interestbased on a mass-flux analog to traditional temperature-based cooling effectiveness measurements. Thecooling effectiveness data of the present study were compared quantitatively against those deriveddirectly from the temperature-based measurements under the same or comparable test conditions inorder to validate the reliability of the PSP technique. The effects of the coolant-to-mainstream densityratio (DR) on the film cooling effectiveness were investigated by performing experiments at fixed blowingratios by using either Nitrogen (DR = 0.97) or CO2 (DR = 1.53) as the coolant streams for the PSP measure-ments. An accompanying analysis of scaling quantities, such as the coolant-to-mainstream momentumflux ratio, I, and bulk coolant-to-mainstream velocity ratio, VR, in addition to the most-commonly usedblowing ratio (i.e., the coolant-to-mainstream mass flux ratio), M, was also conducted to illuminate theextent to which the flow scenario can be described using purely kinematic or dynamic means. It wasfound that the scaling quantities that give more weight to density ratio (i.e., blowing ratio, M, and thenmomentum ratio, I) have more success to collapse measurement data from varying density ratio of thecoolant flows for the cases with relatively low coolant flow rates, while the coolant-to-mainstream bulkvelocity ratio, VR, may be used with some success to scale the film cooling effectiveness for the cases withhigher coolant flow rates.
� 2014 Elsevier Ltd. All rights reserved.
1. Introduction
There is a great incentive to maximize the efficient operation ofgas turbine engines for both economic and environmental reasons.As global transportation demands lean increasingly upon the use ofsuch engines, large savings can be attained by even a marginalimprovement in any of the systems that they rely on to function.Thermodynamic analysis reveals that thermal efficiency and poweroutput of a gas turbine engine can be increased greatly with ahigher turbine inlet temperature. Therefore, means to protect tur-bine components from high temperatures are necessary, typicallythrough the implementation of film cooling techniques. Whileoptimization of the film cooling of turbine blades possesses thepotential for significant savings, a better understanding of the
effects of a variety of controlling parameters on the coolant filmbehavior is necessary for such optimization.
Heat transfer experiments are traditionally used to assess theeffectiveness of film cooling designs of turbine blades. Thermocou-ples were usually used to measure both fluid and surface temper-atures in the earlier heat transfer experiments. However, sincethermocouples can provide temperature measurements only atlimited discrete points, it is very difficult to achieve temperaturemeasurements (thereby, film cooling effectiveness) on the surfaceof interest with relatively high spatial and/or temporal resolutions.More recently, advanced optical-based thermometry techniquessuch as liquid crystal thermometry [1], infrared thermometry [2];laser induced fluorescence [3] and temperature sensitive paint[4], which can achieve temperature distribution measurementson the surface of interest with much higher spatial and temporalresolutions in comparison with the thermocouple-based measure-ments, have been used in both transient and steady heat transferexperiments for turbine blade cooling studies. It should be noted
338 B. Johnson et al. / International Journal of Heat and Mass Transfer 76 (2014) 337–349
that, although useful information has been revealed from the heattransfer experiments with thermal-based measurements to exam-ine the effectiveness of the film cooling designs of turbine blades,there always exists concerns and implications about the measure-ment uncertainties of the adiabatic temperature distributions onthe surface of interest due to the effects of heat conduction throughthe test models in those heat transfer experiments.
Instead of conducting heat transfer experiments to measure thetemperature distributions on the surface of interest, it is becomingincreasingly popular to measure the film cooling effectiveness byconducting ‘‘cold’’ experiments with the Pressure Sensitive Paint(PSP) technique. Through a mass transfer analogy, the adiabaticfilm cooling effectiveness can be determined by measuring the dis-tribution of oxygen concentration over the surface of interest byusing the PSP technique with airflow as the mainstream flow andan oxygen-free foreign gas (e.g., nitrogen or CO2 is used in the pres-ent study) as the coolant stream at an isothermal condition [4–12].For example, Zhang and Jaiswal [5] used the PSP technique to mea-sure the surface film cooling effectiveness on the surface of a tur-bine vane endwall. Ahn et al. [6] used the PSP technique to mapthe adiabatic film cooling effectiveness distributions near a gas tur-bine blade tip. The effects of the presence of a squealer, the loca-tions of the film-cooling holes, and the tip-gap clearance on thefilm-cooling effectiveness were assessed in detail based on thequantitative PSP measurement results. Based on the PSP measure-ment results with a nitrogen stream as the coolant gas and airflowas the mainstream flow, Yang and Hu [7,8] investigated the effectsof the blowing ratio and the existence of lands on the film coolingeffectiveness of a turbine blade trailing-edge model. Similarapproaches were also used by Rallabandi et al. [9] and Wrightet al. [10,11] to study the film cooling effectiveness of the coolantstreams injected from circular and shaped holes on flat plates.Dhungel et al. [12] used the PSP technique to assess the use of sec-ondary cooling holes to counteract coolant jet vortex development,and found that the existence of the secondary cooling holes cangreatly reduce the likelihood of the coolant jet to lift away fromthe protected surface. For the PSP measurements, since experimen-tal studies were usually conducted at isothermal conditions, themeasurement results are free from the heat conduction-relatedmeasurement errors that are frequently encountered in conven-tional heat transfer-based experiments for determining the adia-batic film cooling effectiveness.
So far, the blowing rate, which refers to the ratio of mass fluxesof the coolant jet stream to the mainstream flow and is expressedas M = (qU)c/(qU)1, is generally used to characterize the behaviorof coolant jet flows and the resultant film cooling effectivenessover the surface of interest, where q indicates the fluid mass den-sity, U indicates the bulk flow velocity, and the subscripts ‘‘c’’ and‘‘1’’ indicate the coolant jet and mainstream flows, respectively. Byrewriting M = DR � VR, where DR is the density ratio of the coolantstream to the mainstream flows, and VR is the bulk velocity ratio ofthe coolant to mainstream flows, it is noted that, for a fixed blow-ing ratio M and mainstream flow conditions, an increase in densityratio, DR, requires a compensatory decrease in velocity ratio,VR = Uc/U1. Similarly, the coolant-to-mainstream momentum fluxratio, I = M2/DR, has also been used to characterize the behaviorsof coolant jets in cross flows [10,13–15]. While extensive numeri-cal and experimental studies have been conducted in recent yearsto investigate the characteristics of turbulent jets in cross flowspertinent to film cooling, very few studies can be found in litera-ture that examine what are the proper scaling quantities/parame-ters to characterize the dynamic interaction and mixing betweencoolant jets and mainstream flows and the resultant cooling effec-tiveness over the surface of interest. With this need in mind, anexplorative study was conducted in the present study to assessthe applicability of the scaling quantities, which includes the
most-commonly-used blowing ratio (i.e., coolant-to-mainstreammass flux ratio), M, the coolant-to-mainstream momentum fluxratio, I, and bulk velocity ratio, VR, in characterizing the behaviorof the coolant jet flows and the resultant film cooling effectivenessover the surface of interest in order to shed some light on theunderlying physics to discern the extent to which the dynamicinteraction and mixing of the coolant jet and mainstream flowsoccur primarily due to the kinematics of the fluid flows or due todynamic process that depend on the density disparity betweenthe coolant stream and mainstream flows.
In the present study, an experimental investigation was con-ducted to assess the performance of film cooling injection from arow of circular holes spaced laterally across a flat test plate. Inaddition to using a high-resolution Particle Image Velocity (PIV)system to achieve detailed flow field measurements to quantifythe dynamic interaction and mixing processes between the coolantjet stream and the mainstream flows, the Pressure Sensitive Paint(PSP) technique was used to map the corresponding adiabatic cool-ing effectiveness distributions on the surface of interest based on amass transfer analog to traditional thermal-based film coolingeffectiveness measurements. The cooling effectiveness data of thepresent study were compared quantitatively against those deriveddirectly from the temperature-based measurements under thesame or comparable test conditions in order to validate the reli-ability of the PSP technique as an effective experimental tool forturbine blade film cooling studies. To the best knowledge of theauthors, this is the first effort of its nature. The effects of the den-sity ratio between the coolant jet stream and mainstream flows,DR, on the behavior of the coolant jet flows as well as the resultantfilm cooling effectiveness distributions over the surface of interestwere assessed by performing ‘‘cold’’ experiments at isothermalconditions with fixed blowing ratios (i.e., coolant-to-mainstreammass flux ratios) by using N2 (DR = 0.97), air (DR = 1.00), and CO2
(DR = 1.53) for the coolant streams. An accompanying analysis ofthe scaling quantities, such as the blowing ratio M, momentum fluxratio, I, and bulk coolant-to-mainstream velocity ratio, VR, was alsoperformed. The detailed PIV flow field measurements were corre-lated with the adiabatic cooling effectiveness maps to elucidateunderlying physics in order to explore/optimize design paradigmsfor improved cooling effectiveness to protect the critical portionsof turbine blades from harsh environments.
2. The test model and experimental setup
2.1. The test model
The experimental study was conducted in a small open-circuitwind tunnel located at the Department of Aerospace Engineeringof Iowa State University. The tunnel has a test section of8.0 in. � 5.0 in. (i.e., 200 mm � 125 mm) in cross section. The wallsof the test section are optically transparent. The tunnel has a con-traction section upstream of the test section with honeycombs andscreen structures installed ahead of the contraction section to pro-vide uniform low-turbulence oncoming flow into the test section.The turbulence intensity at the inlet of the test section was foundto be about 1.5%, as measured by using a hotwire anemometer.
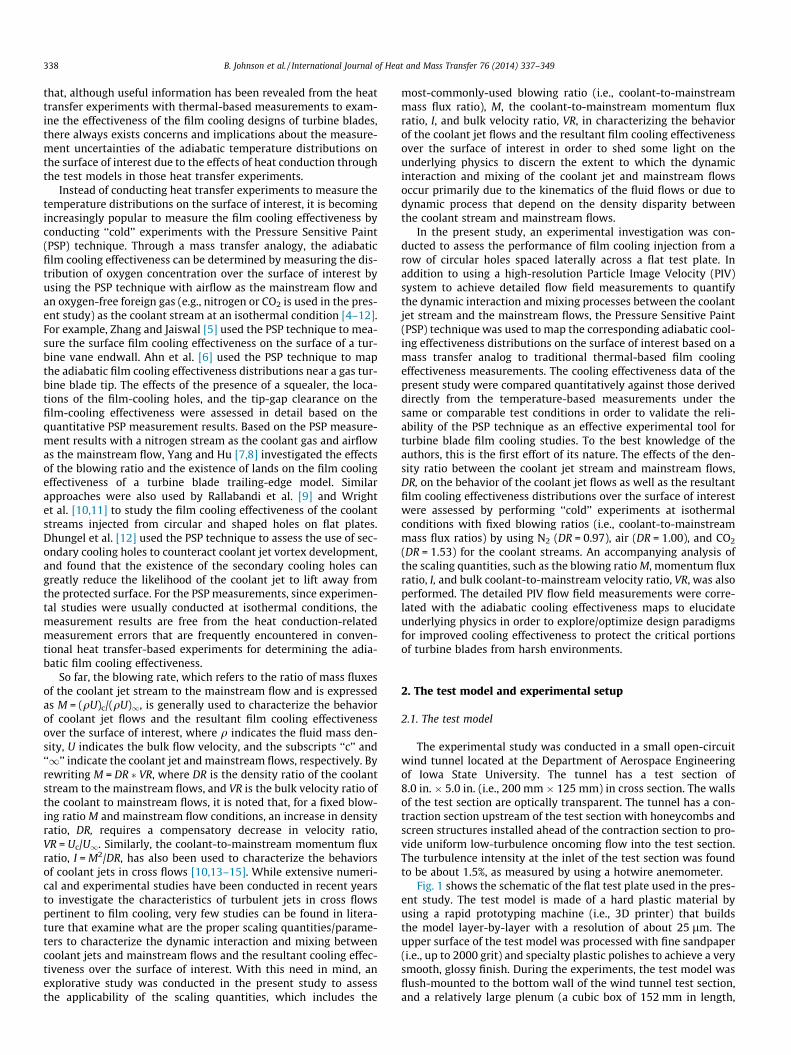
Fig. 1 shows the schematic of the flat test plate used in the pres-ent study. The test model is made of a hard plastic material byusing a rapid prototyping machine (i.e., 3D printer) that buildsthe model layer-by-layer with a resolution of about 25 lm. Theupper surface of the test model was processed with fine sandpaper(i.e., up to 2000 grit) and specialty plastic polishes to achieve a verysmooth, glossy finish. During the experiments, the test model wasflush-mounted to the bottom wall of the wind tunnel test section,and a relatively large plenum (a cubic box of 152 mm in length,
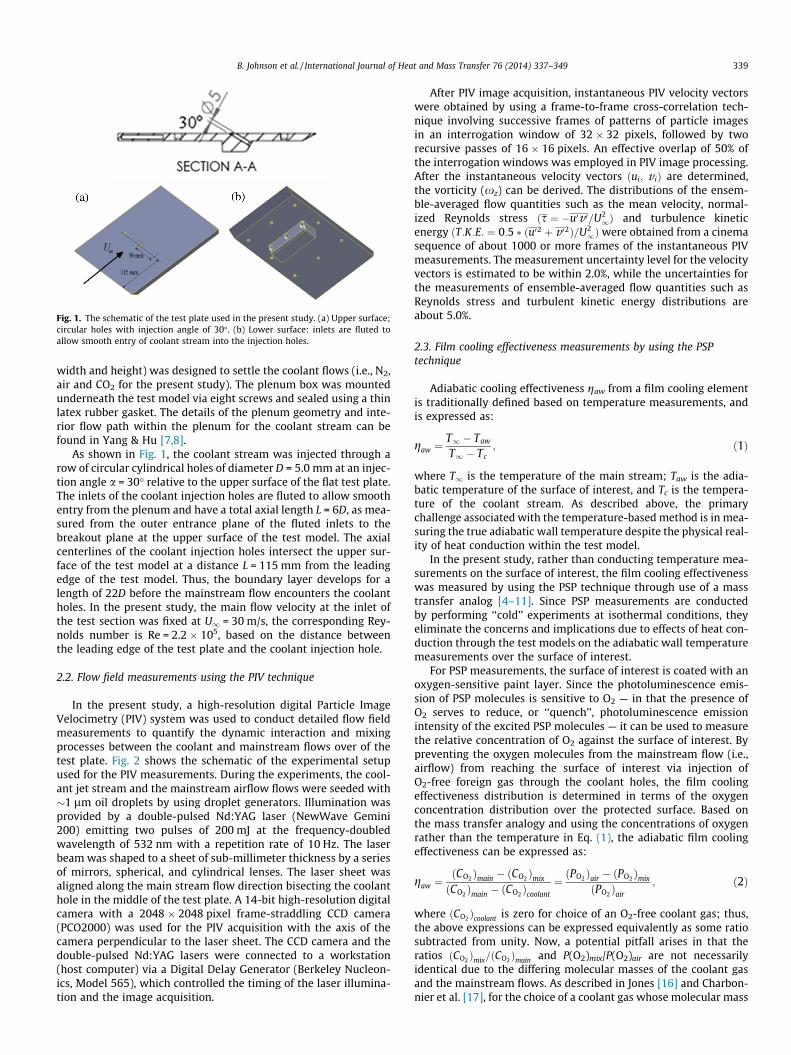
Fig. 1. The schematic of the test plate used in the present study. (a) Upper surface;circular holes with injection angle of 30�. (b) Lower surface: inlets are fluted toallow smooth entry of coolant stream into the injection holes.
B. Johnson et al. / International Journal of Heat and Mass Transfer 76 (2014) 337–349 339
width and height) was designed to settle the coolant flows (i.e., N2,air and CO2 for the present study). The plenum box was mountedunderneath the test model via eight screws and sealed using a thinlatex rubber gasket. The details of the plenum geometry and inte-rior flow path within the plenum for the coolant stream can befound in Yang & Hu [7,8].
As shown in Fig. 1, the coolant stream was injected through arow of circular cylindrical holes of diameter D = 5.0 mm at an injec-tion angle a = 30� relative to the upper surface of the flat test plate.The inlets of the coolant injection holes are fluted to allow smoothentry from the plenum and have a total axial length L = 6D, as mea-sured from the outer entrance plane of the fluted inlets to thebreakout plane at the upper surface of the test model. The axialcenterlines of the coolant injection holes intersect the upper sur-face of the test model at a distance L = 115 mm from the leadingedge of the test model. Thus, the boundary layer develops for alength of 22D before the mainstream flow encounters the coolantholes. In the present study, the main flow velocity at the inlet ofthe test section was fixed at U1 = 30 m/s, the corresponding Rey-nolds number is Re = 2.2 � 105, based on the distance betweenthe leading edge of the test plate and the coolant injection hole.
2.2. Flow field measurements using the PIV technique
In the present study, a high-resolution digital Particle ImageVelocimetry (PIV) system was used to conduct detailed flow fieldmeasurements to quantify the dynamic interaction and mixingprocesses between the coolant and mainstream flows over of thetest plate. Fig. 2 shows the schematic of the experimental setupused for the PIV measurements. During the experiments, the cool-ant jet stream and the mainstream airflow flows were seeded with�1 lm oil droplets by using droplet generators. Illumination wasprovided by a double-pulsed Nd:YAG laser (NewWave Gemini200) emitting two pulses of 200 mJ at the frequency-doubledwavelength of 532 nm with a repetition rate of 10 Hz. The laserbeam was shaped to a sheet of sub-millimeter thickness by a seriesof mirrors, spherical, and cylindrical lenses. The laser sheet wasaligned along the main stream flow direction bisecting the coolanthole in the middle of the test plate. A 14-bit high-resolution digitalcamera with a 2048 � 2048 pixel frame-straddling CCD camera(PCO2000) was used for the PIV acquisition with the axis of thecamera perpendicular to the laser sheet. The CCD camera and thedouble-pulsed Nd:YAG lasers were connected to a workstation(host computer) via a Digital Delay Generator (Berkeley Nucleon-ics, Model 565), which controlled the timing of the laser illumina-tion and the image acquisition.
After PIV image acquisition, instantaneous PIV velocity vectorswere obtained by using a frame-to-frame cross-correlation tech-nique involving successive frames of patterns of particle imagesin an interrogation window of 32 � 32 pixels, followed by tworecursive passes of 16 � 16 pixels. An effective overlap of 50% ofthe interrogation windows was employed in PIV image processing.After the instantaneous velocity vectors ðui; v iÞ are determined,the vorticity (xz) can be derived. The distributions of the ensem-ble-averaged flow quantities such as the mean velocity, normal-ized Reynolds stress ðs ¼ �u0v 0=U2
1Þ and turbulence kineticenergy ðT:K:E: ¼ 0:5 � ðu02 þ v 02Þ=U2
1Þwere obtained from a cinemasequence of about 1000 or more frames of the instantaneous PIVmeasurements. The measurement uncertainty level for the velocityvectors is estimated to be within 2.0%, while the uncertainties forthe measurements of ensemble-averaged flow quantities such asReynolds stress and turbulent kinetic energy distributions areabout 5.0%.
2.3. Film cooling effectiveness measurements by using the PSPtechnique
Adiabatic cooling effectiveness gaw from a film cooling elementis traditionally defined based on temperature measurements, andis expressed as:
gaw ¼T1 � Taw
T1 � Tc; ð1Þ
where T1 is the temperature of the main stream; Taw is the adia-batic temperature of the surface of interest, and Tc is the tempera-ture of the coolant stream. As described above, the primarychallenge associated with the temperature-based method is in mea-suring the true adiabatic wall temperature despite the physical real-ity of heat conduction within the test model.
In the present study, rather than conducting temperature mea-surements on the surface of interest, the film cooling effectivenesswas measured by using the PSP technique through use of a masstransfer analog [4–11]. Since PSP measurements are conductedby performing ‘‘cold’’ experiments at isothermal conditions, theyeliminate the concerns and implications due to effects of heat con-duction through the test models on the adiabatic wall temperaturemeasurements over the surface of interest.
For PSP measurements, the surface of interest is coated with anoxygen-sensitive paint layer. Since the photoluminescence emis-sion of PSP molecules is sensitive to O2 — in that the presence ofO2 serves to reduce, or ‘‘quench’’, photoluminescence emissionintensity of the excited PSP molecules — it can be used to measurethe relative concentration of O2 against the surface of interest. Bypreventing the oxygen molecules from the mainstream flow (i.e.,airflow) from reaching the surface of interest via injection ofO2-free foreign gas through the coolant holes, the film coolingeffectiveness distribution is determined in terms of the oxygenconcentration distribution over the protected surface. Based onthe mass transfer analogy and using the concentrations of oxygenrather than the temperature in Eq. (1), the adiabatic film coolingeffectiveness can be expressed as:
gaw ¼ðCO2 Þmain � ðCO2 Þmix
ðCO2 Þmain � ðCO2 Þcoolant
¼ ðPO2 Þair � ðPO2 Þmix
ðPO2 Þair
; ð2Þ
where ðCO2 Þcoolant is zero for choice of an O2-free coolant gas; thus,the above expressions can be expressed equivalently as some ratiosubtracted from unity. Now, a potential pitfall arises in that theratios ðCO2 Þmix=ðCO2 Þmain and P(O2)mix/P(O2)air are not necessarilyidentical due to the differing molecular masses of the coolant gasand the mainstream flows. As described in Jones [16] and Charbon-nier et al. [17], for the choice of a coolant gas whose molecular mass

Fig. 2. Schematic of the experimental setup used for PIV measurements.
340 B. Johnson et al. / International Journal of Heat and Mass Transfer 76 (2014) 337–349
differs significantly from that of the mainstream, the cooling effec-tiveness as determined via measurement of the partial pressure ofoxygen should be appropriately expressed as:
g ¼ 1� 1ðPO2
Þair
ðPO2Þ
mix
� �wall� 1
� �Mcoolant
Mairþ 1
; ð3Þ
where Mcoolant and Mair are the molecular masses of the coolant gasand the mainstream air, respectively. Thus, if the coolant gas has sim-ilar density to air, such as Nitrogen (DR = 0.97), Eq. (2) will provide areasonable approximation for the film cooling effectiveness. How-ever, in a typical gas turbine engine the density ratio is significantlygreater than unity. For this reason, the use of a foreign gas that has agreater density than air is sensible for the experimental study of filmcooling effectiveness. In the present study, most of the experimentswere performed by using CO2 as the coolant gas (i.e., DR = 1.53), withsome cases using nitrogen (i.e., DR = 0.97) to investigate the effects ofdensity ratio on the film cooling effectiveness.
As described above, since the photoluminescence intensity ofthe excited PSP molecules is a function of the concentration of oxy-gen molecules (i.e., partial pressure of oxygen), the quantitativeinformation about the distributions of the oxygen concentrationover the surface of interest can be obtained from an intensity ratioalong with a PSP calibration curve. The oxygen concentration infor-mation can be directly converted into static pressure distributionsfor the case with air flow as the coolant stream. Intensity ratios forair and air-coolant mixture can be expressed as Eq. (4)respectively:
Iref � Ib
I � Ib¼ f
PPref
� �; ð4Þ
where the reference intensity Iref (with illumination, no flow, sur-rounding pressure uniform at 1.0 atm) is required in order to deter-mine the intensity ratio, and background image intensity, Ib (noillumination and no flow) is used to remove the effects of cameranoise, ambient illumination, and dark current. With a PSP calibra-tion curve, the partial pressure of oxygen (i.e., oxygen concentra-tion) on the surface of interest with both air and a foreign gas(i.e., CO2 or N2 for the present study) as the coolant stream can becalculated.
The above relation is inverted to give the necessary pressurefields to calculate cooling effectiveness g using Eq. (3) throughthe following relations:
ðPO2 Þair
ðPO2 Þref
¼ f�1 Iref � Ib
Iair � Ib
� �; ð5Þ
and
ðPO2 Þmix
ðPO2 Þref
¼ f�1 Iref � Ib
Imix � Ib
� �: ð6Þ
Fig. 3 depicts the schematic of the experimental setup used inthe present study to determine the PSP calibration curve. A testplate, which was painted with PSP molecules, was mounted in anenclosed test cell. The paint that was chosen for this experimentalcampaign is ISSI UniFIB due to its low temperature sensitivity(�0.5%/�C). The paint has peak emission intensity at 650 nm uponillumination with 390 nm UV light. A high-resolution CCD camera(i.e., 14-bit and 2048 pixels � 2048 pixels) fitted with a long-passfilter with a 610 nm cutoff wavelength was used for the PSP imageacquisition. A constant temperature thermal bath system was usedto control the temperature of the test plate mounted inside the testcell, which was monitored by using a K-type thermocouple with ameasurement resolution of 0.1 �C. During the calibration experi-ment, a vacuum pump was employed to depressurize the test cell,and the pressure within the test cell was measured with a digitalpressure transducer (i.e., DSA 3217 Module, Scanivalve Corp). Areference pressure of 1.0 atm (absolute) was used in the presentstudy, which corresponds in the wind tunnel experiments to acondition of g = 0. Since it is feasible that some effectiveness exper-iments might indicate a possible maximum of g = 1.0, correspond-ing to a true zero absolute O2 pressure, it was deemed necessary tocalibrate for this condition rather than rely upon calibration curveextrapolation. For this data point the cell was flushed with pureCO2 until the PSP emission reached a steady value.
In the present study, the calibration procedure was performedfor a range of temperatures from 23.0 �C to 32.6 �C. For each tem-perature condition, all calibration points including the referencepressure were performed within the thermocouple resolution ofa constant temperature. For example, all calibration data taken at28.0 �C were likewise normalized by reference conditions of

Fig. 3. Experimental setup for PSP calibration procedure.
(Iref-Ib)/(I-Ib)
P/P
ref
0.0 0.2 0.4 0.6 0.8 1.00.0
0.2
0.4
0.6
0.8
1.0
T=23.0° CT=26.0° CT=28.0° CT=31.0° CT=32.6° CBest Fit
Fig. 4. The calibration curves for PSP measurements.
B. Johnson et al. / International Journal of Heat and Mass Transfer 76 (2014) 337–349 341
28.0 �C as well, and so on for the other temperature conditions.Fig. 4 shows the normalized PSP calibration curves at differenttemperature levels. It is interesting to note that, while it is wellknown that the absolute value of the emission intensity of theexcited PSP molecules are temperature dependent, the PSP calibra-tion curves obtained at different temperature levels could be col-lapsed into a single curve by using an appropriate normalizationmethod. A similar feature of the PSP calibration curves was alsofound by Liu et al. [18].
For the PSP image processing, in order to reduce the effects ofcamera noise on the measurement results, spatial averaging wasperformed in the present study on square interrogation windowsof 9 � 9 pixels with 50% overlap to ensure complete sampling ofthe measurement data. The acquired PSP images typically have amagnification of about 0.093 mm/pixel, which results in a spatialresolution of 0.37 mm or 0.074D for the PSP measurement results.The measurement uncertainty for the film cooling effectivenessresults given in the present study was estimated to be about ±0.04.
3. Measurement results and discussions
3.1. Flow characteristics of the oncoming boundary layer flow over thetest plate
In the present study, the characteristics of the oncoming bound-ary layer of the mainstream flow over the test plate under differenttest conditions were measured by using the high-resolution PIVsystem. Fig. 5 shows some typical PIV measurement results interms of the time-averaged flow field distribution over the testplate near the coolant injection hole in the middle of the test platealong with the transverse velocity profiles at several upstreamlocations relative to the coolant injection hole. From the measure-ment results given in Fig. 5, it can be seen clearly that, for the testcase without coolant injection (i.e., M = 0 case), the velocity profilein the boundary layer of the oncoming mainstream flow was foundto follow a 1/7th power law well at the leading edge of the coolantinjection hole (i.e., at upstream location of x/D = �1.0). The thick-ness of the boundary layer, d99, at this location was found to beabout 0.98D (i.e., d99 � 0.98D), while the displacement thicknessof the boundary layer flow d⁄ was found to be about 0.10D (i.e., d⁄
� 0.10D). Such characteristics in the boundary layer of the oncom-ing mainstream flow were found to match well with those of
Baldauf et al. [19–21]. It can also be seen clearly that, for the testcases with non-zero coolant injection (i.e., the test cases withblowing ratio M – 0.0), there is a noted distortion in the velocityprofiles of the oncoming flow at the same upstream locations ofx/D = �1.0 and somewhat lesser distortion noted at the furtherupstream location of x/D = �2.0. As shown clearly in Fig. 5, theeffect that increasing blowing ratio M has upon the oncomingmainstream flow is to thicken the boundary layer and reduce itsstreamwise momentum. Further upstream, i.e., at upstream loca-tions of x/D = �3.0 and x/D = �5.0, there is little or no observableeffect of the blowing ratio M upon the velocity profile of theoncoming mainstream flow.
While a number of experimental studies have been conductedin recent years using the PSP technique with mass transfer analogyto achieve quantitative film cooling effectiveness measurements,the PSP technique is still a fairly new technique to measure filmcooling effectiveness in comparison to conventional temperature-based measurement methods. It is highly desirable and necessaryto validate the reliability of the PSP-based measurements as aneffective experimental tool for turbine blade film cooling studies.Surprisingly, very little can be found in literature to provide aquantitative comparison of the measured cooling effectiveness dis-tributions by using the PSP technique against those derived
(a). Ensemble-averaged flow field for the test case with the blowing ratio of M=0.0
(b). The velocity profiles within the boundary layer upstream the coolant injection hole at the blowing ratio of M = 0.0, 0.4, 1.0, and 2.0, respectively.
Test plateTest plate Coolantinjection hole
x / D
y/D
-6 -5 -4 -3 -2 -1 0 1 2
0
1
2
3
U / U∞: 0.00 0.10 0.20 0.30 0.40 0.50 0.60 0.70 0.80 0.90 1.00
δ99
U / U∞
y/D
0.0 0.2 0.4 0.6 0.8 1.00.0
0.2
0.4
0.6
0.8
1.0
1.2
M = 0.0M = 0.4M = 1.0M = 2.01/7th Power Law
x / D = -1
U / U∞
y/D
0.0 0.2 0.4 0.6 0.8 1.00.0
0.2
0.4
0.6
0.8
1.0
1.2
M = 0.0M = 0.4M = 1.0M = 2.01/7th Power Law
x / D = -2.0
U / U∞
y/D
0.0 0.2 0.4 0.6 0.8 1.00.0
0.2
0.4
0.6
0.8
1.0
1.2
M = 0.0M = 0.4M = 1.0M = 2.01/7th Power Law
x / D = -3.0
U / U∞
y/D
0.0 0.2 0.4 0.6 0.8 1.00.0
0.2
0.4
0.6
0.8
1.0
1.2
M = 0.0M = 0.4M = 1.0M = 2.01/7th Power Law
x / D = -5.0
Fig. 5. The flow characteristics of the oncoming mainstream flows over the test plate.
342 B. Johnson et al. / International Journal of Heat and Mass Transfer 76 (2014) 337–349
directly from the temperature-based measurements under thesame or comparable test conditions. With this in mind, a compre-hensive study was conducted in the present study to provide aquantitative comparison of the cooling effectiveness measurementresults by using PSP technique with mass transfer analogy againstthose derived directly from temperature-based measurements forthe same film cooling design under the same or comparable testconditions.
For the comparative study, a coolant stream of CO2 (i.e.,DR = 1.53) was injected through circular holes with a blowingangle of 30� and a spanwise pitch of p/D = 3. Such geometry andexperimental parameters were chosen due to an abundance ofthe temperature-based measurement data available in the pub-lished literature [19–24]. For example, by using a test model with
almost the same geometry and experimental parameters as thatused in the present study, Baldauf et al. [19–21] conducted a para-metric study (i.e., by varying the blowing angle and the spanwisepitch between the coolant hole as well as the flow parameters suchas blowing rate and density ratios) to quantify the adiabatic filmcooling effectiveness on the surface of a test plate downstream arow of circular holes by measuring the surface temperature distri-butions over the test plate with an IR thermography system. Sincethe flow characteristics of the boundary layer of the oncomingflows for the present study were set to be almost identical as thoseof Baldauf et al. [19–21], the film cooling effectiveness over the testplate for the present study are expected to be the same or compa-rable as those of Baldauf et al. [19–21] under the same or compa-rable test conditions.
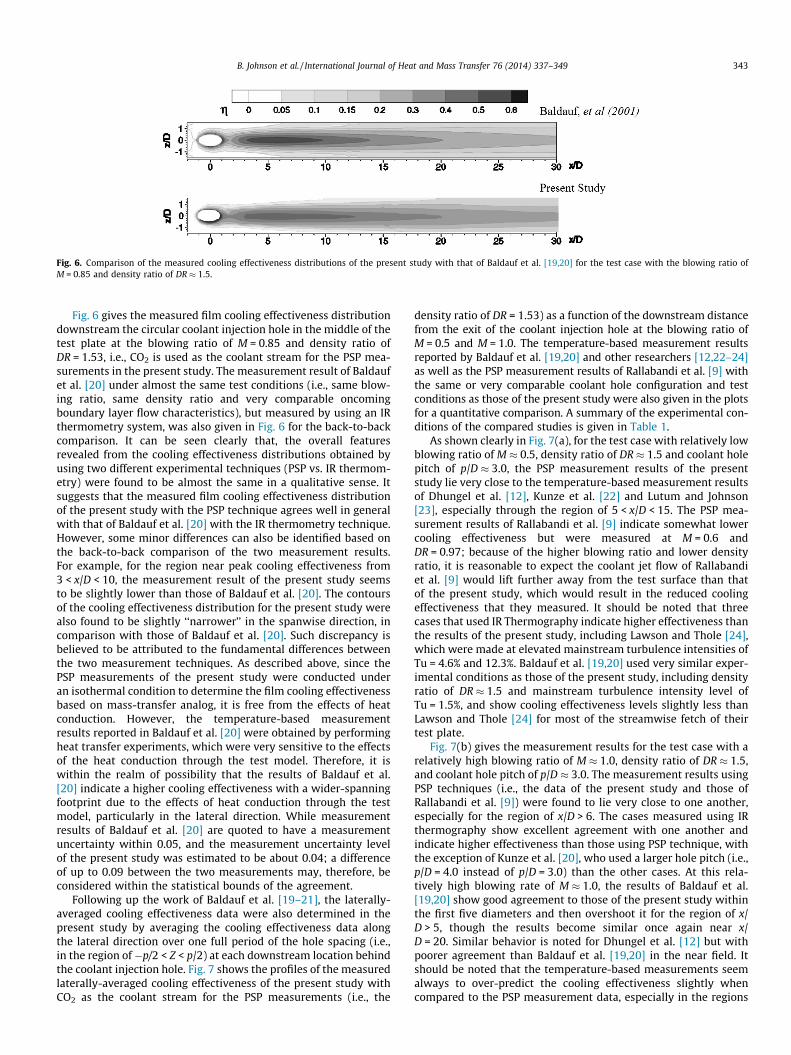
Fig. 6. Comparison of the measured cooling effectiveness distributions of the present study with that of Baldauf et al. [19,20] for the test case with the blowing ratio ofM = 0.85 and density ratio of DR � 1.5.
B. Johnson et al. / International Journal of Heat and Mass Transfer 76 (2014) 337–349 343
Fig. 6 gives the measured film cooling effectiveness distributiondownstream the circular coolant injection hole in the middle of thetest plate at the blowing ratio of M = 0.85 and density ratio ofDR = 1.53, i.e., CO2 is used as the coolant stream for the PSP mea-surements in the present study. The measurement result of Baldaufet al. [20] under almost the same test conditions (i.e., same blow-ing ratio, same density ratio and very comparable oncomingboundary layer flow characteristics), but measured by using an IRthermometry system, was also given in Fig. 6 for the back-to-backcomparison. It can be seen clearly that, the overall featuresrevealed from the cooling effectiveness distributions obtained byusing two different experimental techniques (PSP vs. IR thermom-etry) were found to be almost the same in a qualitative sense. Itsuggests that the measured film cooling effectiveness distributionof the present study with the PSP technique agrees well in generalwith that of Baldauf et al. [20] with the IR thermometry technique.However, some minor differences can also be identified based onthe back-to-back comparison of the two measurement results.For example, for the region near peak cooling effectiveness from3 < x/D < 10, the measurement result of the present study seemsto be slightly lower than those of Baldauf et al. [20]. The contoursof the cooling effectiveness distribution for the present study werealso found to be slightly ‘‘narrower’’ in the spanwise direction, incomparison with those of Baldauf et al. [20]. Such discrepancy isbelieved to be attributed to the fundamental differences betweenthe two measurement techniques. As described above, since thePSP measurements of the present study were conducted underan isothermal condition to determine the film cooling effectivenessbased on mass-transfer analog, it is free from the effects of heatconduction. However, the temperature-based measurementresults reported in Baldauf et al. [20] were obtained by performingheat transfer experiments, which were very sensitive to the effectsof the heat conduction through the test model. Therefore, it iswithin the realm of possibility that the results of Baldauf et al.[20] indicate a higher cooling effectiveness with a wider-spanningfootprint due to the effects of heat conduction through the testmodel, particularly in the lateral direction. While measurementresults of Baldauf et al. [20] are quoted to have a measurementuncertainty within 0.05, and the measurement uncertainty levelof the present study was estimated to be about 0.04; a differenceof up to 0.09 between the two measurements may, therefore, beconsidered within the statistical bounds of the agreement.
Following up the work of Baldauf et al. [19–21], the laterally-averaged cooling effectiveness data were also determined in thepresent study by averaging the cooling effectiveness data alongthe lateral direction over one full period of the hole spacing (i.e.,in the region of�p/2 < Z < p/2) at each downstream location behindthe coolant injection hole. Fig. 7 shows the profiles of the measuredlaterally-averaged cooling effectiveness of the present study withCO2 as the coolant stream for the PSP measurements (i.e., the
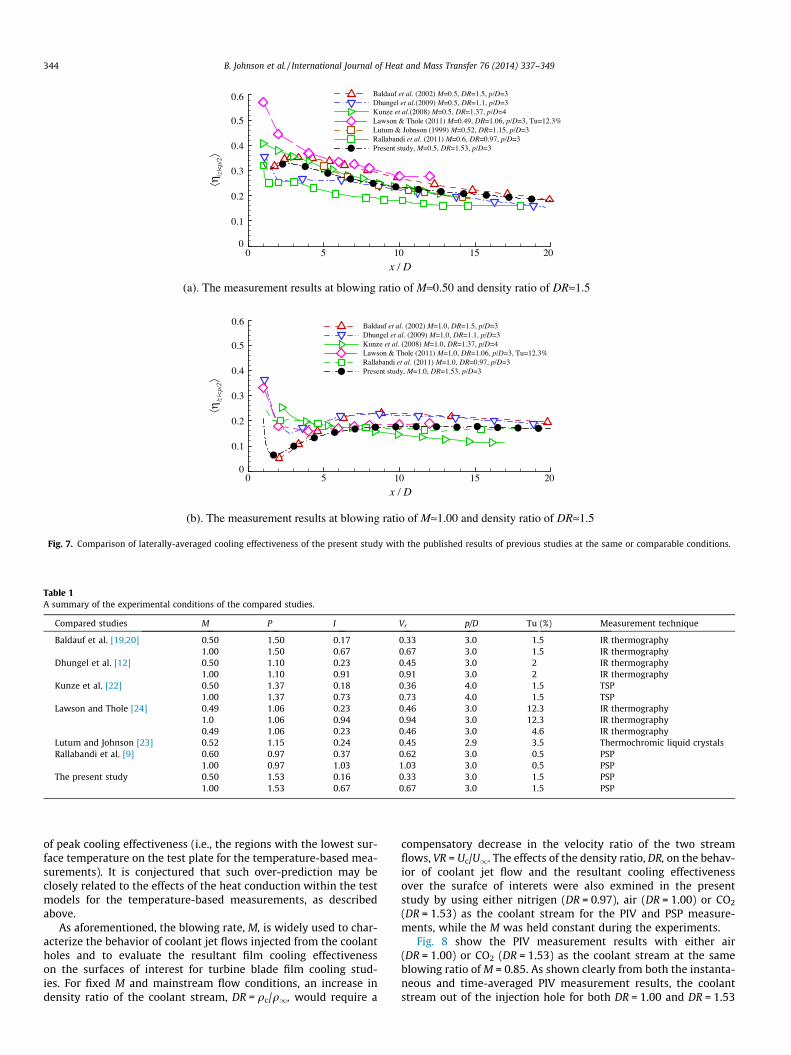
density ratio of DR = 1.53) as a function of the downstream distancefrom the exit of the coolant injection hole at the blowing ratio ofM = 0.5 and M = 1.0. The temperature-based measurement resultsreported by Baldauf et al. [19,20] and other researchers [12,22–24]as well as the PSP measurement results of Rallabandi et al. [9] withthe same or very comparable coolant hole configuration and testconditions as those of the present study were also given in the plotsfor a quantitative comparison. A summary of the experimental con-ditions of the compared studies is given in Table 1.
As shown clearly in Fig. 7(a), for the test case with relatively lowblowing ratio of M � 0.5, density ratio of DR � 1.5 and coolant holepitch of p/D � 3.0, the PSP measurement results of the presentstudy lie very close to the temperature-based measurement resultsof Dhungel et al. [12], Kunze et al. [22] and Lutum and Johnson[23], especially through the region of 5 < x/D < 15. The PSP mea-surement results of Rallabandi et al. [9] indicate somewhat lowercooling effectiveness but were measured at M = 0.6 andDR = 0.97; because of the higher blowing ratio and lower densityratio, it is reasonable to expect the coolant jet flow of Rallabandiet al. [9] would lift further away from the test surface than thatof the present study, which would result in the reduced coolingeffectiveness that they measured. It should be noted that threecases that used IR Thermography indicate higher effectiveness thanthe results of the present study, including Lawson and Thole [24],which were made at elevated mainstream turbulence intensities ofTu = 4.6% and 12.3%. Baldauf et al. [19,20] used very similar exper-imental conditions as those of the present study, including densityratio of DR � 1.5 and mainstream turbulence intensity level ofTu = 1.5%, and show cooling effectiveness levels slightly less thanLawson and Thole [24] for most of the streamwise fetch of theirtest plate.
Fig. 7(b) gives the measurement results for the test case with arelatively high blowing ratio of M � 1.0, density ratio of DR � 1.5,and coolant hole pitch of p/D � 3.0. The measurement results usingPSP techniques (i.e., the data of the present study and those ofRallabandi et al. [9]) were found to lie very close to one another,especially for the region of x/D > 6. The cases measured using IRthermography show excellent agreement with one another andindicate higher effectiveness than those using PSP technique, withthe exception of Kunze et al. [20], who used a larger hole pitch (i.e.,p/D = 4.0 instead of p/D = 3.0) than the other cases. At this rela-tively high blowing rate of M � 1.0, the results of Baldauf et al.[19,20] show good agreement to those of the present study withinthe first five diameters and then overshoot it for the region of x/D > 5, though the results become similar once again near x/D = 20. Similar behavior is noted for Dhungel et al. [12] but withpoorer agreement than Baldauf et al. [19,20] in the near field. Itshould be noted that the temperature-based measurements seemalways to over-predict the cooling effectiveness slightly whencompared to the PSP measurement data, especially in the regions
(a). The measurement results at blowing ratio of M≈0.50 and density ratio of DR≈1.5
(b). The measurement results at blowing ratio of M≈1.00 and density ratio of DR≈1.5
x / D
η |z|<
p/2
0 5 10 15 200
0.1
0.2
0.3
0.4
0.5
0.6 Baldauf et al. (2002) M=0.5, DR=1.5, p/D=3Dhungel et al.(2009) M=0.5, DR=1.1, p/D=3Kunze et al.(2008) M=0.5, DR=1.37, p/D=4Lawson & Thole (2011) M=0.49, DR=1.06, p/D=3, Tu=12.3%Lutum & Johnson (1999) M=0.52, DR=1.15, p/D=3Rallabandi et al. (2011) M=0.6, DR=0.97, p/D=3Present study, M=0.5, DR=1.53, p/D=3
x / D
η |z|<
p/2
0 5 10 15 200
0.1
0.2
0.3
0.4
0.5
0.6 Baldauf et al. (2002) M=1.0, DR=1.5, p/D=3Dhungel et al. (2009) M=1.0, DR=1.1, p/D=3Kunze et al. (2008) M=1.0, DR=1.37, p/D=4Lawson & Thole (2011) M=1.0, DR=1.06, p/D=3, Tu=12.3%Rallabandi et al. (2011) M=1.0, DR=0.97, p/D=3Present study, M=1.0, DR=1.53, p/D=3
Fig. 7. Comparison of laterally-averaged cooling effectiveness of the present study with the published results of previous studies at the same or comparable conditions.
Table 1A summary of the experimental conditions of the compared studies.
Compared studies M P I Vr p/D Tu (%) Measurement technique
Baldauf et al. [19,20] 0.50 1.50 0.17 0.33 3.0 1.5 IR thermography1.00 1.50 0.67 0.67 3.0 1.5 IR thermography
Dhungel et al. [12] 0.50 1.10 0.23 0.45 3.0 2 IR thermography1.00 1.10 0.91 0.91 3.0 2 IR thermography
Kunze et al. [22] 0.50 1.37 0.18 0.36 4.0 1.5 TSP1.00 1.37 0.73 0.73 4.0 1.5 TSP
Lawson and Thole [24] 0.49 1.06 0.23 0.46 3.0 12.3 IR thermography1.0 1.06 0.94 0.94 3.0 12.3 IR thermography0.49 1.06 0.23 0.46 3.0 4.6 IR thermography
Lutum and Johnson [23] 0.52 1.15 0.24 0.45 2.9 3.5 Thermochromic liquid crystalsRallabandi et al. [9] 0.60 0.97 0.37 0.62 3.0 0.5 PSP
1.00 0.97 1.03 1.03 3.0 0.5 PSPThe present study 0.50 1.53 0.16 0.33 3.0 1.5 PSP
1.00 1.53 0.67 0.67 3.0 1.5 PSP
344 B. Johnson et al. / International Journal of Heat and Mass Transfer 76 (2014) 337–349
of peak cooling effectiveness (i.e., the regions with the lowest sur-face temperature on the test plate for the temperature-based mea-surements). It is conjectured that such over-prediction may beclosely related to the effects of the heat conduction within the testmodels for the temperature-based measurements, as describedabove.
As aforementioned, the blowing rate, M, is widely used to char-acterize the behavior of coolant jet flows injected from the coolantholes and to evaluate the resultant film cooling effectivenesson the surfaces of interest for turbine blade film cooling stud-ies. For fixed M and mainstream flow conditions, an increase indensity ratio of the coolant stream, DR = qc/q1, would require a
compensatory decrease in the velocity ratio of the two streamflows, VR = Uc/U1. The effects of the density ratio, DR, on the behav-ior of coolant jet flow and the resultant cooling effectivenessover the surafce of interets were also exmined in the presentstudy by using either nitrigen (DR = 0.97), air (DR = 1.00) or CO2
(DR = 1.53) as the coolant stream for the PIV and PSP measure-ments, while the M was held constant during the experiments.
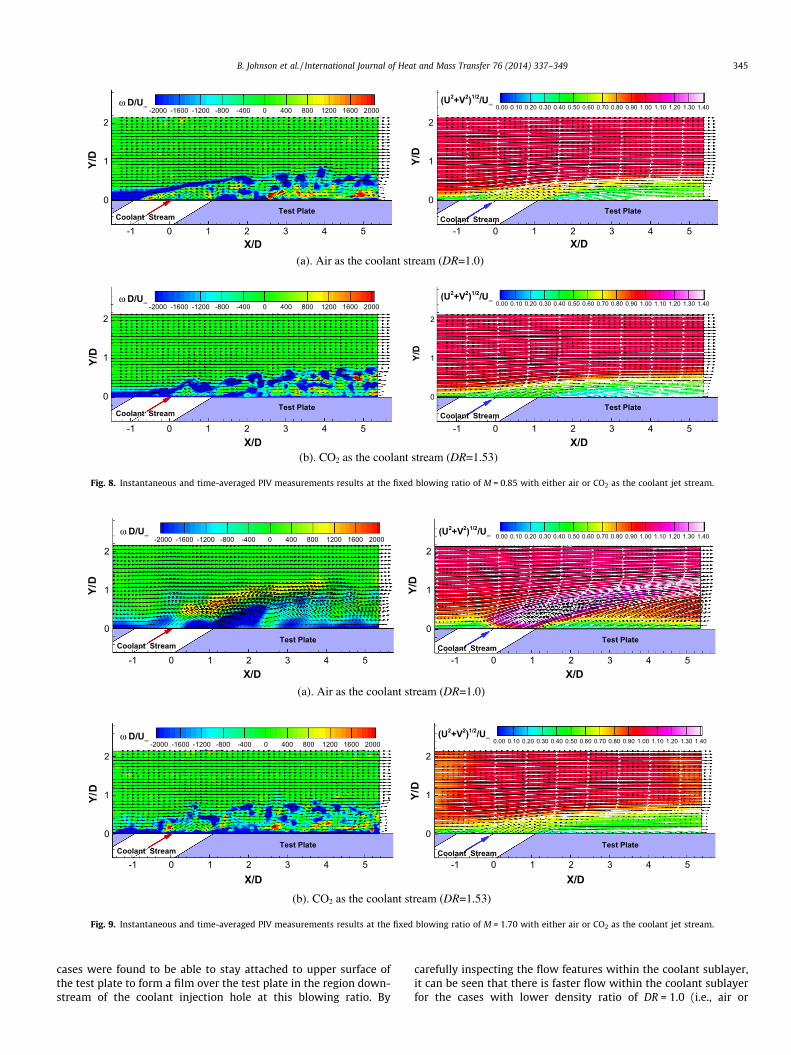
Fig. 8 show the PIV measurement results with either air(DR = 1.00) or CO2 (DR = 1.53) as the coolant stream at the sameblowing ratio of M = 0.85. As shown clearly from both the instanta-neous and time-averaged PIV measurement results, the coolantstream out of the injection hole for both DR = 1.00 and DR = 1.53
(a). Air as the coolant stream (DR=1.0)
(b). CO2 as the coolant stream (DR=1.53)
X/D
Y/D
-1 0 1 2 3 4 5
0
1
2-2000 -1600 -1200 -800 -400 0 400 800 1200 1600 2000
Test PlateCoolant Stream
ω D/U∞
X/D
Y/D
-1 0 1 2 3 4 5
0
1
2
0.00 0.10 0.20 0.30 0.40 0.50 0.60 0.70 0.80 0.90 1.00 1.10 1.20 1.30 1.40
Test PlateCoolant Stream
(U2+V2)1/2/U∞
X/D
Y/D
-1 0 1 2 3 4 5
0
1
2-2000 -1600 -1200 -800 -400 0 400 800 1200 1600 2000
Test PlateCoolant Stream
ω D/U∞
X/D
Y/D
-1 0 1 2 3 4 5
0
1
2
0.00 0.10 0.20 0.30 0.40 0.50 0.60 0.70 0.80 0.90 1.00 1.10 1.20 1.30 1.40
Test PlateCoolant Stream
(U2+V2)1/2/U∞
Fig. 8. Instantaneous and time-averaged PIV measurements results at the fixed blowing ratio of M = 0.85 with either air or CO2 as the coolant jet stream.
(a). Air as the coolant stream (DR=1.0)
(b). CO2 as the coolant stream (DR=1.53)
X/D
Y/D
-1 0 1 2 3 4 5
0
1
2-2000 -1600 -1200 -800 -400 0 400 800 1200 1600 2000
Test PlateCoolant Stream
ω D/U∞
X/D
Y/D
-1 0 1 2 3 4 5
0
1
2
0.00 0.10 0.20 0.30 0.40 0.50 0.60 0.70 0.80 0.90 1.00 1.10 1.20 1.30 1.40
Test PlateCoolant Stream
(U2+V2)1/2/U∞
X/D
Y/D
-1 0 1 2 3 4 5
0
1
2-2000 -1600 -1200 -800 -400 0 400 800 1200 1600 2000
Test PlateCoolant Stream
ω D/U∞
X/D
Y/D
-1 0 1 2 3 4 5
0
1
2
0.00 0.10 0.20 0.30 0.40 0.50 0.60 0.70 0.80 0.90 1.00 1.10 1.20 1.30 1.40
Test PlateCoolant Stream
(U2+V2)1/2/U∞
Fig. 9. Instantaneous and time-averaged PIV measurements results at the fixed blowing ratio of M = 1.70 with either air or CO2 as the coolant jet stream.
B. Johnson et al. / International Journal of Heat and Mass Transfer 76 (2014) 337–349 345
cases were found to be able to stay attached to upper surface ofthe test plate to form a film over the test plate in the region down-stream of the coolant injection hole at this blowing ratio. By
carefully inspecting the flow features within the coolant sublayer,it can be seen that there is faster flow within the coolant sublayerfor the cases with lower density ratio of DR = 1.0 (i.e., air or
(a). Measurement results at blowing ratio of M=0.85
(b). Measurement results at blowing ratio of M=1.70
x / D
z/D
0 5 10 15 20 25 30-6
-4
-2
0
2
4
60.03 0.09 0.15 0.21 0.27 0.33 0.39 0.45 0.51 0.57 0.63
M=0.85, DR=0.97 (N2 as the coolant stream)
<η>:
x / D
z/D
0 5 10 15 20 25 30-6
-4
-2
0
2
4
60.03 0.09 0.15 0.21 0.27 0.33 0.39 0.45 0.51 0.57 0.63
M=0.85, DR=1.53 (CO2 as the coolant stream)
<η>:
x / D
z/D
0 5 10 15 20 25 30-6
-4
-2
0
2
4
60.03 0.09 0.15 0.21 0.27 0.33 0.39 0.45 0.51 0.57 0.63
M=1.70, DR=0.97 (N2 as the coolant stream)
<η>:
x / D
z/D
0 5 10 15 20 25 30-6
-4
-2
0
2
4
60.03 0.09 0.15 0.21 0.27 0.33 0.39 0.45 0.51 0.57 0.63
M=1.70, DR=1.53 (CO2 as the coolant stream)
<η>:
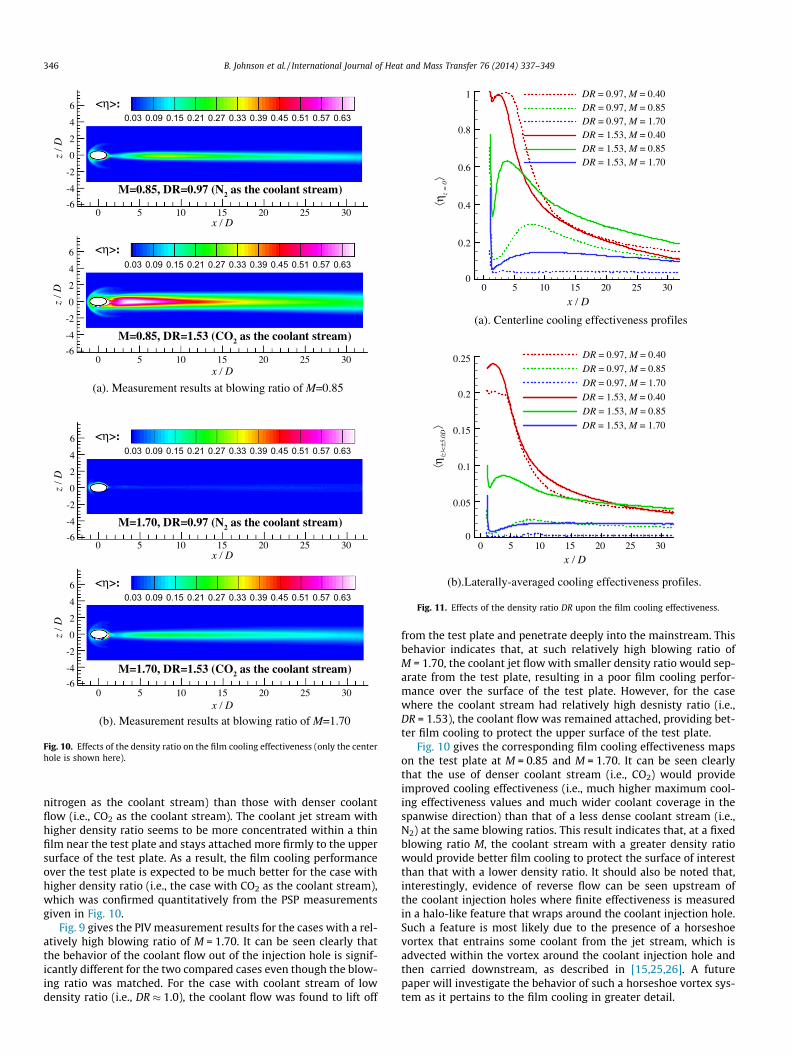
Fig. 10. Effects of the density ratio on the film cooling effectiveness (only the centerhole is shown here).
(a). Centerline cooling effectiveness profiles
(b).Laterally-averaged cooling effectiveness profiles.
x / D
η z=
0
0 5 10 15 20 25 300
0.2
0.4
0.6
0.8
1 DR = 0.97, M = 0.40DR = 0.97, M = 0.85DR = 0.97, M = 1.70DR = 1.53, M = 0.40DR = 1.53, M = 0.85DR = 1.53, M = 1.70
x / D
η |z|<
±5.0
D
0 5 10 15 20 25 300
0.05
0.1
0.15
0.2
0.25 DR = 0.97, M = 0.40
DR = 0.97, M = 0.85
DR = 0.97, M = 1.70
DR = 1.53, M = 0.40
DR = 1.53, M = 0.85
DR = 1.53, M = 1.70
Fig. 11. Effects of the density ratio DR upon the film cooling effectiveness.
346 B. Johnson et al. / International Journal of Heat and Mass Transfer 76 (2014) 337–349
nitrogen as the coolant stream) than those with denser coolantflow (i.e., CO2 as the coolant stream). The coolant jet stream withhigher density ratio seems to be more concentrated within a thinfilm near the test plate and stays attached more firmly to the uppersurface of the test plate. As a result, the film cooling performanceover the test plate is expected to be much better for the case withhigher density ratio (i.e., the case with CO2 as the coolant stream),which was confirmed quantitatively from the PSP measurementsgiven in Fig. 10.
Fig. 9 gives the PIV measurement results for the cases with a rel-atively high blowing ratio of M = 1.70. It can be seen clearly thatthe behavior of the coolant flow out of the injection hole is signif-icantly different for the two compared cases even though the blow-ing ratio was matched. For the case with coolant stream of lowdensity ratio (i.e., DR � 1.0), the coolant flow was found to lift off
from the test plate and penetrate deeply into the mainstream. Thisbehavior indicates that, at such relatively high blowing ratio ofM = 1.70, the coolant jet flow with smaller density ratio would sep-arate from the test plate, resulting in a poor film cooling perfor-mance over the surface of the test plate. However, for the casewhere the coolant stream had relatively high desnisty ratio (i.e.,DR = 1.53), the coolant flow was remained attached, providing bet-ter film cooling to protect the upper surface of the test plate.
Fig. 10 gives the corresponding film cooling effectiveness mapson the test plate at M = 0.85 and M = 1.70. It can be seen clearlythat the use of denser coolant stream (i.e., CO2) would provideimproved cooling effectiveness (i.e., much higher maximum cool-ing effectiveness values and much wider coolant coverage in thespanwise direction) than that of a less dense coolant stream (i.e.,N2) at the same blowing ratios. This result indicates that, at a fixedblowing ratio M, the coolant stream with a greater density ratiowould provide better film cooling to protect the surface of interestthan that with a lower density ratio. It should also be noted that,interestingly, evidence of reverse flow can be seen upstream ofthe coolant injection holes where finite effectiveness is measuredin a halo-like feature that wraps around the coolant injection hole.Such a feature is most likely due to the presence of a horseshoevortex that entrains some coolant from the jet stream, which isadvected within the vortex around the coolant injection hole andthen carried downstream, as described in [15,25,26]. A futurepaper will investigate the behavior of such a horseshoe vortex sys-tem as it pertains to the film cooling in greater detail.

(a). The measurement results with matched blowing rate, M
(b). The measurement results with matched momentum flux ratio, I
(c). The measurement results with matched velocity ratio, VR.
x / D
η z=
0
0 5 10 15 20 25 300
0.2
0.4
0.6
0.8
1 M = 0.40, DR = 0.97M = 0.40, DR = 1.53M = 0.85, DR = 0.97M = 0.85, DR = 1.53M = 1.70, DR = 0.97M = 1.70, DR = 1.53
x / D
η |z|<
±5.0
D
0 5 10 15 20 25 300
0.05
0.1
0.15
0.2
0.25M = 0.40, DR = 0.97M = 0.40, DR = 1.53M = 0.85, DR = 0.97M = 0.85, DR = 1.53M = 1.70, DR = 0.97M = 1.70, DR = 1.53
x / D
η z=
0
0 5 10 15 20 25 300
0.2
0.4
0.6
0.8
1I = 0.17, DR = 0.97I = 0.16, DR = 1.53I = 0.46, DR = 0.97I = 0.47, DR = 1.53I = 0.93, DR = 0.97I = 0.94, DR = 1.53
x / Dη |z
|<±5
.0D
0 5 10 15 20 25 300
0.05
0.1
0.15
0.2
0.25 I = 0.17, DR = 0.97I = 0.16, DR = 1.53I = 0.46, DR = 0.97I = 0.47, DR = 1.53I = 0.93, DR = 0.97I = 0.94, DR = 1.53
x / D
η z=
0
0 5 10 15 20 25 300
0.2
0.4
0.6
0.8
1 VR = 0.31, DR = 0.97VR = 0.31, DR = 1.53VR = 0.62, DR = 0.97VR = 0.62, DR = 1.53VR = 0.88, DR = 0.97VR = 0.90, DR = 1.53
x / D
η |z|<
±5.0
D
0 5 10 15 20 25 300
0.05
0.1
0.15
0.2
0.25VR = 0.31, DR = 0.97VR = 0.31, DR = 1.53VR = 0.62, DR = 0.97VR = 0.62, DR = 1.53VR = 0.88, DR = 0.97VR = 0.90, DR = 1.53
Fig. 12. The measured film cooling effectiveness along the centerline of the coolant injection holes and the laterally-averaged film cooling effectiveness with two differentcoolant gases: dashed lines represent N2, solid lines represent CO2.
B. Johnson et al. / International Journal of Heat and Mass Transfer 76 (2014) 337–349 347
Fig. 11 shows the profiles of the measured cooling effectivenessdata along the centerline of the coolant injection hole and the lat-erally-averaged film cooling effectiveness as a function of thedownstream distance away from the coolant injection hole at thefixed blowing ratio of M = 0.40 (low), 0.85 (medium) and 1.70(high), which can be used to reveal the effects of the coolant-to-mainstream density ratio on the film cooling performance of thecoolant jet streams over the surface of interest more clearly andquantitatively. It can be seen clearly that, concerning the physicsof the film cooling, there is little difference between the coolantstreams of different density for the cases with relatively low blow-ing ratios (i.e., for the cases of M = 0.40), suggesting that the cool-ant stream is able to remain well-attached to the test plate toprotect the surface of interest at relatively small blowing ratio.However, as shown clearly from the PIV measurements given inFig. 10, the coolant jet stream with lower density ratio tends to liftoff much earlier and separate more easily from the test plate, com-pared with those of denser coolant stream, as the blowing ratioincreases. As a result, the film cooling effectiveness over the sur-face of interest was found to become dependent upon the cool-ant-to-mainstream density ratio when the blowing ratio becomes
relatively high. As shown quantitatively from the measurementresults given in Fig. 11, the use of the coolant stream with higherdensity would result in increased cooling effectiveness over thesurface of interest by the measures of both the centerline and lat-erally-averaged cooling effectiveness for the cases of M = 0.85 and1.70.
The PIV and PSP measurement results given above reveal clearlythat the blowing ratio, M, alone would not be able to successfullycategorize the behavior of coolant jet stream as well as the resul-tant film cooling effectiveness on the surfaces of interest. In thepresent study, an explorative study was also conducted to assessthe applicability of other scaling quantities such as the coolant-to-mainstream momentum flux ratio, I = M2/DR, and bulk velocityratio, VR = Uc/U1, in comparison to the most-commonly usedblowing ratio (i.e., coolant-to-mainstream mass flux ratio), M, incharacterizing the film cooling effectiveness over the surface ofinterest in order to reveal the extent to which the flow scenariocan be described by using purely kinematic or dynamic means.By conducting such analysis, it is hopeful to illuminate the under-lying physics to discern the extent to which the interaction andmixing of the coolant jet and mainstream flows occur primarily
348 B. Johnson et al. / International Journal of Heat and Mass Transfer 76 (2014) 337–349
due to the kinematic conditions of the flow field or due to thedynamic processes that depend on the density disparity betweenthe two streams.
With this in mind, a set of experiments were conducted to mea-sure the film cooling effectiveness on the surface of interest at clo-sely-matched values of the blowing ratio, M, momentum ratio, I,and velocity ratio, VR, with either N2 (DR = 0.97) or CO2
(DR = 1.53) as the coolant stream for the PSP measurements. Themeasured cooling effectiveness along the centerline of the coolantinjection hole and the laterally-averaged film cooling effectivenessare given in Fig. 12(a)–(c), respectively. In this order, the successivesubfigures represent decreasing weighting of the scaling by densityratio, DR, or, conversely, the order of increasing importance of flowkinematics upon the resultant film cooling effectiveness. In theplots, the red curves represent the slowest of the three quantitiesin each plot, blue curves are used for the highest, and green curvesshow the intermediate coolant flows. Interestingly, the red curveswere found to be always little-affected by differences in densityratio for matched mass-flux ratio M, and momentum-flux ratio I,but significant far-field disparity is noted for the cases of velocityratio-matching, which suggests that the influence of density ratio,DR, is important at low mass-flux ratio (i.e., blowing ratio), M, andmomentum-flux ratio, I, and those quantities can successfully scalefilm cooling flows across differences in density (or temperature forthermal-based experiments, equivalently). However, the green andblue curves indicate that increases in density ratio, DR, result inpoor matching of mass-flux ratio M, and momentum-flux ratio I,across the differences in the density ratio, DR, as the coolant injec-tion increases. This trend is reversed for the VR-matching cases, forwhich the blue curves trend near each other for both density ratiovalues, but the red slow-coolant curves agree in the near-field butshow disparity in the far-field, with the more-dense coolant streamresulting in better cooling effectiveness. The green curves trendclosely to each other in the far-field but not in the near-field. Thus,it seems that, as the coolant flow increases, the velocity ratio, VR,becomes increasingly useful to describe the cooling effectivenessfor the test cases with differing density ratios. It is worth mention-ing here that the Richardson number of these flows, which repre-sents the ratio between the buoyancy forces to the gravity forcesfor the flows, was found to be always very small, i.e., almost negli-gible, for all the cases investigated in the present study, which itindicates that buoyancy force is not a likely culprit for the ten-dency of the coolant gases with different densities to behavedifferently.
4. Summary and conclusions
An experimental study was conducted to quantify the perfor-mance of film cooling injection from a row of circular holes spacedlaterally across a flat plate. While a high-resolution Particle ImageVelocimetry (PIV) system was used to conduct detailed flow fieldmeasurements to quantitatively visualize the dynamic mixing pro-cess between the coolant jet stream and the mainstream flows, thePressure Sensitive Paint (PSP) technique was used to achieve adia-batic film cooling effectiveness measurements based on a mass-flux analog to traditional temperature-based cooling effectivenessmeasurements. The cooling effectiveness data of the present studywere compared quantitatively against those derived directly fromthe temperature-based measurements under the same or compa-rable test conditions to validate the reliability of the PSP measure-ments for turbine blade film cooling studies.
While the focus of the present study has been placed on theeffects of the density differences of the coolant streams on theresultant cooling effectiveness on the surface of interest at fixedblowing ratios, the applicability of other scaling quantities such
as the coolant-to-mainstream momentum flux ratio and the bulkvelocity ratio, in addition to most-commonly-used blowing ratio(i.e., coolant-to-mainstream mass flux ratio), in characterizing theperformance of film cooling over the surface of interest have alsobeen explored. The PIV measurement results reveal clearly thatthe coolant jets out of the injection holes would be able to stayattached to the test plate to form film flows to protect the surfaceof interest at relatively low blowing ratios. However, as the blow-ing ratio increases, the coolant jets with lower coolant-to-main-stream density ratios tend to separate from the test plate easily,while the coolant jets with higher density ratios are likely toremain attached to the test plate at the same blowing ratios, offer-ing improved film cooling performance to protect the surface ofinterest. As a result, there is a corresponding increase in the filmcooling effectiveness for the coolant jet flows with elevated densityratios. For the cases where the coolant jet flows were found to sep-arate from the test plate, the film cooling effectiveness over thetest plate would become very low in spite of the injection of largeamounts of coolant.
The analysis with different scaling quantities indicates that thequantities that give more weight to density ratio (i.e., coolant-to-mainstream mass flux or blowing ratio and momentum flux ratio)would be more successful to collapse measurement data fromvarying density of coolant jet streams for the cases with relativelylow coolant flow rates, while the coolant-to-mainstream bulkvelocity ratio may be used with some success to scale the film cool-ing effectiveness data for coolant jets of higher velocities. Theintriguing nature by which such these quantities tend to have pref-erential success at scaling coolant jets of different flow rates begsdeeper analysis. Additionally, some observations of film coolingeffectiveness patterns reminiscent of the presence of a horseshoevortex begs a deeper analysis into the effects that closer spacingof coolant holes might have upon the jet behavior, which will beperformed in a future paper.
Conflict of interest
None declared.
Acknowledgments
The technical assistance of Drs. Jose Cordova, Wontae Hwangand Jonathon Slepski of GE Global Research Center and Mr. Bill Ric-kard and Mr. Marc Regan of Iowa State University are greatlyappreciated.
References
[1] J.C. Han, S. Dutta, S. Ekkad, Gas Turbine Heat Transfer and Cooling Technology,Taylor and Francis, New York, 2000, pp. 540–559.
[2] C. Saumweber, A. Schulz, S. Witting, Free-Stream Turbulence Effects on Film-Cooling with Shaped Holes, J. Turbomach. 125 (1) (2003) 65–73.
[3] M.K. Chyu, Y.C. Hsing, Use of a thermographic fluorescence imaging system forsimultaneous measurement of film cooling effectiveness and heat transfercoefficient, in: ASME Paper 96-GT-430, 1996.
[4] L.M. Wright, Z. Gao, T.A. VArvel, C.J. Han, Assessment of steady state psp, tsp,and ir measurement techniques for flat plate film cooling, in: Summer HeatTransfer Conference, San Francisco, ASME Paper HT2005-72363, 2005.
[5] L.J. Zhang, R.S. Jaiswal, Turbine nozzle endwall film cooling study usingpressure-sensitive paint, J. Turbomach. 123 (4) (2001) 730–738.
[6] J. Ahn, S. Mhetras, J.C. Han, Film-cooling effectiveness on a gas turbine blade tipusing pressure-sensitive paint, ASME J. Heat Transfer 127 (5) (2005) 521–530.
[7] Z. Yang, H. Hu, Study of trailing-edge cooling using pressure sensitive painttechnique, J. Propul. Power 27 (3) (2011) 700–709.
[8] Z. Yang, H. Hu, An experimental investigation on the trailing edge cooling ofturbine blades, Propul. Power Res. 1 (1) (2012) 36–47.
[9] A.P. Rallabandi, J. Grizzle, J.C. Han, Effect of upstream step on flat plate film-cooling effectiveness using PSP, J. Turbomach. 133 (2011) 041024-1–041024-8.
[10] L.M. Wright, S.T. McClain, M.D. Clemenson, Effect of density ratio on flat platefilm cooling with shaped holes using PSP, J. Turbomach. 133 (2011) 041011-11.

B. Johnson et al. / International Journal of Heat and Mass Transfer 76 (2014) 337–349 349
[11] L.M. Wright, S.T. McClain, M.D. Clemenson, Effect of freestream turbulenceintensity on film cooling jet structure and surface effectiveness using PIV andPSP, J. Turbomach. 133 (2011) 041023-12.
[12] A. Dhungel, Y. Lu, W. Phillips, S.V. Ekkad, J. Heidmann, Film cooling from a rowof holes supplemented with anti-vortex holes, J. Turbomach. 131 (2009)021007–021010.
[13] Y. Komotani, I. Greber, Experiments on a turbulent jet in a cross flow, AIAA J.10 (11) (1972) 1425–1429.
[14] R.J. Goldstein, E.R.G. Eckert, F. Burggraf, Effect of hole geometry and density onthree dimensional film cooling, Int. J. Heat Mass Transfer 17 (1974) 595–607.
[15] E.J. Gutmark, I.M. Ibrahim, S. Murugappan, Circular and noncircular subsonicjets in cross flow, Phys. Fluids 20 (2009) 075110.
[16] T.V. Jones, Theory for the use of foreign gas in simulating film cooling, Int. J.Heat Fluid Flow 20 (1999) 349–354.
[17] D. Charbonnier, P. Ott, M. Jonsson, F. Cottier, T.H Kobke, Experimental andnumerical study of the thermal performance of a film cooled turbine platform, in:Proc. Of ASME Turbo Expo 2009: Power for Land, Sea and Air, June 8–12, 2009.
[18] L. Liu, S.F. Yang, J.C. Han, Influence of coolant density on turbine blade film-cooling with axial shaped holes, in: Proceedings of the ASME 2012 SummerHeat Transfer Conference, Rio Grande, Puerto Rico, July 8–12, 2012.
[19] S. Baldauf, A. Schulz, S. Wittig, High-resolution measurements of local heattransfer coefficients from discrete hole film cooling, J. Turbomach. 123 (2001)749–757.
[20] S. Baldauf, A. Schulz, S. Wittig, High-resolution measurements of localeffectiveness from discrete hole film cooling, J. Turbomach. 123 (2001) 758–765.
[21] S. Baldauf, M. Scheurlen, A. Schulz, S. Wittig, Correlation of film-coolingmeasurements from thermographic measurements at engine-like conditions,J. Turbomach. 124 (2002) 686–698.
[22] M. Kunze, S. Preibisch, K. Vogeler, K. Landis, A. Heselhaus, A new test rig forfilm cooling experiments on turbine endwalls, in: ASME IGTI Paper No.GT2008-51096, 2008.
[23] E. Lutum, B.V. Johnson, Influence of the hole length-to-diameter ratio on filmcooling with cylindrical holes, J. Turbomach. 121 (2009) 209–216.
[24] S.A. Lawson, K.A. Thole, Effects of simulated particle deposition of film cooling,J. Turbomach. 133 (2011) 021009-1–021009-9.
[25] T.H. New, T.T. Lim, C.S. Luo, Elliptic jets in cross-flow, J. Fluid Mech. 494 (2003)119–140.
[26] B. Johnson, K.T. Christensen, G.E. Elliott, Structural characteristics of a heated jetin cross-flow emanating from a raised, circular stack, Exp. Fluids 54 (2013) 1543.


![International Journal of Heat and Mass Transferyuen/current_paper/RADNETT-IJHMT-09.pdfNumerical data generated by RADCAL [4] will be used to gener-ate the neural network for the absorptivity](https://img.pdfslide.us/doc/110x75/5e7cdeb3a6c2384cc42acc53/international-journal-of-heat-and-mass-transfer-yuencurrentpaperradnett-ijhmt-09pdf.jpg)