Embed Size (px)
Citation preview
International Journal of Food Microbiology 130 (2009) 140–146
Contents lists available at ScienceDirect
International Journal of Food Microbiology
j ourna l homepage: www.e lsev ie r.com/ locate / i j foodmicro
Short communication
Metatranscriptome analysis of lactic acid bacteria during kimchi fermentation withgenome-probing microarrays
Young-Do Nam a,b, Ho-Won Chang a,b, Kyoung-Ho Kim a,b, Seong Woon Roh a,b, Jin-Woo Bae a,b,⁎a University of Science & Technology, KRIBB, Daejeon 305-806, Republic of Koreab Department of Biology, Kyung Hee University, Seoul 130-701, Republic of Korea
⁎ Corresponding author. University of Science & TechnRepublic of Korea. Tel.: +82 42 860 4628; fax: +82 42 86
E-mail address: [email protected] (J.-W. Bae).
0168-1605/$ – see front matter. Crown Copyright © 20doi:10.1016/j.ijfoodmicro.2009.01.007
a b s t r a c t
a r t i c l e i n f oArticle history:
We constructed genome pr Received 26 November 2008Received in revised form 7 January 2009Accepted 9 January 2009Keywords:MetagenomeMetatranscriptomeGPMKimchiLactic acid bacteria
obing microarrays (GPM) that are specific to 39 lactic acid bacteria (LAB) in aneffort to monitor microbial diversity and biological activity during the fermentation of kimchi, a traditionalKorean vegetable product known to contain various health-promoting and immunity-boosting factors.Metagenomes and metatranscriptomes extracted from periodically sampled kimchi soup were labeled,hybridized and comparatively analyzed using GPMs. Each metatranscriptome was prepared by subtracting16S rRNA and 23S rRNA from the total RNA, and selectively synthesizing mRNA-specific cDNAs from therRNA-subtracted samples. Metagenomic analysis revealed 23 LAB related to kimchi fermentation [defined asbacteria with more than a 1% average relative composition (ARC)]. Metatranscriptome analysis revealed that,with the exception of two microorganisms, all LAB probed in the microarray contributed to kimchifermentation. Moreover, the relative compositions of the major LAB remained unchanged (there was lessthan a 1.5% difference between the maximum and minimum values) in our metagenome analysis, while ourmetatranscriptome analysis revealed significant differences in the relative compositions of major LAB duringfermentation (relative compositions changed by 2.4% to 9.5%). These data indicate that microorganisms thatare less abundant in the flora (those with less than a 5% ARC in the metagenomic analysis) also participatedin kimchi fermentation with relatively high activities.
Crown Copyright © 2009 Published by Elsevier B.V. All rights reserved.
1. Introduction
Kimchi is a fermented vegetable product made of variousvegetables such as Chinese cabbage, radish, cucumber, and aseasoning mixture (red pepper powder, garlic, ginger, and greenonion) (Kim et al., 2000). Kimchi contains various health-promotingcomponents, including β-carotene, chlorophyll, vitamin C, and dietaryfiber (Park et al., 1995). In addition, the anti-mutagen (Oh et al., 2005),anti-oxidation (Yoo et al., 2005) and angiotensin-converting enzymeinhibition (Yoo et al., 2004) activities of kimchi are thought to protectagainst disease. Bacteria isolated from kimchi produce beneficialenzymes, such as dextransucrase and alcohol/acetaldehyde dehydro-genase (Eom et al., 2007). Because of these beneficial properties,kimchi was nominated as one of the world's healthiest foods in a 2006issue of Health Magazine (http://www.health.com/).
Kimchi is fermented by lactic acid bacteria (LAB); thus, a betterunderstanding of the kimchi fermentation process can be obtained bystudying the diversity of these bacteria. Various species of LABinvolved in kimchi fermentation, including those in the Leuconostocand Lactobacillus genera (Mheen and Kwon, 1984), have been
ology, KRIBB, Daejeon 305-806,0 4677.
09 Published by Elsevier B.V. All rig
identified using the conventional methods of isolation and phenotypiccharacterization (Lim et al., 1989; Park et al., 1990; Shin et al., 1996).Many LAB species have been identified using culture-dependentmethods; however, the culture bias inherent in these methods makesit difficult to thoroughly identify the entire microbial community.Thus, recent studies have used molecular ecological methods tofurther characterize the microbial communities involved in kimchifermentation. In particular, 16S rDNA cloning and amplified ribosomalDNA restriction analysis (ARDRA) (Kim and Chun, 2005), 16S rDNAamplification and denaturing gradient gel electrophoresis (DGGE)analysis (Lee et al., 2005) and genome probing microarrays (GPMs)(Bae et al., 2005) have been applied to microorganisms involved inkimchi fermentation.
DNAmicroarrays were first introduced in 1995 (Schena et al., 1995)and are typically constructed by arraying hundreds or thousands ofDNA samples on small glass slides. Oligomer and cDNA microarraysdiffer with regard to the length of the spotted probes used. Whilespecificity and sensitivity are critical prerequisites in any microarrayexperiment, cDNA microarrays generally lack specificity (Xu et al.,2001) and oligomer arrays generally lack sensitivity (Urakawa et al.,2002). Accordingly, oligomer microarrays are generally subject toenrichment or PCR amplification protocols to obtain a sufficientnumber of molecules (Revel et al., 2002). These processes alter theoriginal environmental conditions, making it difficult to assess the size
hts reserved.

Table 1List of microorganisms probed in GPM
ID KCTCno.
Strain name Accessionno.
ID KCTCno.
Strain name Accessionno.
1 3108 Lactobacillusplantarum
X54259 21 3549 Lactobacillussuebicus
AJ575744
2 3161 Lactobacillusamylophilus
M58806 22 3594 Lactobacillus reuteri X76328
3 3167 Lactobacilluscoryniformissubsp.coryniformis
M58813 23 3597 Lactobacillusamylovorus
M58805
4 3498 Lactobacillusbrevis
M58810 24 3606 Lactobacillus agilis M58803
5 3501 Lactobacillusanimalis
M58807 25 3608 Lactobacillusvaccinostercus
AJ417735
6 3542 Lactobacillusgraminis
AM113778 26 3804 Lactobacillus zeae D86516
7 3543 Lactobacillusfructivorans
M58818 27 3537 Leuconostoc fallax AB023239
8 3546 Lactobacillusmurinus
M58826 28 3525 Leuconostoccarnosum
X95977
9 3593 Lactobacillusalimentarius
M58804 29 3652 Leuconostocpseudomesenteroides
X95979
10 3596 Lactobacillusmali
M58824 30 3544 Leuconostocfructosum
X61140
11 3603 Lactobacillussakei subsp.sakei
M58829 31 3528 Leuconostoc lactis M23031
12 3611 Lactobacilluskefiri
AB024300 32 3530 Leuconostocmesenteroides subsp.dextranicum
AB023246
13 3670 Lactobacillusoris
X94229 33 3504 Weissella viridescens M23040
14 3681 Lactobacillusfarciminis
M58817 34 3505 Leuconostocmesenteroides subsp.mesenteroides
M23035
15 3767 Lactobacilluscurvatus
AY204894 35 3773 Leuconostocargentinum
AF175403
16 3802 Lactobacillussakei subsp.carnosus
AY204892 36 3531 Weissellaparamesenteroides
M23033
17 3814 Lactobacillusversmoldensis
AJ496791 37 3604 Weissella minor M23039
18 13927 Lactobacillusdiolivorans
AF264701 38 3499 Weissella confusa AB023241
19 3112 Lactobacillusfermentum
M58819 39 3526 Leuconostoc citreum AF111948
20 3503 Lactobacillusparabuchneri
AY026751
141Y.-D. Nam et al. / International Journal of Food Microbiology 130 (2009) 140–146
of the microbial community and the quantity of a certain gene. Incontrast to cDNA and oligomer microarrays, GPMs are highly specificand can distinguish microorganisms at the species level (microorgan-isms sharing 97% 16S rRNA sequence identity). In addition, GPMs boastsuperior sensitivity and are capable of detecting as little as 1 ng nucleicacid (Bae and Park, 2006; Bae et al., 2005; Chang et al., 2008b,c).However, GPMs are unable to elucidate the real dynamics of microbialcommunities during fermentation because these arrays use environ-mental DNA (metagenomes) as target samples, and DNA-basedanalyses reveal the total number of microorganisms rather than thebiological activities of these organisms. Therefore, new technologicalapproaches that use environmental mRNAs (metatranscriptomes)are better suited to investigate microbial dynamics during kimchifermentation.
Here, we describe the construction of genome probing microarrays(GPM) specific to 39 LAB strains. The hybridization signal patterns ofeach metagenome and metatranscriptome sample were subsequentlycompared to determine the community structure and biologicalactivity of bacteria during kimchi fermentation. To our knowledge,this is the first study to examine themicrobial dynamics and biologicalactivities of bacteria during kimchi fermentation using DNA- andmRNA-based microarrays.
2. Materials and methods
2.1. Kimchi sampling
We purchased 10 kg samples of kimchi from Chongga (http://www.chongga.com: this cite was lastly accessed at January 6th 2009),the most popular distributor in Korea. The kimchi was maintained at4 °C, and 5 mL aliquots of kimchi soup were periodically obtained tomeasure the pH. Each sample was then stored at −80 °C in preparationfor DNA and RNA extraction.
2.2. Bacterial strains and growth conditions
We used 39 strains of LAB as probes to assess microbial dynamicsduring kimchi fermentation (Table 1). The strains used in this studywere obtained from the Korea Type Culture Collection (KCTC) and theGerman Collection of Microorganisms and Cell Cultures (DSMZ). Eachstrain was grown under the conditions recommended by the supplier.Cells were quickly harvested during exponential phase and frozen at−80 °C in preparation for DNA extraction.
2.3. DNA extraction and quantification
Genomic DNA from pure cultures and bulk community DNA fromkimchi were isolated using a previously described bead-beatingmethod (Yeates et al., 1998). All DNA samples were treated withRNase A (Sigma, St. Louis, MO) and analyzed on ethidium bromide-stained agarose gels stained prior to the fabrication and hybridizationof microarrays. The extracted DNAs were further purified using theUltraClean® Microbial DNA Isolation Kit (Mo Bio Laboratories, SolanaBeach, CA) according to the manufacturer's recommendations, withthe exception that the bead-beating step was excluded and the DNAsolution was added to Solution MD1 instead of the MicroBeadSolution. The concentrations of the purified DNA samples weredetermined in triplicate using a spectrophotometer (NanodropTechnologies, Rockland, DE).
2.4. RNA extraction and SSU RNA subtraction
In preparation for RNA extraction, 5 mL aliquots of kimchi soupwere pelleted by centrifugation at 5400 g for 10 min. The pellets werethen lysed in 1 mL of Trizol reagent (Invitrogen Life Technologies,Karlsruhe, Germany) and 0.4 mL of zirconia-silica beads (0.1 mm
diameter; Roth, Karlsruhe, Germany) in a Mini-BeadbeaterTM (Bios-pec Products, Bartlesville, USA). The RNA was then isolated accordingto the protocol established by Invitrogen. Contaminated DNAmolecules were removed by incubating the samples with 50 U ofDNase I (Fermentas) in the presence of 1.5 mM MgCl2 and 80 U ofRNaseOut (Invitrogen) at 37 °C for 30 min. The RNA was thenprecipitated by the addition of 5 M lithium chloride, washed withethanol, and dried via vacuum centrifugation. After resuspending theRNA samples in 100 μl of DEPC-treated water, the concentration andpurity of each sample was assessed in triplicate, using a spectro-photometer (Nanodrop Technologies, Rockland, DE). The 16S and 23SrRNAs were then removed using the MICROBExpress™ BacterialmRNA Enrichment Kit (Ambion, Austin, TX). The total RNAs and rRNA-depleted RNAs were visualized on agarose gels stained with ethidiumbromide.
2.5. Synthesis of cDNA from community mRNA
The 16S rRNA- and 23S rRNA-subtracted RNA samples wereapplied to the ExpressArt® Bacterial mRNA Amplification kit (ArtusGmbH, Hamburg, Germany) to synthesize cDNA from the communitymRNAs. Samples (5 μg each) were mixed with 3 μl of DEPC-treated

142 Y.-D. Nam et al. / International Journal of Food Microbiology 130 (2009) 140–146
water, 1 μl of dNTP and 1 μl of primer TR. The cDNA synthesis mixturewas incubated for 4min at 65 °C and cooled at 37 °C. Subsequently, 4 μlof DEPC-treated water, 4 μl of 5X RT butter, 1 μl of RNase inhibitor and1 μl of RT enzyme were added to the mixture. The first-strand cDNAswere synthesized during a 45 min incubation at 37 °C, followed by a10 minute incubation at 45 °C, a 5 minute incubation at 50 °C and a1 minute incubation at 37 °C. First-strand cDNA synthesis wasterminated via incubation for 15 min at 80 °C and the remainingprimers and RNA were removed by treatment with primer erase andRNase.
Second-strand cDNA synthesis was initiated with the addition of10 μl DEPC-treated water, 3 μl of 5X extender buffer, 1 μl of primer Band 1 μl of a dNTP mixture. After a 1 minute incubation at 96 °C and a1 minute incubation at 37 °C, 1 μl each of extender enzymes A and Bwas added to the mixture. At the conclusion of the reaction, theremaining primers were removed by the addition of 1 μl of primererase. The newly synthesized double-stranded cDNA molecules werepurified using the spin columns supplied with the kit.
2.6. Microarray construction
The genomic DNA extracted from each strain was diluted to a finalconcentration of 400 ng/µl in 0.1 X TE. Aliquots (5 μl) of each probegenome were transferred to a 384-well microplate and mixed with5 μl of 2X microarray spotting solution (ArrayIt™, Telechem Interna-tional, Inc., Sunnyvale, CA) in preparation for printing. The probeswere arrayed onto Super-amine glass slides (25 mm by 75 mm;Telechem) at a spacing distance of 250 μm using a PixSys 5500 Printer(Cartesian Technologies, Inc. Irvine, CA) and four pins, in the presenceof 55% to 58% relative humidity. Each probe set was printed inquadruplicate. The slides were cross-linked via exposure to 120 mJ ofultraviolet irradiation (UV Stratalinker 1800, Stratagene, La Jolla, CA).Immediately after blocking, the DNA samples were denatured byimmersing the slides in deionized water (dH2O) at 95 °C for 2min. Themicroarrays were then rinsed briefly in 95% ethanol, air dried at roomtemperature and stored in a clean slide box at room temperature.
2.7. DNA and cDNA labeling
The bulk community DNAs and newly synthesized cDNAs werelabeled using the BioPrime DNA Labeling System. The manufacturer's
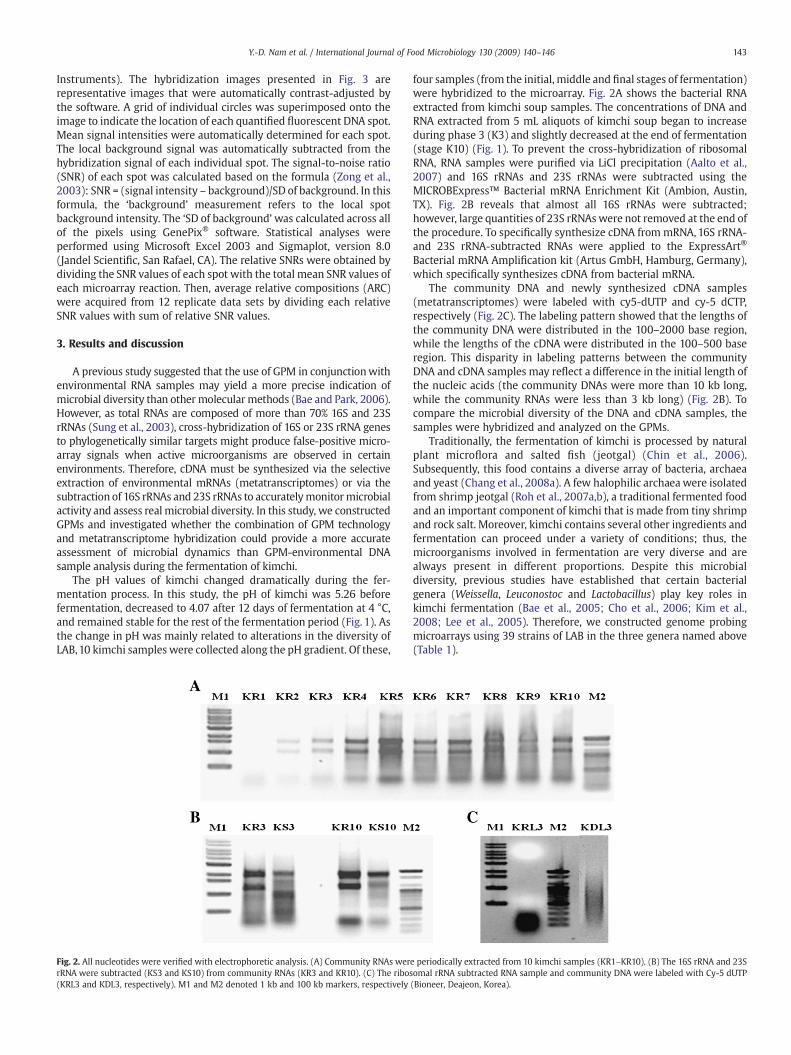
Fig. 1. Change in pH during kimchi fermentation. Kimchi soup was sampled during fermentatmetagenome and metatranscriptome analyses. The concentrations of each nucleic acid are
protocol was modified bymixing 15 μl of DNA (1 μg) with 20 μl of 2.5Xrandom primers. The DNA was then denatured by boiling for 2 min,and was immediately chilled on ice. The denatured genomic DNAsolution was then mixed with 15 μl of a labeling solution containing5 mM each of dATP, dTTP, and dGTP; 2.5 mM dCTP; 2.5 mM Cy3-labeled dCTP (Amersham Pharmacia Biotech, Piscataway, NJ); and40 U of Klenow fragment (Invitrogen, Carlsbad, CA). The reactionmixture was incubated at 37 °C for 3 h. The labeled target DNA waspurified using QIAquick PCR purification column (Qiagen, Valencia,CA), concentrated in a Speedvac for 1 h, and resuspended in 4.35 μl ofdH2O in preparation for hybridization.
2.8. Microarray hybridization and data analysis
Microarray hybridizations were performed in triplicate (a total of12 replicates per genomic DNA probe), unless otherwise noted, toenable statistical analyses. The hybridization solution consisted of4.35 μl of labeled DNA, 8.75 μl of formamide (50% v/v), 3X SSC (1X SSCcontaining 150 mM NaCl and 15 mM trisodium citrate), 1.25 μg ofunlabeled herring sperm DNA (Promega, Madison, WI), and 0.3% SDSin a total volume of 17.5 μl. Aliquots (7.5 μl) of hybridization mixturewere deposited directly onto the slides and covered with a cover slip(i.e. 10 mm by 15 mm; Sigma). We then dispensed 15 μl of 3X SSC intothe hydration wells on either side of the hybridization chambers(Corning). The microarray slides were placed into hybridizationchambers, boiled for 5 min to denature the hybridization solution,and immediately plunged into a temperature-adjusted water bath,where they were allowed to hybridize overnight. After hybridization,each microarray slide was taken out of the water bath and the coverslip was immediately removed in wash solution 1 (containing 1X SSCand 0.2% SDS). The slides werewashed for 5min each inwash solution1, wash solution 2 (0.1X SSC and 0.2% SDS), and wash solution 3 (0.1XSSC) at room temperature. The slides were then dried via centrifuga-tion as described above.
A GenePix® 4000B microarray scanner (Axon instruments, UnionCity, CA) was used to scan the microarrays at a resolution of 10 μm. Toensure that all of the hybridized slides were scanned in a consistentmanner, the laser power and photomultiplier tube (PMT) gain wereadjusted to 100%. The scanned image displays were analyzed byquantifying the pixel density (intensity) of each hybridization spotusing the GenePix® software program, version 6.0 (Axon
ion given the labels K1 to K10. Of these ten samples, K3, K5, K8 and K10 were used in theshown alongside the pH curve.
143Y.-D. Nam et al. / International Journal of Food Microbiology 130 (2009) 140–146
Instruments). The hybridization images presented in Fig. 3 arerepresentative images that were automatically contrast-adjusted bythe software. A grid of individual circles was superimposed onto theimage to indicate the location of each quantified fluorescent DNA spot.Mean signal intensities were automatically determined for each spot.The local background signal was automatically subtracted from thehybridization signal of each individual spot. The signal-to-noise ratio(SNR) of each spot was calculated based on the formula (Zong et al.,2003): SNR = (signal intensity – background)/SD of background. In thisformula, the ‘background’ measurement refers to the local spotbackground intensity. The ‘SD of background’was calculated across allof the pixels using GenePix® software. Statistical analyses wereperformed using Microsoft Excel 2003 and Sigmaplot, version 8.0(Jandel Scientific, San Rafael, CA). The relative SNRs were obtained bydividing the SNR values of each spot with the total mean SNR values ofeach microarray reaction. Then, average relative compositions (ARC)were acquired from 12 replicate data sets by dividing each relativeSNR values with sum of relative SNR values.
3. Results and discussion
A previous study suggested that the use of GPM in conjunctionwithenvironmental RNA samples may yield a more precise indication ofmicrobial diversity than other molecular methods (Bae and Park, 2006).However, as total RNAs are composed of more than 70% 16S and 23SrRNAs (Sung et al., 2003), cross-hybridization of 16S or 23S rRNA genesto phylogenetically similar targets might produce false-positive micro-array signals when active microorganisms are observed in certainenvironments. Therefore, cDNA must be synthesized via the selectiveextraction of environmental mRNAs (metatranscriptomes) or via thesubtraction of 16S rRNAs and 23S rRNAs to accuratelymonitormicrobialactivity and assess real microbial diversity. In this study, we constructedGPMs and investigated whether the combination of GPM technologyand metatranscriptome hybridization could provide a more accurateassessment of microbial dynamics than GPM-environmental DNAsample analysis during the fermentation of kimchi.
The pH values of kimchi changed dramatically during the fer-mentation process. In this study, the pH of kimchi was 5.26 beforefermentation, decreased to 4.07 after 12 days of fermentation at 4 °C,and remained stable for the rest of the fermentation period (Fig. 1). Asthe change in pH was mainly related to alterations in the diversity ofLAB,10 kimchi samples were collected along the pH gradient. Of these,
Fig. 2. All nucleotides were verified with electrophoretic analysis. (A) Community RNAs werrRNA were subtracted (KS3 and KS10) from community RNAs (KR3 and KR10). (C) The ribos(KRL3 and KDL3, respectively). M1 and M2 denoted 1 kb and 100 kb markers, respectively
four samples (from the initial, middle and final stages of fermentation)were hybridized to the microarray. Fig. 2A shows the bacterial RNAextracted from kimchi soup samples. The concentrations of DNA andRNA extracted from 5 mL aliquots of kimchi soup began to increaseduring phase 3 (K3) and slightly decreased at the end of fermentation(stage K10) (Fig. 1). To prevent the cross-hybridization of ribosomalRNA, RNA samples were purified via LiCl precipitation (Aalto et al.,2007) and 16S rRNAs and 23S rRNAs were subtracted using theMICROBExpress™ Bacterial mRNA Enrichment Kit (Ambion, Austin,TX). Fig. 2B reveals that almost all 16S rRNAs were subtracted;however, large quantities of 23S rRNAswere not removed at the end ofthe procedure. To specifically synthesize cDNA frommRNA, 16S rRNA-and 23S rRNA-subtracted RNAs were applied to the ExpressArt®
Bacterial mRNA Amplification kit (Artus GmbH, Hamburg, Germany),which specifically synthesizes cDNA from bacterial mRNA.
The community DNA and newly synthesized cDNA samples(metatranscriptomes) were labeled with cy5-dUTP and cy-5 dCTP,respectively (Fig. 2C). The labeling pattern showed that the lengths ofthe community DNA were distributed in the 100–2000 base region,while the lengths of the cDNA were distributed in the 100–500 baseregion. This disparity in labeling patterns between the communityDNA and cDNA samples may reflect a difference in the initial length ofthe nucleic acids (the community DNAs were more than 10 kb long,while the community RNAs were less than 3 kb long) (Fig. 2B). Tocompare the microbial diversity of the DNA and cDNA samples, thesamples were hybridized and analyzed on the GPMs.
Traditionally, the fermentation of kimchi is processed by naturalplant microflora and salted fish (jeotgal) (Chin et al., 2006).Subsequently, this food contains a diverse array of bacteria, archaeaand yeast (Chang et al., 2008a). A few halophilic archaea were isolatedfrom shrimp jeotgal (Roh et al., 2007a,b), a traditional fermented foodand an important component of kimchi that is made from tiny shrimpand rock salt. Moreover, kimchi contains several other ingredients andfermentation can proceed under a variety of conditions; thus, themicroorganisms involved in fermentation are very diverse and arealways present in different proportions. Despite this microbialdiversity, previous studies have established that certain bacterialgenera (Weissella, Leuconostoc and Lactobacillus) play key roles inkimchi fermentation (Bae et al., 2005; Cho et al., 2006; Kim et al.,2008; Lee et al., 2005). Therefore, we constructed genome probingmicroarrays using 39 strains of LAB in the three genera named above(Table 1).
e periodically extracted from 10 kimchi samples (KR1–KR10). (B) The 16S rRNA and 23Somal rRNA subtracted RNA sample and community DNA were labeled with Cy-5 dUTP(Bioneer, Deajeon, Korea).

Fig. 3. Representative fluorescence images of DNA and RNA kimchi samples (i.e., samples K3, K5, K8 and K10) hybridized to the GPMs. The contrast of each image was automaticallymodulated using GenePix software to enable visualization with the naked eye.
144 Y.-D. Nam et al. / International Journal of Food Microbiology 130 (2009) 140–146
Our metagenome analysis revealed that 23 of the 39 LAB speciesanalyzed exhibited more than a 1% ARC (Fig. 4A). Previously, Bae et al.reported that Lactobacillus species (e.g., Lactobacillus brevis, Lactoba-cillus alimentarius, and Lactobacillus oris), Leuconostoc species (e.g.,Leuconostoc mesenteroides and Leuconostoc pseudomesenteroides), andsomeWeissella species were predominant in kimchi (Bae et al., 2005).However, our community metagenome analysis revealed only fourmajor species of LAB (representing more than 5% of ARC) involved inkimchi fermentation. This may reflect differences in the number ofprobes, as only probes spotted on the GPMs could be detected. Thefour major species of bacteria detected in our study included Lacto-bacillus sakei subsp. carnosus KCTC 3802T [37.4% average relativecomposition (ARC)], Lactobacillus sakei subsp. sakei KCTC 3603T (24.5%ARC), Lactobacillus curvatus KCTC 3767T (7.7% ARC) and Lactobacillusgraminis KCTC 3542T (5.2% ARC) (Figs. 3 and 4B). Previous studiesrevealed that Lc. sakei is a major component of the kimchi flora (Choet al., 2006; Kim and Chun, 2005; Lee et al., 2005). Lactobacilluscurvatus was also present in large numbers, although it was notidentified as frequently as was Lc. sakei. While Lc. graminis exhibited5.2% ARC during kimchi fermentation, this organism has never beforebeen reported as a major component of the kimchi flora. Our DNAanalysis revealed that the relative compositions of these microorgan-isms remained relatively stable during fermentation (the relativecompositions changed by less than 1.5%).
In contrast to the results of our metagenome analysis, ourmetatranscriptome analysis revealed that 37 of 39 species exhibitedARC greater than 1%, and 7 species accounted for more than 5% of therelative composition (Fig. 4). Ourmetatranscriptome analysis revealedthe four species identified via our metagenome analysis as well asthree additional species of LAB, including Leu. pseudomesenteroidesKCTC 3652T (4.6% ARC), Weissella viridescens KCTC 3504T (6.3% ARC)and Weissella minor KCTC 3604T (5.7% ARC) (Fig. 4B). Leuconostocpseudomesenteroides was previously identified as a dominant micro-organism during kimchi fermentation (Bae et al., 2005). Likewise,Weissella species (e.g.,W. cibaria, W. confuse, andW. koreensis) are alsoknown mediators of kimchi fermentation (Bae et al., 2005; Cho et al.,2006; Kim and Chun, 2005; Lee et al., 2005). Our metatranscriptomeanalysis revealed that Weissella spp. may also contribute to kimchi
Fig. 4. The quantities of LAB in each kimchi samples were detected with GPMs at a PMT gaiKD10) and cDNAs (KR3, KR5, KR8, and KR10) from kimchi are shown in each column. (Ametagenome and metatranscriptome from the kimchi were used for hybridization. The SNRyellow squares from lower values of SNRs and more red squares from higher values. (B) Whkimchi fermentation in metagenome analysis, relative composition of these microorganism
fermentation. The relative compositions of the seven microorganismsidentified in our RNA analysis fluctuated throughout the fermentationprocess (by 2.4% to 9.5%) (Fig. 4B).
The relative compositions of the seven species (those exhibitingmore than 5% relative composition in the metagenome andmetatranscriptome analyses) did not change during kimchi fermen-tation as shown by the metagenomic data (Fig. 4B). However, ourmetatranscriptome analysis revealed modulations in all of the majorLAB species (as defined by a 4.75% mean max–min compositionvalue). Specifically, Lc. graminis comprised 15.8%, 7.6%, 6.3% and10.2% of the overall microbial flora as the fermentation processprogressed, while Lc. curvatus comprised 15.1%, 8.4%, 10.0% and 7.7%of the microbial flora. This differs from our metagenomic data,which indicated that the relative composition of Lc. graminis and Lc.curvatus remained stable (5.2%, 5.2%, 6.0% and 4.5%; and 7.9%, 7.9%,7.4% and 7.7%, respectively) during fermentation. The relativecomposition of Leu. pseudomesenteroides also appeared stable inthe metagenome analysis (2.4%, 2.4%, 2.0% and 1.9%), but fluctuatedin the metatranscriptome analysis (1.5%, 6.1%, 5.5% and 5.5%). Whilethe sum of the ARC for the four most abundant species at eachphase was over 69.7% in metagenome analysis, the sum of the ARCfor the seven most abundant species at each phase was less than56.8% in metatranscriptome analysis. These data indicate thatmetagenome analyses reveal the diversity of the microbial faunabut fail to describe the biological activity of the microorganisms, asmetagenome analyses can detect live but inactive microorganisms.Moreover, the number of microorganisms comprising 2% to 5% ofthe microbial flora remained fairly stable in the metagenomeanalysis (3, 3, 4, and 4), but fluctuated in the metatranscriptomeanalysis (1, 10, 7 and 6). Thus, a combination of metagenome andmetatranscriptome analyses is needed to accurately assess microbialdynamics. In our metagenome analysis, relatively minor populationsof microorganisms remained undetected because the four mostabundant microbial genomes were present in such large numbers.However, our metatranscriptome analysis revealed that less abun-dant microorganisms in metagenome analysis (those exhibiting lessthan 5% ARC) also participated in kimchi fermentation withrelatively high activities.
n of 700 V. Microarray hybridization patterns of the labeled DNAs (KD3, KD5, KD8, and) Each row represents the hybridization signal observed for each LAB when 1 μg ofs were visualized by ArrayColor.exe (http://microarray.brc.re.kr), which produces moreile relative compositions of seven major microorganisms almost did not change durings fluctuated in metatranscriptome analysis.

145Y.-D. Nam et al. / International Journal of Food Microbiology 130 (2009) 140–146
146 Y.-D. Nam et al. / International Journal of Food Microbiology 130 (2009) 140–146
Most molecular methods of monitoring microbial diversity arebased onmetagenome analyses (Bae et al., 2005; Chin et al., 2006; Choet al., 2006; Kim and Chun, 2005; Lee et al., 2005). However, thesemethods may not reveal the microorganisms responsible for kimchifermentation because inactive bacteria (dormant cells, spores, anddead cells inwhich the DNA is not yet degraded) are detected as activecells (Bodrossy et al., 2006). In this study, we showed thatmetatranscriptome analyses can be used to monitor microbialdynamics during kimchi fermentation. Our results clearly demon-strate that the apparent composition of microbial communities canvary, depending on the use of DNA or mRNA samples. Furthermore,our metatranscriptome analysis revealed a more divergent microbialpopulation and more accurately portrayed the changes in microbialactivity. Thus, the methods and data presented in this study willcontribute to the understanding of microbial population dynamicsduring the fermentation processes and improve manufacturing in alarger scale using artificially inoculated bacterial seed cultures.
Acknowledgements
This work was supported by NMC0300837, the EnvironmentalBiotechnology National Core Research Center (KOSEF: R15-2003-012-02002-0) and the Conservation Technology Research and Develop-ment project (FTM0300811). The first author was supported by theKorea Research Foundation Grant funded by the Korean Government(MOEHRD, Basic Research Promotion Fund) (KRF-2007-512-C00016).
References
Aalto, A.P., Sarin, L.P., van Dijk, A.A., Saarma, M., Poranen, M.M., Arumae, U., Bamford, D.H.,2007. Large-scale production of dsRNA and siRNA pools for RNA interference utilizingbacteriophage phi6 RNA-dependent RNA polymerase. RNA 13, 422–429.
Bae, J.W., Park, Y.H., 2006. Homogeneous versus heterogeneous probes for microbialecological microarrays. Trends in Biotechnology 24, 318–323.
Bae, J.W., Rhee, S.K., Park, J.R., Chung, W.H., Nam, Y.D., Lee, I., Kim, H., Park, Y.H., 2005.Development and evaluation of genome-probing microarrays for monitoring lacticacid bacteria. Applied and Environmental Microbiology 71, 8825–8835.
Bodrossy, L., Stralis-Pavese, N., Konrad-Koszler, M., Weilharter, A., Reichenauer, T.G.,Schofer, D., Sessitsch, A., 2006. mRNA-based parallel detection of active methano-troph populations by use of a diagnostic microarray. Applied and EnvironmentalMicrobiology 72, 1672–1676.
Chang, H.W., Kim, K.H., Nam, Y.D., Roh, S.W., Kim, M.S., Jeon, C.O., Oh, H.M., Bae, J.W.,2008a. Analysis of yeast and archaeal population dynamics in kimchi usingdenaturing gradient gel electrophoresis. International Journal of FoodMicrobiology126, 159–166.
Chang, H.W., Nam, Y.D., Jung, M.Y., Kim, K.H., Roh, S.W., Kim,M.S., Jeon, C.O., Yoon, J.H., Bae,J.W., 2008b. Statistical superiority of genome-probing microarrays as genomic DNA-DNA hybridization in revealing the bacterial phylogenetic relationship compared toconventional methods. Journal of Microbiological Methods 75, 523–530.
Chang, H.W., Sung, Y., Kim, K.H., Nam, Y.D., Roh, S.W., Kim, M.S., Jeon, C.O., Bae, J.W.,2008c. Development of microbial genome-probing microarrays using digitalmultiple displacement amplification of uncultivated microbial single cells.Environmental Science and Technology 42, 6058–6064.
Chin, H.S., Breidt, F., Fleming, H.P., Shin, W.C., Yoon, S.S., 2006. Identifications ofpredominant bacterial isolates from the fermenting kimchi using ITS-PCR and partial16S rDNA sequence analyses. Journal of Microbiology and Biotechnology 16, 68–76.
Cho, J., Lee, D., Yang, C., Jeon, J., Kim, J., Han, H., 2006. Microbial population dynamics ofkimchi, a fermented cabbage product. FEMS Microbiology Letters 257, 262–267.
Eom, H.J., Seo, D.M., Han, N.S., 2007. Selection of psychrotrophic Leuconostoc spp.producing highly active dextransucrase from lactate fermented vegetables.International Journal of Food Microbiology 117, 61–67.
Kim, J.F., Jeong, H., Lee, J.S., Choi, S.H., Ha, M., Hur, C.G., Kim, J.S., Lee, S., Park, H.S., Park, Y.H.,Oh, T.K., 2008. Complete genome sequence of Leuconostoc citreum KM20. Journal ofBacteriology 190, 3093–3094.
Kim, M., Chun, J., 2005. Bacterial community structure in kimchi, a Korean fermentedvegetable food, as revealed by 16S rRNA gene analysis. International Journal of FoodMicrobiology 103, 91–96.
Kim, Y.K.L., Koh, E., Chung, H.J., Kwon, H., 2000. Determination of ethyl carbamate insome fermented Korean foods and beverages. Food Additives and Contaminants 17,469–475.
Lee, J.S., Heo, G.Y., Jun, W.L., Oh, Y.J., Park, J.A., Park, Y.H., Pyun, Y.R., Jong, S.A., 2005.Analysis of kimchi microflora using denaturing gradient gel electrophoresis.International Journal of Food Microbiology 102, 143–150.
Lim, C.R., Park, H.K., Han, H.U., 1989. Reevaluation of isolation and identification ofGram-positive bacteria in kimchi. Korean Journal of Microbiology. 27, 404–414.
Mheen, T.I., Kwon, T.W., 1984. Effect of temperature and salt concentration on kimchifermentation. Korean Journal of Food Science and Technology 16, 443–450.
Oh, S.Y., Ji, H.L., Dong, K.J., Seung, C.H., Hyo, J.K., 2005. Relationship of nutrients and foodto colorectal cancer risk in Koreans. Nutrition Research 25, 805–813.
Park, H.K., Lim, C.R., Han, H.U., 1990. Microbial succession in Kimchi fermentation atdifferent temperatures. Bulletin of the Institue for Basic Science 11, 161–169.
Park, K.Y., Baek, K.A., Rhee, S.H., Cheigh, H.S., 1995. Antimutagenic effect of kimchi. FoodBiotechnology 4, 141–145.
Revel, A.T., Talaat, A.M., Norgard, M.V., 2002. DNA microarray analysis of differentialgene expression in Borrelia burgdorferi, the Lyme disease spirochete. Proceedingsof the National Academy of Sciences of the United States of America 99,1562–1567.
Roh, S.W., Nam, Y.D., Chang, H.W., Sung, Y., Kim, K.H., Lee, H.J., Oh, H.M., Bae, J.W., 2007a.Natronococcus jeotgali sp. nov., a halophilic archaeon isolated from shrimp jeotgal,a traditional fermented seafood from Korea. International Journal of Systematic andEvolutionary Microbiology 57, 2129–2131.
Roh, S.W., Nam, Y.D., Chang, H.W., Sung, Y., Kim, K.H., Oh, H.M., Bae, J.W., 2007b.Halalkalicoccus jeotgali sp. nov., a halophilic archaeon fromshrimp jeotgal, a traditionalKorean fermented seafood. International Journal of Systematic and EvolutionaryMicrobiology 57, 2296–2298.
Schena, M., Shalon, D., Davis, R.W., Brown, P.O., 1995. Quantitative monitoring of geneexpression patterns with a complementary DNA microarray. Science 270, 467–470.
Shin, D.H., Kim, M.S., Han, J.S., Lim, D.K., Bak, W.S., 1996. Changes of chemicalcomposition and microflora in commercial Kimchi. Korean Journal of Food Scienceand Technology. 28, 137–145.
Sung, K., Khan, S.A., Nawaz, M.S., Khan, A.A., 2003. A simple and efficient Triton X-100boiling and chloroform extraction method of RNA isolation from Gram-positive andGram-negative bacteria. FEMS Microbiology Letters 229, 97–101.
Urakawa, H., Noble, P.A., El Fantroussi, S., Kelly, J.J., Stahl, D.A., 2002. Single-base-pairdiscrimination of terminal mismatches by using oligonucleotide microarrays andneural network analyses. Applied and Environmental Microbiology 68, 235–244.
Xu, W., Bak, S., Decker, A., Paquette, S.M., Feyereisen, R., Galbraith, D.W., 2001.Microarray-based analysis of gene expression in very large gene families: thecytochrome P450 gene superfamily of Arabidopsis thaliana. Gene 272, 61–74.
Yeates, C., Gillings, M.R., Davison, A.D., Altavilla, N., Veal, D.A., 1998. Methods formicrobial DNA extraction from soil for PCR amplification. Biological ProcedureOnline 1, 40–47.
Yoo, E.J., Choi, M.R., Lim, H.S., 2004. The relationship between ACE inhibitory activityand degradations of sulfur containing materials in Dolsan leaf mustard juice.Biotechnology and Bioprocess Engineering 9, 400–404.
Yoo, E.J., Lim, H.S., Park, K.O., Choi, M.R., 2005. Cytotoxic, antioxidative, and ACEinhibiting activities of Dolsan Leaf Mustard Juice (DLMJ) treated with lactic acidbacteria. Biotechnology and Bioprocess Engineering 10, 60–66.
Zong, Y., Wang, Y., Zhang, S., Shi, Y., 2003. How to evaluate a microarray scanner. InHardiman, G. (ed.), Microarrays Methods and Applications: Nuts & Bolts. DNA press,LLC, pp. 97–114.

![Lactic Acid - NIHSLactic Acid 乳酸C3H6O3:90.08 (2RS)-2-Hydroxypropanoic acid [50-21-5] Lactic Acid is a mixture of lactic acid and lactic an-hydride. It contains not less than 85.0z](https://img.pdfslide.us/doc/110x75/6107906c3f161736212a9570/lactic-acid-nihs-lactic-acid-ec3h6o39008-2rs-2-hydroxypropanoic-acid.jpg)