Embed Size (px)
Citation preview
International Journal of Educational Research 62 (2013) 115–128
Contents lists available at ScienceDirect
International Journal of Educational Research
jo u r nal h o mep age: w ww.els evier .c o m/lo c ate / i jed ur es
Effectiveness of a Danish early year preschool program:§
A randomized trialBente Jensen a,*, Anders Holm b,c, Sven Bremberg d,e
a Department of Education, Aarhus University, Tuborgvej 164, Copenhagen 2400 NV, Denmarkb Department of Sociology, University of Copenhagen, Denmarkc SFI: The Danish National Centre for Social Research, Herluf Trollesgade 11, Copenhagen 1052 K, Denmarkd Karolinska Institute, Stockholm, Swedene National Institute of Public Health, Sweden
A R T I C L E I N F O
Article history:
Received 18 January 2012
Received in revised form 29 May 2013
Accepted 21 June 2013
Available online 24 August 2013
Keywords:
Preschool
Socio-emotional problems
Systematic quality improvement
RCT
Denmark
A B S T R A C T
A significant number of studies indicate that early year preschool programs lead to
positive long-term effects. Systematic quality improvement of early year preschool may
enhance these outcomes. The ASP Program was built on this principle. In this program
preschool staff are supported in their efforts to critically reflect on current practices and to
change these. A randomized controlled study was carried out in Denmark from September
2006 to May 2008. The study encompassed 2323 children in 59 preschools in two
municipalities. Children were assessed using the Strength and Difficulties Questionnaire at
the start of the intervention, at mid term, and by the end. The results indicate that, in the
intervention group, children developed fewer emotional symptoms, conduct problems,
became less hyperactive and were more attentive. The effect sizes ranged between 0.15
and 0.2.
� 2013 The Authors. Published by Elsevier Ltd. All rights reserved.
1. Introduction
A significant number of studies indicate that early year preschool programs lead to positive long-term effects with respectto academic achievements, employment and health (Barnett, 1998). In a number of countries, e.g. in the Scandinaviancountries, almost all children aged between 1 and 3 already attend preschool. In these countries, the challenge is not toextend preschool coverage, but instead to improve the quality of care offered in preschools in order to further enhance childoutcomes.
1.1. Systematic quality improvement
Different methods are used to improve the outcomes of educational institutions and the effects of some of these methodshave been studied. For example, Hattie reviewed 800 meta-studies on interventions that were designed to improve academicachievements. The meta-studies built on 50 000 controlled or observational studies (Hattie, 2008). Most of the reviewedstudies dealt with children in compulsory schools, where children typically start at age 6. Yet, these studies are probably also
§ This is an open-access article distributed under the terms of the Creative Commons Attribution License, which permits unrestricted use, distribution,
and reproduction in any medium, provided the original author and source are credited.* Corresponding author. Tel.: +45 2211 9726.
E-mail addresses: [email protected] (B. Jensen), [email protected], [email protected] (A. Holm), [email protected] (S. Bremberg).
0883-0355/$ – see front matter � 2013 The Authors. Published by Elsevier Ltd. All rights reserved.
http://dx.doi.org/10.1016/j.ijer.2013.06.004
B. Jensen et al. / International Journal of Educational Research 62 (2013) 115–128116
relevant for preschools. Hattie ranks the effect sizes of the 138 most studied interventions or determinants and found thatinterventions where teachers are offered opportunities for ‘‘formative evaluation’’ result in the largest effect size. Hattiedescribes ‘‘formative evaluation’’ as any activity that is used to assess the learning process, followed by a change in theteacher’s activity after which the activity is evaluated. Hattie reports that the mean effect size of such interventions is 0.9,which is a large effect.
Formative evaluation is closely related to the system for systematic quality assurance that was developed in the Japaneseauto industry in the 1950s (Maurer, 2012). Due to its Japanese origin, this approach is often referred to as ‘‘Kaizen’’, whichmeans improvement or change for the better. This approach has been applied in a number of different fields, both inmanufacturing and in service production. The core idea is the same as in formative evaluation: the process starts byexamining aspects of existing practices, new approaches are tested, the effect of these new approaches are examined, basedon the results alternative approaches are tried, evaluated etc. Since the 1980s this concept of quality improvement has alsobeen advocated for educational institutions (Murgatroyd, 1989).
The concepts of formative evaluation and Kaizen are furthermore related to an evolutionary approach to organizationallearning. Based on reflection, in this approach new ways of solving current issues are tested and evaluated (Sundbo, 2003). Itis essential that the process starts with current practices, rather than with theories (Ellstrom, 2010), however includingcodified scientific knowledge in the process has proven effective (Jensen, Johnson, Lorenz, & Lundvall, 2007).
The concept of organizational learning does not seem to be widely used with regard to quality development of preschools,and the authors of this paper are not aware of any published controlled study of the effectiveness organizational learning inthis setting.
1.2. Preschool for socially disadvantaged children
The social situation of the family affects a child’s competences and health when starting school (OECD, 2009). Suchcompetences include language skills, cognitive abilities and ability to interact with other people (Almond & Currie, 2011).Social differences often increase during the child’s school years. Thus, in order to reduce long term social inequalities, there isa need to improve the competences of socially disadvantaged children already before they start school (Leseman, 2009).Offering preschool for all children may have this effect (Havnes & Mogstad, 2012; Leseman, 2009; OECD, 2009, 2011;Sammons et al., 2013). Yet, even in countries such as the Scandinavian countries where almost all children attend preschool,there are still social differences in competences and health at the time of school entry (Reinhardt-Pedersen & Madsen, 2001).Improving the quality of universal preschools may reduce these social differences.
1.3. Characteristics of effective preschools
No review on the effect of preschool characteristics on children’s competences and health is as extensive Hattie’s reviewof school interventions (Hattie, 2008). Yet, some studies on preschools have been presented. Favorable child outcomes seemto be promoted by an emotionally safe environment and sensitive, supportive, and verbal stimulating interactions betweenteachers and children (Leseman, 2009). Studies that have been carried out in US indicate that such characteristics arepromoted by ensuring highly qualified teachers (NICHD Early Child Care Research Network, 2005; Phillips, Mekos, Scarr,McCartney, & Abbott-Shim, 2001). However, in these studies only a minority of the teachers had at least a bachelor’s degreein early child education. In Scandinavia about half of the teachers in preschool have this level of training (The SwedishNational Agency for Education, 2012). Thus, it is not clear if increasing the percentage of academically trained teachers willimprove child outcomes in these countries. In a large prospective Danish study, the academic outcomes of children at age 15have been related to characteristics of the preschools that these children had attended before school entry (Bauchmuller,Gørtz, & Wurtz, 2011). A high percentage of academically trained teachers improved outcomes at age 15, but the effect sizewas extremely small.
A low child-to-teacher ratio is also advantageous. Yet, there does not seem to be a linear relationship between the child-to-teacher ratio and child outcomes. One review indicates that less than 12 teachers per 100 children seems to bedetrimental to child outcomes, but simply increasing the number of staff seems to have a limited impact (Bremberg, 2001).This finding is relevant for a Scandinavian context with typically 18 staff per 100 children in preschools in Sweden (TheSwedish National Agency for Education, 2012). A relatively weak relationship between child-to-teacher ratio and childoutcomes is consistent with the findings in Hattie’s review of schools (Hattie, 2008). This conclusion is also coherent with thefindings in the prospective Danish study (Bauchmuller et al., 2011). In the Danish study, the authors found that a highernumber of staff per child improved outcomes at age 15, but also this effect size was extremely small.
A cross-national study indicates that a teaching approach that includes a high proportion of child-initiated activitiespromotes language and cognitive development (Montie, Xiang, & Schweinhart, 2006). In the Scandinavian countries, e.g. inSweden, preschools already have this characteristic (Taguma, Litjens, & Kim, 2013).
Within the ‘‘Effective Provision of Pre-school Education’’ (EPPE) Project, Sylva and others studied the effect of preschoolsin the UK (Sylva, Melhuish, Sammons, Siraj-Blatchford, & Taggart, 2011). They assessed a wide range of quality aspects ofpreschools (in total 61 aspects), including personal care routines, language-reasoning, activities, staff-to-child interactions,interaction between staff and parents, program structure and ‘cognitive’ curricula. They found a strong relationship betweencomposite quality indices and child outcomes. The quality aspects that were included in the indices were highly correlated.
B. Jensen et al. / International Journal of Educational Research 62 (2013) 115–128 117
This means that e.g. that in preschools with a high quality of staff-to-child interactions went with it was also more commonwith a high variation of activities, etc. Accordingly, this study indicates that there is no single point of entry for improvingpreschool quality.
1.4. Specific preschool programs
The results from three carefully evaluated American preschool programs have been published: the Perry PreschoolProgram, the Abecedarian Project and the Tools of the Mind Curriculum. All participants in these studies were recruited fromsocially disadvantaged families. Randomized controlled studies of these programs demonstrate that children thatparticipated in a program had better outcomes compared with the children in the control groups, who did not attend anypreschool at all. The results are not directly transferable to a Scandinavian context where almost all children attendpreschool. From these studies, it is not possible to discern specific characteristics that contributed to a positive outcome. Theoutline of these programs, however, can be used to inspire preschool staff when they are about to improve the quality at aspecific preschool.
The Perry Preschool Program was established in the 1960s (Weikart, 1998). The objective was to improve theparticipating children’s intelligence, their school-preparedness and academic performance, and to reduce future socialproblems, e.g. criminal activity. A total of 123 children were included in the study that followed the children from they were3–4 years old. The program demonstrated effects, albeit small effects, after one year, however, these effects became moresignificant later on. Thus, improvements in educational attainment, income, risk of criminality and risky health behaviorshave been demonstrated at a 37-year follow up (Muennig, Schweinhart, Montie, & Neidell, 2009). Children from theespecially vulnerable families gained most from participating in the program.
The Perry Preschool Program was based on Piaget’s developmental theory in which the child’s cognitive capacity isunderstood to develop in phases. The Perry curriculum takes into account the individual child’s development level. This fitswell with the previously reviewed findings in the cross-national study that indicated that child-centered learning isadvantageous (Montie et al., 2006).
The Abecedarian project was established in the 1970s (Ramey, Campbell, Burchinal, Skinner, Gardner, & Ramey, 2000).The objective was to increase the children’s intellectual capacity. A total of 111 children and their families participated in acontrolled study. Improvements in intellectual capacity and educational attainment were recorded. As in the Perry PreschoolProgram, children from the especially socially vulnerable families gained most from participating in the project.
The Abecedarian curriculum rests on seven principles: (1) encouragement of children to explore their surroundings inorder to learn and understand, (2) guidance in basic skills and how to use these skills, (3) appreciation and recognition ofacquired skills, (4) practice and further development of new skills, (5) protection against disapproval, teasing andpunishment, (6) varied use of communication, giving response when appropriate, thus stimulating language andunderstanding of symbols, and (7) guidance and setting boundaries for behavior.
The Tools of the Mind Curriculum (TOM) was established in the 1990s (Bodrova & Leong, 2006). The objective of theprogram was to support the intentional development of early literacy, self-regulation, and cognitive skills. A total of 274children participated in a controlled study. A decrease in problem behavior and improvement of language skills wererecorded. Classroom quality was greatly improved.
The program is built on Lev Vygotsky’s theories. In Vygotsky’s view the development of the reasoning in children emergesthrough practical activities in a social environment. The development of reasoning is understood to be semiotically mediatedand therefore contingent on cultural practices and language, as well as on universal cognitive processes (Vygotsky,Hanfmann, & Vakar, 1962). TOM has two main goals that are viewed as inseparable: (1) the development of skills such asself-regulation, memory and focused attention, and (2) the development of specific academic skills such as symbolicthought, literacy and an understanding of mathematics. Play is viewed as the leading activity for developing interpersonalskills and self-regulation, and the curriculum emphasizes the teacher’s role in supporting children to develop matureintentional dramatic play, while ensuring that each child is active in all activities. An important element in the program is tohelp teachers to understand the development of the individual preschoolers’ play in interaction with the teachers.Accordingly, TOM provides teachers with a range of tools and strategies that help children and teachers to scaffold learningin the preschool (Barnett et al., 2008; Bodrova & Leong, 2006).
1.5. Improving preschools in order to enhance life chances for disadvantaged children
Preschools may both improve the life chances of young people in general, and specifically improve the life chances ofindividuals from disadvantaged families. The literature review indicates at least four requirements that are needed toachieve these objectives. Firstly, most disadvantaged children have to attend preschools. This is best achieved whenattending preschool is the social norm. Secondly, there have to be more than 12 staff per 100 children. Thirdly, a high fractionof the teachers have to have at least a bachelor’s degree in early child education. Fourthly, the teaching approach mustinclude a high proportion of child-initiated activities. In Scandinavia all these requirements are fulfilled. Still, children fromdisadvantages families have less developed competences when starting school. Obviously, additional initiatives arewarranted. One way is to try to improve the quality of the preschool. This study reports the results of such a trial that hasbeen carried out in Denmark.

B. Jensen et al. / International Journal of Educational Research 62 (2013) 115–128118
In a trial, large resources might be used to achieve maximal effects. The limitation of this approach is, however, that itmight be hard to implement the intervention on a large scale. Thus, in this study relatively few resources were used.
There does not seem to be any single superior method for improving preschool quality. The most promising approachseems to be to give teachers the opportunity to systematically improve the quality of their teaching, starting with reflectionson current ordinary activities. These reflections may be enriched by studies of examples of successful preschoolinterventions.
2. Aim
The aim of the study was to establish effects of a new method for enhancing preschool quality, ‘‘Action Competences inSocial Pedagogical Work with Socially Endangered Children and Youth’’ (the ASP Program), on child competences, both inchildren in general and in children from disadvantaged families.
3. Materials and methods
In recent years, Denmark has increased its focus on socially disadvantaged children. In 2006, the Danish governmentpresented a strategy to combat negative social inheritance, Equal Opportunities for All Children and Young People, and in 2007the revised Day care Facilities Act was presented (Ministry of Social affairs Denmark, 2004; Ministry of Family and ConsumerAffairs, 2007). Both the strategy and the day care act emphasize that socially disadvantaged children must be given the sameopportunities as other children, and they are both based on the premise that education already from an early age in day careis essential with regard to reducing social inequalities later on in life.
3.1. The ASP Program
The ASP Program was developed in 2005. It consists of two parts. Firstly, the program’s pedagogic principles werepresented at a series of workshops and seminars and in booklets. Secondly, the preschool staff was given the opportunity toreflect on how they approached ordinary activities.
The pedagogic principles in the three reviewed programs, the Perry Preschool Program, the Abecedarian project and theTools of the Mind Curriculum, were presented in the program. The Tools of the Mind Curriculum was considered to especiallyuseful since it harmonizes well with Danish legislation in the preschool area. A number of general pedagogical principles thatwere derived from three theorists (Berger, 1973; Dewey, 1986; Mead, 1934) were also presented. In the ASP Program, thechild is understood to develop socio-emotionally and academically through interactions with significant others andexploration of the environment. Learning is understood to be an integral part of the practice of everyday life and the result ofparticipation in a socio-cultural context.
The learning of disadvantaged and privileged children is understood to differ since privileged children have learnt moreskills early on in their life, that is before they start preschool (Bernstein, 1975; Bourdieu & Passeron, 1990). Thus, in the ASPProgram, the objective is for the teacher to try to provide the individual child with learning opportunities that are match thechild’s skill level. Moreover, since the level of skills varies, disadvantaged children are at risk of being excluded from playsituations with other children, which in turn might reinforce the disadvantage of these children. Accordingly, the role of theteacher is to arrange situations that minimize exclusion.
The second part the ASP Program includes offering teachers and other early childhood educators opportunities for criticalreflection, described in Section 1.1 as systematic quality improvement.
Therefore teachers are educated and trained to work with theories on children’s learning and development in a socio-cultural perspective, as well as theories of exclusion and inclusion mechanisms in children’s everyday life, including thepreschool context (see also Bourdieu & Passeron, 1990). The overall goal is for the teacher to recognize every child’s progressand encourage the child to explore new sides of him- or herself, as well as to embark on new activities independently ofothers.
The focal point is to ensure integration of new knowledge in the organization (the preschool) by changing routineactivities.
3.2. Design of the evaluation
In order to assess the effect of ASP, a randomized controlled trial was carried out in two Danish municipalities, starting inSeptember 2006 and ending in May 2008. It included a total of 37 and 200 preschools, respectively. In a first step allpreschools with at least 39 children were selected, i.e. 19 preschools of the 37 participating preschools in the firstmunicipality, and 39 preschools of the 200 participating preschools in the second municipality. On average, preschoolsenrolled approximately 50 children and 10 staff. The staff included both early childhood educators and assistant teacherswith no specific training. At the start of the study in September 2006, a total of 2314 3–6-year-old children were enrolled.The participating 58 preschools were first stratified into three groups on the basis of the parents’ level of education, socialwelfare dependency and unemployment status. This information was obtained from Statistics Denmark. Within each of thethree strata, preschools were randomly selected to either the intervention group (N = 29) or the reference group (N = 29).
B. Jensen et al. / International Journal of Educational Research 62 (2013) 115–128 119
3.3. The ASP intervention
The ASP intervention includes three activities: workshops, education and training in reflection groups and conferenceswith pedagogical consultants.
Workshops: During the intervention period there were two workshops per year in each municipality. On average therewere 100 participants at each workshop with an average duration of 6 h. The main subject was presentation of pedagogicprinciples as described in Section 3.1.
Education and training in reflection groups: Each preschool decided how much time should be dedicated to working withknowledge and reflection. On average the preschools dedicated 17 h to this, with 3 h per session. Considerably less time wasearmarked for reflection than was originally recommended. A consultant from a university college supported eachpreschool. Most of these consultants hold an MA in early childhood education or another relevant field. On average, eachpreschool was paid a visit by a consultant from a university college six times during the entire program period. The universityconsultants supported the staff at the meetings in the reflection groups. The preschools were also supported by consultantsfrom the municipality that assisted preschool staff in how to use the knowledge base, how to develop practices in thereflection sessions, and how to implement the improvements the staff had decided to implement.
Conferences with pedagogical consultants: Three conferences for all participants were arranged, one at the start of theprogram in 2006, one midterm in 2007, and one in 2008. At these conferences, preschool staff participated together withconsultants from the university colleges, consultants from the municipalities and the researchers that were involved in thestudy. One seminar for all preschool staff was also arranged by each municipality at midterm.
In order to structure the overall process, project managers from the University of Aarhus specified a number of commongoals that the participating preschools were expected to reach during the intervention period.
3.4. Data collected
Child data was collected at three occasions: at the start in September 2006, in May 2007 and at the end of the program inMay 2008.
The outcome for each child was scored by the teachers at the preschool in question using the Strengths and DifficultiesQuestionnaire (SDQ) to assess the psycho-social adjustment of the children (Goodman, 1997). The SDQ scale consists of fivesub-scales that measure different aspects of children’s personal and social behavior. These sub-scales are (a) emotionalsymptoms, (b) conduct problems, (c) hyperactivity/inattention, (d) peer relational problems and (e) pro-social behavior. Inthe analysis, the five scales were analyzed separately.
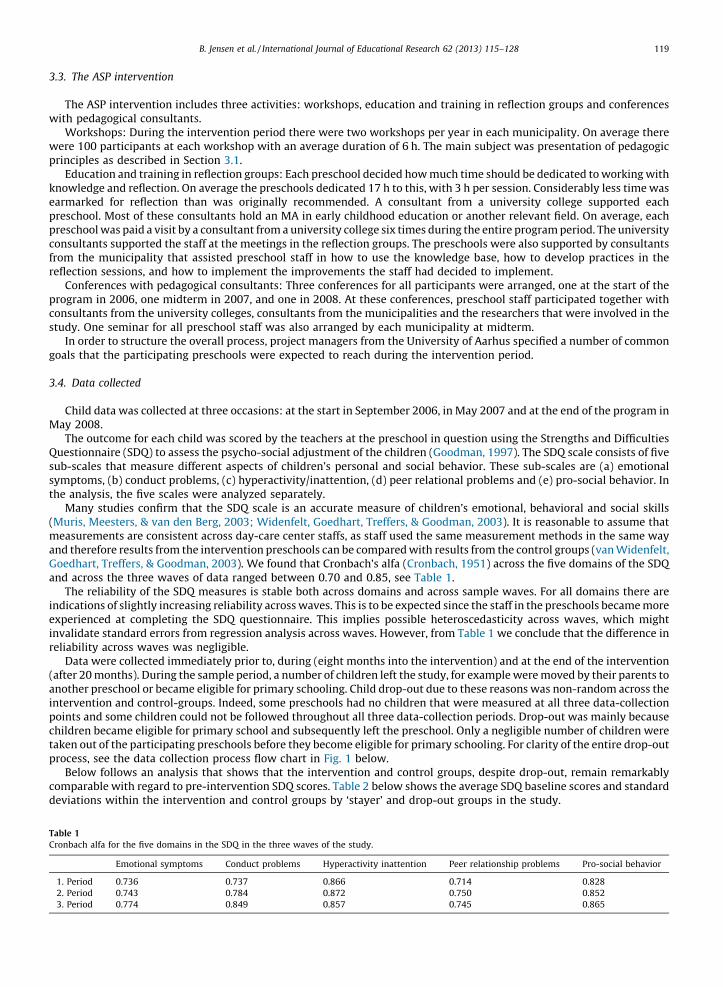
Many studies confirm that the SDQ scale is an accurate measure of children’s emotional, behavioral and social skills(Muris, Meesters, & van den Berg, 2003; Widenfelt, Goedhart, Treffers, & Goodman, 2003). It is reasonable to assume thatmeasurements are consistent across day-care center staffs, as staff used the same measurement methods in the same wayand therefore results from the intervention preschools can be compared with results from the control groups (van Widenfelt,Goedhart, Treffers, & Goodman, 2003). We found that Cronbach’s alfa (Cronbach, 1951) across the five domains of the SDQand across the three waves of data ranged between 0.70 and 0.85, see Table 1.
The reliability of the SDQ measures is stable both across domains and across sample waves. For all domains there areindications of slightly increasing reliability across waves. This is to be expected since the staff in the preschools became moreexperienced at completing the SDQ questionnaire. This implies possible heteroscedasticity across waves, which mightinvalidate standard errors from regression analysis across waves. However, from Table 1 we conclude that the difference inreliability across waves was negligible.
Data were collected immediately prior to, during (eight months into the intervention) and at the end of the intervention(after 20 months). During the sample period, a number of children left the study, for example were moved by their parents toanother preschool or became eligible for primary schooling. Child drop-out due to these reasons was non-random across theintervention and control-groups. Indeed, some preschools had no children that were measured at all three data-collectionpoints and some children could not be followed throughout all three data-collection periods. Drop-out was mainly becausechildren became eligible for primary school and subsequently left the preschool. Only a negligible number of children weretaken out of the participating preschools before they become eligible for primary schooling. For clarity of the entire drop-outprocess, see the data collection process flow chart in Fig. 1 below.
Below follows an analysis that shows that the intervention and control groups, despite drop-out, remain remarkablycomparable with regard to pre-intervention SDQ scores. Table 2 below shows the average SDQ baseline scores and standarddeviations within the intervention and control groups by ‘stayer’ and drop-out groups in the study.
Table 1
Cronbach alfa for the five domains in the SDQ in the three waves of the study.
Emotional symptoms Conduct problems Hyperactivity inattention Peer relationship problems Pro-social behavior
1. Period 0.736 0.737 0.866 0.714 0.828
2. Period 0.743 0.784 0.872 0.750 0.852
3. Period 0.774 0.849 0.857 0.745 0.865
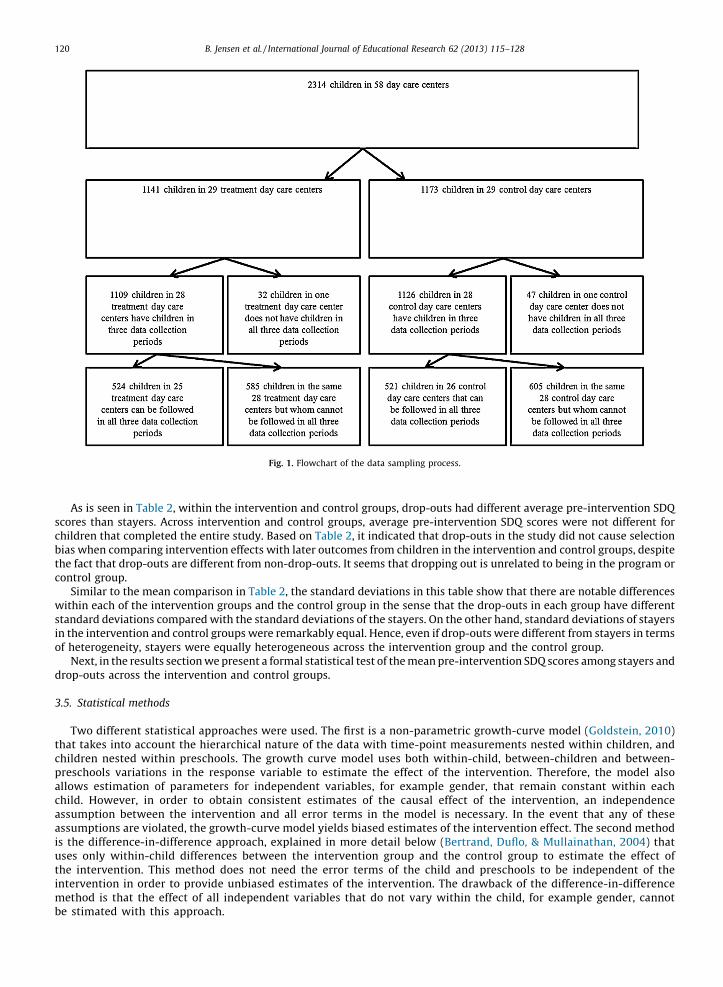
Fig. 1. Flowchart of the data sampling process.
B. Jensen et al. / International Journal of Educational Research 62 (2013) 115–128120
As is seen in Table 2, within the intervention and control groups, drop-outs had different average pre-intervention SDQscores than stayers. Across intervention and control groups, average pre-intervention SDQ scores were not different forchildren that completed the entire study. Based on Table 2, it indicated that drop-outs in the study did not cause selectionbias when comparing intervention effects with later outcomes from children in the intervention and control groups, despitethe fact that drop-outs are different from non-drop-outs. It seems that dropping out is unrelated to being in the program orcontrol group.
Similar to the mean comparison in Table 2, the standard deviations in this table show that there are notable differenceswithin each of the intervention groups and the control group in the sense that the drop-outs in each group have differentstandard deviations compared with the standard deviations of the stayers. On the other hand, standard deviations of stayersin the intervention and control groups were remarkably equal. Hence, even if drop-outs were different from stayers in termsof heterogeneity, stayers were equally heterogeneous across the intervention group and the control group.
Next, in the results section we present a formal statistical test of the mean pre-intervention SDQ scores among stayers anddrop-outs across the intervention and control groups.
3.5. Statistical methods
Two different statistical approaches were used. The first is a non-parametric growth-curve model (Goldstein, 2010)that takes into account the hierarchical nature of the data with time-point measurements nested within children, andchildren nested within preschools. The growth curve model uses both within-child, between-children and between-preschools variations in the response variable to estimate the effect of the intervention. Therefore, the model alsoallows estimation of parameters for independent variables, for example gender, that remain constant within eachchild. However, in order to obtain consistent estimates of the causal effect of the intervention, an independenceassumption between the intervention and all error terms in the model is necessary. In the event that any of theseassumptions are violated, the growth-curve model yields biased estimates of the intervention effect. The second methodis the difference-in-difference approach, explained in more detail below (Bertrand, Duflo, & Mullainathan, 2004) thatuses only within-child differences between the intervention group and the control group to estimate the effect ofthe intervention. This method does not need the error terms of the child and preschools to be independent of theintervention in order to provide unbiased estimates of the intervention. The drawback of the difference-in-differencemethod is that the effect of all independent variables that do not vary within the child, for example gender, cannotbe stimated with this approach.
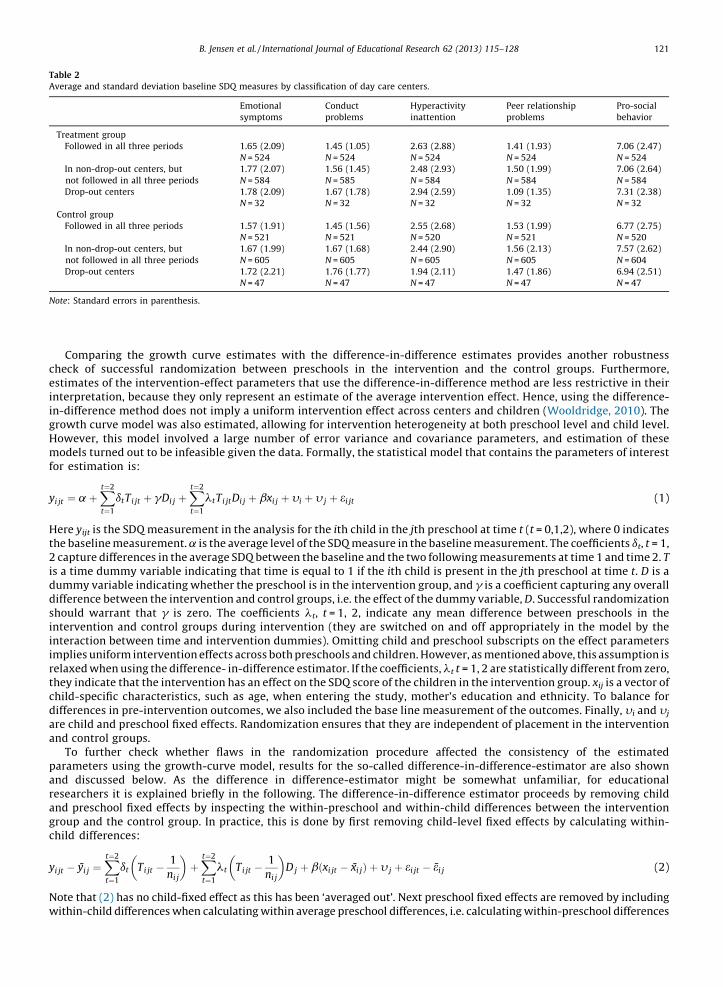
Table 2
Average and standard deviation baseline SDQ measures by classification of day care centers.
Emotional
symptoms
Conduct
problems
Hyperactivity
inattention
Peer relationship
problems
Pro-social
behavior
Treatment group
Followed in all three periods 1.65 (2.09)
N = 524
1.45 (1.05)
N = 524
2.63 (2.88)
N = 524
1.41 (1.93)
N = 524
7.06 (2.47)
N = 524
In non-drop-out centers, but
not followed in all three periods
1.77 (2.07)
N = 584
1.56 (1.45)
N = 585
2.48 (2.93)
N = 584
1.50 (1.99)
N = 584
7.06 (2.64)
N = 584
Drop-out centers 1.78 (2.09)
N = 32
1.67 (1.78)
N = 32
2.94 (2.59)
N = 32
1.09 (1.35)
N = 32
7.31 (2.38)
N = 32
Control group
Followed in all three periods 1.57 (1.91)
N = 521
1.45 (1.56)
N = 521
2.55 (2.68)
N = 520
1.53 (1.99)
N = 521
6.77 (2.75)
N = 520
In non-drop-out centers, but
not followed in all three periods
1.67 (1.99)
N = 605
1.67 (1.68)
N = 605
2.44 (2.90)
N = 605
1.56 (2.13)
N = 605
7.57 (2.62)
N = 604
Drop-out centers 1.72 (2.21)
N = 47
1.76 (1.77)
N = 47
1.94 (2.11)
N = 47
1.47 (1.86)
N = 47
6.94 (2.51)
N = 47
Note: Standard errors in parenthesis.
B. Jensen et al. / International Journal of Educational Research 62 (2013) 115–128 121
Comparing the growth curve estimates with the difference-in-difference estimates provides another robustnesscheck of successful randomization between preschools in the intervention and the control groups. Furthermore,estimates of the intervention-effect parameters that use the difference-in-difference method are less restrictive in theirinterpretation, because they only represent an estimate of the average intervention effect. Hence, using the difference-in-difference method does not imply a uniform intervention effect across centers and children (Wooldridge, 2010). Thegrowth curve model was also estimated, allowing for intervention heterogeneity at both preschool level and child level.However, this model involved a large number of error variance and covariance parameters, and estimation of thesemodels turned out to be infeasible given the data. Formally, the statistical model that contains the parameters of interestfor estimation is:
yi jt ¼ a þXt¼2
t¼1
dtTi jt þ gDi j þXt¼2
t¼1
ltTi jtDi j þ bxi j þ yi þ y j þ ei jt (1)
Here yijt is the SDQ measurement in the analysis for the ith child in the jth preschool at time t (t = 0,1,2), where 0 indicatesthe baseline measurement. a is the average level of the SDQ measure in the baseline measurement. The coefficients dt, t = 1,2 capture differences in the average SDQ between the baseline and the two following measurements at time 1 and time 2. T
is a time dummy variable indicating that time is equal to 1 if the ith child is present in the jth preschool at time t. D is adummy variable indicating whether the preschool is in the intervention group, and g is a coefficient capturing any overalldifference between the intervention and control groups, i.e. the effect of the dummy variable, D. Successful randomizationshould warrant that g is zero. The coefficients lt, t = 1, 2, indicate any mean difference between preschools in theintervention and control groups during intervention (they are switched on and off appropriately in the model by theinteraction between time and intervention dummies). Omitting child and preschool subscripts on the effect parametersimplies uniform intervention effects across both preschools and children. However, as mentioned above, this assumption isrelaxed when using the difference- in-difference estimator. If the coefficients, lt t = 1, 2 are statistically different from zero,they indicate that the intervention has an effect on the SDQ score of the children in the intervention group. xij is a vector ofchild-specific characteristics, such as age, when entering the study, mother’s education and ethnicity. To balance fordifferences in pre-intervention outcomes, we also included the base line measurement of the outcomes. Finally, yi and yj
are child and preschool fixed effects. Randomization ensures that they are independent of placement in the interventionand control groups.
To further check whether flaws in the randomization procedure affected the consistency of the estimatedparameters using the growth-curve model, results for the so-called difference-in-difference-estimator are also shownand discussed below. As the difference in difference-estimator might be somewhat unfamiliar, for educationalresearchers it is explained briefly in the following. The difference-in-difference estimator proceeds by removing childand preschool fixed effects by inspecting the within-preschool and within-child differences between the interventiongroup and the control group. In practice, this is done by first removing child-level fixed effects by calculating within-child differences:
yi jt � yi j ¼Xt¼2
t¼1
dt Ti jt �1
ni j
� �þXt¼2
t¼1
lt Ti jt �1
ni j
� �D j þ bðxi jt � xi jÞ þ y j þ ei jt � ei j (2)
Note that (2) has no child-fixed effect as this has been ‘averaged out’. Next preschool fixed effects are removed by includingwithin-child differences when calculating within average preschool differences, i.e. calculating within-preschool differences
B. Jensen et al. / International Journal of Educational Research 62 (2013) 115–128122
using (2):
yi jt � yi j � y j ¼Xt¼2
t¼1
dt Ti jt �1
ni j� 1
n j
� �þXt¼2
t¼1
lt Ti jt �1
ni j� 1
n j
� �D j þ bðxi jt � xi j � x jÞ þ ei jt � ei j � e j (3)
(3) is estimated by ordinary least squares as there is no child or preschool fixed effect and the twice-differenced observationsare now independent across children and preschools. OLS estimates provide estimates of time, intervention effects andregression parameters of the independent variables. Note that no assumptions have been made about the distribution offixed effects or whether they were correlated with being in the intervention group or with the independent variables. Hence,even if children and preschools were partly allocated to the intervention based on unobserved child and preschool fixedeffects, the difference-in-difference estimator would still allow consistent estimate of the intervention effects. This isopposed to the growth-curve model, where consistent estimates are conditional on the fixed effects and are independent ofthe allocation process in the intervention. However, the difference-in-difference approach also has a drawback. If theindependent variables are constant within each child, e.g. gender, then the difference-in-difference estimator will notprovide an estimate of these variables as they are eliminated when applying the within-child differencing procedure. Thisalso includes baseline measures of the outcome variables. Hence, where the growth curve model controls for a potential in-balance in outcomes in the base line, these differences are washed out by the difference-in-difference estimator.
4. Results
In this section we first how that the control and intervention group are fully balanced with respect to the outcomemeasures, then we proceed to establish that there is a significant difference between the intervention group and controlgroup, and finally we demonstrate that the intervention effect does not seem to be a Hawthorne effect because we establishthat children in the intervention preschools vary with regard to their outcome. This difference is due to the fact that eventhough the children go to the same preschool, they might not have been exposed to the same level of intervention.
First we show that the control and intervention group are fully balanced with respect to outcome measures. To test this,we compare the intervention and control groups by comparing standard deviations in pre-intervention SDQ scores amongstayers and drop-outs. This is also shown in Table 3 below.
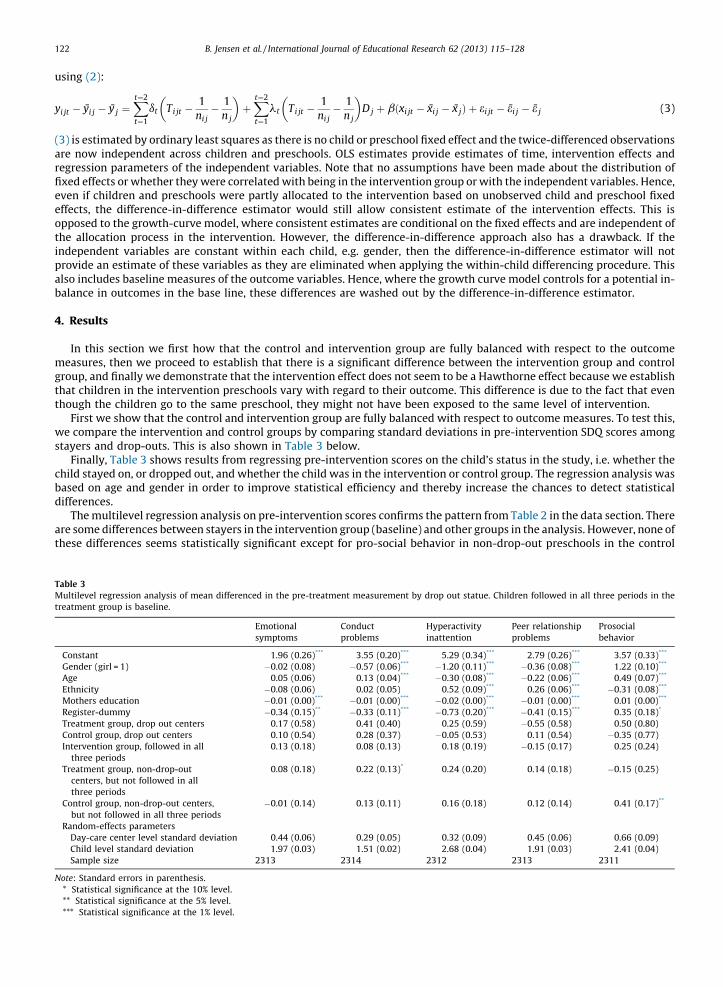
Finally, Table 3 shows results from regressing pre-intervention scores on the child’s status in the study, i.e. whether thechild stayed on, or dropped out, and whether the child was in the intervention or control group. The regression analysis wasbased on age and gender in order to improve statistical efficiency and thereby increase the chances to detect statisticaldifferences.
The multilevel regression analysis on pre-intervention scores confirms the pattern from Table 2 in the data section. Thereare some differences between stayers in the intervention group (baseline) and other groups in the analysis. However, none ofthese differences seems statistically significant except for pro-social behavior in non-drop-out preschools in the control
Table 3
Multilevel regression analysis of mean differenced in the pre-treatment measurement by drop out statue. Children followed in all three periods in the
treatment group is baseline.
Emotional
symptoms
Conduct
problems
Hyperactivity
inattention
Peer relationship
problems
Prosocial
behavior
Constant 1.96 (0.26)*** 3.55 (0.20)*** 5.29 (0.34)*** 2.79 (0.26)*** 3.57 (0.33)***
Gender (girl = 1) �0.02 (0.08) �0.57 (0.06)*** �1.20 (0.11)*** �0.36 (0.08)*** 1.22 (0.10)***
Age 0.05 (0.06) 0.13 (0.04)*** �0.30 (0.08)*** �0.22 (0.06)*** 0.49 (0.07)***
Ethnicity �0.08 (0.06) 0.02 (0.05) 0.52 (0.09)*** 0.26 (0.06)*** �0.31 (0.08)***
Mothers education �0.01 (0.00)*** �0.01 (0.00)*** �0.02 (0.00)*** �0.01 (0.00)*** 0.01 (0.00)***
Register-dummy �0.34 (0.15)** �0.33 (0.11)*** �0.73 (0.20)*** �0.41 (0.15)*** 0.35 (0.18)*
Treatment group, drop out centers 0.17 (0.58) 0.41 (0.40) 0.25 (0.59) �0.55 (0.58) 0.50 (0.80)
Control group, drop out centers 0.10 (0.54) 0.28 (0.37) �0.05 (0.53) 0.11 (0.54) �0.35 (0.77)
Intervention group, followed in all
three periods
0.13 (0.18) 0.08 (0.13) 0.18 (0.19) �0.15 (0.17) 0.25 (0.24)
Treatment group, non-drop-out
centers, but not followed in all
three periods
0.08 (0.18) 0.22 (0.13)* 0.24 (0.20) 0.14 (0.18) �0.15 (0.25)
Control group, non-drop-out centers,
but not followed in all three periods
�0.01 (0.14) 0.13 (0.11) 0.16 (0.18) 0.12 (0.14) 0.41 (0.17)**
Random-effects parameters
Day-care center level standard deviation 0.44 (0.06) 0.29 (0.05) 0.32 (0.09) 0.45 (0.06) 0.66 (0.09)
Child level standard deviation 1.97 (0.03) 1.51 (0.02) 2.68 (0.04) 1.91 (0.03) 2.41 (0.04)
Sample size 2313 2314 2312 2313 2311
Note: Standard errors in parenthesis.
* Statistical significance at the 10% level.
** Statistical significance at the 5% level.
*** Statistical significance at the 1% level.
B. Jensen et al. / International Journal of Educational Research 62 (2013) 115–128 123
group, when considering children who are not followed throughout the three periods. The likelihood ratio test statistic forwhether all group indicators can be removed from the model is insignificant for all five SDQ sub-scales. Hence, overall thereseems to be no detectable differences between children with regard to drop-out status in the study. We therefore believethat the balanced data is as good as randomly assigned data in spite of drop-outs in both groups.
Next we aim to show a general effect of the intervention; i.e. if there are mean differences in SDQ scores between theintervention and the control groups in the second and third periods, but not in the first baseline measurement period. Indetailed analyses that will follow later on (not presented in this paper), the effect of socially disadvantaged children will bestudied.
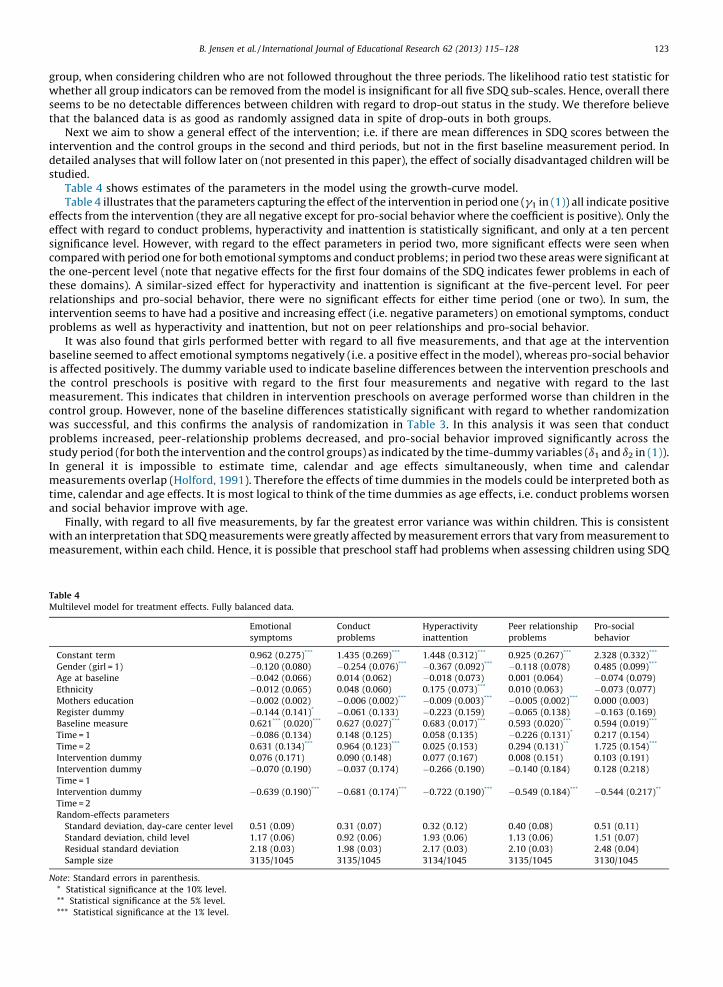
Table 4 shows estimates of the parameters in the model using the growth-curve model.Table 4 illustrates that the parameters capturing the effect of the intervention in period one (g1 in (1)) all indicate positive
effects from the intervention (they are all negative except for pro-social behavior where the coefficient is positive). Only theeffect with regard to conduct problems, hyperactivity and inattention is statistically significant, and only at a ten percentsignificance level. However, with regard to the effect parameters in period two, more significant effects were seen whencompared with period one for both emotional symptoms and conduct problems; in period two these areas were significant atthe one-percent level (note that negative effects for the first four domains of the SDQ indicates fewer problems in each ofthese domains). A similar-sized effect for hyperactivity and inattention is significant at the five-percent level. For peerrelationships and pro-social behavior, there were no significant effects for either time period (one or two). In sum, theintervention seems to have had a positive and increasing effect (i.e. negative parameters) on emotional symptoms, conductproblems as well as hyperactivity and inattention, but not on peer relationships and pro-social behavior.
It was also found that girls performed better with regard to all five measurements, and that age at the interventionbaseline seemed to affect emotional symptoms negatively (i.e. a positive effect in the model), whereas pro-social behavioris affected positively. The dummy variable used to indicate baseline differences between the intervention preschools andthe control preschools is positive with regard to the first four measurements and negative with regard to the lastmeasurement. This indicates that children in intervention preschools on average performed worse than children in thecontrol group. However, none of the baseline differences statistically significant with regard to whether randomizationwas successful, and this confirms the analysis of randomization in Table 3. In this analysis it was seen that conductproblems increased, peer-relationship problems decreased, and pro-social behavior improved significantly across thestudy period (for both the intervention and the control groups) as indicated by the time-dummy variables (d1 and d2 in (1)).In general it is impossible to estimate time, calendar and age effects simultaneously, when time and calendarmeasurements overlap (Holford, 1991). Therefore the effects of time dummies in the models could be interpreted both astime, calendar and age effects. It is most logical to think of the time dummies as age effects, i.e. conduct problems worsenand social behavior improve with age.
Finally, with regard to all five measurements, by far the greatest error variance was within children. This is consistentwith an interpretation that SDQ measurements were greatly affected by measurement errors that vary from measurement tomeasurement, within each child. Hence, it is possible that preschool staff had problems when assessing children using SDQ
Table 4
Multilevel model for treatment effects. Fully balanced data.
Emotional
symptoms
Conduct
problems
Hyperactivity
inattention
Peer relationship
problems
Pro-social
behavior
Constant term 0.962 (0.275)*** 1.435 (0.269)*** 1.448 (0.312)*** 0.925 (0.267)*** 2.328 (0.332)***
Gender (girl = 1) �0.120 (0.080) �0.254 (0.076)*** �0.367 (0.092)*** �0.118 (0.078) 0.485 (0.099)***
Age at baseline �0.042 (0.066) 0.014 (0.062) �0.018 (0.073) 0.001 (0.064) �0.074 (0.079)
Ethnicity �0.012 (0.065) 0.048 (0.060) 0.175 (0.073)*** 0.010 (0.063) �0.073 (0.077)
Mothers education �0.002 (0.002) �0.006 (0.002)*** �0.009 (0.003)*** �0.005 (0.002)*** 0.000 (0.003)
Register dummy �0.144 (0.141)* �0.061 (0.133) �0.223 (0.159) �0.065 (0.138) �0.163 (0.169)
Baseline measure 0.621*** (0.020)*** 0.627 (0.027)*** 0.683 (0.017)*** 0.593 (0.020)*** 0.594 (0.019)***
Time = 1 �0.086 (0.134) 0.148 (0.125) 0.058 (0.135) �0.226 (0.131)* 0.217 (0.154)
Time = 2 0.631 (0.134)*** 0.964 (0.123)*** 0.025 (0.153) 0.294 (0.131)** 1.725 (0.154)***
Intervention dummy 0.076 (0.171) 0.090 (0.148) 0.077 (0.167) 0.008 (0.151) 0.103 (0.191)
Intervention dummy
Time = 1
�0.070 (0.190) �0.037 (0.174) �0.266 (0.190) �0.140 (0.184) 0.128 (0.218)
Intervention dummy
Time = 2
�0.639 (0.190)*** �0.681 (0.174)*** �0.722 (0.190)*** �0.549 (0.184)*** �0.544 (0.217)**
Random-effects parameters
Standard deviation, day-care center level 0.51 (0.09) 0.31 (0.07) 0.32 (0.12) 0.40 (0.08) 0.51 (0.11)
Standard deviation, child level 1.17 (0.06) 0.92 (0.06) 1.93 (0.06) 1.13 (0.06) 1.51 (0.07)
Residual standard deviation 2.18 (0.03) 1.98 (0.03) 2.17 (0.03) 2.10 (0.03) 2.48 (0.04)
Sample size 3135/1045 3135/1045 3134/1045 3135/1045 3130/1045
Note: Standard errors in parenthesis.
* Statistical significance at the 10% level.
** Statistical significance at the 5% level.
*** Statistical significance at the 1% level.
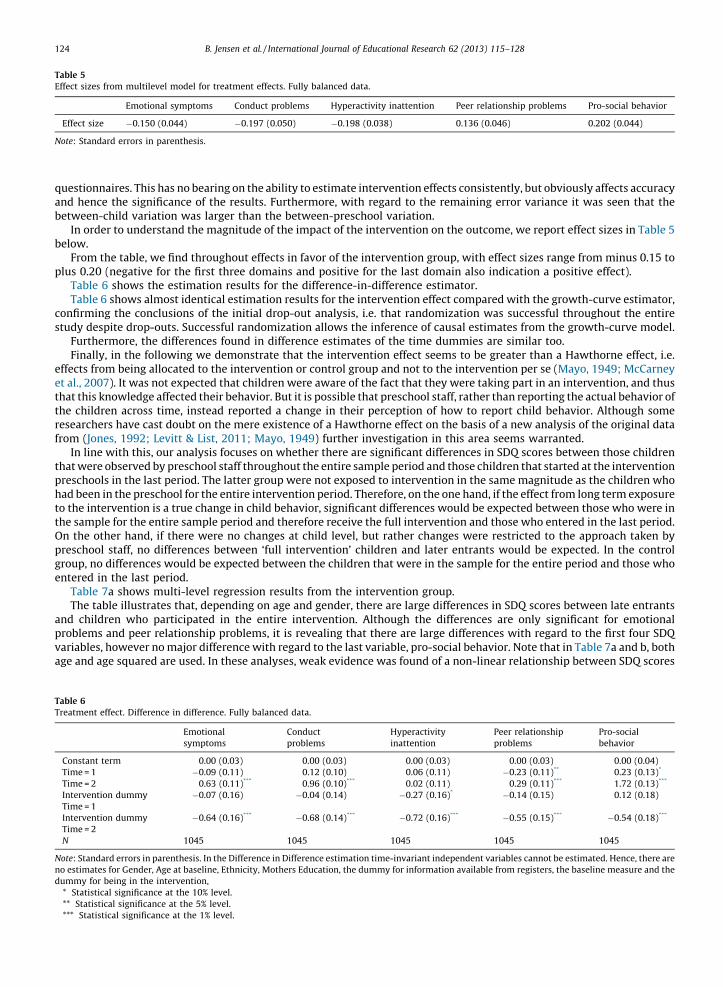
Table 5
Effect sizes from multilevel model for treatment effects. Fully balanced data.
Emotional symptoms Conduct problems Hyperactivity inattention Peer relationship problems Pro-social behavior
Effect size �0.150 (0.044) �0.197 (0.050) �0.198 (0.038) 0.136 (0.046) 0.202 (0.044)
Note: Standard errors in parenthesis.
B. Jensen et al. / International Journal of Educational Research 62 (2013) 115–128124
questionnaires. This has no bearing on the ability to estimate intervention effects consistently, but obviously affects accuracyand hence the significance of the results. Furthermore, with regard to the remaining error variance it was seen that thebetween-child variation was larger than the between-preschool variation.
In order to understand the magnitude of the impact of the intervention on the outcome, we report effect sizes in Table 5below.
From the table, we find throughout effects in favor of the intervention group, with effect sizes range from minus 0.15 toplus 0.20 (negative for the first three domains and positive for the last domain also indication a positive effect).
Table 6 shows the estimation results for the difference-in-difference estimator.Table 6 shows almost identical estimation results for the intervention effect compared with the growth-curve estimator,
confirming the conclusions of the initial drop-out analysis, i.e. that randomization was successful throughout the entirestudy despite drop-outs. Successful randomization allows the inference of causal estimates from the growth-curve model.
Furthermore, the differences found in difference estimates of the time dummies are similar too.Finally, in the following we demonstrate that the intervention effect seems to be greater than a Hawthorne effect, i.e.
effects from being allocated to the intervention or control group and not to the intervention per se (Mayo, 1949; McCarneyet al., 2007). It was not expected that children were aware of the fact that they were taking part in an intervention, and thusthat this knowledge affected their behavior. But it is possible that preschool staff, rather than reporting the actual behavior ofthe children across time, instead reported a change in their perception of how to report child behavior. Although someresearchers have cast doubt on the mere existence of a Hawthorne effect on the basis of a new analysis of the original datafrom (Jones, 1992; Levitt & List, 2011; Mayo, 1949) further investigation in this area seems warranted.
In line with this, our analysis focuses on whether there are significant differences in SDQ scores between those childrenthat were observed by preschool staff throughout the entire sample period and those children that started at the interventionpreschools in the last period. The latter group were not exposed to intervention in the same magnitude as the children whohad been in the preschool for the entire intervention period. Therefore, on the one hand, if the effect from long term exposureto the intervention is a true change in child behavior, significant differences would be expected between those who were inthe sample for the entire sample period and therefore receive the full intervention and those who entered in the last period.On the other hand, if there were no changes at child level, but rather changes were restricted to the approach taken bypreschool staff, no differences between ‘full intervention’ children and later entrants would be expected. In the controlgroup, no differences would be expected between the children that were in the sample for the entire period and those whoentered in the last period.
Table 7a shows multi-level regression results from the intervention group.The table illustrates that, depending on age and gender, there are large differences in SDQ scores between late entrants
and children who participated in the entire intervention. Although the differences are only significant for emotionalproblems and peer relationship problems, it is revealing that there are large differences with regard to the first four SDQvariables, however no major difference with regard to the last variable, pro-social behavior. Note that in Table 7a and b, bothage and age squared are used. In these analyses, weak evidence was found of a non-linear relationship between SDQ scores
Table 6
Treatment effect. Difference in difference. Fully balanced data.
Emotional
symptoms
Conduct
problems
Hyperactivity
inattention
Peer relationship
problems
Pro-social
behavior
Constant term 0.00 (0.03) 0.00 (0.03) 0.00 (0.03) 0.00 (0.03) 0.00 (0.04)
Time = 1 �0.09 (0.11) 0.12 (0.10) 0.06 (0.11) �0.23 (0.11)** 0.23 (0.13)*
Time = 2 0.63 (0.11)*** 0.96 (0.10)*** 0.02 (0.11) 0.29 (0.11)*** 1.72 (0.13)***
Intervention dummy
Time = 1
�0.07 (0.16) �0.04 (0.14) �0.27 (0.16)* �0.14 (0.15) 0.12 (0.18)
Intervention dummy
Time = 2
�0.64 (0.16)*** �0.68 (0.14)*** �0.72 (0.16)*** �0.55 (0.15)*** �0.54 (0.18)***
N 1045 1045 1045 1045 1045
Note: Standard errors in parenthesis. In the Difference in Difference estimation time-invariant independent variables cannot be estimated. Hence, there are
no estimates for Gender, Age at baseline, Ethnicity, Mothers Education, the dummy for information available from registers, the baseline measure and the
dummy for being in the intervention,
* Statistical significance at the 10% level.
** Statistical significance at the 5% level.
*** Statistical significance at the 1% level.
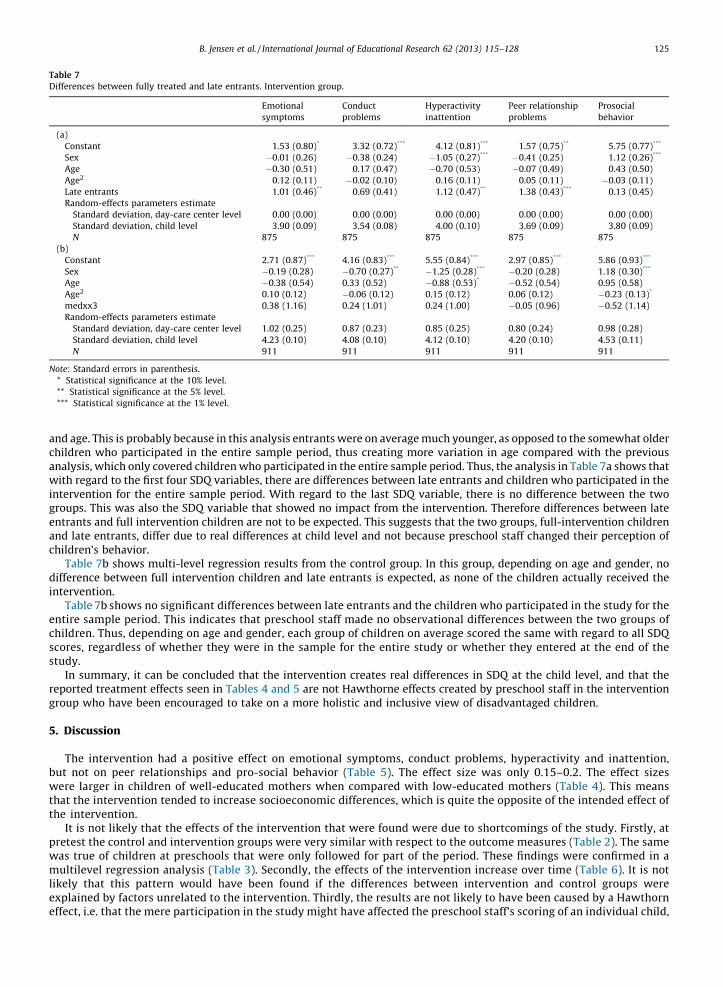
Table 7
Differences between fully treated and late entrants. Intervention group.
Emotional
symptoms
Conduct
problems
Hyperactivity
inattention
Peer relationship
problems
Prosocial
behavior
(a)
Constant 1.53 (0.80)* 3.32 (0.72)*** 4.12 (0.81)*** 1.57 (0.75)** 5.75 (0.77)***
Sex �0.01 (0.26) �0.38 (0.24) �1.05 (0.27)*** �0.41 (0.25) 1.12 (0.26)***
Age �0.30 (0.51) 0.17 (0.47) �0.70 (0.53) �0.07 (0.49) 0.43 (0.50)
Age2 0.12 (0.11) �0.02 (0.10) 0.16 (0.11) 0.05 (0.11) �0.03 (0.11)
Late entrants 1.01 (0.46)** 0.69 (0.41) 1.12 (0.47)** 1.38 (0.43)*** 0.13 (0.45)
Random-effects parameters estimate
Standard deviation, day-care center level 0.00 (0.00) 0.00 (0.00) 0.00 (0.00) 0.00 (0.00) 0.00 (0.00)
Standard deviation, child level 3.90 (0.09) 3.54 (0.08) 4.00 (0.10) 3.69 (0.09) 3.80 (0.09)
N 875 875 875 875 875
(b)
Constant 2.71 (0.87)*** 4.16 (0.83)*** 5.55 (0.84)*** 2.97 (0.85)*** 5.86 (0.93)***
Sex �0.19 (0.28) �0.70 (0.27)** �1.25 (0.28)*** �0.20 (0.28) 1.18 (0.30)***
Age �0.38 (0.54) 0.33 (0.52) �0.88 (0.53)* �0.52 (0.54) 0.95 (0.58)
Age2 0.10 (0.12) �0.06 (0.12) 0.15 (0.12) 0.06 (0.12) �0.23 (0.13)*
medxx3 0.38 (1.16) 0.24 (1.01) 0.24 (1.00) �0.05 (0.96) �0.52 (1.14)
Random-effects parameters estimate
Standard deviation, day-care center level 1.02 (0.25) 0.87 (0.23) 0.85 (0.25) 0.80 (0.24) 0.98 (0.28)
Standard deviation, child level 4.23 (0.10) 4.08 (0.10) 4.12 (0.10) 4.20 (0.10) 4.53 (0.11)
N 911 911 911 911 911
Note: Standard errors in parenthesis.
* Statistical significance at the 10% level.
** Statistical significance at the 5% level.
*** Statistical significance at the 1% level.
B. Jensen et al. / International Journal of Educational Research 62 (2013) 115–128 125
and age. This is probably because in this analysis entrants were on average much younger, as opposed to the somewhat olderchildren who participated in the entire sample period, thus creating more variation in age compared with the previousanalysis, which only covered children who participated in the entire sample period. Thus, the analysis in Table 7a shows thatwith regard to the first four SDQ variables, there are differences between late entrants and children who participated in theintervention for the entire sample period. With regard to the last SDQ variable, there is no difference between the twogroups. This was also the SDQ variable that showed no impact from the intervention. Therefore differences between lateentrants and full intervention children are not to be expected. This suggests that the two groups, full-intervention childrenand late entrants, differ due to real differences at child level and not because preschool staff changed their perception ofchildren’s behavior.
Table 7b shows multi-level regression results from the control group. In this group, depending on age and gender, nodifference between full intervention children and late entrants is expected, as none of the children actually received theintervention.
Table 7b shows no significant differences between late entrants and the children who participated in the study for theentire sample period. This indicates that preschool staff made no observational differences between the two groups ofchildren. Thus, depending on age and gender, each group of children on average scored the same with regard to all SDQscores, regardless of whether they were in the sample for the entire study or whether they entered at the end of thestudy.
In summary, it can be concluded that the intervention creates real differences in SDQ at the child level, and that thereported treatment effects seen in Tables 4 and 5 are not Hawthorne effects created by preschool staff in the interventiongroup who have been encouraged to take on a more holistic and inclusive view of disadvantaged children.
5. Discussion
The intervention had a positive effect on emotional symptoms, conduct problems, hyperactivity and inattention,but not on peer relationships and pro-social behavior (Table 5). The effect size was only 0.15–0.2. The effect sizeswere larger in children of well-educated mothers when compared with low-educated mothers (Table 4). This meansthat the intervention tended to increase socioeconomic differences, which is quite the opposite of the intended effect ofthe intervention.
It is not likely that the effects of the intervention that were found were due to shortcomings of the study. Firstly, atpretest the control and intervention groups were very similar with respect to the outcome measures (Table 2). The samewas true of children at preschools that were only followed for part of the period. These findings were confirmed in amultilevel regression analysis (Table 3). Secondly, the effects of the intervention increase over time (Table 6). It is notlikely that this pattern would have been found if the differences between intervention and control groups wereexplained by factors unrelated to the intervention. Thirdly, the results are not likely to have been caused by a Hawthorneffect, i.e. that the mere participation in the study might have affected the preschool staff’s scoring of an individual child,
B. Jensen et al. / International Journal of Educational Research 62 (2013) 115–128126
as discussed in section 4 (Table 7a and b). All effect sizes found were small. There are two potential explanations for this.Firstly, with regard to all five measurements, by far the greatest error variance was within children. That indicates thatthe staff found it difficult to assess the individual child in a reliable way. This will decrease that effect size of theintervention, independently of its effectiveness. Secondly, the intervention was not implemented as intended. Anessential part of the intervention was to provide each preschool with opportunities for reflection on current practicesand design of changes based on these reflections.
Yet, on average the preschools dedicated only 17 h to this activity, which was considerably less than recommended.This means that each preschool on average only devoted one 3-h meeting every four months to these meetings. It is notremarkable that this tiny intervention only resulted in small effect sizes. No statistically significant effects on peerrelationship problems and pro-social behavior were found. The effect sizes, however, although not statistically significantwere in the same range as for the two remaining forms of problems (Table 5). A possible explanation might be that isharder to assess social aspects of the child in a reliable way. A comprehensive review of the effects of social and emotionallearning programs, however, does not indicate that it is harder to detect such outcomes (Durlak, Weissberg, Dymnicki,Taylor, & Schellinger, 2011).
The intervention did not decrease the socioeconomic differences in the children, which was original intention ofthe program. It is common that pedagogic interventions have this effect (Lorenc, Petticrew, Welch, & Tugwell, 2013).One reason might be that those who deliver the intervention (e.g. teachers) usually have a middle class backgroundand therefore are more apt to understand children (or adults) with the same social background. Both the reviewedPerry Preschool (Weikart, 1998) and the Abecedarian project (Muennig et al., 2009), however, indicate that it is possibleto achieve larger effects in the socially most disadvantaged group. This might be due to the more structuredpedagogy that was used in these programs. It might also be related to differences between US and Danish populationssince the social differences in general are larger in the US than in Denmark (Kautto, Fritzell, Hvinden, Kvist, & Uusitalo,2001).
The study has several limitations. Firstly, the study time was only 21 months. For interventions aimed at individuals,a 21-month study period is often sufficient. However, the ASP Program aimed at affecting the way in which preschoolsorganize their activities. Considering this intention, 21 months is a short time. Secondly, the preschool staff did notreceive any training with regard to assessing children with the SDQ instrument prior to the study. This may haveexplain the large intra-individual variation that was found. Thirdly, outcomes with only one single instrument, SDQ,were reported. It is possible that other outcomes, e.g. assessments of cognitive ability, would be different. Fourthly, nodata on the actual quality of the preschools and the implementation process have been analyzed. The effects of theintervention might be expected to be larger in preschools that were faithful to the program. Fifthly, children are affectedboth by their parents and by the preschool. A preschool intervention that also includes parents might be expected to bemore effective. Such an approach was adopted successfully both in the Perry Preschool Program and Abecedarianproject. Yet, the ASP Program reported here did not include parents. Sixthly, the study was limited to twomunicipalities. It cannot be excluded that preschools in these municipalities are more open to developing theiractivities than the average Danish preschool would be.
There are also a number of strengths of the study. Firstly, it was carried out in a country where almost all childrenalready attend preschool. Obviously, larger effects of preschools will be recorded in countries where this kind of serviceis not generally available. If preschools are not generally available the focus ought to be on providing more preschools.This study, however, represents the next step, i.e. to improve the quality of already existing almost universal preschools.The authors have not identified previous intervention studies that deal with this area. Secondly, the study employs arandomized controlled design, which enables causal inferences. In the Scandinavian countries this design has been quiteuncommon in the pedagogic literature. Thirdly, in the analysis of data, different statistical techniques were employed,both multilevel modeling and difference–in-difference analysis. Both yielded harmonizing results.
6. Conclusion and perspectives
A new preschool program, the ASP Program, intends to improve that quality of preschools by offering support to staff intheir efforts to critically reflect on current practices. A randomized controlled study indicates positive effects on emotionalsymptoms, conduct problems, hyperactivity and inattention in children in the intervention group. The program intended toincrease the socio-emotional wellbeing and competences of all children and this was achieved for four of the variables in theSDQ indexes.
In spite of the small effect sizes, the results are still relevant when discussing a policy for this area. The cost ofsupporting preschools with the ASP Program is relatively small. This means that ASP can be implemented nationallywithout any extra national funding. This contrasts to the three intervention studies that were reviewed in Section 1.4where the costs of the interventions were substantial. The effects might be impressive, but the programs are hard toimplement widely. Moreover, from a population perspective, interventions that are offered widely, albeit with smalleffect sizes, are more effective than interventions with large effect sizes that are only offered to small groups (Rose,1998). Finally, a small effect of a program after one year may be significant later on. This was found in the PerryPreschool study where individuals were followed for 37 years (Muennig et al., 2009). Admittedly, we do not know if thisis the case for the ASP Program.
B. Jensen et al. / International Journal of Educational Research 62 (2013) 115–128 127
Funding
The project was financed by The Strategic Program for Welfare Research (Ministry of Social Affairs) 2005–2009. Fundingfrom Trygfonden has enabled further data analysis and scrutiny of results until 2013. The funders have not been involved inthe study design, analyses, interpretation, or writing of the decision to submit this paper.
Conflict of interest statement
There are no conflicts of interest.
Acknowledgements
Thanks to Mads Meier Jæger, Kristian Karlson and John Bennett for valuable comments and Stine Møllegaard Pedersen forvaluable research assistance. Thanks also to Peter Allerup and Thomas Yung Andersen for valuable contributions to thedesign and sampling and for valuable research contributions related to assessments of the intervention study.
References
Almond, D., & Currie, J. (2011). Chapter 15 – Human capital development before age five. Handbook of Labor Economics pp. 1315–1486). (Vol. 4Elsevier.Barnett, W. S. (1998). Long-term cognitive and academic effects of early childhood education on children in poverty. Preventive Medicine, 27(2), 204–207.Barnett, W. S., Jung, K., Yarosz, D. J., Thomas, J., Hornbeck, A., Stechuk, R., et al. (2008). Educational effects of the Tools of the Mind curriculum: A randomized trial.
Early Childhood Research Quarterly, 23(3), 299–313.Bauchmuller, R., Gørtz, M., & Wurtz, R. A. (2011). Long-run benefits from universal high-quality pre-schooling. Copenhagen: AKF, Danish Institute of Governmental
Research.Berger, J. (1973). Ways of seeing. London: Penguine.Bernstein, B. (1975). Class, codes and control, vol. 3: Towards a theory of educational transmission. London: Routledge.Bertrand, M., Duflo, E., & Mullainathan, S. (2004). How much should we trust differences-in-differences estimates? Quarterly Journal of Economics, 119(1), 249–
275.Bodrova, E., & Leong, D. J. (2006). Tools of the mind: The Vygotskian approach to early childhood education. New York: Prentice Hall.Bourdieu, P., & Passeron, J. C. (1990). Reproduction in education, society and culture. London: Sage Publications.Bremberg, S. (2001). In what way can preschools improve the health children? Stockholm: Swedish National Institute of Public Health (in Swedish).Cronbach, L. J. (1951). Coefficient alpha and the internal structure of tests. Psychometrika, 16(3), 297–334.Dewey, J. (1986). How we think: A restatement of the relations of reflective thinking to the educative process. In The later works pp. 105–352). (vol. 8Carbondale
and Edwardsville: Southern Illinois University Press.Durlak, J. A., Weissberg, R. P., Dymnicki, A. B., Taylor, R. D., & Schellinger, K. B. (2011). The impact of enhancing students’ social and emotional learning: A meta-
analysis of school-based universal interventions. Child Development, 82(1), 405–432.Ellstrom, P.-E. (2010). Practice-based innovation: A learning perspective. Journal of Workplace Learning, 22(1–2), 27–40.Goldstein, H. (2010). Multilevel statistical models. London: Arnold Publishing.Goodman, R. (1997). The Strengths and Difficulties Questionnaire: A research note. Journal of Child Psychology and Psychiatry, 38(5), 581–586.Hattie, J. (2008). Visible learning: A synthesis of over 800 meta-analyses relating to achievement. Oxon, UK: Routledge.Havnes, T., & Mogstad, M. (2012). No child left behind: Subsidized child care and children’s long-run outcomes. American Economic Journal: Economic Policy, 3(2),
97–129.Holford, T. R. (1991). Understanding the effects of age, period and cohort on incidence and mortality rates. Annual Review of Public Health, 12, 425–457.Jensen, M. B., Johnson, B., Lorenz, E., & Lundvall, B. A. (2007). Forms of knowledge and modes of innovation. Research Policy, 36(5), 680–693.Jones, S. R. G. (1992). Was there a Hawthorne effect? American Journal of Sociology, 98(3), 451–468.Kautto, M., Fritzell, J., Hvinden, B., Kvist, J., & Uusitalo, H. (2001). Nordic welfare states in the European context. London: Routledge.Leseman, P. (2009). The impact of high quality education and care on the development of young children: Review of the literature. Brussels: European Commission:
Tackling Social and Educational Disadvantage through early Childhood Education and Care in Europe Education, Audiovisual and Culture Executive Agency.Levitt, S. D., & List, J. A. (2011). Was there really a Hawthorne effect at the Hawthorne plant? An analysis of the original illumination experiments. American
Economic Journal: Applied Economics, 3(1), 224–238.Lorenc, T., Petticrew, M., Welch, V., & Tugwell, P. (2013). What types of interventions generate inequalities? Evidence from systematic reviews. Journal of
Epidemiology and Community Health, 67(2), 190–193.Maurer, R. (2012). The spirit of Kaizen: Creating lasting excellence one small step at a time. New York: McGraw-Hill.Mayo, E. (1949). Hawthorne and the Western Electric Company, The social problems of an industrial civilisation. London: Routledge.McCarney, R., Warner, J., Iliffe, S., van Haselen, R., Griffin, M., & Fisher, P. (2007). The Hawthorne Effect: A randomised, controlled trial. BMC Medical Research
Methodology, 7(1), 30.Mead, G. H. (1934). Mind, self and society. Chicago: Chicago University Press.Ministry of Social affairs Denmark. (2004). Social service order 708. Copenhagen: Socialministeriet (in Danish).Ministry of Family and Consumer Affairs, D. (2007). Law 501. Day Care Act: Act on day care, after-school and club facilities. In children and adolescents, København:
Ministry of Family and Consumer Affairs (in Danish).Montie, J. E., Xiang, Z., & Schweinhart, L. J. (2006). Preschool experience in 10 countries: Cognitive and language performance at age 7. Early Childhood Research
Quarterly, 21(3), 313–331.Muennig, P., Schweinhart, L., Montie, J., & Neidell, M. (2009). Effects of a prekindergarten educational intervention on adult health: 37-Year follow-up results of a
randomized controlled trial. American Journal of Public Health, 99(8), 1431–1437.Murgatroyd, S. (1989). KAIZEN: School-wide quality improvement. School Organization, 9(2), 241–260.Muris, P., Meesters, C., & van den Berg, F. (2003). The strengths and difficulties questionnaire (SDQ). Further evidence for its reliability and validity in a community
sample of Dutch children and adolescents. European Child and Adolescent Psychiatry, 12(1), 1–8.NICHD Early Child Care Research Network. (2005). Child care and child development: Results from the NICHD study of early child care and youth development. New
York: Guilford Press.OECD. (2009). Education today: The OECD perspective. Paris: OECD.OECD. (2011). Investing in high-quality ECEC. Paris: OECD.Phillips, D., Mekos, D., Scarr, S., McCartney, K., & Abbott-Shim, M. (2001). Within and beyond the classroom door: Assessing quality in child care centers. Early
Childhood Research Quarterly, 15(4), 475–496.

B. Jensen et al. / International Journal of Educational Research 62 (2013) 115–128128
Ramey, C. T., Campbell, F. A., Burchinal, M., Skinner, M. L., Gardner, D. M., & Ramey, S. L. (2000). Persistent effects of early childhood education on high-risk childrenand their mothers. Applied Developmental Science, 4(1), 2–14.
Reinhardt-Pedersen, C., & Madsen, M. (2001). Parents’ labour market participation as a predictor of children’s health and wellbeing: A comparative study in fiveNordic countries. Journal of Epidemiology and Community Health, 56, 861–867.
Rose, G. (1998). The strategy of preventive medicine. New York: Oxford University Press.Sammons, P., Hall, J., Sylva, K., Melhuish, E., Siraj-Blatchford, I., & Taggart, B. (2013). Protecting the development of 5–11-year-olds from the impacts of early
disadvantage: The role of primary school academic effectiveness. School Effectiveness and School Improvement, 1–18, (published ahead-of-print).Sundbo, J. (2003). Innovation and strategic reflexivity: An evolutionary approach applied to services. In L. Shavinina (Ed.), The international handbook on innovation
(pp. 97–114). Oxford: Elsevier Science.Sylva, K., Melhuish, E., Sammons, P., Siraj-Blatchford, I., & Taggart, B. (2011). Pre-school quality and educational outcomes at age 11: Low quality has little benefit.
Journal of Early Childhood Research, 9(2), 109–124.Taguma, M., Litjens, I., & Kim, J. H. (2013). Quality matters in early childhood education and care. Paris: OECD.The Swedish National Agency for Education. (2012). Descriptive data on preschools, schools and adult education. Stockholm: The Swedish National Agency for
Education (in Swedish).van Widenfelt, B. M., Goedhart, A. W., Treffers, P. D. A., & Goodman, R. (2003). Dutch version of the Strengths and Difficulties Questionnaire (SDQ). European Child
and Adolescent Psychiatry, 12(6), 281–289.Vygotsky, L., Hanfmann, E., & Vakar, G. (1962). Thought and language. Cambridge, MA: MIT Press.Weikart, D. P. (1998). Changing early childhood development through educational intervention. Preventive Medicine, 27(2), 233–237.Wooldridge, J. M. (2010). Econometric analysis of cross section and panel data (2nd ed.). Cambridge, MA: MIT Press.