Embed Size (px)
Citation preview

Abstract—Feature Selection plays an important role in
many areas especially in classification tasks. It is also an important pre-treatment for every classification process and not only decreases the computational time and cost, but selecting an appropriate variable also increases the classification accuracy. In this research, the comparison of classification performance of machine learning techniques using Principal Components Analysis (PCA) for screening the genotypes of β-Thalassemia patients will be proposed. The aim of this study is to reduce the dimensions of data before classification. According to the PCA method and classification techniques, results show that the Multi-Layer Perceptron (MLP) is the best algorithm providing that the percentage of accuracy reaches 86.61. K- Nearest Neighbors (KNN), NaiveBayes, Bayesian Networks (BNs) and Multinomial Logistic Regression require accuracy percentages of 85.83, 85.04, 85.04 and 82.68 respectively. In the future, we will search for the other feature selection techniques in order to improve the classification performance such as the hybrid method, filtering method etc.
Index Terms—β-Thalassemia, Classification Techniques, Principal Components Analysis (PCA), Feature Selection, Machine Leaning Techniques.
I. INTRODUCTION Over the past decades, machine learning has tried to
adapt algorithms to a specific task. Learning algorithms are widely used for many tasks both in industry and in academia such as facial recognition, text classification and credit card fraud detection and also in medical diagnosis [1].
The classification accuracy research is aimed at building an efficient model to predict the class memberships of data. These techniques not only providing a correct label on training databut also correctly predict the label of any unknown data [2]. One of these machine learning techniques which can be used to improve the data analysis of high dimensional data is a feature selection technique [3]. It is the technique that is able to reduce the dimentions of
Manuscript received June 3, 2011; revised June 15, 2011. This work was supported by College of Arts, Media and Technology,
Chiang Mai University, Thailand. Patcharaporn Paokanta is currently a lecturer at College of Arts, Media and Technology, Chiang Mai University, Thailand. She can be contacted by phone: 668-29340535; E-mail: [email protected].
S. Srichairatanakool is Associate Professor in Biochemistry at Faculty of Medical, Chiang Mai University, Thailand. He can be contacted by E-mail: [email protected].
N. Harnpornchai is Assistant Professor in Knowledge management at College of Arts, Media and Technology, Chiang Mai University, Thailand. He can be contacted by E-mail: [email protected].
M. Ceccarelli is Associate Professor in Computer Sciences at Faculty of Medical, Chiang Mai University, Thailand. He can be contacted by E-mail: [email protected].
data and often provide better classification accuracy by reducing the number of features [4]. Multivariate statistical methods such as a Principal Components Analysis (PCA), partial least squares and more recently independent component analysis have been developed and applied for this purpose. Compared to those mentioned, PCA is the most popular one which relates to its conceptual simplicity [5].
Nowadays, Principal Components Analysis (PCA), or the subspace method, has been extensively investigated in the field of computer vision and pattern recognition. One of the attractive characteristics of PCA is that a high-dimensional vector can be represented by a small number of orthogonal basis vectors, i.e. the principal components. The conventional methods of PCA, such as singular value decomposition (SVD) and eigen-decomposition are performed in batch mode with a computational complexity of O(m3) where m is the minimum value between the data dimension and the number of training examples. Undoubtedly these methods are computationally expensive when dealing with large-scale problems where both the dimension and the number of training examples are large [6].
Yulan Liang et.al presented the review of general feature reduction approaches to find high dimensional related data and specific approaches for Single Nucleotide Polymorphism (SNPs) data, including using statistical testing, modeling and machine learning techniques to analyze this data. Moreover, they illustrated that the Principal Components Analysis is a suitable tool for categorical SNPs information which is arguable, since it has been more appropriate for the continuous scale data [7]. The research of Hong-QiangWang et. al. presented two main approaches for feature transformation: Principal Components Analysis (PCA) and partial least squares (PLS). PCA can be taken as an unsupervised learning and PLS as a supervised learning. Having compared PCA and PLS, Nguyen et al. drew a conclusion that PLS trends to be more useful for cancer classification owing to the supervised learning ability. The main drawback of the separate strategy of the dimensionality reduction is that the strategy might cause the loss of the useful information. Furthermore, they introduced a new probabilistic technique to extract the gene regulation information from the microarray data for the cancer classification using k-nearest neighborhood (k-NN), Fisher linear discriminant (FLD) and SVM [8]. In addition, the research of S.R. Amendolia et al. showed Thalassemia screening indicators by using the Principal Components Analysis (PCA) where the selected features are RBC, Hb, Ht and MCV. They compared the
The Knowledge Discovery of β-Thalassemia Using Principal Components Analysis: PCA and Machine
Learning Techniques
Patcharaporn Paokanta, Napat Harnpornchai, Somdat Srichairatanakool, and Michele Ceccarelli
International Journal of e-Education, e-Business, e-Management and e-Learning, Vol. 1, No. 2, June, 2011
169

study of K-Nearest Neighbor, Support Vector Machine and Multi-Layer Perceptron for Thalassemia screening [9].
The purpose of this paper is to focus on the classification of β-thalassemia with the new data set which is different from the other researches by using serveral algorithms of machine learning. In this research, we first introduce the use of PCA to classify the β-thalassemia patients and compare the classification performance of serveral machine learning techniques, for example, Multi-Layer Perceptron (MLP), K- Nearest Neighbors (KNN), NaiveBayes, Bayesian Networks (BNs) and Multinomial Logistic Regression. The remainder of the paper is organized as follows. In Section 2 and 3, the relevant machine learning background will be introduced to present PCA and the performance of classification. For Section 4, we describe the materials and methodology of using PCA and machine learning techniques which are applied to the β-thalassemia data set. In Section 5, the results of using PCA before training and classifying by applying many classification algorithms are presented in terms of the comparison between their accuracy percentages. Finally, we shall conclude this paper and discuss some future research directions in Section 6.
II. PRINCIPAL COMPONENTS ANALYSIS PCA is a useful statistical technique that has found
application in fields such as data compression, image processing, visualisation, exploratory data analysis, pattern recognition and time series prediction, and it is not only a common technique for finding patterns in data of high dimension but also a well-established technique for dimensionality reduction. This technique is based on a mathematical concept which covers standard deviation, variance, covariance, covariance matrix, eigenvectors and eigenvalues. Some details of each concept are described below.
A. Standard deviation. Statisticians are usually concerned with taking a sample
of a population which is a subset of the population that the statisticians measure. If we assume that our data sets are samples of some bigger population, we can calculate some parameters on a data set, the formula for arithmetic mean as a formular:
(1)
In some cases, the mean cann’t give a lot about the data. This measurement technique is suitable for a sort of middle point. “What parameter can tell us about the difference or spread of data?”. The Standard Deviation (SD) of a data set is a measure of how spread out the data is. It is the most commonly used measure of spread. The standard deviation has proven to be an extremely useful measure of spread in part because it is mathematically tractable. Many formulas in inferential statistics use standard deviation. As a formula:
(2)
B. Variance Is another measure of the spread of data in a data set. In
fact it is closely related to standard deviation. They are measures of variability. As a formula:
(3)
C. Covariance. The last two measures we have looked at are purely 1-
dimensional. However many data sets have more than one dimension, and the aim of the statistical analysis of these data sets is usually to see if there is any relationship between the dimensions. Standard deviation and variance only operate on 1 dimension, so that you could only calculate the standard deviation for each dimension of the data set independently of the other dimensions. However, it is useful to have a similar measure to find out how much the dimensions vary from the mean with respect to each other. Covariance is such a measure. Covariance is always scaled between 2 variables. If you calculate the covariance between one variable and itself, you get the variance. The formula for covariance is very similar to the formula for variance.
The formula for covariance could also be written like this:
(2)
D. Covariance Matrix. Recall that covariance is always measured between 2
variables. More than one covariance measurement can be calculated for a data set with more than 2 variables. For example, from a 3 dimensional data sets (dimensions x, y, z) you could calculate Cov (x, y), Cov (x, z) and Cov (y, z). Practically, an n-dimensional data set can be calculated different covariance values.
(5)
Different covariance values. The covariance matrix for an imaginary 3 dimensional data set will be made up using the usual dimensions x, y and z. The covariance matrix has 3 rows and 3 columns, and the values are:
(6)
Along the main diagonal, you see that the covariance value is between one of the dimensions and itself. These are the variances for that dimension.
International Journal of e-Education, e-Business, e-Management and e-Learning, Vol. 1, No. 2, June, 2011
170

E. Eigenvectors. The eigenvectors of a square matrix are the non-
zero vectors that, after being multiplied by the matrix, remain proportional to the original vector (i.e., change only in magnitude, not in direction) which is the horizontal vector shown in Figure 1. For each eigenvector, the corresponding eigenvalue is the factor by which the eigenvector changes when multiplied by the matrix. The eigenvectors are sometimes also called characteristic vectors. Similarly, the eigenvalues are also known as characteristic values.
The mathematical expression of this idea is as follows: if A is a square matrix, a non-zero vector v is an
eigenvector of A if there is a scalar (lambda) such that
(7)
Figure 1. The eigenvector
F. Eigenvalues.
For an eigenvector , the scalar (lambda) is said to
be an eigenvalue of A corresponding to . An eigenspace of A is the set of all eigenvectors with the same eigenvalue together with the zero vector. However, the zero vectors are not an eigenvector [10, 11].
III. MACHINE LEARNING TECHNIQUES Machine learning is one technique of Artificial
Intelligence which is the method developed for learning by computer. The concept of this technique focuses on building a computer program from the analysis of the data set. One can see that Machine Learning is related to Statistics because these disciplines are both based on data analysis.
Generally, the main algorithm types of Machine Learning are listed below.
A. Supervised learning Generates a function which maps inputs provided by
some expert (called labels) to desired outputs for example classification problems.
B. Unsupervised learning Models a set of inputs before using them; for example,
classification tasks. One well-known unsupervised learning algorithm is clustering techniques.
C. Semi-supervised learning Combines both labeled and unlabeled data to generate an
appropriate function or classifier. There are two approaches on Semi-supervised learning, called co-training and joint probability distribution where the second approach handles unlabeled data through i.e. Gibbs sampling or the EM algorithm.
D. Reinforcement learning Learns how to act given an observation of the world by
considering every action has some impact on the environment, and the environment provides feedback. This is the concept of a learning algorithm.
E. Transduction This technique is alike supervised learning, but does not
obviously construct a function. Instead, it tries to predict new outputs based on training inputs, training outputs, and new inputs.
F. Learning to learn or meta-learning Learns its own inductive bias based on previous
experience. There are several approaches to Machine Learning
theory: 1) Decision tree learning is based on a predictive model
that maps observations about an item to conclusions about the item's target value.
2) Association rule learning is a method for discovering the relation among variables in large databases.
3) An artificial neural network (ANN) learning algorithm or neural network (NN), is a learning algorithm that is inspired by the structure and/or functional aspects of biological neural networks. Computations are structured in terms of an interconnected group of artificial neurons, processing information using a connectionist approach to computation. Modern neural networks are non-linear statistical data modeling tools. These algorithms are usually applied to model complex relationships between inputs and outputs, to find patterns in data, to capture the statistical information in a joint probability distribution between observed variables. It can say that, a main propose of using ANN is to discovery knowledge on target data.
4) Genetic programming (GP) is one of evolutionary algorithm-based methodology developed by biological evolution to find computer programs that manage a user-defined task. Genetic Algorithms (GAs), which is a machine learning technique, used to optimization problems by selection, crossover and mutation process through the computer programming.
5) Inductive logic programming (ILP) is rule learning based on logic programming in knowledge representation for examples, background knowledge, and hypotheses. Given an encoding of the known background knowledge and a set of examples represented as a logical database of facts, an ILP system will derive a hypothesized logic program which entails all the positive and none of the negative examples.
6) Support vector machines (SVMs) are supervised learning methods for classification and regression. Given a set of training examples, each marked as belonging to one of two categories, an SVM training algorithm builds a model that predicts whether a new example falls into one category or the other.
7) Cluster analysis or clustering is the assignment of a set of observations into subsets (called clusters) so that observations in the same cluster are similar in some
International Journal of e-Education, e-Business, e-Management and e-Learning, Vol. 1, No. 2, June, 2011
171
sense. Clustering is a method of unsupervised learning, and a common technique for statistical data analysis.
8) A Bayesian network, belief network or directed acyclic graphical model is a probabilistic graphical model that represents a set of random variables and their conditional independencies via a directed acyclic graph (DAG). For example, a Bayesian network could represent the probabilistic relationships between diseases and symptoms. Given symptoms, the network can be used to compute the probabilities of the presence of various diseases. Efficient algorithms exist that perform inference and learning.
9) Reinforcement learning is concerned with how an agent ought to take actions in an environment so as to maximize some notion of long-term reward. Reinforcement learning algorithms attempt to find a policy that maps states of the world to the actions the agent ought to take in those states. Reinforcement learning differs from the supervised learning problem in that correct input/output pairs are never presented, nor sub-optimal actions explicitly corrected.
10) Several learning algorithms, mostly unsupervised learning algorithms, aim at discovering better representations of the inputs provided during training. Classical examples include principal components analysis and clustering. Representation learning algorithms used not only to obtain the information in their input, but also to transform these information to a way that makes it useful. These algorithms often use in a pre-processing step of classification or predictions. They allow reconstructing the inputs from the unknown data to generate distribution [12, 13].
IV. MATERIALS AND METHODOLOGY
A. Materials Thalassemia is one of the most common genetic
disorders in the world, and an estimated 1.5% of the worldwide population has been diagnosed with β-Thalassemia. The disorder is found in the areas where malaria used to be widespread, such as Africa, the Mediterranean region, the Middle East, Southeast Asia (India, Thailand and Indonesia), and the Far East. It is found often in the Southeast of Asia, where there are approximately 55 million carriers. The gene frequencies of alpha-Thalassemia reach 30-40% in Northern Thailand and Lao PDR, β-Thalassemia varies between 1- 9%, and HbE has a frequency of 50-60% at the junction of Thailand, Lao PDR. Approximately 40% of Thai people are heterozygous carriers of these genes [14]. From these statistics, the data of 127 β-Thalassemia patients were collected and used for classifying the genotypes of them which identify the types of β-Thalassemia. These data were obtained from hospitals in the northen part of Thailand. The data set for this experiment is as follows:
TABLE I. THE DATA SET OF Β-THALASSEMIA
Variables Direction Genotype of children Output F-cell of children Input HbA2 of children Input
HbA2 of father Input HbA2 of mother Input Genotype of father Input Genotype of mother Input
There are 7 variables which were elicited from some experts (biochemist and medical practitioners in the hospital) and some documents (Out Patient Department records). PCA was used to reduce the dimension of some variables. It reduces the dimensionality of the data set while retaining as much information as possible. Furthermore, it computes a concise and optimal description of the data set. The results of this technique will be demonstrated in the next section.
B. Methodology In an effort to focus on the comparison of classification
performance of machine learning techniques of the β-Thalassemia screening study, a data set of 127 β-Thalassemia patients was used.
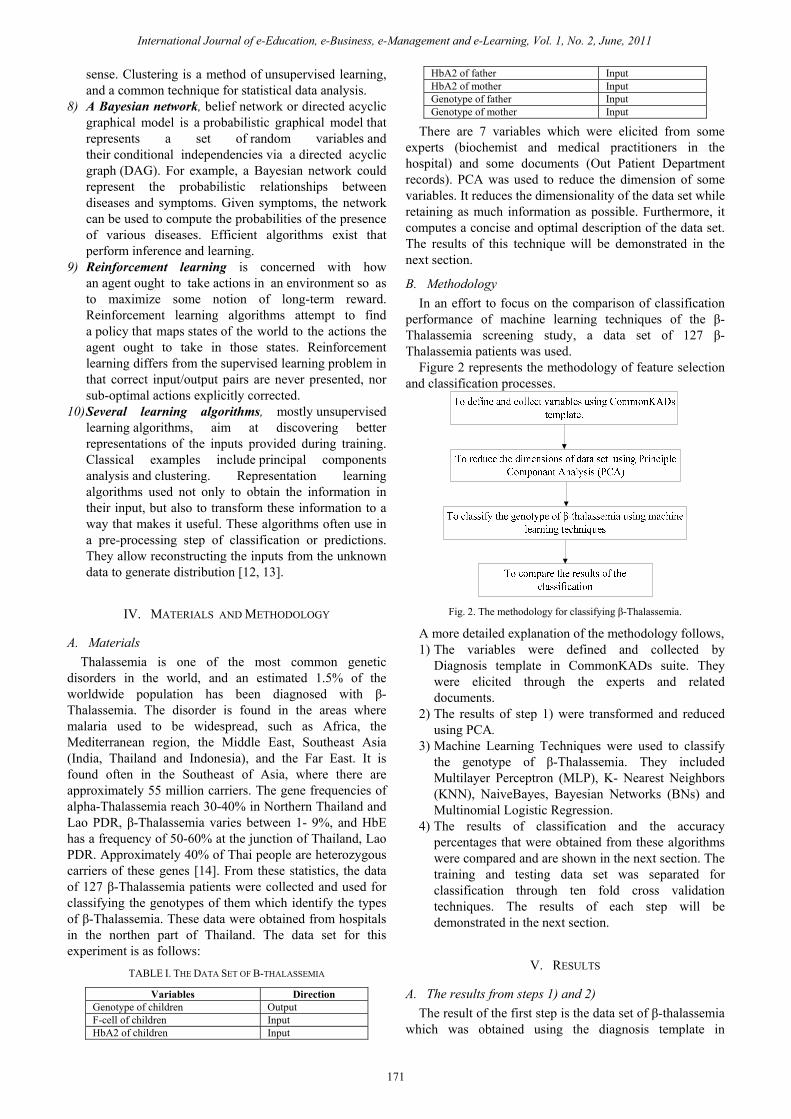
Figure 2 represents the methodology of feature selection and classification processes.
Fig. 2. The methodology for classifying β-Thalassemia.
A more detailed explanation of the methodology follows, 1) The variables were defined and collected by
Diagnosis template in CommonKADs suite. They were elicited through the experts and related documents.
2) The results of step 1) were transformed and reduced using PCA.
3) Machine Learning Techniques were used to classify the genotype of β-Thalassemia. They included Multilayer Perceptron (MLP), K- Nearest Neighbors (KNN), NaiveBayes, Bayesian Networks (BNs) and Multinomial Logistic Regression.
4) The results of classification and the accuracy percentages that were obtained from these algorithms were compared and are shown in the next section. The training and testing data set was separated for classification through ten fold cross validation techniques. The results of each step will be demonstrated in the next section.
V. RESULTS
A. The results from steps 1) and 2) The result of the first step is the data set of β-thalassemia
which was obtained using the diagnosis template in
International Journal of e-Education, e-Business, e-Management and e-Learning, Vol. 1, No. 2, June, 2011
171
CommonKADs suite of Knowledge Engineering Process through the expert interviews and document reviews.
The filtering technique, PCA was used to reduce the data dimension obtained from the first step by combining the related variables to be the new variables called factors. In this data set, it reduces the dimensions of the data from 6 to 3 variables as the result shows in Table II. This technique uses the diagonal value of the correlation matrix which is 1 to be the initial value for calculating the communities. In PCA, the factor loading plays an important role because it refers to the relational value between variables and factors which should be greater than |0.3|. Any variable that has high loading in a factor should be in this factor. The factor loading can be obtained from the diagonal of the Eigen matrix or component matrix shown in Table III.,
TABLE II. THE REDUCED DATA DIMENSION SET USING PCA FOR Β-THALASSEMIA CLASSIFICATION
Variables Direction Genotype of children Output Factor 1 Input Factor 2 Input Factor 3 Input
TABLE III. THE COMPONENT MATRIX
Variables Components
1 2 3 Genotype of mother 0.934 0.116 Genotype of father -0.916 0.158 HbA2 of father -0.715 0.412 HbA2 of mother 0.693 0.405 HbA2 of children 0.826 -0.316F-cell of Children 0.758 0.948
Table III. Shows that 4 variables should be in
component 1 with the factor loading 0.934, 0.916, 0.715 and 0.693 respectively. On the other hand, one variable should be in component 2 with the factor loading 0.826 and there is only one variable in component 3 with the factor loading 0.948.
TABLE IV. THE ROTATED COMPONENT MATRIX
Variables Components
1 2 3 Genotype of mother 0.926 Genotype of father -0.920 0.202 HbA2 of father 0.750 0.318 0.133HbA2 of mother -0.654 0.447 0.142HbA2 of children 0.886 F-cell of Children 0.983
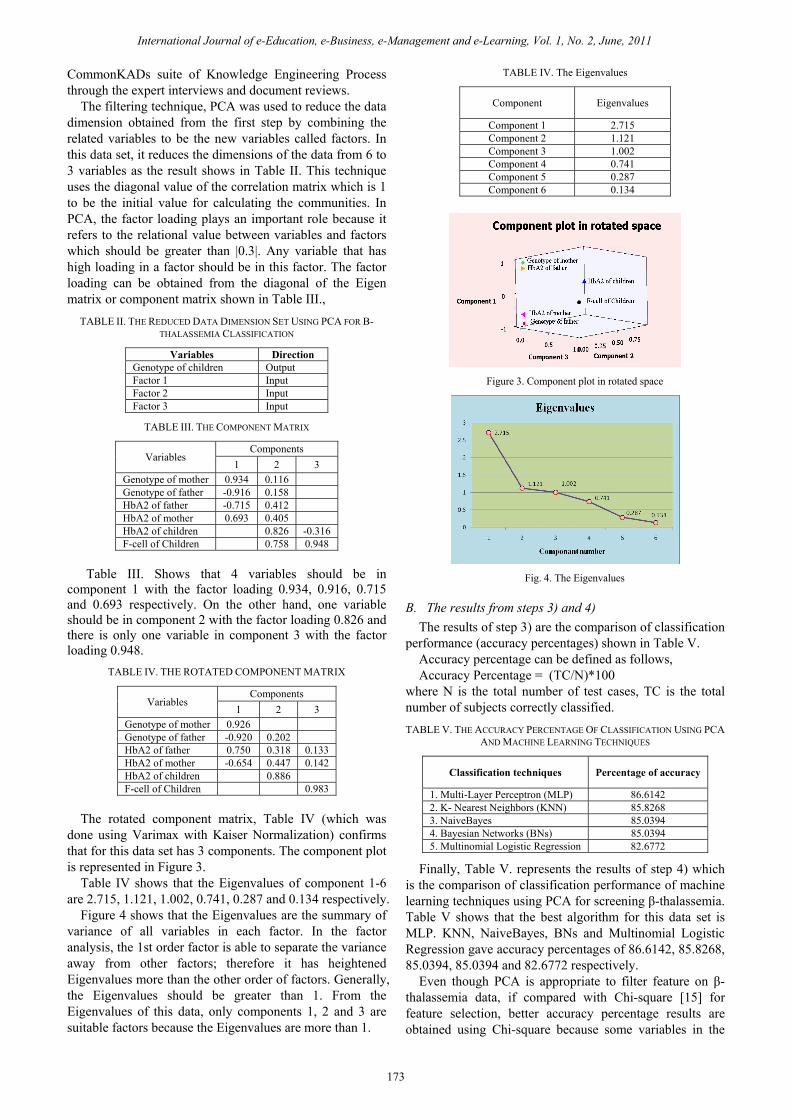
The rotated component matrix, Table IV (which was
done using Varimax with Kaiser Normalization) confirms that for this data set has 3 components. The component plot is represented in Figure 3.
Table IV shows that the Eigenvalues of component 1-6 are 2.715, 1.121, 1.002, 0.741, 0.287 and 0.134 respectively.
Figure 4 shows that the Eigenvalues are the summary of variance of all variables in each factor. In the factor analysis, the 1st order factor is able to separate the variance away from other factors; therefore it has heightened Eigenvalues more than the other order of factors. Generally, the Eigenvalues should be greater than 1. From the Eigenvalues of this data, only components 1, 2 and 3 are suitable factors because the Eigenvalues are more than 1.
TABLE IV. The Eigenvalues
Component Eigenvalues
Component 1 2.715 Component 2 1.121 Component 3 1.002 Component 4 0.741 Component 5 0.287 Component 6 0.134
Figure 3. Component plot in rotated space
Fig. 4. The Eigenvalues
B. The results from steps 3) and 4) The results of step 3) are the comparison of classification
performance (accuracy percentages) shown in Table V. Accuracy percentage can be defined as follows, Accuracy Percentage = (TC/N)*100
where N is the total number of test cases, TC is the total number of subjects correctly classified. TABLE V. THE ACCURACY PERCENTAGE OF CLASSIFICATION USING PCA
AND MACHINE LEARNING TECHNIQUES
Classification techniques Percentage of accuracy
1. Multi-Layer Perceptron (MLP) 86.6142 2. K- Nearest Neighbors (KNN) 85.8268 3. NaiveBayes 85.0394 4. Bayesian Networks (BNs) 85.0394 5. Multinomial Logistic Regression 82.6772
Finally, Table V. represents the results of step 4) which is the comparison of classification performance of machine learning techniques using PCA for screening β-thalassemia. Table V shows that the best algorithm for this data set is MLP. KNN, NaiveBayes, BNs and Multinomial Logistic Regression gave accuracy percentages of 86.6142, 85.8268, 85.0394, 85.0394 and 82.6772 respectively.
Even though PCA is appropriate to filter feature on β-thalassemia data, if compared with Chi-square [15] for feature selection, better accuracy percentage results are obtained using Chi-square because some variables in the
International Journal of e-Education, e-Business, e-Management and e-Learning, Vol. 1, No. 2, June, 2011
173

data set can be transformed to the nominal and interval scale and Chi square can be used as well with nominal scale. Therefore, from this result, the appropriate feature selection technique for screening β-thalassemia on this data set is Chi square.
VI. CONCLUSION Using PCA for the feature selection gives a satisfactory
accuracy percentage. As the results show, the best algorithm to use on this data set is MLP with an accuracy percentage 86.6142. The other algorithm results for KNN, NaiveBays, BNs and Multinomial Logistic Regression had accuracy percentages of 85.8268, 85.0394, 85.0394 and 82.6772 respectively. These results imply that PCA can be used as well but if compared to Chi square which is a feature selection, Chi square produces the better accuracy percentage. On the otherhand, medical data needs the highest accuracy percentage. Therefore, in future work the other algorithms used for feature selection will be studied, for example, the hybrid feature selection methods: fuzzy, genetic algorithm etc. for β-thalassemia classification.
Some other research has investigated the application of data mining techniques for thalassemia data. For this reason, a combination of feature selection techniques for classifying this data set and data set for other types of Thalassemia will be studied.
VII. ACKNOWLEDGEMENT The authors would like to thank Dr. Frank Bozel for
improving English language in this paper and I feel appreciatate with his kindly support.
REFERENCES [1] Amir Navot. “On the Role of Feature Selection in Machine
Learning.” Ph.D. thesis, Hebrew University of Jerusalem, Israel, 2006.
[2] Cheng-San Yang, Li-Yeh Chuang, Chao-Hsuan Ke, and Cheng-Hong Yang, Member and LAENG. “A Hybrid Feature Selection Method for Microarray Classification.” IAENG The International Journal of Computer Science, vol. 35, Issue 3, Aug. 2008.
[3] Supoj Hengpraprohm and Prabhas Chongstitvatana. “Feature Selection By Weighted-SNR For Cancer Microarray Data Classification.” International Journal of Innovative Computing, Information and Control, vol. 5, pp. 4627-4635, Dec. 2009.
[4] Caio Soares. “A Class-Specific Ensemble Feature Selection Approach for Classification Problems.” M.S. thesis, Auburn University, USA, 2009.
[5] Xueqin Liu, Uwe Kruger, Tim Littler a, Lei Xie and Shuqing Wang. “Moving Window Kernel PCA For Adaptive Monitoring of Nonlinear Processes.” Chemometrics and Intelligent Laboratory Systems, vol. 96, pp.132-143, Apr. 2009.
[6] Yongmin Li. “On incremental and robust subspace learning.” Pattern Recognition, vol. 37, pp. 1509-1518, Jul. 2004.
[7] Yulan Liang. “Statistical advances and challenges for analyzing correlated high dimensional SNP data in genomic study for complex Diseases.” Statistics Surveys, vol. 2, pp. 43-60, 2008.
[8] Hong-QiangWang, Hau-SanWong, De-Shuang Huang and Jun Shuc. “Extracting gene regulation information for cancer classification.” Pattern Recognition, vol. 40, pp. 3379-3392, Dec. 2007.
[9] S.R. Amendolia, G. Cossu, M.L. Ganadu, B. Golosio, G.L. Masala and G.M. Murac. “A comparative study of K-Nearest Neighbour, Support Vector Machine and Multi-Layer Perceptron for Thalassemia screening.” Chemometrics and Intelligence Laboratory Systems, vol. 69, pp. 13 – 20, Nov. 2003.
[10] Michael E. Tipping and Christopher M. Bishop. “Probabilistic Principal Component Analysis” Internet: http://www2.mta.ac.il/~gideon/courses/ machine_learning_seminar/papers/ppca.pdf, Sep. 27, 1999 [June 28, 2011].
[11] Lindsay I Smith. “A tutorial on Principal Components Analysis” Internet:http://www.cs.otago.ac.nz/cosc453/student_tutorials/principal_components.pdf, Feb 26, 2002 [June 28, 2011].
[12] Taiwo Oladipupo Ayodele. “Types of Machine Learning Algorithms” Internet: http://www.intechopen.com/articles/show/title/types-of-machine-learning-algorithms, Feb. 10, 2010 [June 28, 2011].
[13] Wikipedia, “Machine Learning” Internet: http://en.wikipedia.org/wiki/Machine_learning, Aug.200 8 [June 28, 2011].
[14] Valairat Dhamcharee, Orasri Romyanan and Tanimporn Ninlagarn. “Genetic Counseling for Thalassemia in Thalind : Problems and Solutions.” Southeast Asian Journal Trop Med Public Health, vol. 32, pp. 413 – 418, Jun. 2001.
[15] Patcharaporn Paokanta, Michele Ceccarelli and Somdat Srichairatanakool. “The Effeciency of Data Types for Classification Performance of Machine Learning Techniques for Screening β-Thalassemia,” in Proc. ISABEL, 2010, pp. 1-4.
Patcharaporn Paokanta, is currently a lecturer in the area of Data Management, E-Commerce and Information Technology at the College of Arts, Media and Technology, Chiang Mai University, Thailand. She is studying in Ph.D of Knowledge Management and obtained her MSc. of Software Engineering in 2009 from College of Arts, Media and Technology, Chiang Mai University, Thailand. In addition, she obtained BSc. of Statistics from faculty of Sciences, Chiang Mai University, Thailand in 2006. She has got the scholarship in E-Link Project from the ELASMUS MUNDUS scholarship to join the research at University of Sannio in Italy for 10 months. Her research interests include Data Mining, Machine Learning, Statistics, Biomedical, Buyer behavior, Knowledge Management, Risk Management, Software Engineering, Expert System, Artificial Intelligence and Applied mathematics. Patcharaporn Paokanta has published articles in International Conferences i.e. SKIMA 2009, ISABEL 2010 and ICCSIT 2011.
International Journal of e-Education, e-Business, e-Management and e-Learning, Vol. 1, No. 2, June, 2011
174