Embed Size (px)
Citation preview
INTERNATIONAL JOURNAL OF COMMUNICATION SYSTEMS 1
Small-cell Planning in LTE HetNet to ImproveEnergy Efficiency
You-Chiun Wang and Shih Lee
Abstract—Cell planning is one essential operation in wireless networks, and it significantly affects system performance and cost. Many
research efforts consider the cell planning problem with identical base stations (BSs) or to construct a new network on the region without any
infrastructure. However, long term evolution (LTE) adopts heterogeneous network (HetNet), which allows operators to tactically deploy small
cells to enhance signal coverage and improve performance. It thus motivates us to propose a small-cell planning problem by adaptively adding
low-powered BSs with the limitation of budget to an existing network in order to increase its energy efficiency, which is defined by the ratio of
network throughput to the amount of energy consumption of BSs. We consider two types of LTE small cells, namely microcells and picocells,
and develop different clustering strategies to deploy these cells. Based on the available resource and traffic demand in each cell, we then
adjust the transmitted power of the deployed BS with energy concern. Experimental results demonstrate that our small-cell planning solution
can achieve high energy efficiency of LTE networks, which means that BSs can better utilize their transmitted energy to satisfy the traffic
demands of user devices. This paper contributes in proposing a practical problem for cell planning with HetNet consideration and developing
an efficient solution to provide green communications.
Index Terms—cell planning, energy efficiency, heterogeneous network (HetNet), long term evolution (LTE), small cell.
✦
1 INTRODUCTION
In wireless networks, cell planning is a critical problem whichdetermines how to deploy base stations (BSs) in a given areato improve the service coverage and save the system cost. Inpast generations of wireless networks, operators usually adopthomogeneous BSs with similar features such as cell range andantenna parameters for system deployment. They calculatethe locations of BSs to cover user devices and reduce signalinterference. Specifically, in 2G networks [1]–[3], operatorsselect some candidate locations to deploy BSs in order tosatisfy the given demand of capacity and then allocate differentchannels for these BSs to avoid interference between eachother. On the other hand, cell planning in 3G networks [4]–[6] aims at determining both locations and transmitted powerof BSs, so as to reduce cell interference. The above solutionsare feasible when users request light-load traffics, for example,voice communications or webpage browsing.
With the coming of 4G epoch, users are thirsty for broad-band wireless communications and operators have to makesure that their deployed networks can support various serviceswith high traffic demands such as mobile television, onlinegaming, and teleconferences [7]. In fact, Cisco points out inits report [8] that multimedia streaming and video downloadshave occupied a large portion of the global network bandwidthtoday, and will keep growing to over 80% of all consumer In-ternet traffics in 2020. Inevitably, the cell planning solutions in2G/3G networks according to homogeneous BSs will becomeinefficient, especially when many users congregate in smallhotspots (for example, markets or airports) and ask for large-demand data transmissions [9].
Consequently, long term evolution (LTE) employs the con-cept of heterogeneous network (HetNet) to allow diverse BSsto cooperate in the same network. In particular, LTE defines
The authors are with the Department of Computer Science and Engineer-ing, National Sun Yat-sen University, Kaohsiung, 80424, Taiwan. E-mail:[email protected]; [email protected]
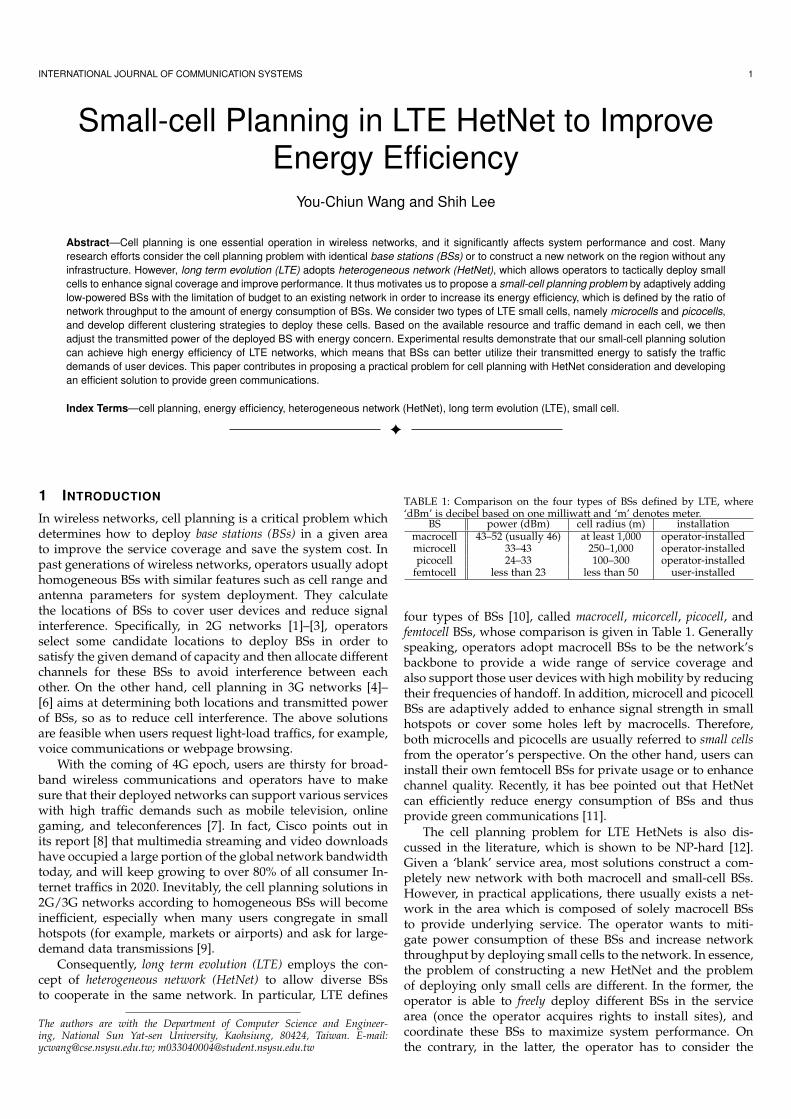
TABLE 1: Comparison on the four types of BSs defined by LTE, where‘dBm’ is decibel based on one milliwatt and ‘m’ denotes meter.
BS power (dBm) cell radius (m) installationmacrocell 43–52 (usually 46) at least 1,000 operator-installedmicrocell 33–43 250–1,000 operator-installedpicocell 24–33 100–300 operator-installed
femtocell less than 23 less than 50 user-installed
four types of BSs [10], called macrocell, micorcell, picocell, andfemtocell BSs, whose comparison is given in Table 1. Generallyspeaking, operators adopt macrocell BSs to be the network’sbackbone to provide a wide range of service coverage andalso support those user devices with high mobility by reducingtheir frequencies of handoff. In addition, microcell and picocellBSs are adaptively added to enhance signal strength in smallhotspots or cover some holes left by macrocells. Therefore,both microcells and picocells are usually referred to small cellsfrom the operator’s perspective. On the other hand, users caninstall their own femtocell BSs for private usage or to enhancechannel quality. Recently, it has bee pointed out that HetNetcan efficiently reduce energy consumption of BSs and thusprovide green communications [11].
The cell planning problem for LTE HetNets is also dis-cussed in the literature, which is shown to be NP-hard [12].Given a ‘blank’ service area, most solutions construct a com-pletely new network with both macrocell and small-cell BSs.However, in practical applications, there usually exists a net-work in the area which is composed of solely macrocell BSsto provide underlying service. The operator wants to miti-gate power consumption of these BSs and increase networkthroughput by deploying small cells to the network. In essence,the problem of constructing a new HetNet and the problemof deploying only small cells are different. In the former, theoperator is able to freely deploy different BSs in the servicearea (once the operator acquires rights to install sites), andcoordinate these BSs to maximize system performance. Onthe contrary, in the latter, the operator has to consider the
2 INTERNATIONAL JOURNAL OF COMMUNICATION SYSTEMS
existence of macrocells and carefully add small cells to improvethe original network. Interestingly, the problem of deployingsmall cells is somewhat like the selection problem of remoteradio heads (RRHs) in a cloud radio network (C-RAN). Specifically,a C-RAN is composed of RRHs and baseband units, whereRRHs is responsible for radio communications while basebandunits provide a set of common computing resource for signalprocessing. The selection of RRH has to consider the locationsof baseband units [13]. Similarly, the deployment of small cellsneeds to take care of the positions and statuses of existingmacrocells.
Based on the above motivation, this paper investigatesthe small-cell planning problem, which determines how to effi-ciently add microcell and picocell BSs to an existing macrocellnetwork in order to improve its energy efficiency, under agiven deployment budget. In particular, the energy efficiencyis defined by the ratio of the HetNet’s throughput to theamount of energy consumed by the whole BSs (includingthe newly deployed ones) [14], [15]. To solve the problem,our idea is to first identify those user devices whose trafficdemands cannot be satisfied by the original (macrocell) BSs.Afterwards, we develop different clustering strategies to findout the suitable locations to place microcell and picocell BSs,and check whether they have sufficient resource to servetheir user devices. Finally, we adjust the transmitted powerof BSs (including macrocell ones) in order to save their energyand support green communications accordingly. Our proposedsmall-cell planning solution allows the operator to flexibly addlow-powered, cheap BSs to the operating network, so as toimprove network throughput while alleviating the traffic loadsand also energy consumption of existing macrocell BSs.
In our previous work [16], we propose an eNB deploymentwith the minimum cost (EDMC) problem which asks how toconstruct a new LTE HetNet with macrocells, microcells, andpicocells. A four-stage solution is developed: Stage 1 estimatesthe number of required macrocells and microcells, while stage2 gives preliminary deployment of these cells. Then, stage 3checks if each BS has enough resource to serve user devicesand adjusts its cell range accordingly. Afterwards, stage 4places picocells to cover unserved user devices. At first glance,this paper seems to be an extension of EDMC. Nevertheless,there are four major differences between them. First of all, theEDMC problem focuses on deploying BSs in a blank servicearea with the objective of minimizing the total cost. On theother hand, our small-cell planning problem aims at improvingan existing macrocell network by adding microcells and pico-cells under a limited amount of budget. More specifically, weseek to improve the energy efficiency of the original network,and this issue is not addressed in EDMC. Second, the EDMCsolution jointly deploys macrocells and microcells in its stage2. This method is efficient when the service area is blank butmay not work well when there already exist macrocells in thearea. To deal with this case, our small-cell planning solutionwill find out the ‘weak points’ in the original network (thatis, the macrocells which cannot meet the traffic demands oftheir user devices), and add small cells to improve them. Third,when estimating the amount of resource supported by each BS,the EDMC solution only computes the (maximum) theoreticalcapacity of each cell according to its bandwidth. In contrast toEDMC, our small-cell planning solution practically calculatesthe available number of physical resource blocks (PRBs) providedby each BS, which takes the LTE specification into considera-
tion and thus helps us acquire more accurate estimation ofa cell’s resource. Fourth, the EDMC solution and our small-cell planning solution have different design philosophies indeploying picocells. In particular, the EDMC solution usespicocells to cover those isolated user devices which cannotbe served by macrocells and microcells. On the contrary, oursmall-cell planning solution considers the hotspot scenario anddevelops a novel clustering strategy to group the user devicesthat congregate in some small regions. The aforementionedfour issues obviously distinguish the proposed small-cell plan-ning solution from our previous EDMC work in [16], and alsoemphasize the contributions of this paper. Through simula-tions, we show that our proposed solution can significantlyoutperform other schemes (including the EDMC solution) interms of the satisfaction ratio of user devices and the amountof energy consumption by BSs, thereby achieving high energyefficiency of the LTE HetNet.
We organize the rest of this paper as follows: Section 2presents both channel model and problem definition. Section 3gives a survey of related work. Afterwards, we propose oursolution to the small-cell planning problem and evaluate itsperformance in Section 4 and Section 5, respectively. Section 6finally concludes this paper and gives some future work.
2 PRELIMINARY
2.1 Channel Model
We follow the LTE specification in both [17] and [18] to esti-mate the transmission behavior of a signal through a wirelesschannel. Specifically, the additive white Gaussian noise (AWGN)is used to describe the environmental noise caused by thethermal agitation (that is, thermal noise), where its powerspectral density is set to -174 dBm/Hz (decibel-milliwatt perhertz). The free-space path loss results in attenuation of awireless signal at the receiver side, which depends on theEuclidean distance di between a user device and its associatedBS. In particular, LTE employs a log-distance model to measureits effect, which is formally expressed by:
• Macrocell: ζ = 128.1+37.6 log di, where di is measuredin kilometers.
• Microcell1: ζ = 34.53 + 38 log di, where di is measuredin meters.
• Picocell: ζ = 38 + 30 log di, where di is measured inmeters.
A wireless signal will be also influenced by the shadowingfading. It occurs when large objects (for example, buildings)block the transmission path, which causes impediment to thesignal. Such fading will add random variation to the signal’samplitude. To evaluate the effect of shadowing fading, LTEadopts a log-normal distribution as follows:
p(X ) =exp[−(X − ε)2/2σ2]√
2πσ, (1)
where X is a random variable used to describe the ratio ofthe received power to the transmitted power in the unit ofdecibel, p(X ) is the probability distribution function of X ,exp[·] denotes the exponential function, and ε and σ representthe mean and standard deviation of X , respectively. The meanε is usually set to zero. For a picocell, the standard deviation σis set to 6 dB; otherwise, it is set to 10 dB.
1. For microcells, we consider the non-line-of-sight case.
SMALL-CELL PLANNING IN LTE HETNET TO IMPROVE ENERGY EFFICIENCY 3
Broadly speaking, both path loss and shadowing fadingsignificantly affect the power strength of a wireless signal atthe receiver side. Consequently, they are useful to evaluate thechannel quality of user devices and determine their data ratesfor cell planning.
2.2 Problem Definition
Suppose that there exists an LTE network consisting of a set Bo
of macrocell BSs. We are given a set U of user devices, wherethe position (xi, yi) and traffic demand ri of each user deviceui ∈ U is known beforehand. In general, since the network hasbeen operated for a period of time, the operator can refer tothe historical statistics to derive the positions where most userdevices appear and their average amount of traffic demands[19]. The operator has a total budget of Γ to deploy a set Bs
of small-cell BSs (including microcell and picocell BSs) in thenetwork, where each BS bj ∈ Bs has the cost of j (for example,installation and hardware costs).
Then, the small-cell planning problem asks how to find theset Bs, determine the locations of BSs in Bs, and compute thetransmitted power of each BS in B = Bo ∪ Bs (that is, the setof all BSs in the LTE HetNet), with the objective of
max
∑ui∈U,bj∈B ri,j∑
bj∈B pj, (2)
subject to
[Budget constraint]∑
bj∈Bs
j ≤ Γ, (3)
[Capacity constraint]∑
{ri,j | ui links to bj} ≤ cj , 0 ≤ ri,j ≤ ri, ∀bj ∈ B, (4)
[Power constraint]∑
{pi,j | ui links to bj} ≤ pj , pi,j ≥ 0, ∀bj ∈ B, (5)
where ri,j is the data rate of a user device ui supported by itsassociated BS bj , pi,j is the amount of power that bj allocatesto ui for data transmission, cj is the available capacity of bj ,and pj is the maximum transmitted power of bj . Here, theobjective function in Eq. (2) seeks to maximize the overallenergy efficiency of the LTE HetNet, which is calculated bythe ratio of network throughput to the energy consumption ofBSs in B. Eq. (3) indicates that the sum of the cost of each BS inBs cannot exceed the operator’s budget Γ. Moreover, for eachBS, we have to make sure that the amount of data rate andpower allocated to all user devices in the corresponding cellshould be restricted by its capacity and maximum transmittedpower, as expressed by Eqs. (4) and (5), respectively.
3 RELATED WORK
In the literature, there have been various approaches devel-oped to solve the cell planning problem with solely macrocells,for instance, simulated annealing [20], genetic algorithm [21],tabu search [22], and geo-clustering [23]. They target at findingthe feasible locations to place macrocell BSs in order to coveruser devices while alleviating signal interference between cells.Nevertheless, these approaches do not exploit the feature ofHetNet and thus lack flexibility in network deployment.
A number of studies address different issues occurred ina HetNet where macrocells and femtocells coexist. In partic-ular, the work of [24] deals with the co-channel interference
problem when a macrocell has coverage overlap with multi-ple femtocells. It allows the macrocell BS to make usage ofthe spectrum configuration information from femtocell BSs toreduce signal interference. In [25], three business models forfemtocell deployment are proposed, namely joint deployment,wireless service provider deployment, and user deployment, whichdepends on who (in particular, the user or the operator) shouldpay the cost to install and maintain femtocells. It then developsthe channel allocation and pricing methods to satisfy the user’srequirement and improve the operator’s revenue, respectively.Given the budget’s limitation, the study of [26] adds femtocellBSs in a macrocell to increase not only the number of userdevices served but also the amount of profit received by theoperator. Yunas et al. [27] discuss different femtocell deploy-ment strategies in suburban regions by considering the effect ofpenetration loss caused by buildings, and analyze interference,spectral efficiency, and energy efficiency of these strategies.However, according to Table 1, femtocells have very short cellradiuses and thus can support just few user devices.
How to combine macrocells with either microcells or pic-ocells is also discussed. In particular, Kaneko et al. [28] it-eratively add picocells within the communication range ofeach macrocell BS, and pick muted subframes during whicha macrocell BS will stop data transmissions (to avoid signalinterference to picocells), until the traffic demands of userdevices become satisfied. The work of [29] proposes twoapproximation algorithms to deploy both macrocell BSs andrelay stations (which can be viewed as a kind of microcellsbut they have to share spectral resource with macrocell BSs).One is to minimize the deployment cost while the other is todeploy BSs with the consideration of budget. Shih and Zain[30] apply a geo-clustering scheme to deploy macrocells andpicocells according to the terrain in the service area ratherthan the distribution of user devices. Thus, the traffic demandsof some user devices may not be met. Li et al. [31] employa genetic algorithm to iteratively add microcells, so as toimprove the energy utilization of macrocell BSs. However, itrequires to repeat the algorithm many times (in particular,more than 600 times) to get a stable result. Zhao et al. [32]first propose an algorithm to deploy only macrocells with anapproximation ratio of O(logRm), where Rm is the maximumachievable capacity of a macrocell. Based on the result, anotherO(logRp)-approximation algorithm for the picocell scenario isalso developed, where Rp is the maximum achievable capac-ity of a macrocell whose range contains picocells. It can beobserved that the above studies address only one combinationof HetNets (that is, macrocells with microcells, or macrocellswith picocells).
Few research efforts consider deploying multiple types ofsmall cells. The work of [33] formulates an APX2-hard problemto deploy macrocell BSs, picocell BSs, and relay stations in aservice region. An approximation algorithm is then proposedto allow user devices to be served by multiple BSs. In [12],a divide-and-rule strategy is developed to deploy macrocellsand small cells under a given budget. This work translatesthe deployment problem to a convex optimization problemand solves it by the Karush-Kuhn-Tucker condition [34]. Asdiscussed earlier in Section 1, our previous work in [16] allowsan operator to deploy macrocells, microcells, and picocells in
2. Based on the complexity theory, the class of approximable (APX)problems is the set of NP optimization problems which allow polynomial-time approximation algorithms to have the approximation ratio boundedby a constant.
4 INTERNATIONAL JOURNAL OF COMMUNICATION SYSTEMS
a service area to reduce the deployment cost. However, theseresearch efforts consider deploying a completely new networkon the blank area without any infrastructure. It thereby mo-tivates us to propose the small-cell planning problem in thispaper to allow operators to dynamically deploy small cellsin an existing network to improve its performance and saveenergy consumption of BSs.
4 THE PROPOSED SMALL-CELL PLANNING
SOLUTION
Given the set Bo of existing macrocell BSs and the set Uof user devices, our proposed small-cell planning solutioninvolves the four phases to deploy a set Bs of small-cell BSsto improve the energy efficiency of the original network underthe constraint of budget Γ as follows:
1) Identify user devices: In the beginning, we find out thoseuser devices that require the service of small cells. Suchuser devices include 1) the user devices which are notcovered by any BS yet and 2) the user devices whosetraffic demands cannot be satisfied by its macrocell BS.We denote by UL the set of these user devices.
2) Deploy microcells: Since a microcell provides muchlarger coverage than a picocell (referring to Table 1),we thus prefer deploying microcells to serve the userdevices in UL, subject to the budget Γ. We then adjustthe communication range of each microcell accordingto its BS’s capacity and the traffic demands of userdevices.
3) Deploy picocells: In case that UL is not empty and therestill exists a budget surplus, we then add picocellsto the network to serve the remaining user devicesin UL. To consider cost-effectiveness, we will deploypicocells to cover the user devices in hotspot regionsfirst. Afterwards, we also check whether each picocellBS possesses sufficient capacity to serve user devicesand adjust its cell range accordingly.
4) Adjust macrocells: Since some user devices of a macro-cell may be reassigned to other small cells, we are ableto shrink the communication range of that macrocelland reduce the energy consumption of its BS accord-ingly.
Below, we detail the design of each phase, followed by thediscussion of our rationale. Then, we address the issue of inter-cell interference.
4.1 Phase 1: Identify User Devices
As mentioned earlier, UL is composed of two non-overlappedsubsets. One subset (denoted by Uc) contains the user devicesthat are not covered by any macrocell BS in Bo due to theoriginal network deployment. The other subset (denoted byUd) consists of the user devices whose traffic demands cannotbe satisfied by their macrocell BSs because of insufficient re-source. It is relatively easy to calculate Uc by checking whethera user device is located inside the communication range of anymacrocell. If not, we will add the user device to Uc. The abovecheck is repeated until all user devices are examined.
To calculate Ud, we adopt the Shannon’s equation [35] toestimate the maximum capacity of each macrocell and checkwhether the BS possesses enough bandwidth and transmittedpower to support its user devices in the cell. Specifically, let pi,j
and λi,j be the amount of transmitted power and bandwidththat a macrocell BS bj allocates to a user device ui. Given thesignal to interference plus noise ratio (SINR) γ, the achievable datarate of ui provided by BS bj is measured as follows:
ri,j = λi,j × log2(1 + γ). (6)
In particular, SINR γ primarily depends on both transmittedpower pi,j and bandwidth λi,j , and its value can be calculatedby
γ = τi,j ×pi,jλi,j
=|gi,j |2ǫN0
× pi,jλi,j
, (7)
where gi,j denotes the channel gain, ǫ represents the SINR gap,and N0 is the power spectral density of AWGN. Specifically,the gap ǫ is a constant which depends on both the symbolerror rate and the modulation and coding scheme (MCS), wherethe work of [36] presents some suggested values for ǫ. On theother hand, N0 is set to -174 dBm/Hz according to the LTEspecification, as discussed in Section 2.1.
Through both Eqs. (6) and (7), we can evaluate the nec-essary amount of BS bj ’s transmitted power to allow a userdevice ui to have data rate of ri,j and bandwidth of λi,j asfollows:
pi,j =λi,j
τi,j×(2ri,j/λi,j − 1
). (8)
By setting ri,j = ri (in other words, the traffic demand of userdevice ui is satisfied by BS bj), we can reexpress Eq. (8) to
pi,j =ǫN0λi,j
|gi,j |2×(2rj/λi,j − 1
). (9)
Let Uj be the set of user devices which associate with a BSbj . By checking both conditions:
∑
ui∈Uj
pi,j ≤ pj , (10)
∑
ui∈Uj
λi,j ≤ λj , (11)
where pj and λj denote the total transmitted power and band-width of bj , we can determine whether this BS has sufficientresource to satisfy the traffic demands of all it user devices.If any of Eqs. (10) and (11) does not hold, BS bj shouldremove some user devices from its cell in order to satisfyboth equations. In particular, we let BS bj iteratively mark thefarthest user device in its cell as ‘uncovered’ and add the userdevice to the set Ud, until bj has enough transmitted powerand bandwidth to serve the remaining user devices. Remark 1discusses the reasons why BS bj should select (and remove)such user devices.
Remark 1. Our method to find the set Ud has two benefits. First,according to the discussion in Section 2.1, the strength ofthe received power by a user device significantly degradeswhen it has a longer distance to the BS because of thepath-loss effect. In other words, there is a high possibilitythat the user device will encounter worse channel quality,thereby consuming more resource of its BS. Thus, removingsuch user devices can help alleviate the BS’s load. Second,it is not a good idea to deploy a small cell close to thecentral part of a macrocell, otherwise the macrocell BS willexert stronger noises to the user devices in the small cell.Therefore, by iteratively adding the farthest user devicein a macrocell to the set Ud, we can alleviate inter-cell
SMALL-CELL PLANNING IN LTE HETNET TO IMPROVE ENERGY EFFICIENCY 5
interference when deploying small cells to cover the userdevices in Ud.
By calculating UL = Uc ∪ Ud, we can deploy small cellsby the following phases to serve the user devices in UL, so asto improve the original network. Notice that UL = ∅ impliesthat the current BSs have sufficient capacity to serve all userdevices, so there is no need to add small cells (and thus thealgorithm terminates).
4.2 Phase 2: Deploy Microcells
This phase is further composed of four steps to deploy micro-cells to cover the user devices in UL.
• Step 1: We first cluster the user devices of the setUL according to their positions in the service area. Inparticular, we adopt the popular K-means clusteringscheme, which can put the user devices whose positionsare close to each other in the same cluster. Specifically,we set K = ⌊Γ/micro⌋, where micro denotes the costof a microcell BS. We also update the residual budgetby
Γ = Γ−K × micro. (12)
Then, the K-means scheme works as follows: In thebeginning, UL is arbitrarily divided into K nonemptyclusters. Afterwards, an iterative process is conducted.In every iteration, the centroid of each cluster is com-puted. In particular, given a cluster of user deviceswhose positions are {(x1, y1), (x2, y2), · · · , (xk, yk)}, its
centroid is computed by (∑k
i=1 xi/k,∑k
i=1 yi/k). Then,we redivide UL into clusters such that the user devicesclosest to the same centroid are assigned to the samecluster. The above process is repeated until no clustercan be further changed. After getting the K-meansresult, we place a microcell BS on the centroid of eachcluster to cover its user devices, and set UL = ∅.
• Step 2: Afterwards, we eliminate those user devicesfrom microcells due to very weak received signals. Inparticular, suppose that γmin is the minimum value ofSINR that a user device can employ the simplest MCS3
to receive and decode data sent from its BS. For eachuser device ui, we check its SINR value by
γi,j =pj − ζi − p(Xi)
ηλj +∑
bv∈B,bv 6=bjIi,v
≥ γmin, (13)
where pj is the transmitted power of the microcellBS bj that ui expects to link, ζi is the effect of pathloss on ui, and p(Xi) is the effect of shadowing effecton ui (which we have discussed in Section 2.1), η isthe effect of noise, which can be calculated by theproduct of noise figure and noise spectral density, andIi,v represents the power of signal interference fromanother BS bv (for example, the BS of the umbrellamacrocell). In Eq. (13), the numerator is the receivedsignal strength by ui (which considers both path-lossand shadowing effects), and the denominator addressesinter-cell interference by taking the term of Ii,v intoaccount. In case that Eq. (13) is violated, it means thatui may not be able to correctly receive data from BS bj .
TABLE 2: The modulation and minimum required SINR value for eachCQI index, where QAM is the acronym of ‘quadrature amplitude modula-tion’.
CQI modulation SINR (in dB)
1 QPSK -6.9362 QPSK -5.1473 QPSK -3.1804 QPSK -1.2535 QPSK 0.7616 QPSK 2.6997 16QAM 4.6948 16QAM 6.5259 16QAM 8.57310 64QAM 10.36611 64QAM 12.28912 64QAM 14.17313 64QAM 15.88814 64QAM 17.81415 64QAM 19.829
Consequently, we eliminate ui from the microcell andadd it to the set UL again.
• Step 3: With the knowledge of γi,j from Eq. (13), wecan estimate the channel quality indicator (CQI) of eachuser device in a microcell. In particular, it can be doneby consulting Table 2 [37] to find the corresponding CQIvalue. Then, the LTE standard [38] provides three tablesto calculate the amount of data that each user device isable to receive according to its CQI value. Specifically,the first table maps between the MCS index and the CQIindex for the user device. Afterwards, the second tablemaps between the transport block size (TBS) index andthe MCS index. Finally, given the TBS index and thenumber of PRBs of that user device, we can calculatethe amount of data carried by these PRBs by referringto the third table. Through these tables, we are able tomeasure whether a macrocell BS bj has enough PRBs toserve all user devices in the cell. In particular, supposethat bj has nPRB
j PRBs. We then check
∑{⌈ri/ti,j⌉ | ui links to bj} ≤ nPRB
j , (14)
where ri is the (minimum) traffic demand of ui andti,j represents ui’s TBS supported by bj . When Eq. (14)does not hold, it implies that bj does not have sufficientresource to satisfy the traffic demands of all its user de-vices. In this case, we have to remove some user devicesfrom the microcell. With the consideration of Remark 1,we iteratively remove the user device farthest from theBS and add the user device to the set UL, until Eq. (14)becomes satisfied.
• Step 4: For each microcell BS that satisfies the trafficdemands of its user devices, we gradually test whetherit is possible to decrease the transmitted power andstill make both Eqs. (13) and (14) hold (for example,by decreasing 5% amount of the power). In this way,we can save the energy consumption of microcell BSs.When the transmitted power of a microcell BS bj isdecreased to less than or equal to ppico and the numberof user devices served in the microcell is no largerthan mpico, where ppico is the maximum transmittedpower of a picocell BS and mpico denotes the maximumnumber of user devices allowed in a picocell, we can
3. Quadrature phase-shift keying (QPSK) with code rate 78 is the sim-plest MCS defined in LTE.
6 INTERNATIONAL JOURNAL OF COMMUNICATION SYSTEMS
v9
v7
v3
v4
v2
v1
v5
v6 v8
ξ
Fig. 1: An example of the DBSCAN algorithm.
replace bj by a picocell BS to further save the budget.In this case, we can update the residual budget by
Γ = Γ + (micro − pico)× α, (15)
where pico denotes the cost of a picocell BS and α isthe number of replaced (microcell) BSs.
4.3 Phase 3: Deploy Picocells
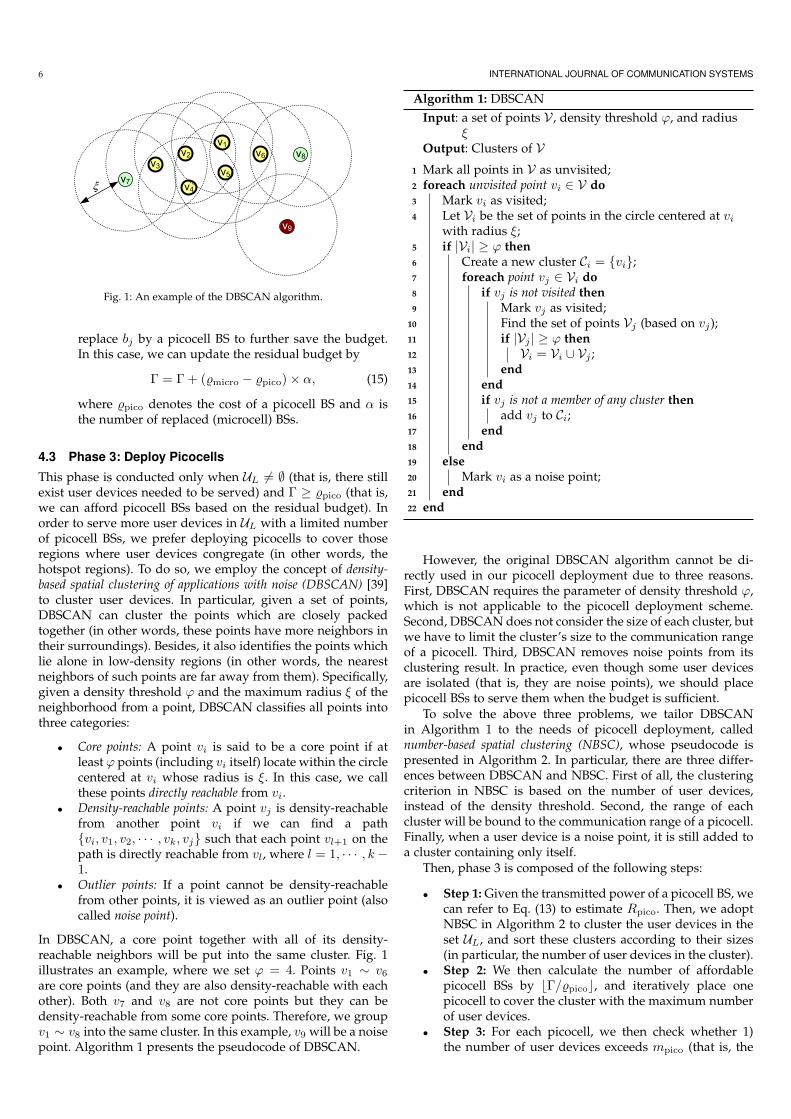
This phase is conducted only when UL 6= ∅ (that is, there stillexist user devices needed to be served) and Γ ≥ pico (that is,we can afford picocell BSs based on the residual budget). Inorder to serve more user devices in UL with a limited numberof picocell BSs, we prefer deploying picocells to cover thoseregions where user devices congregate (in other words, thehotspot regions). To do so, we employ the concept of density-based spatial clustering of applications with noise (DBSCAN) [39]to cluster user devices. In particular, given a set of points,DBSCAN can cluster the points which are closely packedtogether (in other words, these points have more neighbors intheir surroundings). Besides, it also identifies the points whichlie alone in low-density regions (in other words, the nearestneighbors of such points are far away from them). Specifically,given a density threshold ϕ and the maximum radius ξ of theneighborhood from a point, DBSCAN classifies all points intothree categories:
• Core points: A point vi is said to be a core point if atleast ϕ points (including vi itself) locate within the circlecentered at vi whose radius is ξ. In this case, we callthese points directly reachable from vi.
• Density-reachable points: A point vj is density-reachablefrom another point vi if we can find a path{vi, v1, v2, · · · , vk, vj} such that each point vl+1 on thepath is directly reachable from vl, where l = 1, · · · , k−1.
• Outlier points: If a point cannot be density-reachablefrom other points, it is viewed as an outlier point (alsocalled noise point).
In DBSCAN, a core point together with all of its density-reachable neighbors will be put into the same cluster. Fig. 1illustrates an example, where we set ϕ = 4. Points v1 ∼ v6are core points (and they are also density-reachable with eachother). Both v7 and v8 are not core points but they can bedensity-reachable from some core points. Therefore, we groupv1 ∼ v8 into the same cluster. In this example, v9 will be a noisepoint. Algorithm 1 presents the pseudocode of DBSCAN.
Algorithm 1: DBSCAN
Input: a set of points V , density threshold ϕ, and radiusξ
Output: Clusters of V1 Mark all points in V as unvisited;2 foreach unvisited point vi ∈ V do3 Mark vi as visited;4 Let Vi be the set of points in the circle centered at vi
with radius ξ;5 if |Vi| ≥ ϕ then6 Create a new cluster Ci = {vi};7 foreach point vj ∈ Vi do8 if vj is not visited then9 Mark vj as visited;
10 Find the set of points Vj (based on vj);11 if |Vj | ≥ ϕ then12 Vi = Vi ∪ Vj ;13 end14 end15 if vj is not a member of any cluster then16 add vj to Ci;17 end18 end19 else20 Mark vi as a noise point;21 end22 end
However, the original DBSCAN algorithm cannot be di-rectly used in our picocell deployment due to three reasons.First, DBSCAN requires the parameter of density threshold ϕ,which is not applicable to the picocell deployment scheme.Second, DBSCAN does not consider the size of each cluster, butwe have to limit the cluster’s size to the communication rangeof a picocell. Third, DBSCAN removes noise points from itsclustering result. In practice, even though some user devicesare isolated (that is, they are noise points), we should placepicocell BSs to serve them when the budget is sufficient.
To solve the above three problems, we tailor DBSCANin Algorithm 1 to the needs of picocell deployment, callednumber-based spatial clustering (NBSC), whose pseudocode ispresented in Algorithm 2. In particular, there are three differ-ences between DBSCAN and NBSC. First of all, the clusteringcriterion in NBSC is based on the number of user devices,instead of the density threshold. Second, the range of eachcluster will be bound to the communication range of a picocell.Finally, when a user device is a noise point, it is still added toa cluster containing only itself.
Then, phase 3 is composed of the following steps:
• Step 1: Given the transmitted power of a picocell BS, wecan refer to Eq. (13) to estimate Rpico. Then, we adoptNBSC in Algorithm 2 to cluster the user devices in theset UL, and sort these clusters according to their sizes(in particular, the number of user devices in the cluster).
• Step 2: We then calculate the number of affordablepicocell BSs by ⌊Γ/pico⌋, and iteratively place onepicocell to cover the cluster with the maximum numberof user devices.
• Step 3: For each picocell, we then check whether 1)the number of user devices exceeds mpico (that is, the
SMALL-CELL PLANNING IN LTE HETNET TO IMPROVE ENERGY EFFICIENCY 7
Algorithm 2: NBSC
Input: a set of user devices UL and picocell radius Rpico
Output: Clusters of UL
1 Mark all user devices in UL as unvisited;2 foreach unvisited user device ui ∈ UL do3 Mark ui as visited;4 Let Ui be the set of user devices in the circle centered
at ui with radius Rpico;5 Create a new cluster Ci = Ui;6 foreach user device uj ∈ Ui do7 if uj is not visited then8 Mark uj as visited;9 Find the set of user devices Uj (based on uj);
10 if |Uj | > |Ci| then11 Replace Ci by Uj ;12 end13 end14 end15 end
maximum number of user devices allowed in a picocell)and 2) its BS does not have sufficient resource to satisfythe traffic demands of all user devices according toEq. (14). If so, we iteratively remove the farthest userdevice from the picocell, until it can pass the above twochecks.
4.4 Phase 4: Adjust Macrocells
With the help of small cells, macrocell BSs are able to reducetheir traffic loads by reassigning some user devices to nearbysmall-cell BSs. In this case, we can also lower down theirtransmitted power to save the system maintenance cost and
also provide green communications. Specifically, let Uj denotethe set of user devices originally served by a macrocell BSbj but reassigned to other small cells (by phases 2 or 3). For
each user device ui in Uj , we can employ Eq. (8) to calculatethe amount of transmitted power pi,j that bj allocates to itfor communication. Then, the transmitted power of bj can bedecreased to
pj = pj −∑
ui∈Uj
pi,j , (16)
to save its energy.
4.5 Design Rationale
We then discuss the rationale of our small-cell planning so-lution. It first finds out the set of user devices which are notcovered by any macrocell or whose traffic demands cannotbe satisfied by their associated BSs. Then, our solution adoptstwo different clustering strategies to determine the locationsto place microcell and picocell BSs in order to serve theseuser devices. Specifically, in phase 2, we choose the K-meansclustering algorithm due to two reasons. First, it requires theknowledge of the number of groups, which we can easilyderive according to the deployment budget Γ. Second, theobjective of K-means is to minimize
K∑
j=1
∑
ui∈Cj
D(ui, βj)2, (17)
where βj is the centroid of each cluster Cj , and D(ui, βj)denotes the distance between a user device ui and the centroid.Eq. (17) implicitly implies that βj must be the closest centroidfor any user device in cluster Cj . In other words, βj is the‘best’ location to deploy a microcell BS bj to cover Cj from thegeometric perspective, because the user devices in Cj cannotfind another microcell BS which is closer than bj . On the otherhand, since we could afford only few picocell BSs from theremaining budget, it would be better to deploy these BSsto cover those regions where most user devices congregate(that is, hotspot regions). Therefore, we develop a new NBSCalgorithm modified from the DBSCAN algorithm to organizeclusters which can consist of more user devices. Both phases 2and 3 consider the number of PRBs supported by each small-cell BS and adjust the range of its cell accordingly. Finally, thelast phase also shrinks the communication range of macrocellsto further save the energy consumption of their BSs.
We remark that our small-cell planning solution can ef-ficiently deal with the situation where the density of userdevices in the service area fluctuates over different times.For instance, there usually exist numerous user devices ina downtown office area on daytime of workdays, but thesame area may contain much fewer user devices on weekendsor nighttime. Consequently, the operator can use macrocellsalong with dense small cells to provide service so as to handlethe former case, while turn off small cells (or even somemacrocells) to save the energy consumption of the operatingnetwork in the latter case. Moreover, the service area may becrowed with many user devices in a short time because of bigevents such as a singing concert. In this case, the operator canadaptively deploy small-cell BSs in the service area accordingto the expected distribution of user devices by our small-cellplanning solution, and withdraw these BSs after the event forthe economic consideration.
4.6 Discussion on Inter-cell Interference
In our small-cell planning solution, there are two special de-signs which address the issue of inter-cell interference. Firstof all, when constructing the set Ud in phase 1, we consideriteratively moving the user device that has the longest distancefrom a macrocell BS to Ud. As discussed in Remark 1, itprevents from deploying small cells to cover the user devicesin Ud which are very close to macrocell BSs, thereby alleviat-ing signal interference from these high-powered BSs. Second,when deploying microcell and picocell BSs (in both phases 2and 3), we refer to Eq. (13) to calculate the SINR value of eachuser device in these small cells. The calculation of SINR inEq. (13) considers the effect of signal interference from nearbyBSs and thus provides more accurate estimation of spectralresource in each small cell.
On the other hand, LTE develops the technique of en-hanced inter-cell interference coordination (eICIC) to deal withthe inter-cell interference problem in a HetNet, which pro-poses both frequency-domain and time-domain mechanisms.The frequency-domain eICIC mechanism assigns different fre-quency bands for macrocell and small-cell BSs to separatelytransmit their data, so as to avoid signal interference with eachother. The time-domain eICIC mechanism aims at mitigatingthe interference problem in small cells. More specifically, themacrocell BS selects a number of subframes as almost blanksubframes (ABSs) in each period, during which it sends nothingbut only control signals with very low power. In this way,
8 INTERNATIONAL JOURNAL OF COMMUNICATION SYSTEMS
TABLE 3: Simulation parameters of BSs.BS macrocell microcell picocell
cell radius 3,000 m 1,000 m 300 mmaximum power 46 dBm 38 dBm 30 dBm
bandwidth 50 MHz 30 MHz 20 MHzcost [42] $397,800 $42,200 $12,400
channel model referring to Section 2.1
(a) Scenario 1: regular deployment
(b) Scenario 2: arbitrary deployment
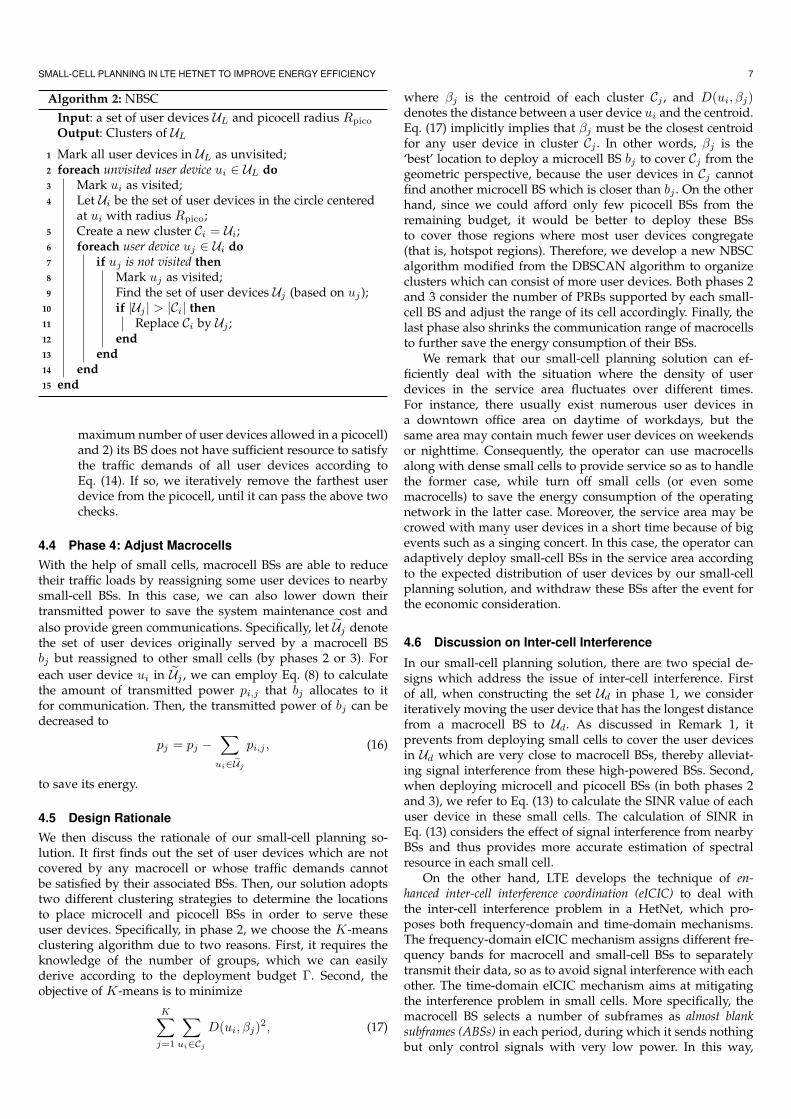
Fig. 2: Two scenarios used to model the deployment of macrocells.
the user devices in small cells are capable of receiving datafrom their BSs without signal interference from the macrocellBS. Generally speaking, the time-domain eICIC mechanismis more flexible than the frequency-domain one, since it canbetter utilize the spectral resource by allowing different cellsto share the same frequency band. Both studies [40], [41] sur-vey some approaches for frequency-domain and time-domaineICIC mechanisms, respectively.
5 PERFORMANCE EVALUATION
We adopt MATLAB to evaluate the performance of our pro-posed small-cell planning solution, where Table 3 presents thesimulation parameters of BSs and the deployment budget Γis set to $1,000,000. The service area is a 20,000×20,000m2
square, on which there have been some macrocells deployed.
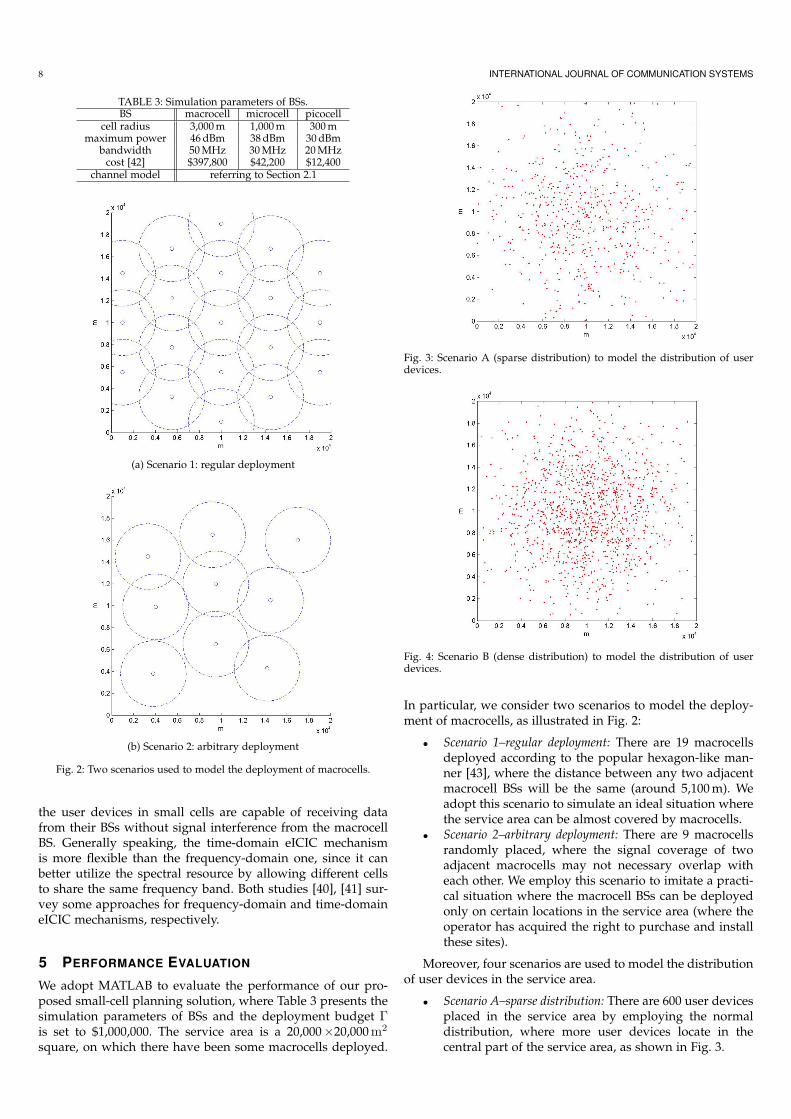
Fig. 3: Scenario A (sparse distribution) to model the distribution of userdevices.
Fig. 4: Scenario B (dense distribution) to model the distribution of userdevices.
In particular, we consider two scenarios to model the deploy-ment of macrocells, as illustrated in Fig. 2:
• Scenario 1–regular deployment: There are 19 macrocellsdeployed according to the popular hexagon-like man-ner [43], where the distance between any two adjacentmacrocell BSs will be the same (around 5,100 m). Weadopt this scenario to simulate an ideal situation wherethe service area can be almost covered by macrocells.
• Scenario 2–arbitrary deployment: There are 9 macrocellsrandomly placed, where the signal coverage of twoadjacent macrocells may not necessary overlap witheach other. We employ this scenario to imitate a practi-cal situation where the macrocell BSs can be deployedonly on certain locations in the service area (where theoperator has acquired the right to purchase and installthese sites).
Moreover, four scenarios are used to model the distributionof user devices in the service area.
• Scenario A–sparse distribution: There are 600 user devicesplaced in the service area by employing the normaldistribution, where more user devices locate in thecentral part of the service area, as shown in Fig. 3.
SMALL-CELL PLANNING IN LTE HETNET TO IMPROVE ENERGY EFFICIENCY 9
Fig. 5: Scenario C (multiple groups) to model the distribution of userdevices.
Fig. 6: Scenario D (streets in Kaohsiung City) to model the distribution ofuser devices.
• Scenario B–dense distribution: This scenario is similar toscenario A but has twice of the density of user devices(that is, 1,200 user devices). Fig. 4 illustrates the densedistribution.
• Scenario C–multiple groups: The service area containstotally 1,800 user devices. Observing from Fig. 5, thereare four conspicuous groups of user devices where theyare closely packed together.
• Scenario D–streets: We refer to the street map of thedowntown region in Kaohsiung City to construct theservice area (as presented in Fig. 6), where 2,600 userdevices are placed along streets.
We combine the two scenarios for the deployment of macro-cells with the four scenarios for the distribution of user devices,so there are totally eight scenarios adopted in our simulations,which is summarized in Table 4. The average traffic demandof user devices is set to 1Mbps (with the standard deviation of0.1Mbps).
We compare our small-cell planning solution (abbreviatedto ‘SCP’ in simulation figures) with four schemes:
• Baseline: In this scheme, we do not deploy any small cellin the service area. The baseline scheme is merely used
0
10
20
30
40
50
60
70
80
90
100
baseline DBSCAN K-means EDMC SCP
satisfa
ction
ratio
(%)
1-A 1-B 1-C 1-D
(a) Scenario 1
0
10
20
30
40
50
60
70
80
90
100
baseline DBSCAN K-means EDMC SCPsatisfa
ction
ratio
(%)
2-A 2-B 2-C 2-D
(b) Scenario 2
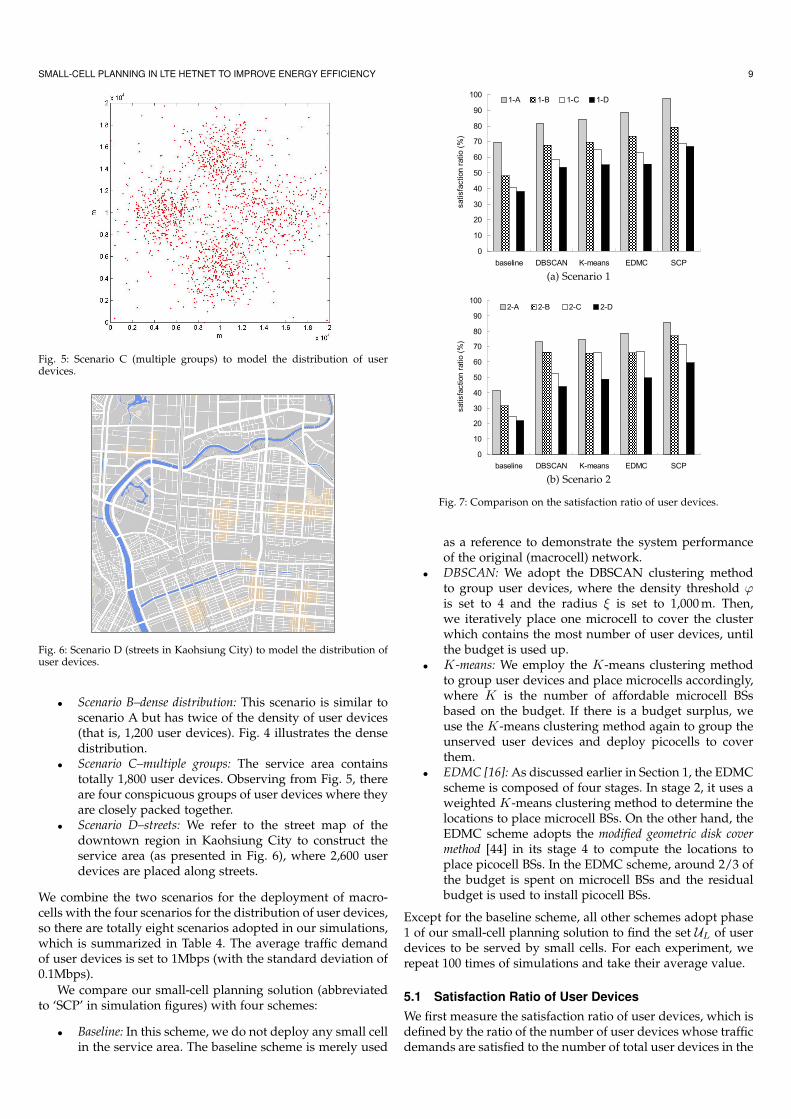
Fig. 7: Comparison on the satisfaction ratio of user devices.
as a reference to demonstrate the system performanceof the original (macrocell) network.
• DBSCAN: We adopt the DBSCAN clustering methodto group user devices, where the density threshold ϕis set to 4 and the radius ξ is set to 1,000 m. Then,we iteratively place one microcell to cover the clusterwhich contains the most number of user devices, untilthe budget is used up.
• K-means: We employ the K-means clustering methodto group user devices and place microcells accordingly,where K is the number of affordable microcell BSsbased on the budget. If there is a budget surplus, weuse the K-means clustering method again to group theunserved user devices and deploy picocells to coverthem.
• EDMC [16]: As discussed earlier in Section 1, the EDMCscheme is composed of four stages. In stage 2, it uses aweighted K-means clustering method to determine thelocations to place microcell BSs. On the other hand, theEDMC scheme adopts the modified geometric disk covermethod [44] in its stage 4 to compute the locations toplace picocell BSs. In the EDMC scheme, around 2/3 ofthe budget is spent on microcell BSs and the residualbudget is used to install picocell BSs.
Except for the baseline scheme, all other schemes adopt phase1 of our small-cell planning solution to find the set UL of userdevices to be served by small cells. For each experiment, werepeat 100 times of simulations and take their average value.
5.1 Satisfaction Ratio of User Devices
We first measure the satisfaction ratio of user devices, which isdefined by the ratio of the number of user devices whose trafficdemands are satisfied to the number of total user devices in the
10 INTERNATIONAL JOURNAL OF COMMUNICATION SYSTEMS
TABLE 4: The eight scenarios used in the simulations.scenario deployment of number of distribution of number of
macrocells macrocell BSs user devices user devices1-A Fig. 2(a) 19 Fig. 3 6001-B Fig. 2(a) 19 Fig. 4 1,2001-C Fig. 2(a) 19 Fig. 5 1,8001-D Fig. 2(a) 19 Fig. 6 2,6002-A Fig. 2(b) 9 Fig. 3 6002-B Fig. 2(b) 9 Fig. 4 1,2002-C Fig. 2(b) 9 Fig. 5 1,8002-D Fig. 2(b) 9 Fig. 6 2,600
service area. Obviously, a higher satisfaction ratio implies thatthe network throughput also becomes higher. Fig. 7 illustratesthe experiment result. Generally speaking, each scheme is ableto achieve a higher satisfaction ratio in scenario 1, becausethere have existed more macrocells to provide service and theycover the most part of the service area. When we take a deeplook at the effect of different distributions of user devices, wecan find that the following relationship holds:
scenario A > scenario B > scenario C > scenario D.
The major reason is that the number of user devices grows andtheir distribution becomes more complex (from scenario A toscenario D).
From Fig. 7, by adding small cells to the network, allother schemes can substantially increase the satisfaction ratiocomparing with the baseline scheme, especially in scenario 2(where macrocells only provide partial coverage in the servicearea). This phenomenon exhibits the superiority of the HetNetover the traditional network consisting of only homogeneousmacrocells. Both the K-means and EDMC schemes outperformthe DBSCAN scheme, because these two schemes are allowedto deploy (cheap) picocells to serve more user devices, un-der the constraint of limited budget. Our small-cell planningsolution can further increase the satisfaction ratio than K-means and EDMC, because it not only checks whether eachmicrocell BS possesses enough PRBs to serve user devices butalso employs the NBSC clustering algorithm to greedily deploypicocells to cover those hotspot regions where user devicescongregate. This experiment demonstrates that the proposedsmall-cell planning solution can make good use of the budgetto adaptively add small cells to a network to significantlyimprove its throughput.
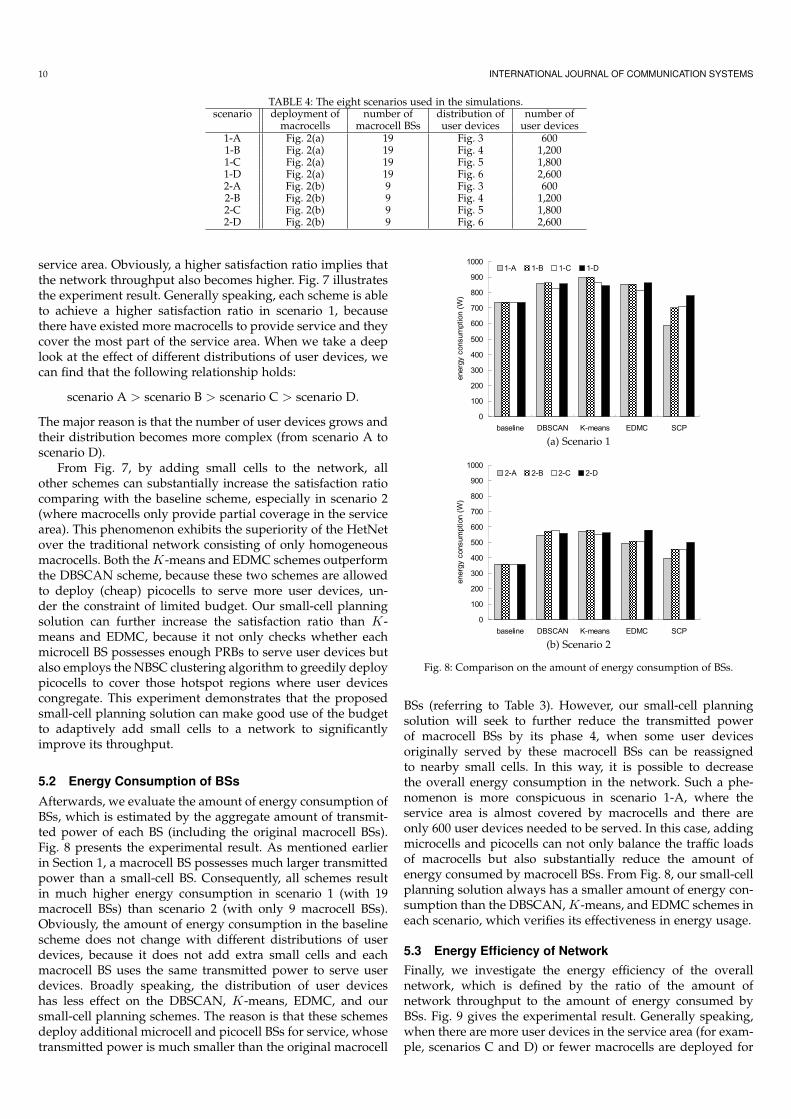
5.2 Energy Consumption of BSs
Afterwards, we evaluate the amount of energy consumption ofBSs, which is estimated by the aggregate amount of transmit-ted power of each BS (including the original macrocell BSs).Fig. 8 presents the experimental result. As mentioned earlierin Section 1, a macrocell BS possesses much larger transmittedpower than a small-cell BS. Consequently, all schemes resultin much higher energy consumption in scenario 1 (with 19macrocell BSs) than scenario 2 (with only 9 macrocell BSs).Obviously, the amount of energy consumption in the baselinescheme does not change with different distributions of userdevices, because it does not add extra small cells and eachmacrocell BS uses the same transmitted power to serve userdevices. Broadly speaking, the distribution of user deviceshas less effect on the DBSCAN, K-means, EDMC, and oursmall-cell planning schemes. The reason is that these schemesdeploy additional microcell and picocell BSs for service, whosetransmitted power is much smaller than the original macrocell
0
100
200
300
400
500
600
700
800
900
1000
baseline DBSCAN K-means EDMC SCP
energ
yconsum
ption
(W)
1-A 1-B 1-C 1-D
(a) Scenario 1
0
100
200
300
400
500
600
700
800
900
1000
baseline DBSCAN K-means EDMC SCP
energ
yconsum
ption
(W)
2-A 2-B 2-C 2-D
(b) Scenario 2
Fig. 8: Comparison on the amount of energy consumption of BSs.
BSs (referring to Table 3). However, our small-cell planningsolution will seek to further reduce the transmitted powerof macrocell BSs by its phase 4, when some user devicesoriginally served by these macrocell BSs can be reassignedto nearby small cells. In this way, it is possible to decreasethe overall energy consumption in the network. Such a phe-nomenon is more conspicuous in scenario 1-A, where theservice area is almost covered by macrocells and there areonly 600 user devices needed to be served. In this case, addingmicrocells and picocells can not only balance the traffic loadsof macrocells but also substantially reduce the amount ofenergy consumed by macrocell BSs. From Fig. 8, our small-cellplanning solution always has a smaller amount of energy con-sumption than the DBSCAN, K-means, and EDMC schemes ineach scenario, which verifies its effectiveness in energy usage.
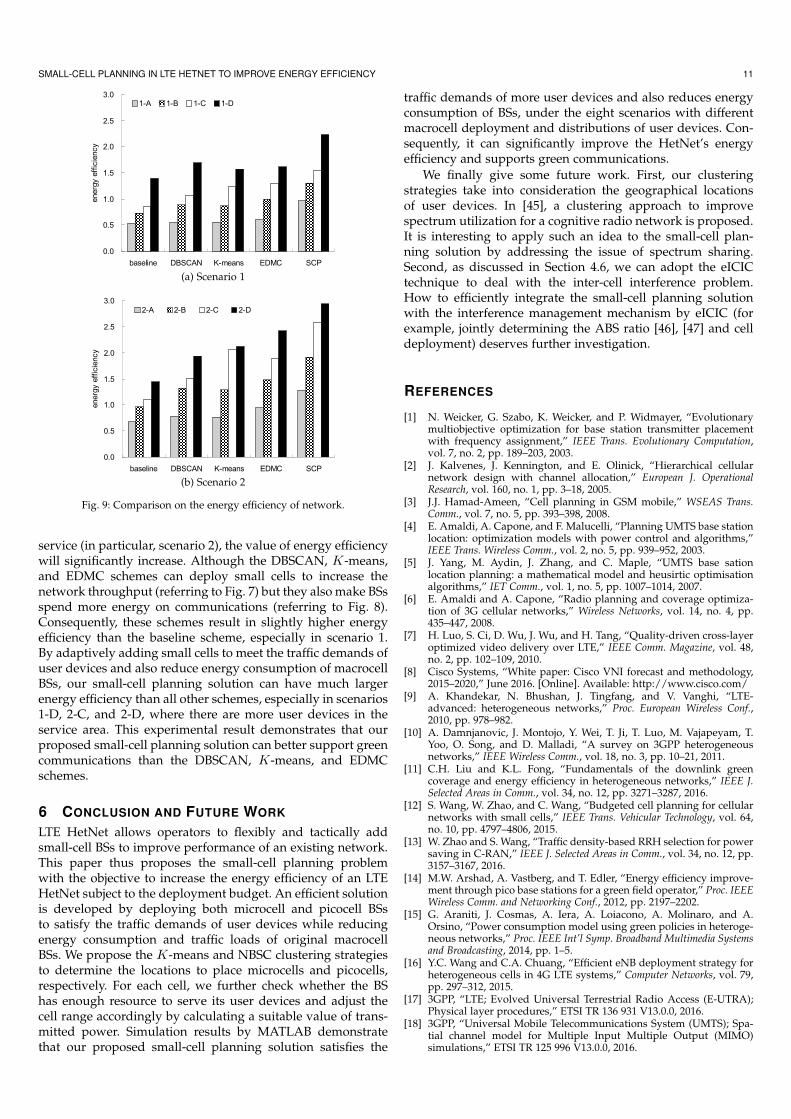
5.3 Energy Efficiency of Network
Finally, we investigate the energy efficiency of the overallnetwork, which is defined by the ratio of the amount ofnetwork throughput to the amount of energy consumed byBSs. Fig. 9 gives the experimental result. Generally speaking,when there are more user devices in the service area (for exam-ple, scenarios C and D) or fewer macrocells are deployed for
SMALL-CELL PLANNING IN LTE HETNET TO IMPROVE ENERGY EFFICIENCY 11
0.0
0.5
1.0
1.5
2.0
2.5
3.0
baseline DBSCAN K-means EDMC SCP
energ
yeff
icie
ncy
1-A 1-B 1-C 1-D
(a) Scenario 1
0.0
0.5
1.0
1.5
2.0
2.5
3.0
baseline DBSCAN K-means EDMC SCP
energ
yeff
icie
ncy
2-A 2-B 2-C 2-D
(b) Scenario 2
Fig. 9: Comparison on the energy efficiency of network.
service (in particular, scenario 2), the value of energy efficiencywill significantly increase. Although the DBSCAN, K-means,and EDMC schemes can deploy small cells to increase thenetwork throughput (referring to Fig. 7) but they also make BSsspend more energy on communications (referring to Fig. 8).Consequently, these schemes result in slightly higher energyefficiency than the baseline scheme, especially in scenario 1.By adaptively adding small cells to meet the traffic demands ofuser devices and also reduce energy consumption of macrocellBSs, our small-cell planning solution can have much largerenergy efficiency than all other schemes, especially in scenarios1-D, 2-C, and 2-D, where there are more user devices in theservice area. This experimental result demonstrates that ourproposed small-cell planning solution can better support greencommunications than the DBSCAN, K-means, and EDMCschemes.
6 CONCLUSION AND FUTURE WORK
LTE HetNet allows operators to flexibly and tactically addsmall-cell BSs to improve performance of an existing network.This paper thus proposes the small-cell planning problemwith the objective to increase the energy efficiency of an LTEHetNet subject to the deployment budget. An efficient solutionis developed by deploying both microcell and picocell BSsto satisfy the traffic demands of user devices while reducingenergy consumption and traffic loads of original macrocellBSs. We propose the K-means and NBSC clustering strategiesto determine the locations to place microcells and picocells,respectively. For each cell, we further check whether the BShas enough resource to serve its user devices and adjust thecell range accordingly by calculating a suitable value of trans-mitted power. Simulation results by MATLAB demonstratethat our proposed small-cell planning solution satisfies the
traffic demands of more user devices and also reduces energyconsumption of BSs, under the eight scenarios with differentmacrocell deployment and distributions of user devices. Con-sequently, it can significantly improve the HetNet’s energyefficiency and supports green communications.
We finally give some future work. First, our clusteringstrategies take into consideration the geographical locationsof user devices. In [45], a clustering approach to improvespectrum utilization for a cognitive radio network is proposed.It is interesting to apply such an idea to the small-cell plan-ning solution by addressing the issue of spectrum sharing.Second, as discussed in Section 4.6, we can adopt the eICICtechnique to deal with the inter-cell interference problem.How to efficiently integrate the small-cell planning solutionwith the interference management mechanism by eICIC (forexample, jointly determining the ABS ratio [46], [47] and celldeployment) deserves further investigation.
REFERENCES
[1] N. Weicker, G. Szabo, K. Weicker, and P. Widmayer, “Evolutionarymultiobjective optimization for base station transmitter placementwith frequency assignment,” IEEE Trans. Evolutionary Computation,vol. 7, no. 2, pp. 189–203, 2003.
[2] J. Kalvenes, J. Kennington, and E. Olinick, “Hierarchical cellularnetwork design with channel allocation,” European J. OperationalResearch, vol. 160, no. 1, pp. 3–18, 2005.
[3] J.J. Hamad-Ameen, “Cell planning in GSM mobile,” WSEAS Trans.Comm., vol. 7, no. 5, pp. 393–398, 2008.
[4] E. Amaldi, A. Capone, and F. Malucelli, “Planning UMTS base stationlocation: optimization models with power control and algorithms,”IEEE Trans. Wireless Comm., vol. 2, no. 5, pp. 939–952, 2003.
[5] J. Yang, M. Aydin, J. Zhang, and C. Maple, “UMTS base sationlocation planning: a mathematical model and heusirtic optimisationalgorithms,” IET Comm., vol. 1, no. 5, pp. 1007–1014, 2007.
[6] E. Amaldi and A. Capone, “Radio planning and coverage optimiza-tion of 3G cellular networks,” Wireless Networks, vol. 14, no. 4, pp.435–447, 2008.
[7] H. Luo, S. Ci, D. Wu, J. Wu, and H. Tang, “Quality-driven cross-layeroptimized video delivery over LTE,” IEEE Comm. Magazine, vol. 48,no. 2, pp. 102–109, 2010.
[8] Cisco Systems, “White paper: Cisco VNI forecast and methodology,2015–2020,” June 2016. [Online]. Available: http://www.cisco.com/
[9] A. Khandekar, N. Bhushan, J. Tingfang, and V. Vanghi, “LTE-advanced: heterogeneous networks,” Proc. European Wireless Conf.,2010, pp. 978–982.
[10] A. Damnjanovic, J. Montojo, Y. Wei, T. Ji, T. Luo, M. Vajapeyam, T.Yoo, O. Song, and D. Malladi, “A survey on 3GPP heterogeneousnetworks,” IEEE Wireless Comm., vol. 18, no. 3, pp. 10–21, 2011.
[11] C.H. Liu and K.L. Fong, “Fundamentals of the downlink greencoverage and energy efficiency in heterogeneous networks,” IEEE J.Selected Areas in Comm., vol. 34, no. 12, pp. 3271–3287, 2016.
[12] S. Wang, W. Zhao, and C. Wang, “Budgeted cell planning for cellularnetworks with small cells,” IEEE Trans. Vehicular Technology, vol. 64,no. 10, pp. 4797–4806, 2015.
[13] W. Zhao and S. Wang, “Traffic density-based RRH selection for powersaving in C-RAN,” IEEE J. Selected Areas in Comm., vol. 34, no. 12, pp.3157–3167, 2016.
[14] M.W. Arshad, A. Vastberg, and T. Edler, “Energy efficiency improve-ment through pico base stations for a green field operator,” Proc. IEEEWireless Comm. and Networking Conf., 2012, pp. 2197–2202.
[15] G. Araniti, J. Cosmas, A. Iera, A. Loiacono, A. Molinaro, and A.Orsino, “Power consumption model using green policies in heteroge-neous networks,” Proc. IEEE Int’l Symp. Broadband Multimedia Systemsand Broadcasting, 2014, pp. 1–5.
[16] Y.C. Wang and C.A. Chuang, “Efficient eNB deployment strategy forheterogeneous cells in 4G LTE systems,” Computer Networks, vol. 79,pp. 297–312, 2015.
[17] 3GPP, “LTE; Evolved Universal Terrestrial Radio Access (E-UTRA);Physical layer procedures,” ETSI TR 136 931 V13.0.0, 2016.
[18] 3GPP, “Universal Mobile Telecommunications System (UMTS); Spa-tial channel model for Multiple Input Multiple Output (MIMO)simulations,” ETSI TR 125 996 V13.0.0, 2016.
12 INTERNATIONAL JOURNAL OF COMMUNICATION SYSTEMS
[19] A. Simonsson, B. Hagerman, J. Chistoffersson, L. Klockar, C. Kout-simanis, and P. Cosimini, “LTE downlink inter-cell interference as-sessment in an existing GSM metropolitan deployment,” Proc. IEEEVehicular Technology Conf., 2010, pp. 1–5.
[20] S. Hurley, “Planning effective cellular mobile radio networks,” IEEETrans. Vehicular Technology, vol. 51, no. 2, pp. 243–253, 2002.
[21] H.P. Lin, R.T. Juang, D.B. Lin, C.Y. Ke, and Y. Wang, “Cell planningscheme for WCDMA systems using genetic algorithm and measuredbackground noise floor,” IEE Proc.–Comm., vol. 151, no. 6, pp. 595–600, 2004.
[22] M. St-Hilaire, S. Chamberland, and S. Pierre, “A tabu search heuristicfor the global planning of UMTS networks,” Proc. IEEE Int’l Conf.Wireless and Mobile Computing, Networking and Comm., 2006, pp. 148–151.
[23] T.S. Siadari and S.Y. Shin, “Geo-clustering algorithm for downlinkcellular network planning,” Proc. Int’l Conf. ICT Convergence, 2012,pp. 119–124.
[24] Y. Wu, D. Zhang, H. Jiang, and Y. Wu, “A novel spectrum arrange-ment scheme for femto cell deployment in LTE macro cells,” Proc.IEEE Int’l Symp. Personal, Indoor and Mobile Radio Comm., 2009, pp.6–11.
[25] P. Lin, J. Zhang, Y. Chen, and Q. Zhang, “Macro-femto heterogeneousnetwork deployment and management: from business models totechnical solutions,” IEEE Wireless Comm., vol. 18, no. 3, pp. 64–70,2011.
[26] E. Emelianova, S. Park, and S. Bahk, “Deployment algorithm forfemtocells in multi-tiered wireless cellular network,” Proc. Int’l Conf.ICT Convergence, 2012, pp. 131– 136.
[27] S.F. Yunas, A. Asp, J. Niemela, and M. Valkama, “Deployment strate-gies and performance analysis of macrocell and femtocell networksin suburban environment with modern buildings,” Proc. IEEE Conf.Local Computer Networks, 2014, pp. 643–651.
[28] S. Kaneko, T. Matsunaka, and Y. Kishi, “A cell-planning model forHetNet with CRE and TDM-ICIC in LTE-advanced,” Proc. IEEEVehicular Technology Conf., 2012, pp. 1–5.
[29] S. Wang, W. Zhao, and C. Wang, “Approximation algorithms forcellular networks planning with relay nodes,” Proc. IEEE WirelessComm. and Networking Conf., 2013, pp. 3230–3235.
[30] S.Y. Shin and I.F.M. Zain, “Cellular network planning for heteroge-neous network using geo-clustering algorithm,” Proc. Int’l Conf. ICTConvergence, 2013, pp. 448–449.
[31] X. Li, X. Zhang, and W. Wang, “An energy-efficient cell planningstrategy for heterogeneous network based on realistic traffic data,”Proc. Int’l Conf. Computing, Management and Telecomm., 2014, pp. 122–127.
[32] W. Zhao, S. Wang, C. Wang, and X. Wu, “Approximation algorithmsfor cell planning in heterogeneous networks,” IEEE Trans. VehicularTechnology, vol. 66, no. 2, pp. 1561–1572, 2017.
[33] W. Zhao, S. Wang, C. Wang, and X. Wu, “Cell planning for hetero-geneous networks: an approximation algorithm,” Proc. IEEE INFO-COM, 2014, pp. 1087–1095.
[34] S. Boyd and L. Vandenberghe, Convex Optimization. Cambridge: Cam-bridge University Press, 2004.
[35] C.E. Shannon, “A mathematical theory of communication,” Bell Sys-tem Technical J., vol. 27, pp. 379–423, 1948.
[36] A. Garcia-Armada, “SNR gap approximation for M-PSK-based bitloading,” IEEE Trans. Wireless Comm., vol. 5, no. 1, pp. 57–60, 2006.
[37] C. Mehlfuhrer, M. Wrulich, J.C. Ikuno, D. Bosanska, and M. Rupp,“Simulating the long term evolution physical layer,” Proc. EuropeanSignal Processing Conf., 2009, pp. 1471–1478.
[38] ETSI, “Evolved universal terrestrial radio access (E-UTRA); physicallayer procedures (release 14),” 3GPP TS 36.213 V14.1.0, 2016.
[39] M. Ester, H.P. Kriegel, J. Sander, and X. Xu, “A density-based algo-rithm for discovering clusters a density-based algorithm for discov-ering clusters in large spatial databases with noise,” Proc. Int’l Conf.Knowledge Discovery and Data Mining, 1996, pp. 226–231.
[40] A.S. Hamza, S.S. Khalifa, H.S. Hamza, and K. Elsayed, “A surveyon inter-cell interference coordination techniques in OFDMA-basedcellular networks,” IEEE Comm. Surveys & Tutorials, vol. 15, no. 4, pp.1642– 1670, 2013.
[41] S. Deb, P. Monogioudis, J. Miernik, and J.P. Seymour, “Algorithmsfor enhanced inter-cell interference coordination (eICIC) in LTE Het-Nets,” IEEE/ACM Trans. Networking, vol. 22, no. 1, pp. 137–150, 2014.
[42] M. Dottling, W. Mohr, and A. Osseiran, Radio Technologies and Conceptsfor IMT-Advanced. New York: Wiley, 2009.
[43] Y.C. Wang, C.C. Hu, and Y.C. Tseng, “Efficient deployment algo-rithms for ensuring coverage and connectivity of wireless sensornetworks,” Proc. IEEE Wireless Internet Conf., 2005, pp. 114–121.
[44] Y.C. Wang, Y.F. Chen, and Y.C. Tseng, “Using rotatable and direc-tional (R&D) sensors to achieve temporal coverage of objects and its
surveillance application,” IEEE Trans. Mobile Computing, vol. 11, no.8, pp. 1358–1371, 2012.
[45] J. Dai and S. Wang, “Clustering-based spectrum sharing strategy forcognitive radio networks,” IEEE J. Selected Areas in Comm., vol. 35, no.1, pp. 228–237, 2017.
[46] S. Vasudevan, R.N. Pupala, and K. Sivanesan, “Dynamic eICIC: aproactive strategy for improving spectral efficiencies of heteroge-neous LTE cellular networks by leveraging user mobility and trafficdynamics,” IEEE Trans. Wireless Comm., vol. 12, no. 10, pp. 4956–4969,2013.
[47] Y.C. Wang and S.T. Chen, “Delay-aware ABS adjustment to supportQoS for real-time traffic in LTE-A HetNet,” IEEE Wireless Comm.Letters, vol. 6, no. 5, pp. 590–593, 2017.