Embed Size (px)
Citation preview

United States Department of Agriculture
International Food Assistance ReportFiscal Year 2019
United States Department of Agriculture
Food for Progress ReportFiscal Year 2020

I. Introduction ...................................................................................................................................1
II. Eligible Commodities ..................................................................................................................3
Table 1: Eligible Bulk Commodities for Use in FY 2020 Food For Progress ...........................3Table 2: FY 2020 Food for Progress Awards for New Projects ...............................................4Table 3: FY 2020 Food for Progress Merit and Standing NOFO Awards ..............................4Table 4: FY 2020 Descriptions of New Food for Progress Projects .......................................5
III. FY 2020 Monetization Activity Summary ...................................................................................6
Table 5: FY 2020 Summary of Monetization Activity by Commodity .......................................6Table 6: FY 2020 Monetization Rates of Return by Country and by Sale ...............................6Figure 1: Sale Proceeds and Rate of Return by Country and Commodity FY 2020 ...............7 Factors Influencing the Rate of Return ...............................................................................8Table 7: Explanation of Return Rates Below 70 Percent ........................................................9 Other Costs ......................................................................................................................10Table 8: FY 2020 Cost of Bags ............................................................................................. 11Table 9: FY 2020 Other Shipping Costs ................................................................................ 11
Contents
AMSCRSCCC
CDSOCFRCFRCRSDNS
DRFAS
FFPrFFPFNS
FYHRSHRWIESC
KCCOMT
NCBA CLUSA NOFO
NSPOAPVOSBMSPS
USAIDUSC
USDA
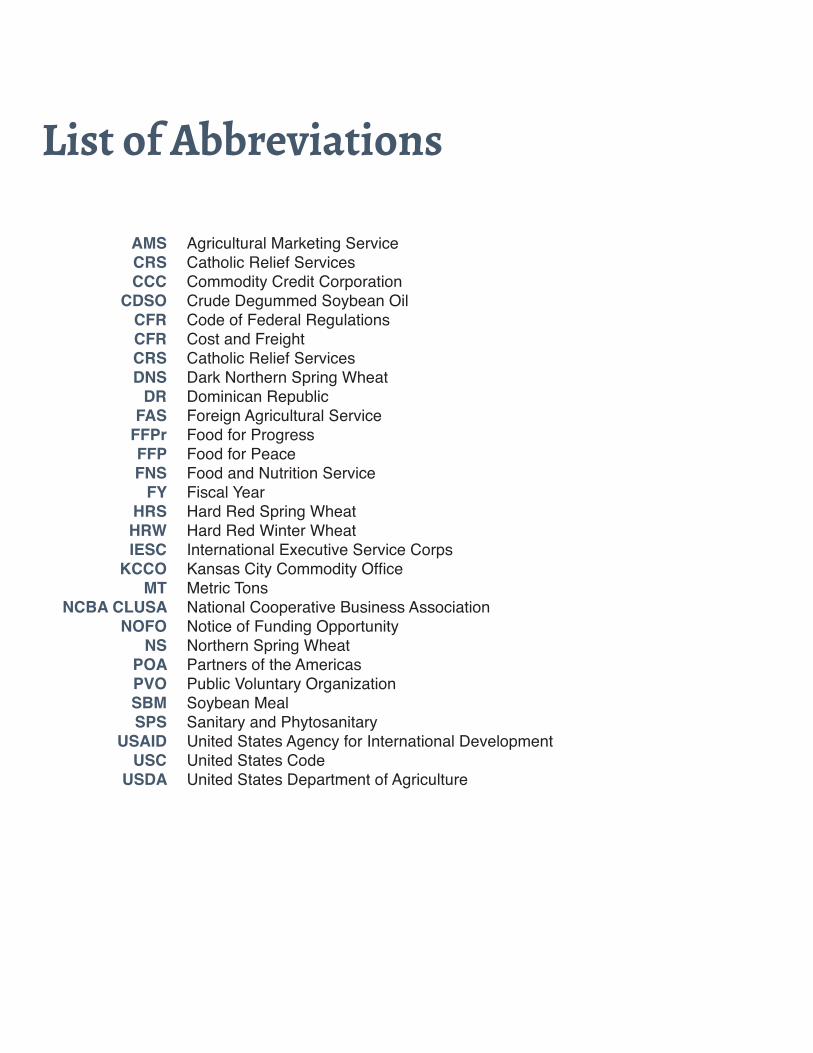
List of Abbreviations
Agricultural Marketing ServiceCatholic Relief ServicesCommodity Credit Corporation Crude Degummed Soybean OilCode of Federal RegulationsCost and FreightCatholic Relief ServicesDark Northern Spring WheatDominican RepublicForeign Agricultural ServiceFood for ProgressFood for PeaceFood and Nutrition ServiceFiscal YearHard Red Spring WheatHard Red Winter WheatInternational Executive Service CorpsKansas City Commodity OfficeMetric TonsNational Cooperative Business AssociationNotice of Funding OpportunityNorthern Spring WheatPartners of the AmericasPublic Voluntary OrganizationSoybean MealSanitary and PhytosanitaryUnited States Agency for International DevelopmentUnited States CodeUnited States Department of Agriculture

I. Introduction
The Food for Progress Program (FFPr) was authorized by the U.S. Congress in the Food Security Act of 1985. Most recently, the program was re-authorized through fiscal year 2023 in the Agriculture Improvement Act of 2018 (2018 Farm Bill)1. FFPr has two principal objectives: to improve agricultural productivity and to expand trade of agricultural products. FFPr projects have trained farmers in animal and plant health, improved farming methods, developed road and utility systems, established producer cooperatives, provided microcredit, and developed agricultural value chains.
To fulfill its mandate under the Food for Progress Act of 1985, the United States Department of Agriculture’s (USDA’s) Foreign Agricultural Service (FAS) enters into cooperative agreements with eligible organizations to implement field–based projects that aim to improve agricultural production and expand trade of agricultural products in developing countries. FAS published the FY 2020 Notice of Funding Opportunity (see https://www.grants.gov/web/grants/view-opportunity.html?oppId=327100 ) and proposed FFPr Program guidelines in accordance with 7 CFR part 1499. Projects are primarily funded through the sale of U.S. commodities within the foreign market where the project is implemented. Some examples of past projects include: training farmers in improved animal and plant production, establishing and building capacity of agricultural cooperatives, providing microfinance to farmers, and developing agricultural value chains. Program participants have included private voluntary organizations (PVOs), foreign governments, universities, and intergovernmental organizations.
Sales of the commodities are conducted through an open public invitation to bid tender. Once the sale of the commodities is awarded to a buyer in a recipient country, tenders soliciting bids for the commodity and shipping freight are issued through the Commodity Credit Corporation (CCC). USDA’s Agricultural Marketing Service (AMS), through its Kansas City Commodity Office, oversees the procurement process and bidding. The guidelines for these procedures are contained in AMS’ Master Solicitation for Commodity Procurements – International Food Assistance Program Purchases2.
FFPr released three Notices of Funding Opportunity (NOFO) in FY 2020. The primary program NOFO (USDA-FAS-10-606-0700-20-01) resulted in five new cooperative agreements for projects that will be implemented in Bangladesh, Colombia, Dominican Republic, Uganda, and West Africa (Cote d’Ivoire, Ghana, and Nigeria). The selected applicants will receive 241,900 metric tons (MT) of commodities, valued at $97.56 million, and $37.64 million to support ocean freight expenditures. The second NOFO, named the Standing Sup-plemental NOFO (USDA-FAS-0700-10606-S), provided existing agreement holders the opportunity to apply for additional funding if the project had previously experienced a no-fault shortfall in the budget due to lower than an-ticipated monetization proceeds. Projects in Bangladesh, Burkina Faso, Dominican Republic, Guatemala, Laos, and Sri Lanka received additional funding via the Standing Supplemental NOFO. The last category, the Merit NOFO (USDA-FAS-0700-10606-C), provided the opportunity for current agreement holders of projects that had completed monetization and had at least $400,000 or more in remaining freight funds in their budgets. Four Merit and six Standing Supplemental awards were made, with the merit awards given to projects in Benin, Dominican Republic, and Nicaragua. These awards include only additional commodity and commodity funds. The 10 awarded projects will receive a total of 60,910 MT of commodities valued at $31.50 million. Including the new FY 2020 projects, there are 39 active projects in 34 countries valued at more than $1 billion.
Food for Progress Report Fiscal Year 2020 1
1 H.R.2 – Agriculture Improvement Act of 2018, https://www.congress.gov/bill/115th-congress/house-bill/2/text 2 https://www.ams.usda.gov/sites/default/files/media/master_solicitation.pdf

During FY 2020, activities conducted by the 39 active projects reached more than 385,600 direct participants. As a result of FFPr’s work, more than 215,600 individuals applied improved agricultural management practices or technologies to approximately 436,500 hectares. Access to working capital and credit are other significant components in expanding participation in agricultural sectors in emerging markets. Greater access to financing contributes to increased production, expanded international trade, and ultimately, increased incomes. For FY 2020, FFPr projects included access to more than $49 million in finance for farmers and cooperatives by facilitating access to private market credit with agribusiness-management support and by directly providing loan facilities through project activities.
The 2018 Farm Bill, signed into law of December 20, 2018, included the following reporting requirements:
7 USC 1736o(j)(3)
(3) Report NotlaterthanApril1ofeachfiscalyear,theSecretaryshallsubmittotheCommitteeon AgricultureoftheHouseofRepresentativesandtheCommitteeonAgriculture,Nutrition,and ForestryoftheSenate- A.alistofprograms,countries,andeligiblecommodities,andthetotalamountoffunds fortransportationandadministrativecosts,approvedduringthepriorfiscalyearunder thissection; B.adescriptionoftheactualrateofreturnforeachcommoditymadeavailableunderthis sectionforthepreviousfiscalyearincluding- I.factorsthatinfluencedtherateofreturn;and II.withrespecttothecommodity,thecostsofbaggingorfurtherprocessing,ocean transportation,inlandtransportation,storagecosts,andanyotherinformationthat theSecretarydeterminestobenecessary;and C.foreachinstanceinwhichacommoditywasmadeavailableunderthissectionatarate ofreturnlessthan70percent,anexplanationfortherateofreturnrealized.
This document includes the reporting required under sections (A), (B) and (C) in the following tables, figures, project descriptions, and narrative on the rate of return.
Food for Progress Report Fiscal Year 2020 2

Food for Progress Report Fiscal Year 2020 3
II. Eligible Commodities
Commodities may vary from year to year, depending on availability of U.S. products and market conditions where the proposed monetization is to occur. All bulk grain commodities monetized under FFPr programs must meet the grading standards detailed in the USDA’s Official United States Standards for Grain . Table 1 provides the subset of available bulk commodities approved for use in FFPr for FY 2020.
Table 1: Eligible Bulk Commodities for Use in FY 2020 Food For Progress
Commodity Group Eligible Bulk Commodity
Wheat Wheat, Hard Red Winter (HRW)
Wheat, Northern Spring (NS)
Wheat, Soft Red Winter (SRW)
Wheat, Soft White (SWW)
Wheat, Dark Northern Spring (DNS)
Wheat, Hard Red Spring (HRS)
Wheat, Hard White (HWW)
Other Coarse Grains Corn, Yellow
Sorghum
Non-Coarse Grains Rice, Milled
Fats and Oils Soybean Oil, Crude Degummed (CDSO) or Fully Refined
Corn Oil, Crude or Refined
Vegetable Oil
Sunflower Seed Oil
Tallow
Yellow Grease
Non-Oil Soy Products Soybean Meal (SBM)
Soybeans, Whole, Yellow
Food for Progress Report Fiscal Year 2020 4
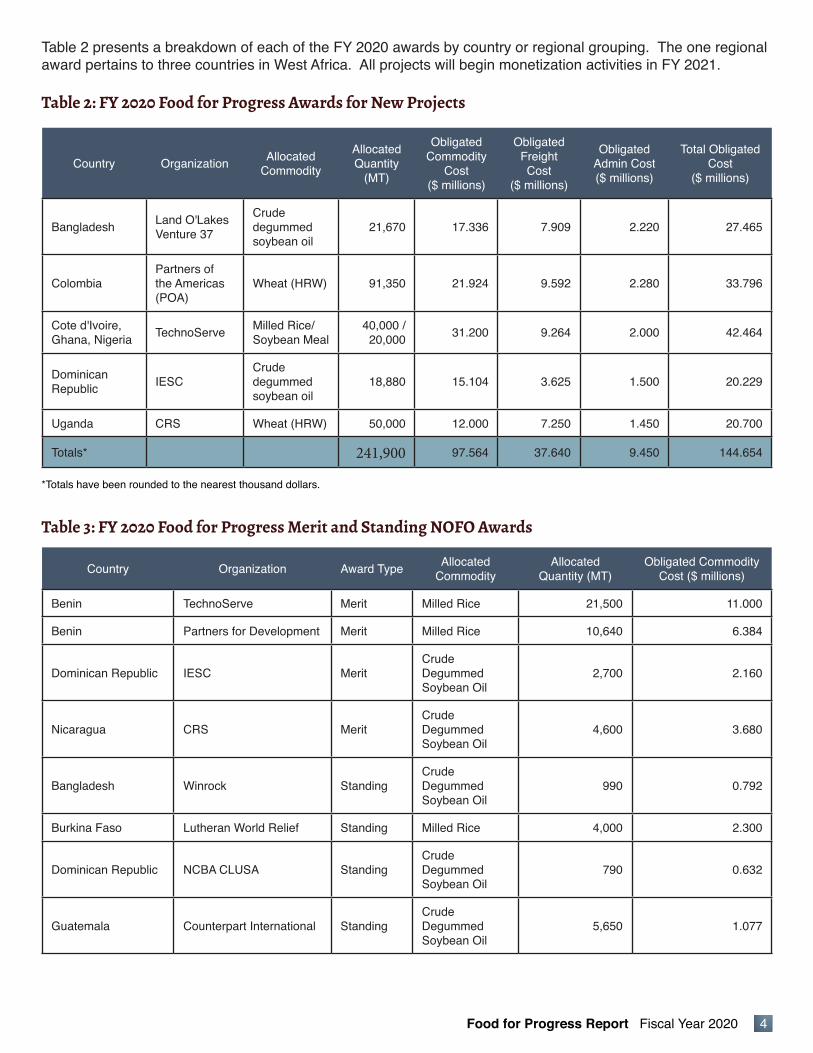
Table 2 presents a breakdown of each of the FY 2020 awards by country or regional grouping. The one regional award pertains to three countries in West Africa. All projects will begin monetization activities in FY 2021.
Table 2: FY 2020 Food for Progress Awards for New Projects
Table 3: FY 2020 Food for Progress Merit and Standing NOFO Awards
Country Organization Allocated Commodity
Allocated Quantity
(MT)
Obligated Commodity
Cost($ millions)
Obligated Freight Cost
($ millions)
Obligated Admin Cost($ millions)
Total Obligated Cost
($ millions)
Bangladesh Land O'Lakes Venture 37
Crude degummed soybean oil
21,670 17.336 7.909 2.220 27.465
ColombiaPartners of the Americas (POA)
Wheat (HRW) 91,350 21.924 9.592 2.280 33.796
Cote d'Ivoire, Ghana, Nigeria TechnoServe Milled Rice/
Soybean Meal40,000 / 20,000 31.200 9.264 2.000 42.464
Dominican Republic IESC
Crude degummed soybean oil
18,880 15.104 3.625 1.500 20.229
Uganda CRS Wheat (HRW) 50,000 12.000 7.250 1.450 20.700
Totals* 241,900 97.564 37.640 9.450 144.654 *Totals have been rounded to the nearest thousand dollars.
Country Organization Award Type Allocated Commodity
Allocated Quantity (MT)
Obligated Commodity Cost ($ millions)
Benin TechnoServe Merit Milled Rice 21,500 11.000
Benin Partners for Development Merit Milled Rice 10,640 6.384
Dominican Republic IESC MeritCrude Degummed Soybean Oil
2,700 2.160
Nicaragua CRS MeritCrude Degummed Soybean Oil
4,600 3.680
Bangladesh Winrock StandingCrude Degummed Soybean Oil
990 0.792
Burkina Faso Lutheran World Relief Standing Milled Rice 4,000 2.300
Dominican Republic NCBA CLUSA StandingCrude Degummed Soybean Oil
790 0.632
Guatemala Counterpart International StandingCrude Degummed Soybean Oil
5,650 1.077

Food for Progress Report Fiscal Year 2020 5
Table 3: Continued
Country Organization Award Type Allocated Commodity
Allocated Quantity (MT)
Obligated Commodity Cost ($ millions)
Laos Winrock StandingCrude Degummed Soybean Oil
1,840 1.472
Sri Lanka IESC Standing Wheat, (DNS) 8,200 2.000
Totals 60,910 31.497 *Totals have been rounded to the nearest thousand dollars.
Country Organization
Bangladesh Land O’Lakes Venture37
Project Description: This project is intended to expand regional and international trade of agricultural goods. The Ban-gladesh Trade Facilitation project will work to address systemic constraints to agricultural trade at Bangladeshi ports by simplifying and automating import and export processes; improving the capacity of government agencies, laboratories, and warehouses; and by fostering private and public investment, especially in cold storage.
Colombia Partners of the Americas
Project Description: This project is designed to improve the operational capacity of producers in the cacao and comple-mentary crop value chains. The increased capacity will be achieved through agricultural extension and outreach, devel-oping producer organizations, improving post-harvest practices and handling, and increasing access to financial services. The project will also work to facilitate innovation and employment opportunities for young, aspiring farmers.
Cote d'Ivoire, Ghana, Nigeria TechnoServe
Project Description: The goal of the project is to expand the trade of agricultural products by improving the competitive-ness of the West African cashew processing sector. Progress toward this goal will be supported by improving access to finance with the establishment of a $60 million commercial cashew industry investment fund. The project has set a target of expanding processing capacity to handle at least 50 percent of the raw cashew nuts grown in each of the project countries.
Dominican Republic IESC
Project Description: The project is designed to improve the local sanitary and phytosanitary (SPS) standards policy and practices of public and private institutions in the Dominican Republic. This project referred to as Trade Safe will focus on the adoption of science-based and technically sound SPS regulations and measures; supporting public and private institutions involved in SPS activities; and developing cold chain systems that meet international standards. Through this collaboration the project intends to increase agricultural productivity and expand trade in agricultural products.
Uganda CRS
Project Description: This project is designed to increase the agricultural productivity of the vanilla industry in Uganda. This will be accomplished by improving agricultural extension systems, building capacity among producer groups and cooperatives, providing farmers with greater access to quality inputs, and connecting producers to sources of finance. A secondary objective is to expand the trade for the country’s high-quality vanilla by improving post-handling processes, improving access to finance, and creating linkages between producers and national and international users.
Table 4: FY 2020 Descriptions of New Food for Progress Projects

Food for Progress Report Fiscal Year 2020 6
III. FY 2020 Monetization Activity Summary
In FY 2020, a total of 16 monetization sales of U.S. commodities, organized into 12 shipments, were made to nine countries. Eight of the 16 sales were consolidated into joint shipments, going to either the same country or region. The commodities included crude degummed soybean oil (CDSO), milled rice, soybean meal (SBM), and hard red winter (HRW) wheat. The combined tonnage of the 16 monetization sales totaled 218,740 MT. U.S. producers of these commodities received $96.09 million. Total shipping expenditures, including the occasional associated costs of bagging, stacking and discharge for certain commodities, amounted to $25.12 million. Of the $25.12 million in freight costs, $18.67 million was booked on U.S. flagged vessels while $6.45 million was booked on foreign-flagged vessels. Net proceeds from monetized sales amounted to $78.6 million, which result-ed in an average rate of return of 64.9 percent.
Table 5: FY 2020 Summary of Monetization Activity by Commodity
Commodity Quantity (MT)
Commodity Costs Freight Costs Total Costs Monetization
ProceedsRate of
Return (%)
Milled Rice 50,980 29,107,996 5,015,741 $34,123,737 20,377,230 59.7%
Soybean Meal 84,030 33,179,730 8,614,442 41,794,172 29,898,655 71.6%
Wheat, HRW 59,000 13,923,110 4,436,588 24,317,658 11,135,000 53.1%
Crude Degummed Soybean Oil 24,730 19,881,070 7,055,870 20,978,980 17,191,140 70.7%
Totals* 218,740 96,091,906 25,122,642 121,214,548 78,602,025 64.9% *Totals reflect rounding to nearest whole number.
Table 6: FY 2020 Monetization Rates of Return by Country and by Sale
CountryShipment Approval
DateCommodity Quantity
(MT)
Commodity Cost
($ Millions)
Freight Cost
($ Millions)
Total Cost to USDA
($ Millions)
Actual Proceeds
($ Millions)
Rate of Return
(%)
Georgia 10/1/2019 Wheat, HRW 27,000 $6.19 $1.30 $7.49 $5.00 67%
Guinea* 10/19/2019 Milled Rice 17,260 9.03 1.58 10.62 5.75 54%
Ghana 10/19/2019 Wheat, HRW 5,000 1.07 1.20 2.27 1.01 44%
Burkina Faso* 10/19/2019 Milled Rice 8,670 4.54 0.87 5.41 3.86 71%
Guatemala 12/18/2019 CDSO 5,000 4.07 0.87 4.94 3.28 66%
Peru 12/18/2019 CDSO 14,730 11.92 2.32 14.24 10.74 75%

Food for Progress Report Fiscal Year 2020 7
Table 6: Continued
CountryShipment Approval
DateCommodity Quantity
(MT)
Commodity Cost
($ Millions)
Freight Cost
($ Millions)
Total Cost to USDA
($ Millions)
Actual Proceeds
($ Millions)
Rate of Return
(%)
Indonesia* 7/7/2020 SBM 33,700 12.63 5.16 17.79 11.68 66%
Cambodia* 7/7/2020 SBM 6,450 2.42 .99 3.40 2.17 64%
Burkina Faso 7/15/2020 Milled Rice 25,050 15.54 2.56 18.09 10.77 60%
Dominican Republic* 8/10/2020 CDSO 860 0.67 0.21 0.88 .55 62%
Dominican Republic* 8/10/2020 CDSO 4,140 3.23 1.03 4.26 2.63 62%
Georgia 9/9/2020 Wheat, HRW 14,000 3.40 2.29 5.69 2.66 47%
Cambodia* 9/16/2020 SBM 6,450 2.63 .24 2.88 2.31 80%
Indonesia* 9/16/2020 SBM 27,430 11.20 1.04 12.24 10.04 82%
Georgia 9/22/2020 Wheat, HRW 13,000 3.26 2.27 5.53 2.47 45%
Ghana 9/29/2020 SBM 10,000 4.30 1.19 5.49 3.70 67%
Grand Total** 218,740 96.09 25.12 121.21 78.60 65%
Rate of Return average on commodity sales in FY 2019 65%
* These 8 sales were organized into joint shipments to economize on freight expenditures. The shipping pairs included the sales to Guinea/Burkina Faso, Cambodia/Indonesia, and the Dominican Republic.** Costs, proceeds, and their respective totals are rounded to the nearest $10,000. Column totals reflect the actual whole number value rounded to the nearest $10,000. Average rate of return is rounded to nearest 1%.
Figure 1: Sale Proceeds and Rate of Return by Country and Commodity FY 2020
Indonesia (SBM) - $10,039,380
Cambodia (SBM) - $2,309,100
Peru (CDSO) - $10,736,840
Burkina Faso (Rice, Milled Bulk) - $3,858,150
Ghana (SBM)
- $3,700,000
Georgia (Wheat, HRW) - $4,995,000
Guatemala (CDSO)
- $3,275,000
Indonesia (SBM)
- $11,677,050
Cambodia (SBM)
- $2,173,125
Dominican Republic (CDSO)
- $550,400
Dominican Republic (CDSO)
- $2,628,900
Burkina Faso (Rice, Milled Bulk)
- $10,771,500
Georgia (Wheat, HRW) - $2,660,000
Georgia (Wheat, HRW) - $2,470,000
Ghana (Wheat, HRW) - $1,010,000
Guinea (Rice, Milled Bulk)
- $5,747,580
0% 10% 20% 30% 40% 50% 60% 70% 80% 90% 100%
0% 10% 20% 30% 40% 50% 60% 70% 80% 90% 100%

Factors Influencing the Rate of Return
The 2018 Farm Bill requires an explanation for instances when commodities monetized under FFPr realize a rate of return less than 70 percent of the cost of the U.S. commodities sold abroad to obtain proceeds to fund FFPr programs. Obtaining a rate of return4 of 70 percent or more can be challenging when considering the commercial shipping and programmatic limitations, including requirements under the U.S. Cargo Preference Act.
In some cases, attaining a rate of return of 70 percent can be difficult in overseas markets where U.S. commodities face significant price competition from other foreign suppliers. For example, local buyers in West Africa import rice primarily from suppliers in Asia (India, Myanmar, Thailand, and Vietnam). The rice usually trades on global markets at prices between 15 to 20 percent lower than U.S.-origin rice. In the case of India, the country generally exports a lower quality rice containing a substantial quantity of broken grains. In contrast, the U.S. rice sold under the FFPr program is a higher grade, comprised mostly of whole rice grains, and thus, local buyers are gaining access to higher quality U.S. commodities. This past summer, prices for U.S. long grain and medium grain rice rose sharply as stocks fell to their lowest point in about 20 years, which pushed the commodity cost for U.S. rice well above the average prevailing market rates in West Africa at that time by as much as $200 per MT.
Additionally, the impact of the Phase I trade deal with China, which led to a resurgence in U.S. soybean exports and an uptick in wheat shipments in late summer and early fall, resulted in a significant run-up in commodity prices. As countries around the world implemented a variety of quarantine measures due to the novel coronavirus pandemic, prevailing market prices for soybeans, soybean meal (SBM), crude degummed soybean oil (CDSO), and various classes of wheat were forced down in the spring. Prices roared back in the second half of the summer and continued to climb throughout the fall; from the end of April 2020 through the end of September 2020, the average export prices for U.S. soybeans, SBM, and CDSO rose by 27 percent, 20 percent, and 34 percent, respectively5. Similarly, hard red winter (HRW) wheat and dark northern spring (DNS) wheat, the two classes of wheat used most often for monetization, increased by 15 percent and 16 percent, respectively. With respect to soybeans, SBM, HRW, and DNS, the bulk of the price increase occurred in August and September. For sales tenders that were approved in July or early August, the time between securing the letter of credit to protect payment risk, and the time of the purchase of the commodities and freight, magnified price volatility in the current trade environment.
Finally, ocean freight is a significant component of costs to the FFPr program. A driver of these costs is USDA’s requirements under the U.S. Cargo Preference Act, which mandates that at least 50 percent of all commodities sent to each country and via each vessel type be shipped on U.S.-flagged vessels. U.S.-flagged vessels generally have higher shipping rates than foreign-flagged carriers, which in turn can be a substantial share of the total cost and thus lower the rate of return. In 2020, higher costs associated with port closures, unloading delays, and crews affected by the Covid-19 pandemic translated into U.S.-flagged rates that were sub-stantially higher than commercial foreign-flagged vessel rates. As points of comparison, the freight rates for the joint shipments to Cambodia and Indonesia had a 16-percentage point difference in the rates of the return. The U.S.-flagged rate was more than 300 percent higher than the foreign-flagged rate for a shipment of similar tonnage. Similarly, the cost of the U.S.-flagged tanker for shipping CDSO to the Dominican Republic (DR) was about 2.5 times higher than shipments of a similar size going back to 2013 when the FFPr program started shipments to the DR. The rate was $249 per MT, about $65/MT more than the highest rate previously paid during the 2013 through 2019 period.
Sales under FFPr are subject to requirements of Section 212 of the International Development and Food Assistance Act of 1977, commonly referred to as the Bellmon amendment. This legal provision requires a market analysis be conducted to ensure that the distribution of the commodities in the recipient country will not result in a substantial disincentive to, or interference with, domestic production or marketing. A positive Bellmon determination, which also evaluates the availability of the storage and cargo handling capacity of the recipient
Food for Progress Report Fiscal Year 2020 8
4 Rate of return is the ratio of the proceeds the awardees generate through the sale of commodities divided by the cost the U.S. government incurs to procure and ship those commodities to recipient countries.5 International Grains Council. Market Data. Available at: https://www.igc.int/en/members-site/markets/igc_markets_prices.aspx

Food for Progress Report Fiscal Year 2020 9
country, is required before any monetization activity of food assistance shipments can occur. These two factors can limit the size and frequency of the shipments, which limits FFPr’s ability to capture cost efficiencies through greater economies of scale. In some cases, monetization activities must be extended throughout two or three fiscal years to accommodate the Bellmon determination and to generate the necessary proceeds to support an implementing partner’s project budget. By limiting the ability to maximize cargo space on ocean vessels, the increased number of shipments raises the operating costs to the program and lowers the average rate of return.
Table 7: Explanation of Return Rates Below 70 Percent
Sale Date Country Commodity Quantity (MT)
Commodity Cost
($ million)
Freight Cost
($ million)
Total Cost to USDA ($ million)
Actual Project
Proceeds ($ million)
Rate of Return
(%)
Oct 2019 Georgia Wheat, HRW 27,000 $6.19 $1.30 $7.49 $5.00 66.71%
Explanation: Tender sale $44/MT below purchase price. Competing with wheat from nearby Russia.
Oct 2019 Guinea Milled Rice 17,260 9.03 1.58 10.62 5.75 54.13%
Explanation: Rice only viable option for market. Sale price nearly $200/MT below cost. Low prices from Asia a challenge.
Oct 2019 Ghana Milled Rice 5,000 1.07 1.20 2.27 1.01 44.50%
Explanation: Shipped on U.S. Flag. Small load could not be consolidated. Freight rate exceed cost of commodity by $20/MT, more than doubling the total cost. Sale price was $202/MT vs. purchase cost of $214.95/MT.
Dec 2019 Guatemala CDSO 5,000 4.07 0.87 4.94 3.28 66.35%
Explanation: Average export price for U.S. CDSO rose by $80/MT from end of November until purchase. A renewal of biodiesel tax credit and new export taxes in Argentina led to sharp market rally. Capacity constraint on U.S.-flagged vessel resulted in 800/MT going on a foreign-flagged vessel that charged a low tonnage premium of more than $200/MT.
Jul 2020 Indonesia SBM 33,700 12.63 5.16 17.79 11.68 65.65%
Explanation: The July Indonesia and Cambodia sales shipped together. U.S.-flagged vessel rate more than three times the for-eign-flagged offer. Purchase of SBM was $20/MT higher than average U.S. export value at the time of the transaction.
Jul 2020 Cambodia SBM 6,450 2.44 0.99 3.40 2.17 64.21%
Explanation: The July Indonesia and Cambodia sales shipped together. U.S.-flagged vessel rate more than three times the for-eign-flagged offer. Purchase of SBM was $20/MT higher than average U.S. export value at the time of the transaction. Argentina and Brazil SBM exports are price competitive in Southeast Asia with U.S. SBM exports.
Jul 2020 Burkina Faso Milled Rice 25,050 15.54 2.56 18.09 10.77 59.53%
Explanation: U.S. rice stocks were out 20-year lows at the time of purchase. That made U.S. milled rice the most expensive in the world in 2020. Sales price was good for West Africa. Purchase price nearly $200/MT above sales price. U.S. rice faces stiff price competition from India, Myanmar, Thailand, and Vietnam in West Africa.
Aug 2020 Dominican Republic CDSO 860 0.67 0.21 0.88 0.55 62.23%
Explanation: This sale was consolidated with other Dominican Republic sale and shipped together. Crushing facility closures in the Texas and Louisiana Gulf resulted in multiple instances of no offers when prices were low. CDSO prices recovered sharply in July through early August by $100/MT. U.S.-flagged rate at $249.47/MT was nearly 2.5 times higher than the average U.S.-flagged rate for the Dominican Republic going back to 2013.
Aug 2020 Dominican Republic CDSO 4,140 3.23 1.03 4.26 2.63 61.74%
Explanation: This sale was consolidated with other Dominican Republic sale and shipped together. Crushing facility closures for maintenance in the Louisiana Gulf resulted in multiple instances of no offers when prices were low. CDSO prices recovered sharply in July through early August by $100/MT. U.S.-flagged rate at $249.47/MT was nearly 2.5 times higher than the average U.S.-flagged rate for the Dominican Republic going back to 2013.

Food for Progress Report Fiscal Year 2020 10
Table 7: Continued
Sale Date Country Commodity Quantity (MT)
Commodity Cost
($ million)
Freight Cost
($ million)
Total Cost to USDA ($ million)
Actual Project
Proceeds ($ million)
Rate of Return
(%)
Sep 2020 Georgia Wheat, HRW 14,000 3.40 2.29 5.69 2.66 46.77%
Explanation: Negotiated sales price of $190/MT accepted to meet the Government of Georgia’s request to the U.S. Government for food safety assistance. Prices of HRW rose by nearly 10 percent after contract signed. Sales price about $50/MT average export price for HRW worldwide. U.S.-flagged rate at $163.37 was 176 percent higher than foreign-flagged rate.
Sep 2020 Georgia Wheat, HRW 13,000 3.26 2.27 5.53 2.47 44.63%
Explanation: Negotiated sales price of $190/MT accepted to meet the Government of Georgia’s request to the U.S. Government for food safety assistance. Prices of HRW rose by nearly 10 percent after contract signed. Sales price about $50/MT average export price for HRW worldwide. U.S.-flagged rate at $163.37 was 176 percent higher than foreign-flagged rate.
Sep 2020 Ghana SBM 10,000 4.30 1.19 5.49 3.70 67.40%
Explanation: Purchase price of SBM was about $30/MT above prevailing average U.S. export price. The lack of bids for soybean meal from the Gulf resulted in the purchase coming from a supplier in the Pacific Northwest, which resulted in a freight of $119/MT compared to a rate of $75/MT from the Gulf.
Other Costs
Commodity sales under FFPr are structured as commercial transactions to private sector buyers. To limit internal transport, shipping, and handling costs to the U.S. government, FFPr sales tenders are solicited on a Cost and Freight (CFR) basis, meaning the title to the commodities passes to the buyers at the time the cargo passes the ship’s rail at the U.S. port of origin. Under the CFR terms, the buyer is responsible for arrangements and costs in connection with the receipt, clearance, inland delivery, and storage of the cargo. Risk of loss also passes to the buyer at this point in accordance with the CFR shipping terms. Thus, the buyer is responsible for insuring the donated commodities. Depending on the buyer’s or the receiving port’s capacity, commodity discharge terms are negotiated between the implementing partner(s) and buyer(s). On occasion, buyers request bagging and stacking as part of the freight discharge terms. The costs for the bags for these commodities are separate from ocean freight expenditures. The costs of bagging and stacking, however, as well as bulk discharge premiums, are included in total freight expenditures. Tables 8 and 9 summarize these respective costs.
The final remaining monetization expenses pertain to issuing phytosanitary certificates, carrying charges, and refunds for delivering commodities that do not meet quality specifications. Phytosanitary certificates, which are required for most exported agricultural food and feed products including bulk grains, amounted to $366 for FY 2020. Carrying charges involve expenses incurred by the commodity supplier due to an ocean carrier’s failure to meet the loading requirements stipulated in the freight tender offer. In these events, CCC submits an invoice to the ocean carrier for reimbursement of the charges. For FY 2020, CCC invoiced a total of $171,769.33 to ocean carriers for reimbursement. Finally, when commodities purchased do not meet required specifications, CCC invoices suppliers for a refund. For FY 2020, CCC received $19,581.43 in refunds for commodity purchases that resulted in quality discounts.

Table 8: Cost of Bags
Food for Progress Report Fiscal Year 2020 11
Country Material Description Quantity Cost
Burkina Faso BAGS, WOVEN POLYPROPYLENE- 50 KG 690,000 $315,618
Guinea BAGS, WOVEN POLYPROPYLENE- 50 KG 352,000 121,475
Total 1,042,000 437,093
Table 9: FY 2020 Other Shipping Costs6
6 This table includes instances of added shipping costs, outside of the ocean transportation segment, such as bagging, stacking, and bulk discharge costs. These discharge costs are for certain commodities in certain markets. Depending on the buyers, or the receiving port’s capacity, commodity discharge terms are negotiated between the implementing partner(s) and buyer(s). For the second shipment to Burkina Faso, there were two rates for bagging and stacking. The higher amount was for loading into a warehouse and the lower amount was for directly stacking onto the receiver’s trucks. A total of 13,398 MT was stacked on trucks in this latter case.
Recipient Country Commodity Total Tonnage (MT) Bagging & Stacking (per MT)
Total Additional Shipping Costs
Guinea Milled Rice 17,260 15 258,900
Burkina Faso Milled Rice 8,670 23 199,410
Burkina Faso Milled Rice 25,050 37 / 31 846,462
Total Other Shipping Costs 1,304,772