Embed Size (px)
Citation preview
SAHEL 2012: CLUSTER STRATEGIC INDICATORS
FOOD ASSISTANCE
Burkina Faso, Chad, Mali, Mauritania, Niger, Northern Cameroon,
Senegal, The Gambia
PERIOD: JULY 2012
2
WFP Sahel response
WFP provided food and nutrition assistance to more than 6 million in July as the peak of the lean season began. 2.9 million people across all affected countries were assisted through targeted food distributions, including 185,000 Malian refugees and internally displaced people. In Burkina Faso, Mauritania, Niger and Senegal, assistance was provided to 1.5 million people through cash and vouchers. 65,000 people were reached in Chad and Mali through food-for-work activities. In July, 15,000 people were assisted in Senegal through the re-stocking of community managed village cereal banks. The same activity was postponed in Mauritania in anticipation of the arrival of required food stocks. In July, WFP assisted close to 1.5 million children and women through nutrition interventions. This includes over 1 million children aged 6-23 months and pregnant and nursing mothers through blanket supplementary feeding activities in Burkina Faso, Chad, Mali, Niger and The Gambia. Under targeted supplementary programmes, 500,000 children aged 6-59 months and pregnant and nursing mothers were assisted in Burkina Faso, Chad, Mauritania, Mali and Niger.
Food security:
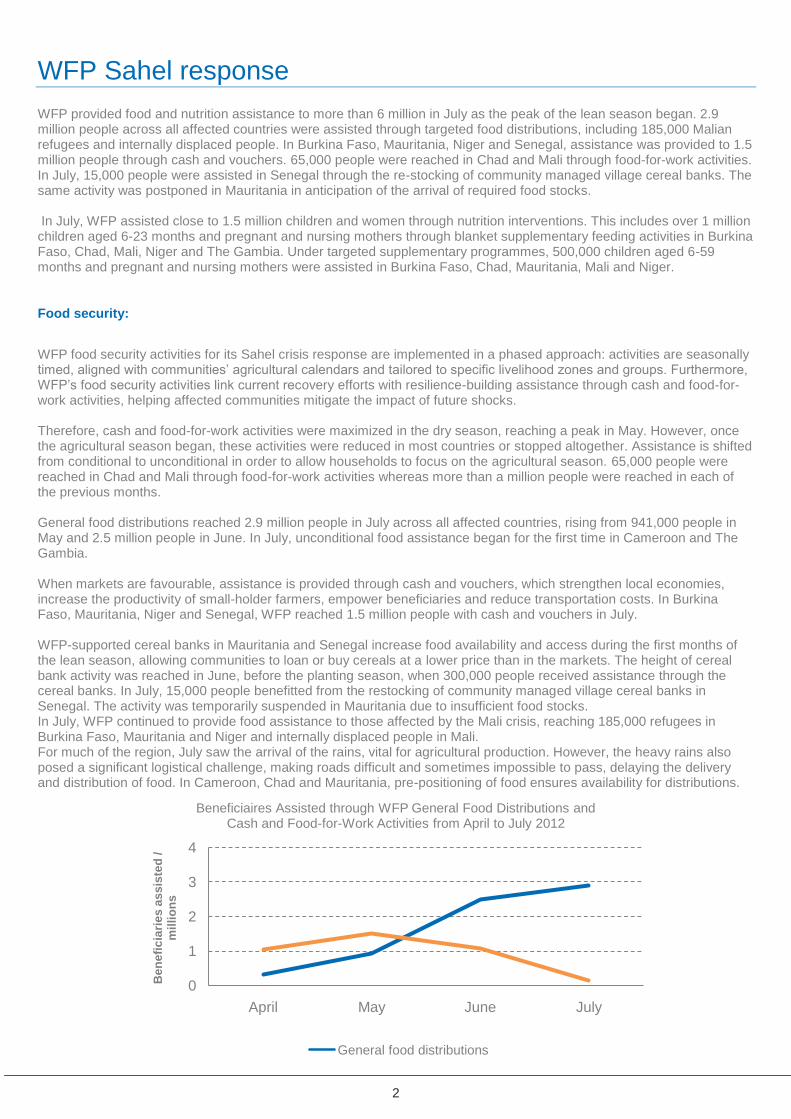
WFP food security activities for its Sahel crisis response are implemented in a phased approach: activities are seasonally timed, aligned with communities‟ agricultural calendars and tailored to specific livelihood zones and groups. Furthermore, WFP‟s food security activities link current recovery efforts with resilience-building assistance through cash and food-for-work activities, helping affected communities mitigate the impact of future shocks. Therefore, cash and food-for-work activities were maximized in the dry season, reaching a peak in May. However, once the agricultural season began, these activities were reduced in most countries or stopped altogether. Assistance is shifted from conditional to unconditional in order to allow households to focus on the agricultural season. 65,000 people were reached in Chad and Mali through food-for-work activities whereas more than a million people were reached in each of the previous months. General food distributions reached 2.9 million people in July across all affected countries, rising from 941,000 people in May and 2.5 million people in June. In July, unconditional food assistance began for the first time in Cameroon and The Gambia. When markets are favourable, assistance is provided through cash and vouchers, which strengthen local economies, increase the productivity of small-holder farmers, empower beneficiaries and reduce transportation costs. In Burkina Faso, Mauritania, Niger and Senegal, WFP reached 1.5 million people with cash and vouchers in July. WFP-supported cereal banks in Mauritania and Senegal increase food availability and access during the first months of the lean season, allowing communities to loan or buy cereals at a lower price than in the markets. The height of cereal bank activity was reached in June, before the planting season, when 300,000 people received assistance through the cereal banks. In July, 15,000 people benefitted from the restocking of community managed village cereal banks in Senegal. The activity was temporarily suspended in Mauritania due to insufficient food stocks. In July, WFP continued to provide food assistance to those affected by the Mali crisis, reaching 185,000 refugees in Burkina Faso, Mauritania and Niger and internally displaced people in Mali. For much of the region, July saw the arrival of the rains, vital for agricultural production. However, the heavy rains also posed a significant logistical challenge, making roads difficult and sometimes impossible to pass, delaying the delivery and distribution of food. In Cameroon, Chad and Mauritania, pre-positioning of food ensures availability for distributions.
0
1
2
3
4
April May June July
Ben
efi
cia
rie
s a
ss
iste
d /
mil
lio
ns
Beneficiaires Assisted through WFP General Food Distributions and Cash and Food-for-Work Activities from April to July 2012
General food distributions
3
Nutrition:
In response to this year‟s Sahel crisis, WFP is implementing prevention and treatment activities that take into account seasonal specificities, as well as the needs of the most vulnerable groups during different times of the year, based on continuous assessments and monitoring.
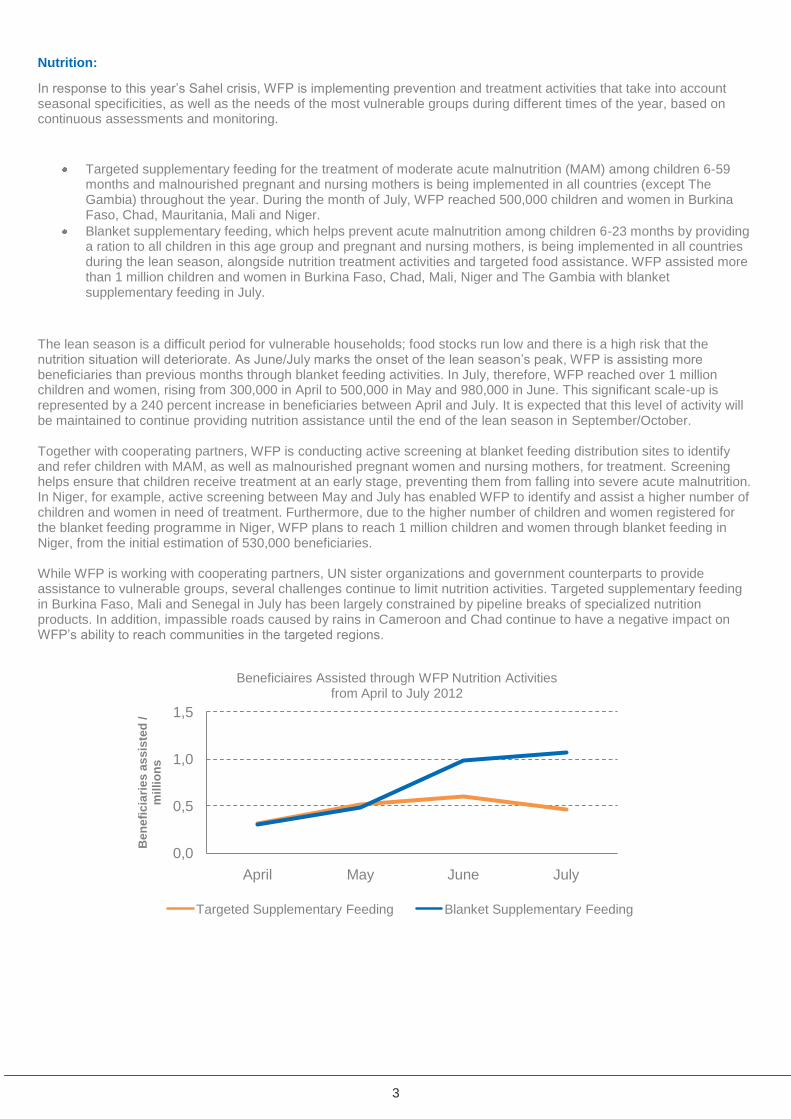
Targeted supplementary feeding for the treatment of moderate acute malnutrition (MAM) among children 6-59 months and malnourished pregnant and nursing mothers is being implemented in all countries (except The Gambia) throughout the year. During the month of July, WFP reached 500,000 children and women in Burkina Faso, Chad, Mauritania, Mali and Niger.
Blanket supplementary feeding, which helps prevent acute malnutrition among children 6-23 months by providing a ration to all children in this age group and pregnant and nursing mothers, is being implemented in all countries during the lean season, alongside nutrition treatment activities and targeted food assistance. WFP assisted more than 1 million children and women in Burkina Faso, Chad, Mali, Niger and The Gambia with blanket supplementary feeding in July.
The lean season is a difficult period for vulnerable households; food stocks run low and there is a high risk that the nutrition situation will deteriorate. As June/July marks the onset of the lean season‟s peak, WFP is assisting more beneficiaries than previous months through blanket feeding activities. In July, therefore, WFP reached over 1 million children and women, rising from 300,000 in April to 500,000 in May and 980,000 in June. This significant scale-up is represented by a 240 percent increase in beneficiaries between April and July. It is expected that this level of activity will be maintained to continue providing nutrition assistance until the end of the lean season in September/October. Together with cooperating partners, WFP is conducting active screening at blanket feeding distribution sites to identify and refer children with MAM, as well as malnourished pregnant women and nursing mothers, for treatment. Screening helps ensure that children receive treatment at an early stage, preventing them from falling into severe acute malnutrition. In Niger, for example, active screening between May and July has enabled WFP to identify and assist a higher number of children and women in need of treatment. Furthermore, due to the higher number of children and women registered for the blanket feeding programme in Niger, WFP plans to reach 1 million children and women through blanket feeding in Niger, from the initial estimation of 530,000 beneficiaries. While WFP is working with cooperating partners, UN sister organizations and government counterparts to provide assistance to vulnerable groups, several challenges continue to limit nutrition activities. Targeted supplementary feeding in Burkina Faso, Mali and Senegal in July has been largely constrained by pipeline breaks of specialized nutrition products. In addition, impassible roads caused by rains in Cameroon and Chad continue to have a negative impact on WFP‟s ability to reach communities in the targeted regions.
0,0
0,5
1,0
1,5
April May June July
Ben
efi
cia
rie
s a
ss
iste
d /
mil
lio
ns
Beneficiaires Assisted through WFP Nutrition Activities from April to July 2012
Targeted Supplementary Feeding Blanket Supplementary Feeding

4
All Affected Countries June 2012
Unconditional transfers (Cash/Voucher based 1 945 000 1 480 901 76%
Unconditional transfers (food based) 4 237 500 2 864 091 68%
Conditional transfers Cash / Voucher based - - -
Conditional transfers (Food based) 514 000 80 211 16%
Target Assisted
% Assisted
vs Targeted
FOOD ASSISTANCE
Affected or at Risk Assisted by cluster
Targeted by cluster Not Assisted
Targets for Food assistance are monthly
BURKINA FASO July 2012
Unconditional transfers (Cash/Voucher based 555 000 277 840 50%
Unconditional transfers (food based) 690 000 88 986 13%
Conditional transfers Cash / Voucher based - - -
Conditional transfers (Food based) - - -
Foot Note
Unconditional transfers (food based): Heavy rains posed a logistical challenge to the delivery of food. This figure includes assistance for 65,280 Malian
refugees.
Unconditional transfers (Cash/Voucher based: Slow beneficiary identification process hampered distributions.
Target Assisted
% Assisted
vs Targeted
FOOD ASSISTANCE
Affected or at Risk Assisted by cluster
Targeted by cluster Not Assisted
CHAD July 2012
Unconditional transfers (Cash/Voucher based - - -
Unconditional transfers (food based) 425 000 351 906 83%
Conditional transfers Cash / Voucher based - - -
Conditional transfers (Food based) 70 000 49 965 71%
Foot Note
Unconditional transfers (food based): Late arrival of food into the country partly due to heavy rains which made roads impassable
Target Assisted
% Assisted
vs Targeted
FOOD ASSISTANCE
Affected or at Risk Assisted by cluster
Targeted by cluster Not Assisted
5
MALI July 2012
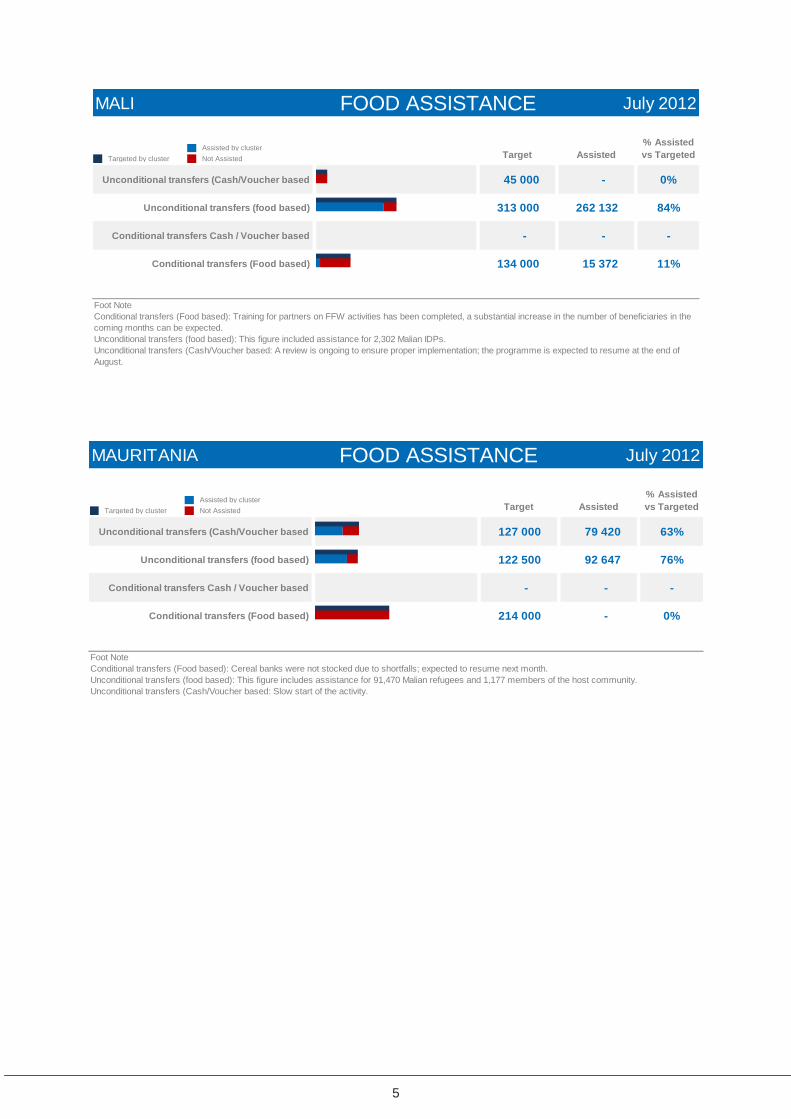
Unconditional transfers (Cash/Voucher based 45 000 - 0%
Unconditional transfers (food based) 313 000 262 132 84%
Conditional transfers Cash / Voucher based - - -
Conditional transfers (Food based) 134 000 15 372 11%
Foot Note
Conditional transfers (Food based): Training for partners on FFW activities has been completed, a substantial increase in the number of beneficiaries in the
coming months can be expected.
Unconditional transfers (food based): This figure included assistance for 2,302 Malian IDPs.
Unconditional transfers (Cash/Voucher based: A review is ongoing to ensure proper implementation; the programme is expected to resume at the end of
August.
Target Assisted
% Assisted
vs Targeted
FOOD ASSISTANCE
Affected or at Risk Assisted by cluster
Targeted by cluster Not Assisted
MAURITANIA July 2012
Unconditional transfers (Cash/Voucher based 127 000 79 420 63%
Unconditional transfers (food based) 122 500 92 647 76%
Conditional transfers Cash / Voucher based - - -
Conditional transfers (Food based) 214 000 - 0%
Foot Note
Conditional transfers (Food based): Cereal banks were not stocked due to shortfalls; expected to resume next month.
Unconditional transfers (food based): This figure includes assistance for 91,470 Malian refugees and 1,177 members of the host community.
Unconditional transfers (Cash/Voucher based: Slow start of the activity.
Target Assisted
% Assisted
vs Targeted
FOOD ASSISTANCE
Affected or at Risk Assisted by cluster
Targeted by cluster Not Assisted
6
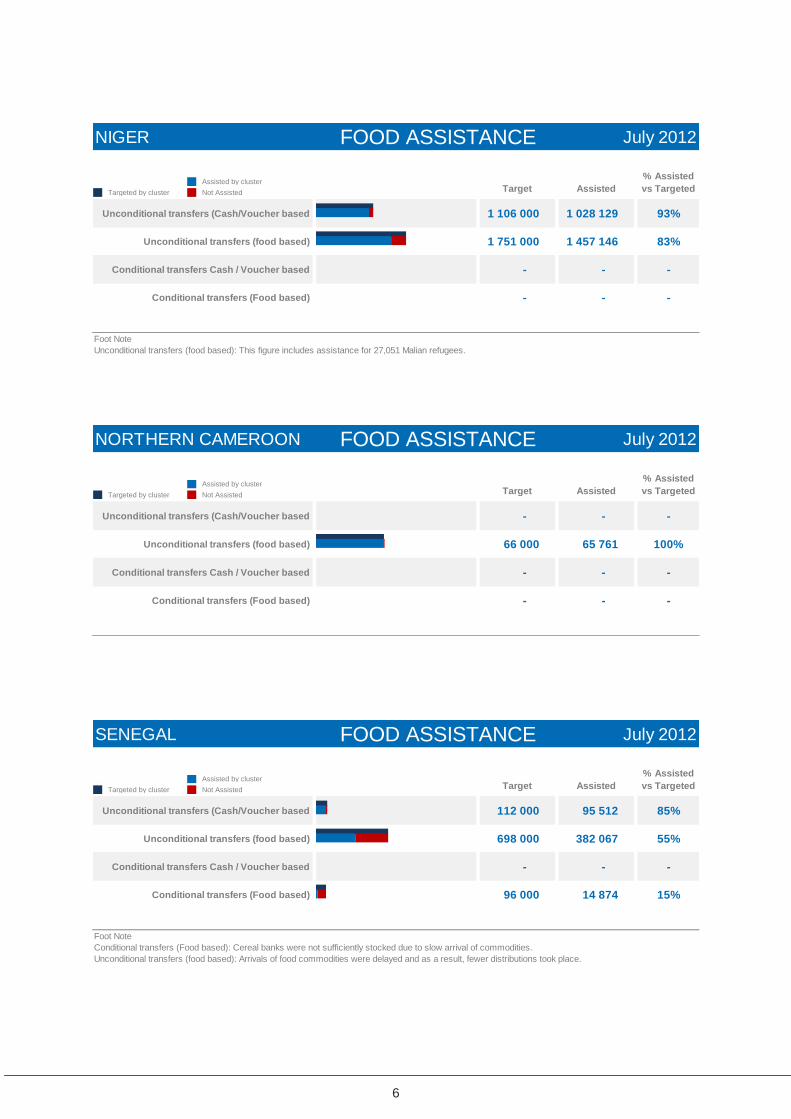
NIGER July 2012
Unconditional transfers (Cash/Voucher based 1 106 000 1 028 129 93%
Unconditional transfers (food based) 1 751 000 1 457 146 83%
Conditional transfers Cash / Voucher based - - -
Conditional transfers (Food based) - - -
Foot Note
Unconditional transfers (food based): This figure includes assistance for 27,051 Malian refugees.
Target Assisted
% Assisted
vs Targeted
FOOD ASSISTANCE
Affected or at Risk Assisted by cluster
Targeted by cluster Not Assisted
NORTHERN CAMEROON July 2012
Unconditional transfers (Cash/Voucher based - - -
Unconditional transfers (food based) 66 000 65 761 100%
Conditional transfers Cash / Voucher based - - -
Conditional transfers (Food based) - - -
Target Assisted
% Assisted
vs Targeted
FOOD ASSISTANCE
Affected or at Risk Assisted by cluster
Targeted by cluster Not Assisted
SENEGAL July 2012
Unconditional transfers (Cash/Voucher based 112 000 95 512 85%
Unconditional transfers (food based) 698 000 382 067 55%
Conditional transfers Cash / Voucher based - - -
Conditional transfers (Food based) 96 000 14 874 15%
Foot Note
Conditional transfers (Food based): Cereal banks were not sufficiently stocked due to slow arrival of commodities.
Unconditional transfers (food based): Arrivals of food commodities were delayed and as a result, fewer distributions took place.
Target Assisted
% Assisted
vs Targeted
FOOD ASSISTANCE
Affected or at Risk Assisted by cluster
Targeted by cluster Not Assisted

7
THE GAMBIA July 2012
Unconditional transfers (Cash/Voucher based - - -
Unconditional transfers (food based) 172 000 163 446 95%
Conditional transfers Cash / Voucher based - - -
Conditional transfers (Food based) - - -
Target Assisted
% Assisted
vs Targeted
FOOD ASSISTANCE
Affected or at Risk Assisted by cluster
Targeted by cluster Not Assisted
8
SAHEL 2012: CLUSTER STRATEGIC INDICATORS
NUTRITION
Burkina Faso, Chad, Mali, Mauritania, Niger, North of Cameroon,
North of Nigeria, Senegal, The Gambia
PERIOD: JANUARY – July 2012
9
Nutrition
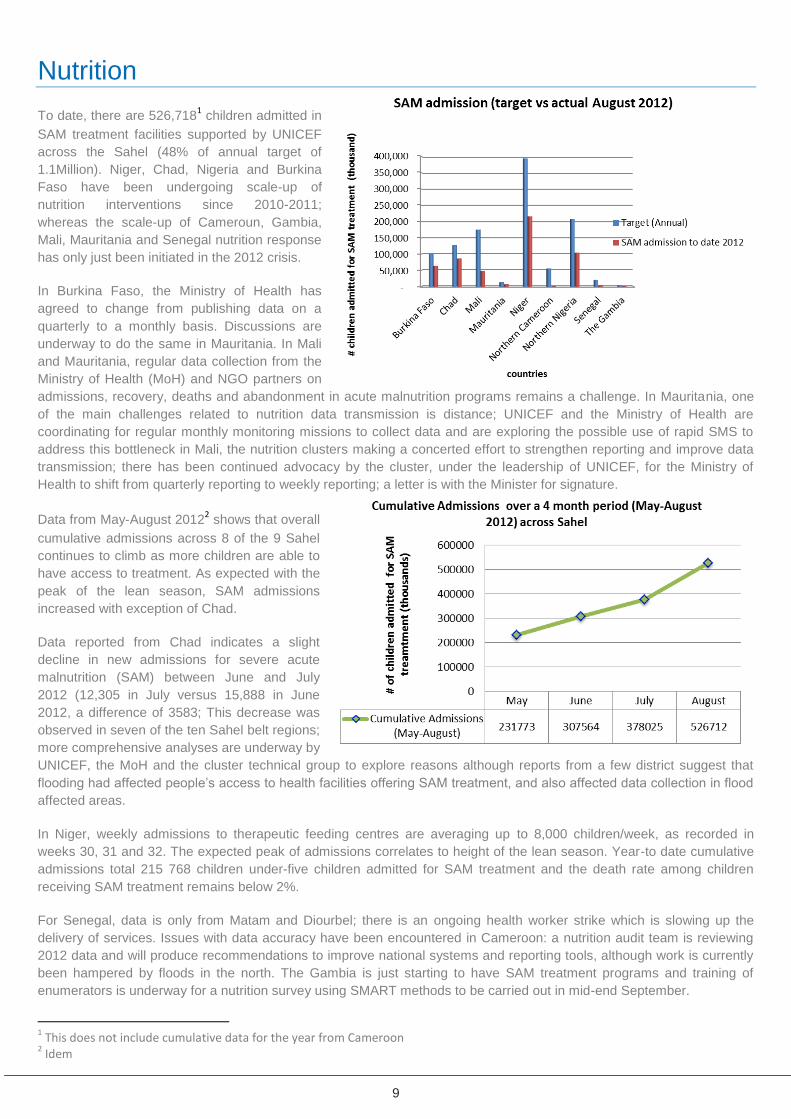
To date, there are 526,7181 children admitted in
SAM treatment facilities supported by UNICEF
across the Sahel (48% of annual target of
1.1Million). Niger, Chad, Nigeria and Burkina
Faso have been undergoing scale-up of
nutrition interventions since 2010-2011;
whereas the scale-up of Cameroun, Gambia,
Mali, Mauritania and Senegal nutrition response
has only just been initiated in the 2012 crisis.
In Burkina Faso, the Ministry of Health has
agreed to change from publishing data on a
quarterly to a monthly basis. Discussions are
underway to do the same in Mauritania. In Mali
and Mauritania, regular data collection from the
Ministry of Health (MoH) and NGO partners on
admissions, recovery, deaths and abandonment in acute malnutrition programs remains a challenge. In Mauritania, one
of the main challenges related to nutrition data transmission is distance; UNICEF and the Ministry of Health are
coordinating for regular monthly monitoring missions to collect data and are exploring the possible use of rapid SMS to
address this bottleneck in Mali, the nutrition clusters making a concerted effort to strengthen reporting and improve data
transmission; there has been continued advocacy by the cluster, under the leadership of UNICEF, for the Ministry of
Health to shift from quarterly reporting to weekly reporting; a letter is with the Minister for signature.
Data from May-August 20122 shows that overall
cumulative admissions across 8 of the 9 Sahel
continues to climb as more children are able to
have access to treatment. As expected with the
peak of the lean season, SAM admissions
increased with exception of Chad.
Data reported from Chad indicates a slight
decline in new admissions for severe acute
malnutrition (SAM) between June and July
2012 (12,305 in July versus 15,888 in June
2012, a difference of 3583; This decrease was
observed in seven of the ten Sahel belt regions;
more comprehensive analyses are underway by
UNICEF, the MoH and the cluster technical group to explore reasons although reports from a few district suggest that
flooding had affected people‟s access to health facilities offering SAM treatment, and also affected data collection in flood
affected areas.
In Niger, weekly admissions to therapeutic feeding centres are averaging up to 8,000 children/week, as recorded in
weeks 30, 31 and 32. The expected peak of admissions correlates to height of the lean season. Year-to date cumulative
admissions total 215 768 children under-five children admitted for SAM treatment and the death rate among children
receiving SAM treatment remains below 2%.
For Senegal, data is only from Matam and Diourbel; there is an ongoing health worker strike which is slowing up the
delivery of services. Issues with data accuracy have been encountered in Cameroon: a nutrition audit team is reviewing
2012 data and will produce recommendations to improve national systems and reporting tools, although work is currently
been hampered by floods in the north. The Gambia is just starting to have SAM treatment programs and training of
enumerators is underway for a nutrition survey using SMART methods to be carried out in mid-end September.
1 This does not include cumulative data for the year from Cameroon
2 Idem
10
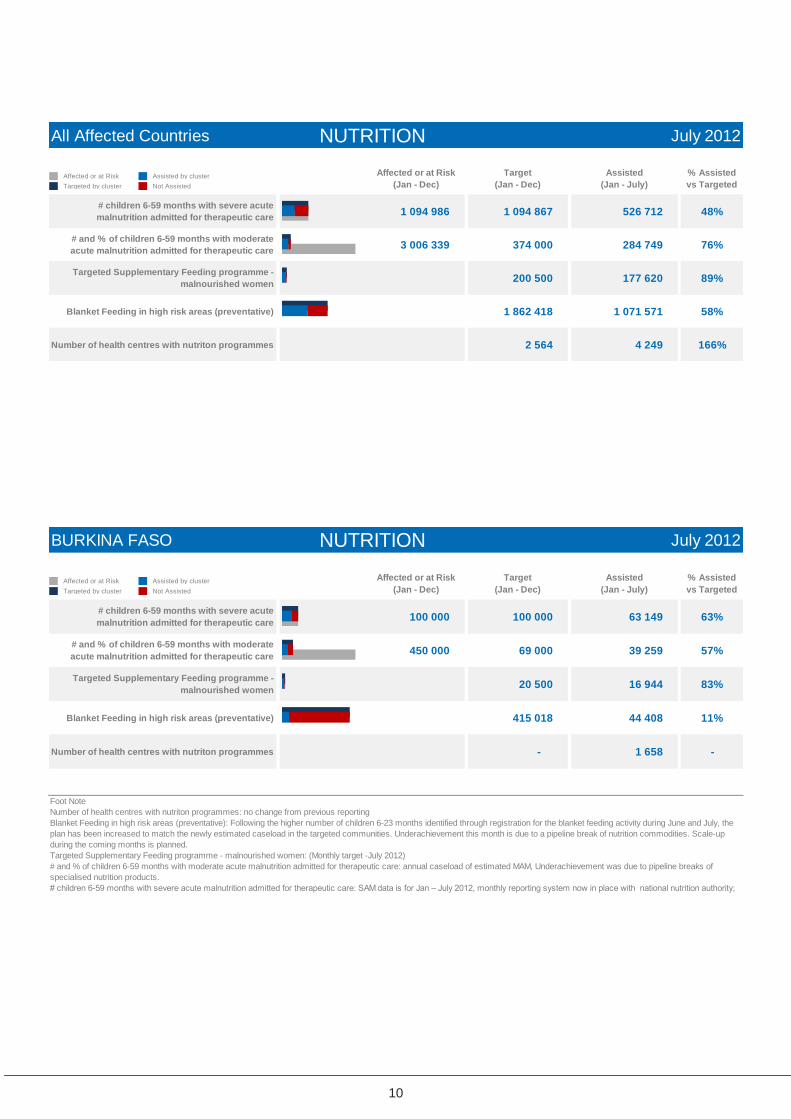
All Affected Countries July 2012
# children 6-59 months with severe acute
malnutrition admitted for therapeutic care1 094 986 1 094 867 526 712 48%
# and % of children 6-59 months with moderate
acute malnutrition admitted for therapeutic care3 006 339 374 000 284 749 76%
Targeted Supplementary Feeding programme -
malnourished women200 500 177 620 89%
Blanket Feeding in high risk areas (preventative) 1 862 418 1 071 571 58%
Number of health centres with nutriton programmes 2 564 4 249 166%
% Assisted
vs Targeted
Affected or at Risk
(Jan - Dec)
Target
(Jan - Dec)
Assisted
(Jan - July)
NUTRITION
Affected or at Risk Assisted by cluster
Targeted by cluster Not Assisted
BURKINA FASO July 2012
# children 6-59 months with severe acute
malnutrition admitted for therapeutic care100 000 100 000 63 149 63%
# and % of children 6-59 months with moderate
acute malnutrition admitted for therapeutic care450 000 69 000 39 259 57%
Targeted Supplementary Feeding programme -
malnourished women20 500 16 944 83%
Blanket Feeding in high risk areas (preventative) 415 018 44 408 11%
Number of health centres with nutriton programmes - 1 658 -
Foot Note
Number of health centres with nutriton programmes: no change from previous reporting
Blanket Feeding in high risk areas (preventative): Following the higher number of children 6-23 months identified through registration for the blanket feeding activity during June and July, the
plan has been increased to match the newly estimated caseload in the targeted communities. Underachievement this month is due to a pipeline break of nutrition commodities. Scale-up
during the coming months is planned.
Targeted Supplementary Feeding programme - malnourished women: (Monthly target -July 2012)
# and % of children 6-59 months with moderate acute malnutrition admitted for therapeutic care: annual caseload of estimated MAM, Underachievement was due to pipeline breaks of
specialised nutrition products.
# children 6-59 months with severe acute malnutrition admitted for therapeutic care: SAM data is for Jan – July 2012, monthly reporting system now in place with national nutrition authority;
% Assisted
vs Targeted
Affected or at Risk
(Jan - Dec)
Target
(Jan - Dec)
Assisted
(Jan - July)
NUTRITION
Affected or at Risk Assisted by cluster
Targeted by cluster Not Assisted
11
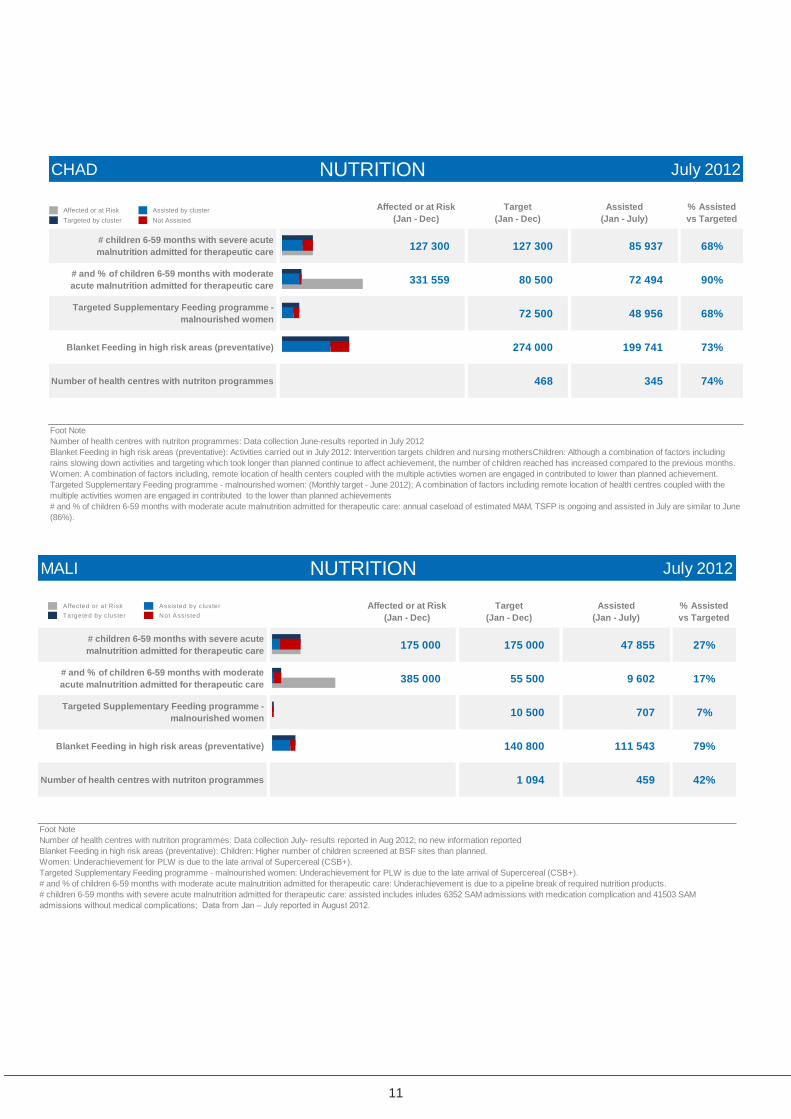
CHAD July 2012
# children 6-59 months with severe acute
malnutrition admitted for therapeutic care127 300 127 300 85 937 68%
# and % of children 6-59 months with moderate
acute malnutrition admitted for therapeutic care331 559 80 500 72 494 90%
Targeted Supplementary Feeding programme -
malnourished women72 500 48 956 68%
Blanket Feeding in high risk areas (preventative) 274 000 199 741 73%
Number of health centres with nutriton programmes 468 345 74%
Foot Note
Number of health centres with nutriton programmes: Data collection June-results reported in July 2012
Blanket Feeding in high risk areas (preventative): Activities carried out in July 2012: Intervention targets children and nursing mothersChildren: Although a combination of factors including
rains slowing down activities and targeting which took longer than planned continue to affect achievement, the number of children reached has increased compared to the previous months.
Women: A combination of factors including, remote location of health centers coupled with the multiple activties women are engaged in contributed to lower than planned achievement.
Targeted Supplementary Feeding programme - malnourished women: (Monthly target - June 2012); A combination of factors including remote location of health centres coupled wiith the
multiple activities women are engaged in contributed to the lower than planned achievements
# and % of children 6-59 months with moderate acute malnutrition admitted for therapeutic care: annual caseload of estimated MAM, TSFP is ongoing and assisted in July are similar to June
(86%).
% Assisted
vs Targeted
Affected or at Risk
(Jan - Dec)
Target
(Jan - Dec)
Assisted
(Jan - July)
NUTRITION
Affected or at Risk Assisted by cluster
Targeted by cluster Not Assisted
MALI July 2012
# children 6-59 months with severe acute
malnutrition admitted for therapeutic care175 000 175 000 47 855 27%
# and % of children 6-59 months with moderate
acute malnutrition admitted for therapeutic care385 000 55 500 9 602 17%
Targeted Supplementary Feeding programme -
malnourished women10 500 707 7%
Blanket Feeding in high risk areas (preventative) 140 800 111 543 79%
Number of health centres with nutriton programmes 1 094 459 42%
Foot Note
Number of health centres with nutriton programmes: Data collection July- results reported in Aug 2012; no new information reported
Blanket Feeding in high risk areas (preventative): Children: Higher number of children screened at BSF sites than planned.
Women: Underachievement for PLW is due to the late arrival of Supercereal (CSB+).
Targeted Supplementary Feeding programme - malnourished women: Underachievement for PLW is due to the late arrival of Supercereal (CSB+).
# and % of children 6-59 months with moderate acute malnutrition admitted for therapeutic care: Underachievement is due to a pipeline break of required nutrition products.
# children 6-59 months with severe acute malnutrition admitted for therapeutic care: assisted includes inludes 6352 SAM admissions with medication complication and 41503 SAM
admissions without medical complications; Data from Jan – July reported in August 2012.
% Assisted
vs Targeted
Affected or at Risk
(Jan - Dec)
Target
(Jan - Dec)
Assisted
(Jan - July)
NUTRITION
Affected or at R isk Assisted by cluster
Targeted by cluster Not Assisted
12
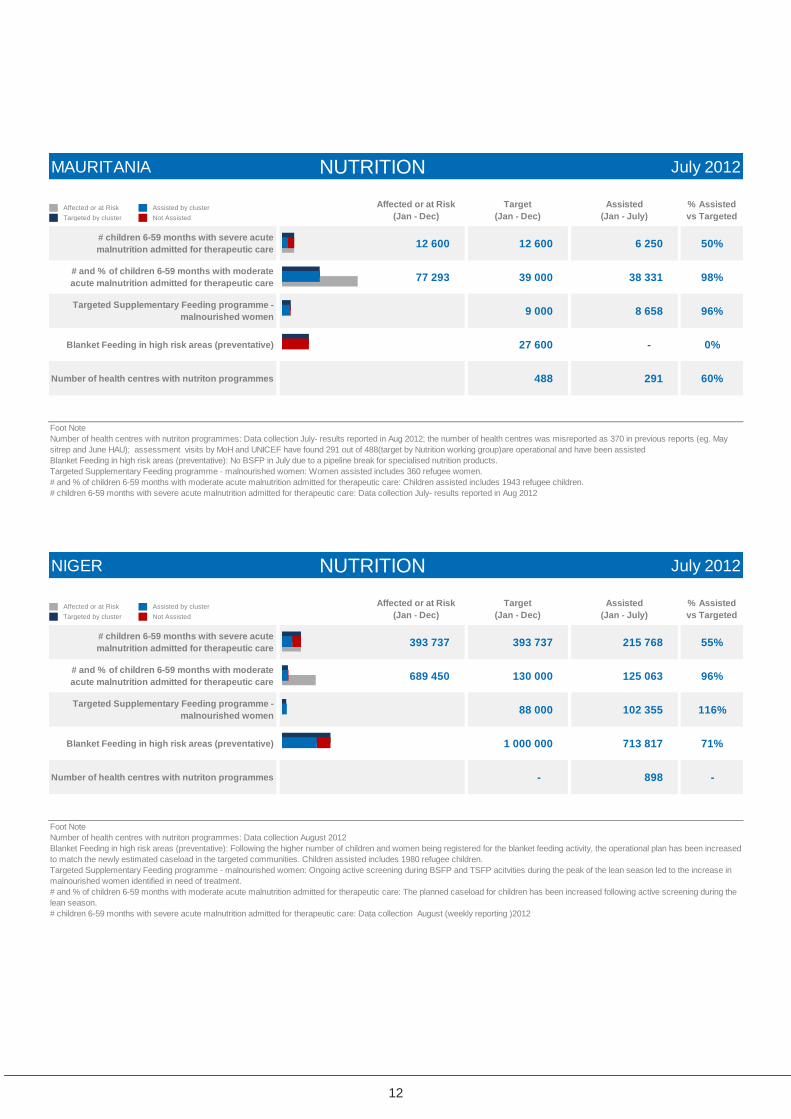
MAURITANIA July 2012
# children 6-59 months with severe acute
malnutrition admitted for therapeutic care12 600 12 600 6 250 50%
# and % of children 6-59 months with moderate
acute malnutrition admitted for therapeutic care77 293 39 000 38 331 98%
Targeted Supplementary Feeding programme -
malnourished women9 000 8 658 96%
Blanket Feeding in high risk areas (preventative) 27 600 - 0%
Number of health centres with nutriton programmes 488 291 60%
Foot Note
Number of health centres with nutriton programmes: Data collection July- results reported in Aug 2012; the number of health centres was misreported as 370 in previous reports (eg. May
sitrep and June HAU); assessment visits by MoH and UNICEF have found 291 out of 488(target by Nutrition working group)are operational and have been assisted
Blanket Feeding in high risk areas (preventative): No BSFP in July due to a pipeline break for specialised nutrition products.
Targeted Supplementary Feeding programme - malnourished women: Women assisted includes 360 refugee women.
# and % of children 6-59 months with moderate acute malnutrition admitted for therapeutic care: Children assisted includes 1943 refugee children.
# children 6-59 months with severe acute malnutrition admitted for therapeutic care: Data collection July- results reported in Aug 2012
% Assisted
vs Targeted
Affected or at Risk
(Jan - Dec)
Target
(Jan - Dec)
Assisted
(Jan - July)
NUTRITION
Affected or at Risk Assisted by cluster
Targeted by cluster Not Assisted
NIGER July 2012
# children 6-59 months with severe acute
malnutrition admitted for therapeutic care393 737 393 737 215 768 55%
# and % of children 6-59 months with moderate
acute malnutrition admitted for therapeutic care689 450 130 000 125 063 96%
Targeted Supplementary Feeding programme -
malnourished women88 000 102 355 116%
Blanket Feeding in high risk areas (preventative) 1 000 000 713 817 71%
Number of health centres with nutriton programmes - 898 -
Foot Note
Number of health centres with nutriton programmes: Data collection August 2012
Blanket Feeding in high risk areas (preventative): Following the higher number of children and women being registered for the blanket feeding activity, the operational plan has been increased
to match the newly estimated caseload in the targeted communities. Children assisted includes 1980 refugee children.
Targeted Supplementary Feeding programme - malnourished women: Ongoing active screening during BSFP and TSFP acitvities during the peak of the lean season led to the increase in
malnourished women identified in need of treatment.
# and % of children 6-59 months with moderate acute malnutrition admitted for therapeutic care: The planned caseload for children has been increased following active screening during the
lean season.
# children 6-59 months with severe acute malnutrition admitted for therapeutic care: Data collection August (weekly reporting )2012
% Assisted
vs Targeted
Affected or at Risk
(Jan - Dec)
Target
(Jan - Dec)
Assisted
(Jan - July)
NUTRITION
Affected or at Risk Assisted by cluster
Targeted by cluster Not Assisted
13
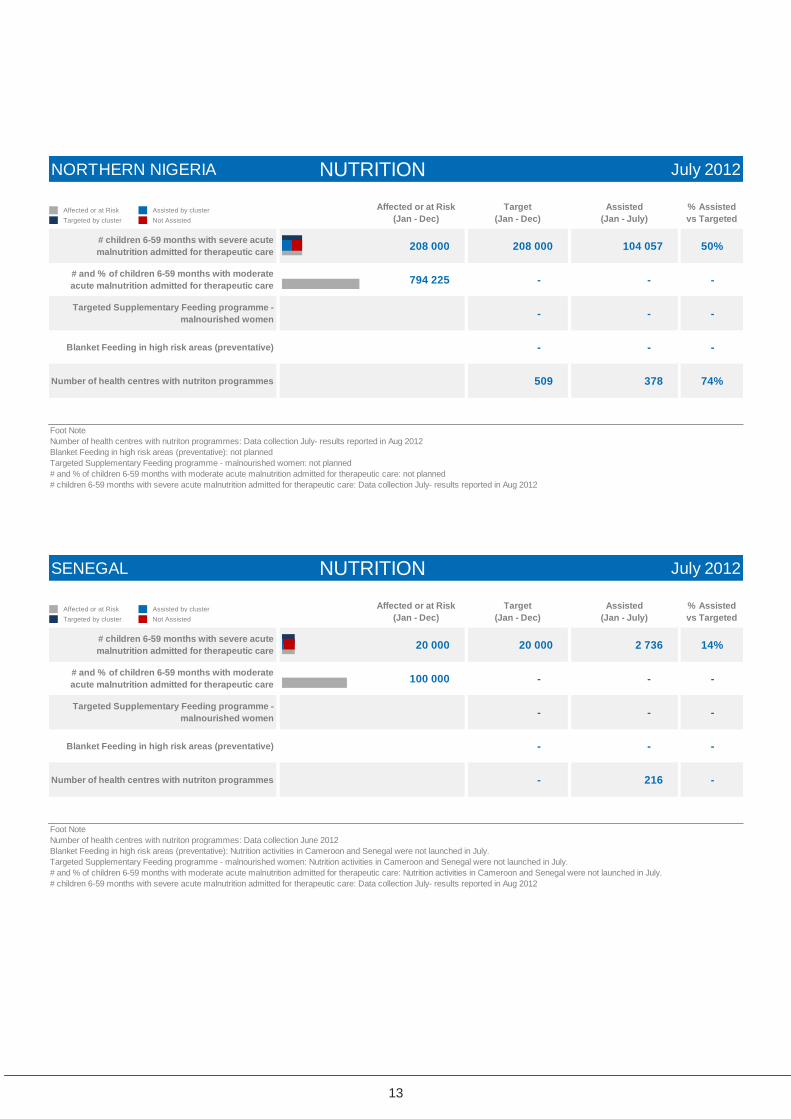
NORTHERN NIGERIA July 2012
# children 6-59 months with severe acute
malnutrition admitted for therapeutic care208 000 208 000 104 057 50%
# and % of children 6-59 months with moderate
acute malnutrition admitted for therapeutic care794 225 - - -
Targeted Supplementary Feeding programme -
malnourished women- - -
Blanket Feeding in high risk areas (preventative) - - -
Number of health centres with nutriton programmes 509 378 74%
Foot Note
Number of health centres with nutriton programmes: Data collection July- results reported in Aug 2012
Blanket Feeding in high risk areas (preventative): not planned
Targeted Supplementary Feeding programme - malnourished women: not planned
# and % of children 6-59 months with moderate acute malnutrition admitted for therapeutic care: not planned
# children 6-59 months with severe acute malnutrition admitted for therapeutic care: Data collection July- results reported in Aug 2012
% Assisted
vs Targeted
Affected or at Risk
(Jan - Dec)
Target
(Jan - Dec)
Assisted
(Jan - July)
NUTRITION
Affected or at Risk Assisted by cluster
Targeted by cluster Not Assisted
SENEGAL July 2012
# children 6-59 months with severe acute
malnutrition admitted for therapeutic care20 000 20 000 2 736 14%
# and % of children 6-59 months with moderate
acute malnutrition admitted for therapeutic care100 000 - - -
Targeted Supplementary Feeding programme -
malnourished women- - -
Blanket Feeding in high risk areas (preventative) - - -
Number of health centres with nutriton programmes - 216 -
Foot Note
Number of health centres with nutriton programmes: Data collection June 2012
Blanket Feeding in high risk areas (preventative): Nutrition activities in Cameroon and Senegal were not launched in July.
Targeted Supplementary Feeding programme - malnourished women: Nutrition activities in Cameroon and Senegal were not launched in July.
# and % of children 6-59 months with moderate acute malnutrition admitted for therapeutic care: Nutrition activities in Cameroon and Senegal were not launched in July.
# children 6-59 months with severe acute malnutrition admitted for therapeutic care: Data collection July- results reported in Aug 2012
% Assisted
vs Targeted
Affected or at Risk
(Jan - Dec)
Target
(Jan - Dec)
Assisted
(Jan - July)
NUTRITION
Affected or at Risk Assisted by cluster
Targeted by cluster Not Assisted

14
THE GAMBIA July 2012
# children 6-59 months with severe acute
malnutrition admitted for therapeutic care3 230 3 230 960 30%
# and % of children 6-59 months with moderate
acute malnutrition admitted for therapeutic care73 803 - - -
Targeted Supplementary Feeding programme -
malnourished women- - -
Blanket Feeding in high risk areas (preventative) 5 000 2 062 41%
Number of health centres with nutriton programmes 5 4 80%
Foot Note
Number of health centres with nutriton programmes: Data collection June 2012
Blanket Feeding in high risk areas (preventative): This activity was launched at the end of July; distributions have been completed in one region (West Coast Region). The remaining
beneficiaries in the other targeted regions will be assisted from August onwards.
Targeted Supplementary Feeding programme - malnourished women: not planned
# and % of children 6-59 months with moderate acute malnutrition admitted for therapeutic care: not planned
# children 6-59 months with severe acute malnutrition admitted for therapeutic care: Data collection and review July 2012 reported in August 2012
% Assisted
vs Targeted
Affected or at Risk
(Jan - Dec)
Target
(Jan - Dec)
Assisted
(Jan - July)
NUTRITION
Affected or at Risk Assisted by cluster
Targeted by cluster Not Assisted
15
SAHEL 2012: SECTOR PERFORMANCE INDICATORS
AGRICULTURE
Burkina Faso, Chad, Mali, Mauritania, Niger, Northern Cameroon,
Senegal, The Gambia
PERIOD: JANUARY – JULY 2012

16
FAO Sahel response
As of July, more than 4.5 million individuals were assisted by FAO in response to the Sahel crisis in Burkina
Faso, Cameroon, Gambia, Mali, Mauritania, Niger, Senegal and Chad. FAO‟s priority response interventions in
the Sahel focus on protecting, restoring and building resilient livelihoods of crisis-affected vulnerable farmers,
agro pastoralist and herders. The proposed interventions, linking action in a continuum from emergency to
recovery and development are presented in the Regional Response Programme to the Food and Nutrition
Security Crisis in the Sahel.
The assistance provided in July included : helping farmers with the delivery of seeds, fertilizers and farming
tools for the main planting season, which began in May/June 2012; drought-related assistance to herders,
including the distribution of animal feeding veterinary inputs, and provision of small livestock; strengthening of
technical capacities with training on good practices including vegetable processing and marketing, and best
practices of livestock management; organization of nutrition education sessions in order to increase the
nutritional status of affected households with children and pregnant women facing high malnutrition rates,
school gardens, rehabilitation of water points for irrigation and batter access to water for human and livestock
populations; and support to food security-information, early-warning systems and coordination. The impact of
lack of funds on programmes is important. For instance the assistance provided to crisis-affected herders in
Burkina Faso through animal fodder distribution covers a period of one to two months instead of four to five
months ideally.
Regarding the rainy season, in July, partners continue distributing agricultural inputs and started monitoring of
the programs, including culture development. The technical training activities have started. In some countries,
distributions are almost completed. This is why indicators remain the same than last month (Chad, Senegal,
Gambia). In other countries, they are still running and will be completed by August (Mali, Niger, Burkina Faso,
and Mauritania).
The off-season production (October 2012 – April 2013) has not started yet.
Malian Context:
In the North of Mali, FAO encounters specific issues of monitoring of the activities (agriculture, livestock and
food assistance) due to the very limited access in the area.
Note that the indicators remain FAO data only, except for Mali which provides the figures of FAO and partners.
All Affected Countries July 2012
Agriculture and Livestock 18 740 123 9 965 556 5 053 410 51%
Affected or at
Risk Target Assisted
% Assisted
vs Targeted
AGRICULTURE
Affected or at Risk Assisted by cluster
Targeted by cluster Not Assisted
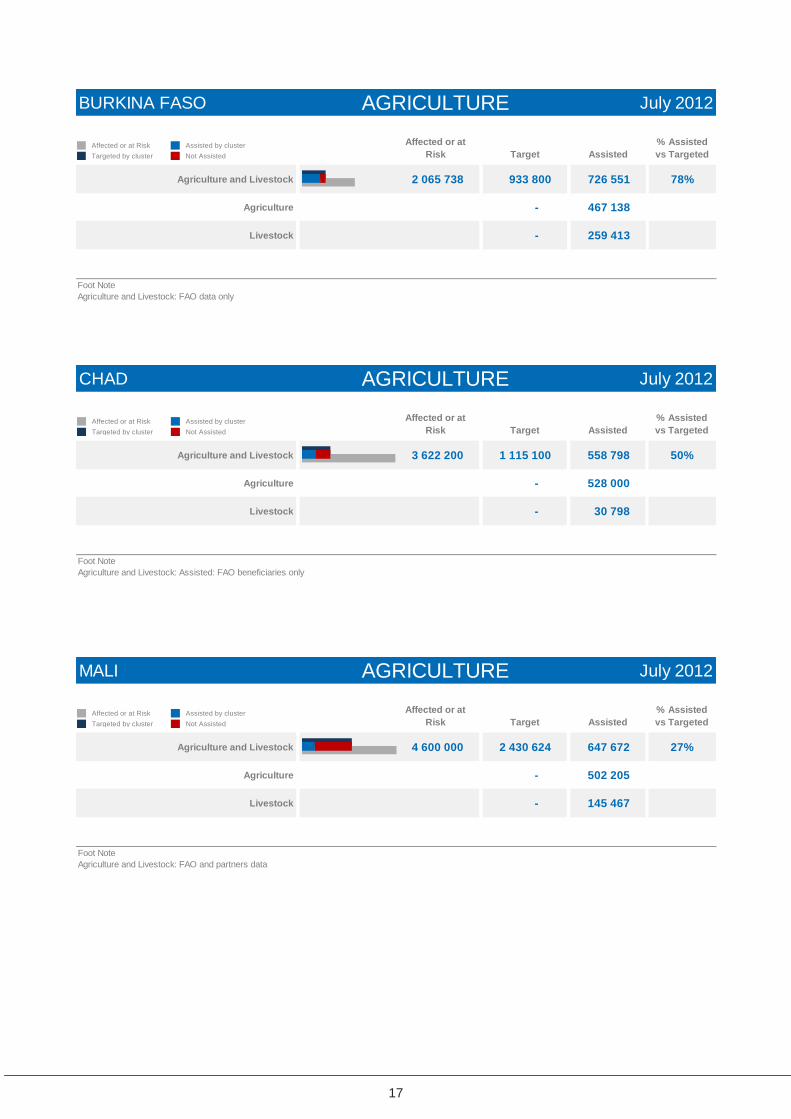
17
CHAD July 2012
Agriculture and Livestock 3 622 200 1 115 100 558 798 50%
Agriculture - 528 000
Livestock - 30 798
Foot Note
Agriculture and Livestock: Assisted: FAO beneficiaries only
Affected or at
Risk Target Assisted
% Assisted
vs Targeted
AGRICULTURE
Affected or at Risk Assisted by cluster
Targeted by cluster Not Assisted
MALI July 2012
Agriculture and Livestock 4 600 000 2 430 624 647 672 27%
Agriculture - 502 205
Livestock - 145 467
Foot Note
Agriculture and Livestock: FAO and partners data
Affected or at
Risk Target Assisted
% Assisted
vs Targeted
AGRICULTURE
Affected or at Risk Assisted by cluster
Targeted by cluster Not Assisted
BURKINA FASO July 2012
Agriculture and Livestock 2 065 738 933 800 726 551 78%
Agriculture - 467 138
Livestock - 259 413
Foot Note
Agriculture and Livestock: FAO data only
Affected or at
Risk Target Assisted
% Assisted
vs Targeted
AGRICULTURE
Affected or at Risk Assisted by cluster
Targeted by cluster Not Assisted
18
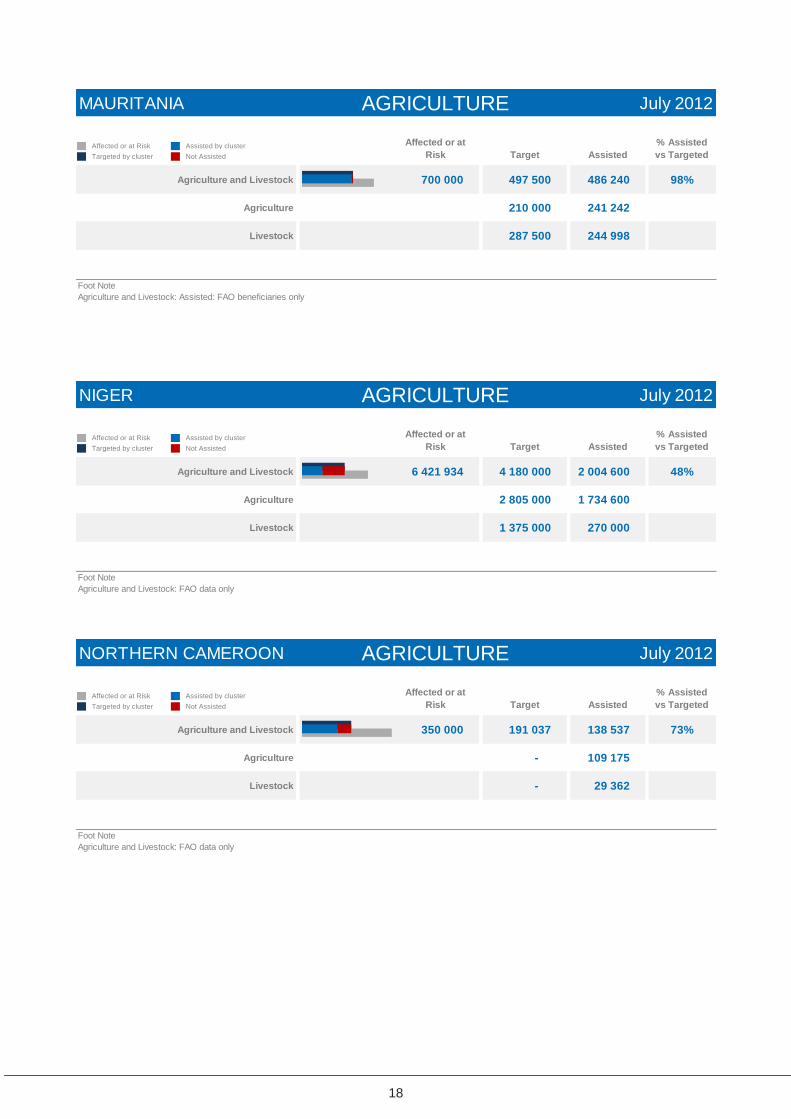
MAURITANIA July 2012
Agriculture and Livestock 700 000 497 500 486 240 98%
Agriculture 210 000 241 242
Livestock 287 500 244 998
Foot Note
Agriculture and Livestock: Assisted: FAO beneficiaries only
Affected or at
Risk Target Assisted
% Assisted
vs Targeted
AGRICULTURE
Affected or at Risk Assisted by cluster
Targeted by cluster Not Assisted
NIGER July 2012
Agriculture and Livestock 6 421 934 4 180 000 2 004 600 48%
Agriculture 2 805 000 1 734 600
Livestock 1 375 000 270 000
Foot Note
Agriculture and Livestock: FAO data only
Affected or at
Risk Target Assisted
% Assisted
vs Targeted
AGRICULTURE
Affected or at Risk Assisted by cluster
Targeted by cluster Not Assisted
NORTHERN CAMEROON July 2012
Agriculture and Livestock 350 000 191 037 138 537 73%
Agriculture - 109 175
Livestock - 29 362
Foot Note
Agriculture and Livestock: FAO data only
Affected or at
Risk Target Assisted
% Assisted
vs Targeted
AGRICULTURE
Affected or at Risk Assisted by cluster
Targeted by cluster Not Assisted
19
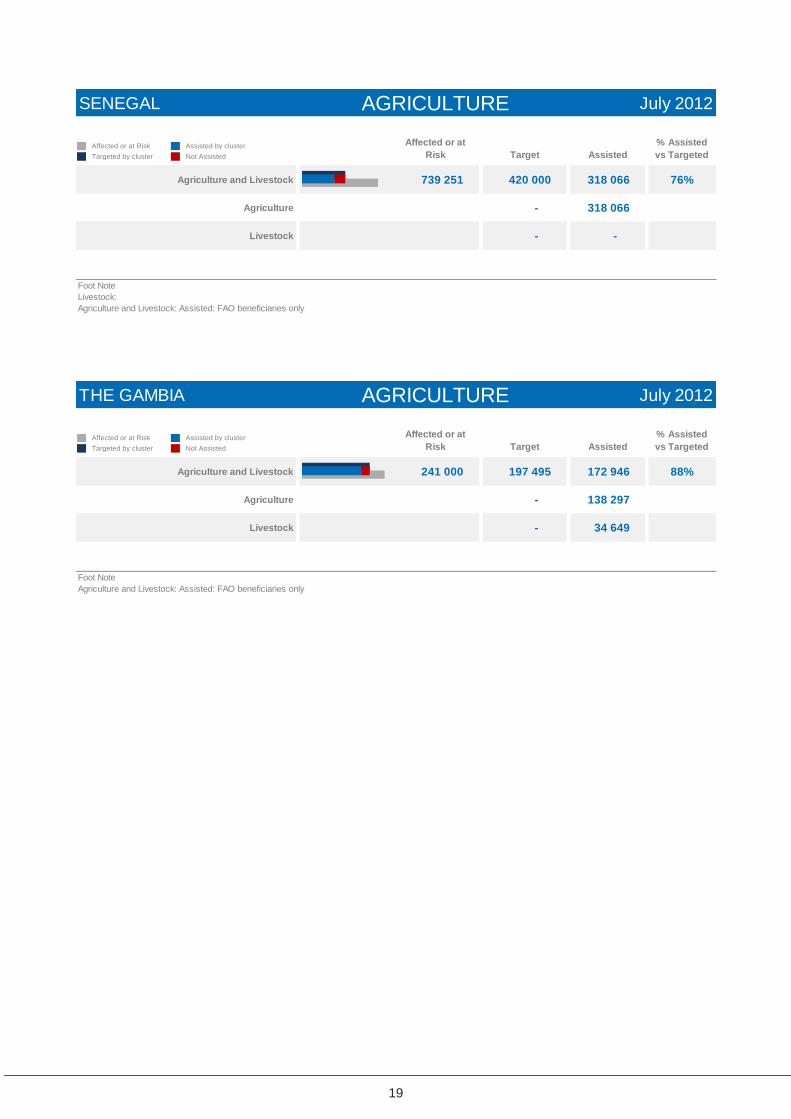
SENEGAL July 2012
Agriculture and Livestock 739 251 420 000 318 066 76%
Agriculture - 318 066
Livestock - -
Foot Note
Livestock:
Agriculture and Livestock: Assisted: FAO beneficiaries only
Affected or at
Risk Target Assisted
% Assisted
vs Targeted
AGRICULTURE
Affected or at Risk Assisted by cluster
Targeted by cluster Not Assisted
THE GAMBIA July 2012
Agriculture and Livestock 241 000 197 495 172 946 88%
Agriculture - 138 297
Livestock - 34 649
Foot Note
Agriculture and Livestock: Assisted: FAO beneficiaries only
Affected or at
Risk Target Assisted
% Assisted
vs Targeted
AGRICULTURE
Affected or at Risk Assisted by cluster
Targeted by cluster Not Assisted

20
SAHEL 2012: CLUSTER STRATEGIC INDICATORS
HEALTH
Burkina Faso, Mali, Mauritania, Niger, Senegal, The Gambia
PERIOD: JULY 2012
21
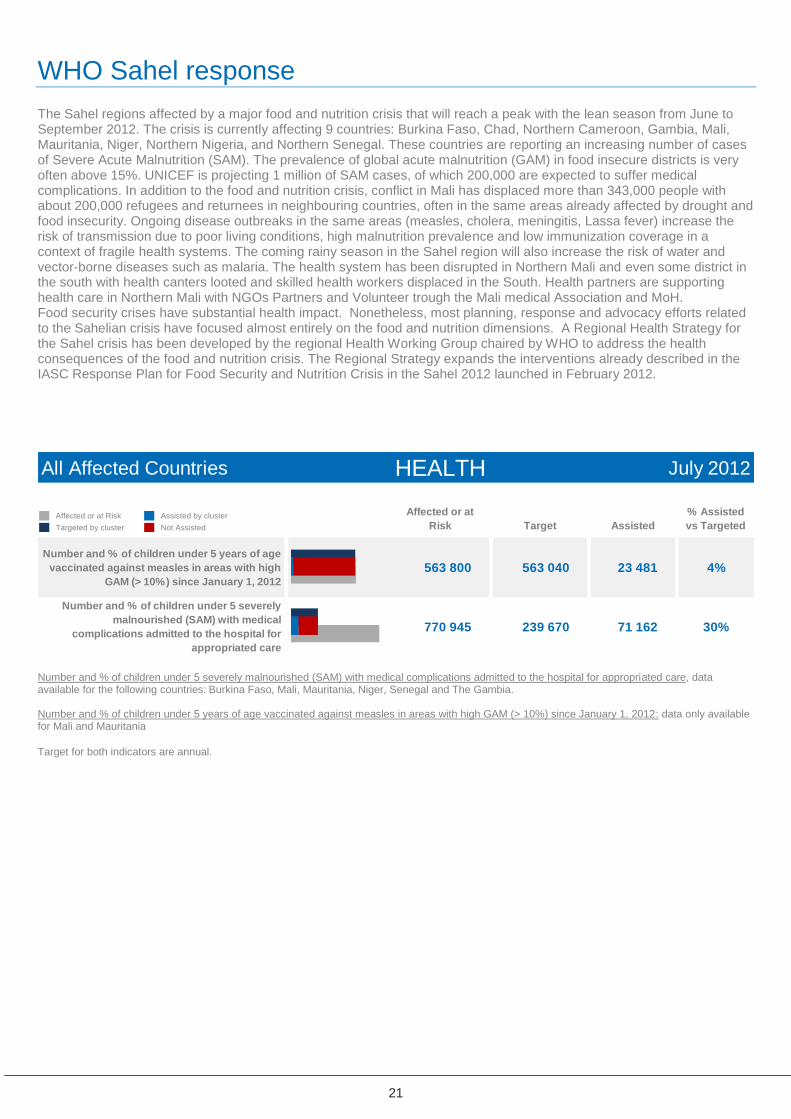
WHO Sahel response
The Sahel regions affected by a major food and nutrition crisis that will reach a peak with the lean season from June to September 2012. The crisis is currently affecting 9 countries: Burkina Faso, Chad, Northern Cameroon, Gambia, Mali, Mauritania, Niger, Northern Nigeria, and Northern Senegal. These countries are reporting an increasing number of cases of Severe Acute Malnutrition (SAM). The prevalence of global acute malnutrition (GAM) in food insecure districts is very often above 15%. UNICEF is projecting 1 million of SAM cases, of which 200,000 are expected to suffer medical complications. In addition to the food and nutrition crisis, conflict in Mali has displaced more than 343,000 people with about 200,000 refugees and returnees in neighbouring countries, often in the same areas already affected by drought and food insecurity. Ongoing disease outbreaks in the same areas (measles, cholera, meningitis, Lassa fever) increase the risk of transmission due to poor living conditions, high malnutrition prevalence and low immunization coverage in a context of fragile health systems. The coming rainy season in the Sahel region will also increase the risk of water and vector-borne diseases such as malaria. The health system has been disrupted in Northern Mali and even some district in the south with health canters looted and skilled health workers displaced in the South. Health partners are supporting health care in Northern Mali with NGOs Partners and Volunteer trough the Mali medical Association and MoH. Food security crises have substantial health impact. Nonetheless, most planning, response and advocacy efforts related to the Sahelian crisis have focused almost entirely on the food and nutrition dimensions. A Regional Health Strategy for the Sahel crisis has been developed by the regional Health Working Group chaired by WHO to address the health consequences of the food and nutrition crisis. The Regional Strategy expands the interventions already described in the IASC Response Plan for Food Security and Nutrition Crisis in the Sahel 2012 launched in February 2012.
All Affected Countries July 2012
Number and % of children under 5 years of age
vaccinated against measles in areas with high
GAM (> 10%) since January 1, 2012
563 800 563 040 23 481 4%
Number and % of children under 5 severely
malnourished (SAM) with medical
complications admitted to the hospital for
appropriated care
770 945 239 670 71 162 30%
Affected or at
Risk Target Assisted
% Assisted
vs Targeted
HEALTH
Affected or at Risk Assisted by cluster
Targeted by cluster Not Assisted
Number and % of children under 5 severely malnourished (SAM) with medical complications admitted to the hospital for appropriated care, data available for the following countries: Burkina Faso, Mali, Mauritania, Niger, Senegal and The Gambia. Number and % of children under 5 years of age vaccinated against measles in areas with high GAM (> 10%) since January 1, 2012: data only available for Mali and Mauritania
Target for both indicators are annual.

22
BURKINA FASO July 2012
Number and % of children under 5 years of age
vaccinated against measles in areas with high
GAM (> 10%) since January 1, 2012
- - -
Number and % of children under 5 severely
malnourished (SAM) with medical
complications admitted to the hospital for
appropriated care
100 000 20 000 4 275 21%
Affected or at
Risk Target Assisted
% Assisted
vs Targeted
HEALTH
Affected or at Risk Assisted by cluster
Targeted by cluster Not Assisted
MALI July 2012
Number and % of children under 5 years of age
vaccinated against measles in areas with high
GAM (> 10%) since January 1, 2012
560 000 560 000 23 027 4%
Number and % of children under 5 severely
malnourished (SAM) with medical
complications admitted to the hospital for
appropriated care
175 000 78 750 1 926 2%
Foot Note
Number and % of children under 5 severely malnourished (SAM) with medical complications admitted to the hospital for appropriated care: Affected or at Risk: 2.2%
of SAM for the entire country; Targeted: 45% of SAM; Assisted: 1st quarter data only for the 6 Southern regions only. Data for the Northern regions not yet available.
Affected or at
Risk Target Assisted
% Assisted
vs Targeted
HEALTH
Affected or at Risk Assisted by cluster
Targeted by cluster Not Assisted
MAURITANIA July 2012
Number and % of children under 5 years of age
vaccinated against measles in areas with high
GAM (> 10%) since January 1, 2012
3 800 3 040 454 15%
Number and % of children under 5 severely
malnourished (SAM) with medical
complications admitted to the hospital for
appropriated care
74 115 59 292 37 235 63%
Affected or at
Risk Target Assisted
% Assisted
vs Targeted
HEALTH
Affected or at Risk Assisted by cluster
Targeted by cluster Not Assisted
23
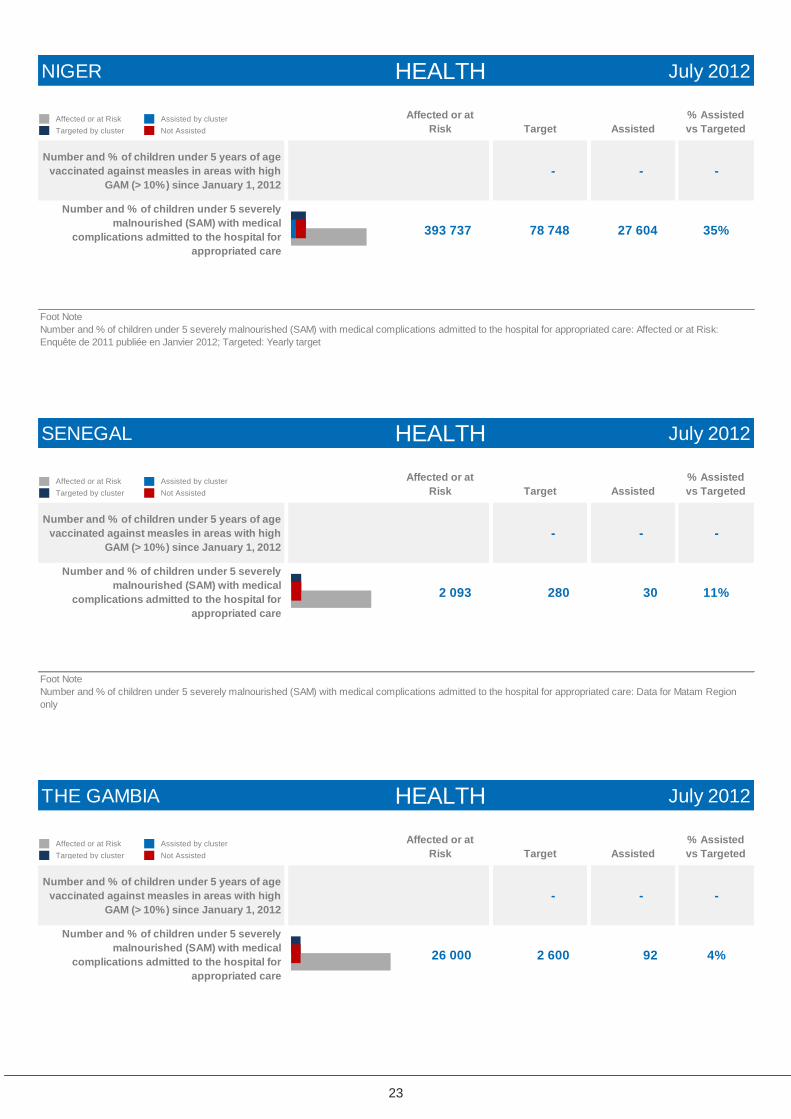
NIGER July 2012
Number and % of children under 5 years of age
vaccinated against measles in areas with high
GAM (> 10%) since January 1, 2012
- - -
Number and % of children under 5 severely
malnourished (SAM) with medical
complications admitted to the hospital for
appropriated care
393 737 78 748 27 604 35%
Foot Note
Number and % of children under 5 severely malnourished (SAM) with medical complications admitted to the hospital for appropriated care: Affected or at Risk:
Enquête de 2011 publiée en Janvier 2012; Targeted: Yearly target
Affected or at
Risk Target Assisted
% Assisted
vs Targeted
HEALTH
Affected or at Risk Assisted by cluster
Targeted by cluster Not Assisted
SENEGAL July 2012
Number and % of children under 5 years of age
vaccinated against measles in areas with high
GAM (> 10%) since January 1, 2012
- - -
Number and % of children under 5 severely
malnourished (SAM) with medical
complications admitted to the hospital for
appropriated care
2 093 280 30 11%
Foot Note
Number and % of children under 5 severely malnourished (SAM) with medical complications admitted to the hospital for appropriated care: Data for Matam Region
only
Affected or at
Risk Target Assisted
% Assisted
vs Targeted
HEALTH
Affected or at Risk Assisted by cluster
Targeted by cluster Not Assisted
THE GAMBIA July 2012
Number and % of children under 5 years of age
vaccinated against measles in areas with high
GAM (> 10%) since January 1, 2012
- - -
Number and % of children under 5 severely
malnourished (SAM) with medical
complications admitted to the hospital for
appropriated care
26 000 2 600 92 4%
Affected or at
Risk Target Assisted
% Assisted
vs Targeted
HEALTH
Affected or at Risk Assisted by cluster
Targeted by cluster Not Assisted
24
SAHEL 2012: CLUSTER STRATEGIC INDICATORS
WASH
Burkina Faso, Chad, Mali, Mauritania, Niger, North of Cameroon,
North of Nigeria, Senegal, The Gambia
PERIOD: JANUARY – JULY 2012
25
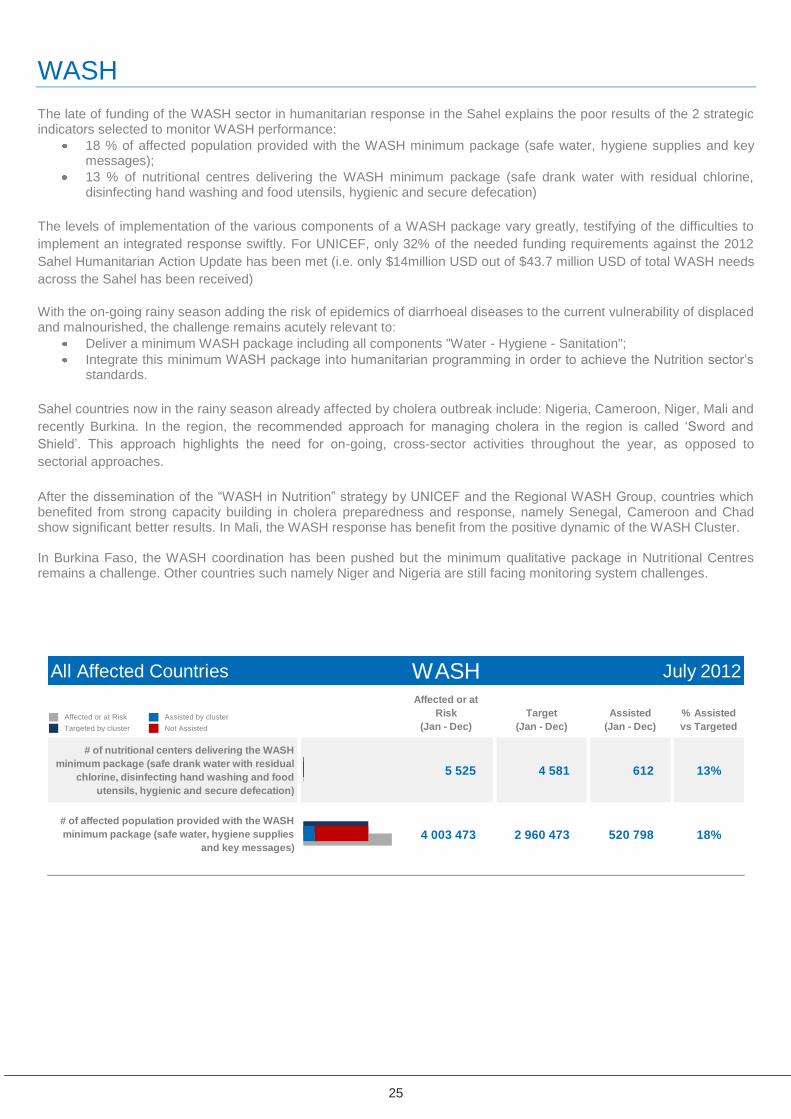
WASH
The late of funding of the WASH sector in humanitarian response in the Sahel explains the poor results of the 2 strategic indicators selected to monitor WASH performance:
18 % of affected population provided with the WASH minimum package (safe water, hygiene supplies and key messages);
13 % of nutritional centres delivering the WASH minimum package (safe drank water with residual chlorine, disinfecting hand washing and food utensils, hygienic and secure defecation)
The levels of implementation of the various components of a WASH package vary greatly, testifying of the difficulties to
implement an integrated response swiftly. For UNICEF, only 32% of the needed funding requirements against the 2012
Sahel Humanitarian Action Update has been met (i.e. only $14million USD out of $43.7 million USD of total WASH needs
across the Sahel has been received)
With the on-going rainy season adding the risk of epidemics of diarrhoeal diseases to the current vulnerability of displaced and malnourished, the challenge remains acutely relevant to:
Deliver a minimum WASH package including all components "Water - Hygiene - Sanitation";
Integrate this minimum WASH package into humanitarian programming in order to achieve the Nutrition sector‟s standards.
Sahel countries now in the rainy season already affected by cholera outbreak include: Nigeria, Cameroon, Niger, Mali and
recently Burkina. In the region, the recommended approach for managing cholera in the region is called „Sword and
Shield‟. This approach highlights the need for on-going, cross-sector activities throughout the year, as opposed to
sectorial approaches.
After the dissemination of the “WASH in Nutrition” strategy by UNICEF and the Regional WASH Group, countries which benefited from strong capacity building in cholera preparedness and response, namely Senegal, Cameroon and Chad show significant better results. In Mali, the WASH response has benefit from the positive dynamic of the WASH Cluster. In Burkina Faso, the WASH coordination has been pushed but the minimum qualitative package in Nutritional Centres remains a challenge. Other countries such namely Niger and Nigeria are still facing monitoring system challenges.
All Affected Countries July 2012
# of nutritional centers delivering the WASH
minimum package (safe drank water with residual
chlorine, disinfecting hand washing and food
utensils, hygienic and secure defecation)
5 525 4 581 612 13%
# of affected population provided with the WASH
minimum package (safe water, hygiene supplies
and key messages)
4 003 473 2 960 473 520 798 18%
WASHAffected or at
Risk
(Jan - Dec)
Target
(Jan - Dec)
Assisted
(Jan - Dec)
% Assisted
vs TargetedAffected or at Risk Assisted by cluster
Targeted by cluster Not Assisted

26
BURKINA FASO July 2012
# of nutritional centers delivering the WASH
minimum package (safe drank water with residual
chlorine, disinfecting hand washing and food
utensils, hygienic and secure defecation)
1 658 1 658 20 1%
# of affected population provided with the WASH
minimum package (safe water, hygiene supplies
and key messages)
207 909 207 909 42 193 20%
Foot Note
# of affected population provided with the WASH minimum package (safe water, hygiene supplies and key messages) : WASH minimum package functional in camps
for Malian refugees in Damba, Mentao and Fererio. Source: WASH Regional Group (data collection July 2012).
WASHAffected or at
Risk
(Jan - Dec)
Target
(Jan - Dec)
Assisted
(Jan - Dec)
% Assisted
vs TargetedAffected or at Risk Assisted by cluster
Targeted by cluster Not Assisted
CHAD July 2012
# of nutritional centers delivering the WASH
minimum package (safe drank water with residual
chlorine, disinfecting hand washing and food
utensils, hygienic and secure defecation)
400 400 107 27%
# of affected population provided with the WASH
minimum package (safe water, hygiene supplies
and key messages)
331 559 331 559 62 297 19%
Foot Note
# of affected population provided with the WASH minimum package (safe water, hygiene supplies and key messages) : Volunteers and technicians working in the
CAN/CNT in 6 Regions have been trained in WASH. Source: UNICEF (data collection July 2012).
WASHAffected or at
Risk
(Jan - Dec)
Target
(Jan - Dec)
Assisted
(Jan - Dec)
% Assisted
vs TargetedAffected or at Risk Assisted by cluster
Targeted by cluster Not Assisted
MALI July 2012
# of nutritional centers delivering the WASH
minimum package (safe drank water with residual
chlorine, disinfecting hand washing and food
utensils, hygienic and secure defecation)
1 094 150 45 30%
# of affected population provided with the WASH
minimum package (safe water, hygiene supplies
and key messages)
2 695 000 1 652 000 352 260 21%
Foot Note
# of affected population provided with the WASH minimum package (safe water, hygiene supplies and key messages) : 352,260 persons received hygiene kits (including
265,200 persons benefiting from a simple mosquito net + soap kit) and hygiene promotion. Source: UNICEF (data collection July 2012)
WASHAffected or at
Risk
(Jan - Dec)
Target
(Jan - Dec)
Assisted
(Jan - Dec)
% Assisted
vs TargetedAffected or at Risk Assisted by cluster
Targeted by cluster Not Assisted
27
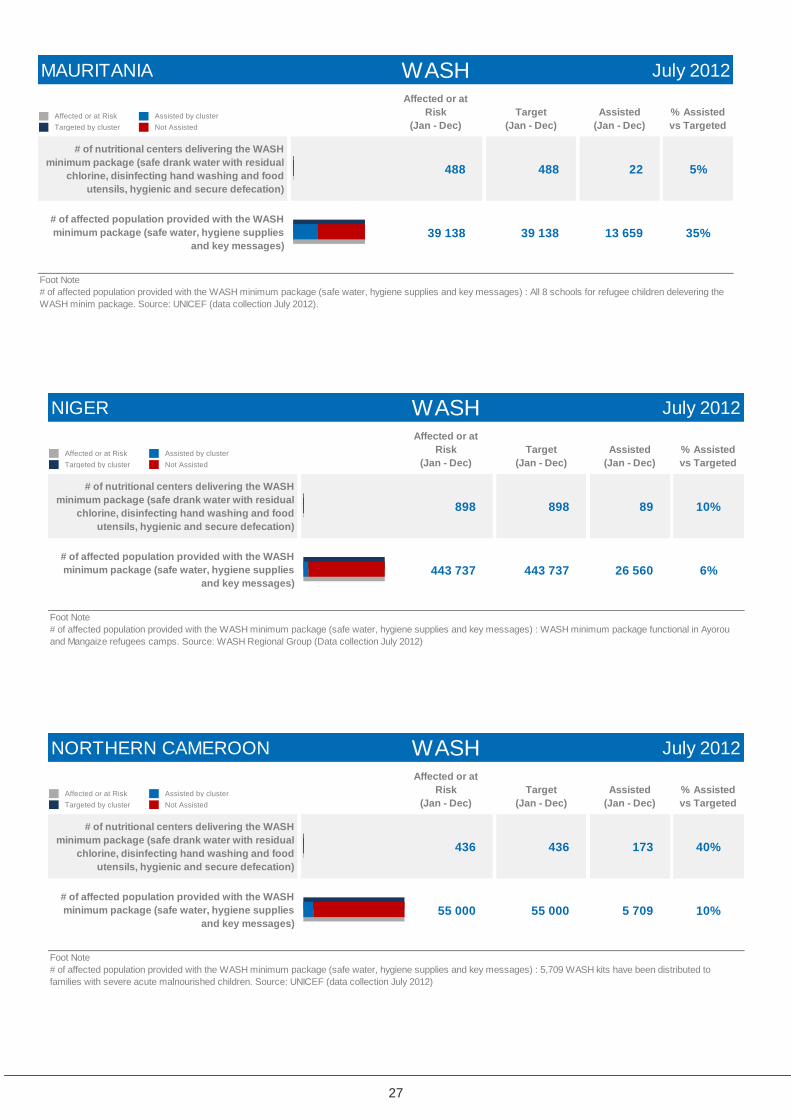
MAURITANIA July 2012
# of nutritional centers delivering the WASH
minimum package (safe drank water with residual
chlorine, disinfecting hand washing and food
utensils, hygienic and secure defecation)
488 488 22 5%
# of affected population provided with the WASH
minimum package (safe water, hygiene supplies
and key messages)
39 138 39 138 13 659 35%
Foot Note
# of affected population provided with the WASH minimum package (safe water, hygiene supplies and key messages) : All 8 schools for refugee children delevering the
WASH minim package. Source: UNICEF (data collection July 2012).
WASHAffected or at
Risk
(Jan - Dec)
Target
(Jan - Dec)
Assisted
(Jan - Dec)
% Assisted
vs TargetedAffected or at Risk Assisted by cluster
Targeted by cluster Not Assisted
NIGER July 2012
# of nutritional centers delivering the WASH
minimum package (safe drank water with residual
chlorine, disinfecting hand washing and food
utensils, hygienic and secure defecation)
898 898 89 10%
# of affected population provided with the WASH
minimum package (safe water, hygiene supplies
and key messages)
443 737 443 737 26 560 6%
Foot Note
# of affected population provided with the WASH minimum package (safe water, hygiene supplies and key messages) : WASH minimum package functional in Ayorou
and Mangaize refugees camps. Source: WASH Regional Group (Data collection July 2012)
WASHAffected or at
Risk
(Jan - Dec)
Target
(Jan - Dec)
Assisted
(Jan - Dec)
% Assisted
vs TargetedAffected or at Risk Assisted by cluster
Targeted by cluster Not Assisted
NORTHERN CAMEROON July 2012
# of nutritional centers delivering the WASH
minimum package (safe drank water with residual
chlorine, disinfecting hand washing and food
utensils, hygienic and secure defecation)
436 436 173 40%
# of affected population provided with the WASH
minimum package (safe water, hygiene supplies
and key messages)
55 000 55 000 5 709 10%
Foot Note
# of affected population provided with the WASH minimum package (safe water, hygiene supplies and key messages) : 5,709 WASH kits have been distributed to
families with severe acute malnourished children. Source: UNICEF (data collection July 2012)
WASHAffected or at
Risk
(Jan - Dec)
Target
(Jan - Dec)
Assisted
(Jan - Dec)
% Assisted
vs TargetedAffected or at Risk Assisted by cluster
Targeted by cluster Not Assisted

28
NORTHERN NIGERIA July 2012
# of nutritional centers delivering the WASH
minimum package (safe drank water with residual
chlorine, disinfecting hand washing and food
utensils, hygienic and secure defecation)
378 378 38 10%
# of affected population provided with the WASH
minimum package (safe water, hygiene supplies
and key messages)
208 000 208 000 5 200 3%
Foot Note
# of affected population provided with the WASH minimum package (safe water, hygiene supplies and key messages) : 138,600 provided with hygiene supplies and key
messages. Water treatment supplies (PUR) will be distributed shortly. Souce: UNICEF WASH team (data collection July 2012)
WASHAffected or at
Risk
(Jan - Dec)
Target
(Jan - Dec)
Assisted
(Jan - Dec)
% Assisted
vs TargetedAffected or at Risk Assisted by cluster
Targeted by cluster Not Assisted
SENEGAL July 2012
# of nutritional centers delivering the WASH
minimum package (safe drank water with residual
chlorine, disinfecting hand washing and food
utensils, hygienic and secure defecation)
168 168 118 70%
# of affected population provided with the WASH
minimum package (safe water, hygiene supplies
and key messages)
20 000 20 000 12 000 60%
Foot Note
# of affected population provided with the WASH minimum package (safe water, hygiene supplies and key messages) : 94,859 persons at risk within 12,000 SAM
provided with access to household water treatment. Source: UNICEF (data collection July 2012).
WASHAffected or at
Risk
(Jan - Dec)
Target
(Jan - Dec)
Assisted
(Jan - Dec)
% Assisted
vs TargetedAffected or at Risk Assisted by cluster
Targeted by cluster Not Assisted
THE GAMBIA July 2012
# of nutritional centers delivering the WASH
minimum package (safe drank water with residual
chlorine, disinfecting hand washing and food
utensils, hygienic and secure defecation)
5 5 - 0%
# of affected population provided with the WASH
minimum package (safe water, hygiene supplies
and key messages)
3 130 3 130 920 29%
Foot Note
# of affected population provided with the WASH minimum package (safe water, hygiene supplies and key messages) : Figure based on 29,4% of target achieved.
Source: UNICEF (data collection July 2012).
WASHAffected or at
Risk
(Jan - Dec)
Target
(Jan - Dec)
Assisted
(Jan - Dec)
% Assisted
vs TargetedAffected or at Risk Assisted by cluster
Targeted by cluster Not Assisted
29