Embed Size (px)
Citation preview

International Export Program Business Services Division
June 16, 2014
Mary Trimarco, Assistant Director
Mark Calhoon, Senior Managing Director Business Services Division

Results for FY 14 • Responded to 1005 requests for assistance from 445 WA small
businesses • Assisted these companies with $216 million in new export sales International Trade services
• Connect WA small businesses with international customers,
through high level access WA State can access
• Research and develop new export markets
• Locate strategic partners
• Risk mitigation and advocacy to remove roadblocks
• Conduct trade missions
• Bring new businesses to Washington
• Financial assistance for trade missions
Business Services: Diversifying our state economy

Results of our international trade work
MIL
LIO
NS
Sales data as reported by companies. Combines data from Trade and EFACW. * Fiscal year 2014 data to date.
NEW EXPORT ASSISTANCE PROJECTS MANAGED
455 companies assisted in FY 2014 to date.

International Trade Program: State Budget
FY 2011-13 $3 million in federal STEP funding helped compensate for GFS reductions, and funded 3 FTE project positions

The role of state government in international trade
• Integrated into the overall state economic development strategy
• Add credibility for WA small businesses in foreign markets and leverage government to government assistance
• Use WA State international protocols to get high level foreign government and business access for WA small businesses
• Provide economies of scale and increased exposure for WA small businesses at major international trade shows
• Small and medium companies lack resources to develop export sales on their own
• Connects them to the right resources, including federal grants
• Government accountability, transparency and fairness
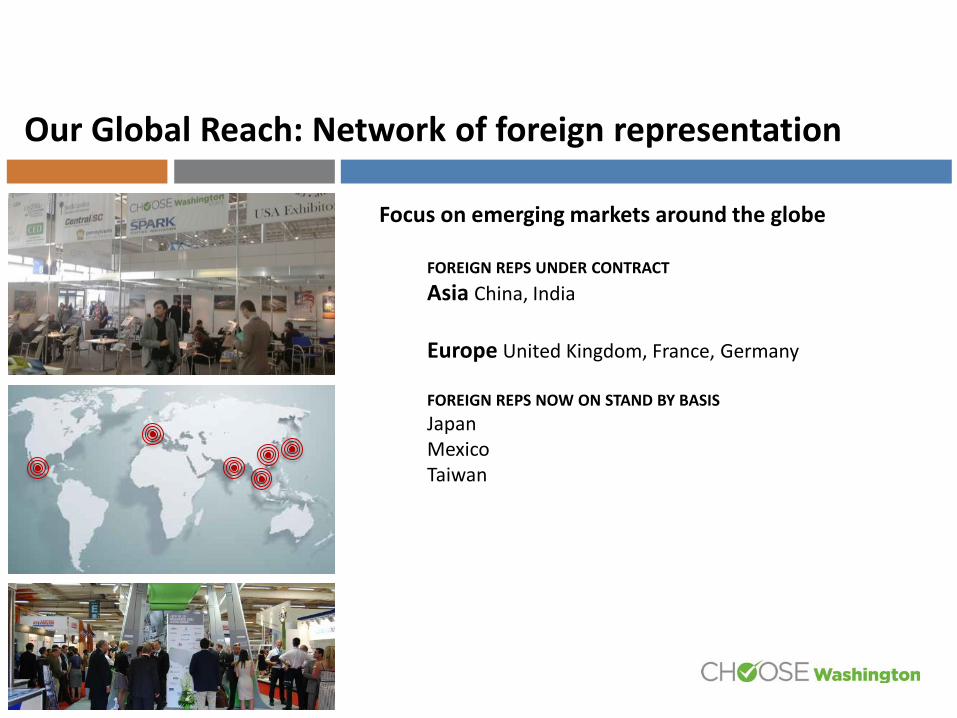
Our Global Reach: Network of foreign representation
Focus on emerging markets around the globe
FOREIGN REPS UNDER CONTRACT Asia China, India Europe United Kingdom, France, Germany FOREIGN REPS NOW ON STAND BY BASIS Japan Mexico Taiwan

Key business sectors
• Aerospace
• Advanced manufacturing
• Information and communication technology
• Life sciences and global Health
• Clean technology
• Marine technology
• Professional Services and consumer products • Education

Upcoming events
Governor Mission to Farnborough Air Show, July Mobile Games Forum (UK organizer), Seattle, October Medica, Hannover, November Aeromart Toulouse, December Mobile World Congress, Barcelona, February JEC Composites Show, Paris, March Hannover Messe, April Aerospace and Defense Supplier Summit, April 2016 Seattle
Photo of hannover or Farnborough… ?? Or an obvious foreign meeting of some sort.
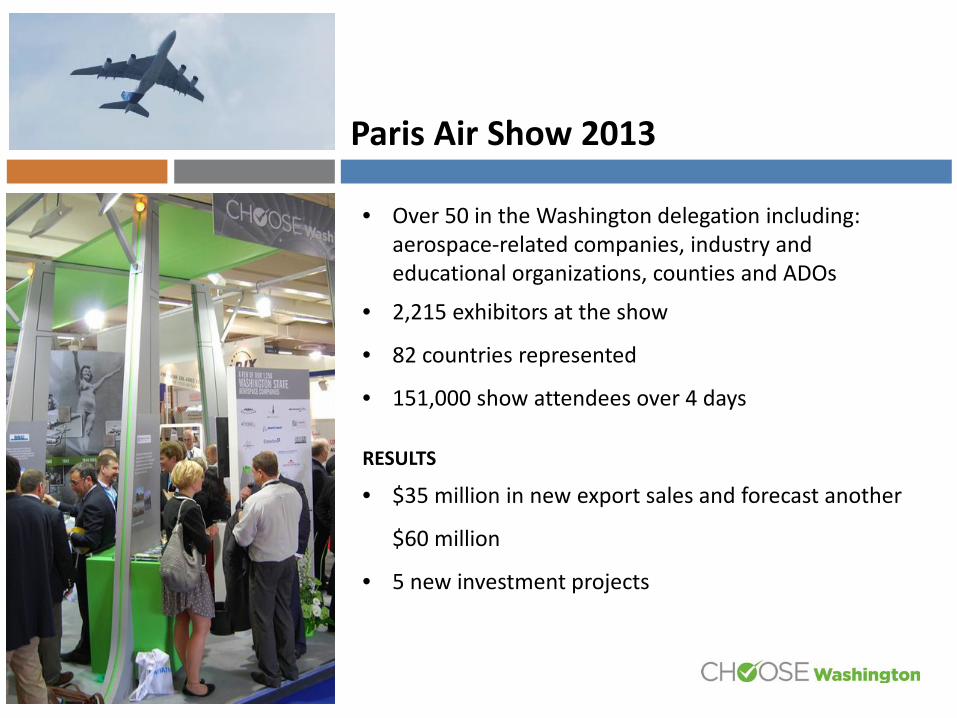
Paris Air Show 2013
• Over 50 in the Washington delegation including: aerospace-related companies, industry and educational organizations, counties and ADOs
• 2,215 exhibitors at the show
• 82 countries represented
• 151,000 show attendees over 4 days
RESULTS
• $35 million in new export sales and forecast another
$60 million
• 5 new investment projects

STEP Grant Program Y1 Number of Participating Firms – WA 3rd Highest
10 ND, NJ and WV did not participate in the STEP Grant Program in Y1 * states with projected export sales figures
47
157
21
110
23
2*
19
236 14
23 40
33
36
7
4*
4
17
81
165
11
83
4*
55
50* 10 42
93
5 11
47*
1*
35* 13*
122 341
27
45 0
17
23* 27
24*
10
23*
40
10
Total Number of Participating Firms:
2,261
RI 2*
8* DC
PR 38
VI 1*
GU 4*

11
STEP Program Performance Washington Top 5 for ROI and Highest Total Export $
State STEP Year 1 and Census Export Sales1
Top 10 STEP ROI States1
13 15
11
3
9
22
15
2
7 6
0
5
10
15
20
25
< 1 1-5 5-10 10-20 20+
# of
Sta
tes
Return on Investment
Year 1
Year 2
Actuals (9) (21) (10) (11) (8) (2) (3) (3) (6) (6)
STEP Return on Investment*
Rank State ROI State ROI1 MT 47.69 AL 92.392 MD 44.79 OK 83.103 AZ 41.51 WA 58.534 MO 39.39 FL 37.535 WA 22.77 CO 26.776 PR 22.64 MO 24.247 PA 17.16 ND 17.958 FL 12.85 ID 14.589 TX 12.37 NE 12.14
10 OR 9.07 IL 7.40
Y1 Y2
StateSTEP Rank
STEP Export $ millions
Y1
Census Rank
Census Export $ millions as of 09/2013
MO 1 $38.51 29 $9,741.90WA 2 $36.24 4 $59,389.70PA 3 $29.37 10 $31,127.40AZ 4 $27.23 22 $14,385.70MD 5 $26.20 31 $8,952.60MT 6 $14.68 50 $1,146.50FL 7 $10.03 6 $45,537.90OH 8 $7.74 9 $37,762.40CA 9 $6.71 2 $122,957.10PR 10 $5.45 20 $15,632.90
StateSTEP Rank
STEP Export $ millions
Y2
Census Rank
Census Export $ millions as of 09/2013
WA 1 $82.24 4 $59,389.70FL 2 $41.26 6 $45,537.90AL 3 $34.04 23 $14,383.00OK 4 $31.83 38 $5,228.90MO 5 $24.66 29 $9,741.90ND 6 $12.05 44 $2,755.10CO 7 $8.82 35 $6,491.70IL 8 $7.92 5 $47,776.80
NE 9 $6.90 36 $5,484.20ID 10 $5.92 39 $4,279.50
State STEP Year 2 and Census Export Sales1
*Return on investment bar graph reflects both actual and projected export sales. 1) For these tables, only states reporting actual sales are considered, not states reporting projected sales. Year 1 comprises the time period of October 2011–September 2013. Year 2 reflects results from October 2012–September 2013.

New To Export Success Story – Has Offers
• Developed software to track effectiveness of e-advertising campaigns for companies
• Founded in 2009 • Currently – 50 employees • 10,000 customers, tracking $350m in advertising
• In 2011, Has Offers was not exporting, but saw opportunities in the mobile advertising market in Europe
• Has Offers joined the WA delegation that went to Mobile World Congress, Barcelona in Feb 2012
• Commerce provided support with an Export Voucher and organized B2B meetings
• Showcased company’s latest product to some of world’s best known mobile ad networks
• Found new emerging technology partners

Supply Chain Success Story – MetalTech
• MetalTech is a contract manufacturer located in Sumner • Turnkey manufacturing, fabrication and assembly products and services • Worked with customers in the automotive, commercial and medical industries
• To grow company, MetalTech wanted to start doing work for the aerospace industry • Commerce recruited MetalTech to join the WA delegation that went with Governor
Gregoire to the 2012 Farnborough Air Show • Participated in B2B meetings set up by Commerce for sales and market intelligence
purposes • Landed high-ticket orders for aerospace – first ever exports for the company • MetalTech has continued to grow its exports and business with the aerospace industry
and attended the 2013 Paris Air Show with the WA delegation recruited by Commerce

QUESTIONS?

APPENDIX: STEP Voucher program
2012 2013 2 year TOTAL
Actual Sales $13,010,481.00 $25,787,016.00 $38,797,497.00
Forecast Sales $95,450,000.00 $118,163,200.00 $213,613,200.00 # Companies Assisted 108 112 178* # Applications Received 185 153 338 # Awards 111 113 224 Total $ allocated to Vouchers $353,506 460,638 $814,144 Average voucher amount $3,184.75 $3,427.75 $3,300.19
As of now, $74,902 of the $460,638 available is still unallocated and will still be used for 2013 activity. * Some companies were assisted in both years but counted once in total. As sales reporting continues this total will likely increase.
Every $1 received in STEP funding = return of $25 in export sales.

Y 1 & Y 2 Applied 315 Approved 224 Declined 67 Rescinded 24
APPENDIX: STEP Voucher Program
Approved
Declined
Rescinded
Voucher Applications Year 1 & Year 2
0
50
100
150
200
250
Year 1 Year 2 CombinedApproved 111 113 224Declined 50 17 67Rescinded 19 5 24
Voucher Applications by Year

APPENDIX: Trade Business Development Life Cycle
GENERATE LEAD Identify WA client at
trade event, seminars, from email/phone call
VISIT CLIENT Commerce staff
consults with WA company
EVALUATE Market potential
Readiness to go to market
ENGAGE in-country reps get involved in export
project
DELIVER Foreign rep provides
intelligence on potential partners, B2B meetings, market
intelligence, advocacy, in-country support
FOLLOW UP Company acts on
recommendations. Commerce staff monitors
progress to provide assistance as needed. SALES
Survey for qualitative and quantitative
results throughout life cycle of project
NEW EXPORT PROJECT
Following successful initial export market experience they initiate a new export
expansion project.

APPENDIX: Recent target sector missions
Advanced materials and manufacturing JEC composites trade show in Paris - March 2014 • 5 companies participated – aerospace, marine,
automotive, sports and leisure, education • 33,000 exhibitors
Clean tech Hannover Messe in Germany - April 2014 • 6 Washington companies represented • 6,500 exhibitors from 62 countries • 250,000 attendees
Information and communications technology Mobile World Congress in Barcelona – February 2014 • 15 mobile technology companies from Washington • 65,000 industry leaders from 200 countries

APPENDIX: Partnering increases the impact
Associate Development Organizations (ADO) African Chamber of Commerce British American Business Council Center for Advanced Manufacturing Puget Sound (CAMPS) Center for International Trade in Forest Products (CINTRAFOR) Center of Excellence for Global Trade & Supply Chain Management China Relations Council Evergreen Building Products Association Export Finance Assistance Center of Washington Export-Import Bank French American Chamber of Commerce Greater Spokane Inc. Japan America Society Japan External Trade Organization Pacific Northwest Aerospace Alliance Pacific Northwest Trade Adjustment Assistance Center Port of Seattle Port of Tacoma Softwood Export Council State Board of Community and Technical Colleges State International Development Organizations
The Indus Entrepreneurs (TiE Seattle) Trade Development Alliance of Greater Seattle U.S. Export Assistance Ctr of U.S. Dept of Commerce, Seattle (USEAC) University of Washington U.S.-Saudi Arabia Business Council Washington Biotechnology & Biomedical Association (WBBA) Washington Clean Tech Alliance (WCTA) Washington Council on International Trade (WCIT) Washington Public Ports Association Washington State China Relations Council (WSCRC) Washington State Department of Agriculture (WSDA Washington State District Export Council (DEC) Washington State Office of Minority and Women Owned Enterprises Washington State Small Business Development Centers (SBDC) Washington State University Washington Technology Industry Association (WTIA) World Trade Center Tacoma World Trade Club, Seattle

APPENDIX: Quarterly data for Export Assisted Cases and Sales
* Fiscal Year 2014 to date. Data from Results Washington.

Average Annual Growth in Per capita GDP Based on purchasing power parity (PPP) in USD, 2010-2017
Data source: International Monetary Fund (IMF), World Economic Outlook database.
Developing economies will outpace the U.S. as a source of new demand.
*Values next to countries are projected per capita based PPP for 2017

Rise of Asia Share of global GDP, current international dollar
IMF Forecast, 2012-2017
Data source: International Monetary Fund (IMF), World Economic Outlook database, October 2012.
Difference of
47 per points
Difference of 16 per points