Embed Size (px)
Citation preview

3
International Comparison of Transport Appraisal Practice
Annex 7 New Zealand Country Report
Douglas N J Wallis I
Lawrence A Wignall D
Douglas Economics and Ian Wallis Associates
April 2013
Project Funded by the Department for Transport UK
Institute for Transport Studies
INTERNATIONAL COMPARISON OF TRANSPORT APPRAISAL PRACTICE
T H E N E W Z E A L A N D C O U N T R Y R E P O R T
Foreword
ITS Leeds University commissioned Neil Douglas of Douglas Economics and Ian Wallis of Ian Wallis amp Associates to review project appraisal practices in New Zealand Peter Mackie of ITS Leeds provided a structure for our review to which we have followed as best we can
We asked Don Wignall to help on the lsquohistoryrsquo section and comment on roadrail appraisal Adam Lawrence of Ian Wallis amp Associates reviewed current practices Chris Parker of NZIER provided a view on Wider Economic Benefits
Peter Mackie also provided a set of tables to complete Ian Wallis completed the table with help from Sandy Fong of the NZ Transport Agency
We would like to stress that the views expressed in this paper are those of the authors and do not reflect any official view that the NZ government may have
Overview
Section 1 sets the scene by providing a short description of New Zealand and how transport is organized Section 2 provides a brief history of the development of transport appraisal in NZ leading up to section 3 which outlines the current situation Section 4 looks at recent developments focusing on the move to larger unitary local authorities and the move to Treasury Better Business Case appraisals Section 5-8 look at some topical issues in transport appraisal section 5 lists some general issues section 6 looks at toll roads section 7 at rail evaluation and section 8 the national cycle way Section 9 looks at areas of recent and ongoing transport appraisal research that is being undertaken in NZ Finally in section 10 the key points of the review are listed
Contents
1 Introduction 4
2 Development of appraisal practice in NZ 4
3 The current situation 7 31 National planning and funding framework 7 32 Economic appraisal procedures 9 33 Other considerations 11
4 Recent developments affecting project evaluation 12 41 Land Transport Management Amendment Bill 2012 12 42 Move to an Auckland lsquoSuper Cityrsquo 13 43 Treasury Better Business Case 13 44 Business Case of Auckland City Centre Rail Link 16 45 Wellington lsquoFlyoverrsquo Dispute 17
5 Other Developments 17 51 Introduction 17 52 Current Review of the Evaluation Manual amp Emphasis on CBA 18 53 Developments in road tolling 18 54 Rail Evaluation 19 55 Appraisal of active transport strategies and projects 21
6 Areas of NZ Research in Project Evaluation22 61 Wider Economic Benefits 22 62 Value of time savings for multi-occupant light vehicle travellers 23 63 Non-linearity of (commuter) time savings 24 64 Economic appraisal of PT fares service levels and subsidies 24 65 PT Option amp Non-use Values 24 66 Parameter values for public transport economic appraisal 24 67 Deriving Service Quality Values through linked SP amp Rating Surveys 25
7 Conclusions 25
References 26
1 Introduction
New Zealand comprises two main islands (the North and South Islands) and numerous smaller islands The total land area is some 270000 sq kms (around double that of England) extending some 1600 kms in length and reaching 400 km at its widest point The population of NZ is 445 million with 72 of people living in 16 main urban areas the three largest metropolitan areas being Auckland (14 million) Wellington (400000) and Christchurch (360000)
NZ has three levels of government the central government 11 regional councils and 67 territorial authorities (5 of which are unitary authorities also undertaking the functions of regional councils)
NZrsquos land transport system comprises some 10800km of state highways 82000km of local roads and 3900 route km of railway The state highways are fully funded by the central government while local road funding is shared (on a national average 5050 basis) between the central government and territorial authorities
At a national level the railway is predominantly a freight railway with both the infrastructure and operations now being owned by the central government following a period of private ownership and operation (1993-2004) which ultimately turned out to be unsuccessful The freight services operate predominantly on a commercial basis (competing with road freight and to a lesser extent coastal shipping) although limited government funding has been granted as part of a lsquocatch-uprsquo investment programme Limited long-distance passenger services also operate on the rail network again on a commercial basis
Urban rail passenger services operate in Auckland and Wellington and are contracted and subsidised through the regional councils regional councils with funding assistance from central government Similarly local bus services in the urban centres are planned and managed through the regional councils with operations being contracted out through a competitive tendering process Central government policy is that local public transport services should overall recover at least 50 of costs through fares the remaining portion of costs is funded approximately 5050 between the regional councils and the central government
Central government land transport funding is drawn from a hypothecated fund with revenues derived principally from petrol taxes road user charges (levied on heavy vehicles) and motor registration fees The local (regional and territorial authority) contributions to land transport funding are derived principally from property rates
Given the key role of central government in land transport funding it takes the lead in the development and maintenance of project appraisal procedures in the review of funding applications in the light of these procedures and in deciding on the projects to be funded
2 Development of appraisal practice in NZ
In NZ over the last thirty years project appraisal has been based on social lsquocost benefit analysisrsquo (or CBA) with most applications being for roads rather than rail Pervading the development of evaluation procedures and decision making to date has been a deeply ingrained principle of only spending road user funds for road user benefit rather than for other reasons
In the mid 1970rsquos the Ministry of Works and Development began to consider approaches to evaluate road construction projects which culminated in the selection of CBA to appraise investment in major state highway projects from 1982 In 1986 the National Roads Board published the economic appraisal manual referred to as TR9 By 1988 CBA was a requirement for assessing all road projects administered by the National Roads Board
The first Project Evaluation Manual (PEM) was issued in 1991 by Transit NZ to replace TR9 The PEM was a road based procedure and the calculated benefit cost ratios (BCRs) were used to select a BCR threshold (typically 4) above which funding could be awarded based on available central government transport funds
1991 also saw the enactment of the Resource Management Act (RMA) which governs land use in NZ and requires that any transport project affecting land use needs to be assessed according to its environmental effects which need to be avoided or appropriately mitigated In order to proceed projects needs to be lsquoconsentablersquo in RMA terms RMA mitigationconditions can significantly increase costs and hearings inquiries and appeals often act to slow the project consent process
In 1995 under a new government agency was created from Transit NZ called lsquoTransfund NZrsquo under a funder and provider split which was empowered to fund transport related outputs that were considered to be efficient alternatives to the provision or maintenance of roading1 The Minister of Transport requested that Transfund NZ which up to that point had been a roads agency develop evaluation procedures for output based funding for train services and barging operations
As a prelude to developing detailed procedures Transfund NZ commissioned a study of alternative approaches that included cost benefit appraisal financial appraisal cost effectiveness analysis multiple criteria analysis and economic impact analysis2 The study which involved workshops with local territorial authorities recommended CBA as the most appropriate technique On the basis of this recommendation detailed procedures were developed for non road alternatives primarily rail and water services (passenger and freight) In 1997 the ldquoAlternatives to Roadingrdquo Manual (ATR) was published
To a large extent the benefits and parameters measuring the ability of lsquonon roading alternativesrsquo to produce road user benefits such as maintenance cost savings decongestion benefits accident savings noise and air pollution savings and greenhouse gas emission reductions were taken from the PEM
The ATR economic evaluation criterion was an efficiency ratio (ER) which represented the ratio of additional benefits to the subsidy required There were a number of differences between the ER and BCR at the time and these were not always allowed for when thresholds were being set or comparisons were made between the two indicators for funding purposes ATR funding was by way of operational subsidy (a maximum of 3 years was introduced in 2007) rather than via a lump sum capital grant
Altogether around ten projects mostly small scale were submitted for ATR funding consideration with five achieving funding Three projects all involving log transport
1 Transfund was created under section 3D of the Transit New Zealand (TNZ) Amendment Act 1995
2 ldquoA Comparison of Evaluation Methods for Alternatives to Roadingrdquo Report to Transit New Zealand by PCIE
March 1996
(two by barge and one by rail) and were justified largely on the basis of road maintenance savings3
In 2002 the results of a major study into benefit parameter values including the value of time were finalised The study reported the results of a nationwide survey of willingness to pay values for travel time ride smoothness and other factors based on Stated Preference market research4 Also around this time some latitude was introduced into the ranking of BCRs to allow for non quantifiable factors
In 20034 the idea of developing balanced lsquotransport packagesrsquo was imported from the UK rather than developing lists of individual projects solving individual problems In terms of evaluation the questions were how to evaluate the total package and whether the package components could be evaluated individually for funding applications Advice was provided in volume 1 of the EEM about options evaluation but advice on packages has not developed in any detail As a consequence PT package evaluations (services vehicle capital costs infrastructure termini etc) were rare Evaluation was undertaken at the strategic level of multi-modal packages in developing regional or corridor plans but often the packages comprised mixes of non-complementary investments rather than representing complementary lsquopackagesrsquo
In 2004 Transfund NZ and the Land Transport Safety Authority were combined into one Land Transport New Zealand Later in 2008 Land Transport New Zealand and Transit New Zealand were merged combining the funder and provider to become the New Zealand Transport Agency
In 2006 a two volume Economic Evaluation Manual (EEM) was released the larger and more detailed volume 1 being for road evaluation with volume 2 covering other modes Volume 2 introduced the concept of consumer surplus and replaced the ER with a calculated BCR
Work has continued on estimating the financial and social costs of transport for use in appraisals A wide ranging review was conducted by the Ministry of Transport in 2009 that looked at valuation methodologies and parameter values for road rail and water based passenger and freight domestic transport5 The review looked at road
congestion greenhouse gas emissions harmful emissions accidents transport noise and other social and environmental impacts and followed on from work undertaken in the 1990s
The last decade has seen a move away from CBA towards multi criteria analysis The aim initially instigated by the NZ Green Party was to assist rail and non road alternatives achieve funding by widening the assessment criteria Perversely however the downgrading of conventional CBA together with a change in Government has contributed to the promotion of road investment by relaxing the CBA constraint on project scope
3 ldquoCase Studies of Two Alternative to Roading Projectsrdquo Brennand T Wallbran W NZIHT 2004
4 ldquoProject Evaluation Benefit Parameter Valuesrdquo Beca Carter Hollings amp Ferner in association with SDG Forsyte
Research Brown Copeland amp Co report to Transfund April 2002 5
ldquoUnderstanding Transport Costs and Charges Phase 2 ndash Social and environmental costs ndash A literaturerdquo Report by
Financial amp Economic Analysis Team Ministry of Transport November 2009
Since 2008 the Roads of National Significance (RoNS) programme has developed Seven State Highway (SH) projects based around the five largest population centres have been designated as RoNS because they ldquoenable economic growth rather than simply responding to itrdquo The RoNS designation allows projects with an individually low BCR to be approved within a overall higher package BCR As an example the Mackays to Peka Peka Expressway on SH1 north of Wellington costing NZ$630m achieved a BCR of less than 10 but has been given draft approval on the basis of the strategic value of the RoNS programme as a whole and reducing travel times for through traffic particularly in the peak commuting period
In terms of evaluation the CBA of RoNS projects has been augmented to include Wider Economic Benefit analysis using two alternative approaches (i) a regionally specific WEBs assessment to assess agglomeration effects and land use changes and (ii) a computable general equilibrium model (CGE) to estimate the size of the national economy wide effects although CGE currently is outside the scope of the EEM6
In summary for NZ the development of CBA for transport evaluation purposes has been incremental with lsquoexplicitly allowablersquo benefits introduced into official procedures on the basis of research evidence and comparison with international practice
3 The current situation
The Land Transport Management Act 2003 sets out the planning and funding framework for project appraisal and decision-making in New Zealand A number of process changes are currently being considered by Parliament and will be in place later this year (refer section 41 for further discussion on these changes)
31 National planning and funding framework
The national planning and funding framework is rather complex and involves a number organisations The government sets the overall priorities Local councils (city and district) are responsible for local roading and most transport infrastructure and regional councils are responsible for transport planning and public transport (policy fares timetables procurement)7 Regional transport committees (RTCs) are responsible for regional transport strategy and programme prioritisation
The NZ Transport Agency (NZTA) is responsible for all State highway activities as well as the prioritisation and allocation of national transport funding to the above organisations The division of responsibility for local roads and state highways (which are both extensive and pass through urban areas) has created tensions between local and central government in project selection evaluation and funding
The national framework essentially works as follows
1 The Governmentrsquos three year priorities for transport are set out in the Government
Policy Statement (GPS) on Land Transport Funding This includes specified funding
6 SAHA (2010) ldquoRoads of National Significance Economic Assessments Reviewrdquo report by SAHA to NZTA dated July
2010
7 There are also a number of lsquounitaryrsquo authorities (combined local and regional councils) with the Auckland lsquosuper
cityrsquo being a special care is a special case
ranges for various lsquoactivity classesrsquo (eg local roads State highways public transport
services)
2 The NZTA is a Crown agency responsible for administering the National Land
Transport Fund (NLTF) which is sourced primarily from road user charges levied on
trucks buses and other diesel vehicles and petrol taxes8 The NZTA must prepare a
national land transport programme (NLTP) every three years The NLTP identifies the
activities intended to receive funding from the NLTF and the proposed level of
funding for each of the lsquoactivity classesrsquo identified in the GPS It is also required to
contribute to a number of statutory lsquoobjectivesrsquo and to give effect to the GPS9
3 Most local government transport activities are part funded from the NLTF based on
a lsquofunding assistance ratersquo (FAR) set by the NZTA (national average of 50) with the
remaining funding sourced from local government rates (business and residential) or
public transport fares State highway activities are 100 funded from the NLTF
4 To be considered for inclusion in the NLTP projectsactivities must first be included
in a regional land transport programme (RLTP) 10 Regional transport committees
(RTCs) must prepare a new RLTP and consult the public every three years11
5 Activities must be proposed by an lsquoapproved organisationrsquo to be included in a
RLTP12 A core level of activity is automatically included (ie local road maintenance
and renewals and existing public transport services) but most are included at the
discretion of the RTC and must be prioritised13 The RTC can choose to exclude any
activity from the RLTP that is not automatically included but it cannot proposed new
activities or change activities
6 Activities proposed for inclusion in an RLTP must also include an assessment that
complies with both RTC and NZTA requirements There is some uncertainty and
overlap between RTC and NZTA responsibilities but in practice the process is driven
by NZTA requirements set out in their Investment and Revenue Strategy Planning
and Investment Knowledgebase and Economic Evaluation Manual (EEM) (Vols
1amp2)14 The NZTA essentially requires a form of multi-criteria analysis with projects
8 Additional Crown appropriations are made available from time-to-time particularly for large capital projects
that do not directly benefit road users (eg rail upgrades) These appropriations are not part of the NLTF but are generally administrated by the NZTA as they complement or offset the need for NLTF funding9
The NZTA must ensure that the NLTP contributes to the aim of achieving an affordable integrated safe responsive and sustainable land transport system and contributes to each of the following assisting economic development assisting safety and personal security improving access and mobility protecting and promoting public health ensuring environmental sustainability (s19B LTMA 2003)10
The NZTA must ldquotake into accountrdquo RLTPs when preparing the NLTP Certain nationally delivered activities (eg
road policing) do not need to be include in an RLTP but State highways local roading public transport road safety promotion and transport planning activities must all be included to be considered for inclusion in the NLTP
11 There is one RTC for each local government region Membership is made up of all city and district mayors in
the region two regional council representatives and a NZTA representative Membership also includes five lsquoobjectiversquo representatives (for economic development safety and personal security public health access and mobility environmental sustainability) and one representative of cultural interests (these members cannot vote on the RLTP as they are not funding parties) There are variations to this for unitary authorities12
Approved organisations are local councils regional councils and the NZTA (State highways) 13
The prioritisation approach (policies) must have previously been set out in the relevant regional land transport strategy (RLTS) which is also prepared by the RTC (the Bill combines the RLTS and RLTP into a single Regional Land Transport Plan acronym remains RLTP) 14
The Planning and Investment Knowledgebase is similar in concept to the UK WebTAG
being assessed as high medium or low against the three criteria strategic fit
effectiveness and efficiency The assessment procedures are discussed in section 32
below The end result is an RLTP with activities set out in priority order as
determined the RTC
7 The NZTA must take the RLTP and priorities into account but has to prioritise funding
across the 14 regions developing the NLTP This includes a parallel process to ensure
that expenditure is maintained within the GPS funding range for each activity class
The final decision on which activities get funded is essentially a decision made by the
NZTA Board based on their view of the information presented
One contentious issue with the above process is the fact that NZTA can be both a project proposer and assessor These projects usually state highway projects are proposed by the state highway organisation (the Highway Network Operations unit) within NZTA but also have to be included in a RLTP by a RTC The project is then assessed for approval by the funding approval section of NZTA which can raise questions of quality control and in-house bias Other projects are proposed by approved organisations mainly Councils and then assessed by the funding approval section of NZTA
32 Economic appraisal procedures
Procedures for economic appraisal are set out in NZTArsquos Economic Evaluation Manual
(EEM) (Vols 1amp2) The EEM is an extensive document that has been developed incrementally over more than a decade to provide detailed procedures to estimate different types of benefit Table 1 sets out the types of benefit covered and the transport initiatives to which they mainly apply
As can be seen the scope is extensive However although the emphasis has been on Willingness to Pay values (adjusted for indirect taxes to produce resource values) the manual provides less coverage of demand modelling techniques and how to forecast patronage response
The table could be misinterpreted to imply that certain benefits may not be awarded to certain project types For example to imply that health benefits are not relevant to either PT or road investments would clearly be incorrect It is important to ensure that benefits (of whatever type) and also any disbenefits are appropriately selected and correctly applied in each particular case
Table 1 Benefits Evaluated in NZ EEM by Transport Initiative
The NZTA decision-making criteria as set out in NZTArsquos Planning and Investment Knowledgebase are a form of multi-criteria analysis with projects assessed as high medium or low against the three criteria strategic fit effectiveness and efficiency
Strategic fit refers to how an identified problem issue or opportunity aligns with the NZTArsquos strategic investment direction There is a stated set of strategic priorities or goals against which lsquostrategic fitrsquo is assessed The Government Policy Statement (GPS) is highly prescriptive in this regard containing the amount of funding available for each project type (or activity class)
Effectiveness refers to the contribution that the proposed solution makes towards solving the identified problem Guidelines on how this criteria should be applied are contained within the NZTA lsquoKnowledge Basersquo
Economic efficiency refers to the value of the solution in relation to the resources used (rating based on CBA calculation using EEM15)
The resulting three letter lsquoassessment profilersquo is used to rank projects from 1 to 14 using a rating table In practice only the CBA component is a quantified factor calculated with a set methodology The other factors are subjective judgements Any formalised MCA tends only to be used to short-list options in major studies such as the 201213 Wellington Spine study which considered over fifty moderoute alternatives for improving public transport along the main urban corridor of Wellington
The government focus in recent years has been the RONS programme which is supported by the NZTA strategic fit and effectiveness measures which essentially
15 The BCR is converted into a low (lt2) medium (2-4) or high (gt4) rating
outweigh any economic efficiency consideration for those RONS activities Economic efficiency however remains an important component (particularly those that have a lower strategic fit assessment) but due to the funding ranges set by government in the GPS priorities funding for non-RONS activities (including maintenance of existing roads and state highways) has become increasingly scarce
33 Other considerations
Funding and programming
In addition to the above procedures local and regional council have their own decision-making processes to decide whether or not they should put a project forward for inclusion in a RLTP in the first place Large or complex projects require substantial supporting information for NZTA funding approval purposes including a Scheme Assessment Report and an assessment profile Medium sized projects also require supporting material and associated profiles for funding purposes but less detailed information is required compared with large projects Small projects routine expenditure can often be included within block spending totals without requiring specific approvals
The local authority processes must also comply with the requirements of the Local Government Act 2002 including the preparation of long term plans and annual plans which are subject to public consultation and must identify all planned significant expenditure Councils often need to assume funding provisions for their draft plans before they know what funding they may receive from the NLTF
The founding document of New Zealand is the Waitangi Treaty between Maori and the Crown In terms of transport project appraisal and approval the Treaty introduces some special consultation requirements and some flexibility for special roads (for example to Marae) in the LTMA New road and rail routes tend to avoid land or activities of importance to Maori wherever possible due to the difficulties of obtaining consent and the associated costs involved
Resource Management Act
As mentioned in section 2 the Resource Management Act (RMA) is important in determining the process and success of transport proposals that are considered to have significant environmental impacts The RMA is currently being reformed to streamline the process for Aucklands first unitary plan introduce a six-month time limit for processing consents for medium-sized projects and make direct referral to the Environment Court easier for major regional projects The Bill also includes stronger requirements for councils to base planning decisions on robust and thorough cost-benefit analysis (s32) including assessing how jobs and employment will be affected
Large projects will generally require a Resource Consent Hearing at which the focus is mainly on environmental impacts rather than the economic impacts of the project (equivalent to a large UK public inquiry justification) Large projects are either lsquocalled inrsquo to be taken through a Board of Inquiry process or otherwise go to a local
government Hearing in order to apply for a lsquodesignationrsquo and obtain necessary consents Appeals on the outcome of Hearings are held in an lsquoEnvironment Courtrsquo
4 Recent developments affecting project evaluation
The legislation governing transport planning and funding is currently going through a legislative change process as discussed in section 41 In addition two recent developments that are affecting project selection and evaluation are the move towards larger unitary local authorities which is discussed in section 42 and the introduction of the better business case framework which is discussed in section 43 Section 44 brings these two developments together by looking at the case of the Auckland Cross City Rail Link business case proposal Then section 45 looks at the case of the Wellington flyover proposed by NZTA but not whole heartedly supported by the Wellington City Council
41 Land Transport Management Amendment Bill 2012
The Land Transport Management Amendment Bill 2012 is currently before Parliament Changes proposed to the planning and funding framework include simplified decision-making criteria focusing on effectiveness efficiency and safety consolidation of regional planning documents and a move from a three-year to six-year planning cycle There is also a stronger emphasis on top down planning with a stronger role for the GPS
The Act currently requires consideration of wide range of factors for most decisions including the contribution of plans and activities to the aim of achieving an affordable integrated safe responsive and sustainable land transport system and their condition to assisting economic development assisting safety and personal security improving access and mobility protecting and promoting public health ensuring environmental sustainability (s19B LTMA 2003) The Bill will streamline these requirements simply requiring plans and activities ldquohellipto contribute to an effective efficient and safe land transport system in the public interestrdquo (Bill as reported back from the Select Committee)
Another change seeks to streamline RTC decision-making but removing the requirement for lsquoobjectiversquo and other representatives and combining regional land transport strategies (RLTS) and regional land transport programmes (RLTP) into a single regional land transport plan (RLTP) prepared every six years and reviewed every three
The Bill also introduces a new ldquopublic transport operating modelrdquo for the procurement of public transport services This is intended to strengthen regional and operator joint planning and deliver more efficient services
42 Move to an Auckland lsquoSuper Cityrsquo
Auckland was criticised as dysfunctional because of the inability to get the city councils to agree and wasteful because of the cost of running seven councils In 2010 largely at the instigation of the central government Auckland Council was established taking over the functions of the Auckland Regional Council and seven territorial authorities At the same time Auckland Transport replaced the Auckland Regional Transport Authority and is now responsible for all regional transport infrastructure (excluding state highways) and the regions public transport services The Auckland Integrated Transport Programme (ITP) has recently been published jointly by Auckland Transport and the NZTA and it is hoped that ITPs will be developed for other NZ cities in the future In combination with the Treasury Better Business Case Programme Case an ITP is intended to enable multimodal programme appraisals in which various land use growthinvestmentdemand management scenarios are developed modelled for their long term performance and assessed for investment strategic fit Project appraisal would then be able to focus on the detailed appraisal of effectiveness and efficiency for optimisation and timing purposes as part of the detailed business cases as the programme is developed
In 2012 Auckland Council produced its first spatial plan which is supported by a more detailed unitary plan and a complementary transport programme prepared by Auckland Transport The aim of this plan and programme is to develop a more compact more sustainable city-region supported by high quality transport links including a significant increase in the frequency of electrified rail services
This vision is not shared 100 by central government who see higher economic growth from investing in major new roads through the RoNS program and more affordable housing being provided by releasing more peripheral land
43 Treasury Better Business Case
A Treasury Better Business Case (TBBC) framework is being developed for government agencies seeking funding for new capital expenditure The TBBC is based on the UK Treasury framework but takes some elements from the Investment Management Standard produced by the Department of Treasury and Finance in the State of Victoria (Australia)
Project assessment is based on ldquofive casesrdquo is it supported by a robust case for change ndash the ldquostrategic caserdquo does it maximise value for money ndash the ldquoeconomic caserdquo is commercially viable ndash the ldquocommercial caserdquo is it financially affordable ndash the ldquofinancial caserdquo is it achievable ndash the management case
TBBC process includes different lsquopathsrsquo and provides for single-stage or two-stage business case decision-making depending on the size and risk profile of the project After the strategic case has been proven the economic case needs to be assessed which for transport projects will most likely involve a CBA
Figure 43 Treasury Better Business Case
Overview of Treasury Better Business Case (The Treasury (NZ) 2012 p 8) The coloured letters indicate the relative effort required on each of the ldquofive casesrdquo
As of March 2013 NZTA is in the process of incorporating aspects of the TBBC framework into its own decision-making processes (National Infrastructure Unit (NZ) 2012) The NZTA intends to adapt the TBBC so that it is ldquofit for purposerdquo when considering transport projects This will include changes to existing NZTA procedures to alignment with the TBBC framework Feedback is expected to be sought from local and regional councils within the next few months and new procedures published prior to the next planning round scheduled for 201516
The NZTA have adopted a lsquoprinciples based approachrsquo (ie not rules) with the main principle include the need for a clear lsquoproblem definitionrsquo and clearly identified benefits as part of a strategic case for change prepared up front The main change being to carry out assessments in the correct order eg donrsquot start doing a detailed economic appraisal until there is a clear strategic case for change NZTA consider the current system to be reasonably robust and that only relatively minor changes will be required to align existing procedures with the TBBC Changes will be published as part of the NZTA Planning and Investment Knowledgebase
One example of the application of the TBBC to an investment is the proposed $NZ 422 million Clifford Bay ferry terminal which would replace the existing ferry-railtruck transfer arrangements on NZrsquos main trunk rail route where it crosses between the North and South Islands The project has been subject to financial evaluations by Kiwi Rail (and its predecessor organisations) which operates the ferry service In early 2011 the government asked the Ministry of Transport to provide an independent review of KiwiRailrsquos findings and evaluate the Clifford Bay option from a
national transport perspective using the Treasuryrsquos Better Business Case guidelines incorporating strategic economic financial commercial and management cases
The impetus for the new terminal are fourfold an expected doubling of the freight task by 2040 time savings of 30 minutes in ferry sailing time 50 minutes in road time and 110 minutes in rail time16 (between Wellington and Christchurch) a one third reduction in fuel use because of shorter route and the avoidance of the steep terrain outside Picton and the redundancy of current environmental limitations on existing ferry operations through the Marlborough Sounds (due to ship wave wash)
Port fees at the current Picton terminal fees are only around $7 million per annum however which is low relative to the $422 million cost of developing the Clifford Bay Terminal thus any prospective terminal operator would need to increase the current berthing fees significantly in order to make a commercial return The other problem is the economic impact on the town of Picton which relies on the existing ferry terminal The local District Council has said that it would push for a compensation package17
To date no conventional economic or financial evaluation results such as a BCR have been released from the Better Business Case evaluation only qualitative statements regarding the strong merit of the proposal
The Treasury Better Business Case has also been used in the Additional Waitemata Harbour Crossing preliminary business case in 2011 (Price Waterhouse Coopers amp NZIER 2011) and the Wellington Public Transport Spine Study in 2012-13 (AECOM 2012) In the case of Additional Waitemata Harbour Crossing appraisal the report was structured around the standard EEM procedure with the business case requirements mapped against the relevant sections of the report
The Public Transport Spine Study is using the TBBC five cases as an organising structure for the study although it is proving difficult to apply the TBBC to this type of feasibility study where some key decisions were made previously as part of a wider corridor plan The Spine Study has adopted a ldquosievingrdquo approach based on multi-criteria analysis to reduce the numbers of candidate options through a 3-stage (longmediumshort listing) approach A full economic appraisal is not being undertaken until the short list stage
16 Road and rail time savings measured in terms of Picton-Christchurch versus Clifford Bay to Christchurch
Savings to Nelson would be less17
The Marlborough Council has cited the example of the West Coast Council which received a compensation package when the Central Government closed down the native timber logging industry for environmental reasons
44 Business Case of Auckland City Centre Rail Link
In November 2010 Auckland Council and Auckland Transport (ACAT) presented a Business Case for a $24 billion City Centre Rail Link (CCRL) comprising a rail tunnel from Britomart to Mt Eden with three new stations costing $24 billion (including additional rolling stock and additional network infrastructure) in November 2010 The Ministry of Transport reviewed the Business Case with the Treasury and reported in May 201118
The review found that the Business Case did not comply with the EEM guidelines or Treasury guidelines on Better Business Cases for Capital Proposals Table 2 compares the cost-benefit results of the ACAT and MoT assessments
Estimated costs were similar but there were major differences in estimated benefits ACAT estimated transport benefits of $13 billion whereas MoT estimated only $04 billion
Table 2 Costs and Benefits of Auckland City Centre Rail Link
Present Value NZ$ millions 2010
The MOT review commented that the ldquodifference between these two figures is largely the result of correcting technical issues in the Business Case economic modelling and a more robust approach to calculating decongestion benefitsrdquo
18 ldquoAuckland City Centre Rail Link Business Case Reviewrdquo report prepared by the NZ Ministry of Transport The
Treasury and NZ Transport Agency dated May 2011
The other major difference was the estimated of productivity gains from job relocation The ACAT submission estimated a benefit of $33 billion compared to $148 million estimated by the MoT review The ACAT estimate was based on 22000 additional full time equivalent jobs relocating to the CBD by 2041 (an increase of 38) in response to the CCRL with relocation producing urban regeneration benefits $33 billion
The Review commented that ldquoestimating additional employment directly attributable to transport infrastructure projects is difficult as there is no established theoretical basis and limited empirical datardquo Given future constraints on transport accessibility into the CBD the Review considered that a maximum of 5000 full-time jobs relocating into the CBD was more likely The review also prescribed a benefit per relocated job which was only one fifth that of ACAT ($30000 compared to $150000 per relocated job in PV terms)
ACAT agreed that the Review had identified and corrected issues with the calculation of transport benefits Towards the end of the review process ACAT presented a new policy case which included revised transport benefits and also an allowance for ldquoefficiency gains in the regional economyrdquo of $13 billion The BCR for the new policy case ranged between 11 and 23 In consideration MoT the appropriate BCR lay in the range 03 to 04 (see Table 2)
Despite rejecting the business case proposal for funding The MoT review that there was a strategic case for ACAT lodging a Notice of Requirement (NoR) to protect the route and proceeding to investigate funding and procurement
45 Wellington lsquoFlyoverrsquo Dispute
Friction has also arisen between Wellington City Council and NZTA over proposals to build a flyover in the heart of the city to grade separate State Highway 1 from the local road network as part of a much larger $3 billion RoNs improvement The flyover was not the preferred option of Wellington City Council who had advocated for a tunnel for city amenity values The City Council changed its stance when NZTA threatened to switch the RoNS funding to other regions and withdraw support and funding for a Light Rail study which had been a key part of the Mayor of Wellingtonrsquos election platform
5 Other Developments
51 Introduction
In this section we look at other recent developments in transport appraisal in NZ Section 52 looks at the current review of the Economic Evaluation Manual and changes in importance on Cost Benefit Analysis Section 53 looks at road tolling and section 54 looks at rail evaluation and section 55 active modes ndash primarily cycling
52 Current Review of the Evaluation Manual amp Emphasis on CBA
A major review of the EEM is currently in progress and is expected to be completed in mid 2013 Inter alia it is likely to include updating of some unit parameter values and to consider changes to the discount rate and extension of the appraisal period for major investments
The move towards lsquomode neutralityrsquo within the economic (and other) procedures in the EEM should continue but may be slow requiring more supporting evidence and research to be undertaken prior to this happening
CBA is likely to remain a component of project planning and decision-making in the future although its role is likely to remain relatively minor compared with what can only be described as a political strategy to develop certain infrastructure projects in particular the Roads of National Significance (RoNS) which have generally low estimated benefit cost ratios and rely on designation as a project of lsquonational significancersquo to warrant funding
Before 2003 CBA the dominant criteria in transport decision making in NZ but today its current importance is much lower Political strategy now leads transport investments with PT systems and road networks likely to replace the current funding focus on RoNS if a significant change in the composition of the central government was to occur
There is no centralised control (such as the national trip end forecasts in the UK) on local demand forecasting in NZ so each region can forecast its own demand levels from first principles This appears to be a significant weakness in the NZ procedures
Predict and provide road based policies currently tend to dominate in NZ with national strategies based on road and parking capacity being increased to rising demand
The Waterview Board of Inquiry process illustrates that once a project has passed the funding scrutiny of NZTA and any associated consultation processes on national and regional funding programmes it needs to be consented The focus of the Board of Inquiries to date has tended to be on how to facilitate the project through appropriate mitigation of its environmental and social impacts At this stage the main focus is whether there is any reason under the RMA (and other consent legislation) why the project cannot proceed
Other noteworthy recent changes to the EEM include the use of variable trip matrix modelling methods when congestion is expected and the allowance for mode-changers to carry over any higher value of travel time associated with their former mode and the introduction of PT attribute values
53 Developments in road tolling
Toll roads have a long but somewhat chequered history in New Zealand The traditional approach has been to toll new bridges (such as the Auckland Harbour Bridge and Tauranga Harbour Bridge) for a period of 30 years to allow for loan repayment and then to remove the toll
Tolling provisions in the LTMA only allow for the tolling of new roads (or new lanes) and there must be a viable free alternative Tolling can only be used for funding to offset the cost of road construction maintenance and operations and not demand management
In recent years only two new toll roads have been opened the Route K in Tauranga financed through a local authority consortium and the Northern Toll Road owned and operated by the NZTA part funded by a Treasury loan and underwritten by the NLTF
A tolling proposal for a major bridge crossing (Tauranga Harbour Bridge duplication) was abandoned in 2005 as a result of a political decision rather than on any economic or financial grounds
The tolling of proposed new schemes under PPP arrangements is still under discussion nationally with the primary objective of enabling schemes to be constructed earlier than would otherwise occur through direct government funding (under a hypothecated transport fund) This argument has been put forward in relation to the funding of the proposed Transmission Gully route a 20 kilometre $NZ 11 billion route out of Wellington which would provide an alternative route (albeit steeply graded one) to a congested section of route on the outskirts of the Wellington region
A study for NZTA by Wallis indicated that relative to the net revenues raised direct user tolls would result in comparatively large reductions in the lsquountolledrsquo scheme economic benefits in many cases of which the Transmission Gully route is one 19 In this case there would appear to be greater economic rationale to toll the existing route in order to encourage heavy vehicles and cars away from the more populated existing corridor and onto the much steeper new route
In at least some cases the revenue stream to the PPP consortium is likely to come from a shadow toll (based on traffic volumes) or a lane availability payment (independent of traffic volumes) rather than through direct user payments These approaches reflect the relatively low traffic volumes and the high diversion potential for some schemes under consideration such as the Wellington Transmission Gully route
54 Rail Evaluation
Rail evaluation issues and procedures are best described in two parts-- for the lsquocommercialrsquo railway and the lsquosocialrsquo railway The former comprises the lsquobelow-railrsquo infrastructure the freight operations (accounting for the major part of rail revenue) and the long-distance passenger operations the latter comprises the urban passenger services in Auckland and Wellington
Almost all rail assets are now publicly owned the central government (through a state owned enterprise SOE) owns the rail network and ownsoperates the freight and long-distance passenger services Regional councils own most of the lsquoabove-railrsquo urban passenger assets and contract out the operation of the services to a private operator (Veolia) in Auckland and to Kiwirail (which is a SOE) in Wellington
The commercial railway operates on an essentially commercial basis with the freight services competing with truck operations and (to a lesser extent) with coastal shipping Potential investments when evaluated by KiwiRail are subject to a financial appraisal and are required to earn typical commercial rates of return (around 20-25 nominal which is well above those used in economic appraisals) Such appraisals are not covered by the EEM
In exceptional cases consideration may be given to other than commercial factors For example for some years there has been controversy about the railwayrsquos proposals to close an under-utilised freight line (Napier-Gisborne) at the extremity of the network serving a largely agriculturalforestry area While the line is currently loss-making and the commercial case for retaining it appears weak there are some arguments in favour of its retention (i) the parallel road route is also being subsidised in terms of its ongoing maintenance etc costs exceeding the road user charges contributed by its traffic and (ii) rail closure would result in
ldquoImplications of Selected Urban Road Tolling Policies for New Zealandrdquo Ian Wallis BAH Land Transport New Zealand Research Report No270 2005
19
net increases in accident and environmental costs in the corridor A number of studies for example BERL20 have attempted to quantify these various impacts of rail closure and the central government has yet to make a decision (which could well be a precedent for other rail lines and services)
The social railway comprises the urban passenger services in Auckland and Wellington These are significant contributors to the overall public transport task in the two cities and over recent years have benefited from a major investment programme largely funded by the central government (direct from Crown funds rather than through the hypothecated NLTF) In the case of Auckland the previous Labour Government enable the regional authority to levy a regional petrol tax (RPT) to fund a suite of transport improvements (mainly rail) costing up to $NZ 750 million No evaluation was made of the dead weight economic loss of the RPT although such a loss is likely to have been low given the low elasticity with respect to fuel price Nevertheless the power to levy a RPT was repealed by the National Government in 2012 and replaced by a higher national petrol tax21
Thus the expectation is that capital and operational funding requirements will be primarily through the NLTF with contributions from regional rates22 As a consequence future rail investment projects will therefore probably use the same EEM procedures as for local bus and ferry services (ie on a PT lsquomode-neutralrsquo basis) A number of rail infrastructure projects have been evaluated using these procedures in recent years and some of these have now been implemented
One example is a NZ$90 million electrification and double tracking of the suburban railway between Paraparaumu and Waikanae including upgrades of both stations23 The project was proposed in 2007 by the Greater Wellington Regional Council and was evaluated using the EEM Volume 2 procedures A BCR over 2 was estimated based on an analysis that featured relatively low generated passenger demand (as a result of the introduction of a new high frequency service in the base case) reliability benefits and the inclusion of only infrastructure costs
Longer distance services that cross regional territorial authority boundaries are treated as lsquocommercialrsquo and cannot attract (up to 50 funding) from the NLTF Two examples of economic CBA studies being undertaken for these types of service are Hamilton to Auckland and Palmerston North to Wellington24 In both these cases BCRs of around 2 were calculated which places the services on a comparable basis with some 100 funded state highway projects
20 BERL ldquoReview of Economics of Napier-Gisborne Rail Linerdquo report to Tairawhiti Environment Centre dated
December 2012
21 An Auckland regional fuel tax scheme was approved for a 2clitre tax from 1
st July 2009 5cl from 2st July 2010
and 95cl from 1st
July 2011 Revenue from this tax would be used to fund $750 million in public transport infrastructure improvements in Auckland $150 million toward the cost of Penlink ( a road link) and to meet the financing costs of Crown borrowing for the $500 million allocated for electrification of the Auckland passenger rail network 22
The Greater Wellington Regional Council is exploring alternative methods of funding Light Rail along the city spinal corridor 23
ldquoRequest for funding of double tracking and electrification from Mackays Crossing to Waikanaerdquo Greater
Wellington Regional Council 2011)
24 ldquoHamilton-Auckland Passenger Rail Service Strategic Assessment and Detailed Evaluation Scopingrdquo
Waikato Regional Council 2011 and ldquoCapital Connection - Palmerston North to Wellington Business Caserdquo Greater Wellington Regional Council dated 2012 and ldquoImplications of Selected Urban Road Tolling Policies for New Zealandrdquo Ian Wallis BAH Land Transport New Zealand Research Report No270 2005
55 Appraisal of active transport strategies and projects
lsquoTransportrsquo projects
Procedures for the economic appraisal of improved walking and cycling facilities (route improvements and lsquospotrsquo improvements) are included in the EEM The manual indicates that appraisal should be undertaken at the package level rather than the individual component level recognising the synergistic effects of related components
The economic appraisal is to be based on the consumer surplus methodology using willingness -to -pay values for time savings (with standard values of time) and for quality improvements (valued using specific surveys or estimates from elsewhere) Each package option is compared with the lsquodo minimumrsquo case BCR estimates are calculated (on a national basis) and packages ranked in national BCR terms
Some guidance is provided on the estimation of demand associated with newimproved facilities while recognising this is a difficult aspect
The economic benefits associated with improved facilities fall into three groups as follows
Mode change benefits-- benefits associated with new walkerscyclists resulting from education promotion and marketing campaigns
Facility user benefits-- comprise travel time savings quality benefits and safety benefits (accounting for lsquosafety in numbersrsquo effects) to existing users of the improved facility Also allows for benefits to new users (based on the lsquorule of a halfrsquo method)
Road traffic reduction benefits-- including lsquodecongestionrsquo parking and environmental benefits
A set of composite benefit values is given in the manual being $260pedestrian km and $130cycle km applied to both existing and new walkerscyclists It is notable that the health benefits account for the great majority of these total composite benefits
While the manual provides a set of simplified procedures for such projects in practice these are still reasonably complex in the context of the nature and the relatively low cost of the schemes being appraised
Recreational projectsmdashthe National Cycleway
The EEM procedures described above are intended for use in the appraisal of lsquotransportrsquo projects for which the major benefit is typically time savings sand which are funded through the NZTA from the National land Transport fund lsquoRecreationalrsquo projects such as the National cycleway scheme are funded separately through the Ministry of Tourism and hence not subject to the same economic appraisal procedures
The National Cycleway proposal together with completion of the Te Araroa walkway the length of NZ was put forward by the Prime Minister John Key at a jobs summit in 2008 Under the plan $50 million would be spent to employ 4000 people to build the cycleway The cycleway was to be paid out of Ministry of Tourism funds (this department was headed by the Prime Minister) Thus EEM procedures were not required to justify NTLF funding
The original proposal for the cycleway effectively paralleled state highways from Bluff at the bottom of the south island to Kaitaia at the top of the north island However this ambitious proposal was soon replaced by a linking up of existing cycle ways and routeing any new links via smaller communities From an evaluative perspective the emphasis has been in choosing between alternative links put forward by local authorities Any formalised methodology that may have been developed to decide between and prioritise alternative proposals has not been disclosed indications are that any methodology will put more emphasis on job creation (particularly in remote areas) and encouragement of tourism than on lsquoconventionalrsquo transport benefits
6 Areas of NZ Research in Project Evaluation
61 Wider Economic Benefits
There has been growing unease that transport CBAs are not fit for purpose for assessing major transport investments in high growth areas such as Auckland Ignoring induced changes from transport improvements to regional population economic activity and land uses is a major disconnect between the problems high growth areas face and the value for money measures of infrastructure CBAs It is hoped that research in NZ will enable these broader economic development effects to be incorporated into CBAs
Agglomeration benefits have been included in the Economic Evaluation Manual (EEM) since 2008 with subsequent updates taking account locally estimated agglomeration elasticities (Mare and Graham 2009) and research to develop WEB methodologies in the NZ context (Kernohan and Rognlien 2011) Unlike other sources of wider economic benefits (WEBs) agglomeration benefits can be included in the headline benefit-cost ratio (BCR) because the methodology has been approved by the NZTA Board
Nevertheless issues that have arisen with agglomeration benefit estimation One is that the results of the method seem sensitive to whether a transport modelrsquos origin-destination outputs are aggregated across zones or not Analysis has shown that the more zones are aggregated the lower the agglomeration benefits (possibly over 50 smaller) 25 This is concerning in terms of accuracy of forecasts consistency between appraisals and the level of guidance in the EEM
Another issue is that the procedure is weak in its treatment of transport-induced land use change Agglomeration is a phenomenon related to people changing locations to be closer to each other However in practical applications of the agglomeration procedure the number of people working in each industry sector in each zone is held fixed at any period in time and the procedure seeks to measure changes in lsquoeffective densityrsquo from altered transport costs This high degree of rigidity may lead to only a partial reflection of the effects of transport on agglomeration economies in the measurements
The procedure superficially permits changing numbers of workers in each modelled zone but it is not refined enough to measure the externalities on other workersrsquo productivity If land use changes (ie the changes to the level of employment per zone) were factored into the
25 For instance NZIER used the full 512 zones of the Auckland model for several Auckland projects whereas
Kernohan and Rognlien 2011 took the initiative to aggregate zones to ~110 in their review of one of the projects NZIER appraised
analysis then there is a question of whether this lack of refinement in the procedure could lead to overestimation of agglomeration benefits of transport schemes
There are three other sources of WEBs for which Kernohan and Rognlien have developed methodologies in line with the UK DfTrsquos approach but which are not approved NZTA policy as at March 2013 (i) imperfect competition (increasing output to industries that have a price-cost mark-up above factor costs) (ii) increased labour supply and (iii) movement to moreless productive jobs The latter two sources relate to induced traffic effects that benefits government through tax receipts not captured in transport willingness to pay measures Although not yet approved the benefits from these three other sources of WEBs have been estimated for some NZ transport schemes as sensitivity analyses
A second area of concern regarding WEBs is induced traffic New Zealand transport modelling does not normally model new journeys and particularly not those from longer-term impacts such as changing employment Thus assessing the wider benefits from these effects may be biased because congestion externality costs and other Wider Economics Costs (WECs) are omitted
New Zealand practice is to treat the three major sets of inputs to transport models (economic activity population and locations) as exogenous In other words transport schemes are assumed to have no effect on land use However there is a growing evidence to say that transport schemes do have a marked impact on land use development in the long-term and that the induced traffic effects can be a primary long-term characteristic of major transport schemes Given the potential relevance of transport-induced land use change it is a strong assumption to ignore it in transport CBAs
However one cannot point at any single local authoritative source of transport appraisal guidance that overtly recommends that induced land use change be ignored26 The Australian Transport Council (of which NZTA is a member) National Guidelines (2006) do not discuss transport-induced land use change
NZTA has commissioned pieces of work to understand the broader economic development impacts of transport investment One study has reviewed actual evidence of land use change in response to transport investment to inform project appraisal forecasts27 Another current study being undertaken by NZIER is attempting to generalise the lsquorule of a halfrsquo measure to account for the induced total change in social surplus from shifting short-run demand schedules
62 Value of time savings for multi-occupant light vehicle travellers
A current NZTA project involves primary market research (using contingent valuation methods) into the valuation of time savings for drivers and passengers (individually and as a group) in cars and other light vehicles being used for non-business purposes
Initial market research has identified that individuals often express different values when travelling as driver or passenger that adult values are often strongly influenced (positively or negatively) by the presence of children and that values of drivers and passengers often
26 The closest advice that can be found in the NZTArsquos EEM is in section 215 lsquoEvaluating congested networks and
induced traffic effectsrsquo The discussion in that section is not about the determinants of demand per se but on forecasts of the lsquotrip matrixrsquo in the presence of very high levels of congestion The advice appears to leave much to lsquoprofessional judgementrsquo27
ldquoThe economic and land use impacts of transformational transport investmentrdquo(Williamson Philbin Sanderson 2012
appear to be non-additive (eg when faced by the alternatives of choosing a tolled or non-tolled route)
If successful it is anticipated that the project could make a useful contribution to the international understanding of valuations of time savings by carlight vehicle users individually and as a group
63 Non-linearity of (commuter) time savings
A recent market research project (OrsquoFallon amp Wallis 2012) involved an online survey into commutersrsquo attitudes to their time spent travelling tofrom work including how they spent this time and their attitudes to increasing or decreasing their commuting time Findings included (i) most people had an ideal commute time of around 15- 20 minutes (one-way) (ii) a minimum commute time of around 10 minutes was seen as preferable by most people as this allows for their mental transition between home and work (iii) these people would generally ascribe little or no value to any time savings below this 10 minutes threshold (iv) people tend to think about time savings in 5-minute units indicating that small time savings would be seen as having relatively low value
64 Economic appraisal of PT fares service levels and subsidies
In 2012 NZTA commissioned a study (Allison et al 2013) to develop and apply a model to assess the economic effects of changes in fares service levels and associated subsidycost recovery policies in the main urban centres in New Zealand The model has built on earlier work of Glaister amp Lewis (as applied in London and the GB METS model) and more recent work of Parry amp Small The model can be used to (i) assess the optimum fare service level and subsidy for any market segment (eg peak period work trips) and (ii) examine the impacts of incremental changes in fares service levels etc It is envisaged that one of the main uses of the model will be in the development of appropriate cost recovery levels in the main centres of NZ
65 PT Option amp Non-use Values
Building on the rather limited international (mainly UKEU) previous research on this topic primary market research was undertaken in NZ in 201011 to investigate the economic concepts of option values and non-use values as applied to public transport services in particular for areas with low levels (or no) PT services (Wallis I amp Wignall D 2012) Telephone-based surveys of a random sample of households were undertaken in four communities within the outer catchment area of major urban centres Contingent valuation methods were used to establish household willingness-to-pay for the provision of enhanced public transport services tofrom the nearest main centre and to estimate the various components (consumer surplus option value non-use value) of the overall willingness-toshypay value Recommendations were made on appropriate optionnon-use values per household for use in economic appraisal of public transport projects in New Zealand (these have yet to be incorporated into EEM)
66 Parameter values for public transport economic appraisal
The EEM evaluation is currently being updated One input to the update is a review of Australian and New Zealand studies conducted over the last 20 years (mostly using stated
preference methods) into the value of PT user time (including access in vehicle transfers etc) and reliability28 For the value of travel time saving (VTTS) the review has found that over the 20 year period the VTTS has increased relatively more than the increase in the CPI average wage rates and hourly GDP per head (GDPPhr)29 For GDPPhr the VTTS increased from around 25 in 1992 to around 40 in 2012 This result has implications for EEM assumptions regarding how future VTTS should be forecast both nominally and in real terms In this regard the current EEM assumes VTTS to remain constant in real terms over the project evaluation period
67 Deriving Service Quality Values through linked SP amp Rating Surveys
NZTA commissioned Douglas Economics in 2011 to undertake market research to investigate passengers Willingness to Pay (WTP) for quality improvements in bus and rail services A hybrid Passenger Rating Stated Preference approach has been developed with a large scale self-completion questionnaire survey of Christchurch Wellington and Auckland bus and rail users The passenger ratings of vehicle and infrastructure quality attributes will be explained in terms of objective bus and train vehicle data and bus stop and rail station features The Stated Preference survey will provide WTP values for changes in quality ratings measured relative to changes in onboard travel time and fare
7 Conclusions
For a country with a small population New Zealand has a detailed well-developed Economic Evaluation Manual intended for the economic appraisal of all types of transport investment (and divestment) projects The Manual grew out of what was originally a manual covering road projects only and remains today more detailed on road aspects than for public transport The manual is updated more-or-less continuously through an ongoing programme of research into best practices
Some 10 years ago benefit cost ratios resulting from economic appraisal were the primary means of ranking and selecting projects for funding Since then economic appraisal has become relatively less important being only one criterion in a multi-criteria assessment In the near term CBA may increase in importance with the requirement for lsquorobust and thorough cost benefit analysisrsquo in proposed Resource Management legislation
Current NZ project decision procedures involve two main stages that may occur in parallel a funding decision by the funding authority (NZTA) board and a public hearing process to assess any adverse environmental effects of the scheme and ways in which it is intended to mitigate these Unlike in the UK there is no single public hearing process at which all aspects of the scheme and the trade-offs between them are considered
The primary focus of the EEM has been on economic appraisal methods and associated parameter values The value of time parameter values are purpose and mode specific rather than following the lsquoequityrsquo value approach adopted in the UK and some other
28 Ian Wallis amp Associates (2013) ldquoLiterature Review of Evaluation Parametersrdquo Working Paper 2 (2013) draft
report to NZTA by Ian Wallis and Neil Douglas
29 Gross Domestic Product divided by population divided by 2000 hours (2000 being the standard
number of hours used to convert average annual earnings to hourly)
countries EEM has lesser coverage (eg compared with WebTAG) of the demand forecastingmodelling aspects which provide key inputs to appraisal
The NZ development and application of methods to assess the lsquowider economic benefitsrsquo of transport schemes remains very much a work-in-progress Procedures for estimating agglomeration benefits are now included in EEM but have proved difficult to apply in practice as not all of NZ is covered by transport models sufficiently robust for calculating these benefits Estimates for the other WEB aspects (including land-use aspects) have been made recently for some major schemes but the results have been highly controversial and subject to very wide levels of uncertainty Research and development in this area is continuing influenced by and building on UK developments
CBA methods in NZ as set out in the EEM have been used predominantly to appraise infrastructure-oriented schemes (whether for road or PT improvements) They are also now being used to a lesser extent for appraising PT service changes (eg frequency improvements) Research is currently in progress to extend the procedures to optimise PT fares service levels and subsidy levels within metropolitan areas (on lines broadly similar to the British 1980rsquos METS studies)
In major urban areas such as Auckland Wellington and Christchurch there has been a long term move towards multimodal programme appraisal using transport and land use scenario testing in conjunction with the Better Business Case approach CBA will continue to play an important role in supporting both programme and project appraisal within that wider assessment appraisal framework The focus of the Better Business Case framework is to first identifying the problems and opportunities before jumping to particular solutions whether it be road solutions or public transport solutions In practice in urban areas there will be a need for a multimodal mix of investment combined with complementary network and demand management measures
References
Allison N Lupton D amp Wallis I (2013) ldquoDevelopment of a Public Transport Investment Modelrdquo NZ Transport Agency research report
Beca Carter (2002) ldquoProject Evaluation Benefit Parameter Valuesrdquo Beca Carter Hollings amp Ferner in association with SDG Forsyte Research Brown Copeland amp Co report to Transfund April 2002
Brennand T Wallbran W ldquoCase Studies of Two Alternative to Roading Projectsrdquo NZIHT 2004 David Simmonds Consultancy and John Bates Services (2001) ldquoAppraisal in land usetransport interaction designrdquo Report to Government Office for the North-West GWRC ldquoCapital Connection -Palmerston North to Wellington Business Caserdquo Greater Wellington Regional Council dated 2012 Hensher D Truong T Mulley C and Ellison R (2012) ldquoAssessing the wider economy impacts of transport infrastructure investment with an illustrative application to the north-west rail link project in Sydney Australiardquo ITSL Working Paper ITLS-WP-12-05 Kernohan D and L Rognlien (2011) ldquoWider economic impacts of transport investments in New Zealandrdquo NZ Transport Agency research report 448
Mare D and Graham D (2009) ldquoAgglomeration elasticities in New Zealandrdquo NZ Transport Agency research report 367 NZIER (forthcoming) ldquoAppraising transport strategies that induce land use changes Estimating benefits of long-term land use change from standard transport model outputsrdquo NZIER public good funded research NZ MOT (2009) rdquoUnderstanding Transport Costs and Charges Phase 2 ndash Social and environmental costs ndash A literature Reviewrdquo Report by Financial amp Economic Analysis Team Ministry of Transport November 2009 NZ MOT (2011) ldquoAuckland City Centre Rail Link Business Case Reviewrdquo report prepared by the NZ Ministry of Transport The Treasury and NZ Transport Agency dated May 2011
OrsquoFallon C and Wallis I (2012) ldquoA wider look at how travellers value the quality and quantity of travel timerdquo NZ Transport Agency research report 469 128pp
PCIE (1996) ldquoA Comparison of Evaluation Methods for Alternatives to Roadingrdquo Report to Transit New Zealand by PCIE March 1996
SAHA (2010) ldquoRoads of National Significance Economic Assessments Reviewrdquo report by SAHA to NZTA dated July 2010
Wallis I (2005) ldquoImplications of selected urban road tolling policies for New Zealandrdquo Land Transport New Zealand Research Report No 270
Wallis I (2005) ldquoImplications of Selected Urban Road Tolling Policies for New Zealandrdquo Ian Wallis BAH Land Transport New Zealand Research Report No270 2005 Wallis IP and Don Wignall (2012) ldquoThe benefits of public transport ndash option values and non-use valuesrdquo NZ Transport Agency research report 471 148pp
Ian Wallis amp Associates (2013) ldquoLiterature Review of Evaluation Parametersrdquo Working Paper 2 (2013) draft report to NZTA by Ian Wallis and Neil Douglas
Williamson J Philbin S Sanderson K (2012) ldquoThe economic and land use impacts of transformational transport investmentrdquo NZ Transport Agency research report 479 WRC (2011) ldquoHamilton-Auckland Passenger Rail Service Strategic Assessment and Detailed Evaluation Scopingrdquo Waikato Regional Council 2011
28
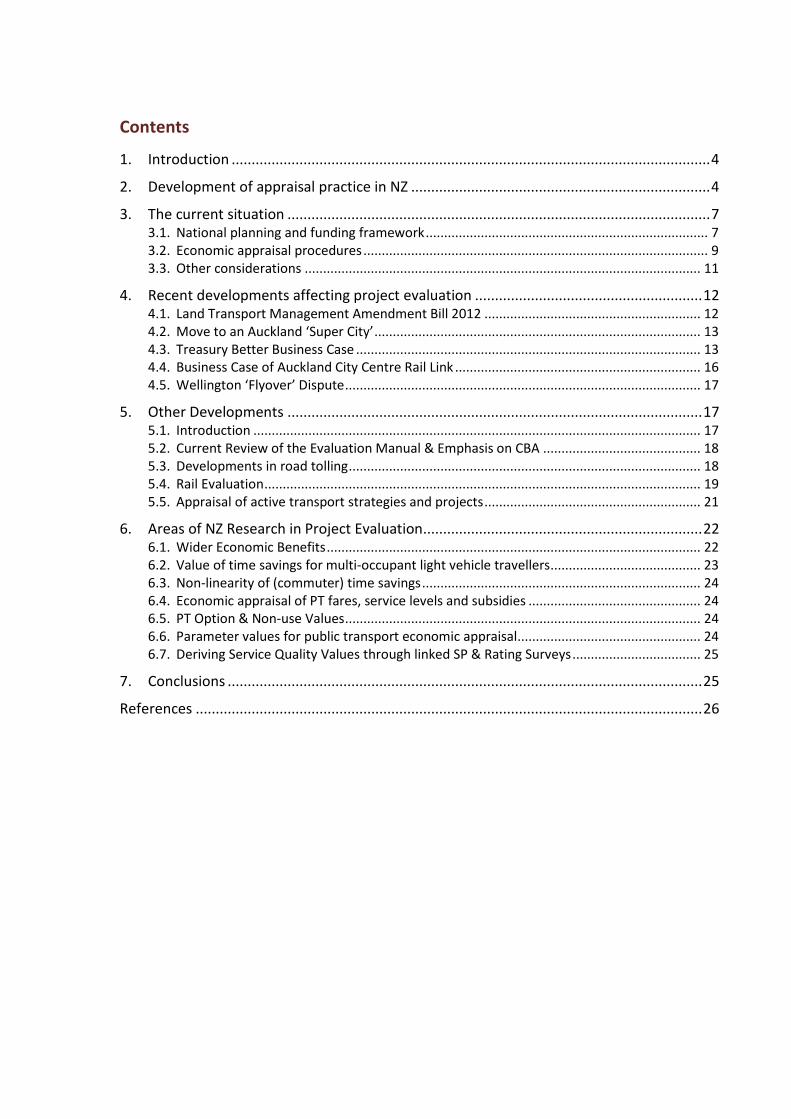
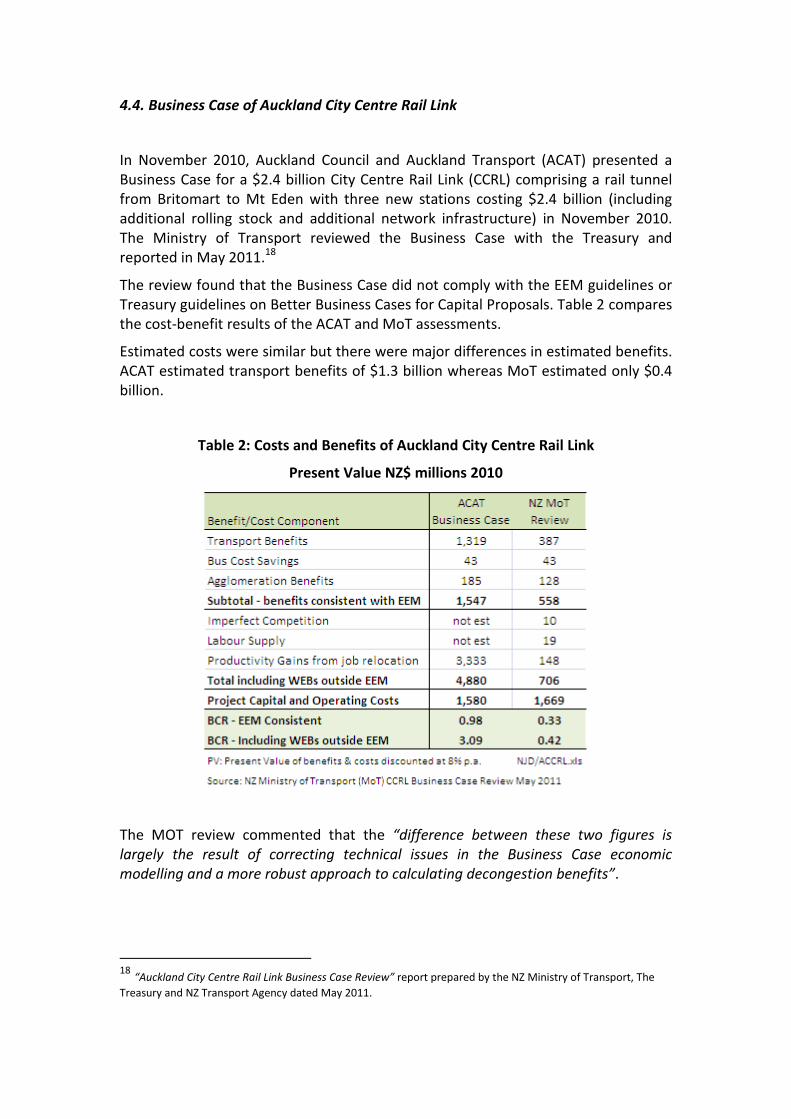

28