Embed Size (px)
Citation preview
1
International Carbon Footprint Report2017 Financial Year
2 Carbon footprint Report
List of AbbreviationsCO2 Carbon dioxideCO2eq Carbon dioxide equivalents FY Financial yearK BG Kaufland BulgariaK CZ Kaufland Czech RepublicK DE Kaufland GermanyK HR Kaufland CroatiaK INT Kaufland InternationalKKV Kälte-Klima-Verbund
(combined refrigeration and air conditioning)K PL Kaufland PolandK RO Kaufland RomaniaK SK Kaufland SlovakiaOCI Omnichannel/delivery servicePV PhotovoltaicsSF ShippingGHG Greenhouse gasesSAA Sales and ancillary area
3
CONTENTS
Contents
Summary ................................................................................................................................................................................................................................................... 4
Introduction .............................................................................................................................................................................................................................................6
1. Overview of Results Kaufland International ............................................................................................................................................................7
2. Detailed Results in accordance with Emissions Sources in a Comparison of Countries 2.1 Electricity .....................................................................................................................................................................................................................................8 2.2 Heating .......................................................................................................................................................................................................................................10 2.3 Refrigerants ............................................................................................................................................................................................................................12 2.4 Transport ..................................................................................................................................................................................................................................15 2.4.1 Transport Store Logistics ..........................................................................................................................................................................................16 2.4.2Transport Procurement Logistics ......................................................................................................................................................................... 17 2.4.3 Transport Distribution Customer Newspaper............................................................................................................................................19 2.4.4 Transport OCI Omnichannel ...............................................................................................................................................................................20
2.5 Paper ............................................................................................................................................................................................................................................21 2.5.1 Paper Customer Newspaper .................................................................................................................................................................................22 2.5.2OfficePaper ...................................................................................................................................................................................................................24
3. Reference Values .........................................................................................................................................................................................................................25
4. Emission Factors ..........................................................................................................................................................................................................................26
5. Recalculations ............................................................................................................................................................................................................................... 27
6. Scopes and Limits of the Carbon footprint Report .........................................................................................................................................28
4 Carbon footprint Report
Kaufland INT
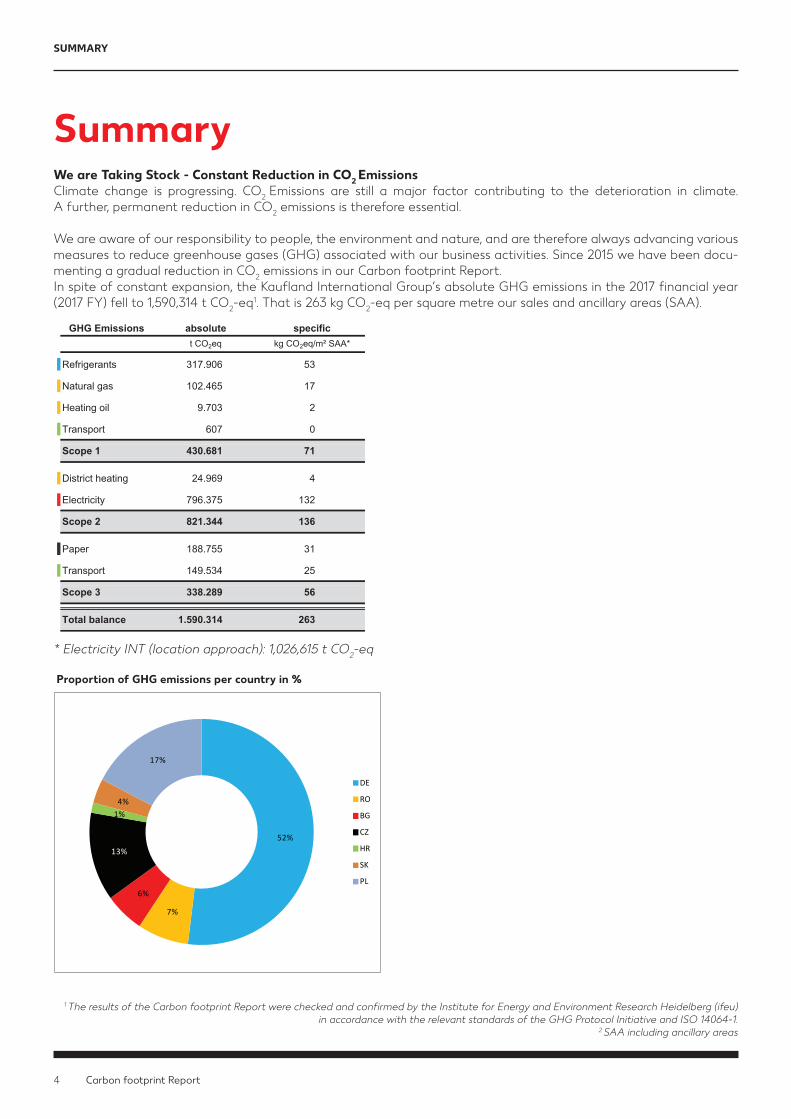
GHG Emissions absolute specifict CO2eq kg CO2eq/m² SAA*
Refrigerants 317.906 53
Natural gas 102.465 17
Heating oil 9.703 2
Transport 607 0
Scope 1 430.681 71
District heating 24.969 4
Electricity 796.375 132
Scope 2 821.344 136
Paper 188.755 31
Transport 149.534 25
Scope 3 338.289 56
Total balance 1.590.314 263
CSR
We are Taking Stock - Constant Reduction in CO2 EmissionsClimate change is progressing. CO2 Emissions are still a major factor contributing to the deterioration in climate. A further, permanent reduction in CO2 emissions is therefore essential.
We are aware of our responsibility to people, the environment and nature, and are therefore always advancing various measures to reduce greenhouse gases (GHG) associated with our business activities. Since 2015 we have been docu-menting a gradual reduction in CO2 emissions in our Carbon footprint Report. Inspiteofconstantexpansion,theKauflandInternationalGroup’sabsoluteGHGemissionsinthe2017financialyear(2017 FY) fell to 1,590,314 t CO2-eq1. That is 263 kg CO2-eq per square metre our sales and ancillary areas (SAA).
Proportion of GHG emissions per country in %
SUMMARY
* Electricity INT (location approach): 1,026,615 t CO2-eq
Summary
1 The results of the Carbon footprint Report were checked and confirmed by the Institute for Energy and Environment Research Heidelberg (ifeu)in accordance with the relevant standards of the GHG Protocol Initiative and ISO 14064-1.
2 SAA including ancillary areas
52%
7%
6%
13%
1%4%
17%
DE
RO
BG
CZ
HR
SK
PL

5
-
50
100
150
200
250
300
350
2015 FY 2016 FY 2017 FY
Specific GHG Emissions K INT in t CO2eq/m²
Transport
Paper
Electricity
Heating
Refrigerants
- 6.8%
- 3.4%
- 6.8%
- 3.4%
- 6.8%
- 3.4%
- 6.8%
- 3.4%
SUMMARY
Since2015,wehavealreadyachievedaspecificCO2 reduction of around 10%. This has been done by several methods. They include the successive conversion of the stores to LED lighting, the introduction of an energy management sys-tem, the use of climate-neutral refrigerants, ongoing optimisation of transport routes and capacity utilisation in trans-portlogisticsaswellastheuseofcombinedrefrigerationandairconditioning.Thisiswherethestores’heatingandventilation technology is connected to the refrigeration unit that generates the cold for the refrigerators. The waste heatfromthecentralrefrigerationunitcanthusbeusedtoheatthestoreviaanindustrialunderfloorheatingsystem.When the outdoor temperatures are high, the system can be used to cool the store. As a result, stores manage without a conventional heating system and are thus independent of fuels such as oil, gas or wood.
To be able to achieve even more CO2 savings in future, we want to focus even more on the areas of energy and re-frigeration.Forexample,bytheendof2021,atleast5%ofthestoresinGermanyaretobefittedwithphotovoltaicsystems.
The Carbon footprint Report is drawn up once a year following the standards of the GHG Protocol Initiative and ISO 14064-1. Its declared goal is to reduce emissions.
The Carbon footprint Report broadly describes the emissions harmful to the climate that are caused directly or in-directlybyacompany’sbusinessactivities.Emissionsthathaveanimpactontheenvironment, includeinparticulargreenhouse gases, which, alongside carbon dioxide (CO2), include other gases, such as methane or nitrous oxide. Con-version of the various greenhouse gases into CO2-equivalents (CO2-eq) indicate how much the gas concerned con-tributestothegreenhouseeffect.AspartoftheCarbonfootprintReportatKaufland,theseareemissionsfromtheconsumption of electricity, the burning of fossil fuels to heat our locations and escaped refrigerants, as well as other indirectemissionsfromtransportlogisticsandtheuseofpaperinadvertisingmaterialsorintheoffice.
Specific GHG emissions K INT in t CO2-eq/m2
6 Carbon footprint Report
Introduction
What is a Carbon footprint Report?The Carbon footprint Report broadly describes the emis-sions harmful to the climate that are caused by a compa-ny’sbusinessactivities.Emissionsthathaveanimpactonthe environment, include in particular greenhouse gas-es, which, alongside carbon dioxide, include other gases, such as methane or nitrous oxide. These are converted into carbon dioxide and represented as CO2 equivalents (CO2-eq). The CO2-equivalents indicate how much the gas concerned contributes to the greenhouse effect. Thisresultsinauniformreferencevalue.Thefirstinter-national Carbon footprint Report for K INT was drawn up for the 2015 FY, which thus acts as the base year.
Why does Kaufland Draw up a Carbon footprint Report?With the introduction of the new EU directive on the requirement to submit a sustainability report and its in-corporation into national law, Kaufland Slovakia is re-quired to report publicly on major CSR activities from the 2017 FY onwards. Selected key climate data is part of a general CSR report. The Carbon footprint Report should support the countries required to report, and those re-porting voluntarily, with the key data obtained. The goal is to reduce emissions. Moreover, there are voluntary un-dertakingsspecifictoindividualcountries(e.g.“LeanandGreen”), on the basis of which selected key date relevant to climate protection has to be collected and published.
How Significant is a Carbon footprint Report?The significance of the greenhouse gas emissions ex-pressedinabsolutefiguresisverylimited.Thesefiguresonlybecomesignificantwhentheyareplacedinatimeorcontentcontext.Inrespecttotime,thefigurescanbecompared with the previous year 2016 and the base year 2015. However, a rise in greenhouse gas emissions can always be due to company growth. To discount these effects, the absolute emissions were placed in relation to the sales/ancillary area (m2VKF)(specificemissions).
How is the Carbon footprint Report Quality Assured?In terms of content, the key data was quality assured and approved by the relevant divisions and controlling. As far as the methodology is concerned, the Carbon footprintReportforthe2017FYwasalsoverifiedbytheInstitute for Energy and Environment Research (ifeu). Verificationcomprisesreviewingandensuringthetrans-parency of the procedure and plausibility of the Carbon footprintReportsidentifiedandreportedinaccordancewith the standards of the GHG Protocol Initiative and ISO 14064-1.
Why are there Recalculations?The values from the 2015 FY and 2016 FY were recalcu-lated. The reasons for the recalculations include: ■ Changedscientificfindingsleadtoupdatedemis-
sion factors ■ Data was transmitted with errors ■ Balance sheet items are omitted because of their
insignificance, ensuring comparability across theyears
External Audit of the Carbon footprint ReportThe results of the INT 2017 Carbon footprint Report were reviewedand confirmedby ifeuHeidelberg in accord-ance with the standards of the GHG Protocol Initiative and ISO 14064-1.
INTRODUCTION
7
1. Overview of Results Kaufland International
GHG Emissions K INT in accordance with Scopes
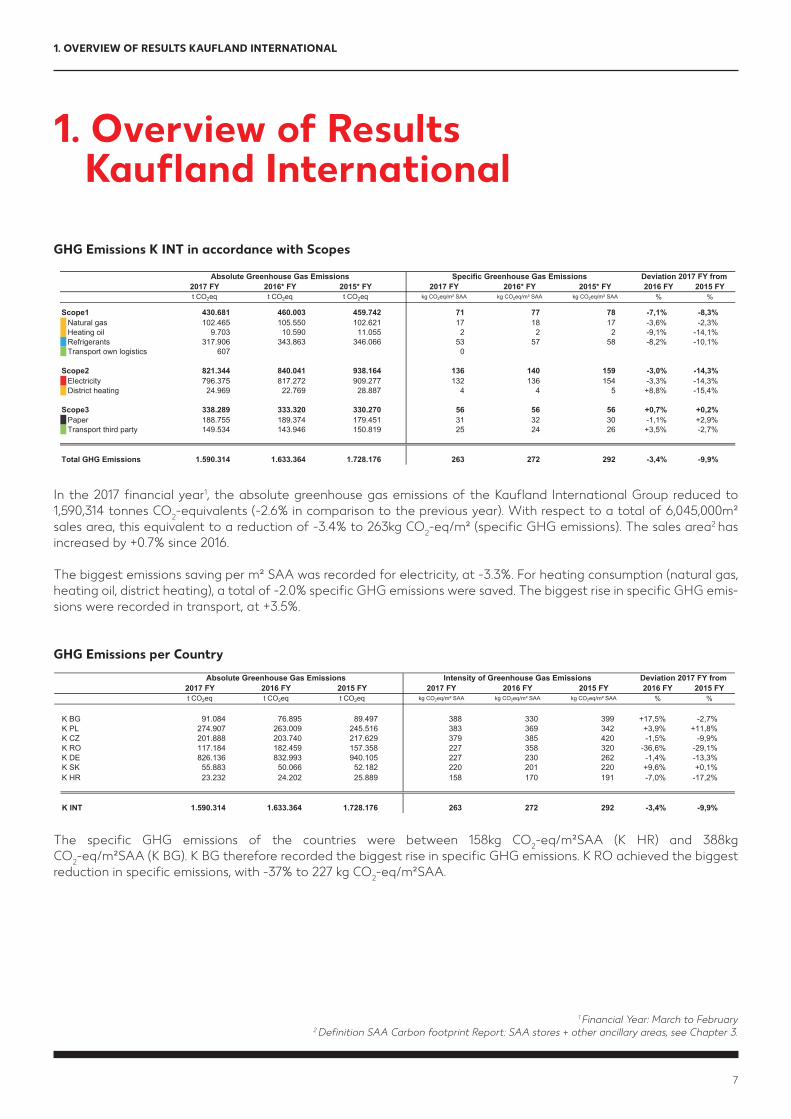
Inthe2017financialyear1, theabsolutegreenhousegasemissionsoftheKauflandInternationalGroupreducedto1,590,314 tonnes CO2-equivalents (-2.6% in comparison to the previous year). With respect to a total of 6,045,000m² sales area, this equivalent to a reduction of -3.4% to 263kg CO2-eq/m²(specificGHGemissions).Thesalesarea
2 has increased by +0.7% since 2016.
The biggest emissions saving per m² SAA was recorded for electricity, at -3.3%. For heating consumption (natural gas, heatingoil,districtheating),atotalof-2.0%specificGHGemissionsweresaved.ThebiggestriseinspecificGHGemis-sions were recorded in transport, at +3.5%.
GHG Emissions per Country
The specific GHG emissions of the countries were between 158kg CO2-eq/m²SAA (K HR) and 388kg CO2-eq/m²SAA(KBG).KBGthereforerecordedthebiggestriseinspecificGHGemissions.KROachievedthebiggestreductioninspecificemissions,with-37%to227kgCO2-eq/m²SAA.
1 Financial Year: March to February2 Definition SAA Carbon footprint Report: SAA stores + other ancillary areas, see Chapter 3.
1. OVERVIEW OF RESULTS KAUFLAND INTERNATIONAL
2017 FY 2016* FY 2015* FY 2017 FY 2016* FY 2015* FY 2016 FY 2015 FYt CO2eq t CO2eq t CO2eq kg CO2eq/m² SAA kg CO2eq/m² SAA kg CO2eq/m² SAA % %
Scope1 430.681 460.003 459.742 71 77 78 -7,1% -8,3%Natural gas 102.465 105.550 102.621 17 18 17 -3,6% -2,3%Heating oil 9.703 10.590 11.055 2 2 2 -9,1% -14,1%Refrigerants 317.906 343.863 346.066 53 57 58 -8,2% -10,1%Transport own logistics 607 0
Scope2 821.344 840.041 938.164 136 140 159 -3,0% -14,3%Electricity 796.375 817.272 909.277 132 136 154 -3,3% -14,3%District heating 24.969 22.769 28.887 4 4 5 +8,8% -15,4%
Scope3 338.289 333.320 330.270 56 56 56 +0,7% +0,2%Paper 188.755 189.374 179.451 31 32 30 -1,1% +2,9%Transport third party 149.534 143.946 150.819 25 24 26 +3,5% -2,7%
Total GHG Emissions 1.590.314 1.633.364 1.728.176 263 272 292 -3,4% -9,9%
Absolute Greenhouse Gas Emissions Specific Greenhouse Gas Emissions Deviation 2017 FY from
2017 FY 2016 FY 2015 FY 2017 FY 2016 FY 2015 FY 2016 FY 2015 FYt CO2eq t CO2eq t CO2eq kg CO2eq/m² SAA kg CO2eq/m² SAA kg CO2eq/m² SAA % %
K BG 91.084 76.895 89.497 388 330 399 +17,5% -2,7%K PL 274.907 263.009 245.516 383 369 342 +3,9% +11,8%K CZ 201.888 203.740 217.629 379 385 420 -1,5% -9,9%K RO 117.184 182.459 157.358 227 358 320 -36,6% -29,1%K DE 826.136 832.993 940.105 227 230 262 -1,4% -13,3%K SK 55.883 50.066 52.182 220 201 220 +9,6% +0,1%K HR 23.232 24.202 25.889 158 170 191 -7,0% -17,2%
K INT 1.590.314 1.633.364 1.728.176 263 272 292 -3,4% -9,9%
Absolute Greenhouse Gas Emissions Intensity of Greenhouse Gas Emissions Deviation 2017 FY from
8 Carbon footprint Report
2017 FY 2016 FY 2015 FY 2017 FY 2016 FY 2015 FY 2016 FY 2015 FYthousand Unit thousand Unit thousand Unit Unit/m² SAA Unit/m² SAA Unit/m² SAA Unit/m² SAA Unit/m² SAA
INT 2.223.147 2.139.493 2.159.022 368 357 365 +3,1% +0,8%BG 95.494 98.264 95.100 406 421 423 -3,6% -4,0%CZ 223.778 231.467 231.845 420 437 448 -3,9% -6,2%DE 1.292.139 1.203.979 1.243.852 355 332 346 +6,7% +2,5%HR 53.168 51.682 49.418 362 363 364 -0,4% -0,7%PL 245.517 248.302 242.371 342 348 338 -1,7% +1,2%RO 214.897 208.962 201.490 416 410 410 +1,5% +1,5%SK 98.155 96.837 94.946 386 388 400 -0,5% -3,3%
INT 573 0 - -BG - - - -CZ 31 0 - -DE 541 0 - -HR - - - -PL - - - -RO - - - -SK - - - -
Absolute Energy Consumption Specific Energy Consumption Deviation 2017 FY from
Electricity total(Unit in kWh)
Electricity from photovoltaics(Unit in kWh)
2. Detailed results according toEmission sources and countries2.1 Electricity
GHG Emissions Electricity in CO2-eq
Energy consumption
Weighted emissions factors from the electricity mix per country in kg CO2/kWh
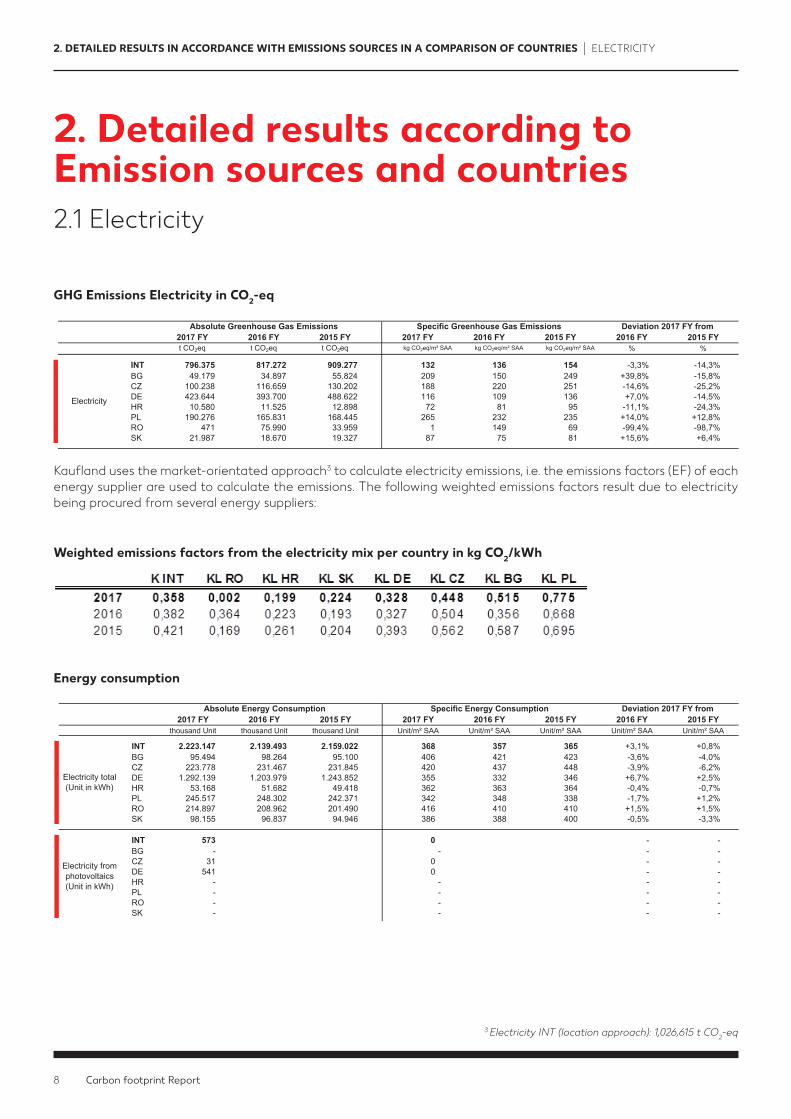
Kauflandusesthemarket-orientatedapproach3 to calculate electricity emissions, i.e. the emissions factors (EF) of each energy supplier are used to calculate the emissions. The following weighted emissions factors result due to electricity being procured from several energy suppliers:
2. DETAILED RESULTS IN ACCORDANCE WITH EMISSIONS SOURCES IN A COMPARISON OF COUNTRIES | ELECTRICITY
3 Electricity INT (location approach): 1,026,615 t CO2-eq
2017 FY 2016 FY 2015 FY 2017 FY 2016 FY 2015 FY 2016 FY 2015 FYt CO2eq t CO2eq t CO2eq kg CO2eq/m² SAA kg CO2eq/m² SAA kg CO2eq/m² SAA % %
INT 796.375 817.272 909.277 132 136 154 -3,3% -14,3%BG 49.179 34.897 55.824 209 150 249 +39,8% -15,8%CZ 100.238 116.659 130.202 188 220 251 -14,6% -25,2%DE 423.644 393.700 488.622 116 109 136 +7,0% -14,5%HR 10.580 11.525 12.898 72 81 95 -11,1% -24,3%PL 190.276 165.831 168.445 265 232 235 +14,0% +12,8%RO 471 75.990 33.959 1 149 69 -99,4% -98,7%SK 21.987 18.670 19.327 87 75 81 +15,6% +6,4%
Absolute Greenhouse Gas Emissions Specific Greenhouse Gas Emissions Deviation 2017 FY from
Electricity
9
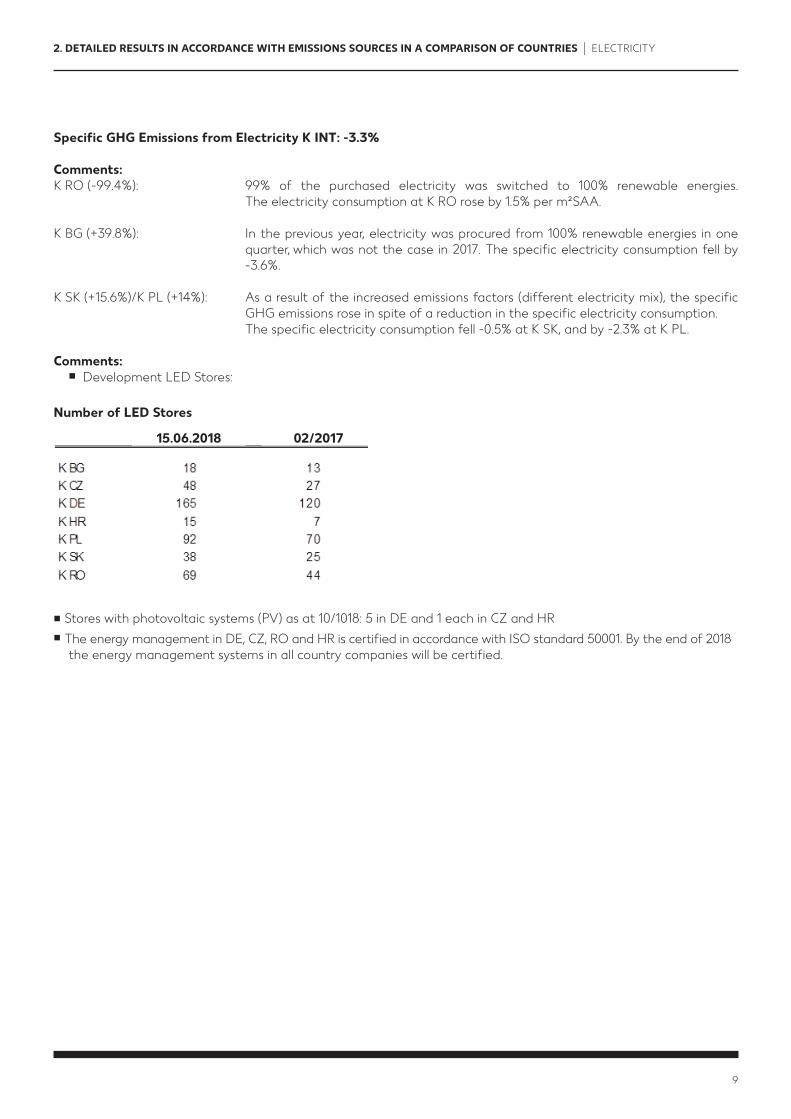
Specific GHG Emissions from Electricity K INT: -3.3%
Comments:K RO (-99.4%): 99% of the purchased electricity was switched to 100% renewable energies. The electricity consumption at K RO rose by 1.5% per m²SAA.
K BG (+39.8%): In the previous year, electricity was procured from 100% renewable energies in one quarter,whichwasnotthecasein2017.Thespecificelectricityconsumptionfellby-3.6%.
KSK(+15.6%)/KPL(+14%): Asaresultoftheincreasedemissionsfactors(differentelectricitymix),thespecificGHGemissionsroseinspiteofareductioninthespecificelectricityconsumption.Thespecificelectricityconsumptionfell-0.5%atKSK,andby-2.3%atKPL.
Comments: ■ Development LED Stores:
■ Stores with photovoltaic systems (PV) as at 10/1018: 5 in DE and 1 each in CZ and HR ■ TheenergymanagementinDE,CZ,ROandHRiscertifiedinaccordancewithISOstandard50001.Bytheendof2018
theenergymanagementsystemsinallcountrycompanieswillbecertified.
2. DETAILED RESULTS IN ACCORDANCE WITH EMISSIONS SOURCES IN A COMPARISON OF COUNTRIES | ELECTRICITY
Number of LED Stores
15.06.2018 02/2017
10 Carbon footprint Report
2017 FY 2016 FY 2015 FY 2017 FY 2016 FY 2015 FY 2016 FY 2015 FYt CO2eq t CO2eq t CO2eq kg CO2eq/m² SAA kg CO2eq/m² SAA kg CO2eq/m² SAA % %
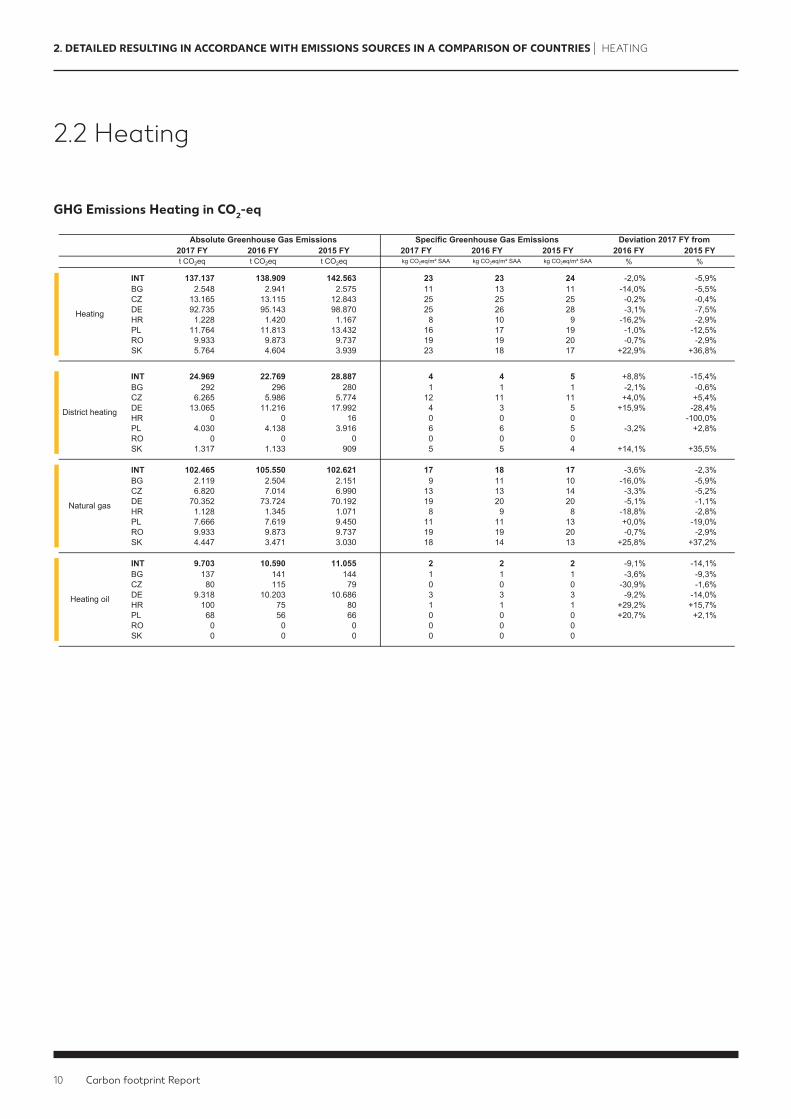
INT 137.137 138.909 142.563 23 23 24 -2,0% -5,9%BG 2.548 2.941 2.575 11 13 11 -14,0% -5,5%CZ 13.165 13.115 12.843 25 25 25 -0,2% -0,4%DE 92.735 95.143 98.870 25 26 28 -3,1% -7,5%HR 1.228 1.420 1.167 8 10 9 -16,2% -2,9%PL 11.764 11.813 13.432 16 17 19 -1,0% -12,5%RO 9.933 9.873 9.737 19 19 20 -0,7% -2,9%SK 5.764 4.604 3.939 23 18 17 +22,9% +36,8%
INT 24.969 22.769 28.887 4 4 5 +8,8% -15,4%BG 292 296 280 1 1 1 -2,1% -0,6%CZ 6.265 5.986 5.774 12 11 11 +4,0% +5,4%DE 13.065 11.216 17.992 4 3 5 +15,9% -28,4%HR 0 0 16 0 0 0 #DIV/0! -100,0%PL 4.030 4.138 3.916 6 6 5 -3,2% +2,8%RO 0 0 0 0 0 0 #DIV/0! #DIV/0!SK 1.317 1.133 909 5 5 4 +14,1% +35,5%
INT 102.465 105.550 102.621 17 18 17 -3,6% -2,3%BG 2.119 2.504 2.151 9 11 10 -16,0% -5,9%CZ 6.820 7.014 6.990 13 13 14 -3,3% -5,2%DE 70.352 73.724 70.192 19 20 20 -5,1% -1,1%HR 1.128 1.345 1.071 8 9 8 -18,8% -2,8%PL 7.666 7.619 9.450 11 11 13 +0,0% -19,0%RO 9.933 9.873 9.737 19 19 20 -0,7% -2,9%SK 4.447 3.471 3.030 18 14 13 +25,8% +37,2%
INT 9.703 10.590 11.055 2 2 2 -9,1% -14,1%BG 137 141 144 1 1 1 -3,6% -9,3%CZ 80 115 79 0 0 0 -30,9% -1,6%DE 9.318 10.203 10.686 3 3 3 -9,2% -14,0%HR 100 75 80 1 1 1 +29,2% +15,7%PL 68 56 66 0 0 0 +20,7% +2,1%RO 0 0 0 0 0 0 #DIV/0! #DIV/0!SK 0 0 0 0 0 0 #DIV/0! #DIV/0!
Heating
District heating
Natural gas
Heating oil
Absolute Greenhouse Gas Emissions Specific Greenhouse Gas Emissions Deviation 2017 FY from
2.2 Heating
GHG Emissions Heating in CO2-eq
2. DETAILED RESULTING IN ACCORDANCE WITH EMISSIONS SOURCES IN A COMPARISON OF COUNTRIES | HEATING
11
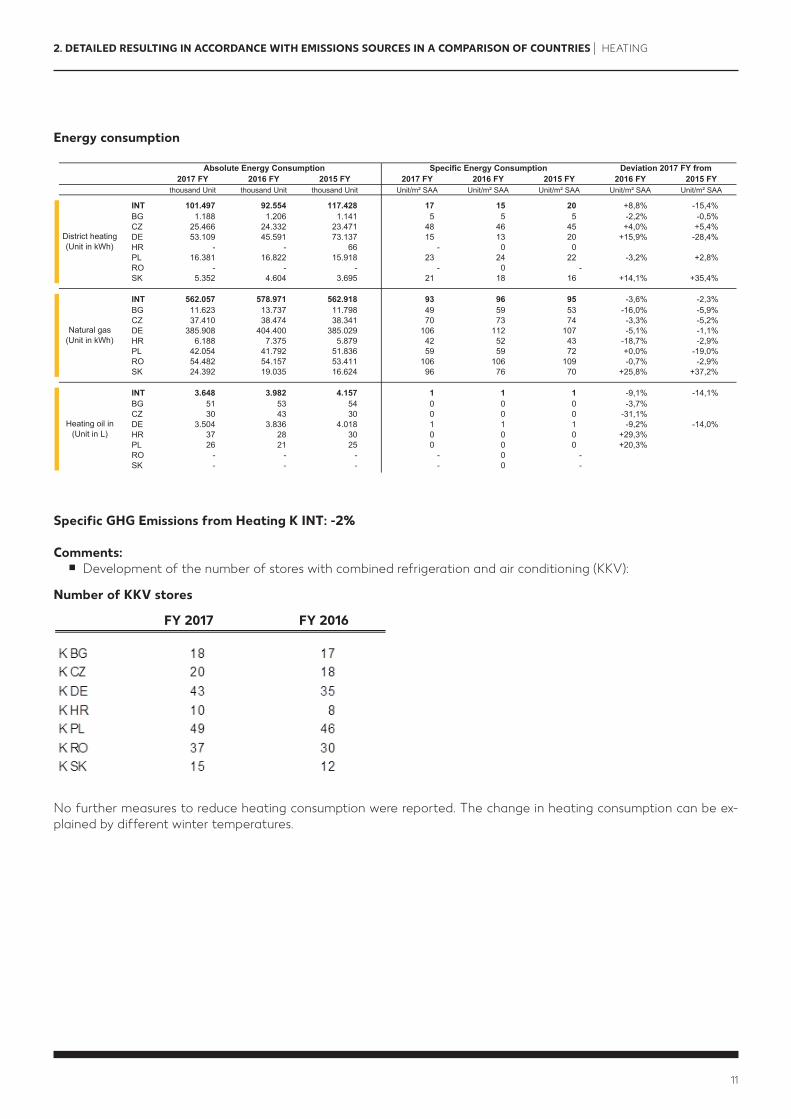
2017 FY 2016 FY 2015 FY 2017 FY 2016 FY 2015 FY 2016 FY 2015 FYthousand Unit thousand Unit thousand Unit Unit/m² SAA Unit/m² SAA Unit/m² SAA Unit/m² SAA Unit/m² SAA
INT 101.497 92.554 117.428 17 15 20 +8,8% -15,4%BG 1.188 1.206 1.141 5 5 5 -2,2% -0,5%CZ 25.466 24.332 23.471 48 46 45 +4,0% +5,4%DE 53.109 45.591 73.137 15 13 20 +15,9% -28,4%HR - - 66 - 0 0 #WERT! #WERT!PL 16.381 16.822 15.918 23 24 22 -3,2% +2,8%RO - - - - 0 - #WERT! #WERT!SK 5.352 4.604 3.695 21 18 16 +14,1% +35,4%
INT 562.057 578.971 562.918 93 96 95 -3,6% -2,3%BG 11.623 13.737 11.798 49 59 53 -16,0% -5,9%CZ 37.410 38.474 38.341 70 73 74 -3,3% -5,2%DE 385.908 404.400 385.029 106 112 107 -5,1% -1,1%HR 6.188 7.375 5.879 42 52 43 -18,7% -2,9%PL 42.054 41.792 51.836 59 59 72 +0,0% -19,0%RO 54.482 54.157 53.411 106 106 109 -0,7% -2,9%SK 24.392 19.035 16.624 96 76 70 +25,8% +37,2%
INT 3.648 3.982 4.157 1 1 1 -9,1% -14,1%BG 51 53 54 0 0 0 -3,7% #DIV/0!CZ 30 43 30 0 0 0 -31,1% #DIV/0!DE 3.504 3.836 4.018 1 1 1 -9,2% -14,0%HR 37 28 30 0 0 0 +29,3% #DIV/0!PL 26 21 25 0 0 0 +20,3% #DIV/0!RO - - - - 0 - #WERT! #WERT!SK - - - - 0 - #WERT! #WERT!
Heating oil in (Unit in L)
Absolute Energy Consumption Specific Energy Consumption Deviation 2017 FY from
District heating(Unit in kWh)
Natural gas(Unit in kWh)
Energy consumption
Specific GHG Emissions from Heating K INT: -2%
Comments: ■ Development of the number of stores with combined refrigeration and air conditioning (KKV):
No further measures to reduce heating consumption were reported. The change in heating consumption can be ex-plained by different winter temperatures.
2. DETAILED RESULTING IN ACCORDANCE WITH EMISSIONS SOURCES IN A COMPARISON OF COUNTRIES | HEATING
Number of KKV stores
FY 2017 FY 2016

12 Carbon footprint Report
2017 FY 2016 FY 2015 FY 2017 FY 2016 FY 2015 FY 2016 FY 2015 FYt CO2eq t CO2eq t CO2eq kg CO2eq/m² SAA kg CO2eq/m² SAA kg CO2eq/m² SAA % %
INT 317.906 343.863 346.066 53 57 58 -8,2% -10,1%BG 22.374 21.357 13.151 95 92 59 +4,0% +62,6%CZ 58.589 44.633 44.404 110 84 86 +30,5% +28,2%DE 125.261 166.590 184.865 34 46 51 -25,2% -33,2%HR 4.767 5.284 4.767 32 37 35 -12,6% -7,7%PL 38.045 43.413 24.855 53 61 35 -12,9% +52,9%RO 56.852 51.661 62.473 110 101 127 +8,7% -13,4%SK 12.018 10.925 11.551 47 44 49 +8,0% -2,7%
Absolute Greenhouse Gas Emissions Specific Greenhouse Gas Emissions Deviation 2017 FY from
Refrigerants
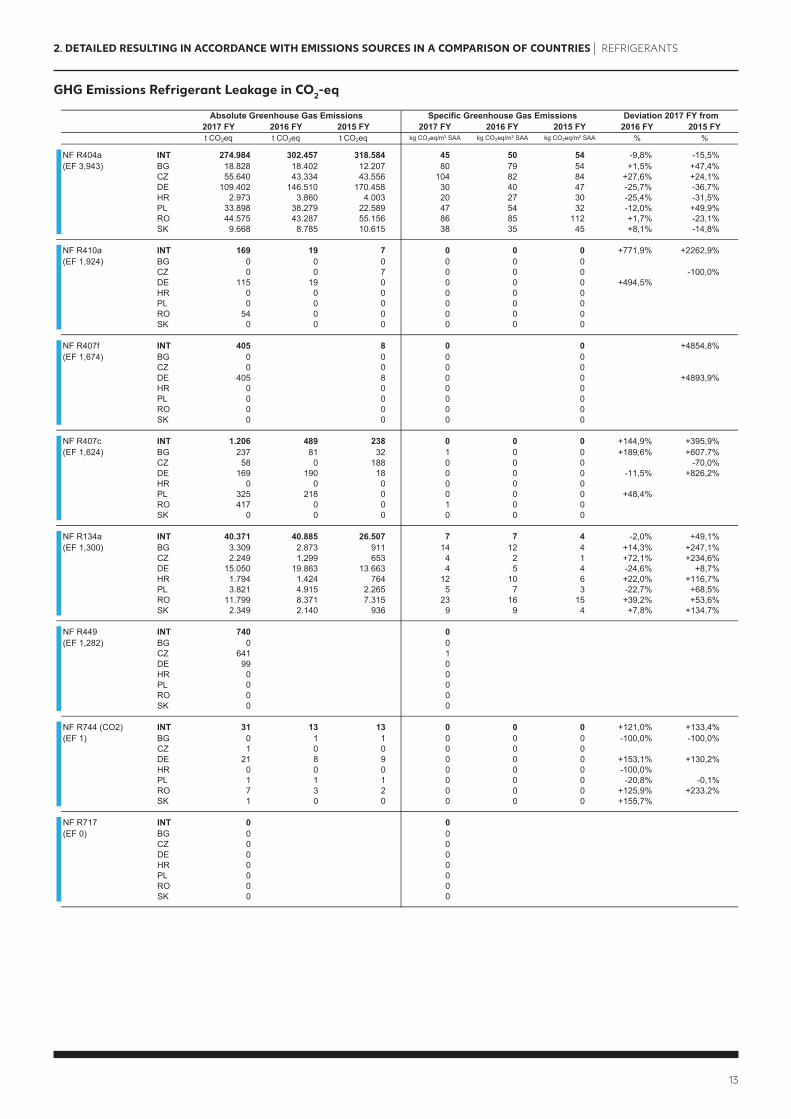
GHG Emissions Refrigerant Leakage in CO2-eq
2. DETAILED RESULTING IN ACCORDANCE WITH EMISSIONS SOURCES IN A COMPARISON OF COUNTRIES | REFRIGERANTS
Specific GHG Emissions from Refrigeration Leakage K INT: -8.2%
Comments:K DE (-25.2%): There were more incidents of refrigerant leakage. There were fewer incidents of leak-
ages that were harmful to the climate. In 2017, there were many conversions to climate-neutral refrigerants. Since the end
of 2016, only refrigeration units with the climate-neutral refrigerant CO2 have been installed in new buildings.
2.3 Refrigerants
13
2017 FY 2016 FY 2015 FY 2017 FY 2016 FY 2015 FY 2016 FY 2015 FYt CO2eq t CO2eq t CO2eq kg CO2eq/m² SAA kg CO2eq/m² SAA kg CO2eq/m² SAA % %
NF R404a INT 274.984 302.457 318.584 45 50 54 -9,8% -15,5%(EF 3,943) BG 18.828 18.402 12.207 80 79 54 +1,5% +47,4%
CZ 55.640 43.334 43.556 104 82 84 +27,6% +24,1%DE 109.402 146.510 170.458 30 40 47 -25,7% -36,7%HR 2.973 3.860 4.003 20 27 30 -25,4% -31,5%PL 33.898 38.279 22.589 47 54 32 -12,0% +49,9%RO 44.575 43.287 55.156 86 85 112 +1,7% -23,1%SK 9.668 8.785 10.615 38 35 45 +8,1% -14,8%
NF R410a INT 169 19 7 0 0 0 +771,9% +2262,9%(EF 1,924) BG 0 0 0 0 0 0 #DIV/0! #DIV/0!
CZ 0 0 7 0 0 0 #DIV/0! -100,0%DE 115 19 0 0 0 0 +494,5% #DIV/0!HR 0 0 0 0 0 0 #DIV/0! #DIV/0!PL 0 0 0 0 0 0 #DIV/0! #DIV/0!RO 54 0 0 0 0 0 #DIV/0! #DIV/0!SK 0 0 0 0 0 0 #DIV/0! #DIV/0!
NF R407f INT 405 8 0 0 #DIV/0! +4854,8%(EF 1,674) BG 0 0 0 0 #DIV/0! #DIV/0!
CZ 0 0 0 0 #DIV/0! #DIV/0!DE 405 8 0 0 #DIV/0! +4893,9%HR 0 0 0 0 #DIV/0! #DIV/0!PL 0 0 0 0 #DIV/0! #DIV/0!RO 0 0 0 0 #DIV/0! #DIV/0!SK 0 0 0 0 #DIV/0! #DIV/0!
NF R407c INT 1.206 489 238 0 0 0 +144,9% +395,9%(EF 1,624) BG 237 81 32 1 0 0 +189,6% +607,7%
CZ 58 0 188 0 0 0 #DIV/0! -70,0%DE 169 190 18 0 0 0 -11,5% +826,2%HR 0 0 0 0 0 0 #DIV/0! #DIV/0!PL 325 218 0 0 0 0 +48,4% #DIV/0!RO 417 0 0 1 0 0 #DIV/0! #DIV/0!SK 0 0 0 0 0 0 #DIV/0! #DIV/0!
NF R134a INT 40.371 40.885 26.507 7 7 4 -2,0% +49,1%(EF 1,300) BG 3.309 2.873 911 14 12 4 +14,3% +247,1%
CZ 2.249 1.299 653 4 2 1 +72,1% +234,6%DE 15.050 19.863 13.663 4 5 4 -24,6% +8,7%HR 1.794 1.424 764 12 10 6 +22,0% +116,7%PL 3.821 4.915 2.265 5 7 3 -22,7% +68,5%RO 11.799 8.371 7.315 23 16 15 +39,2% +53,6%SK 2.349 2.140 936 9 9 4 +7,8% +134,7%
NF R449 INT 740 0 #DIV/0! #DIV/0!(EF 1,282) BG 0 0 #DIV/0! #DIV/0!
CZ 641 1 #DIV/0! #DIV/0!DE 99 0 #DIV/0! #DIV/0!HR 0 0 #DIV/0! #DIV/0!PL 0 0 #DIV/0! #DIV/0!RO 0 0 #DIV/0! #DIV/0!SK 0 0 #DIV/0! #DIV/0!
NF R744 (CO2) INT 31 13 13 0 0 0 +121,0% +133,4%(EF 1) BG 0 1 1 0 0 0 -100,0% -100,0%
CZ 1 0 0 0 0 0 #DIV/0! #DIV/0!DE 21 8 9 0 0 0 +153,1% +130,2%HR 0 0 0 0 0 0 -100,0% #DIV/0!PL 1 1 1 0 0 0 -20,8% -0,1%RO 7 3 2 0 0 0 +125,9% +233,2%SK 1 0 0 0 0 0 +155,7% #DIV/0!
NF R717 INT 0 0 #DIV/0! #DIV/0!(EF 0) BG 0 0 #DIV/0! #DIV/0!
CZ 0 0 #DIV/0! #DIV/0!DE 0 0 #DIV/0! #DIV/0!HR 0 0 #DIV/0! #DIV/0!PL 0 0 #DIV/0! #DIV/0!RO 0 0 #DIV/0! #DIV/0!SK 0 0 #DIV/0! #DIV/0!
Absolute Greenhouse Gas Emissions Specific Greenhouse Gas Emissions Deviation 2017 FY from
GHG Emissions Refrigerant Leakage in CO2-eq
2. DETAILED RESULTING IN ACCORDANCE WITH EMISSIONS SOURCES IN A COMPARISON OF COUNTRIES | REFRIGERANTS
14 Carbon footprint Report
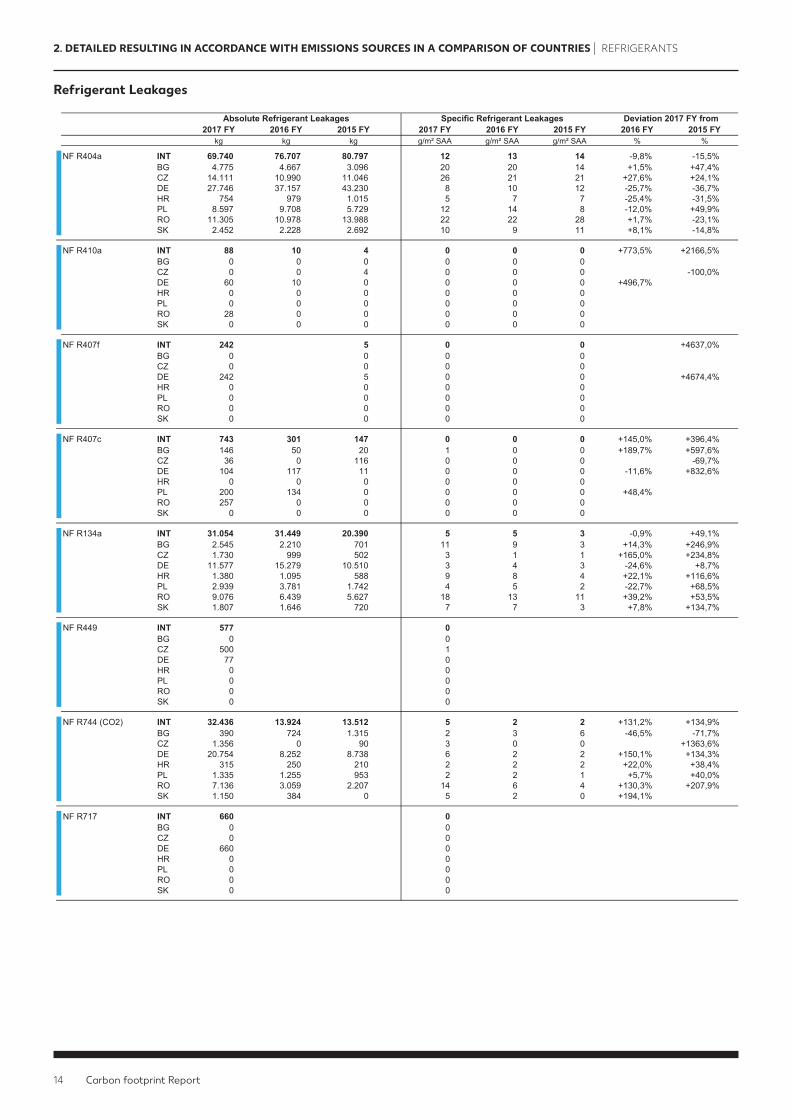
Refrigerant Leakages
2017 FY 2016 FY 2015 FY 2017 FY 2016 FY 2015 FY 2016 FY 2015 FYkg kg kg g/m² SAA g/m² SAA g/m² SAA % %
NF R404a INT 69.740 76.707 80.797 12 13 14 -9,8% -15,5%BG 4.775 4.667 3.096 20 20 14 +1,5% +47,4%CZ 14.111 10.990 11.046 26 21 21 +27,6% +24,1%DE 27.746 37.157 43.230 8 10 12 -25,7% -36,7%HR 754 979 1.015 5 7 7 -25,4% -31,5%PL 8.597 9.708 5.729 12 14 8 -12,0% +49,9%RO 11.305 10.978 13.988 22 22 28 +1,7% -23,1%SK 2.452 2.228 2.692 10 9 11 +8,1% -14,8%
NF R410a INT 88 10 4 0 0 0 +773,5% +2166,5%BG 0 0 0 0 0 0 #DIV/0! #DIV/0!CZ 0 0 4 0 0 0 #DIV/0! -100,0%DE 60 10 0 0 0 0 +496,7% #DIV/0!HR 0 0 0 0 0 0 #DIV/0! #DIV/0!PL 0 0 0 0 0 0 #DIV/0! #DIV/0!RO 28 0 0 0 0 0 #DIV/0! #DIV/0!SK 0 0 0 0 0 0 #DIV/0! #DIV/0!
NF R407f INT 242 5 0 0 #DIV/0! +4637,0%BG 0 0 0 0 #DIV/0! #DIV/0!CZ 0 0 0 0 #DIV/0! #DIV/0!DE 242 5 0 0 #DIV/0! +4674,4%HR 0 0 0 0 #DIV/0! #DIV/0!PL 0 0 0 0 #DIV/0! #DIV/0!RO 0 0 0 0 #DIV/0! #DIV/0!SK 0 0 0 0 #DIV/0! #DIV/0!
NF R407c INT 743 301 147 0 0 0 +145,0% +396,4%BG 146 50 20 1 0 0 +189,7% +597,6%CZ 36 0 116 0 0 0 #DIV/0! -69,7%DE 104 117 11 0 0 0 -11,6% +832,6%HR 0 0 0 0 0 0 #DIV/0! #DIV/0!PL 200 134 0 0 0 0 +48,4% #DIV/0!RO 257 0 0 0 0 0 #DIV/0! #DIV/0!SK 0 0 0 0 0 0 #DIV/0! #DIV/0!
NF R134a INT 31.054 31.449 20.390 5 5 3 -0,9% +49,1%BG 2.545 2.210 701 11 9 3 +14,3% +246,9%CZ 1.730 999 502 3 1 1 +165,0% +234,8%DE 11.577 15.279 10.510 3 4 3 -24,6% +8,7%HR 1.380 1.095 588 9 8 4 +22,1% +116,6%PL 2.939 3.781 1.742 4 5 2 -22,7% +68,5%RO 9.076 6.439 5.627 18 13 11 +39,2% +53,5%SK 1.807 1.646 720 7 7 3 +7,8% +134,7%
NF R449 INT 577 0 #DIV/0! #DIV/0!BG 0 0 #DIV/0! #DIV/0!CZ 500 1 #DIV/0! #DIV/0!DE 77 0 #DIV/0! #DIV/0!HR 0 0 #DIV/0! #DIV/0!PL 0 0 #DIV/0! #DIV/0!RO 0 0 #DIV/0! #DIV/0!SK 0 0 #DIV/0! #DIV/0!
NF R744 (CO2) INT 32.436 13.924 13.512 5 2 2 +131,2% +134,9%BG 390 724 1.315 2 3 6 -46,5% -71,7%CZ 1.356 0 90 3 0 0 #DIV/0! +1363,6%DE 20.754 8.252 8.738 6 2 2 +150,1% +134,3%HR 315 250 210 2 2 2 +22,0% +38,4%PL 1.335 1.255 953 2 2 1 +5,7% +40,0%RO 7.136 3.059 2.207 14 6 4 +130,3% +207,9%SK 1.150 384 0 5 2 0 +194,1% #DIV/0!
NF R717 INT 660 0 #DIV/0! #DIV/0!BG 0 0 #DIV/0! #DIV/0!CZ 0 0 #DIV/0! #DIV/0!DE 660 0 #DIV/0! #DIV/0!HR 0 0 #DIV/0! #DIV/0!PL 0 0 #DIV/0! #DIV/0!RO 0 0 #DIV/0! #DIV/0!SK 0 0 #DIV/0! #DIV/0!
Absolute Refrigerant Leakages Specific Refrigerant Leakages Deviation 2017 FY from
2. DETAILED RESULTING IN ACCORDANCE WITH EMISSIONS SOURCES IN A COMPARISON OF COUNTRIES | REFRIGERANTS
15
2017 FY 2016 FY 2015 FY 2017 FY 2016 FY 2015 FY 2016 FY 2015 FYt CO2eq t CO2eq t CO2eq Økg CO2eq/m² SAA Økg CO2eq/m² SAA Økg CO2eq/m² SAA % %
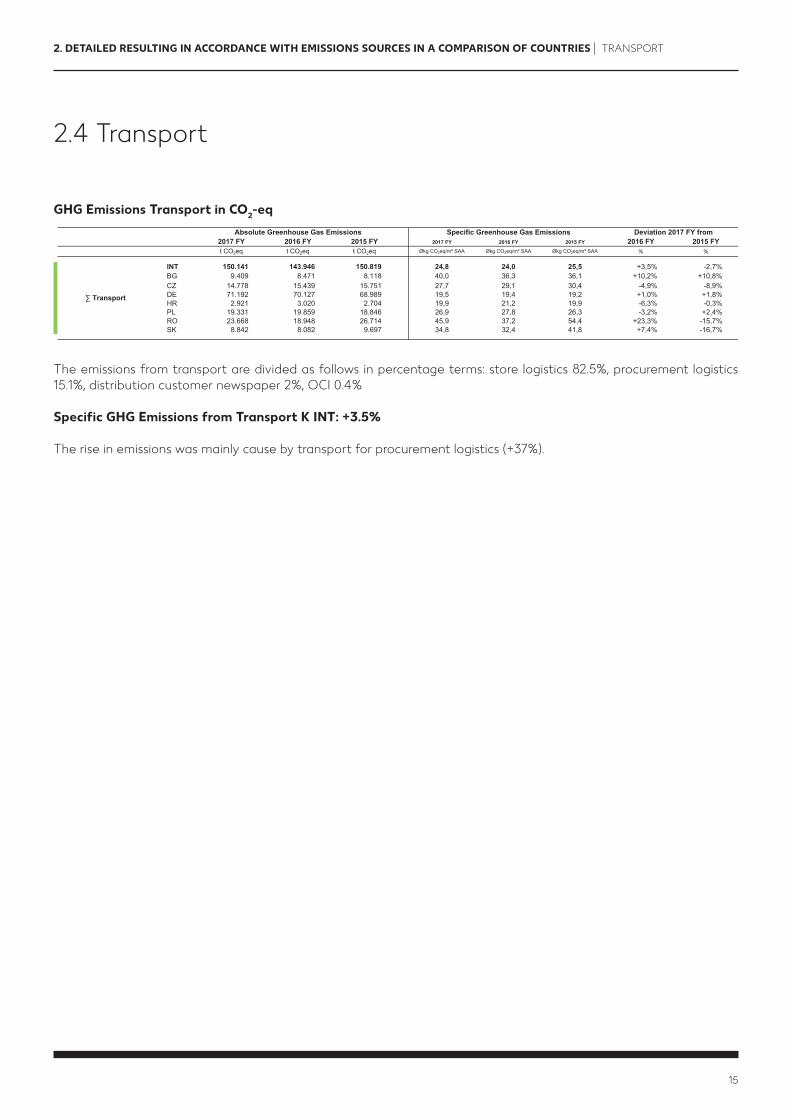
INT 150.141 143.946 150.819 24,8 24,0 25,5 +3,5% -2,7%BG 9.409 8.471 8.118 40,0 36,3 36,1 +10,2% +10,8%CZ 14.778 15.439 15.751 27,7 29,1 30,4 -4,9% -8,9%DE 71.192 70.127 68.989 19,5 19,4 19,2 +1,0% +1,8%HR 2.921 3.020 2.704 19,9 21,2 19,9 -6,3% -0,3%PL 19.331 19.859 18.846 26,9 27,8 26,3 -3,2% +2,4%RO 23.668 18.948 26.714 45,9 37,2 54,4 +23,3% -15,7%SK 8.842 8.082 9.697 34,8 32,4 41,8 +7,4% -16,7%
Absolute Greenhouse Gas Emissions Specific Greenhouse Gas Emissions Deviation 2017 FY from
∑ Transport
GHG Emissions Transport in CO2-eq
2. DETAILED RESULTING IN ACCORDANCE WITH EMISSIONS SOURCES IN A COMPARISON OF COUNTRIES | TRANSPORT
The emissions from transport are divided as follows in percentage terms: store logistics 82.5%, procurement logistics 15.1%, distribution customer newspaper 2%, OCI 0.4%
Specific GHG Emissions from Transport K INT: +3.5%
The rise in emissions was mainly cause by transport for procurement logistics (+37%).
2.4 Transport
16 Carbon footprint Report
2017 FY 2016 FY 2015 FY 2017 FY 2016 FY 2015 FY 2016 FY 2015 FYt CO2eq t CO2eq t CO2eq Økg CO2eq/m² SAA Økg CO2eq/m² SAA Økg CO2eq/m² SAA % %
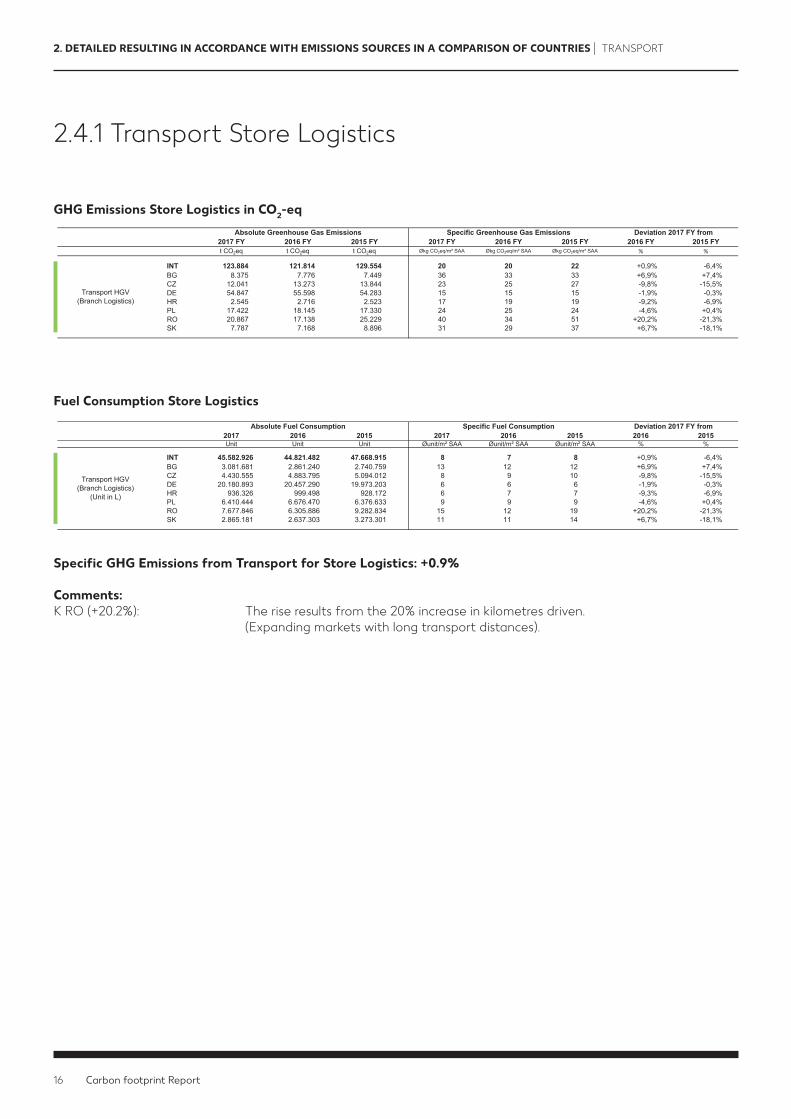
INT 123.884 121.814 129.554 20 20 22 +0,9% -6,4%BG 8.375 7.776 7.449 36 33 33 +6,9% +7,4%CZ 12.041 13.273 13.844 23 25 27 -9,8% -15,5%DE 54.847 55.598 54.283 15 15 15 -1,9% -0,3%HR 2.545 2.716 2.523 17 19 19 -9,2% -6,9%PL 17.422 18.145 17.330 24 25 24 -4,6% +0,4%RO 20.867 17.138 25.229 40 34 51 +20,2% -21,3%SK 7.787 7.168 8.896 31 29 37 +6,7% -18,1%
Specific Greenhouse Gas Emissions Deviation 2017 FY fromAbsolute Greenhouse Gas Emissions
Transport HGV(Branch Logistics)
2017 2016 2015 2017 2016 2015 2016 2015Unit Unit Unit Øunit/m² SAA Øunit/m² SAA Øunit/m² SAA % %
INT 45.582.926 44.821.482 47.668.915 8 7 8 +0,9% -6,4%BG 3.081.681 2.861.240 2.740.759 13 12 12 +6,9% +7,4%CZ 4.430.555 4.883.795 5.094.012 8 9 10 -9,8% -15,5%DE 20.180.893 20.457.290 19.973.203 6 6 6 -1,9% -0,3%HR 936.326 999.498 928.172 6 7 7 -9,3% -6,9%PL 6.410.444 6.676.470 6.376.633 9 9 9 -4,6% +0,4%RO 7.677.846 6.305.886 9.282.834 15 12 19 +20,2% -21,3%SK 2.865.181 2.637.303 3.273.301 11 11 14 +6,7% -18,1%
Transport HGV (Branch Logistics)
(Unit in L)
Deviation 2017 FY fromSpecific Fuel ConsumptionAbsolute Fuel Consumption
GHG Emissions Store Logistics in CO2-eq
Fuel Consumption Store Logistics
2. DETAILED RESULTING IN ACCORDANCE WITH EMISSIONS SOURCES IN A COMPARISON OF COUNTRIES | TRANSPORT
Specific GHG Emissions from Transport for Store Logistics: +0.9%
Comments:K RO (+20.2%): The rise results from the 20% increase in kilometres driven. (Expanding markets with long transport distances).
2.4.1 Transport Store Logistics

17
2017 FY 2016 FY 2015 FY 2017 FY 2016 FY 2015 FY 2016 FY 2015 FYt CO2eq t CO2eq t CO2eq Økg CO2eq/m² SAA Økg CO2eq/m² SAA Økg CO2eq/m² SAA % %
INT 22.721 16.425,0 15.092 3,8 2,7 2,6 +37,3% +47,3%BG 633 359,0 305 2,7 1,5 1,4 +75,0% +98,3%CZ 1.955 1.153,0 977 3,7 2,2 1,9 +68,6% +94,4%DE 15.715 12.016,0 11.726 4,3 3,3 3,3 +30,1% +32,2%HR 376 304,0 181 2,6 2,1 1,3 +19,7% +91,7%PL 1.304 950,0 769 1,8 1,3 1,1 +36,5% +69,3%RO 1.989 1.051,0 663 3,9 2,1 1,3 +86,8% +185,6%SK 749 592,0 471 2,9 2,4 2,0 +24,1% +48,7%
INT 7.401 5.142 4.841 1,2 0,9 0,8 +42,9% +49,6%BG 309 234 242 1,3 1,0 1,1 +31,0% +22,0%CZ 956 588 532 1,8 1,1 1,0 +61,6% +74,6%DE 3.786 2.522 2.563 1,0 0,7 0,7 +49,3% +45,7%HR 217 202 139 1,5 1,4 1,0 +4,1% +44,1%PL 778 647 494 1,1 0,9 0,7 +19,5% +57,3%RO 880 490 477 1,7 1,0 1,0 +77,3% +75,6%SK 475 459 394 1,9 1,8 1,7 +1,6% +12,7%
INT 314 242 214 0,1 0,0 0,0 +28,8% +43,6%BG 0 0 0 0,0 0,0 0,0 #DIV/0! #DIV/0!CZ 62 37 34 0,1 0,1 0,1 +66,6% +77,1%DE 205 136 141 0,1 0,0 0,0 +49,9% +43,4%HR 0 0 0 0,0 0,0 0,0 #DIV/0! #DIV/0!PL 0 24 0 0,0 0,0 0,0 -100,0% #DIV/0!RO 0 0 0 0,0 0,0 0,0 #DIV/0! #DIV/0!SK 47 45 39 0,2 0,2 0,2 +2,6% +12,7%
INT 224 174 144 0,0 0,0 0,0 +27,8% +52,2%BG 0 0 0 0,0 0,0 0,0 #DIV/0! #DIV/0!CZ 110 66 60 0,2 0,1 0,1 +65,7% +78,1%DE 77 51 53 0,0 0,0 0,0 +50,2% +43,3%HR 0 0 0 0,0 0,0 0,0 #DIV/0! #DIV/0!PL 0 21 0 0,0 0,0 0,0 -100,0% #DIV/0!RO 0 0 0 0,0 0,0 0,0 #DIV/0! #DIV/0!SK 37 36 31 0,1 0,1 0,1 +0,9% +11,6%
INT 631 338 385 0,1 0,1 0,1 +85,3% +60,4%BG 77 59 60 0,3 0,3 0,3 +29,5% +22,6%CZ 0 0 0 0,0 0,0 0,0 #DIV/0! #DIV/0!DE 21 20 5 0,0 0,0 0,0 +4,4% +314,3%HR 20 19 14 0,1 0,1 0,1 +2,0% +31,8%PL 332 139 208 0,5 0,2 0,3 +137,4% +59,4%RO 181 101 98 0,4 0,2 0,2 +76,9% +75,8%SK 0 0 0 0,0 0,0 0,0 #DIV/0! #DIV/0!
Absolute Greenhouse Gas Emissions
Transport Sea Freight (SF4)(Procurement Logistics)
Transport SF – Rail5
(Procurement Logistics)
Transport SF - Rail - HGV6
(Procurement Logistics)
Transport SF - HGV7
(Procurement Logistics)
∑ Transport Procurement Logistics
Specific Greenhouse Gas Emissions Deviation 2017 FY from
GHG Emissions Procurement Logistics in CO2-eq
2. DETAILED RESULTING IN ACCORDANCE WITH EMISSIONS SOURCES IN A COMPARISON OF COUNTRIES | TRANSPORT
4 SF=Shipping indicates the CO2eq/shipping distance covered by sea freight (tkm) 5 SF - Rail indicates the CO2eq/rail distance covered (after transport by ship) by sea freight (tkm)
6 SF - Rail - HGV indicates the CO2eq/HGV distance covered (after transport by ship and rail) by sea freight (tkm) 7 SF - HGV indicates the CO2eq/HGV distance covered (after transport by ship) by sea freight (tkm)
2.4.2 Transport Procurement Logistics
18 Carbon footprint Report
2017 2016 2015 2017 2016 2015 2016 2015Unit Unit Unit Øunit/m² SAA Øunit/m² SAA Øunit/m² SAA % %
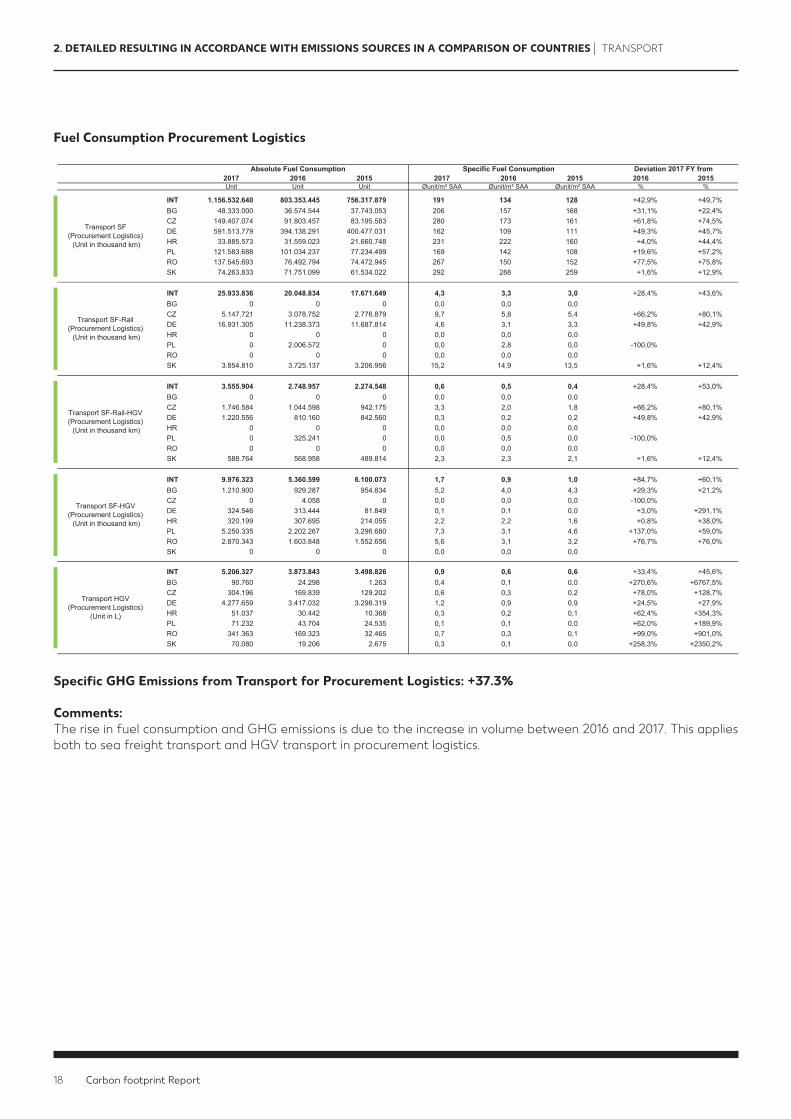
INT 1.156.532.640 803.353.445 756.317.879 191 134 128 +42,9% +49,7%BG 48.333.000 36.574.544 37.743.053 206 157 168 +31,1% +22,4%CZ 149.407.074 91.803.457 83.195.583 280 173 161 +61,8% +74,5%DE 591.513.779 394.138.291 400.477.031 162 109 111 +49,3% +45,7%HR 33.885.573 31.559.023 21.660.748 231 222 160 +4,0% +44,4%PL 121.583.688 101.034.237 77.234.499 169 142 108 +19,6% +57,2%RO 137.545.693 76.492.794 74.472.945 267 150 152 +77,5% +75,8%SK 74.263.833 71.751.099 61.534.022 292 288 259 +1,6% +12,9%
INT 25.933.836 20.048.834 17.671.649 4,3 3,3 3,0 +28,4% +43,6%BG 0 0 0 0,0 0,0 0,0 #DIV/0! #DIV/0!CZ 5.147.721 3.078.752 2.776.879 9,7 5,8 5,4 +66,2% +80,1%DE 16.931.305 11.238.373 11.687.814 4,6 3,1 3,3 +49,8% +42,9%HR 0 0 0 0,0 0,0 0,0 #DIV/0! #DIV/0!PL 0 2.006.572 0 0,0 2,8 0,0 -100,0% #DIV/0!RO 0 0 0 0,0 0,0 0,0 #DIV/0! #DIV/0!SK 3.854.810 3.725.137 3.206.956 15,2 14,9 13,5 +1,6% +12,4%
INT 3.555.904 2.748.957 2.274.548 0,6 0,5 0,4 +28,4% +53,0%BG 0 0 0 0,0 0,0 0,0 #DIV/0! #DIV/0!CZ 1.746.584 1.044.598 942.175 3,3 2,0 1,8 +66,2% +80,1%DE 1.220.556 810.160 842.560 0,3 0,2 0,2 +49,8% +42,9%HR 0 0 0 0,0 0,0 0,0 #DIV/0! #DIV/0!PL 0 325.241 0 0,0 0,5 0,0 -100,0% #DIV/0!RO 0 0 0 0,0 0,0 0,0 #DIV/0! #DIV/0!SK 588.764 568.958 489.814 2,3 2,3 2,1 +1,6% +12,4%
INT 9.976.323 5.360.599 6.100.073 1,7 0,9 1,0 +84,7% +60,1%BG 1.210.900 929.287 954.834 5,2 4,0 4,3 +29,3% +21,2%CZ 0 4.058 0 0,0 0,0 0,0 -100,0% #DIV/0!DE 324.546 313.444 81.849 0,1 0,1 0,0 +3,0% +291,1%HR 320.199 307.695 214.055 2,2 2,2 1,6 +0,8% +38,0%PL 5.250.335 2.202.267 3.296.680 7,3 3,1 4,6 +137,0% +59,0%RO 2.870.343 1.603.848 1.552.656 5,6 3,1 3,2 +76,7% +76,0%SK 0 0 0 0,0 0,0 0,0 #DIV/0! #DIV/0!
INT 5.206.327 3.873.843 3.498.826 0,9 0,6 0,6 +33,4% +45,6%BG 90.760 24.298 1.263 0,4 0,1 0,0 +270,6% +6767,5%CZ 304.196 169.839 129.202 0,6 0,3 0,2 +78,0% +128,7%DE 4.277.659 3.417.032 3.298.319 1,2 0,9 0,9 +24,5% +27,9%HR 51.037 30.442 10.368 0,3 0,2 0,1 +62,4% +354,3%PL 71.232 43.704 24.535 0,1 0,1 0,0 +62,0% +189,9%RO 341.363 169.323 32.465 0,7 0,3 0,1 +99,0% +901,0%SK 70.080 19.206 2.675 0,3 0,1 0,0 +258,3% +2350,2%
Specific Fuel Consumption Deviation 2017 FY from
Transport HGV (Procurement Logistics)
(Unit in L)
Transport SF-Rail (Procurement Logistics) (Unit in thousand km)
Transport SF-Rail-HGV (Procurement Logistics) (Unit in thousand km)
Transport SF-HGV (Procurement Logistics) (Unit in thousand km)
Absolute Fuel Consumption
Transport SF (Procurement Logistics) (Unit in thousand km)
Fuel Consumption Procurement Logistics
2. DETAILED RESULTING IN ACCORDANCE WITH EMISSIONS SOURCES IN A COMPARISON OF COUNTRIES | TRANSPORT
Specific GHG Emissions from Transport for Procurement Logistics: +37.3%
Comments:The rise in fuel consumption and GHG emissions is due to the increase in volume between 2016 and 2017. This applies both to sea freight transport and HGV transport in procurement logistics.
19
Fuel Consumption Distribution Customer Newspaper
2017 FY 2016 FY 2015 FY 2017 FY 2016 FY 2015 FY 2016 FY 2015 FYt CO2eq t CO2eq t CO2eq Økg CO2eq/m² SAA Økg CO2eq/m² SAA Økg CO2eq/m² SAA % %
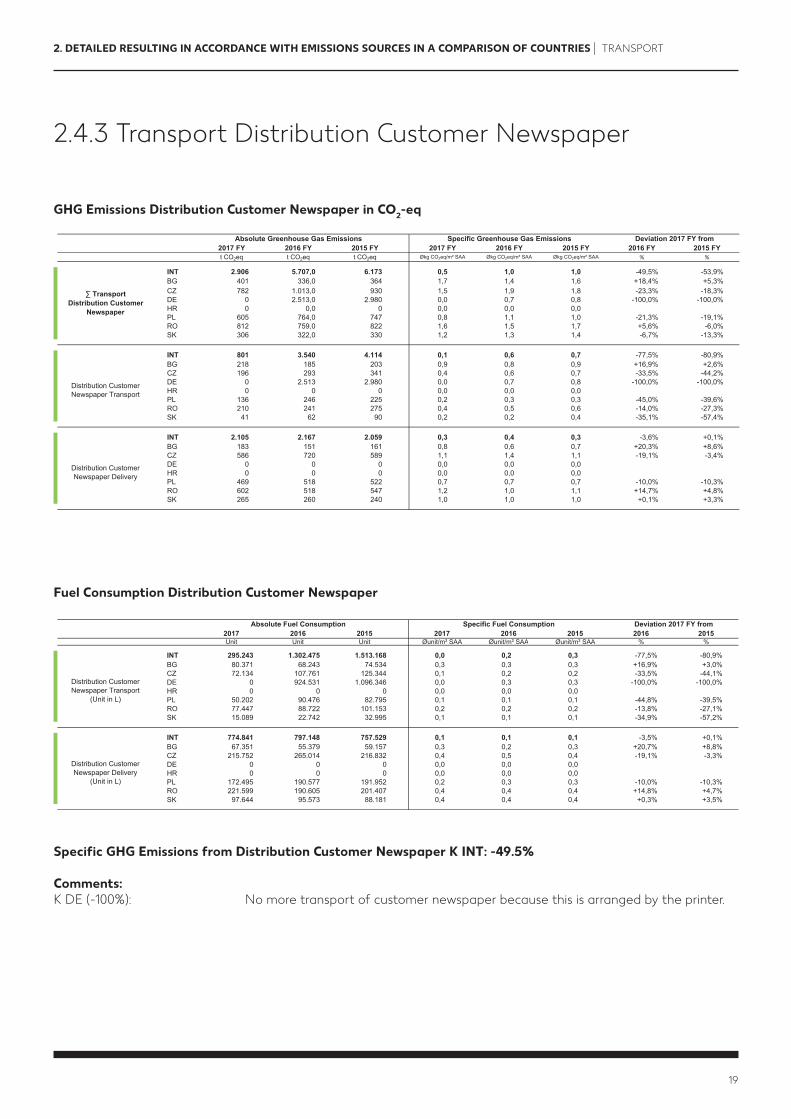
INT 2.906 5.707,0 6.173 0,5 1,0 1,0 -49,5% -53,9%BG 401 336,0 364 1,7 1,4 1,6 +18,4% +5,3%CZ 782 1.013,0 930 1,5 1,9 1,8 -23,3% -18,3%DE 0 2.513,0 2.980 0,0 0,7 0,8 -100,0% -100,0%HR 0 0,0 0 0,0 0,0 0,0 #DIV/0! #DIV/0!PL 605 764,0 747 0,8 1,1 1,0 -21,3% -19,1%RO 812 759,0 822 1,6 1,5 1,7 +5,6% -6,0%SK 306 322,0 330 1,2 1,3 1,4 -6,7% -13,3%
INT 801 3.540 4.114 0,1 0,6 0,7 -77,5% -80,9%BG 218 185 203 0,9 0,8 0,9 +16,9% +2,6%CZ 196 293 341 0,4 0,6 0,7 -33,5% -44,2%DE 0 2.513 2.980 0,0 0,7 0,8 -100,0% -100,0%HR 0 0 0 0,0 0,0 0,0 #DIV/0! #DIV/0!PL 136 246 225 0,2 0,3 0,3 -45,0% -39,6%RO 210 241 275 0,4 0,5 0,6 -14,0% -27,3%SK 41 62 90 0,2 0,2 0,4 -35,1% -57,4%
INT 2.105 2.167 2.059 0,3 0,4 0,3 -3,6% +0,1%BG 183 151 161 0,8 0,6 0,7 +20,3% +8,6%CZ 586 720 589 1,1 1,4 1,1 -19,1% -3,4%DE 0 0 0 0,0 0,0 0,0 #DIV/0! #DIV/0!HR 0 0 0 0,0 0,0 0,0 #DIV/0! #DIV/0!PL 469 518 522 0,7 0,7 0,7 -10,0% -10,3%RO 602 518 547 1,2 1,0 1,1 +14,7% +4,8%SK 265 260 240 1,0 1,0 1,0 +0,1% +3,3%
Absolute Greenhouse Gas Emissions
Distribution Customer Newspaper Transport
Distribution Customer Newspaper Delivery
∑ Transport Distribution Customer
Newspaper
Specific Greenhouse Gas Emissions Deviation 2017 FY from
2017 2016 2015 2017 2016 2015 2016 2015Unit Unit Unit Øunit/m² SAA Øunit/m² SAA Øunit/m² SAA % %
INT 295.243 1.302.475 1.513.168 0,0 0,2 0,3 -77,5% -80,9%BG 80.371 68.243 74.534 0,3 0,3 0,3 +16,9% +3,0%CZ 72.134 107.761 125.344 0,1 0,2 0,2 -33,5% -44,1%DE 0 924.531 1.096.346 0,0 0,3 0,3 -100,0% -100,0%HR 0 0 0 0,0 0,0 0,0 #DIV/0! #DIV/0!PL 50.202 90.476 82.795 0,1 0,1 0,1 -44,8% -39,5%RO 77.447 88.722 101.153 0,2 0,2 0,2 -13,8% -27,1%SK 15.089 22.742 32.995 0,1 0,1 0,1 -34,9% -57,2%
INT 774.841 797.148 757.529 0,1 0,1 0,1 -3,5% +0,1%BG 67.351 55.379 59.157 0,3 0,2 0,3 +20,7% +8,8%CZ 215.752 265.014 216.832 0,4 0,5 0,4 -19,1% -3,3%DE 0 0 0 0,0 0,0 0,0 #DIV/0! #DIV/0!HR 0 0 0 0,0 0,0 0,0 #DIV/0! #DIV/0!PL 172.495 190.577 191.952 0,2 0,3 0,3 -10,0% -10,3%RO 221.599 190.605 201.407 0,4 0,4 0,4 +14,8% +4,7%SK 97.644 95.573 88.181 0,4 0,4 0,4 +0,3% +3,5%
Distribution Customer Newspaper Transport
(Unit in L)
Specific Fuel Consumption Deviation 2017 FY from
Distribution Customer Newspaper Delivery
(Unit in L)
Absolute Fuel Consumption
GHG Emissions Distribution Customer Newspaper in CO2-eq
2. DETAILED RESULTING IN ACCORDANCE WITH EMISSIONS SOURCES IN A COMPARISON OF COUNTRIES | TRANSPORT
Specific GHG Emissions from Distribution Customer Newspaper K INT: -49.5%
Comments:K DE (-100%): No more transport of customer newspaper because this is arranged by the printer.
2.4.3 Transport Distribution Customer Newspaper
20 Carbon footprint Report
Fuel Consumption OCI
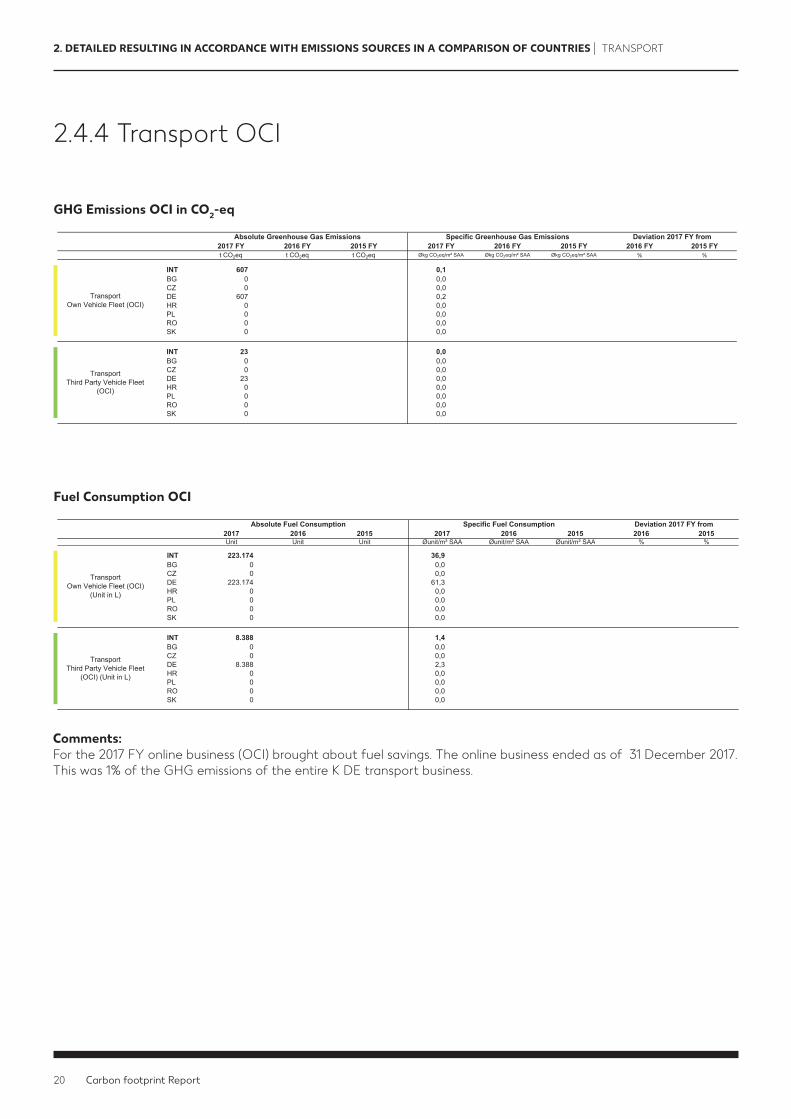
2017 FY 2016 FY 2015 FY 2017 FY 2016 FY 2015 FY 2016 FY 2015 FYt CO2eq t CO2eq t CO2eq Økg CO2eq/m² SAA Økg CO2eq/m² SAA Økg CO2eq/m² SAA % %
INT 607 0,1BG 0 0,0CZ 0 0,0DE 607 0,2HR 0 0,0PL 0 0,0RO 0 0,0SK 0 0,0
INT 23 0,0BG 0 0,0CZ 0 0,0DE 23 0,0HR 0 0,0PL 0 0,0RO 0 0,0SK 0 0,0
TransportOwn Vehicle Fleet (OCI)
TransportThird Party Vehicle Fleet
(OCI)
Absolute Greenhouse Gas Emissions Specific Greenhouse Gas Emissions Deviation 2017 FY from
2017 2016 2015 2017 2016 2015 2016 2015Unit Unit Unit Øunit/m² SAA Øunit/m² SAA Øunit/m² SAA % %
INT 223.174 36,9BG 0 0,0CZ 0 0,0DE 223.174 61,3HR 0 0,0PL 0 0,0RO 0 0,0SK 0 0,0
INT 8.388 1,4BG 0 0,0CZ 0 0,0DE 8.388 2,3HR 0 0,0PL 0 0,0RO 0 0,0SK 0 0,0
Specific Fuel Consumption Deviation 2017 FY from
TransportThird Party Vehicle Fleet
(OCI) (Unit in L)
Absolute Fuel Consumption
TransportOwn Vehicle Fleet (OCI)
(Unit in L)
GHG Emissions OCI in CO2-eq
2. DETAILED RESULTING IN ACCORDANCE WITH EMISSIONS SOURCES IN A COMPARISON OF COUNTRIES | TRANSPORT
Comments:For the 2017 FY online business (OCI) brought about fuel savings. The online business ended as of 31 December 2017. This was 1% of the GHG emissions of the entire K DE transport business.
2.4.4 Transport OCI

21
2017 FY 2016 FY 2015 FY 2017 FY 2016 FY 2015 FY 2016 FY 2015 FYt CO2eq t CO2eq t CO2eq Økg CO2eq/m² SAA Økg CO2eq/m² SAA Økg CO2eq/m² SAA % %
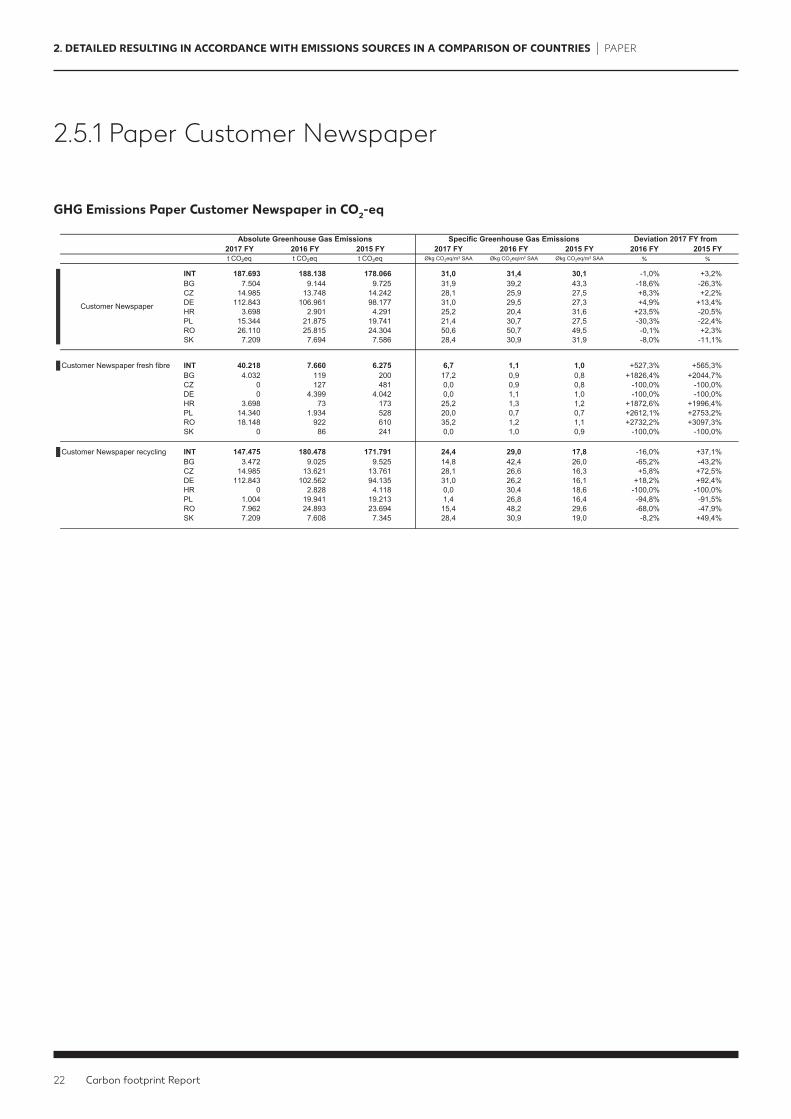
INT 188.755 189.374 179.451 31,2 31,6 30,3 -1,1% +2,9%BG 7.574 9.229 9.829 32,2 39,6 43,8 -18,6% -26,4%CZ 15.118 13.894 14.429 28,4 26,2 27,9 +8,2% +1,8%DE 113.304 107.433 98.759 31,1 29,7 27,5 +4,9% +13,2%HR 3.736 2.953 4.353 25,4 20,7 32,1 +22,5% -20,8%PL 15.491 22.093 19.938 21,6 31,0 27,8 -30,3% -22,4%RO 26.260 25.987 24.475 50,9 51,0 49,8 -0,2% +2,1%SK 7.272 7.785 7.668 28,6 31,2 32,3 -8,3% -11,3%
Absolute Greenhouse Gas Emissions Specific Greenhouse Gas Emissions Deviation 2017 FY from
Paper
GHG Emissions Paper in CO2-eq
2. DETAILED RESULTING IN ACCORDANCE WITH EMISSIONS SOURCES IN A COMPARISON OF COUNTRIES | PAPER
The emissions from paper consumption are divided as follows in percentage terms:customernewspaper99%,officepaper1%.
Specific GHG Emissions from Paper Consumption K INT: -1.1%
2.5 Paper
22 Carbon footprint Report
2017 FY 2016 FY 2015 FY 2017 FY 2016 FY 2015 FY 2016 FY 2015 FYt CO2eq t CO2eq t CO2eq Økg CO2eq/m² SAA Økg CO2eq/m² SAA Økg CO2eq/m² SAA % %
INT 187.693 188.138 178.066 31,0 31,4 30,1 -1,0% +3,2%BG 7.504 9.144 9.725 31,9 39,2 43,3 -18,6% -26,3%CZ 14.985 13.748 14.242 28,1 25,9 27,5 +8,3% +2,2%DE 112.843 106.961 98.177 31,0 29,5 27,3 +4,9% +13,4%HR 3.698 2.901 4.291 25,2 20,4 31,6 +23,5% -20,5%PL 15.344 21.875 19.741 21,4 30,7 27,5 -30,3% -22,4%RO 26.110 25.815 24.304 50,6 50,7 49,5 -0,1% +2,3%SK 7.209 7.694 7.586 28,4 30,9 31,9 -8,0% -11,1%
Customer Newspaper fresh fibre INT 40.218 7.660 6.275 6,7 1,1 1,0 +527,3% +565,3%BG 4.032 119 200 17,2 0,9 0,8 +1826,4% +2044,7%CZ 0 127 481 0,0 0,9 0,8 -100,0% -100,0%DE 0 4.399 4.042 0,0 1,1 1,0 -100,0% -100,0%HR 3.698 73 173 25,2 1,3 1,2 +1872,6% +1996,4%PL 14.340 1.934 528 20,0 0,7 0,7 +2612,1% +2753,2%RO 18.148 922 610 35,2 1,2 1,1 +2732,2% +3097,3%SK 0 86 241 0,0 1,0 0,9 -100,0% -100,0%
Customer Newspaper recycling INT 147.475 180.478 171.791 24,4 29,0 17,8 -16,0% +37,1%BG 3.472 9.025 9.525 14,8 42,4 26,0 -65,2% -43,2%CZ 14.985 13.621 13.761 28,1 26,6 16,3 +5,8% +72,5%DE 112.843 102.562 94.135 31,0 26,2 16,1 +18,2% +92,4%HR 0 2.828 4.118 0,0 30,4 18,6 -100,0% -100,0%PL 1.004 19.941 19.213 1,4 26,8 16,4 -94,8% -91,5%RO 7.962 24.893 23.694 15,4 48,2 29,6 -68,0% -47,9%SK 7.209 7.608 7.345 28,4 30,9 19,0 -8,2% +49,4%
Absolute Greenhouse Gas Emissions Specific Greenhouse Gas Emissions Deviation 2017 FY from
Customer Newspaper
GHG Emissions Paper Customer Newspaper in CO2-eq
2. DETAILED RESULTING IN ACCORDANCE WITH EMISSIONS SOURCES IN A COMPARISON OF COUNTRIES | PAPER
2.5.1 Paper Customer Newspaper
23
2017 FY 2016 FY 2015 FY 2017 FY 2016 FY 2015 FY 2016 FY 2015 FYt t t Ø g/m² SAA Ø g/m² SAA Ø g/m² SAA % %
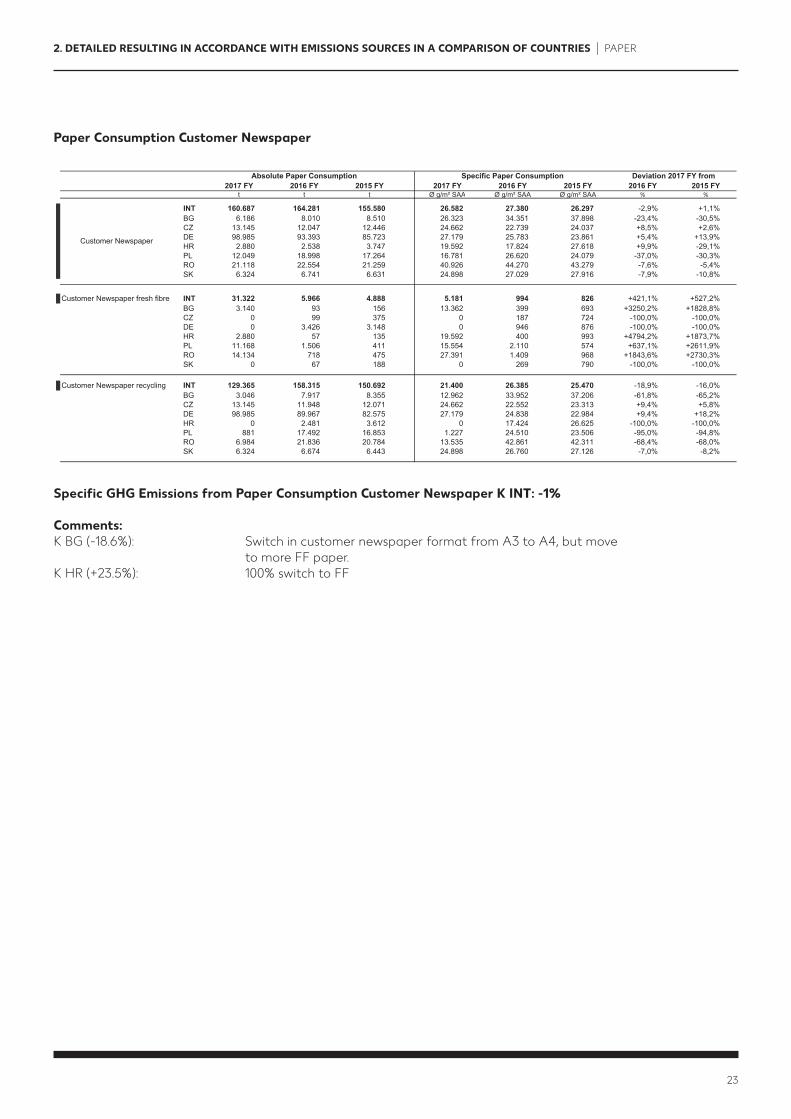
INT 160.687 164.281 155.580 26.582 27.380 26.297 -2,9% +1,1%BG 6.186 8.010 8.510 26.323 34.351 37.898 -23,4% -30,5%CZ 13.145 12.047 12.446 24.662 22.739 24.037 +8,5% +2,6%DE 98.985 93.393 85.723 27.179 25.783 23.861 +5,4% +13,9%HR 2.880 2.538 3.747 19.592 17.824 27.618 +9,9% -29,1%PL 12.049 18.998 17.264 16.781 26.620 24.079 -37,0% -30,3%RO 21.118 22.554 21.259 40.926 44.270 43.279 -7,6% -5,4%SK 6.324 6.741 6.631 24.898 27.029 27.916 -7,9% -10,8%
Customer Newspaper fresh fibre INT 31.322 5.966 4.888 5.181 994 826 +421,1% +527,2%BG 3.140 93 156 13.362 399 693 +3250,2% +1828,8%CZ 0 99 375 0 187 724 -100,0% -100,0%DE 0 3.426 3.148 0 946 876 -100,0% -100,0%HR 2.880 57 135 19.592 400 993 +4794,2% +1873,7%PL 11.168 1.506 411 15.554 2.110 574 +637,1% +2611,9%RO 14.134 718 475 27.391 1.409 968 +1843,6% +2730,3%SK 0 67 188 0 269 790 -100,0% -100,0%
Customer Newspaper recycling INT 129.365 158.315 150.692 21.400 26.385 25.470 -18,9% -16,0%BG 3.046 7.917 8.355 12.962 33.952 37.206 -61,8% -65,2%CZ 13.145 11.948 12.071 24.662 22.552 23.313 +9,4% +5,8%DE 98.985 89.967 82.575 27.179 24.838 22.984 +9,4% +18,2%HR 0 2.481 3.612 0 17.424 26.625 -100,0% -100,0%PL 881 17.492 16.853 1.227 24.510 23.506 -95,0% -94,8%RO 6.984 21.836 20.784 13.535 42.861 42.311 -68,4% -68,0%SK 6.324 6.674 6.443 24.898 26.760 27.126 -7,0% -8,2%
Customer Newspaper
Absolute Paper Consumption Specific Paper Consumption Deviation 2017 FY from
Paper Consumption Customer Newspaper
2. DETAILED RESULTING IN ACCORDANCE WITH EMISSIONS SOURCES IN A COMPARISON OF COUNTRIES | PAPER
Specific GHG Emissions from Paper Consumption Customer Newspaper K INT: -1% Comments:K BG (-18.6%): Switch in customer newspaper format from A3 to A4, but move to more FF paper.K HR (+23.5%): 100% switch to FF
24 Carbon footprint Report
2017 FY 2016 FY 2015 FY 2017 FY 2016 FY 2015 FY 2016 FY 2015 FYt CO2eq t CO2eq t CO2eq Økg CO2eq/m² SAA Økg CO2eq/m² SAA Økg CO2eq/m² SAA % %
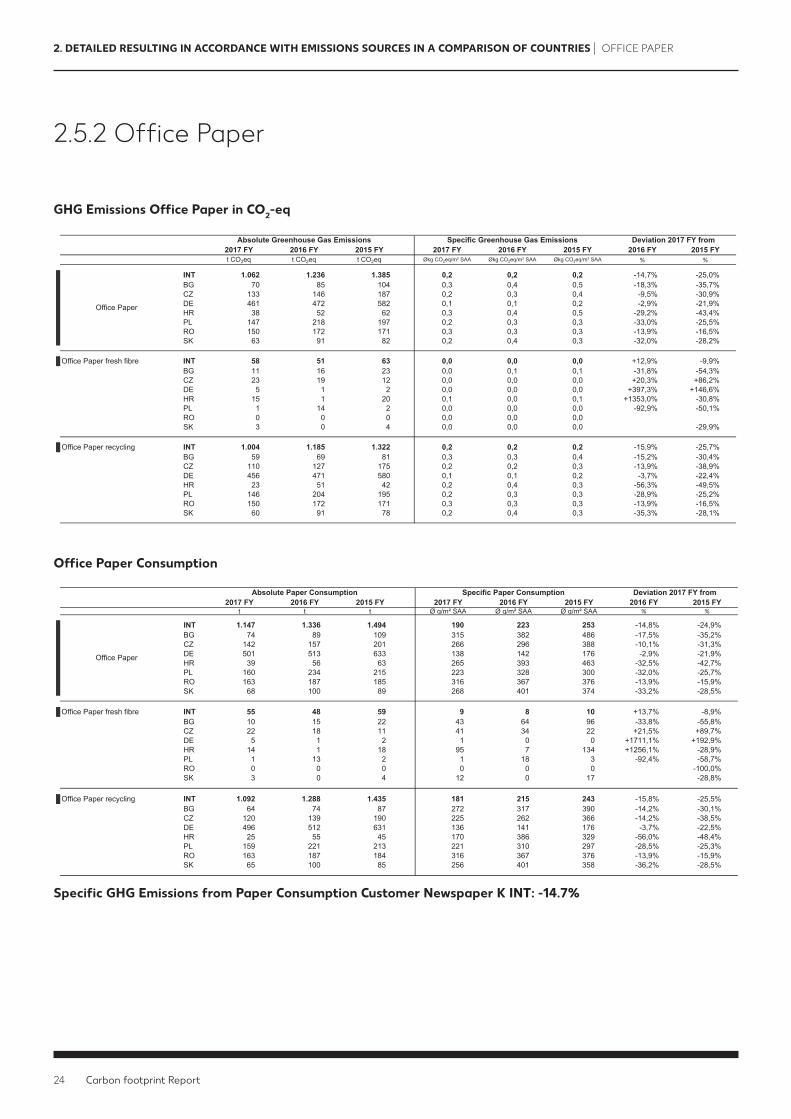
INT 1.062 1.236 1.385 0,2 0,2 0,2 -14,7% -25,0%BG 70 85 104 0,3 0,4 0,5 -18,3% -35,7%CZ 133 146 187 0,2 0,3 0,4 -9,5% -30,9%DE 461 472 582 0,1 0,1 0,2 -2,9% -21,9%HR 38 52 62 0,3 0,4 0,5 -29,2% -43,4%PL 147 218 197 0,2 0,3 0,3 -33,0% -25,5%RO 150 172 171 0,3 0,3 0,3 -13,9% -16,5%SK 63 91 82 0,2 0,4 0,3 -32,0% -28,2%
Office Paper fresh fibre INT 58 51 63 0,0 0,0 0,0 +12,9% -9,9%BG 11 16 23 0,0 0,1 0,1 -31,8% -54,3%CZ 23 19 12 0,0 0,0 0,0 +20,3% +86,2%DE 5 1 2 0,0 0,0 0,0 +397,3% +146,6%HR 15 1 20 0,1 0,0 0,1 +1353,0% -30,8%PL 1 14 2 0,0 0,0 0,0 -92,9% -50,1%RO 0 0 0 0,0 0,0 0,0 #DIV/0! #DIV/0!SK 3 0 4 0,0 0,0 0,0 #DIV/0! -29,9%
Office Paper recycling INT 1.004 1.185 1.322 0,2 0,2 0,2 -15,9% -25,7%BG 59 69 81 0,3 0,3 0,4 -15,2% -30,4%CZ 110 127 175 0,2 0,2 0,3 -13,9% -38,9%DE 456 471 580 0,1 0,1 0,2 -3,7% -22,4%HR 23 51 42 0,2 0,4 0,3 -56,3% -49,5%PL 146 204 195 0,2 0,3 0,3 -28,9% -25,2%RO 150 172 171 0,3 0,3 0,3 -13,9% -16,5%SK 60 91 78 0,2 0,4 0,3 -35,3% -28,1%
Absolute Greenhouse Gas Emissions Specific Greenhouse Gas Emissions
Office Paper
Deviation 2017 FY from
GHG Emissions Office Paper in CO2-eq
Office Paper Consumption
Specific GHG Emissions from Paper Consumption Customer Newspaper K INT: -14.7%
2. DETAILED RESULTING IN ACCORDANCE WITH EMISSIONS SOURCES IN A COMPARISON OF COUNTRIES | OFFICE PAPER
2.5.2OfficePaper
2017 FY 2016 FY 2015 FY 2017 FY 2016 FY 2015 FY 2016 FY 2015 FYt t t Ø g/m² SAA Ø g/m² SAA Ø g/m² SAA % %
INT 1.147 1.336 1.494 190 223 253 -14,8% -24,9%BG 74 89 109 315 382 486 -17,5% -35,2%CZ 142 157 201 266 296 388 -10,1% -31,3%DE 501 513 633 138 142 176 -2,9% -21,9%HR 39 56 63 265 393 463 -32,5% -42,7%PL 160 234 215 223 328 300 -32,0% -25,7%RO 163 187 185 316 367 376 -13,9% -15,9%SK 68 100 89 268 401 374 -33,2% -28,5%
Office Paper fresh fibre INT 55 48 59 9 8 10 +13,7% -8,9%BG 10 15 22 43 64 96 -33,8% -55,8%CZ 22 18 11 41 34 22 +21,5% +89,7%DE 5 1 2 1 0 0 +1711,1% +192,9%HR 14 1 18 95 7 134 +1256,1% -28,9%PL 1 13 2 1 18 3 -92,4% -58,7%RO 0 0 0 0 0 0 #DIV/0! -100,0%SK 3 0 4 12 0 17 #DIV/0! -28,8%
Office Paper recycling INT 1.092 1.288 1.435 181 215 243 -15,8% -25,5%BG 64 74 87 272 317 390 -14,2% -30,1%CZ 120 139 190 225 262 366 -14,2% -38,5%DE 496 512 631 136 141 176 -3,7% -22,5%HR 25 55 45 170 386 329 -56,0% -48,4%PL 159 221 213 221 310 297 -28,5% -25,3%RO 163 187 184 316 367 376 -13,9% -15,9%SK 65 100 85 256 401 358 -36,2% -28,5%
Office Paper
Absolute Paper Consumption Specific Paper Consumption Deviation 2017 FY from

25
3. Reference Values
3. REFERENCE VALUES
2017 FY 2016 FY 2015 FY 2016 FY 2015 FYThousand m² Thousand m² Thousand m² % %
INT 6.045 6.000 5.916 0,7% 2,2%BG 235 233 225 0,8% 4,6%CZ 533 530 518 0,6% 2,9%DE 3.642 3.622 3.593 0,5% 1,4%HR 147 142 136 3,2% 8,4%PL 718 714 717 0,6% 0,1%RO 516 509 491 1,3% 5,0%SK 254 249 238 1,8% 6,9%
Sales Area + NF Deviation 2017 FY from
26 Carbon footprint Report
4. Emission Factors
4. EMISSION FACTORS
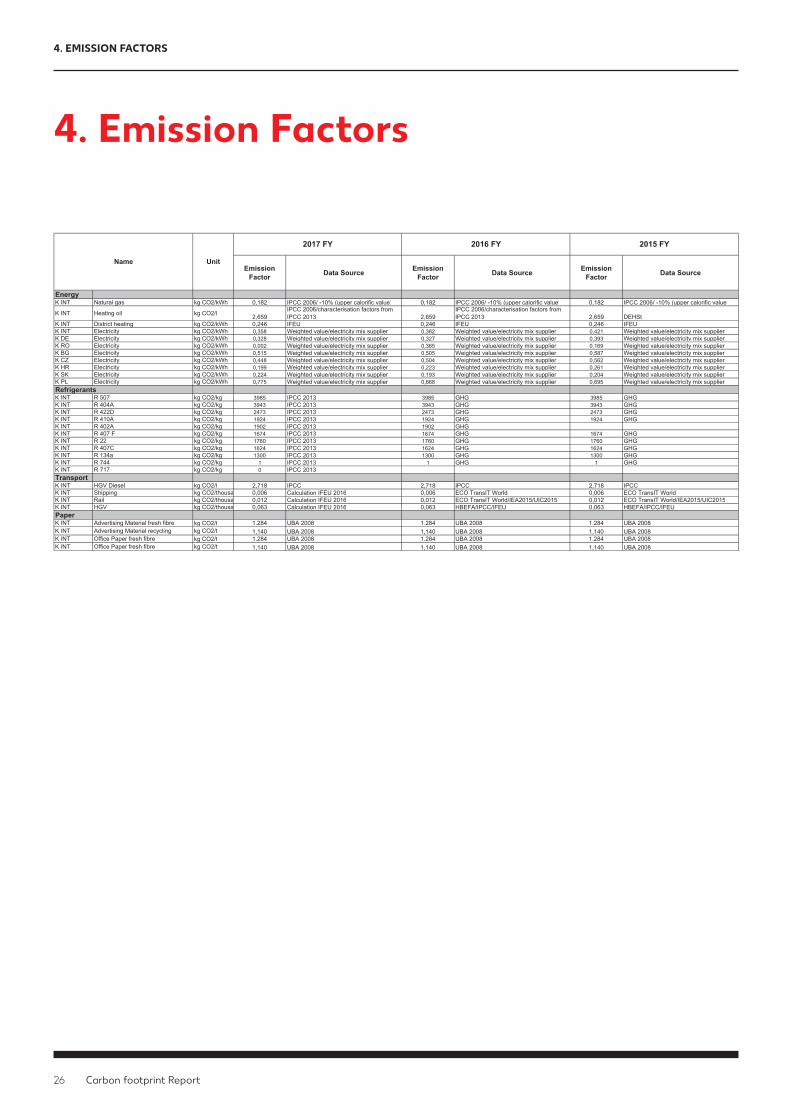
Emission Factors
Emission Factor Data Source Emission
Factor Data Source Emission Factor Data Source
EnergyK INT Natural gas kg CO2/kWh 0,182 IPCC 2006/ -10% (upper calorific value) 0,182 IPCC 2006/ -10% (upper calorific value) 0,182 IPCC 2006/ -10% (upper calorific value)
K INT Heating oil kg CO2/l 2,659IPCC 2006/characterisation factors from IPCC 2013 2,659
IPCC 2006/characterisation factors from IPCC 2013 2,659 DEHSt
K INT District heating kg CO2/kWh 0,246 IFEU 0,246 IFEU 0,246 IFEUK INT Electricity kg CO2/kWh 0,358 Weighted value/electricity mix supplier 0,382 Weighted value/electricity mix supplier 0,421 Weighted value/electricity mix supplier K DE Electricity kg CO2/kWh 0,328 Weighted value/electricity mix supplier 0,327 Weighted value/electricity mix supplier 0,393 Weighted value/electricity mix supplier K RO Electricity kg CO2/kWh 0,002 Weighted value/electricity mix supplier 0,365 Weighted value/electricity mix supplier 0,169 Weighted value/electricity mix supplier K BG Electricity kg CO2/kWh 0,515 Weighted value/electricity mix supplier 0,505 Weighted value/electricity mix supplier 0,587 Weighted value/electricity mix supplier K CZ Electricity kg CO2/kWh 0,448 Weighted value/electricity mix supplier 0,504 Weighted value/electricity mix supplier 0,562 Weighted value/electricity mix supplier K HR Electricity kg CO2/kWh 0,199 Weighted value/electricity mix supplier 0,223 Weighted value/electricity mix supplier 0,261 Weighted value/electricity mix supplier K SK Electricity kg CO2/kWh 0,224 Weighted value/electricity mix supplier 0,193 Weighted value/electricity mix supplier 0,204 Weighted value/electricity mix supplier K PL Electricity kg CO2/kWh 0,775 Weighted value/electricity mix supplier 0,668 Weighted value/electricity mix supplier 0,695 Weighted value/electricity mix supplier RefrigerantsK INT R 507 kg CO2/kg 3985 IPCC 2013 3985 GHG 3985 GHGK INT R 404A kg CO2/kg 3943 IPCC 2013 3943 GHG 3943 GHGK INT R 422D kg CO2/kg 2473 IPCC 2013 2473 GHG 2473 GHGK INT R 410A kg CO2/kg 1924 IPCC 2013 1924 GHG 1924 GHGK INT R 402A kg CO2/kg 1902 IPCC 2013 1902 GHGK INT R 407 F kg CO2/kg 1674 IPCC 2013 1674 GHG 1674 GHGK INT R 22 kg CO2/kg 1760 IPCC 2013 1760 GHG 1760 GHGK INT R 407C kg CO2/kg 1624 IPCC 2013 1624 GHG 1624 GHGK INT R 134a kg CO2/kg 1300 IPCC 2013 1300 GHG 1300 GHGK INT R 744 kg CO2/kg 1 IPCC 2013 1 GHG 1 GHGK INT R 717 kg CO2/kg 0 IPCC 2013TransportK INT HGV Diesel kg CO2/l 2,718 IPCC 2,718 IPCC 2,718 IPCCK INT Shipping kg CO2/thousa 0,006 Calculation IFEU 2016 0,006 ECO TransIT World 0,006 ECO TransIT WorldK INT Rail kg CO2/thousa 0,012 Calculation IFEU 2016 0,012 ECO TransIT World/IEA2015/UIC2015 0,012 ECO TransIT World/IEA2015/UIC2015K INT HGV kg CO2/thousa 0,063 Calculation IFEU 2016 0,063 HBEFA/IPCC/IFEU 0,063 HBEFA/IPCC/IFEUPaperK INT Advertising Material fresh fibre kg CO2/t 1.284 UBA 2008 1.284 UBA 2008 1.284 UBA 2008K INT Advertising Material recycling kg CO2/t 1,140 UBA 2008 1,140 UBA 2008 1,140 UBA 2008K INT Office Paper fresh fibre kg CO2/t 1.284 UBA 2008 1.284 UBA 2008 1.284 UBA 2008K INT Office Paper fresh fibre kg CO2/t 1,140 UBA 2008 1,140 UBA 2008 1,140 UBA 2008
Name Unit
2017 FY 2016 FY 2015 FY
27
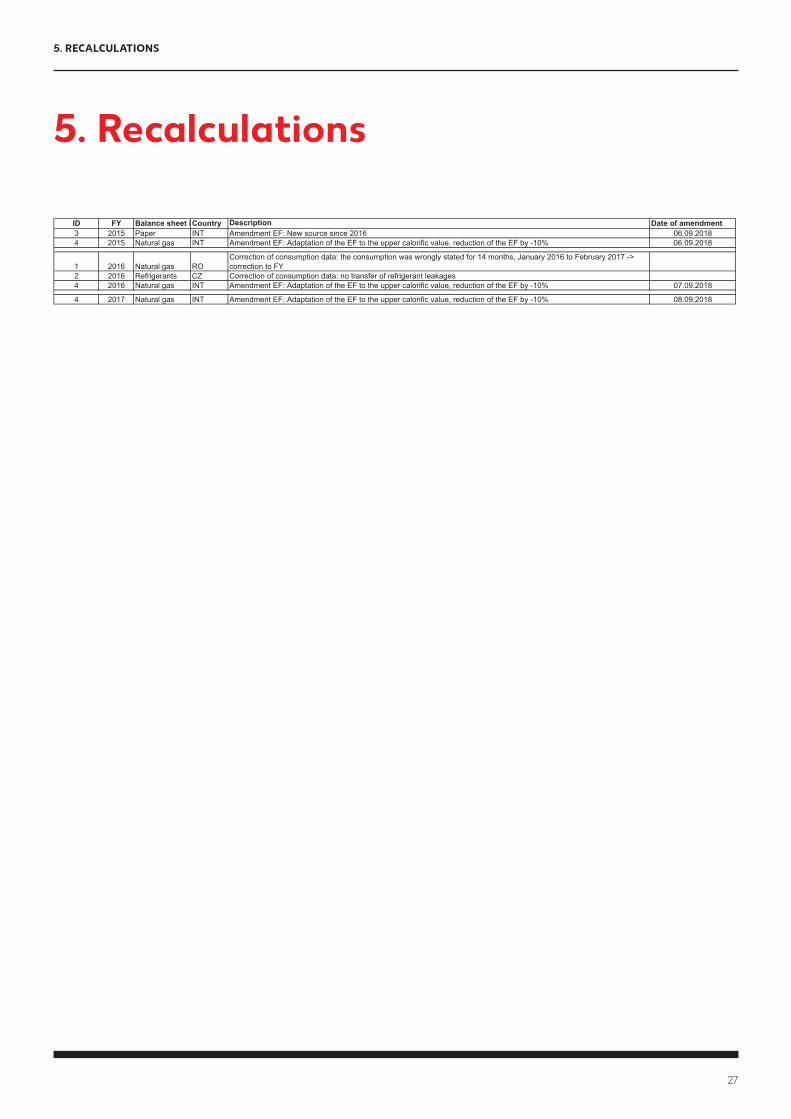
ID FY Balance sheet iCountry Description Date of amendment3 2015 Paper INT Amendment EF: New source since 2016 06.09.20184 2015 Natural gas INT Amendment EF: Adaptation of the EF to the upper calorific value, reduction of the EF by -10% 06.09.2018
1 2016 Natural gas ROCorrection of consumption data: the consumption was wrongly stated for 14 months, January 2016 to February 2017 -> correction to FY
2 2016 Refrigerants CZ Correction of consumption data: no transfer of refrigerant leakages4 2016 Natural gas INT Amendment EF: Adaptation of the EF to the upper calorific value, reduction of the EF by -10% 07.09.2018
4 2017 Natural gas INT Amendment EF: Adaptation of the EF to the upper calorific value, reduction of the EF by -10% 08.09.2018
5. Recalculations
5. RECALCULATIONS

28 Carbon footprint Report
Kaufland Group ClientsProducers
Electricity Heating: Natural gas heating oil district heating
Sales Logistics Administration FLWManufacture of products
Shopping tripUse
DisposalR l Heating: Natural gas, heating oil, district heating
Refrigerants Transport: Store, procurement logistics,
distribution customer newspaper [Omnichannel]
Paper consumption: Customer newspaper, office paper
Recycling
6. Scopes and Limits of the Carbon footprint Report
6. SCOPES AND LIMITS OF THE CARBON FOOTPRINT REPORT
Limits of the Carbon footprint Report:
An exact allocation of the emissions/consumption to the relevant divisions (administration, sales, logistics and FLW) in individual countries is not possible for some items due to combinations of locations (store/administration location, FLW/logistics). In these cases, the emissions/consumption was/were allocated on a percentage basis where possible.
Scopes of the Carbon footprint Report ■ Direct emissions (Scope 1):
Burning of fossil fuels and using refrigerants in the company ■ Indirect emissions (Scope 2):
Bought-in quantities of electricity and district heating ■ Other indirect emissions (Scope 3):
Commissioned logistics (transport for store logistics, transport for procurement logistics, distribution customernewspaper,OCI)andpaperconsumption(customernewspaper,officepaper)

29

Publication Details
Contact:KauflandStiftung&Co.KGEmail:[email protected]:kaufland.de/machenDate of publication: December 2018