Embed Size (px)
Citation preview
www.baastel.com
International Adaptation Core Indicators A Review of Adaptation Indicators used by
Development Agencies and Countries
Final Draft Report
Submitted by: Margaret Spearman, Baastel
Requested by: Craig Irwin, DFID
June 20, 2014
1
This report has been produced by Baastel for the UK Department for International Development (DFID)
Adaptation Knowledge and Tools programme and published through Evidence on Demand.
The Adaptation Knowledge and Tools programme is a DFID-funded programme intended to maximise the
effectiveness of UK and international investment in climate change adaptation and resilience. The knowledge
and tools generated through this programme are expected to promote greater understanding of what
constitutes best practice in adaptation, as well as better international cohesion and coordination around
adaptation. Through these entry points the programme expects to increase the quality of international and
UK adaptation programming and reduce its risk.
The views expressed in the report are entirely those of the author and do not necessarily represent DFID’s
own views or policies, or those of Evidence on Demand.
DFID welcome comments and suggestions, and any feedback on these documents should be sent to the ICF
Secretariat ([email protected]).
2
Le Groupe-conseil baastel sprl Rue de la Croix de fer 23, 1°
B-1000 Brussels BELGIUM
Tel: + 32 (0)2 893 0032 Fax: + 32 (0)2 503 3183
www.baastel.com
Contact: [email protected]
3
TABLE OF CONTENTS
Table of Contents ....................................................................................................................3
1. Introduction ..................................................................................................................... 4
2. Review of Meta-Studies .....................................................................................................5
3. Review of Adaptation Results Frameworks ..........................................................................7
3.1. High level objectives ..................................................................................................... 8
3.2. Indicators .................................................................................................................... 9
4. Conclusions .................................................................................................................... 15
5. Recommendations .......................................................................................................... 16
6. Annexes ......................................................................................................................... 18
4
1. INTRODUCTION
Monitoring and evaluation (M&E) for climate change adaptation programs, policies, and strategies – and specifically the indicators of success for measures taken - has been a topic of great interest among international development partners. Donor agencies each have their own respective results frameworks and corresponding guidance that is periodically updated to meet monitoring, reporting and evaluation needs. Often there are overlaps in the technical definitions or conceptual meaning that the indicators used by donor agencies are meant to capture, but there are no streamlined systems for reporting ‘common’ indicators. Therefore, at the partner country level, the recipients of multiple funding sources must manage various expectations despite the duplication of effort and burden of multiple reporting requirements.
The Paris Declaration and Accra Agenda for Action, for example, have encouraged harmonization of various approaches, and better alignment with country systems, but there is much progress to be made. This paper is meant to inform discussions on advancing the options to take advantage of the similarities in methodologies so that less complex and less burdensome systems may be used across various portfolios directly or indirectly addressing climate change adaptation. The core audience for this paper includes interested development and climate change actors, and the GCF board members, as they consider the benefits to consistent and coordinated of approaches, including:
Reducing the burden of M&E for countries and donors
Accelerating learning to improve the quality and value of program implementation
Avoiding unnecessary duplication of effort in measuring results
Reducing transactions costs and increasing efficiency
Improved comparability of results to support better decision making
Responding to the emerging new international climate finance architecture1
The following report helps to identify, in relation to climate change adaptation:
Key themes that organisations are trying to measure;
Where similarities lie between organisations’ monitoring frameworks and indicators; and
Where common methodologies could potentially be adapted from existing approaches.
Following a scoping exercise of dozens of reports, guides, and other documents, resources from the following types of organizations were selected for an in-depth review (see bibliography for citations):
o Six meta-analysis resources on climate change adaptation frameworks (OECD, GIZ, SEA Change & UKCIP, Ecology and Society, UNDP, CGIAR)
o Eighteen climate change adaptation results frameworks, climate screening guides, and other related resources from five bilateral donors (DFID, GIZ, SIDA, JICA, USAID), four multilateral programs (WB CIF PPCR, GEF LDCF/SCCF, UNDP/UNEP PEI, Adaptation Fund), three regional banks (ADB, AfDB, IDB), three country strategies (Kenya, Bangladesh, Indonesia), and one international (IIED) and one regional NGO/research center (Mekong River Commission).
The report is divided into four main sections following this introduction: meta-analysis review; multilateral, bilateral, global, regional and country frameworks review; conclusions; and recommendations. The corresponding sections explain the key questions posed by the analysis and respective findings.
1 PWC/DFID 2013 NB: need full citation.
5
2. REVIEW OF META-STUDIES
A review of existing meta-evaluations of M&E systems for adaptation to climate change was undertaken as a first step to understanding the landscape of actors and approaches in developing and applying climate change adaptation indicators. The review specifically examined publications that consolidate practices and experiences of multiple M&E systems related to adaptation, as well as publications that are relatively recent (i.e. prioritizing those published within the last 2-3 years). In analyzing the meta-evaluations, the types of questions asked included:
How was adaptation defined?
What major themes or categorization of indicators were used? and
What types of recommendations or best practices were formulated on M&E of adaptation?
From among the various resources reviewed, the most pertinent of those identified were four recent (2013) studies: a report by UKCIP and SEA Change
2 that synthesizes current adaptation M&E resources and
frameworks from 16 sources and summarizes their major components; a proposed typology for adaptation indicators by Ford et. al
3., based on their review of existing M&E practices; a comparative analysis of 10
different aggregated M&E frameworks by GIZ;4 and, a review by CGIAR
5 of adaptation M&E systems
specifically from a food security perspective.
In several respects, the meta-evaluation made only small strides in answering the review questions, and publications more often than not contained detailed articulations and reiterations of the challenges involved in creating M&E systems for adaptation as opposed to proposing best practices. Additionally, most of the publications considered M&E systems for adaptation from a management or operational perspective rather than from a thematic perspective. Overall, the publications showed a hesitation to make concrete proposals for M&E systems, and the recommendations centered on the multiple considerations to take into account when creating an M&E system as opposed to defining and proposing an ideal M&E system.
A likely reason for the broad focus on developing and conceptualizing adaptation M&E systems stems from the reality that most of these systems remain in a relatively early stage. Many of the interventions examined are in the process of being formulated but few were fully implemented and/or evaluated after a substantial passing of time. Furthermore, as noted in their review of M&E frameworks for adaptation, Chesterman and Ericksen conclude that most documents merely outline devised frameworks without reporting on actual experiences using the frameworks. The GIZ review adds that discussion on M&E frameworks for adaption take place at the project and programme level, with little attention paid to aggregate levels, such as portfolio, regional and national levels. Overall, the review of meta-evaluations did not uncover best practices or a harmonized categorization of adaptation indicators, but rather it collected a series of considerations and guidance to take into consideration when devising adaptation indicators and using M&E assess interventions.
The first overarching consideration common to the documents reviewed was the difficulty of defining climate change adaption. These difficulties generally include that adaption will likely only be evident in the long-term; the effects of climate change themselves are imprecise; and adaptation involves avoiding or lessening a negative response to imprecise events. In addition, adaptation will necessarily intersect a variety of actors, scales, and sectors, and will be heavily dependent on the respective local contexts, definitions of vulnerability, and tolerance levels for specific risks.
Given the complexity of defining adaptation, much of the guidance on establishing indicators centers on deconstructing the term into manageable dimensions. They can be summarized broadly in the following categories:
2 Bours, D., McGinn, C. and Pringle, P. (2013). “Monitoring & evaluation for climate change adaptation: A synthesis of tools, frameworks and approaches.” SEA Change CoP, Phnom Penh and UKCIP, Oxford. 3 Ford, J. D. et. al. (2013). “How to Track Adaptation to Climate Change: A Typology of Approaches for National-Level Application.” Ecology and Society. 18 (3) 40. 4 GIZ. (November 2013). “Monitoring and Evaluating Adaptation at Aggregated Levels: A Comparative Analysis of Ten Systems.” Eschborn, Germany. 5 Chesterman S, Ericksen P. (2013) “Monitoring adaptation to enhance food security: A survey of approaches and best practice.” CCAFS Working Paper no. 51. CGIAR Research Program on Climate Change, Agriculture and Food Security (CCAFS). Copenhagen, Denmark.
6
1. Process versus Outcome Indicators – One of the most prevalent dichotomies discussed in the review is the choice between outcome and process indicators, and most authors suggest that an M&E system will need to employ both types.
6 Outcome indicators have the advantage of being concrete
representations of an anticipated result and will speak to the effectiveness of adaptation measures; while process indicators can respond to incremental steps taken and changes brought about within the timeframe of a project cycle and include different types of soft adaptation. Ideally, the use of process indicators is combined with a well-defined theory of change to guide and orient indicators.
2. Different purposes or functions of an M&E system - Many authors note the different purposes or
functions of the M&E system itself and how this will influence the choice and weight of different indicators. A broad categorization of these functions includes:
7
a. Monitor climate change, adaptation, and changing local contexts; b. Monitor the implementation process of adaptation interventions and guide decision-making
and/or policy; c. Collect and create an improved knowledge base about climate change adaptation; d. Identify and share best-practices in adaptation; and e. Generate accountability and/or attribution for specific programmes or projects.
3. Degree of integration with national M&E systems – Integrating M&E for adaptation within an
existing national system can reduce duplication of data reporting, reduce the burden of M&E activities, and increase stakeholder buy-in. Integration may also be the logical result of broad overlaps that adaptation has with other development (vulnerability, disaster risk management, poverty alleviation, etc.) and sectoral (agriculture, resource management, etc.) policies. Creating integration and coherence with existing systems will influence the prioritization of adaption indicators.
Overall, the review identified guiding questions and considerations for establishing and choosing indicators for an adaptation M&E framework without identifying specific indicators. In so much as the meta-evaluation resources discussed categories of indicators, they remained largely focused on operational and management categories as opposed to thematic categories. Common assertions gathered through the review on devising such frameworks include:
The choice of indicators should be tied to a conscientious positioning of the given M&E framework in terms of its overall goals;
Indicators should be identified based by explicitly addressing the “messy” elements of defining adaption, including selecting a time-frame and acknowledging local variation;
A well-rounded set of indicators will likely include a variety of qualitative and quantitative indicators as well as process and outcome indicators; and
Indicators will likely be integrated to some degree with other relevant monitoring systems.
If addressing the complexity of adaptation in an M&E System entails relying on a diversity of indicators and aligning an M&E system not only to address different local contexts but also to incorporate existing M&E systems, then the prospect of creating an aggregated list of common indicators across multiple M&E systems for multiple adaptation interventions becomes all the more complex. It appears from the brief review conducted to launch this mandate that while identification of the difficulties, challenges, and stakes at hand in creating adaptation M&E systems has been covered extensively by the literature, a systematic comparison of adaptation indicators has not necessarily been conducted.
6 See Bours, D., McGinn, C. and Pringle, P. 2013 and Ford, J. D. et. al. (2013) in particular.
7 GIZ. (November 2013).
7
3. REVIEW OF ADAPTATION RESULTS
FRAMEWORKS
The following section describes the findings of the desk review of core adaptation results frameworks, strategies, policies, guides and plans operational in bilateral, multilateral, and regional organizations, and countries. The review gathered information on the nature and purposes of the resource, which break down across the following categories as their primary function:
Policy/required results-based monitoring framework for portfolio: 5
Tools for assessing climate risks/climate screening of portfolio: 4
Research of many frameworks/Guide or proposal of an approach: 6
National Climate Change Plan or Strategy: 3
The review of materials sought to answer the following two question areas, which are discussed further below:
1. High-level adaptation objectives: What does the institution or organization consider to be adaptation success?
Expected impacts (if at all) Expected high-level outcomes (if any)
2. Indicators: What indicators are identified across theses following primary thematic areas? Institutionalization, climate information, natural resource management, resilience,
transformational change; and these secondary areas? Livelihoods and economic benefits; coordination; resources and budgeting; capacities
and skills (individual or institutional); planning/decision-making; knowledge, understanding and awareness; participation and engagement; risk management; other.
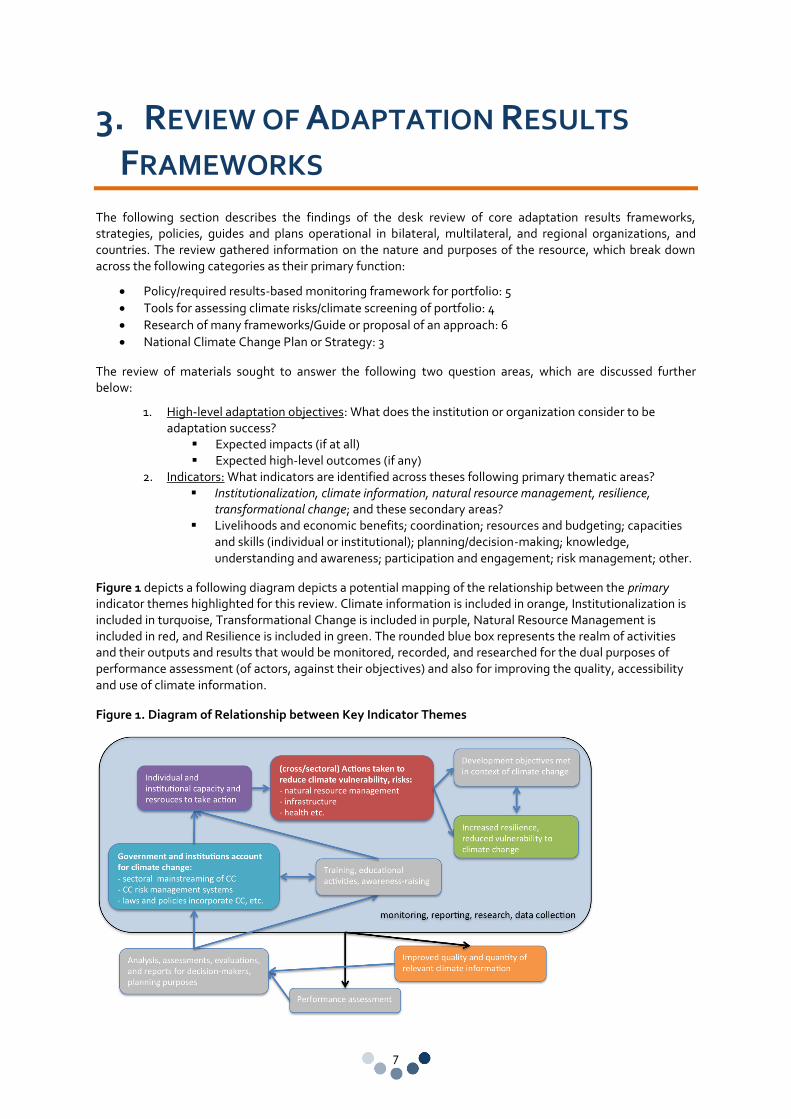
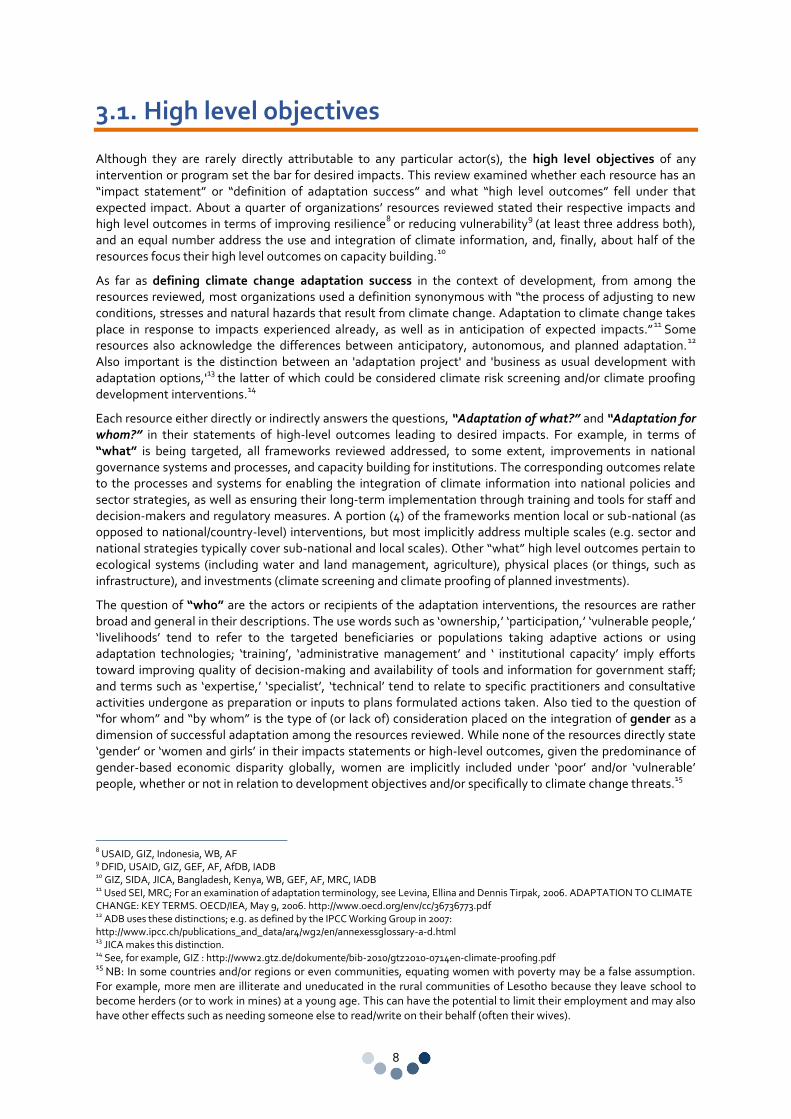
Figure 1 depicts a following diagram depicts a potential mapping of the relationship between the primary indicator themes highlighted for this review. Climate information is included in orange, Institutionalization is included in turquoise, Transformational Change is included in purple, Natural Resource Management is included in red, and Resilience is included in green. The rounded blue box represents the realm of activities and their outputs and results that would be monitored, recorded, and researched for the dual purposes of performance assessment (of actors, against their objectives) and also for improving the quality, accessibility and use of climate information.
Figure 1. Diagram of Relationship between Key Indicator Themes
8
3.1. High level objectives
Although they are rarely directly attributable to any particular actor(s), the high level objectives of any intervention or program set the bar for desired impacts. This review examined whether each resource has an “impact statement” or “definition of adaptation success” and what “high level outcomes” fell under that expected impact. About a quarter of organizations’ resources reviewed stated their respective impacts and high level outcomes in terms of improving resilience
8 or reducing vulnerability
9 (at least three address both),
and an equal number address the use and integration of climate information, and, finally, about half of the resources focus their high level outcomes on capacity building.
10
As far as defining climate change adaptation success in the context of development, from among the resources reviewed, most organizations used a definition synonymous with “the process of adjusting to new conditions, stresses and natural hazards that result from climate change. Adaptation to climate change takes place in response to impacts experienced already, as well as in anticipation of expected impacts.”
11 Some
resources also acknowledge the differences between anticipatory, autonomous, and planned adaptation.12
Also important is the distinction between an 'adaptation project' and 'business as usual development with adaptation options,'
13 the latter of which could be considered climate risk screening and/or climate proofing
development interventions.14
Each resource either directly or indirectly answers the questions, “Adaptation of what?” and “Adaptation for whom?” in their statements of high-level outcomes leading to desired impacts. For example, in terms of “what” is being targeted, all frameworks reviewed addressed, to some extent, improvements in national governance systems and processes, and capacity building for institutions. The corresponding outcomes relate to the processes and systems for enabling the integration of climate information into national policies and sector strategies, as well as ensuring their long-term implementation through training and tools for staff and decision-makers and regulatory measures. A portion (4) of the frameworks mention local or sub-national (as opposed to national/country-level) interventions, but most implicitly address multiple scales (e.g. sector and national strategies typically cover sub-national and local scales). Other “what” high level outcomes pertain to ecological systems (including water and land management, agriculture), physical places (or things, such as infrastructure), and investments (climate screening and climate proofing of planned investments).
The question of “who” are the actors or recipients of the adaptation interventions, the resources are rather broad and general in their descriptions. The use words such as ‘ownership,’ ‘participation,’ ‘vulnerable people,’ ‘livelihoods’ tend to refer to the targeted beneficiaries or populations taking adaptive actions or using adaptation technologies; ‘training’, ‘administrative management’ and ‘ institutional capacity’ imply efforts toward improving quality of decision-making and availability of tools and information for government staff; and terms such as ‘expertise,’ ‘specialist’, ‘technical’ tend to relate to specific practitioners and consultative activities undergone as preparation or inputs to plans formulated actions taken. Also tied to the question of “for whom” and “by whom” is the type of (or lack of) consideration placed on the integration of gender as a dimension of successful adaptation among the resources reviewed. While none of the resources directly state ‘gender’ or ‘women and girls’ in their impacts statements or high-level outcomes, given the predominance of gender-based economic disparity globally, women are implicitly included under ‘poor’ and/or ‘vulnerable’ people, whether or not in relation to development objectives and/or specifically to climate change threats.
15
8 USAID, GIZ, Indonesia, WB, AF 9 DFID, USAID, GIZ, GEF, AF, AfDB, IADB 10 GIZ, SIDA, JICA, Bangladesh, Kenya, WB, GEF, AF, MRC, IADB 11 Used SEI, MRC; For an examination of adaptation terminology, see Levina, Ellina and Dennis Tirpak, 2006. ADAPTATION TO CLIMATE CHANGE: KEY TERMS. OECD/IEA, May 9, 2006. http://www.oecd.org/env/cc/36736773.pdf 12 ADB uses these distinctions; e.g. as defined by the IPCC Working Group in 2007: http://www.ipcc.ch/publications_and_data/ar4/wg2/en/annexessglossary-a-d.html 13 JICA makes this distinction. 14 See, for example, GIZ : http://www2.gtz.de/dokumente/bib-2010/gtz2010-0714en-climate-proofing.pdf 15
NB: In some countries and/or regions or even communities, equating women with poverty may be a false assumption. For example, more men are illiterate and uneducated in the rural communities of Lesotho because they leave school to become herders (or to work in mines) at a young age. This can have the potential to limit their employment and may also have other effects such as needing someone else to read/write on their behalf (often their wives).
9
In short, each results framework has a particular entry point (point of departure or primary focus), timescale, and geographic scope or scale of expected operation. Nevertheless, two key elements of the high level objectives of all frameworks proposed are:
Ensuring availability, quality, and use of climate information in forming plans, strategies, and in taking actions: Assist actors in having relevant climate risk analysis, vulnerability assessments, climate projections, and other climate-related information available and usable to the persons closest to a position of decision-making or taking action.
Addressing specific climate risks and/or vulnerabilities: Enabling specific actors to formulate plans and take actions that target particular populations, sectors, or other points of entry based on identified climate vulnerabilities and climate risks.
16
Ultimately, the high level objectives of all resources aim to enable the attainment of development objectives – and ensuring human security - in spite of climate change, e.g. “Securing ecological, economic and social development goals despite climate change.”
17 Several resources also push for a different ‘development
pathway,’ or one that is ‘climate compatible.’ This is especially prominent in the country strategies for at least two reason: early identification of the synergies (and trade-offs) between climate change adaptation and climate change mitigation reduce the risks in planning for investments and can help to obtain various sources of climate financing; and adopting technologies early, or following a ‘leap frog’ model, can mean a higher likelihood of long term economic growth and stability in the face of climate change.
Finally, underlying all resources high-level objectives is the significance of ‘ownership,’ ‘knowledge,’ ‘awareness-raising,’ and quality of ‘engagement’ or ‘participation’ of targeted groups, actors, and populations. This can mean setting up systems for communication and coordination to channel information to relevant audiences/user groups, setting standard and expectations for knowledge management and information exchange, and establishing processes for deliberation and due diligence on planned actions as well as reflection and learning from actions taken. Without these elements, actions risk having low levels of legitimacy, and may risk being irrelevant or inappropriate to the local context, especially in the medium to long term.
3.2. Indicators
The review identified approximately 415 indicators outlined by the various resources, which cover all of the identified thematic areas, with very few exceptions. Several indicators repeat (approximately 70), or they intend to measure the same phenomena - or different aspects of the same phenomena - but are slightly different in focus or wording.
Part of the reason for the significant overlap in the types of changes and results that the indicators seek to capture is due to a number of composite or “index” indicators, which are comprised of a formula or combination of several (weighted or un-weighted) variables or factors. For example, the term vulnerability is typically interpreted as a function of sensitivity and exposure in relation to adaptive capacity to a particular climate risk.
18 Therefore, vulnerability indicators inevitably require more granular measurements that address
who and what is vulnerable, and in what ways, and to what extent. Likewise, terms such as ‘resilience’ and ‘livelihood’ are complex and require a further technical definition. Another reason for overlap in what the adaptation indicators aim to measure is the need for an explanation for the range of desired change – e.g. what is meant by “sufficient” or “access” or “level.” In short, the qualitative aspect aspects of the indicator need to be either quantified, or mapped to a scale to understand relative movements toward or away from desired changes over time.
16 Vulnerability is a subjective/socially constructed term and therefore needs to be defined by those closes to implementation; also most vulnerability can be attributed to the “development gap” or a lack of meeting basic human needs, which is exacerbated by - not caused by - climate change. 17 - sammenarbeit (GIZ) GmbH/BMZ 2013. 18 In accordance to the 2001 IPCC definition, vulnerability is f(sensitivity, exposure, capacity), or (exposure * sensitivity) / adaptive capacity.
10
The second main characteristic of the group of indicators reviewed is that they propose a mix of both prescriptive and example indicators. In short, some resources reviewed outline indicators that are required (to be measured and reported by the financing recipient) and some are only optional or illustrative. For example, the Pilot Project for Climate Resilience (World Bank Climate Investment Fund) results framework
19
contains 5 core mandatory indicators to be tracked by all projects, in any region or country, and an additional 8 that are optional for the country to monitor and report if they are already tracking that indicator, or if they have the particular reasons and means to do so. Contrasting this is the SIDA study
20 reviewed, which uses an
OECD categorization21
of adaptation indicators as the basis for mapping illustrative examples from other guides and tools.
Also, many (approximately 70) indicators could be categorized under more than one theme. In addition there are several cross-cutting considerations raised in the guidance that cut-across all indicators, such as:
Gender (both using a gender “lens” in choosing indicators and also disaggregating existing indicators by gender where possible);
Trade offs and synergies between climate change adaptation and climate change mitigation (where to spend resources and/or which options may yield results under one or another);
Scale (national and local/community-level interventions are rarely clearly connected, and doing so has the potential of mutual benefits for both);
Sectoral vs non-sectoral approach (many adaptation themes and objectives are cross-sectoral but budgets and operational management often occurs by sector);
Tailoring of indicators (since climate change adaptation is highly contextual by nature, generic indicators need to be made relevant to local needs and goals); and
Expected impacts (an absence of an event or an absence of loss can be a success in climate change adaptation, but does not lend itself readily to indicators and measurement).
While most of the cross-cutting topics reflected in the list above reflect “what” is being adapted in the form of technical (scale, tailoring indicators, expected impacts) and political challenges (trade-offs, sectoral vs non-sectoral) of prioritizing actions, gender addresses “who” is (not) captured in the results frameworks. A further examination of how this issue is treated in the resources reviewed shows that there are at least 16 examples of indicators across 6 resources.
22 Gender is reflected in two possible ways in the proposed indicators:
o Gender disaggregation: These resources that directly recommend or advise the disaggregation of males to females for specific indicators in their results frameworks. These include 2 indicators in Natural Resource Management that relate to the percent of poor people with access to water in drought prone areas
23, and another on the extent to which adaptation measures taken provide equal
benefits to men and women.24
For Resilience one indicator disaggregates number of people with access to safe water supply and basic sanitation.
25 Under Transformational Change are 2 indicators;
one on the increased proportion of females to males who are ‘active’ in the implementation of climate adaptation measures,
26 and a second on targeted groups adopting adaptation technologies.
27
For “Livelihoods and Economic Benefits,” one example indicator pertains to livelihood protection of vulnerable socio-economic groups,
28 and another secure access to livelihood assets.
29 For
“C y/ ” 4 F y x; staff trained on technical adaptation themes; capacity to transfer appropriate adaptation technologies;
19 CIF (December 2012). Revised PPCR Results Framework. Climate Investment Funds. World Bank. https://www.climateinvestmentfunds.org/cif/sites/climateinvestmentfunds.org/files/Revised_PPCR_Results_Framework.pdf 20 C w y ’ w C C C von Walter. SIDA's helpdesk for environment and climate change. October, 2013. 21 Gigli, S. and S. Agrawala (2007), Stocktaking of Progress on Integrating Adaptation to Climate Change into Development Co-operation Activities, COM/ENV/EPOC/DCD/DAC(2007)1/FINAL, OECD, Paris. 22 It should be noted that the GEF AMAT has a disproportionately large number of gender disaggregated indicators compared to the other resources reviewed, accounting for 11 of the 16 example indicators. 23 GIZ 24 Kenya 25 GEF 26 GIZ 27 GEF 28 Bangladesh 29 GEF
11
and individuals trained in adaptation-related technologies. “K w w ” “P ” saggregated indicator: percent of the targeted population with awareness of predicted adverse impacts of climate change and appropriate responses; and percent of population affirming ownership of adaptation processes, respectively.
30 F y “R M ” /
areas with access to the early warning system31
; percent of targeted population covered by insurance mechanisms; and finally the percent of population with access to improved flood and drought management.
32
o Gender-specific indicators: These indicators include those that are tracked because a vulnerability assessment or other baseline study shows that a change in the value of the indicator affects the health or wellbeing of women (or men), specifically; e.g. applying an evidence-based gender-lens to the indicator selection process. These indicators do not require gender disaggregation because they are chosen principally for their impact on a specific gender. For example, accessibility to hot water at night might be a primary concern to women (but not men). Therefore, in an area with severe land degradation that is further exacerbated change, having a stove burns efficiently enough to maintain that hot water all night with the limited fuel available may be an indicator of adaptive progress (only) for women. Bangladesh and Indonesia, for example, suggest gender-specific processes indicators; to strengthen the consideration of gender in climate change management,
33 and ensure the
engagement of the appropriate ministries (Women Empowerment and Child Protection) in a coordinated approach to climate change adaptation.
34
The findings suggest that for indicators, donors and development partners are far more likely to disaggregate existing types of indicators by gender than they are to devise specific gender-based indicators that directly measure the perceptions, experiences, challenges, needs, or other considerations that are unique to females (in context).
35 The reasons for this preference could be the need for a basis of
comparison or ratio of changes for/among women as compared to men (or visa versa, as the case may be); and also to more easily enable aggregation across a (global, national) portfolio of activities that feed into a single results framework. Gender specific indicators may be difficult to aggregate because they are context-specific and therefore may not be sufficiently relevant to more than a particular region or country. Finally, even though the long-term benefits of gender equality is well known,
36 gender-specific indicators may have
up-front budgetary implications and require additional measures to collect and assess over the course of the intervention. Unless gender is a (required) priority those deigning the intervention, it may be overlooked.
According to the categorization of indicators used, the thematic areas that did not directly address gender in the results frameworks reviewed are Institutionalization, Climate Information, Coordination, Resources//budgeting, and Planning/Decision-making. The largest categories for gender disaggregation were “Capacity/Skills” (4 indicators) and “Risk Management” (3 indicators). The entry point for gender indicators appears most frequently at the intervention/ground level and not at the institutional level, and also the categorization of indicators meant that examples fell under the most relevant area, even if they overlapped/could fall into more than one. For example, Capacity building and Risk Management were the two largest categories for gender integration, but depending on the nature and scale of the intervention, they could be incorporated into the indicator themes above that did not directly address gender. Also, Risk Management requires Coordination, for example, but the gender entry point could be at the community level or household level, or the provincial/district level, or at the national level. Also, most projects and programs seek to capture change they have affected, which is commonly at the smallest possible scale of intervention (e.g. most projects do not have the control over institutional processes or systems).
As a precursor to the identification of useful indicators to measure adaptation success with a gender perspective are the approaches and tools that can be used to integrate gender into interventions and their
30 Both GEF 31 Kenya 32 GEF 33 Bangladesh; NB: this indicator is relatively high-level and not easily interpreted or operationalized without a technical definition. 34 Indonesia 35 e.g. MRC “ en and women are likely to perceive and experience climate change differently, meaning that they have …w entify any methods and tools [that] specifically focus on how men and women x z x w y ” 36 For example, see this study of progress on 7 priority areas conducted by the International Council for Research on Women: http://www.icrw.org/files/publications/Seven-Priorities-Seven-Years-to-Go-Progress-on-Achieving-Gender-Equality.pdf
12
management. There are two ways that resources can potentially address this; namely, giving guidance to help ensure a balanced and appropriate engagement of men and women in either designing and/or executing interventions; and, providing advice on using gender-sensitive processes and methods/tools used in planning and implementing the M&E system. For example, the MRC states that “men and women are likely to perceive and experience climate change differently, meaning that they have different adaptation needs. The …w y y [ ] y w w x and respond to climate stress, hazards and extremes in diffe w y ”
37 However, neither of these
approaches will necessarily be reflected in the actual results frameworks, however, as they are a matter of policy and incentives to identify, capture and use information on these differing needs where appropriate.
As far as tools and approaches that incorporate gender needs and gender sensitivity, there are broad statements of commitment on the part of the donors and development actors to consider the implications of gender and how it might shape their tools, approaches, management, and budget. However, on the basis of resources reviewed, actual plans or strategies for either the identification of appropriate indicators or guidance for the appropriate tools or approaches to take to incorporate gender into M&E are lacking. Also, intent must be met with commensurate budget and other resources for execution, which cannot be known on the basis of M&E guidance and results frameworks. Evidence of whether broad intentions are met with specific actions requires review and/or an impact assessment of the role gender plays in the design and implementation of respective climate change adaptation interventions.
3.2.1. Similarities
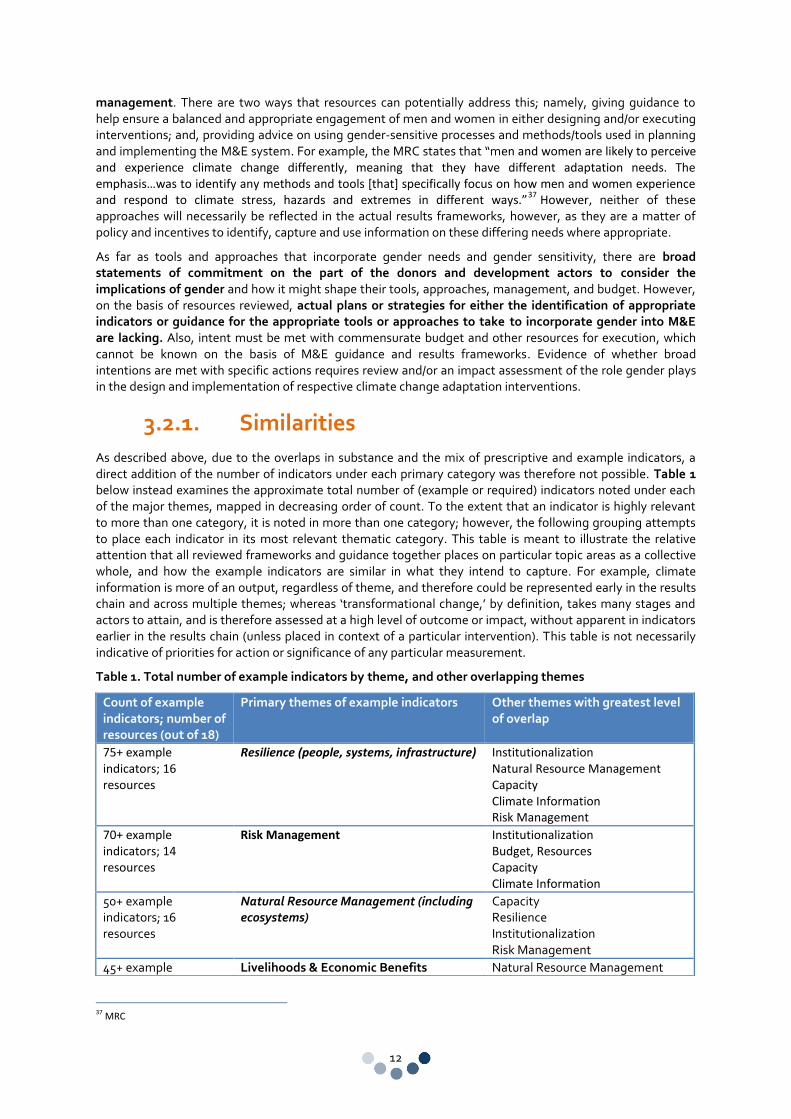
As described above, due to the overlaps in substance and the mix of prescriptive and example indicators, a direct addition of the number of indicators under each primary category was therefore not possible. Table 1 below instead examines the approximate total number of (example or required) indicators noted under each of the major themes, mapped in decreasing order of count. To the extent that an indicator is highly relevant to more than one category, it is noted in more than one category; however, the following grouping attempts to place each indicator in its most relevant thematic category. This table is meant to illustrate the relative attention that all reviewed frameworks and guidance together places on particular topic areas as a collective whole, and how the example indicators are similar in what they intend to capture. For example, climate information is more of an output, regardless of theme, and therefore could be represented early in the results chain and across multiple themes; whereas ‘transformational change,’ by definition, takes many stages and actors to attain, and is therefore assessed at a high level of outcome or impact, without apparent in indicators earlier in the results chain (unless placed in context of a particular intervention). This table is not necessarily indicative of priorities for action or significance of any particular measurement.
Table 1. Total number of example indicators by theme, and other overlapping themes
37 MRC
Count of example indicators; number of resources (out of 18)
Primary themes of example indicators Other themes with greatest level of overlap
75+ example indicators; 16 resources
Resilience (people, systems, infrastructure) Institutionalization Natural Resource Management Capacity Climate Information Risk Management
70+ example indicators; 14 resources
Risk Management Institutionalization Budget, Resources Capacity Climate Information
50+ example indicators; 16 resources
Natural Resource Management (including ecosystems)
Capacity Resilience Institutionalization Risk Management
45+ example Livelihoods & Economic Benefits Natural Resource Management
13
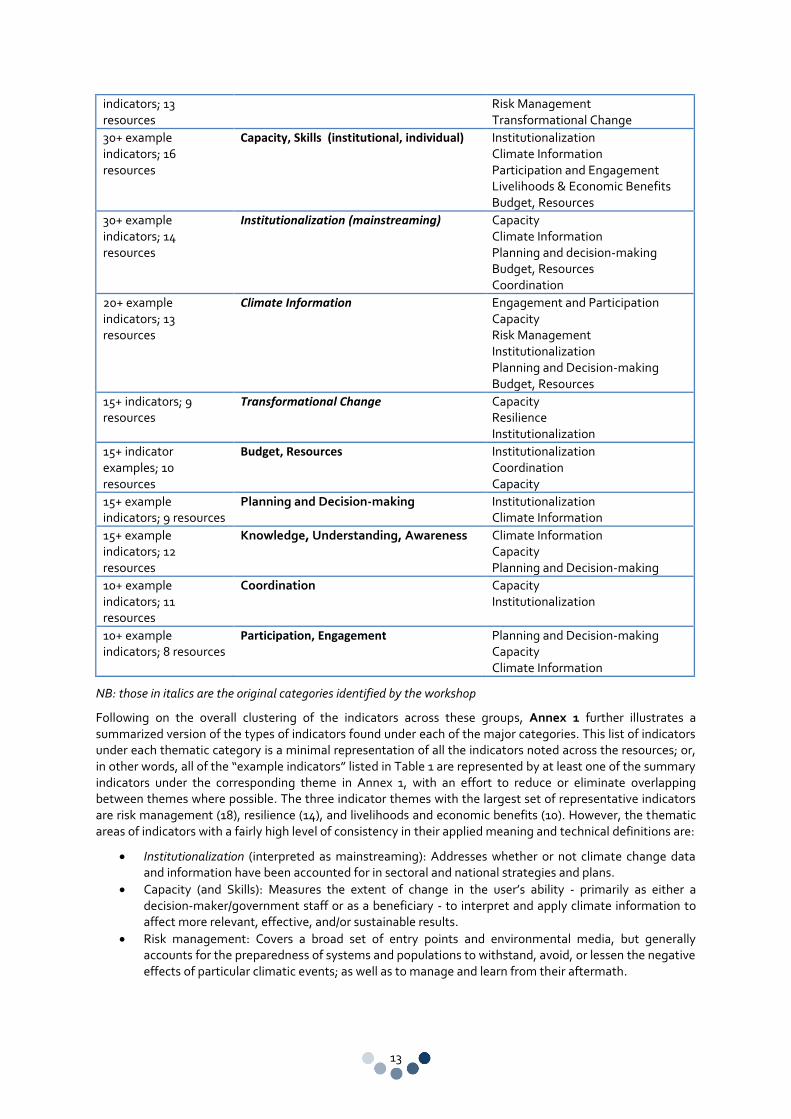
NB: those in italics are the original categories identified by the workshop
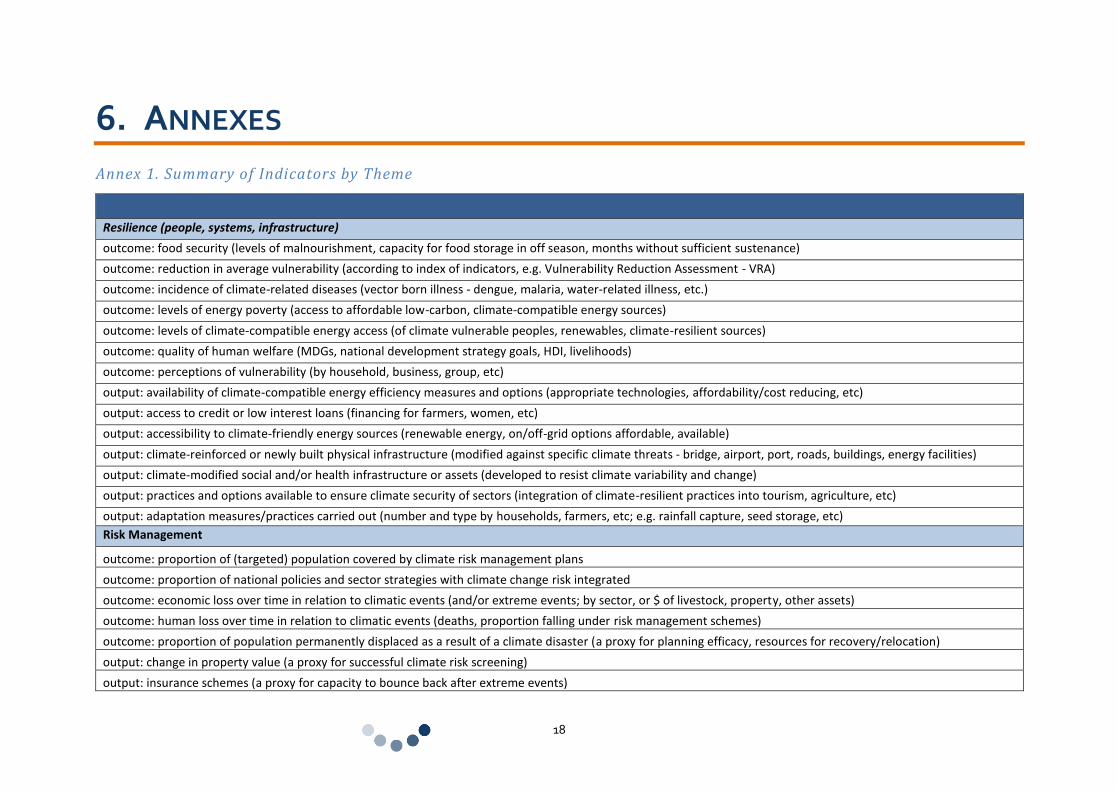
Following on the overall clustering of the indicators across these groups, Annex 1 further illustrates a summarized version of the types of indicators found under each of the major categories. This list of indicators under each thematic category is a minimal representation of all the indicators noted across the resources; or, in other words, all of the “example indicators” listed in Table 1 are represented by at least one of the summary indicators under the corresponding theme in Annex 1, with an effort to reduce or eliminate overlapping between themes where possible. The three indicator themes with the largest set of representative indicators are risk management (18), resilience (14), and livelihoods and economic benefits (10). However, the thematic areas of indicators with a fairly high level of consistency in their applied meaning and technical definitions are:
Institutionalization (interpreted as mainstreaming): Addresses whether or not climate change data and information have been accounted for in sectoral and national strategies and plans.
Capacity (and Skills): Measures the extent of change in the user’s ability - primarily as either a decision-maker/government staff or as a beneficiary - to interpret and apply climate information to affect more relevant, effective, and/or sustainable results.
Risk management: Covers a broad set of entry points and environmental media, but generally accounts for the preparedness of systems and populations to withstand, avoid, or lessen the negative effects of particular climatic events; as well as to manage and learn from their aftermath.
indicators; 13 resources
Risk Management Transformational Change
30+ example indicators; 16 resources
Capacity, Skills (institutional, individual) Institutionalization Climate Information Participation and Engagement Livelihoods & Economic Benefits Budget, Resources
30+ example indicators; 14 resources
Institutionalization (mainstreaming) Capacity Climate Information Planning and decision-making Budget, Resources Coordination
20+ example indicators; 13 resources
Climate Information Engagement and Participation Capacity Risk Management Institutionalization Planning and Decision-making Budget, Resources
15+ indicators; 9 resources
Transformational Change Capacity Resilience Institutionalization
15+ indicator examples; 10 resources
Budget, Resources Institutionalization Coordination Capacity
15+ example indicators; 9 resources
Planning and Decision-making Institutionalization Climate Information
15+ example indicators; 12 resources
Knowledge, Understanding, Awareness Climate Information Capacity Planning and Decision-making
10+ example indicators; 11 resources
Coordination Capacity Institutionalization
10+ example indicators; 8 resources
Participation, Engagement Planning and Decision-making Capacity Climate Information
14
Natural resource management: Largely focuses on the use of land, including forest and agricultural areas, and water systems as key elements to planning for the effects of climate variability and change, and taking advantage of opportunities to improve well-being as a result of good practices.
Climate information: Captures the range of research and tools used for planning and decision-making, as well as the quality and extent of availability of relevant information via dissemination channels.
Livelihoods and Economic Benefits: Valuates the assets and/or monetary gains - including income in jobs un-/less affected by climate change, as well as ecosystem services protected or enhanced - as a result of actions taken as a response to existing climate pressures, or in anticipation of likely ones.
Budget, Resources: Outlines necessary financing mobilized, and/or appropriated, to take actions on strategies and plans, and also includes their enforcement.
Planning and Decision-making: Deals with the necessity and extent of planning and decision-making under uncertainty, and the systems and tools to support participation in short-term decision-making and long-term planning.
Knowledge, Understanding, Awareness: Addresses the assumption that people behave differently if they have different (better quality, more useful) information, and therefore this set of indicators accounts the change in awareness and understanding at the public and institutional levels, and the fora and platforms used to disseminate the targeted information.
Participation and Engagement: This theme measures the quality and extent of due diligence of the deliberative process to shape options and decide on actions to take in the face of climate change and climate variability, and it covers all scales, from community/local to national/policy levels.
As part of this assignment three areas were requested for further exploration of indicator sub-categorization and/or definitions in use by the resources reviewed: climate information and institutionalization.
As noted above, nearly three quarters of all resources reviewed addressed climate information in one way or another in their results frameworks. About 20 indicators from 13 resources touched on it relation to the existence (generation or production) and quality (e.g. accuracy, completeness, relevance) of information products/outputs and with respect to their (degree of) accessibility, actual (extent of) use, and perceived (level of) utility. The changes captured in the indicators are relatively consistent, with only 6 summary indicators (5 outputs, 2 outcomes), as shown in Annex 1. Table 1 notes that climate information shares overlapping content most commonly with the following other categories, followed by examples of indicator areas:
o Engagement and Participation: languages used in dissemination materials; threat and hazard information disseminated; use of climate information by key stakeholders in climate-sensitive sectors
o Capacity: generation of exposure and socio-economic datasets; climate change modeling at national and sub-national levels; documented research on the interaction of climate protection measures and other aspects of environmental management (e.g. biodiversity conservation); effective adaptive strategies communicated
o Risk Management: early warning and health hazards dissemination outlets; meteorological information products (seasonal forecasts, monthly bulletins) for farmers and entrepreneurs in drought/flood-prone areas (and or to tourism operators)
o Institutionalization: reports detailing data collection and summarizing information; regular use of climate risk and climate change information by relevant departments; institutional mandates to raise awareness of and disseminate information about climate change (risks, impacts, responses, etc)
o Planning and Decision-making: climate information used to inform responses to climate change (including sectorial); preparatory studies for responses to particular threats; methods and decision-support tools for using climate scenarios and impact research
o Budget, Resources: allocation of resources toward climate change information dissemination;
Also found in three quarters of the resources reviewed, institutionalization of climate change adaptation, the resources reviewed interpreted the integration of climate change data or analyses, or adaptation priorities or needs, into sector plans/strategies and/or (sub) national development plans/strategies. With only 5 summary indicators (3 outputs, 2 outcomes; See annex 1) capturing the substance of the full range of the 30+ examples provided across the resources, this thematic category had relatively little variation in definition. The main areas of thematic overlap were with the following categories, followed by example indicator types:
o Capacity: mainstream existing risk management tools (tourism microfinance, grant and loan schemes, and also examine feasibility of a climate-risk transfer/insurance mechanism); laws and regulations
15
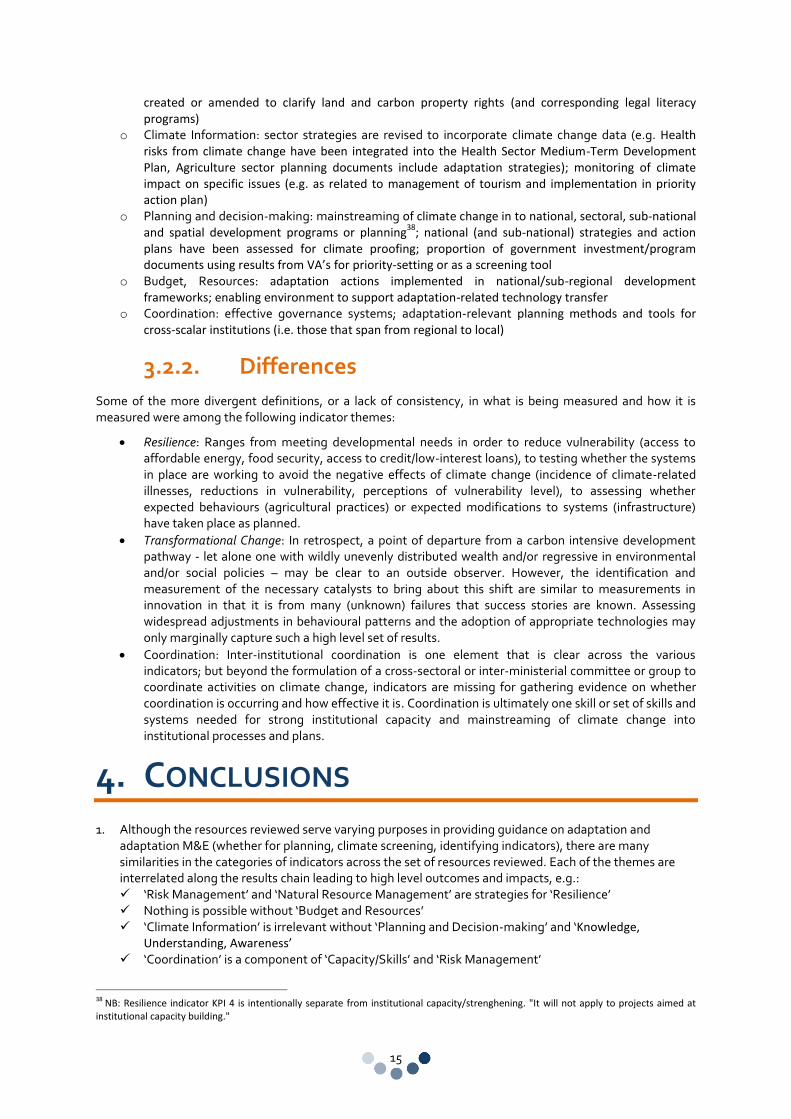
created or amended to clarify land and carbon property rights (and corresponding legal literacy programs)
o Climate Information: sector strategies are revised to incorporate climate change data (e.g. Health risks from climate change have been integrated into the Health Sector Medium-Term Development Plan, Agriculture sector planning documents include adaptation strategies); monitoring of climate impact on specific issues (e.g. as related to management of tourism and implementation in priority action plan)
o Planning and decision-making: mainstreaming of climate change in to national, sectoral, sub-national and spatial development programs or planning
38; national (and sub-national) strategies and action
plans have been assessed for climate proofing; proportion of government investment/program V ’ for priority-setting or as a screening tool
o Budget, Resources: adaptation actions implemented in national/sub-regional development frameworks; enabling environment to support adaptation-related technology transfer
o Coordination: effective governance systems; adaptation-relevant planning methods and tools for cross-scalar institutions (i.e. those that span from regional to local)
3.2.2. Differences
Some of the more divergent definitions, or a lack of consistency, in what is being measured and how it is measured were among the following indicator themes:
Resilience: Ranges from meeting developmental needs in order to reduce vulnerability (access to affordable energy, food security, access to credit/low-interest loans), to testing whether the systems in place are working to avoid the negative effects of climate change (incidence of climate-related illnesses, reductions in vulnerability, perceptions of vulnerability level), to assessing whether expected behaviours (agricultural practices) or expected modifications to systems (infrastructure) have taken place as planned.
Transformational Change: In retrospect, a point of departure from a carbon intensive development pathway - let alone one with wildly unevenly distributed wealth and/or regressive in environmental and/or social policies – may be clear to an outside observer. However, the identification and measurement of the necessary catalysts to bring about this shift are similar to measurements in innovation in that it is from many (unknown) failures that success stories are known. Assessing widespread adjustments in behavioural patterns and the adoption of appropriate technologies may only marginally capture such a high level set of results.
Coordination: Inter-institutional coordination is one element that is clear across the various indicators; but beyond the formulation of a cross-sectoral or inter-ministerial committee or group to coordinate activities on climate change, indicators are missing for gathering evidence on whether coordination is occurring and how effective it is. Coordination is ultimately one skill or set of skills and systems needed for strong institutional capacity and mainstreaming of climate change into institutional processes and plans.
4. CONCLUSIONS
1. Although the resources reviewed serve varying purposes in providing guidance on adaptation and adaptation M&E (whether for planning, climate screening, identifying indicators), there are many similarities in the categories of indicators across the set of resources reviewed. Each of the themes are interrelated along the results chain leading to high level outcomes and impacts, e.g.: ‘Risk Management’ and ‘Natural Resource Management’ are strategies for ‘Resilience’ Nothing is possible without ‘Budget and Resources’ ‘Climate Information’ is irrelevant without ‘Planning and Decision-making’ and ‘Knowledge,
Understanding, Awareness’ ‘Coordination’ is a component of ‘Capacity/Skills’ and ‘Risk Management’
38 NB: Resilience indicator KPI 4 is intentionally separate from institutional capacity/strenghening. "It will not apply to projects aimed at institutional capacity building."
16
‘Institutionalization’ is irrelevant without ‘Capacity/Skills’ to act on it ‘Livelihoods and Economic Benefits’ are proxies for short and medium-term ‘Resilience’
2. Although there are many similarities in how these indicators are defined, not all indicators are robust and/or SMART.
39 For example, if the very phenomenon to be measured by the indicator is part of the
definition itself, it leads to circular reasoning. “Participation in decision-making,” for example, needs to then define what is meant by ‘participation‘ and ‘decision-making,’ respectively, before meaningful monitoring can take place and targets can be set. Another area open to interpretation is the relevance of any given indicators to any particular context. An indicator such as “crop diversification,” for example, can be consistently defined in the technical sense, between various results frameworks, but may not be the most relevant indicator in a particular context, and therefore results gathered under the assumption that it is relevant may be misleading. Finally, one other consideration is that consistently defined indicators – at the global level - may be useful for one set of users and not another. With the exception of those derived from country strategies, many of the results frameworks reviewed are developed out of a process of deliberation with a limited set of actors (e.g. government officials and development agencies), and indicators may be similar because that set of actors share similar needs or interests in the use and utility of data gathered and not because they reflect meaningful results to other audiences (e.g. farmers, community leaders, district officials).
3. The review also considered the ‘Solutions and Guidance’ offered by each of the respective resources, by asking “What advice, conclusions, recommendations or lessons learned are proposed by the approach?” However, very few resources outlined any guidance on the benefits (or trade-offs) of a coordinated or common approach to indicators.
40 Some other advisory points, however, were to consider:
Affordability of monitoring and reporting on each indicator consistently and accurately over time
Choosing indicators that help make the economic case for particular actions or strategies
Maintaining flexibility with the results framework, allowing for (pilot) countries to add or adjust indicators at a later date for projects and programs
Less is more and a small set of well-tracked indicators is better than several at multiple levels
Indicators that provide relative data (proportion, percent, ratio) ease tracking of overall progress in the larger context
Indicators should be chosen based on information already available41
2. The issue of gender and gender-sensitivity consistently appears as an element to climate change adaptation interventions in all resources reviewed. In the results frameworks, gender is most commonly incorporated as a dimension to addressing the needs of vulnerable (and poor) populations and in the form of a gender-disaggregated indicator. However, gender is often only mentioned in the introduction to the report, without further elaboration in relation to either a gender policy and/or active guidance on the identification of gender-appropriate indicators or the engagement of women and girls the design and execution of activities, including for M&E.
5. RECOMMENDATIONS
1. Prior to the development of a results framework for an adaptation intervention or a development intervention with an adaptation component, use a screening device, similar to an adaptation marker
42,
that helps narrow the scope of the results framework – and potentially cost of implementation - to common but meaningful indicators. For example, answer the following 2 questions and corresponding sub-questions:
a. In what ways does this intervention address specific climate risks and/or specific climate vulnerabilities?
i. What are the risks? Who and what is exposed or sensitive to these risks?
39 IADB and SIDA both discuss steps toward developing meaningful indicators. 40
DFID, WB, GEF, and AF note some benefits to sticking to a small set of indicators. 41
Summary points from UNDP/UNEP PEI, WB, DFID, AF. 42
OECD, 2011. Handbookon the OECD-DAC Climate Markers. OECD-DAC. September, 2011.
17
ii. Who and what is vulnerable? (How is vulnerability defined?) iii. What is the expected impact? Probability? iv. Who and what will be affected, and over what period of time?
b. In what ways does this intervention enhance or enable the use of climate information? i. Who is using the information generated?
ii. How will they receive this information? iii. Into what process or decisions can the information be used? iv. Over what period of time is this information relevant?
2. In light of the significant overlaps in existing indicators used to track adaptation, and the need for a consistent and small set of global indicators to track (See Annex 2 for detailed description):
a. Level of human well-being relative to climate variability and extreme events b. Number new strategies, practices, or new technologies used in response to current climate
variability or expected climate change c. Proportion of climate-integrated sector strategies (and national development plan) that are
sufficiently resourced d. Extent to which relevant climate information and analyses reaches intended actors
3. Finally, other operational considerations to account for in using a common approach to indicators and methodologies are to:
a. Note entry points: In order to draw a meaningful line of contribution toward results, each intervention, at any scale, should indicate its respective starting point and intended end-point among a larger set of actors and activities (including other ongoing adaptation interventions and/or development interventions with adaptation components).
a. Track assumptions: Assumptions are the foundation behind each intervention approach and its intended results, and are the basis for learning from previous reasoning in the design and execution of interventions.
b. Incorporate gender: Articulate clear connections between formal gender policies for development strategies and results frameworks and the tools, approaches and indicators used for climate change adaptation interventions.
18
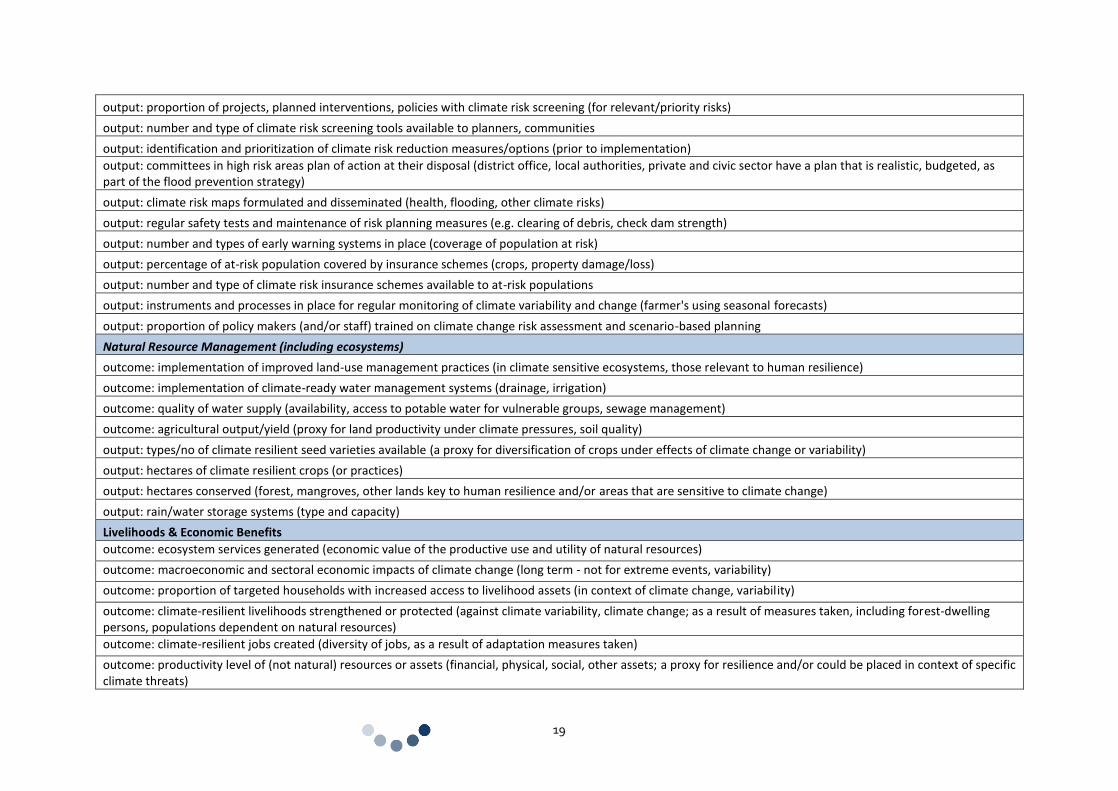
6. ANNEXES
Annex 1. Summary of Indicators by Theme
Resilience (people, systems, infrastructure)
outcome: food security (levels of malnourishment, capacity for food storage in off season, months without sufficient sustenance)
outcome: reduction in average vulnerability (according to index of indicators, e.g. Vulnerability Reduction Assessment - VRA)
outcome: incidence of climate-related diseases (vector born illness - dengue, malaria, water-related illness, etc.)
outcome: levels of energy poverty (access to affordable low-carbon, climate-compatible energy sources)
outcome: levels of climate-compatible energy access (of climate vulnerable peoples, renewables, climate-resilient sources)
outcome: quality of human welfare (MDGs, national development strategy goals, HDI, livelihoods)
outcome: perceptions of vulnerability (by household, business, group, etc)
output: availability of climate-compatible energy efficiency measures and options (appropriate technologies, affordability/cost reducing, etc)
output: access to credit or low interest loans (financing for farmers, women, etc)
output: accessibility to climate-friendly energy sources (renewable energy, on/off-grid options affordable, available)
output: climate-reinforced or newly built physical infrastructure (modified against specific climate threats - bridge, airport, port, roads, buildings, energy facilities)
output: climate-modified social and/or health infrastructure or assets (developed to resist climate variability and change)
output: practices and options available to ensure climate security of sectors (integration of climate-resilient practices into tourism, agriculture, etc)
output: adaptation measures/practices carried out (number and type by households, farmers, etc; e.g. rainfall capture, seed storage, etc)
Risk Management
outcome: proportion of (targeted) population covered by climate risk management plans
outcome: proportion of national policies and sector strategies with climate change risk integrated
outcome: economic loss over time in relation to climatic events (and/or extreme events; by sector, or $ of livestock, property, other assets)
outcome: human loss over time in relation to climatic events (deaths, proportion falling under risk management schemes)
outcome: proportion of population permanently displaced as a result of a climate disaster (a proxy for planning efficacy, resources for recovery/relocation)
output: change in property value (a proxy for successful climate risk screening)
output: insurance schemes (a proxy for capacity to bounce back after extreme events)
19
output: proportion of projects, planned interventions, policies with climate risk screening (for relevant/priority risks)
output: number and type of climate risk screening tools available to planners, communities
output: identification and prioritization of climate risk reduction measures/options (prior to implementation)
output: committees in high risk areas plan of action at their disposal (district office, local authorities, private and civic sector have a plan that is realistic, budgeted, as part of the flood prevention strategy)
output: climate risk maps formulated and disseminated (health, flooding, other climate risks)
output: regular safety tests and maintenance of risk planning measures (e.g. clearing of debris, check dam strength)
output: number and types of early warning systems in place (coverage of population at risk)
output: percentage of at-risk population covered by insurance schemes (crops, property damage/loss)
output: number and type of climate risk insurance schemes available to at-risk populations
output: instruments and processes in place for regular monitoring of climate variability and change (farmer's using seasonal forecasts)
output: proportion of policy makers (and/or staff) trained on climate change risk assessment and scenario-based planning
Natural Resource Management (including ecosystems)
outcome: implementation of improved land-use management practices (in climate sensitive ecosystems, those relevant to human resilience)
outcome: implementation of climate-ready water management systems (drainage, irrigation)
outcome: quality of water supply (availability, access to potable water for vulnerable groups, sewage management)
outcome: agricultural output/yield (proxy for land productivity under climate pressures, soil quality)
output: types/no of climate resilient seed varieties available (a proxy for diversification of crops under effects of climate change or variability)
output: hectares of climate resilient crops (or practices)
output: hectares conserved (forest, mangroves, other lands key to human resilience and/or areas that are sensitive to climate change)
output: rain/water storage systems (type and capacity)
Livelihoods & Economic Benefits
outcome: ecosystem services generated (economic value of the productive use and utility of natural resources)
outcome: macroeconomic and sectoral economic impacts of climate change (long term - not for extreme events, variability)
outcome: proportion of targeted households with increased access to livelihood assets (in context of climate change, variability)
outcome: climate-resilient livelihoods strengthened or protected (against climate variability, climate change; as a result of measures taken, including forest-dwelling persons, populations dependent on natural resources)
outcome: climate-resilient jobs created (diversity of jobs, as a result of adaptation measures taken)
outcome: productivity level of (not natural) resources or assets (financial, physical, social, other assets; a proxy for resilience and/or could be placed in context of specific climate threats)
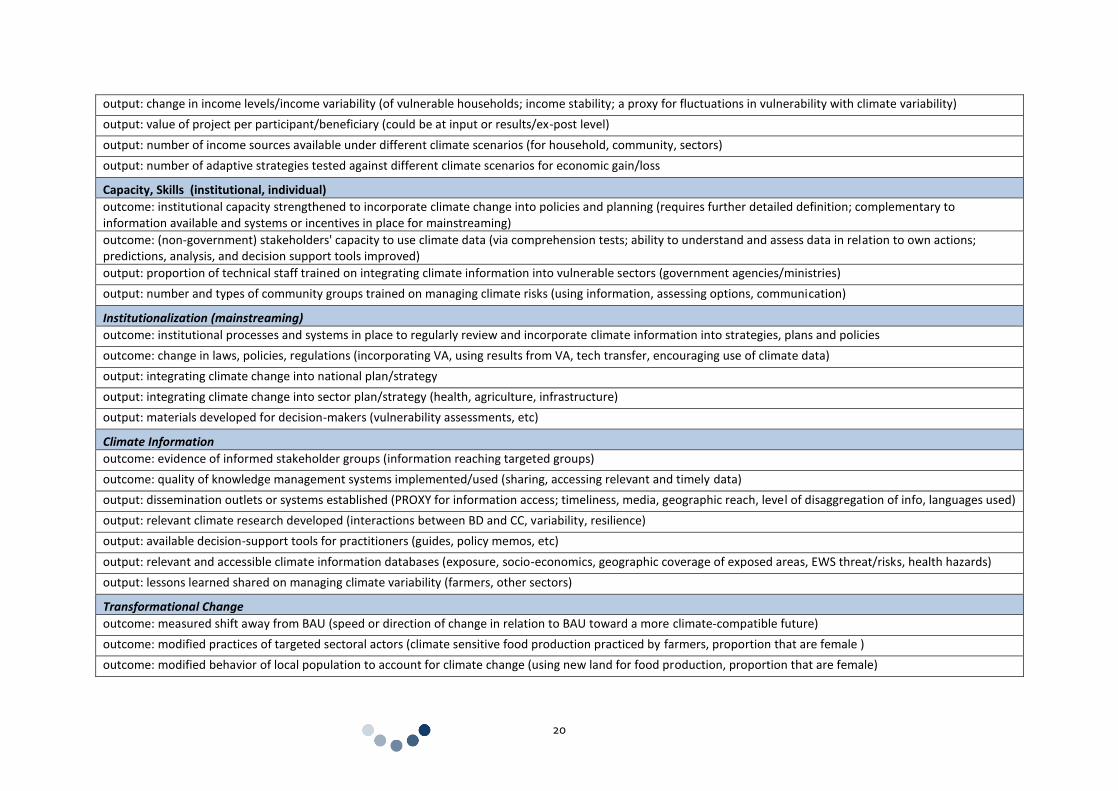
20
output: change in income levels/income variability (of vulnerable households; income stability; a proxy for fluctuations in vulnerability with climate variability)
output: value of project per participant/beneficiary (could be at input or results/ex-post level)
output: number of income sources available under different climate scenarios (for household, community, sectors)
output: number of adaptive strategies tested against different climate scenarios for economic gain/loss
Capacity, Skills (institutional, individual)
outcome: institutional capacity strengthened to incorporate climate change into policies and planning (requires further detailed definition; complementary to information available and systems or incentives in place for mainstreaming)
outcome: (non-government) stakeholders' capacity to use climate data (via comprehension tests; ability to understand and assess data in relation to own actions; predictions, analysis, and decision support tools improved)
output: proportion of technical staff trained on integrating climate information into vulnerable sectors (government agencies/ministries)
output: number and types of community groups trained on managing climate risks (using information, assessing options, communication)
Institutionalization (mainstreaming)
outcome: institutional processes and systems in place to regularly review and incorporate climate information into strategies, plans and policies
outcome: change in laws, policies, regulations (incorporating VA, using results from VA, tech transfer, encouraging use of climate data)
output: integrating climate change into national plan/strategy
output: integrating climate change into sector plan/strategy (health, agriculture, infrastructure)
output: materials developed for decision-makers (vulnerability assessments, etc)
Climate Information
outcome: evidence of informed stakeholder groups (information reaching targeted groups)
outcome: quality of knowledge management systems implemented/used (sharing, accessing relevant and timely data)
output: dissemination outlets or systems established (PROXY for information access; timeliness, media, geographic reach, level of disaggregation of info, languages used)
output: relevant climate research developed (interactions between BD and CC, variability, resilience)
output: available decision-support tools for practitioners (guides, policy memos, etc)
output: relevant and accessible climate information databases (exposure, socio-economics, geographic coverage of exposed areas, EWS threat/risks, health hazards)
output: lessons learned shared on managing climate variability (farmers, other sectors)
Transformational Change
outcome: measured shift away from BAU (speed or direction of change in relation to BAU toward a more climate-compatible future)
outcome: modified practices of targeted sectoral actors (climate sensitive food production practiced by farmers, proportion that are female )
outcome: modified behavior of local population to account for climate change (using new land for food production, proportion that are female)
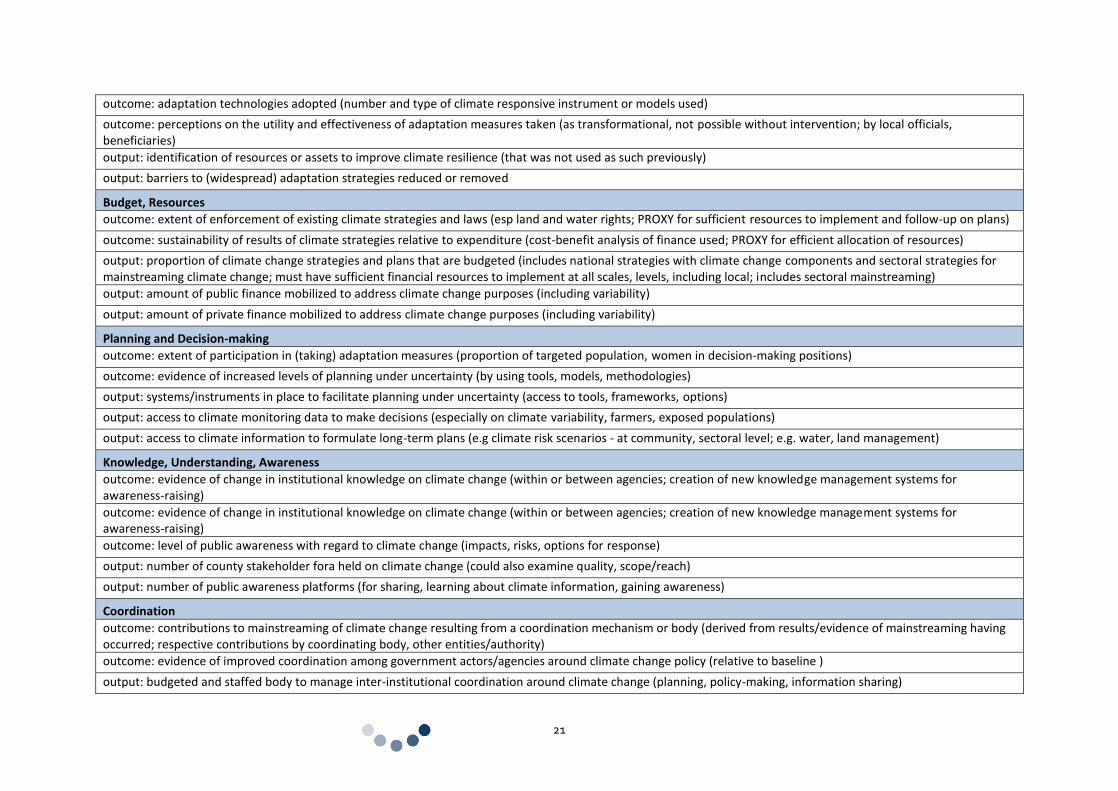
21
outcome: adaptation technologies adopted (number and type of climate responsive instrument or models used)
outcome: perceptions on the utility and effectiveness of adaptation measures taken (as transformational, not possible without intervention; by local officials, beneficiaries)
output: identification of resources or assets to improve climate resilience (that was not used as such previously)
output: barriers to (widespread) adaptation strategies reduced or removed
Budget, Resources
outcome: extent of enforcement of existing climate strategies and laws (esp land and water rights; PROXY for sufficient resources to implement and follow-up on plans)
outcome: sustainability of results of climate strategies relative to expenditure (cost-benefit analysis of finance used; PROXY for efficient allocation of resources)
output: proportion of climate change strategies and plans that are budgeted (includes national strategies with climate change components and sectoral strategies for mainstreaming climate change; must have sufficient financial resources to implement at all scales, levels, including local; includes sectoral mainstreaming)
output: amount of public finance mobilized to address climate change purposes (including variability)
output: amount of private finance mobilized to address climate change purposes (including variability)
Planning and Decision-making
outcome: extent of participation in (taking) adaptation measures (proportion of targeted population, women in decision-making positions)
outcome: evidence of increased levels of planning under uncertainty (by using tools, models, methodologies)
output: systems/instruments in place to facilitate planning under uncertainty (access to tools, frameworks, options)
output: access to climate monitoring data to make decisions (especially on climate variability, farmers, exposed populations)
output: access to climate information to formulate long-term plans (e.g climate risk scenarios - at community, sectoral level; e.g. water, land management)
Knowledge, Understanding, Awareness
outcome: evidence of change in institutional knowledge on climate change (within or between agencies; creation of new knowledge management systems for awareness-raising)
outcome: evidence of change in institutional knowledge on climate change (within or between agencies; creation of new knowledge management systems for awareness-raising)
outcome: level of public awareness with regard to climate change (impacts, risks, options for response)
output: number of county stakeholder fora held on climate change (could also examine quality, scope/reach)
output: number of public awareness platforms (for sharing, learning about climate information, gaining awareness)
Coordination
outcome: contributions to mainstreaming of climate change resulting from a coordination mechanism or body (derived from results/evidence of mainstreaming having occurred; respective contributions by coordinating body, other entities/authority)
outcome: evidence of improved coordination among government actors/agencies around climate change policy (relative to baseline )
output: budgeted and staffed body to manage inter-institutional coordination around climate change (planning, policy-making, information sharing)
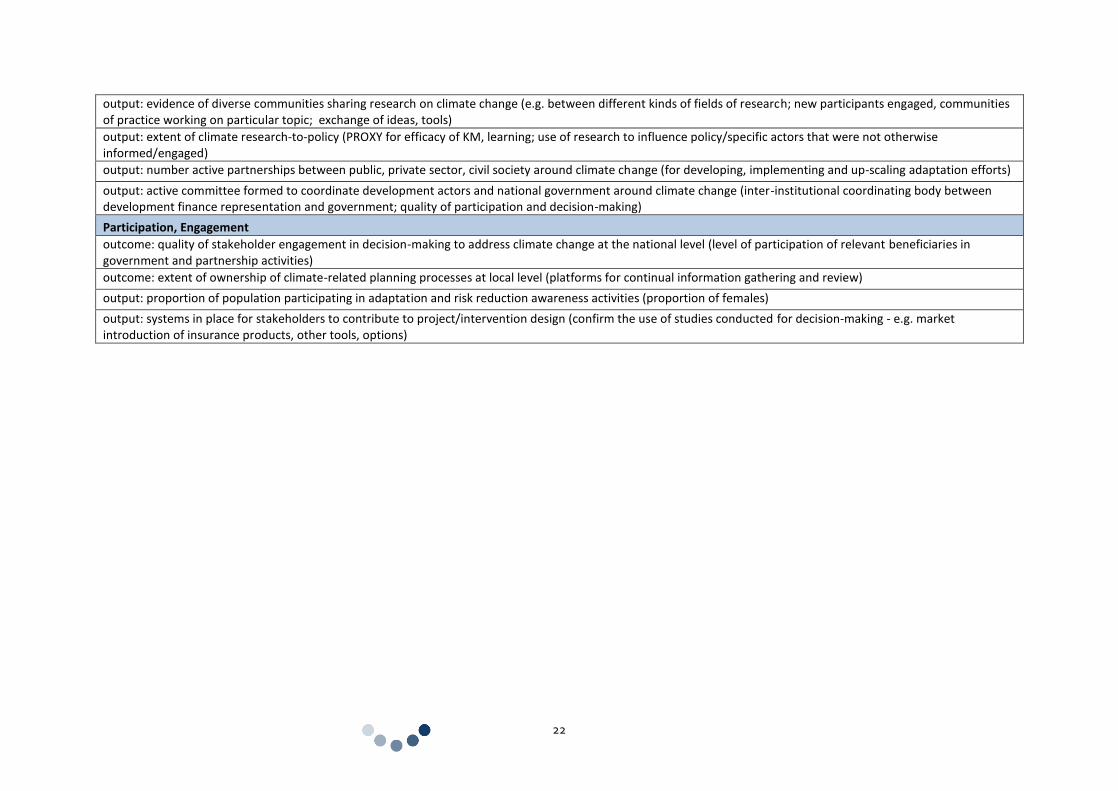
22
output: evidence of diverse communities sharing research on climate change (e.g. between different kinds of fields of research; new participants engaged, communities of practice working on particular topic; exchange of ideas, tools)
output: extent of climate research-to-policy (PROXY for efficacy of KM, learning; use of research to influence policy/specific actors that were not otherwise informed/engaged)
output: number active partnerships between public, private sector, civil society around climate change (for developing, implementing and up-scaling adaptation efforts)
output: active committee formed to coordinate development actors and national government around climate change (inter-institutional coordinating body between development finance representation and government; quality of participation and decision-making)
Participation, Engagement
outcome: quality of stakeholder engagement in decision-making to address climate change at the national level (level of participation of relevant beneficiaries in government and partnership activities)
outcome: extent of ownership of climate-related planning processes at local level (platforms for continual information gathering and review)
output: proportion of population participating in adaptation and risk reduction awareness activities (proportion of females)
output: systems in place for stakeholders to contribute to project/intervention design (confirm the use of studies conducted for decision-making - e.g. market introduction of insurance products, other tools, options)
23
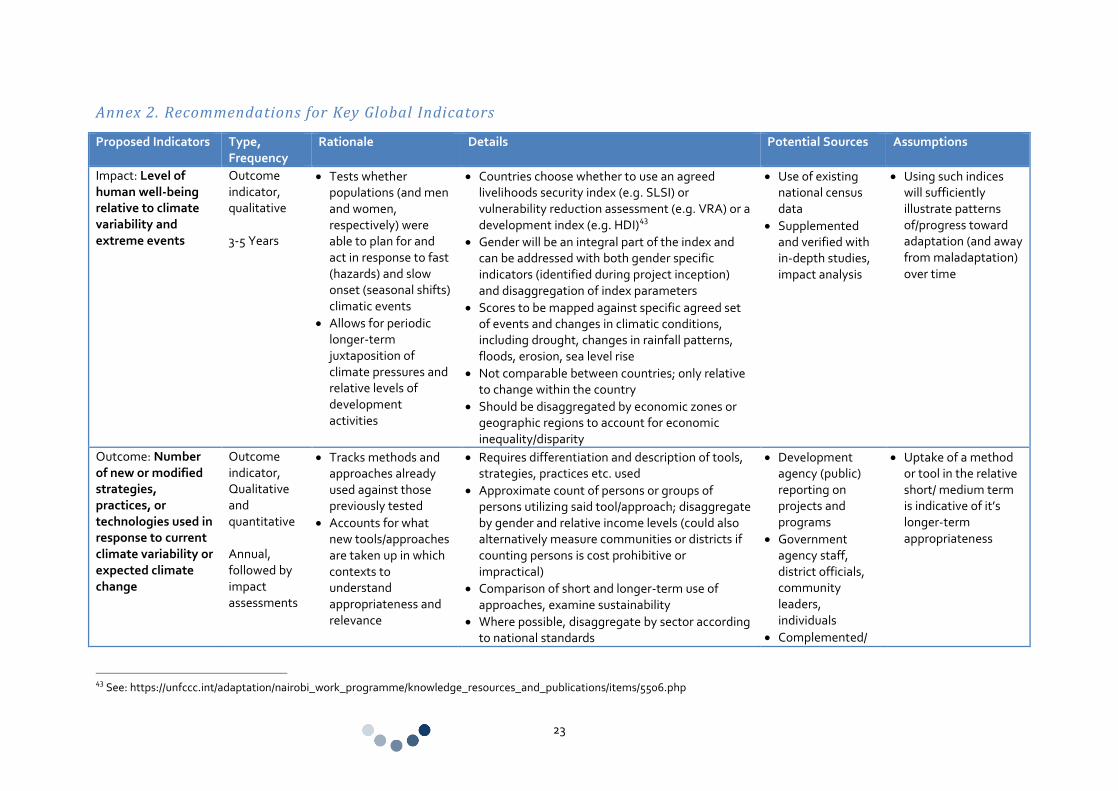
Annex 2. Recommendations for Key Global Indicators
Proposed Indicators Type, Frequency
Rationale Details Potential Sources Assumptions
Impact: Level of human well-being relative to climate variability and extreme events
Outcome indicator, qualitative 3-5 Years
Tests whether populations (and men and women, respectively) were able to plan for and act in response to fast (hazards) and slow onset (seasonal shifts) climatic events
Allows for periodic longer-term juxtaposition of climate pressures and relative levels of development activities
Countries choose whether to use an agreed livelihoods security index (e.g. SLSI) or vulnerability reduction assessment (e.g. VRA) or a development index (e.g. HDI)
43
Gender will be an integral part of the index and can be addressed with both gender specific indicators (identified during project inception) and disaggregation of index parameters
Scores to be mapped against specific agreed set of events and changes in climatic conditions, including drought, changes in rainfall patterns, floods, erosion, sea level rise
Not comparable between countries; only relative to change within the country
Should be disaggregated by economic zones or geographic regions to account for economic inequality/disparity
Use of existing national census data
Supplemented and verified with in-depth studies, impact analysis
Using such indices will sufficiently illustrate patterns of/progress toward adaptation (and away from maladaptation) over time
Outcome: Number of new or modified strategies, practices, or technologies used in response to current climate variability or expected climate change
Outcome indicator, Qualitative and quantitative Annual, followed by impact assessments
Tracks methods and approaches already used against those previously tested
Accounts for what new tools/approaches are taken up in which contexts to understand appropriateness and relevance
Requires differentiation and description of tools, strategies, practices etc. used
Approximate count of persons or groups of persons utilizing said tool/approach; disaggregate by gender and relative income levels (could also alternatively measure communities or districts if counting persons is cost prohibitive or impractical)
Comparison of short and longer-term use of approaches, examine sustainability
Where possible, disaggregate by sector according to national standards
Development agency (public) reporting on projects and programs
Government agency staff, district officials, community leaders, individuals
Complemented/
Uptake of a method or tool in the relative short/ medium term is indicative of it’s longer-term appropriateness
43
See: https://unfccc.int/adaptation/nairobi_work_programme/knowledge_resources_and_publications/items/5506.php
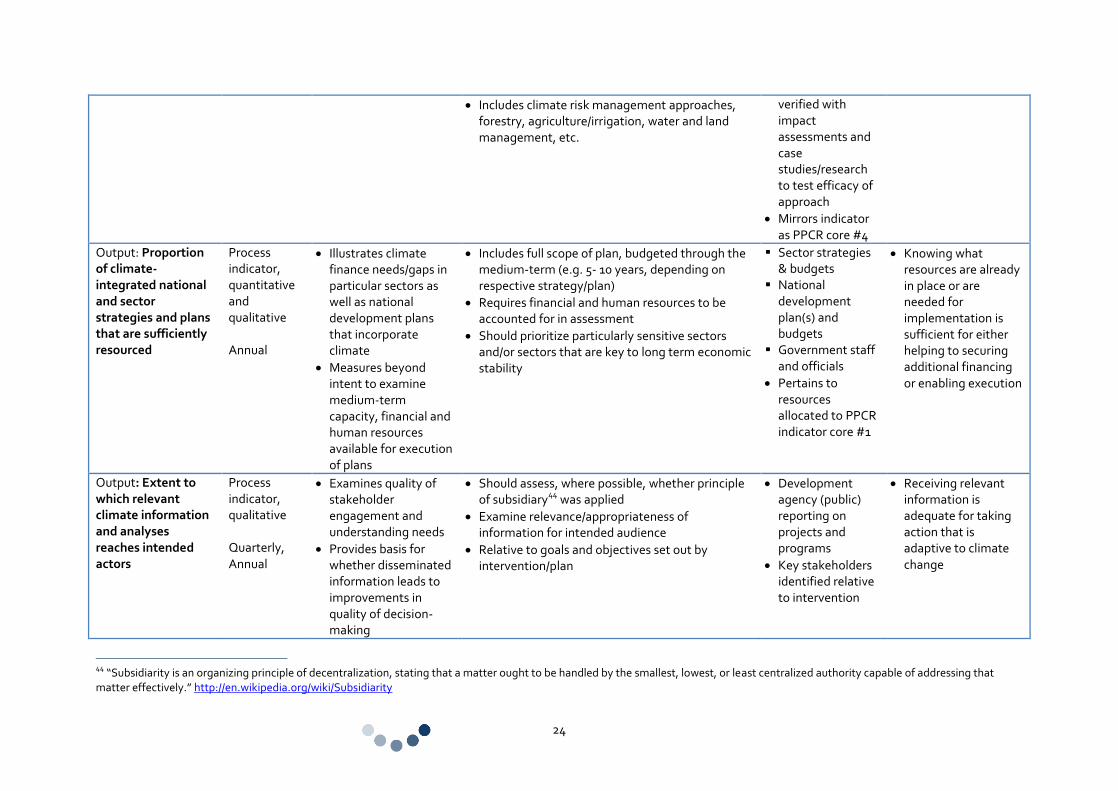
24
Includes climate risk management approaches, forestry, agriculture/irrigation, water and land management, etc.
verified with impact assessments and case studies/research to test efficacy of approach
Mirrors indicator as PPCR core #4
Output: Proportion of climate-integrated national and sector strategies and plans that are sufficiently resourced
Process indicator, quantitative and qualitative Annual
Illustrates climate finance needs/gaps in particular sectors as well as national development plans that incorporate climate
Measures beyond intent to examine medium-term capacity, financial and human resources available for execution of plans
Includes full scope of plan, budgeted through the medium-term (e.g. 5- 10 years, depending on respective strategy/plan)
Requires financial and human resources to be accounted for in assessment
Should prioritize particularly sensitive sectors and/or sectors that are key to long term economic stability
Sector strategies & budgets
National development plan(s) and budgets
Government staff and officials
Pertains to resources allocated to PPCR indicator core #1
Knowing what resources are already in place or are needed for implementation is sufficient for either helping to securing additional financing or enabling execution
Output: Extent to which relevant climate information and analyses reaches intended actors
Process indicator, qualitative Quarterly, Annual
Examines quality of stakeholder engagement and understanding needs
Provides basis for whether disseminated information leads to improvements in quality of decision-making
Should assess, where possible, whether principle of subsidiary
44 was applied
Examine relevance/appropriateness of information for intended audience
Relative to goals and objectives set out by intervention/plan
Development agency (public) reporting on projects and programs
Key stakeholders identified relative to intervention
Receiving relevant information is adequate for taking action that is adaptive to climate change
44
“Subsidiarity is an organizing principle of decentralization, stating that a matter ought to be handled by the smallest, lowest, or least centralized authority capable of addressing that matter effectively.” http://en.wikipedia.org/wiki/Subsidiarity
Founded in 1989, Baastel’s mission is to provide decision-makers, managers and implementation partners with the knowledge, tools and skills necessary to promote effective and efficient sustainable development. Baastel has earned its reputation as a consultancy
firm fully committed to providing sound advice to development partners on how to strengthen the impacts of their policy and development efforts around the world
North American Office 85 Victoria Street Gatineau QC J8X 2A3 CANADA Tel: + 1 819 595-1421 Fax: + 1 819 595-8586 European Office Le Groupe-conseil baastel sprl Rue de la Croix de fer 23, 1° B-1000 Brussels BELGIUM Tel: + 32 (0)2 893 0032 Fax: + 32 (0)2 503 3183
www.baastel.com