Embed Size (px)
Citation preview
Page 1/37
Prospects on the nano-plastic particlesinternalization and induction of cellular response inhuman keratinocytesPonnusamy Manogaran Gopinath
VIT UniversityKrishna Sundar Twayana
VIT UniversityPalaniyandi Ravanan
Central University of Tamil NaduJohn Thomas
VIT UniversityAmitava Mukherjee
VIT UniversityNatarajan Chandrasekaran ( [email protected] )
VIT University
Research
Keywords: Nano-plastics, Keratinocytes, Human keratin, Protein-corona, Macropinocytosis, Oxidativestress, Autophagy, Senescence
Posted Date: May 5th, 2021
DOI: https://doi.org/10.21203/rs.3.rs-41392/v3
License: This work is licensed under a Creative Commons Attribution 4.0 International License. Read Full License
Version of Record: A version of this preprint was published at Particle and Fibre Toxicology on September8th, 2021. See the published version at https://doi.org/10.1186/s12989-021-00428-9.
Page 2/37
Abstract
BackgroundToday, cosmetic usage has become customary in both men and women towards improving theirappearance and increase societal visibility. In this study, the nano-sized (30 to 300 nm) plastic particleswere isolated from the commercial face-scrubs and treated on the human keratinocytes.
ResultsThe adherence studies of polyethylene nano-plastics (PENPs), polystyrene NPs (PSNPs), and face-scrubsisolated nano-plastics (NPs) on the keratin layer revealed a rapid attachment of NPs on the skin from thecosmetics that have short exposure time. This attachment property could facilitate further adherence ofprotein molecules on NPs and the protein-corona formation. The protein-corona mimics proteinaggregates, thereby triggers the macropinocytosis followed by the macropinolysosomal process in thecell. Then the internalized NPs induced the concentration-dependent cytotoxic, cytostatic andcytoprotective activity in keratinocytes. Both single dose and chronic long-term exposure of lethal andsub-lethal concentrations of NPs resulted in the oxidative stress-mediated down-regulation of cell growthand proliferation inhibition. Autophagy and premature aging were also observed in the NPs internalizedHaCaT cells incubated in a fresh, NPs-free medium.
ConclusionAt the outset, this work provides insight into the NPs concentration-dependent regulatory, cytoprotective,and cytotoxic effects in HaCaT cells. Further studies are required to identify the detailed mechanisms ofNPs toxicity and cytoprotective events in cells at the molecular level.
BackgroundFashion is an aesthetic declaration that strengthens a person's appearance and provides better socialvisibility [1, 2]. Cosmetics are not a modern invention. Both men and women in ancient Egypt (4000 BC),India (2500 BC), and China (3000 BC) have used cosmetics to alter their appearance or as a sign ofnobility and religion [3, 4]. Today, people of all age groups use cosmetics as a beautifying agent (makeupand lipsticks), cleansing agent (soaps, shower gels, shampoos, face scrubs, and toothpaste), odour-�ghting agent (perfumes, deodorants, and antiperspirants), and well-being agent (sunscreens andtoothpaste) [5, 6, 7]. Earlier, the cosmetics and personal care products were composed of naturalexfoliants such as pumice, aniseed, coconut, almonds, oat �our, fruit stones, and husk of apricot,bamboo, pecan nut, and walnut shell [5] besides the conventional components such as soap, surfactant,alcohol, oil, wax, water, and inorganic pigments. Recently, nano- and micro-sized plastic polymers such aspolyethylene (PE), polypropylene, polystyrene (PS), and nylon have replaced the natural exfoliants owing
Page 3/37
to their cost-effectiveness, versatility, durability, lightweight, and corrosion-resistant properties [5, 6, 7, 8, 9,10].
According to the European Chemical Agency (ECHA) and United Nations Environment Programme (UNEP)reports, more than 500 different types of nano- and micro-plastic ingredients weighing above 9300tonnes are added to cosmetics and personal care products (CPCP) every year in the European Unioncountries alone [7, 11]. The polyethylene (PE) particles are commonly added polymer in cosmetics [7]because of their abrasiveness, �lm-forming, and viscosity controlling capacity, followed by polypropyleneand polystyrene (PS) particles. Until now, there is no speci�c data available on the size of plastic particlesused in cosmetics. Quite a few studies encountered around 5 µm to 2 mm-sized plastic particles frommajor cosmetic brands. The size-frequency distribution data showed that most of the products consist ofa wide range of plastic particles, whereas some products were the most homogenous with a largenumber of smaller particles [5, 9, 12]. Recently, Hernandez et al. [13] and our group [14, 15] have isolatedless than 100 nm-sized nano-plastic (NPs) particles from facial scrubs. According to Hernandez et al.,one gram of face scrub contains more than 300 billion nano-sized plastic particles equivalent to 300 µg[13]. It has been estimated that the PE microplastics (MPs) usage by the US population via CPCP isaround 2.4 mg/person/day [16]. The PEMPs release from the facial scrub usage by the UK populationranges between 40.5– 215 mg/person/day, suggesting the annual environmental release of ~ 86 tonnesof MPs from facial exfoliants alone [9].
Numerous studies have proved that CPCP is the primary contributor to aquatic plastic pollution [17] andpresented the adverse effect of microplastics on various marine and terrestrial organisms. Only a fewstudies have demonstrated the toxicity of environmentally isolated microplastics on human cells [15, 18],plant cells [15], and marine animals [19]. Most of the studies used commercial virgin-NPs or -MPs andshowed an altered growth and reproduction in rotifer, amphipod, and copepod [20, 21, 22]. Also, the virgin-NPs/ MPs affected cellular function in blue mussel and sea bass [23, 24], reduced feeding activity inlugworm [25], activated �brosis, congestion, and in�ammatory in�ltration in the earthworm [26], andtriggered the immune response in mice [27]. Consequently, in the 2nd Environmental Conference, 2015,the plastic particles were recognized and described as the second most poisonous agent that affects theenvironment and ecology [28]. This perception raised concern about the direct exposure of plasticparticles to human skin via cosmetics. Subsequently, it warranted an empirical investigation on the effectof nano-plastic on skin cells.
The skin is made up of epidermis, dermis, and subcutaneous layers and serves as a physical barrieragainst �uctuating environmental factors, including pollutants, toxic substances, ultraviolet and ionizingradiation. Additionally, the skin also performs several vital functions, including defensive,thermoregulatory, sensory, and excretory. The epidermis is the external layer composed of 90–95%keratinocytes and fewer melanocytes and Langerhans cells [29]. Direct application of NPs and MPsincorporated cosmetics on the skin could allow high penetration of NPs via percutaneous absorption [30].But the adsorption and persistence of NPs on the skin and their effects on keratinocytes areunderstudied. Recently, several studies focused on the impacts of unintentionally exposed NPs via
Page 4/37
ingestion [31] or inhalation route [32]. But very few studies have demonstrated the penetration andaccumulation tendency of polymeric NPs on in�amed skin [33, 34]. However, the effects of NPs found incosmetics on human skin cells are not known. Hence, the present study intended to determine the entry ofpolyethylene NPs (PENPs), polystyrene NPs (PSNPs), and NPs isolated from the face scrubs (FS) andtheir effect on human keratinocytes.
Results And DiscussionIsolation and determination of NPs from face scrubs
The face scrubs (FS) manufactured by two different industries were purchased from the localsupermarket and used for NPs extraction by sequential �ltration [13]. Since the brand names are notparticularly relevant to the study, we presented the samples as FS-1 and FS-2. The FS-1 and FS-2 are usedby men and women, respectively. Both products contain common ingredients such as antioxidants,preservatives, and fragrance enhancers. Notably, FS-2 comprises polyquaternium, a cosmetic ingredientdesignated for several cationic polymers with different properties. Regardless of the ingredient list, wehave observed MPs and NPs in both products. The NPs particles isolated from FS-1 and FS-2 weretermed as NPs-1 and NPs-2, respectively.
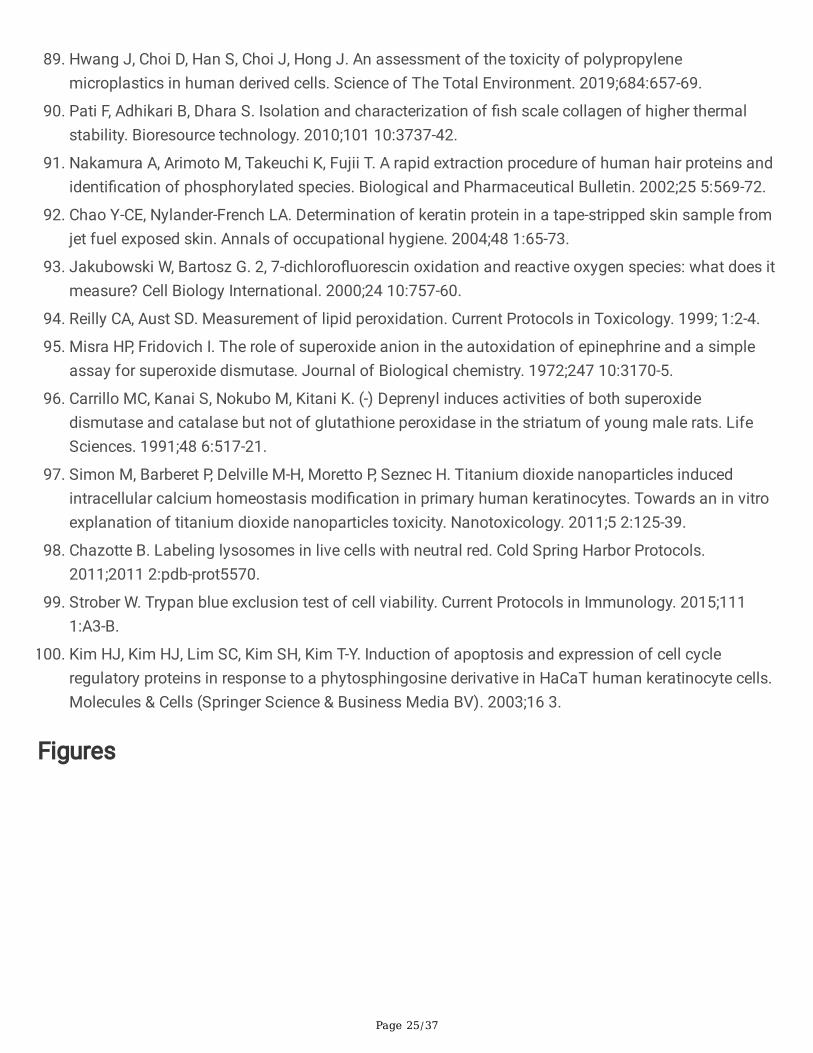
The NPs containing �nal �ltrates obtained from the FS samples via subsequent �ltration were examinedunder the high-resolution scanning electron microscope (HR-SEM) to determine the hydrodynamic sizeand shape. The electron micrographs showed that the NPs-1 isolated from FS-1 are mostly spherical witha smooth surface and few irregular aggregates (Fig. 1a insert), whereas NPs-2 isolated from the FS-2 areamorphous with sharp edges (Fig. 1c insert). The amorphous nature of NPs might have resulted from thecosmetic production steps such as homogenization, emulsifying, and heating. The size distributionanalysis showed a broad size distribution range from 30 to 300 nm and 90 to 230 nm for NPs-1 and NPs-2, respectively. In NPs-1, most of the particles are 100 ± 20 nm in diameter. The observed slight increasein the NPs particle size (>200 nm) could be due to particle agglomeration during the drying process. Onthe other hand, the PENPs (Fig. 1c insert) prepared from the subsequent breakdown of PE pellets and thecommercially procured virgin-PSNPs (Fig. 1d insert) showed irregular particles of about 400 nm or less indiameter and spherical particles of 100 nm in diameter, respectively. More details on the particle sizedistribution and NPs concentration in FS samples are available in the supplement data.
The dried NPs-1, NPs-2, PENPs, and PSNPs were analysed using Fourier Transform Raman Spectroscopy(FT-Raman). The Raman spectra of NPs-1 (Fig. 1a) and NPs-2 (Fig. 1c) showed a close correlation withthe characteristic Raman bands of standard PENPs (Fig. 1e). The bands at 1062, 1132, 1299, and 1444cm-1 are mainly due to the C-C stretching, CH2 twisting, and CH2 bending vibrations of PE, and the strong
bands at 2851 and 2885 cm-1 are due to the CH2 asymmetric and symmetric stretching vibrations of PE[35, 36]. As mentioned above, PE is the most prominently used polymer (about 93%) in cosmetics; henceit could be the highest polymer fraction in the isolated NPs-1 and NPs-2. As a result, the PE Raman peaksmight have surpassed the Raman shift of PS and other plastic polymers [7]. On closer examination, the
Page 5/37
Raman spectra of NPs-1 (Fig. 1b) and NPs-2 (Fig. 1d) showed the characteristic bands at 620, 795, 1002,1032, 1155, 1450, and 1602 cm-1 corresponding to ring deformation, C-H out of plane deformation, ringbreathing, C-H in-plane deformation, C-C stretch, CH2 scissoring, C=C stretch, and the ring-skeletal stretchof PSNPs (Fig. 1f), respectively. This observation indicates that both FS contains different types of nano-sized plastic particles, mainly polyethylene and polystyrene polymers.
Dispersion and stability of NPs in the aqueous medium
The hydrodynamic size of PENPs, PSNPs, NPs-1, and NPs-2 in deionized water, keratin solution (0.2%),and Dulbecco's Modi�ed Eagle's culture medium (DMEM) were measured using the dynamic lightscattering (DLS) technique. During this experiment, the samples were vortexed vigorously in respectivesolutions for 10 min and then incubated for 24 hrs at room temperature or in cell culture conditions (at37°C with 5% CO2 and 95% humidity). The initial DLS measurements showed moderate stability (ζ ≥ -30mV) of PENPS and PSNPs and an optimal dispersity and stability (ζ ≥ -40 mV) of NPs-1 and NPs-2 indeionized water (Table S1). But, over a 24 hrs period, the PENPs showed greater instability with a Z-average of 1409±520 nm and PDI of 9.106, followed by a drastic decrease in the zeta potential value(-9±2.6 mV) in deionized water. On the other hand, all the NPs showed signi�cant stability in the keratinsolution. In DMEM, the average particle size of NPs-1 and NPs-2 increased 3 to 4-fold than in thedeionized water (Table S1). The observed size increase in the NPs under the cell culture medium could bedue to the aggregation of particles (Fig. S3d) via non-speci�c protein-protein attraction and the bridgingeffect between protein and other biomolecules, as described in our previous study [15]. The above resultsindicate that the adsorption of biomolecules on the plastic particles plays a signi�cant role in NPsaggregation and stability.
Adherence of NPs particles on keratin coated glass slides
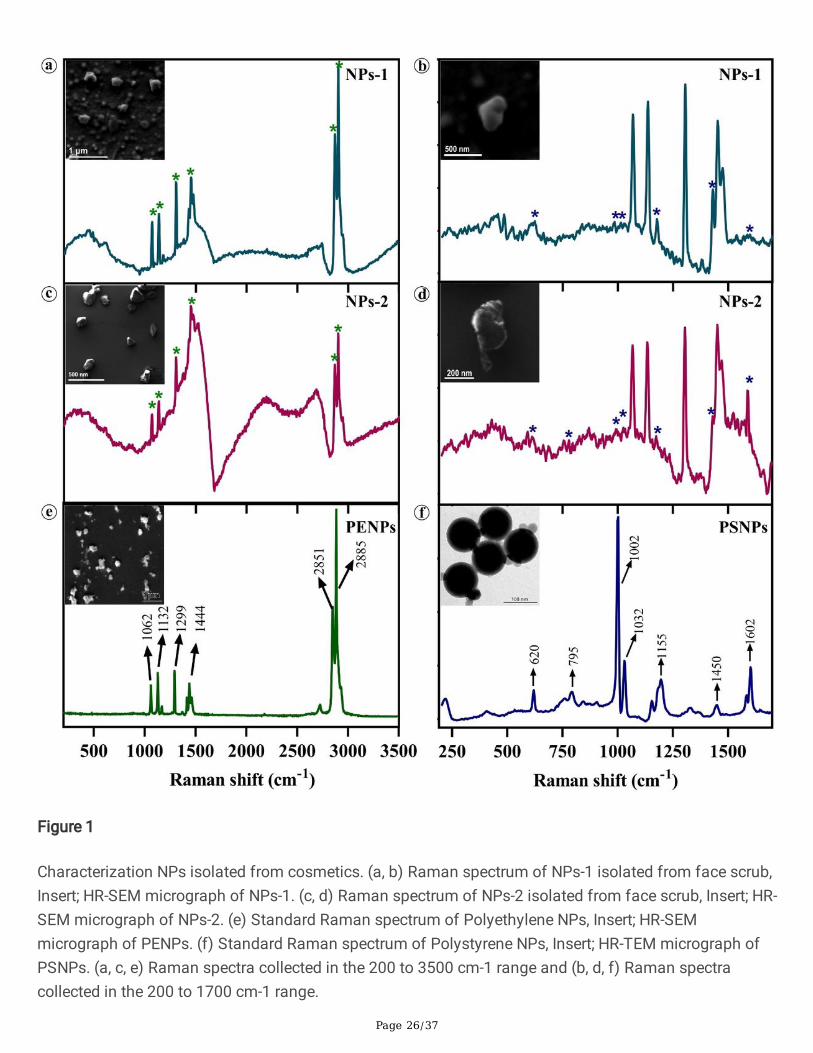
It is a well-known phenomenon that NP/MP particles rapidly adhere to the biological substrate such asprotein layers via non-speci�c attraction forces like Van der Waals force or the surface electric polarityalteration through a strong hydrophobic bond or dipole bonding by hydrogen bond via ─OH, O, ─NH, NH,≡N groups or the spontaneous adsorption depending on the amino acid content [15]. The bindingstability of NPs may differ depending on the attraction factors and contact/interaction time. To show therapid attachment of NPs on the skin surface, we have exposed the keratin-coated glass slides to NPssolution (100 µg/mL) for 2-3 min and rinsed twice in ultra-pure water, and then observed under theelectron microscope. Since this study uses NPs isolated from face scrubs, we have restricted the contacttime for a maximum of 3 min and washed twice with deionized water. The �eld-emission scanningelectron micrographs (FE-SEM) of keratin-coated glass slides showed a signi�cant attachment of PENPs,PSNPs, NPs-1, and NPs-2 within 3 min of exposure (Fig. 2). Although washing removed most of theparticles, an ample number of particles remained attached on the keratin-coated glass surface even aftertwo washes (8-10 dipping /wash) (Fig. 2c, f, i, and l). The NPs removal from the keratin layer duringwashing could be due to the weak adherence of NPs in the given contact time. However, the attached NPson the protein layer, even after consecutive washes, revealed that washing does not remove all the
Page 6/37
particles adhered to the skin surface. Doge et al. [30] showed the penetration of 20 and 200 nm-sizedPSNPs into the stratum corneum via skin furrows, lipid channels, and vellus hair follicles andaccumulation onto the viable epidermis just beneath the stratum corneum as well as within the epidermiscells. Other studies have also reported that the stratum corneum could act as a long-term reservoir for thepenetrated polymer particles and facilitate the NPs translocation into viable tissues [37, 38, 39].
Impact of NPs on keratinocytes viability
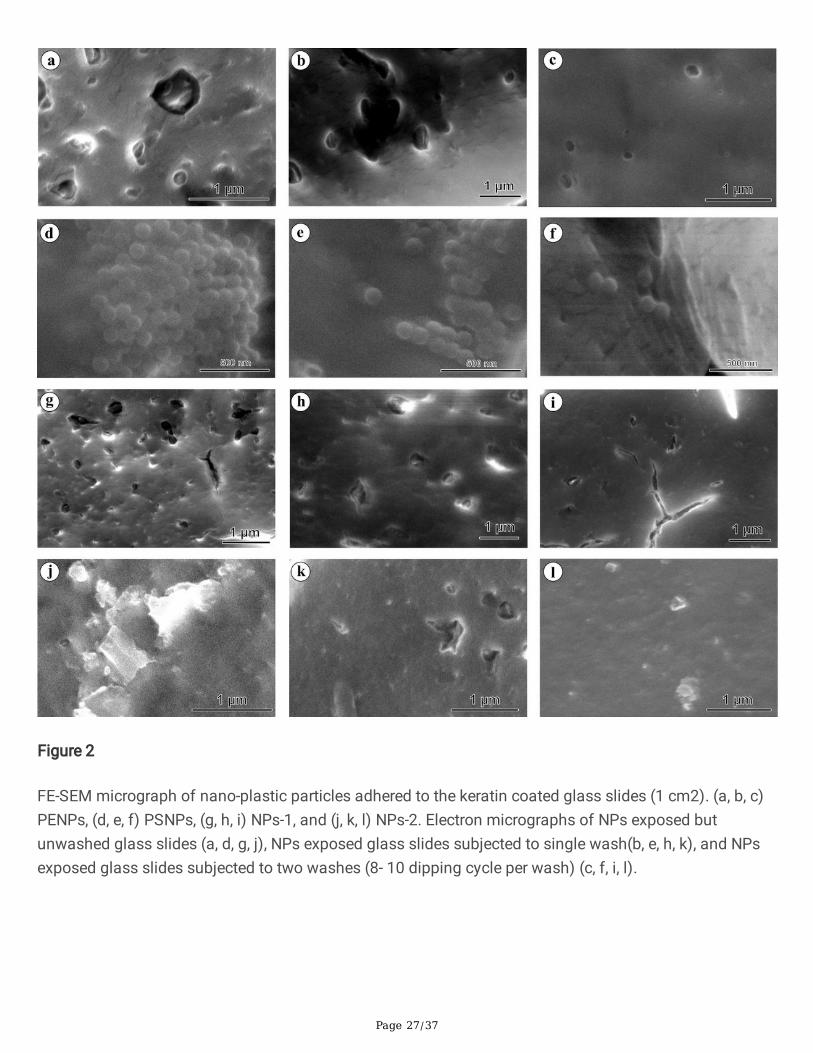
The constant usage of cosmetics on the skin could lead to the long-term interaction of NPs withkeratinocytes, thereby provokes the physiological, biochemical, and pathological responses in cells. Toobserve the cytotoxic effect on the cell, we have exposed the keratinocytes to different concentrations ofPENPs, PSNPs, NPs-1, and NPs-2 for six consecutive days. The MTT assay showed a gradual reductionin cell viability at the high concentrations of PENPs, NPs-1, and NPs-2 with treatment time (Fig. 3). On thecontrary, there was no/less inhibition observed in PSNPs and low concentrations of PENPs, NPs-1, andNPs-2 treated cells. The pairwise comparison of cell viability between the NPs dose range and controlshowed a statistically signi�cant difference (p≤ 0.05), evidencing the NPs concentration- and time-dependent toxicity in cells. Herein, we have limited the NPs-2 concentration range to 250 µg/mL becauseof the complete growth inhibition of cells at the higher concentrations. The observed cell death at highconcentrations of NPs could be due to the cell damage caused by the irregular-shaped NPs with sharpedges during physical interaction. Also, the adsorbed materials and additives in plastics might haveenhanced the NPs cytotoxicity [40]. The cells exposed to the pristine PSNPs did not show signi�cant celldeath as elsewhere reported in different cell lines [40, 41, 42]. However, we have recorded a remarkablecell viability increase after 48 hrs of exposure compared to control. A similar growth pattern in PSNPstreated cells was observed in the trypan blue assay (discussed below). Likewise, the low concentrationsof PENPs, NPs-1, and NPs-2 treatment showed a slight increase in the growth after 48, 72, and 96 hrsthan the control (Table S2). The observed increase in the cell viability at the low concentration of NPsstrengthens the assumption that chemically inert polymers cannot induce cellular toxicity. This scenariois explained below.
Oxidative stress generation in the HaCaT cells
In addition to the cell viability assay, we have estimated the unspeci�c oxidative stress induced by NPsusing reactive oxygen species (ROS) assay for six days (Fig. S1). The overall observation showed adifference in the ROS values between the NPs treatments (Fig. 4). The NPs isolated from FS showedsigni�cantly low ROS activity compare to the PSNPs and PENPs, which could be due to the increasedcytotoxic effect of isolated NPs via physical damage (as mentioned above), denoting high cytotoxicity bydirect physical damage over oxidative stress. Though there are similarities among the ROS values ofPENPs and PSNPs, only the amorphous PENPs showed cytotoxicity due to the cell damage throughphysical interaction. On the other hand, the PSNPs with spherical shape and smooth surface did notcause physical damage on the cell, hence showed a minimal cytotoxic effect. It is also possible that thelow level of ROS in the cells treated with NPs-1 and NPs-1 could be due to the increased proliferation
Page 7/37
inhibition as observed in the cell proliferation assay (discussed below). Interestingly, all the NPs showed amaximum ROS level at 48 and 72 hrs of treatment (Fig. 4 a-d), followed by a steady downward trend at96, 120, and 144 hrs. The increased ROS level at 48 and 72 hrs could be due to the high level of NPsinteraction and internalization. The observed gradual reduction in the cellular ROS level after 96 hrs couldbe due to the defensive action against the ROS or elimination of NPs or cell destruction [43, 44].
The free radicals produced during oxidative stress could damage the cell membrane lipid and fatty acidsleading to elevated lipid peroxidation, a primary indicator of cell or organelle damage. Here, the amount oflipid peroxidation in cells was determined from the intracellular malondialdehyde (MDA) level usingthiobarbituric acid reactive substances (TBARS) assay. MDA is an end product of lipid peroxidation thatreacts with the thiobarbituric acid-trichloroacetic acid (TBA-TCA) complex and produces a detectablecoloured substance. The cells exposed to PENPs, PSNPs, NPs-1, and NPs-2 (Fig. 4 e-h) showed aconcentration and time-dependent increase (p< 0.05) in the MDA level compare to the control. However, at96 hrs, there was no signi�cant difference (p> 0.05) observed in MDA level in the cells treated with highconcentrations of PENPs, NPs-1, and NPs-2, and all the PSNPs concentrations (Fig. 4 e-h). It isnoteworthy to mention that all the tested NPs showed a two-fold increase in MDA production at 48 and72 hrs compared to control.
Effect of NPs on the antioxidant enzymes
ROS substances are naturally produced in cells during various cellular metabolisms and subsequentlyeliminated by the enzymatic or non-enzymatic antioxidants [45, 46]. When the ROS production succeedsthe antioxidant defence, the equilibrium between prooxidants and antioxidants becomes inadequate,leading to oxidative damage in the nuclei, lipids, and proteins, followed by cell damage [45, 47, 48, 49].Redox homeostasis is the endogenous capacity of cells to deal with continuous challenges generated byelectrophiles. An increased accumulation of superoxide anion (O2
•−) and hydrogen peroxide (H2O2) duringoxidative stress could disrupt the cellular redox-homeostasis. In order to defend and normalize the ROSstress, cells could produce endogenous antioxidant enzymes. Superoxide dismutase (SOD) is the �rst lineof defence against oxygen‐derived free radicals, dismutates the O2
•− into less reactive H2O2, which is splitinto H2O and O2 by catalase (CAT). Herein, the production of SOD in the cells during ROS generation wasassayed spectroscopically at 480 nm by the epinephrine auto-oxidation inhibition method. Similarly, theCAT production was assayed from the depletion of hydrogen peroxide.
The chronic long-term treatment of NPs showed a concentration-dependent reduction in the total proteinlevels compared to control and a time-dependent �uctuation in the SOD and CAT activity. All the NPs (25and 50 µg/mL) treated cells except NP-2 displayed a decreasing trend in SOD activity at 24 and 48 hrs oftreatment, followed by a slight increase at 72 and 96 hrs (Fig. 5 a-c). On the other hand, the NPs-2 (Fig.5d) and high concentration PENPs and PSNPs showed �uctuated SOD levels at different treatment times,while the NPs-1 showed a gradual decrease (Fig. 5c). In CAT activity, all the NPs showed a time- andconcentration-dependent �uctuation in CAT levels (Fig. 5 e-h). However, the overall antioxidant enzymeactivity remained signi�cantly low in the high concentrations of NPs compared to control. The observed

Page 8/37
high level of �uctuation in the SOD and CAT activity of the cells under the long-term treatment with NPssigni�es the imbalanced redox-homeostasis in cells. A similar negative correlation between theantioxidants and lipid peroxidation was reported in age-related macular degeneration [50] and heart, lung,liver, and testis of rats [51, 52, 53, 54]. It has been postulated that the decrease in the antioxidant activitymay be due to the exhaustion of enzymes while detoxifying oxidants [52, 55, 56]. Or else, direct inhibitionof antioxidant enzymes by the toxicants [56] and lipid peroxidation [57]. Pigeolet et al. [58] reported thatthe most important antioxidant enzymes such as SOD, CAT, and GPX (glutathione peroxidase) aresusceptible to oxidant metabolites. For instance, SOD is susceptible to H2O2, and CAT and GPX aresusceptible to hydroxyl radicals and superoxide anions [58]. Indeed, these enzymes protect each otherfrom inactivation by the antioxidants. The depletion of one enzyme could increase the oxidants thatinactivate the other enzyme, which leads to the exponential production of oxidant molecules and highoxidative stress [58, 59]. It is worth mentioning that the reduced antioxidant activity accompanies ROS-mediated cellular responses in the cell.
A low level of ROS acts like signalling molecules that promote cell proliferation [60], while the moderatelevel of ROS induces biological responses such as autophagy and senescence leading to apoptosis andin�ammation [61, 62] whereas, the high level of ROS disrupts the cells [61, 62, 63]. As a result of theabove facts, the HaCaT cells showed increased viability in PSNPs and at low concentrations of PENPs,NPs-1 and NPs-2 treatment, and increased cytotoxicity at high concentrations of PENPs, NPs-1, and NPs-2. We believe that the PSNPs and low/ sub-lethal concentrations of PENPs, NPs-1, and NPs-2 couldstimulate oxidative stress-mediated biological responses in the cells. Before proceeding with this aspect,two important queries need to be answered: (i) how the cells recognize and engulf the NPs, and (ii) whythere is a delay in the cellular response against the NPs.
Mechanism of cell uptake
Cellular internalization of NPs
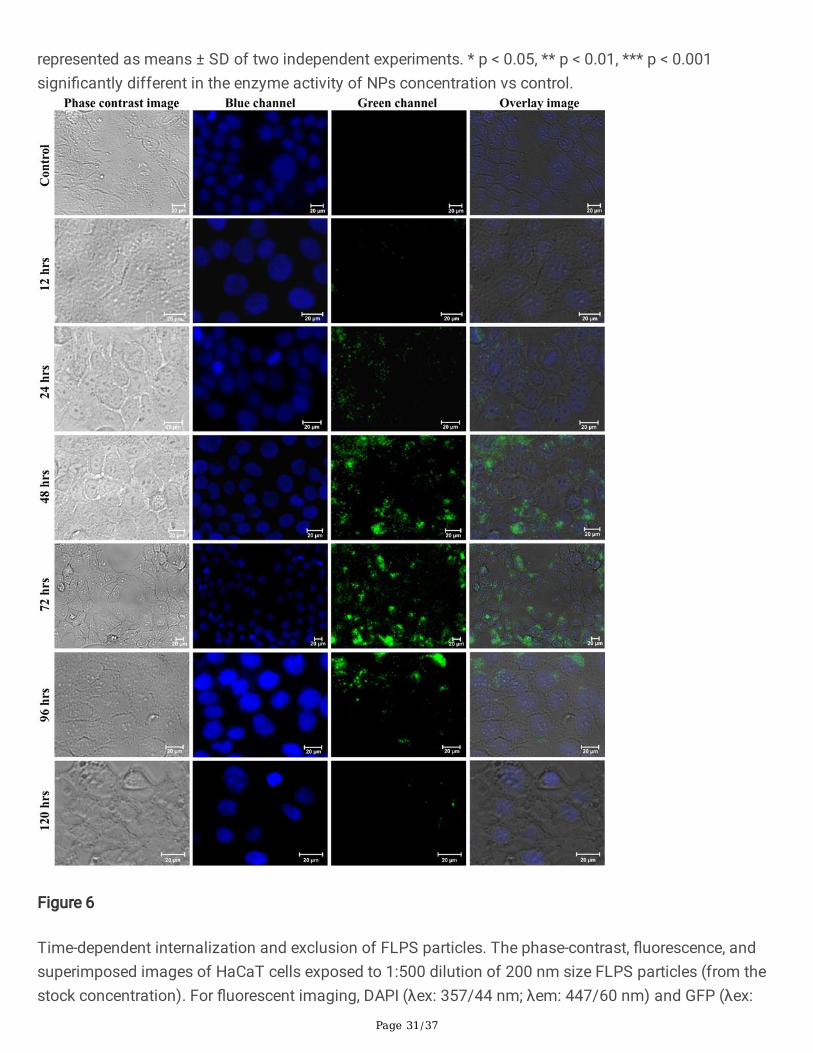
To examine the internalization of NPs in the cells, we have treated the keratinocytes with �uorescentlylabelled PSNPs (FLPS) for 12, 24, 48, 72, 96, 120, and 144 hrs, and then examined under a �uorescencemicroscope. Figure 6 showed a minimum accumulation of FLPS at 12 and 24 hrs and a maximuminternalization at 48 and 72 hrs of treatment. There was no further increase in the particle accumulationobserved at 96 and 120 hrs, suggesting interruption in the internalization process. Similar ROS-mediatedinterruption of the endocytosis process was reported in Chinese hamster ovary cells [64] and epidermalcell lines [65]. On the other hand, for the exclusion experiment, the NPs incorporated medium wasreplaced with NPs free medium after 72 hrs of exposure. After 96 hrs, a gradual decrease in the�uorescence intensity in cells (Fig. 6) followed by a complete absence of �uorescence was observed at144 hrs (Fig. S2). It appears that the gradual reduction of FLPS in cells could be due to the rapidexclusion of internalized FLPS or ROS-mediated cell death or both. As a result of the increased uptake ofNPs at 48 and 72 hrs treatment (Fig. 6), the keratinocytes presented an elevated level of ROS and reducedantioxidant activity. The observed reduction in the ROS level after 72 hrs of treatment could be either due
Page 9/37
to the rise of defensive antioxidant activity in cells (Fig. 5), NPs removal from the cells, blocking of NPsinternalization, or cell death. The result observed in the FLPS experiment signi�es that the NPsinternalization does not occur immediately but requires some time. However, further investigations areneeded for a better understanding of the mechanism of uptake.
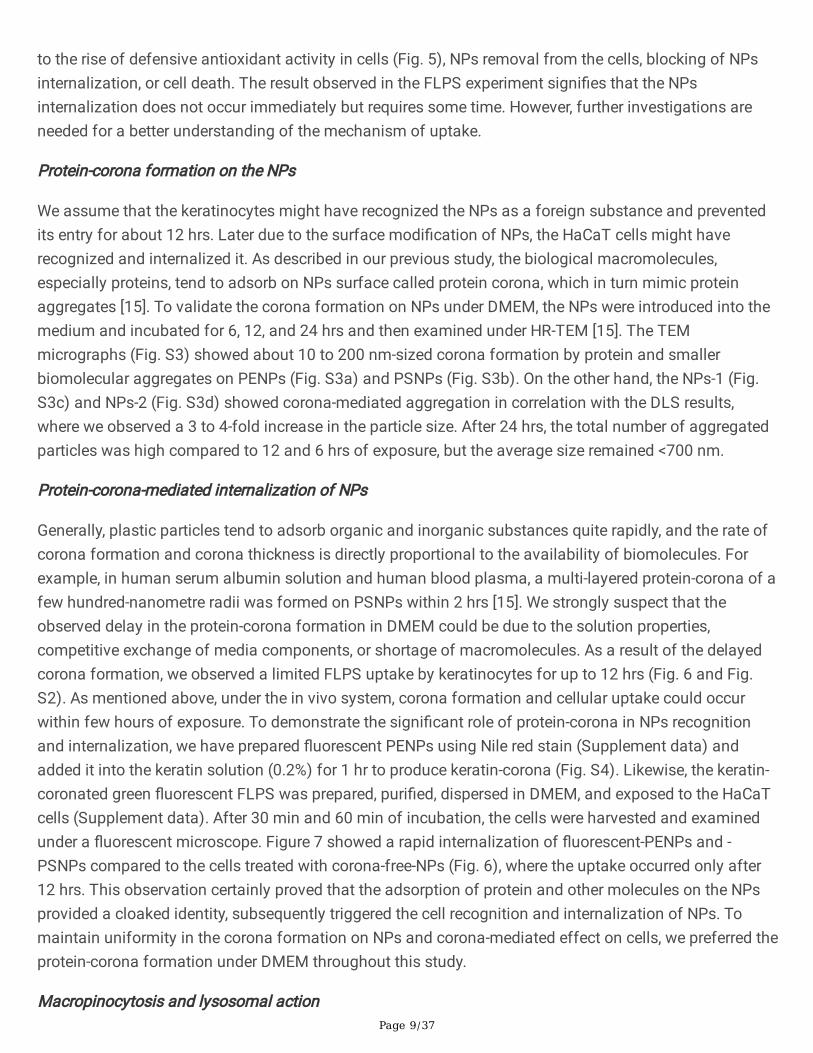
Protein-corona formation on the NPs
We assume that the keratinocytes might have recognized the NPs as a foreign substance and preventedits entry for about 12 hrs. Later due to the surface modi�cation of NPs, the HaCaT cells might haverecognized and internalized it. As described in our previous study, the biological macromolecules,especially proteins, tend to adsorb on NPs surface called protein corona, which in turn mimic proteinaggregates [15]. To validate the corona formation on NPs under DMEM, the NPs were introduced into themedium and incubated for 6, 12, and 24 hrs and then examined under HR-TEM [15]. The TEMmicrographs (Fig. S3) showed about 10 to 200 nm-sized corona formation by protein and smallerbiomolecular aggregates on PENPs (Fig. S3a) and PSNPs (Fig. S3b). On the other hand, the NPs-1 (Fig.S3c) and NPs-2 (Fig. S3d) showed corona-mediated aggregation in correlation with the DLS results,where we observed a 3 to 4-fold increase in the particle size. After 24 hrs, the total number of aggregatedparticles was high compared to 12 and 6 hrs of exposure, but the average size remained <700 nm.
Protein-corona-mediated internalization of NPs
Generally, plastic particles tend to adsorb organic and inorganic substances quite rapidly, and the rate ofcorona formation and corona thickness is directly proportional to the availability of biomolecules. Forexample, in human serum albumin solution and human blood plasma, a multi-layered protein-corona of afew hundred-nanometre radii was formed on PSNPs within 2 hrs [15]. We strongly suspect that theobserved delay in the protein-corona formation in DMEM could be due to the solution properties,competitive exchange of media components, or shortage of macromolecules. As a result of the delayedcorona formation, we observed a limited FLPS uptake by keratinocytes for up to 12 hrs (Fig. 6 and Fig.S2). As mentioned above, under the in vivo system, corona formation and cellular uptake could occurwithin few hours of exposure. To demonstrate the signi�cant role of protein-corona in NPs recognitionand internalization, we have prepared �uorescent PENPs using Nile red stain (Supplement data) andadded it into the keratin solution (0.2%) for 1 hr to produce keratin-corona (Fig. S4). Likewise, the keratin-coronated green �uorescent FLPS was prepared, puri�ed, dispersed in DMEM, and exposed to the HaCaTcells (Supplement data). After 30 min and 60 min of incubation, the cells were harvested and examinedunder a �uorescent microscope. Figure 7 showed a rapid internalization of �uorescent-PENPs and -PSNPs compared to the cells treated with corona-free-NPs (Fig. 6), where the uptake occurred only after12 hrs. This observation certainly proved that the adsorption of protein and other molecules on the NPsprovided a cloaked identity, subsequently triggered the cell recognition and internalization of NPs. Tomaintain uniformity in the corona formation on NPs and corona-mediated effect on cells, we preferred theprotein-corona formation under DMEM throughout this study.
Macropinocytosis and lysosomal action
Page 10/37
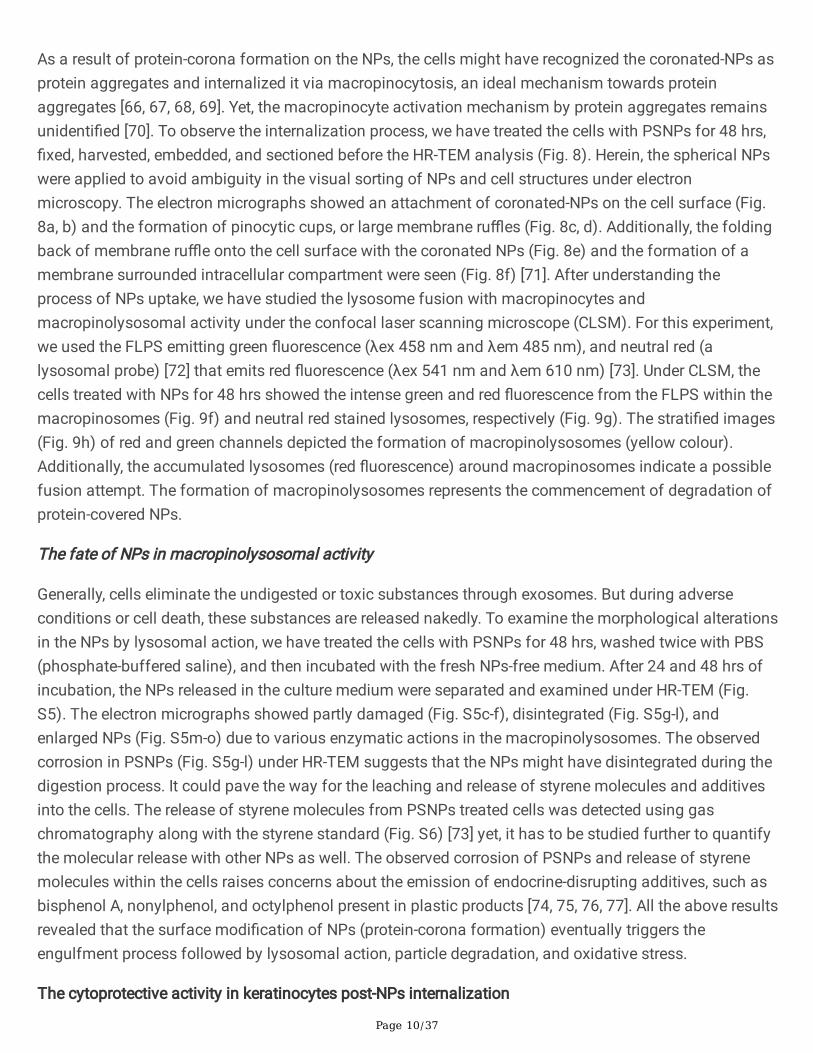
As a result of protein-corona formation on the NPs, the cells might have recognized the coronated-NPs asprotein aggregates and internalized it via macropinocytosis, an ideal mechanism towards proteinaggregates [66, 67, 68, 69]. Yet, the macropinocyte activation mechanism by protein aggregates remainsunidenti�ed [70]. To observe the internalization process, we have treated the cells with PSNPs for 48 hrs,�xed, harvested, embedded, and sectioned before the HR-TEM analysis (Fig. 8). Herein, the spherical NPswere applied to avoid ambiguity in the visual sorting of NPs and cell structures under electronmicroscopy. The electron micrographs showed an attachment of coronated-NPs on the cell surface (Fig.8a, b) and the formation of pinocytic cups, or large membrane ru�es (Fig. 8c, d). Additionally, the foldingback of membrane ru�e onto the cell surface with the coronated NPs (Fig. 8e) and the formation of amembrane surrounded intracellular compartment were seen (Fig. 8f) [71]. After understanding theprocess of NPs uptake, we have studied the lysosome fusion with macropinocytes andmacropinolysosomal activity under the confocal laser scanning microscope (CLSM). For this experiment,we used the FLPS emitting green �uorescence (λex 458 nm and λem 485 nm), and neutral red (alysosomal probe) [72] that emits red �uorescence (λex 541 nm and λem 610 nm) [73]. Under CLSM, thecells treated with NPs for 48 hrs showed the intense green and red �uorescence from the FLPS within themacropinosomes (Fig. 9f) and neutral red stained lysosomes, respectively (Fig. 9g). The strati�ed images(Fig. 9h) of red and green channels depicted the formation of macropinolysosomes (yellow colour).Additionally, the accumulated lysosomes (red �uorescence) around macropinosomes indicate a possiblefusion attempt. The formation of macropinolysosomes represents the commencement of degradation ofprotein-covered NPs.
The fate of NPs in macropinolysosomal activity
Generally, cells eliminate the undigested or toxic substances through exosomes. But during adverseconditions or cell death, these substances are released nakedly. To examine the morphological alterationsin the NPs by lysosomal action, we have treated the cells with PSNPs for 48 hrs, washed twice with PBS(phosphate-buffered saline), and then incubated with the fresh NPs-free medium. After 24 and 48 hrs ofincubation, the NPs released in the culture medium were separated and examined under HR-TEM (Fig.S5). The electron micrographs showed partly damaged (Fig. S5c-f), disintegrated (Fig. S5g-l), andenlarged NPs (Fig. S5m-o) due to various enzymatic actions in the macropinolysosomes. The observedcorrosion in PSNPs (Fig. S5g-l) under HR-TEM suggests that the NPs might have disintegrated during thedigestion process. It could pave the way for the leaching and release of styrene molecules and additivesinto the cells. The release of styrene molecules from PSNPs treated cells was detected using gaschromatography along with the styrene standard (Fig. S6) [73] yet, it has to be studied further to quantifythe molecular release with other NPs as well. The observed corrosion of PSNPs and release of styrenemolecules within the cells raises concerns about the emission of endocrine-disrupting additives, such asbisphenol A, nonylphenol, and octylphenol present in plastic products [74, 75, 76, 77]. All the above resultsrevealed that the surface modi�cation of NPs (protein-corona formation) eventually triggers theengulfment process followed by lysosomal action, particle degradation, and oxidative stress.
The cytoprotective activity in keratinocytes post-NPs internalization
Page 11/37
Inhibition of cell proliferation
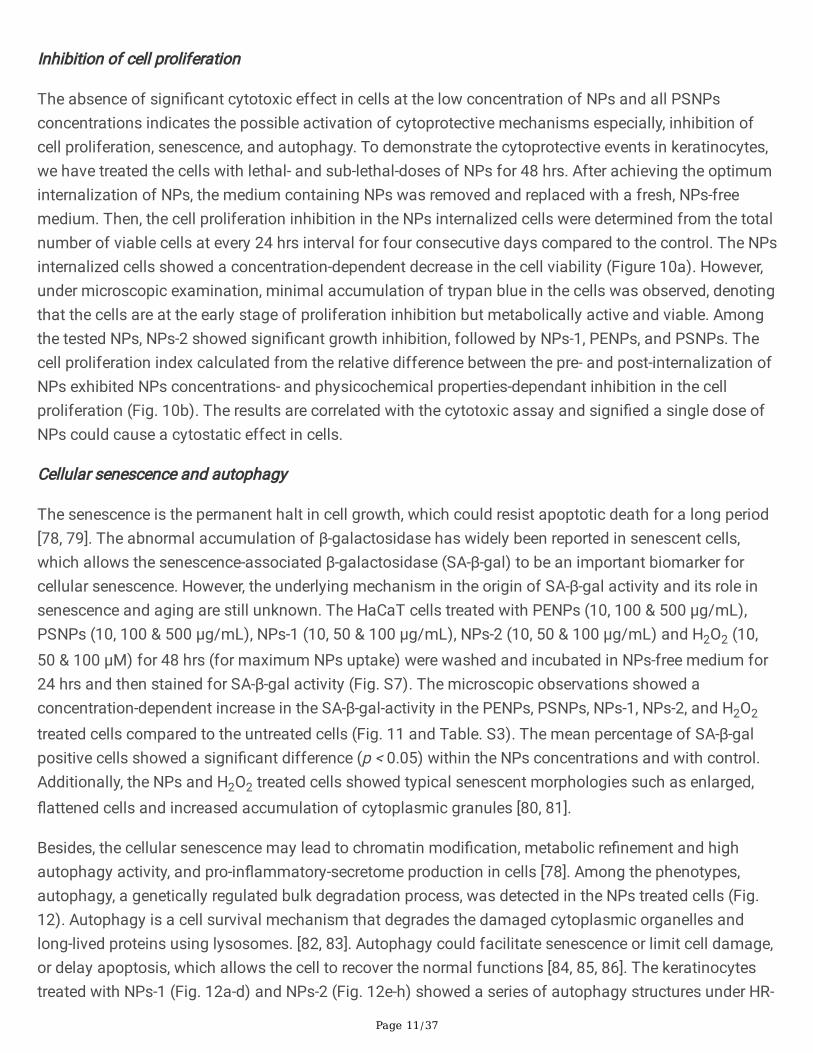
The absence of signi�cant cytotoxic effect in cells at the low concentration of NPs and all PSNPsconcentrations indicates the possible activation of cytoprotective mechanisms especially, inhibition ofcell proliferation, senescence, and autophagy. To demonstrate the cytoprotective events in keratinocytes,we have treated the cells with lethal- and sub-lethal-doses of NPs for 48 hrs. After achieving the optimuminternalization of NPs, the medium containing NPs was removed and replaced with a fresh, NPs-freemedium. Then, the cell proliferation inhibition in the NPs internalized cells were determined from the totalnumber of viable cells at every 24 hrs interval for four consecutive days compared to the control. The NPsinternalized cells showed a concentration-dependent decrease in the cell viability (Figure 10a). However,under microscopic examination, minimal accumulation of trypan blue in the cells was observed, denotingthat the cells are at the early stage of proliferation inhibition but metabolically active and viable. Amongthe tested NPs, NPs-2 showed signi�cant growth inhibition, followed by NPs-1, PENPs, and PSNPs. Thecell proliferation index calculated from the relative difference between the pre- and post-internalization ofNPs exhibited NPs concentrations- and physicochemical properties-dependant inhibition in the cellproliferation (Fig. 10b). The results are correlated with the cytotoxic assay and signi�ed a single dose ofNPs could cause a cytostatic effect in cells.
Cellular senescence and autophagy
The senescence is the permanent halt in cell growth, which could resist apoptotic death for a long period[78, 79]. The abnormal accumulation of β-galactosidase has widely been reported in senescent cells,which allows the senescence-associated β-galactosidase (SA-β-gal) to be an important biomarker forcellular senescence. However, the underlying mechanism in the origin of SA-β-gal activity and its role insenescence and aging are still unknown. The HaCaT cells treated with PENPs (10, 100 & 500 µg/mL),PSNPs (10, 100 & 500 µg/mL), NPs-1 (10, 50 & 100 µg/mL), NPs-2 (10, 50 & 100 µg/mL) and H2O2 (10,50 & 100 µM) for 48 hrs (for maximum NPs uptake) were washed and incubated in NPs-free medium for24 hrs and then stained for SA-β-gal activity (Fig. S7). The microscopic observations showed aconcentration-dependent increase in the SA-β-gal-activity in the PENPs, PSNPs, NPs-1, NPs-2, and H2O2
treated cells compared to the untreated cells (Fig. 11 and Table. S3). The mean percentage of SA-β-galpositive cells showed a signi�cant difference (p < 0.05) within the NPs concentrations and with control.Additionally, the NPs and H 2O2 treated cells showed typical senescent morphologies such as enlarged,�attened cells and increased accumulation of cytoplasmic granules [80, 81].
Besides, the cellular senescence may lead to chromatin modi�cation, metabolic re�nement and highautophagy activity, and pro-in�ammatory-secretome production in cells [78]. Among the phenotypes,autophagy, a genetically regulated bulk degradation process, was detected in the NPs treated cells (Fig.12). Autophagy is a cell survival mechanism that degrades the damaged cytoplasmic organelles andlong-lived proteins using lysosomes. [82, 83]. Autophagy could facilitate senescence or limit cell damage,or delay apoptosis, which allows the cell to recover the normal functions [84, 85, 86]. The keratinocytestreated with NPs-1 (Fig. 12a-d) and NPs-2 (Fig. 12e-h) showed a series of autophagy structures under HR-
Page 12/37
TEM. These structures revealed an active engulfment of damaged organelles by phagophore thatbecomes an autophagosome. After maturation, the autophagosome fuses with the lysosome (termedautophagolysosome/ autolysosomes) for active digestion. The observed proliferation inhibition,senescence, and autophagy activity in the NPs treated cells envisages the homeostasis against a lowlevel of oxidative stress. The results further emphasized that all the ROS-mediated molecular pathwaysmay be interconnected [84, 87]. However, a high level of cytoprotective events can trigger in�ammationand apoptosis [61, 62, 85, 87].
Recent studies on the cytotoxicity of MPs and NPs in human and animal models presented that lowconcentration plastic particles produce oxidative stress in cells, and high concentration plastic particlescause cytotoxic [88, 89]. Additionally, in this study, we have demonstrated the NPs concentration-dependent regulatory activity and cytoprotective and cytotoxic effects in HaCaT cells. This study presentsthree lines of evidence that are essential to close the existing knowledge gap in the cell uptake andresponse against NPs; �rstly, the plastic particles adsorb protein molecules and mimic proteinaggregates, thereby triggers and accelerate the internalization process. Secondly, the internalized NPsundergo lysosomal activity, which damages the NPs and leads to the release of plastic molecules andadditives within the cells, subsequently accelerates oxidative stress. Finally, the ROS stress down-regulates cell proliferation and inhibits cell growth leading to premature aging, autophagy, or ROS-induced cytotoxic effect. To conclude, the continuous use of NPs and MPs particles incorporatedcosmetics over a prolonged time may result in premature aging of skin cells.
ConclusionDespite the wide usage of cosmetic products containing a high concentration of NPs/MPs, not manystudies have demonstrated the NPs internalization, accumulation, and toxicity in skin cells. Hence, in thepresent study, we have used HaCaT cells to evaluate the potential risk of a single- and long-term-doses ofNPs on human skin. To the best of our knowledge, this is the �rst study that demonstrates the protein-corona-mediated entry of plastic particles, lysosomal-mediated disintegration of NPs, and additivesrelease in cells. Also presented the NPs concentration-dependent ROS production, cytoprotective andcytotoxic events in cells. The observed proliferation inhibition, senescence, and autophagy activity in cellsevidence the homeostasis attempt via cytoplasmic and organelle turnover against a low level of oxidativestress. However, at the high level of cytoprotective events, especially autophagy may cause autophagiccell death.
Although the concentration of NPs exposed to humans in every single use has not been preciselycalculated, the concentrations used herein still order the magnitude of realistic human exposure. Webelieve that the results obtained from the 2D monolayer culture model are preliminary but novel evidenceon keratinocyte's physiological responses against NPs. Even though 2D cultures have many limitationsand are highly variable from the natural architecture, most of the physiological events and molecularpathways taking place within the cells were elucidated using the 2D culture technique. For more realisticexposure and dose analysis at the physiological and molecular level, and to validate additional risks of
Page 13/37
applying polymer NPs incorporated cosmetics on skin cells and NPs disintegration within the cells, a 3Dskin model is needed. Further studies are required to de�ne the protein-corona-mediated recognition andmacropinocytosis process and to determine the e�ux action. Collectively, these �ndings will shed light onthe effects of plastic particles on human cells and might seed further studies. At the outset, our resultsemphasize an immediate action to curtail the use of NPs/MPs and demand the use of more natural andsustainable ingredients in CPCP.
Materials And MethodsMaterials, reagents, and cell culture
The polyethylene pellets (Polysciences, Inc., Warrington, PA), polystyrene NPs (PSNPs- 100 nm) (Catalog# 108821-10, Corpuscular Inc., NY, USA), and �uorescently labelled polystyrene NPs (FLPS- 200 nm)(Fluoresbrite® Yellow Green 0.20 µm Microspheres, Polysciences, Inc.) were procured commercially andused in this study. The 2', 7'-Dichloro�uorescin diacetate (DCFDA) was purchased from Sigma Aldrich (St.Louis, MO). The DAPI (4', 6-Diamidino-2-Phenylindole, Dihydrochloride) and MTT (3‐ [4, 5‐dimethylthiazol‐2‐yl] ‐2, 5‐diphenyl tetrazolium bromide) were procured from HiMedia, India. The Senescence β-Galactosidase Staining Kit (#9860, CST) was acquired from Cell Signalling Technology (Beverly, MA,USA). Collagen and keratin were extracted from �sh scales [90] and human hair �bres [91], respectively,and used in this study (Supplement data).
The nano-sized PENPs were prepared from the subsequent breakdown of polyethylene pellets using astainless-steel grain grinder mill, homogenizer, and ultra-sonicator. Brie�y, the powder collected from thegrinder mill was sieved using stainless steel sieve (75 µm), and the sieved powder (10 mg) washomogenized in deionized water (50 mL) until a pale smoke colour solution formed. Then the solutionwas separated and sonicated for 2 hrs. The pale solution was �ltered subsequently using 20-25 μm, 2.5μm, and 0.4 μm �lters and then quanti�ed for further studies. Before each experiment, the PENPsdispersion solution was sonicated for 30 min. The stability, zeta-potential, Raman shift, and morphometryof PENPs were analysed as described below.
The human keratinocytes (HaCaT cells) were cultured in DMEM (HiMedia) containing glucose (4.5 g/l),sodium pyruvate, FBS (10%), L-glutamine (2 mM), penicillin (100U/mL), streptomycin (100 µg/mL) andamphotericin B (0.25 µg/mL) and maintained under a 95% humidi�ed incubator at 37°C with 5% CO2.The same cultural conditions were maintained throughout the study.
Isolation of NPs from face scrubs
About 0.2 g samples from 10 replicates of each FS were diluted separately in 10 mL of �lter-sterilized,surfactant-free ultrapure hot water (Fig. S8) subsequently �ltered through 20-25 μm (Grade 2Whatman®), 2.5 μm (Grade 41 Whatman®), 0.4 μm (Whatman® 110607, Nuclepore membrane �lter)and 0.2 μm (Whatman® 7182-014, Cellulose nitrate membrane �lter). Final �ltrates obtained from a 0.2μm �lter were pooled together with the respective FS and quanti�ed. The spectral and morphological
Page 14/37
features of the dried NPs were analysed using Fourier Transform Raman Spectroscopy (FT-Raman)(PerkinElmer 1600 instrument, USA) and HR-SEM (Carl Zeiss Evo 18 SEM, Germany). The dispersion,stability, and size distribution of the NPs in culture medium (DMEM) were measured using the MalvernDynamic Light Scattering instrument (Malvern, UK) in triplicates with 20 runs each.
Adsorption of NP particles on the keratin layer
The microscopic glass slides were cut into 1cm2 glass pieces, immersed in detergent solution, bathsonicated, rinsed with distilled water, and cleaned with freshly prepared 3:1 HCl: HNO3 (aqua regia) for 30min and then thoroughly rinsed using ultra-pure water. Each glass piece was immersed in a 0.1% collagensolution overnight under a shaker incubator. After incubation, the glass pieces were carefully removed,wiped at one side, placed into a Petri dish to drain the excess moisture. About 100 µL of keratin solution(0.5%) was drop coated on the collagen layer and dried at room temperature (Fig. S9). Herein, keratinconcentration was decided based on the estimate of Chao and Nylander-French [92] that the averagetotal keratin mass of stratum corneum in males and females was more than 400 µg/cm2. The keratin-coated glass pieces were immersed in the PENPs suspension (100 µg/mL) for 2-3 min under wrist-actionshaking at room temperature. After incubation, the glass pieces were carefully removed and subsequentlywashed by 8 - 10 dipping in ultra-pure water for 30 sec. Another set of glass pieces was washed twice (8 -10 dipping/ wash) with a 30-sec interval to check the sturdy adsorption of NPs on the protein layer. Thewashed (1 or 2 times) and unwashed glass pieces were dried, gold-coated using sputter coater, and thenobserved under �eld-emission scanning electron microscope (FE-SEM). The same procedure was carriedout for PSNPs, NPs-1, and NPs-2.
NP particles interaction with keratinocytes
Chronic long-term cytotoxicity assay
HaCaT cells (1x10⁴) were seeded in 96 well plates and incubated. After achieving con�uency, the DMEMwas replaced with fresh medium containing different concentrations of PENPs (25, 50, 100, 250, 500µg/mL), PSNPs (25, 50, 100, 250, 500 µg/mL), NPs-1 (25, 50, 100, 250, 500 µg/mL) and NPs-2 (5, 10, 50,100, 250 µg/mL) into respective wells and incubated. The working concentrations of all the NPs in theculture medium were prepared without altering the concentration of the medium components from thestock solutions of PENPs (1 mg/mL), PSNPs (25 mg/mL), NPs-2 (2 mg/mL), and NPs-1 (2 mg/mL),vortexed vigorously for 10 min and used immediately or eventually depending on the experiment. At every24 hrs interval, the cell viability was measured using the MTT assay. Herein, the experiment wasconducted for six consecutive days because most in vitro studies on MPs or NPs were conducted for lessthan 48 hrs, but in real-world events, there might be chronic long-term exposure. Additionally, the NPsincorporated DMEM medium was maintained under culture conditions and used as a replacementmedium (every 24 hrs) for all the experiments unless otherwise stated.
Determination of intracellular oxidative stress
Page 15/37
HaCaT cells (1x10⁴) were seeded in 96-well plates and incubated. The ROS production in HaCaT cellsexposed to the above-used concentrations of PENPs, PSNPs, NPs-1, and NPs-2 was measured for sixconsecutive days using the DCFDA assay. Brie�y, the NPs treated cells were washed twice with PBS(phosphate-buffered saline) at every 24 hrs intervals and about 10µM DCFDA was added and incubatedfor 60 min. In the event of ROS production, the non-�uorescent DCFDA oxidized into green �uorescent 2',7' –dichloro�uorescein (DCF). The level of �uorescence is directly proportional to the oxidative stress inthe cells [93]. After 60 min, the cells were washed with PBS twice and measured for �uorescence underspectro�uorometer (JASCO FP-8300, Japan) using the excitation and emission wavelengths of 495 and525 nm, respectively. Additionally, hydrogen peroxide (25, 50, 100, 250, 500 µM) was used as the positiveROS indicator.
Determination of oxidative stress marker
HaCaT cells (1x10⁵) were seeded in a culture dish and incubated to achieve con�uence, then the cellswere treated with different concentration of PENPs (25, 50, 500 µg /mL), PSNPs (25, 50, 500 µg /mL),NPs-1 (25, 50, 500 µg /mL), NPs-2 (10, 50, 250 µg /mL). At every 24 hrs interval for four consecutive days,the spent medium with NPs was withdrawn and discarded. The cells were washed thrice with cold PBS,detached by scraping, suspended subsequently in sodium phosphate buffer (10mM, pH 7.5), and thenhomogenized. To the homogenate, 1% Triton X-100 was added and incubated on ice for 10 min and thencentrifuged (5000g) at 4° C for 10 min. The protein content was estimated from the clear supernatant bythe Bradford method. Lipid peroxidation was estimated through the thiobarbituric acid reactive substanceconcentration (TBARS) [94]. Brie�y, the protein molecules were precipitated from the cell homogenateusing TCA (10% w/v). The clear supernatant obtained from centrifugation was mixed with 0.67% TBA(w/v), heated for 30 min at 95°C in a water bath. Herein, the reaction between TBA and oxidativedegradation of lipid products produced a red complex with an absorbance maximum at 535 nm. The 1, 1,3, 3-tetra methoxy propane was used as the standard, and the lipid peroxidation was presented asnmol/mg protein.
Determination of antioxidant enzyme activity
The amount of epinephrine auto-oxidation inhibition by SOD was used to determine the total SOD activity[95]. Brie�y, 50 µg of protein was added to 500 mM sodium phosphate buffer (pH 10.2) and epinephrine(1mM). At pH 10, epinephrine rapidly undergoes auto-oxidation that produces pink-colour adrenochrome,which was measured at 480 nm using a microplate reader (Biotek, USA.) The amount of enzyme requiredto cause 50% inhibition was de�ned as 1 unit of enzyme activity, and the total SOD activity wasexpressed as units/mg protein. Similarly, for catalase activity, 50 µl of protein extract was added tosodium phosphate buffer (50 mM, pH 7.0) and hydrogen peroxide (100 mM) mixture, shaken, and thenincubated under dark for 10 min at 37°C. The changes in the absorbance at 240 nm were measuredagainst the blank, and the CAT activity was expressed as units/mg protein [96].
Degree of NPs cellular internalization and exclusion
Page 16/37
Determination of NPs internalization
To study the NPs internalization, retention, and elimination, we used the green �uorescent FLPS particles.The HaCaT cells (8 × 10³) were exposed to1:500 dilutions of FLPS and incubated. After every 24 hrs, thecells were washed thrice with PBS, �xed with 3.7% formaldehyde, stained with DAPI, and examined undera �uorescence microscope (EVOS™ FLoid™ Cell Imaging Station, Life Technologies, Carlsbad,CA). Another set of washed cells was supplemented with fresh medium (without FLPS), incubated, andused to evaluate the retention and exclusion activity. Post-incubation, the cells were washed, �xed, andstained for microscopic examination.
Role of protein-corona in the NPs uptake
The in�uence of protein-corona in the NPs uptake was demonstrated using the �uorescent-labelledpolystyrene NPs (FLPS) and Nile red-stained PENPs. The �uorescent FLPS and PENPs were treated withthe human keratin solution to produce keratin-coronated NPs. Detailed Nile red staining procedure andkeratin-corona preparation are presented in the supplement data. These coronated �uorescent NPs wereexposed to the keratinocytes and incubated. After 30 and 60 min of exposure, the cells were washed andobserved under a �uorescence microscope.
Mode of NPs internalization in cell
The NPs treated cells were �xed in glutaraldehyde (2%), harvested by scraping, and then embedded inresin for sectioning under an ultramicrotome (Leica ultra-cut UCT UC7, Austria) [97]. The sections wereplaced on a copper grid, stained with 4% uranyl acetate and 1% lead citrate, and observed under the HR-TEM (Technai, G2 20 Twin, FEI, USA). Here, we used spherical PSNPs for visual sorting and robustidenti�cation of particles under electron microscopy.
Lysosome labelling with neutral red
The keratinocytes exposed to FLPS were washed thrice with PBS and immersed with the neutral redsolution (2 mM) for 5 min. Then the cells were washed thrice with PBS, mounted, and observed under aconfocal laser scanning microscope (CLSM) (Zeiss LSM 710, Carl Zeiss, Germany) [98].
Morphometry of NPs eliminated from the keratinocytes
After removing the medium containing the uninternalized PSNPs, the cells were washed thrice andincubated with a fresh medium without PSNPs. After 24 hrs incubation, the cell-free medium wascollected and centrifuged at 4000 rpm for 5 min. The pellet was dissolved in ultra-pure water, drop coatedimmediately onto a TEM grid, air-dried, and observed under HR-TEM. Similarly, the NPs incorporated inthe sterile DMEM were also examined under HR-TEM to compare the morphology of the NPs [15]. Here,we used spherical PSNPs for visual sorting and robust identi�cation of particles under electronmicroscopy.
Page 17/37
Assessment of cellular response against internalized NPs
Effect of single-dose on cell proliferation
To determine the effect of a single dose of lethal- and sub-lethal-concentrations of NPs on the cellproliferation, the HaCaT cells (3 X 10⁵) were seeded in a 24-well plate and treated with a single dose of 50and 100 µg /mL of NPs and 50 and 100 µM of H2O2 as a positive control for proliferation inhibition. After48 hrs incubation, the NPs containing medium was removed, and the cells were washed with PBS andfresh medium to remove the particles attached to the cell surface and culture dish. Then the cells wereharvested by trypsinization to estimate the viable cells using the trypan blue staining, wherein the deadcells stained in blue colour and viable cells remain unstained [99]. About 3x10⁴ cells (internalized withNPs) were seeded in triplicates into four individual culture plates and incubated for 24, 48, 72, and 96 hrs,respectively. Here, the culture medium containing the excreted NPs was withdrawn and replaced withfresh, NPs-free DMEM at every 24 hrs interval. After incubation, the cells were harvested, stained with0.4% trypan blue, and counted in triplicates using a hemocytometer [100]. The relative difference of cellproliferation rate was calculated from the triplicate experiments using the following equation; seeequations 1 and 2 in the supplementary �les section.
Senescence associated β-galactosidase assay
For assessing the cellular senescence, HaCaT cells (5X10⁴) were exposed to PENPs (10, 100 & 500µg/mL), PSNPs (10, 100 & 500 µg/mL), NPs-1 (10, 50 & 100 µg/mL), NPs-2 (10, 50 & 100 µg/mL) andH2O2 (10, 50 & 100µM) for 48 hrs. After 48 hrs of incubation, the medium (with NPs) was removed, cellswere washed with PBS as described above, then the fresh, NPs-free medium was introduced andincubated. After 72 hrs, the cells were �xed using paraformaldehyde (3.7%) and stained for senescence-associated beta-galactosidase (SA-b-gal) using Senescence β-Galactosidase Staining Kit according to themanufacturer's instructions. Five phase-contrast images were captured in random locations using CarlZeiss inverted microscope (Axio Vert.A1 FL, Carl Zeiss, Germany). The number of SA- β-gal positive cells(stained in blue) in respective concentrations was calculated and quanti�ed using ImageJ 1.8.0 software(NIH) [44].
Statistical analysis
All the treatment conditions were triplicated, and each experiment was repeated twice at different times,and all the data were presented as mean ± SME. For MTT data, a two-way analysis of variance (ANOVA)was carried out by considering the different concentrations of the NPs at speci�c treatment times asmain factors. Tukey post hoc method was implemented for the pairwise multiple means comparisonusing OriginPro 2020b (Learning Edition, OriginLab Corp, Massachusetts, USA). The ROS data was alsoprocessed with two-way ANOVA with Tukey pairwise multiple means comparison for the treatment timeof each treatment concentration in GraphPad Prism 8.4.3 (GraphPad Software, San Diego, CA, USA).Similar pairwise multiple means comparison and one-way ANOVA with Holm-Sidak multiple comparison
Page 18/37
analysis were done for SA β-gal positive cells and MDA activity, respectively. The statistical signi�cancedifferences in the SOD and CAT activity between control and treatment groups were analysed by two-wayANOVA implementing Dunnett's multiple comparisons test using GraphPad Prism. The p <0.05 wasconsidered to indicate a statistically signi�cant difference.
DeclarationsEthical Approval and Consent to participate: Not applicable
Consent for publication: Not applicable
Availability of data and materials: Not applicable
Competing interests: The authors declare no competing �nancial interests.
Funding: Not applicable
Authors' contributions: P.M.G., N.C., and P.R., conceived the idea and designed the experiments; P.M.G. andK.S.T. carried out the experiments wrote the paper; J.T. and A.M. contributed materials characterization,analysed data; all authors discussed the results and commented on the manuscript.
Acknowledgments: The author P.M.G. is grateful for �nancial support from the DST-SERB, Govt. of India,and Vellore Institute of Technology, Vellore in the form of National Post-Doctoral Fellowship (FILENO.PDF/2016/002124) and Institutional-PDF, respectively. PR acknowledges the funding from theScience and Engineering Research Board, Grant/Award Number: SB/EMEQ‐223/2014. We also thank theeditor and four anonymous reviewers for their valuable insights, suggestions, and thoughtful commentsin all aspects of this investigation.
Authors' information: PM Gopinath, KS Twayana, John Thomas, Amitava Mukherjee, and NChandrasekaran are from the Vellore Institute of Technology (VIT University). P Ravanan is from theCentral University of Tamil Nadu.
AbbreviationsCAT- Catalase; CLSM - Confocal Laser Scanning Microscope; CPCP - Cosmetics and Personal CareProducts; DMEM- Dulbecco’s Modi�ed Eagle’s Medium; FS- Face Scrubs; FLPS- �uorescently labelledpolystyrene NPs; HR-TEM - High-Resolution Transmission Electron Microscopy; NPs-1- Nanoplasticsisolated from FS-1; NPs-2 - Nanoplastics isolated from FS-2; NPs/MPs - Nano-plastics/ Microplastics;PENPs- Polyethylene Nano-plastics; PSNP- Polystyrene Nano-Plastics; ROS - Reactive Oxygen Species;SOD- Superoxide dismutase.
References
Page 19/37
1. Mansor N, Ali DEBM, Yaacob MR. Cosmetic usage in Malaysia: understanding of the majordeterminants affecting the users. International Journal of Business and Social Science. 2010;13:273-81.
2. Chao A, Schor JB. Empirical tests of status consumption: Evidence from women's cosmetics. Journalof Economic Psychology. 1998;19 1:107-31.
3. Daniel GE. Ancient India, number 4 (July 1947-January 1948, Double Number), ArchaeologicalSurvey of India, New Delhi. 6s.-Etched Beads in India, byM. G. Dikshit (Deccan CollegeMonographSeries no. 4), Poona, 1949, Rs. 10.-Stone Age Cultures of Bellary, byB. Subbarao (DeccanCollege DissertationSeries no. 7), Poona, 1948. Rs. 8. Proceedings of the Prehistoric Society.1949;15:195-6.
4. Butuc G, Morrison DS. Hydrocarbons in Pigmented Products. In: Rhein LD, Schlossman M, O'LenickA, Somasundaran P, editors. Surfactants in Personal Care Products and Decorative Cosmetics. vol.135: CRC Press; 2006. p. 341.
5. Fendall LS, Sewell MA. Contributing to marine pollution by washing your face: microplastics in facialcleansers. Marine pollution bulletin. 2009;58 8:1225-8.
�. Zitko V, Hanlon M. Another source of pollution by plastics: skin cleaners with plastic scrubbers.Marine Pollution Bulletin. 1991;22 1:41-2.
7. UNEP. Plastic in Cosmetics: Are We Polluting the Environment Through our Personal Care: Plasticingredients that contribute to marine microplastic litter. United Nations Environment Programme(UNEP), Nairobi. 2015:URL: http://unep.org/newscentre/default.aspx?DocumentID=26827&ArticleID=35180&l=en.
�. Thompson RC, Swan SH, Moore CJ, Vom Saal FS. Our plastic age. Philosophical Transactions of theRoyal Society B Biological Sciences. 2009;364:1973–6.
9. Napper IE, Bakir A, Rowland SJ, Thompson RC. Characterisation, quantity and sorptive properties ofmicroplastics extracted from cosmetics. Marine Pollution Bulletin. 2015;99 1-2:178-85.
10. Gregory MR. Plastic 'scrubbers' in hand cleansers: a further (and minor) source for marine pollutionidenti�ed. Marine Pollution Bulletin. 1996;32 12:867-71.
11. ECHA. ECHA’s ANNEX XV Restriction Report-Proposal for a restriction: Intentionally addedmicroplastics, 20 March 2019. European Chemicals Agency.2019:https://echa.europa.eu/documents/10162/2414bc7-6bb2-17e7-c9ec-652a20fa43fc.
12. Godoy V, Martin-Lara MA, Calero M, Blazquez G. Physical-chemical characterization of microplasticspresent in some exfoliating products from Spain. Marine Pollution Bulletin. 2019;139:91-9.
13. Hernandez LM, Youse� N, Tufenkji N. Are there nanoplastics in your personal care products?Environmental Science & Technology Letters. 2017;4 7:280-5.
14. Gopinath PM, Chandrasekaran N, Mageshchander M: Method and device for the extraction ofmicroplastics from aqueous suspension. In: The Patent O�ce Journal No 42/2019 Dated18/10/2019. Edited by India IP. India2019: 48806.
Page 20/37
15. Gopinath PM, Saranya V, Vijayakumar S, Meera MM, Ruprekha S, Kunal R, et al. Assessment oninteractive prospectives of nanoplastics with plasma proteins and the toxicological impacts of virgin,coronated and environmentally released-nanoplastics. Scienti�c Reports. 2019;9 1:1-15.
1�. Gouin T, Roche N, Lohmann R, Hodges G. A thermodynamic approach for assessing theenvironmental exposure of chemicals absorbed to microplastic. Environmental Science &Technology. 2011;45 4:1466-72.
17. Praveena SM, Shaifuddin SNM, Akizuki S. Exploration of microplastics from personal care andcosmetic products and its estimated emissions to marine environment: An evidence from Malaysia.Marine pollution bulletin. 2018;136:135-40.
1�. Sivagami M, Selvambigai M, Devan U, Velangani AAJ, Karmegam N, Biruntha M, et al. Extraction ofmicroplastics from commonly used sea salts in India and their toxicological evaluation.Chemosphere. 2020;263:128181.
19. Nobre CR, Santana MFM, Maluf A, Cortez FS, Cesar A, Pereira CDS, et al. Assessment of microplastictoxicity to embryonic development of the sea urchin Lytechinus variegatus (Echinodermata:Echinoidea). Marine pollution bulletin. 2015;92 1-2:99-104.
20. Jeong C-B, Won E-J, Kang H-M, Lee M-C, Hwang D-S, Hwang U-K, et al. Microplastic size-dependenttoxicity, oxidative stress induction, and p-JNK and p-p38 activation in the monogonont rotifer(Brachionus koreanus). Environmental Science & Technology. 2016;50 16:8849-57.
21. Au SY, Bruce TF, Bridges WC, Klaine SJ. Responses of Hyalella azteca to acute and chronicmicroplastic exposures. Environmental Toxicology and Chemistry. 2015;34 11:2564-72.
22. Lee K-W, Shim WJ, Kwon OY, Kang J-H. Size-dependent effects of micro polystyrene particles in themarine copepod Tigriopus japonicus. Environmental Science & Technology. 2013;47 19:11278-83.
23. Von Moos N, Burkhardt-Holm P, Köhler A. Uptake and effects of microplastics on cells and tissue ofthe blue mussel Mytilus edulis L. after an experimental exposure. Environmental Science &Technology. 2012;46 20:11327-35.
24. Peda C, Caccamo L, Fossi MC, Gai F, Andaloro F, Genovese L, et al. Intestinal alterations in Europeansea bass Dicentrarchus labrax (Linnaeus, 1758) exposed to microplastics: preliminary results.Environmental Pollution. 2016;212:251-6.
25. Wright SL, Rowe D, Thompson RC, Galloway TS. Microplastic ingestion decreases energy reserves inmarine worms. Current Biology. 2013;23 23:R1031-R3.
2�. Rodriguez-Seijo A, Lourenco J, Rocha-Santos TAP, Da Costa J, Duarte AC, Vala H, et al.Histopathological and molecular effects of microplastics in Eisenia andreiBouche. EnvironmentalPollution. 2017;220:495-503.
27. Deng Y, Zhang Y, Lemos B, Ren H. Tissue accumulation of microplastics in mice and biomarkerresponses suggest widespread health risks of exposure. Scienti�c Reports. 2017;7:46687.
2�. Amaral-Zettler LA, Zettler ER, Slikas B, Boyd GD, Melvin DW, Morrall CE, et al. The biogeography of thePlastisphere: implications for policy. Frontiers in Ecology and the Environment. 2015;13 10:541-6.
Page 21/37
29. Holliman G, Lowe D, Cohen H, Felton S, Raj K. Ultraviolet radiation-induced production of nitric oxide:a multi-cell and multi-donor analysis. Scienti�c Reports. 2017;7 1:1-11.
30. Doge N, Hadam S, Volz P, Wolf A, Schonborn KH, Blume†Peytavi U, et al. Identi�cation ofpolystyrene nanoparticle penetration across intact skin barrier as rare event at sites of focal particleaggregations. Journal of Biophotonics. 2018;11 4:e201700169.
31. Li J, Yang D, Li L, Jabeen K, Shi H. Microplastics in commercial bivalves from China. Environmentalpollution. 2015;207:190-5.
32. Goodman KE, Hare JT, Khamis ZI, Hua T, Sang Q-XA. Exposure of Human Lung Cells to PolystyreneMicroplastics Signi�cantly Retards Cell Proliferation and Triggers Morphological Changes. ChemicalResearch in Toxicology. 2021.
33. Abdel-Mottaleb MMA, Moulari B, Beduneau A, Pellequer Y, Lamprecht A. Surface-charge-dependentnanoparticles accumulation in in�amed skin. Journal of pharmaceutical sciences. 2012;10111:4231-9.
34. Abdel-Mottaleb MMA, Moulari B, Beduneau A, Pellequer Y, Lamprecht A. Nanoparticles enhancetherapeutic outcome in in�amed skin therapy. European journal of pharmaceutics andbiopharmaceutics. 2012;82 1:151-7.
35. Lei K, Qiao F, Liu Q, Wei Z, Qi H, Cui S, et al. Microplastics releasing from personal care and cosmeticproducts in China. Marine Pollution Bulletin. 2017;123 1-2:122-6.
3�. Kotula AP, Meyer MW, De Vito F, Plog J, Hight Walker AR, Migler KB. The rheo-Raman microscope:Simultaneous chemical, conformational, mechanical, and microstructural measures of softmaterials. Review of Scienti�c Instruments. 2016;87 10:105105.
37. Mahe B, Vogt A, Liard C, Duffy D, Abadie Vr, Bonduelle O, et al. Nanoparticle-based targeting ofvaccine compounds to skin antigen-presenting cells by hair follicles and their transport in mice.Journal of Investigative Dermatology. 2009;129 5:1156-64.
3�. Teichmann A, Jacobi U, Weigmann HJ, Sterry W, Lademann J. Reservoir function of the stratumcorneum: development of an in vivo method to quantitatively determine the stratum corneumreservoir for topically applied substances. Skin pharmacology and physiology. 2005;18 2:75-80.
39. Lademann J, Otberg N, Richter H, Weigmann HJ, Lindemann U, Schaefer H, et al. Investigation offollicular penetration of topically applied substances. Skin Pharmacology and Physiology. 2001;14Suppl. 1:17-22.
40. Stock V, Bohmert L, Lisicki E, Block R, Cara-Carmona J, Pack LK, et al. Uptake and effects of orallyingested polystyrene microplastic particles in vitro and in vivo. Archives of Toxicology. 2019;937:1817-33.
41. Espinosa C, Beltran JMG, Esteban MA, Cuesta A. In vitro effects of virgin microplastics on �sh head-kidney leucocyte activities. Environmental Pollution. 2018;235:30-8.
42. Hesler M, Aengenheister L, Ellinger B, Drexel R, Straskraba S, Jost C, et al. Multi-endpointtoxicological assessment of polystyrene nano-and microparticles in different biological models invitro. Toxicology In Vitro. 2019;61:104610.
Page 22/37
43. Zhong JL, Raval C, Edwards GP, Tyrrell RM. A role for Bach1 and HO-2 in suppression of basal andUVA-induced HO-1 expression in human keratinocytes. Free Radical Biology and Medicine. 2010;482:196-206.
44. Liu L, Xie H, Chen X, Shi W, Xiao X, Lei D, et al. Differential response of normal human epidermalkeratinocytes and HaCaT cells to hydrogen peroxide-induced oxidative stress. Clinical andExperimental Dermatology: Experimental Dermatology. 2012;37 7:772-80.
45. Svobodova A, Walterova D, Vostalova J. Ultraviolet light induced alteration to the skin. BiomedicalPapers-Palacky University in Olomouc. 2006;150 1:25.
4�. Kammeyer A, Luiten RM. Oxidation events and skin aging. Ageing research reviews. 2015;21:16-29.
47. Bauernfeind F, Bartok E, Rieger A, Franchi L, Nunez G, Hornung V. Cutting edge: reactive oxygenspecies inhibitors block priming, but not activation, of the NLRP3 in�ammasome. The Journal ofImmunology. 2011;187 2:613-7.
4�. Tobin DJ. Introduction to skin aging. Journal of Tissue Viability. 2017;26 1:37-46.
49. Scharffetter-Kochanek K, Wlaschek M, Brenneisen P, Schauen M, Blaudschun R, Wenk J. UV-inducedreactive oxygen species in photocarcinogenesis and photoaging. Biological Chemistry. 1997;37811:1247-58.
50. Evereklioglu C, Er H, Doganay S, Cekmen M, Turkoz Y, Otlu B, et al. Nitric oxide and lipid peroxidationare increased and associated with decreased antioxidant enzyme activities in patients with age-related macular degeneration. Documenta ophthalmologica. 2003;106 2:129-36.
51. Demling R, Ikegami K, Lalonde C. Increased lipid peroxidation and decreased antioxidant activitycorrespond with death after smoke exposure in the rat. The Journal of burn care & rehabilitation.1995;16 2:104-10.
52. Ezz HSA, Khadrawy YA, Mourad IM. The effect of bisphenol A on some oxidative stress parametersand acetylcholinesterase activity in the heart of male albino rats. Cytotechnology. 2015;67 1:145-55.
53. Eid JI, Eissa SM, El-Ghor AA. Bisphenol A induces oxidative stress and DNA damage in hepatic tissueof female rat offspring. The Journal of Basic & Applied Zoology. 2015;71:10-9.
54. Ullah H, Jahan S, Ain QU, Shaheen G, Ahsan N. Effect of bisphenol S exposure on male reproductivesystem of rats: A histological and biochemical study. Chemosphere. 2016;152:383-91.
55. Zoroglu SS, Armutcu F, Ozen S, Gurel A, Sivasli E, Yetkin O, et al. Increased oxidative stress andaltered activities of erythrocyte free radical scavenging enzymes in autism. European archives ofpsychiatry and clinical neuroscience. 2004;254 3:143-7.
5�. Eraslan G, Saygi S, Essiz D, Aksoy A, Gul H, Macit E. Evaluation of aspect of some oxidative stressparameters using vitamin E, proanthocyanidin and N-acetylcysteine against exposure to cy�uthrin inmice. Pesticide biochemistry and physiology. 2007;88 1:43-9.
57. Bukowska B. 2, 4, 5-T and 2, 4, 5-TCP induce oxidative damage in human erythrocytes: the role ofglutathione. Cell biology international. 2004;28 7:557-63.
Page 23/37
5�. Pigeolet E, Corbisier P, Houbion A, Lambert D, Michiels C, Raes M, et al. Glutathione peroxidase,superoxide dismutase, and catalase inactivation by peroxides and oxygen derived free radicals.Mechanisms of ageing and development. 1990;51 3:283-97.
59. Fattman CL, Schaefer LM, Oury TD. Extracellular superoxide dismutase in biology and medicine. FreeRadical Biology and Medicine. 2003;35 3:236-56.
�0. Trachootham D, Lu W, Ogasawara MA, Valle NR-D, Huang P. Redox regulation of cell survival.Antioxidants & Redox Signaling. 2008;10 8:1343-74.
�1. AshaRani PV, Low Kah Mun G, Hande MP, Valiyaveettil S. Cytotoxicity and genotoxicity of silvernanoparticles in human cells. ACS Nano. 2009;3 2:279-90.
�2. Mahmoudi M, Azadmanesh K, Shokrgozar MA, Journeay WS, Laurent S. Effect of nanoparticles onthe cell life cycle. Chemical Reviews. 2011;111 5:3407-32.
�3. Schins RPF, Knaapen AM. Genotoxicity of poorly soluble particles. Inhalation Toxicology. 2007;19sup1:189-98.
�4. Aguilar-Gaytan R, Mas-Oliva J. Oxidative stress impairs endocytosis of the scavenger receptor classA. Biochemical and biophysical research communications. 2003;305 3:510-7.
�5. Cheng J, Vieira A. Oxidative stress disrupts internalization and endocytic tra�cking of transferrin in ahuman malignant keratinocyte line. Cell biochemistry and biophysics. 2006;45 2:177-84.
��. Desplats P, Lee H-J, Bae E-J, Patrick C, Rockenstein E, Crews L, et al. Inclusion formation andneuronal cell death through neuron-to-neuron transmission of α-synuclein. Proceedings of theNational Academy of Sciences. 2009;106 31:13010-5.
�7. Trevino RS, Lauckner JE, Sourigues Y, Pearce MM, Bousset L, Melki R, et al. Fibrillar structure andcharge determine the interaction of polyglutamine protein aggregates with the cell surface. Journalof Biological Chemistry. 2012;287 35:29722-8.
��. Zeineddine R, Pundavela JF, Corcoran L, Stewart EM, Do-Ha D, Bax M, et al. SOD1 protein aggregatesstimulate macropinocytosis in neurons to facilitate their propagation. Molecular Neurodegeneration.2015;10 1:1-18.
�9. Munch C, O'Brien J, Bertolotti A. Prion-like propagation of mutant superoxide dismutase-1 misfoldingin neuronal cells. Proceedings of the National Academy of Sciences. 2011;108 9:3548-53.
70. Yerbury JJ. Protein aggregates stimulate macropinocytosis facilitating their propagation. Prion.2016;10 2:119-26.
71. Meier O, Boucke K, Hammer SV, Keller S, Stidwill RP, Hemmi S, et al. Adenovirus triggersmacropinocytosis and endosomal leakage together with its clathrin-mediated uptake. The Journal ofCell Biology. 2002;158 6:1119-31.
72. Sousa C, Sa e Melo T, Geze M, Gaullier J-M, Maziere JC, Santus R. Solvent polarity and pH effects onthe spectroscopic properties of neutral red: application to lysosomal microenvironment probing inliving cells. Photochemistry and Photobiology. 1996;63 5:601-7.
Page 24/37
73. Colin P, Sirois G, Chakrabarti S. Determination of styrene in biological samples by reversed-phaseliquid chromatography. Journal of Chromatography. 1986;375 2:431-7.
74. Chen Q, Yin D, Jia Y, Schiwy S, Legradi J, Yang S, et al. Enhanced uptake of BPA in the presence ofnanoplastics can lead to neurotoxic effects in adult zebra�sh. Science of the Total Environment.2017 609:1312-21.
75. Liu X, Xu J, Zhao Y, Shi H, Huang C-H. Hydrophobic sorption behaviors of 17β-Estradiol onenvironmental microplastics. Chemosphere. 2019;226:726-35.
7�. Bittner GD, Denison MS, Yang CZ, Stoner MA, He G. Chemicals having estrogenic activity can bereleased from some bisphenol a-free, hard and clear, thermoplastic resins. Environmental Health.2014;13 1:103.
77. Loyo-Rosales JE, Rosales-Rivera GC, Lynch AM, Rice CP, Torrents A. Migration of nonylphenol fromplastic containers to water and a milk surrogate. Journal of Agricultural and Food Chemistry.2004;52 7:2016-20.
7�. Kuilman T, Michaloglou C, Mooi WJ, Peeper DS. The essence of senescence. Genes & Development.2010;24 22:2463-79.
79. McHugh D, Gil J. Senescence and aging: Causes, consequences, and therapeutic avenues. Journal ofCell Biology. 2018;217 1:65-77.
�0. Zhu Y, Armstrong JL, Tchkonia T, Kirkland JL. Cellular senescence and the senescent secretoryphenotype in age-related chronic diseases. Current Opinion in Clinical Nutrition & Metabolic Care.2014;17 4:324-8.
�1. Rodier F, Campisi J. Four faces of cellular senescence. The Journal of Cell Biology. 2011;192 4:547-56.
�2. Mizushima N, Levine B, Cuervo AM, Klionsky DJ. Autophagy �ghts disease through cellular self-digestion. Nature. 2008;451 7182:1069-75.
�3. Cuervo AM, Bergamini E, Brunk UT, Droge W, Ffrench M, Terman A. Autophagy and aging: theimportance of maintaining" clean" cells. Autophagy. 2005;1 3:131-40.
�4. White E, Lowe SW. Eating to exit: autophagy-enabled senescence revealed. Genes & Development.2009;23 7:784-7.
�5. Filomeni G, De Zio D, Cecconi F. Oxidative stress and autophagy: the clash between damage andmetabolic needs. Cell Death & Differentiation. 2015;22 3:377-88.
��. Yosef R, Pilpel N, Tokarsky-Amiel R, Biran A, Ovadya Y, Cohen S, et al. Directed elimination ofsenescent cells by inhibition of BCL-W and BCL-XL. Nature Communications. 2016;7 1:1-11.
�7. Gewirtz DA. Autophagy and senescence: a partnership in search of de�nition. Autophagy. 2013;95:808-12.
��. Xie X, Deng T, Duan J, Xie J, Yuan J, Chen M. Exposure to polystyrene microplastics causesreproductive toxicity through oxidative stress and activation of the p38 MAPK signaling pathway.Ecotoxicology and Environmental Safety. 2010;190:110133.
Page 25/37
�9. Hwang J, Choi D, Han S, Choi J, Hong J. An assessment of the toxicity of polypropylenemicroplastics in human derived cells. Science of The Total Environment. 2019;684:657-69.
90. Pati F, Adhikari B, Dhara S. Isolation and characterization of �sh scale collagen of higher thermalstability. Bioresource technology. 2010;101 10:3737-42.
91. Nakamura A, Arimoto M, Takeuchi K, Fujii T. A rapid extraction procedure of human hair proteins andidenti�cation of phosphorylated species. Biological and Pharmaceutical Bulletin. 2002;25 5:569-72.
92. Chao Y-CE, Nylander-French LA. Determination of keratin protein in a tape-stripped skin sample fromjet fuel exposed skin. Annals of occupational hygiene. 2004;48 1:65-73.
93. Jakubowski W, Bartosz G. 2, 7-dichloro�uorescin oxidation and reactive oxygen species: what does itmeasure? Cell Biology International. 2000;24 10:757-60.
94. Reilly CA, Aust SD. Measurement of lipid peroxidation. Current Protocols in Toxicology. 1999; 1:2-4.
95. Misra HP, Fridovich I. The role of superoxide anion in the autoxidation of epinephrine and a simpleassay for superoxide dismutase. Journal of Biological chemistry. 1972;247 10:3170-5.
9�. Carrillo MC, Kanai S, Nokubo M, Kitani K. (-) Deprenyl induces activities of both superoxidedismutase and catalase but not of glutathione peroxidase in the striatum of young male rats. LifeSciences. 1991;48 6:517-21.
97. Simon M, Barberet P, Delville M-H, Moretto P, Seznec H. Titanium dioxide nanoparticles inducedintracellular calcium homeostasis modi�cation in primary human keratinocytes. Towards an in vitroexplanation of titanium dioxide nanoparticles toxicity. Nanotoxicology. 2011;5 2:125-39.
9�. Chazotte B. Labeling lysosomes in live cells with neutral red. Cold Spring Harbor Protocols.2011;2011 2:pdb-prot5570.
99. Strober W. Trypan blue exclusion test of cell viability. Current Protocols in Immunology. 2015;1111:A3-B.
100. Kim HJ, Kim HJ, Lim SC, Kim SH, Kim T-Y. Induction of apoptosis and expression of cell cycleregulatory proteins in response to a phytosphingosine derivative in HaCaT human keratinocyte cells.Molecules & Cells (Springer Science & Business Media BV). 2003;16 3.
Figures
Page 26/37
Figure 1
Characterization NPs isolated from cosmetics. (a, b) Raman spectrum of NPs-1 isolated from face scrub,Insert; HR-SEM micrograph of NPs-1. (c, d) Raman spectrum of NPs-2 isolated from face scrub, Insert; HR-SEM micrograph of NPs-2. (e) Standard Raman spectrum of Polyethylene NPs, Insert; HR-SEMmicrograph of PENPs. (f) Standard Raman spectrum of Polystyrene NPs, Insert; HR-TEM micrograph ofPSNPs. (a, c, e) Raman spectra collected in the 200 to 3500 cm-1 range and (b, d, f) Raman spectracollected in the 200 to 1700 cm-1 range.
Page 27/37
Figure 2
FE-SEM micrograph of nano-plastic particles adhered to the keratin coated glass slides (1 cm2). (a, b, c)PENPs, (d, e, f) PSNPs, (g, h, i) NPs-1, and (j, k, l) NPs-2. Electron micrographs of NPs exposed butunwashed glass slides (a, d, g, j), NPs exposed glass slides subjected to single wash(b, e, h, k), and NPsexposed glass slides subjected to two washes (8- 10 dipping cycle per wash) (c, f, i, l).
Page 28/37
Figure 3
Dose-dependent cytotoxic effect of pristine and isolated NPs on the HaCaT cells at different timeintervals. Treatment time interval (a) 24 hrs, (b) 48 hrs, (c) 72 hrs, (d) 96 hrs, (e) 120 hrs and (f) 144 hrsrespectively for the PENPs, PSNPs, NPs-1, NPs-2 and H2O2. The data are presented as the means ± SEMof three independent experiments: * p ≤ 0.05, ** p≤ 0.01, *** p ≤ 0.001 signi�cantly different within thesame NPs concentration.
Page 29/37
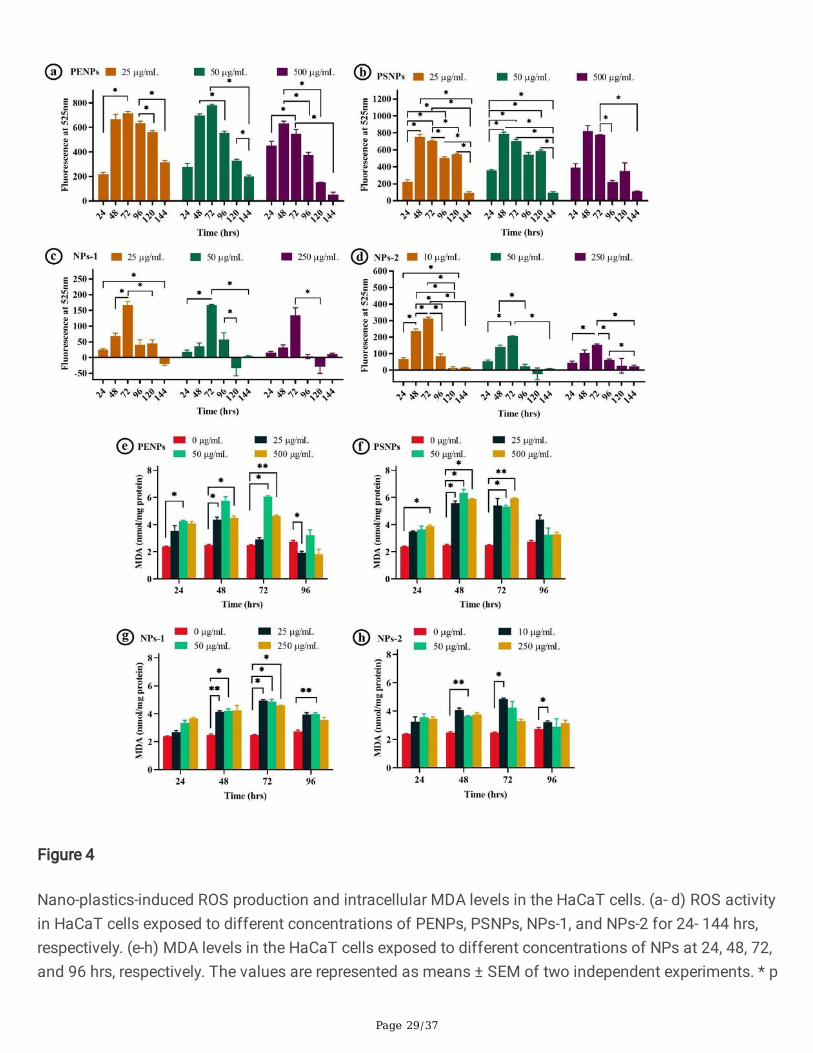
Figure 4
Nano-plastics-induced ROS production and intracellular MDA levels in the HaCaT cells. (a- d) ROS activityin HaCaT cells exposed to different concentrations of PENPs, PSNPs, NPs-1, and NPs-2 for 24- 144 hrs,respectively. (e-h) MDA levels in the HaCaT cells exposed to different concentrations of NPs at 24, 48, 72,and 96 hrs, respectively. The values are represented as means ± SEM of two independent experiments. * p
Page 30/37
< 0.05 signi�cantly different in the ROS production by the NPs concentration vs the exposure time. * p <0.05, ** p < 0.01, *** p < 0.001 signi�cantly different in the MDA levels NPs concentration vs control.
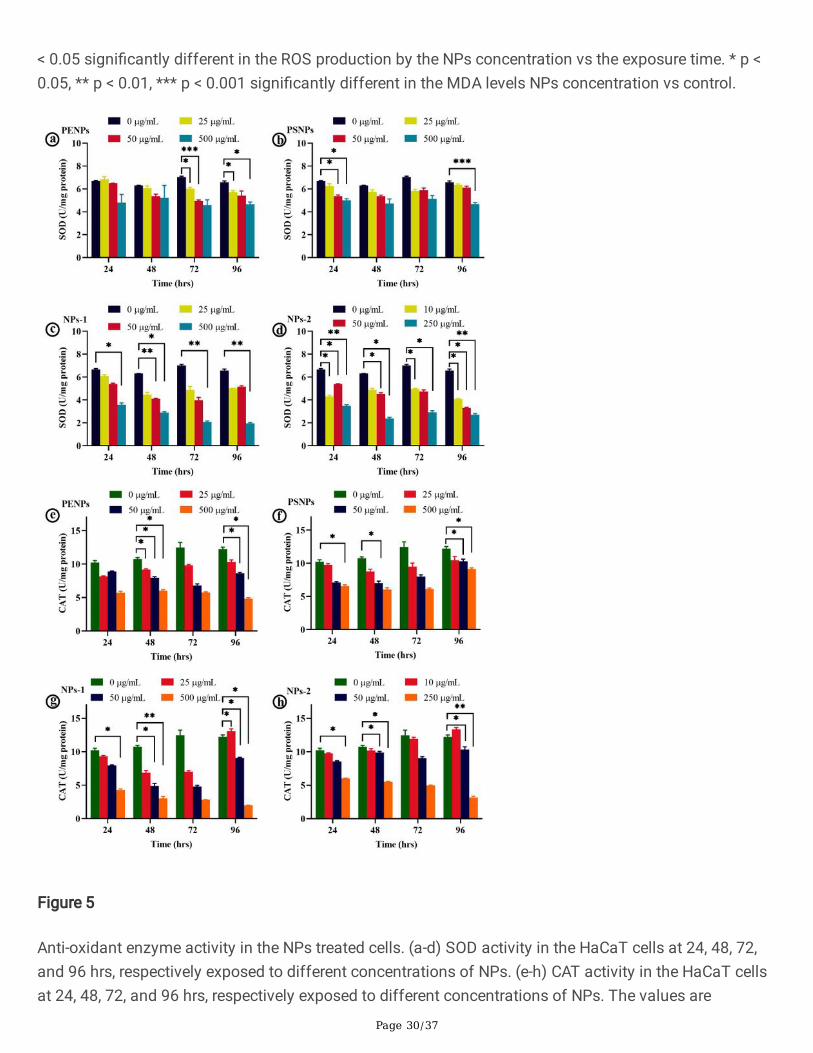
Figure 5
Anti-oxidant enzyme activity in the NPs treated cells. (a-d) SOD activity in the HaCaT cells at 24, 48, 72,and 96 hrs, respectively exposed to different concentrations of NPs. (e-h) CAT activity in the HaCaT cellsat 24, 48, 72, and 96 hrs, respectively exposed to different concentrations of NPs. The values are
Page 31/37
represented as means ± SD of two independent experiments. * p < 0.05, ** p < 0.01, *** p < 0.001signi�cantly different in the enzyme activity of NPs concentration vs control.
Figure 6
Time-dependent internalization and exclusion of FLPS particles. The phase-contrast, �uorescence, andsuperimposed images of HaCaT cells exposed to 1:500 dilution of 200 nm size FLPS particles (from thestock concentration). For �uorescent imaging, DAPI (λex: 357/44 nm; λem: 447/60 nm) and GFP (λex:
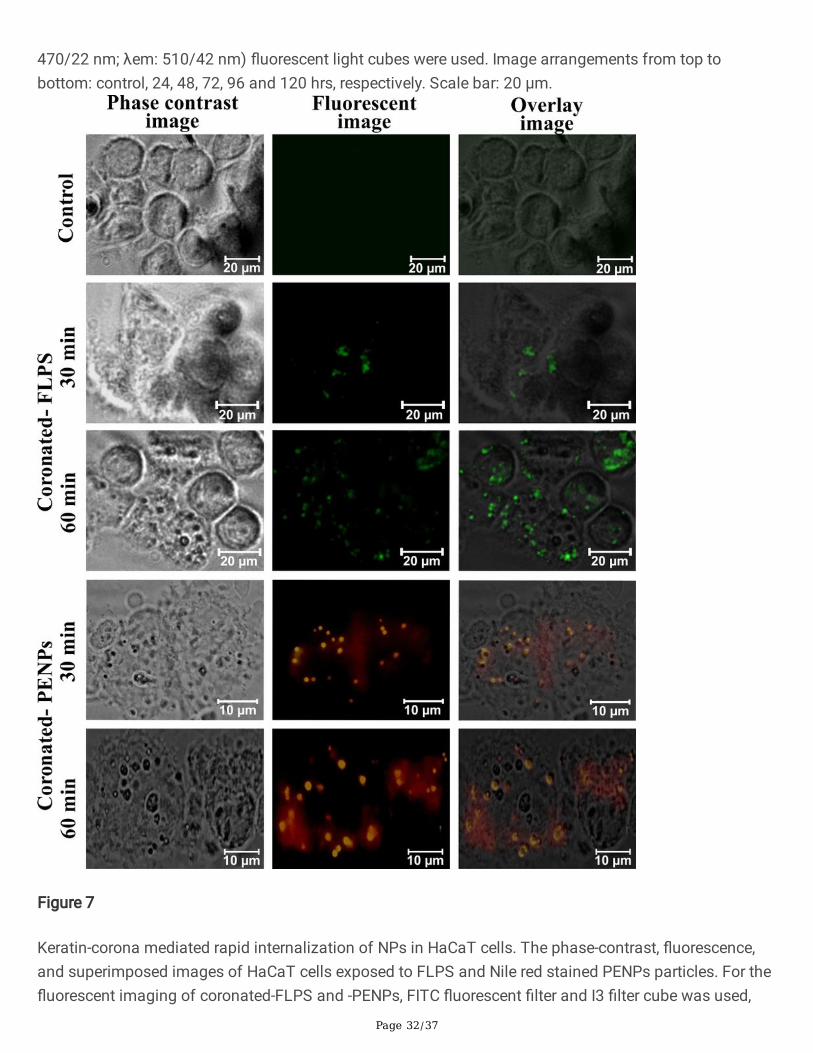
Page 32/37
470/22 nm; λem: 510/42 nm) �uorescent light cubes were used. Image arrangements from top tobottom: control, 24, 48, 72, 96 and 120 hrs, respectively. Scale bar: 20 μm.
Figure 7
Keratin-corona mediated rapid internalization of NPs in HaCaT cells. The phase-contrast, �uorescence,and superimposed images of HaCaT cells exposed to FLPS and Nile red stained PENPs particles. For the�uorescent imaging of coronated-FLPS and -PENPs, FITC �uorescent �lter and I3 �lter cube was used,
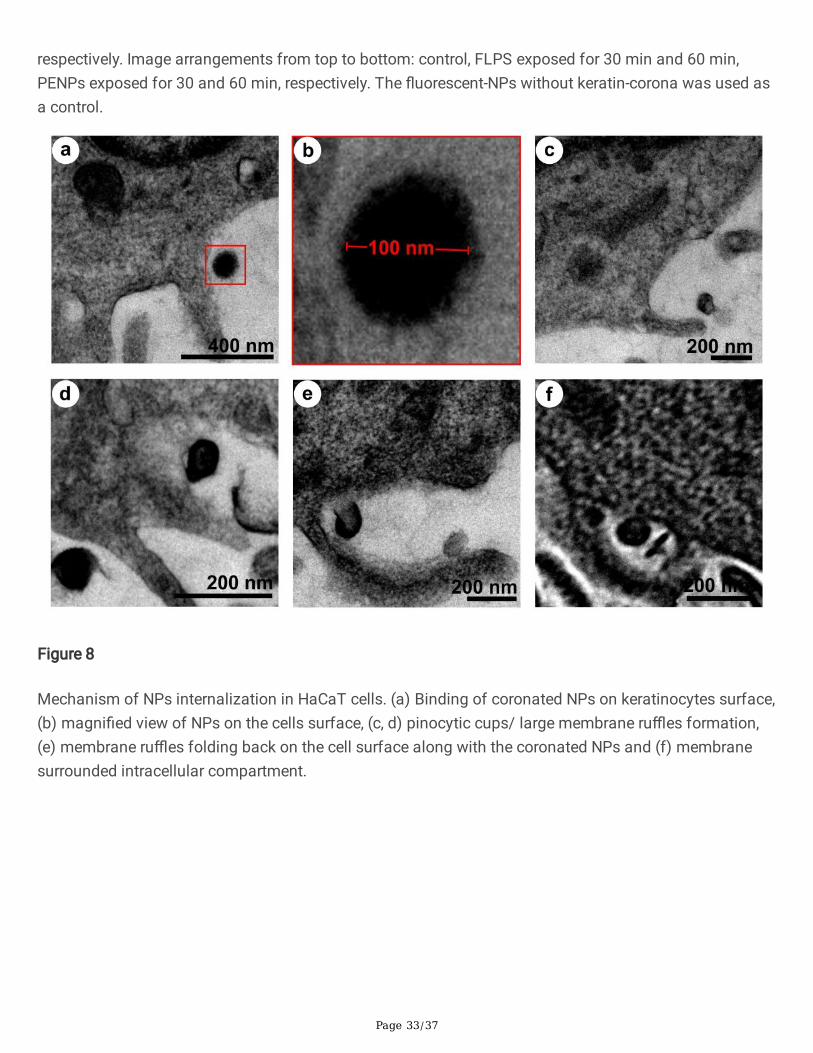
Page 33/37
respectively. Image arrangements from top to bottom: control, FLPS exposed for 30 min and 60 min,PENPs exposed for 30 and 60 min, respectively. The �uorescent-NPs without keratin-corona was used asa control.
Figure 8
Mechanism of NPs internalization in HaCaT cells. (a) Binding of coronated NPs on keratinocytes surface,(b) magni�ed view of NPs on the cells surface, (c, d) pinocytic cups/ large membrane ru�es formation,(e) membrane ru�es folding back on the cell surface along with the coronated NPs and (f) membranesurrounded intracellular compartment.
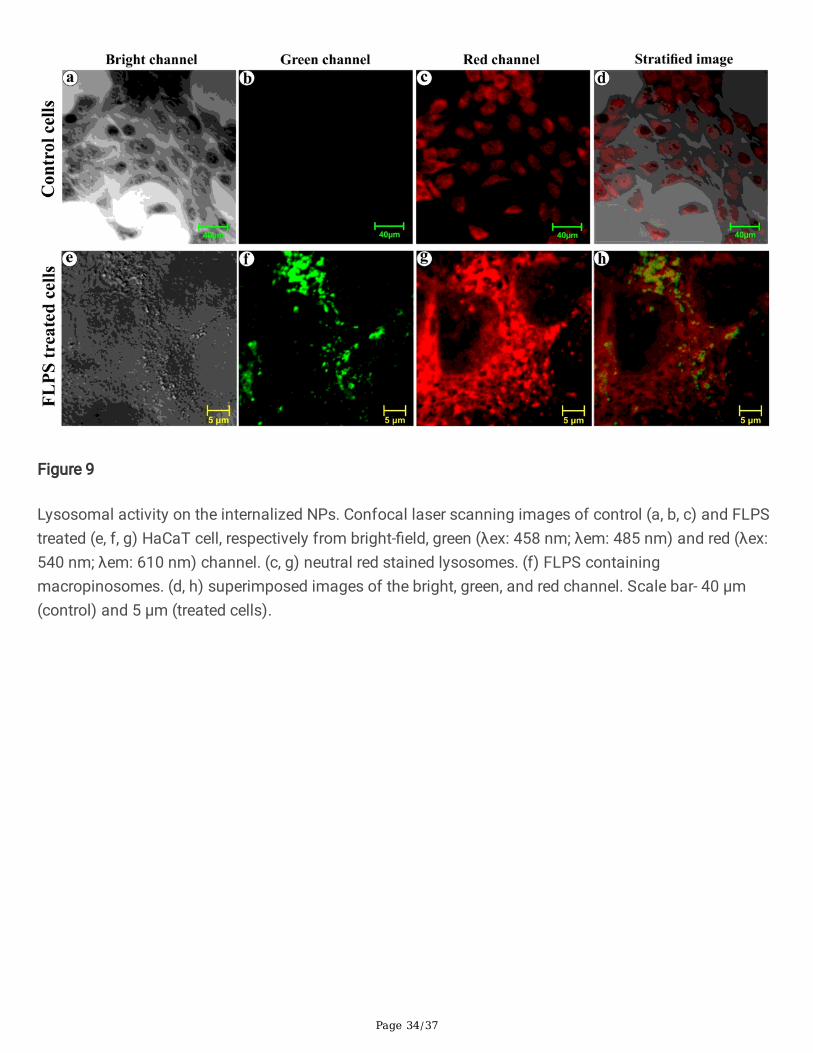
Page 34/37
Figure 9
Lysosomal activity on the internalized NPs. Confocal laser scanning images of control (a, b, c) and FLPStreated (e, f, g) HaCaT cell, respectively from bright-�eld, green (λex: 458 nm; λem: 485 nm) and red (λex:540 nm; λem: 610 nm) channel. (c, g) neutral red stained lysosomes. (f) FLPS containingmacropinosomes. (d, h) superimposed images of the bright, green, and red channel. Scale bar- 40 µm(control) and 5 µm (treated cells).
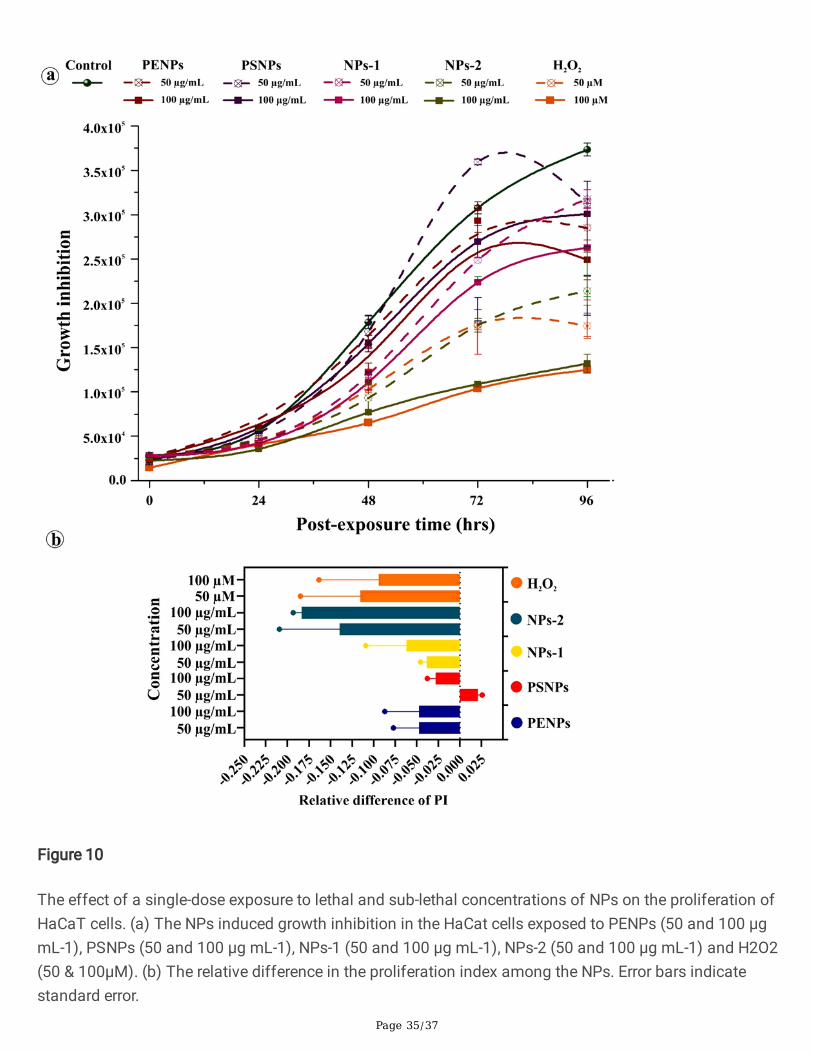
Page 35/37
Figure 10
The effect of a single-dose exposure to lethal and sub-lethal concentrations of NPs on the proliferation ofHaCaT cells. (a) The NPs induced growth inhibition in the HaCat cells exposed to PENPs (50 and 100 µgmL-1), PSNPs (50 and 100 µg mL-1), NPs-1 (50 and 100 µg mL-1), NPs-2 (50 and 100 µg mL-1) and H2O2(50 & 100µM). (b) The relative difference in the proliferation index among the NPs. Error bars indicatestandard error.
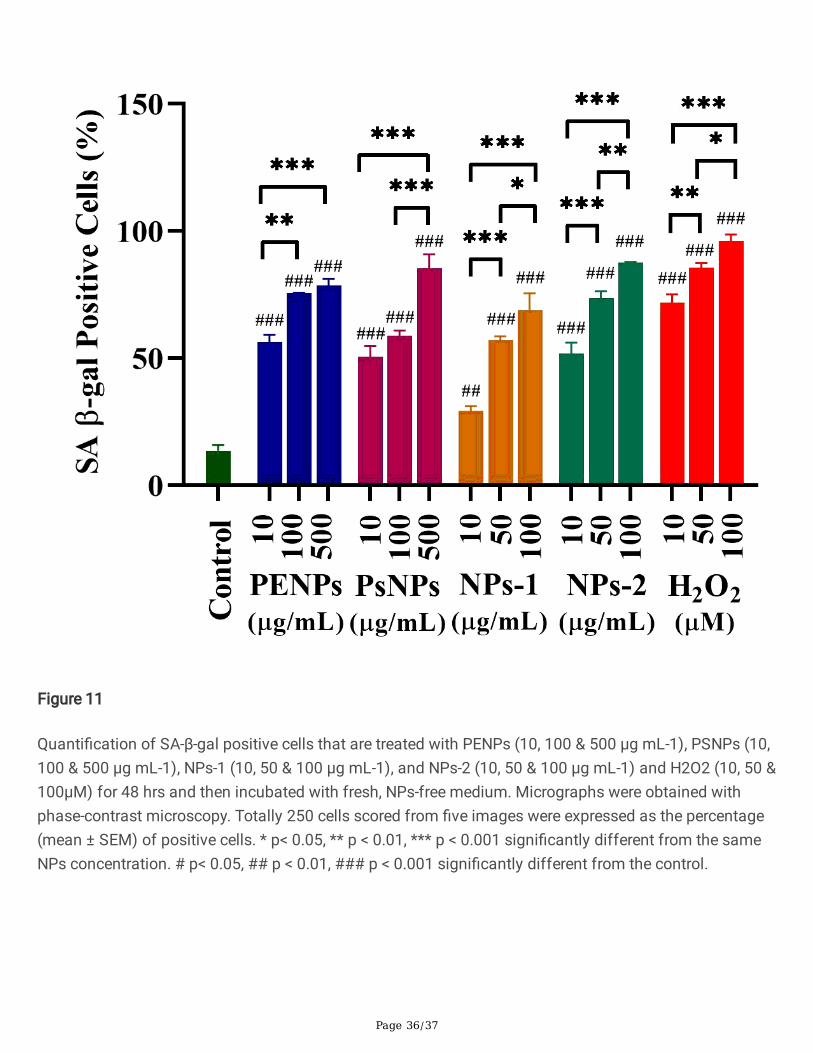
Page 36/37
Figure 11
Quanti�cation of SA-β-gal positive cells that are treated with PENPs (10, 100 & 500 µg mL-1), PSNPs (10,100 & 500 µg mL-1), NPs-1 (10, 50 & 100 µg mL-1), and NPs-2 (10, 50 & 100 µg mL-1) and H2O2 (10, 50 &100µM) for 48 hrs and then incubated with fresh, NPs-free medium. Micrographs were obtained withphase-contrast microscopy. Totally 250 cells scored from �ve images were expressed as the percentage(mean ± SEM) of positive cells. * p< 0.05, ** p < 0.01, *** p < 0.001 signi�cantly different from the sameNPs concentration. # p< 0.05, ## p < 0.01, ### p < 0.001 signi�cantly different from the control.
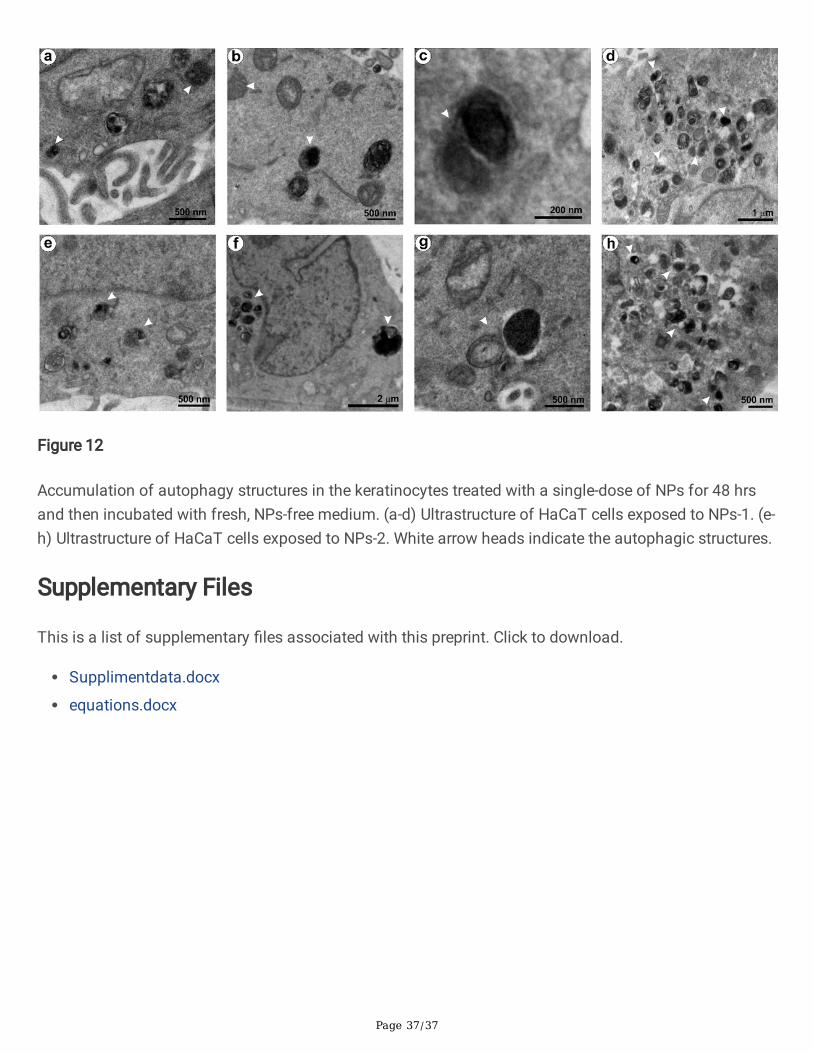
Page 37/37
Figure 12
Accumulation of autophagy structures in the keratinocytes treated with a single-dose of NPs for 48 hrsand then incubated with fresh, NPs-free medium. (a-d) Ultrastructure of HaCaT cells exposed to NPs-1. (e-h) Ultrastructure of HaCaT cells exposed to NPs-2. White arrow heads indicate the autophagic structures.
Supplementary Files
This is a list of supplementary �les associated with this preprint. Click to download.
Supplimentdata.docx
equations.docx