Embed Size (px)
Citation preview
INTERNAL GEAR STRAINS AND LOAD SHARING IN PLANETARY TRANSMISSIONS – MODEL AND EXPERIMENTS
Avinash Singh Ahmet Kahraman Haris Ligata Advanced Power Transfer Department of Mechanical Engineering Department of Mechanical Engineering GM Powertrain The Ohio State University The Ohio State University General Motors Corporation 30240 Oak Creek Drive 201 W. 19th Avenue 201 W. 19th Avenue Wixom, MI 48393 Columbus, OH 43210 Columbus, OH 43210 [email protected] [email protected] [email protected]
Proceedings of the ASME 2007 International Design Engineering Technical Conferences & Computers and Information in Engineering Conference
IDETC/CIE 2007 September 4-7, 2007, Las Vegas, Nevada, USA
DETC2007-35047
ABSTRACT
This paper presents results of a comprehensive experimental and theoretical study to determine the influence of certain key factors in planetary transmissions on gear stresses and planetary load sharing. A series of tests are conducted on a family of planetary gear sets, and strains are recorded at various locations on the outer diameter and gear tooth fillet of the ring gear. Pinion position errors are introduced as a representative key manufacturing tolerance, and the resultant changes in the planetary behavior are observed. The experimental data is compared to the predictions of a state-of-the-art multi-body contact analysis model - ‘Gear System Analysis Modules’ (GSAM). This model is capable of including the influences of a number of system-level variables and quantifying their impact on gear strains. The model predictions are shown to compare well with the measured strain at the ring gear outer diameter and tooth fillet. GSAM predictions of planet load sharing are then used to quantify the influence of pin hole position errors on the 3, 4, 5, and 6 planet test gear sets. These predictions also agree well with the planet load sharing experiments presented in a companion paper [20].
INTRODUCTION
Gear system durability depends upon a number of design, manufacturing, and assembly related variations. This is especially true in planetary gears, where there are a number of system-level variables that have a significant impact on gear stresses and durability. These
1
influences can be classified as those that influence the distribution of load throughout the system and those that influence the response of the system to the distributed load. Often times, there are interactions between the system response to the distributed load and the load distribution. Some examples of such interactions are the deflection of the carrier under load influencing the tooth load distribution (and vice versa), and the elastic deformation of the needle bearing under distributed load on the pinion influencing the pinion load distribution [1,2]. System level models are needed to account for these interactions.
In planetary transmissions, one of the important influences is that of pinion position errors on the planetary load sharing. Under ideal conditions, there is perfect load sharing among the planets. The input torque to an n planet planetary transmission is split into n parallel paths, and each sun-pinion-ring path carries 1/n of the total torque. However, in actual transmissions, in the presence of pinion position errors, there is unequal load sharing between the parallel paths. This load sharing behavior of planetary gears has significant implications for transmission design and torque ratings.
In order to predict realistic stresses under operating conditions, system level models are essential. However, while single mesh models of external gears are abundant [3-6], there are relatively few models of planetary systems. These models of planetary gears vary in the level of detail and complexity [7-10], but most of them only model a portion of the ring gear and apply a point load at the pinion position. These models are good
Copyright © 2007 by ASME and General Motors
tools for qualitative assessments, but cannot predict actual strain levels, nor account for the interactions between body deformations, load sharing among planets, and load distributions across the facewidth. There have been a few attempts to model all the meshes in a planetary transmission [11,12], but these have been limited to two-dimensional analyses. They are applicable to spur gears (without load distribution effects) and cannot be applied to helical planetary gears.
The GSAM software was developed to address this need of a complete system model. The GSAM model includes all the gear bodies (sun, pinions, ring) and support structures (bearings, carrier, splines, housing/ shell). In addition, most manufacturing tolerances can be modeled and their influence on system stresses can be quantified. Design decisions have been made based on GSAM predictions of system hoop and bending strains (stresses), deflections, and planetary load sharing.
There are, however, very little published experimental strain data [13-16] available in literature. Also, often times, they are limited to very specific gear structures [17]. Experimental planetary load sharing data are also equally scarce, and mostly limited to 3 or 4 planet [18,19] systems.
The goal of this research is to generate a comprehensive set of experimental data that can be used to validate model predictions. Ring gear strains and planetary load sharing are chosen as the metrics for comparison. An extensive study has been conducted to investigate the impact of manufacturing errors on ring gear strains and individual planet loads of an n-planet planetary gear set (n=3 to 6). The influences of carrier pin hole position errors on planetary load sharing have been quantified for various errors and torque values. The load sharing results of this experimental study are presented in reference [20].
In this paper, we will examine the ring gear strain data in detail. Strain data from various locations on the outer diameter of the ring gear will be compared, and the variations will be explained. Gear tooth fillet strain data from the tensile and compressive sides will also be examined. The experimental strain data will be qualitatively and quantitatively compared to GSAM predictions. GSAM analyses of the test gear set will be performed and the load sharing results for 3 to 6 planet systems will be documented. The GSAM predicted load sharing patterns will be compared to the experimental data.
EXPERIMENTAL SETUP
The test gears have been described in detail in reference [20]. A brief summary is provided here for the sake of completeness. A helical planetary gear set of module 1.81 mm and outer diameter 264 mm was adapted as the test planetary gear set. This gear set was chosen because it is sufficiently large for strain gages to
2
Table 1 Parameters of the test gear set Parameter Sun Planet Ring Number of teeth 73 26 125 Normal module, (mm) 1.81 1.81 1.81 Pressure angle, (deg.) 23.04 23.04 Helix angle, (deg.) 13.12 13.12 Center distance, (mm) 92.12 Active face width, (mm) 25 25
be mounted in the root fillet of the stationary ring gear near the critical stress locations. The basic design parameters of the test gear set are defined in Table 1.
Several changes were made to the production gear set to adapt it for test purposes. The production ring gear has 77 OD splines whereas the test ring gear has 11 OD splines. The remaining splines were removed via wire EDM. The clearance between the pinion tip and the ring gear fillet was increased by reducing the major diameter of the pinions. This was done to ensure that there is no interference between the pinion tip and the strain gages on the ring gear, even under tight mesh conditions. All of the gears were ground to achieve very accurate profiles while minimizing errors associated with planet tooth thickness and planet pitch line run-out.
The production version of the test gear set uses a 6-planet carrier. Since the number of planets is a variable in this study, a family of planetary carriers was designed and procured to form 3 to 6-planet gear sets. The same gears were used in all the carrier builds.
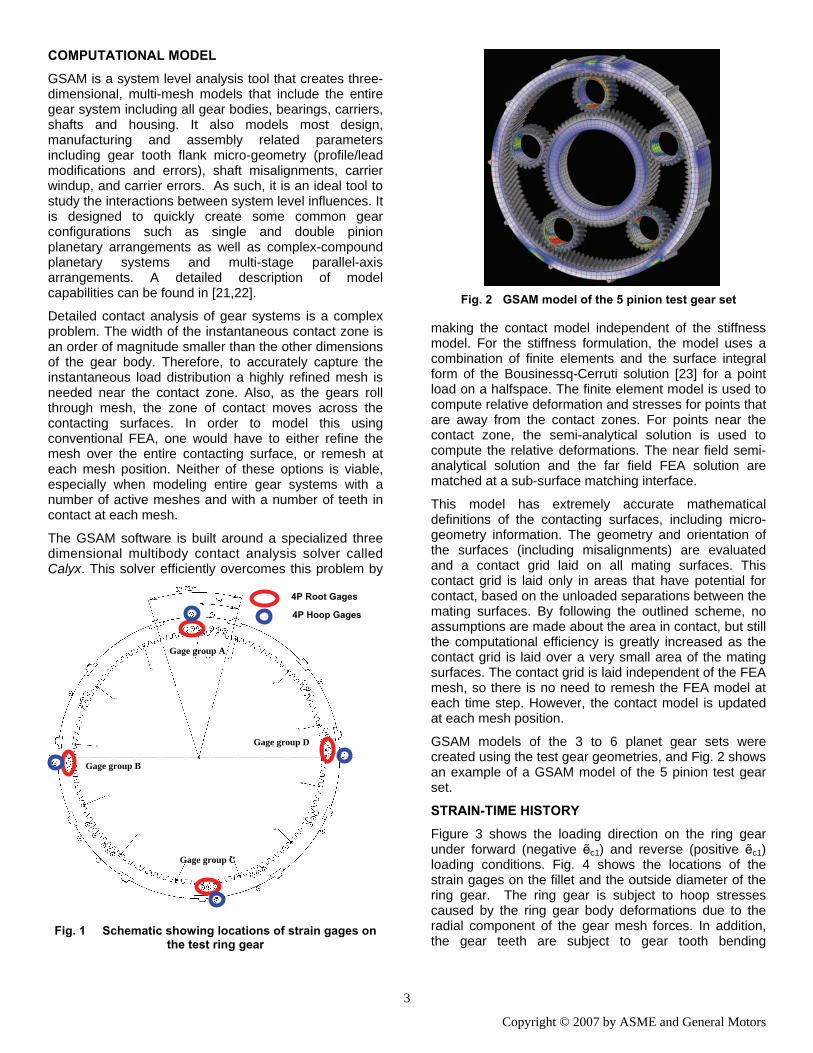
The test ring gear was strain gaged according to the schematic shown in Fig. 1. The number and location of gages is such that strain data from each planet path can be simultaneously recorded. This is true for 3, 4, 5 and 6 planet systems. Also, as seen in Fig. 1, there are gages on three successive teeth, so there are three strain signals from each planet path. In all, there are 46 strain gages – 35 gages in the gear tooth fillet and 11 gages on the outer diameter of the ring gear. The strain gages used for the 4-planet system are highlighted in Fig. 1.
Carriers with 3 pinhole position error levels were fabricated – 0 μm, 35 μm, and 70 μm. They were tested under forward and reverse loading conditions. Under forward loading, the direction of torque and rotation of the sun gear was in the CCW direction. In this case, the pinhole position error on the carrier acts in the negative sense, i.e. the planet with the error lags all the other planets. On the other hand, under reverse loading, the direction of torque and rotation of the sun gear are in the CW direction and the pinhole position errors act in the positive sense, i.e. the planet with the error leads all the other planets. Using both loading directions, test were carried out with effective pinhole position errors of ẽc1 = -70 μm, -35 μm, ± 0 μm, +35 μm, and +70 μm.
Copyright © 2007 by ASME and General Motors
COMPUTATIONAL MODEL
GSAM is a system level analysis tool that creates three-dimensional, multi-mesh models that include the entire gear system including all gear bodies, bearings, carriers, shafts and housing. It also models most design, manufacturing and assembly related parameters including gear tooth flank micro-geometry (profile/lead modifications and errors), shaft misalignments, carrier windup, and carrier errors. As such, it is an ideal tool to study the interactions between system level influences. It is designed to quickly create some common gear configurations such as single and double pinion planetary arrangements as well as complex-compound planetary systems and multi-stage parallel-axis arrangements. A detailed description of model capabilities can be found in [21,22].
Detailed contact analysis of gear systems is a complex problem. The width of the instantaneous contact zone is an order of magnitude smaller than the other dimensions of the gear body. Therefore, to accurately capture the instantaneous load distribution a highly refined mesh is needed near the contact zone. Also, as the gears roll through mesh, the zone of contact moves across the contacting surfaces. In order to model this using conventional FEA, one would have to either refine the mesh over the entire contacting surface, or remesh at each mesh position. Neither of these options is viable, especially when modeling entire gear systems with a number of active meshes and with a number of teeth in contact at each mesh.
The GSAM software is built around a specialized three dimensional multibody contact analysis solver called Calyx. This solver efficiently overcomes this problem by
Fig. 1 Schematic showing locations of strain gages on
the test ring gear
4P Root Gages
4P Hoop Gages
Gage group A
Gage group C
Gage group B
Gage group D
3
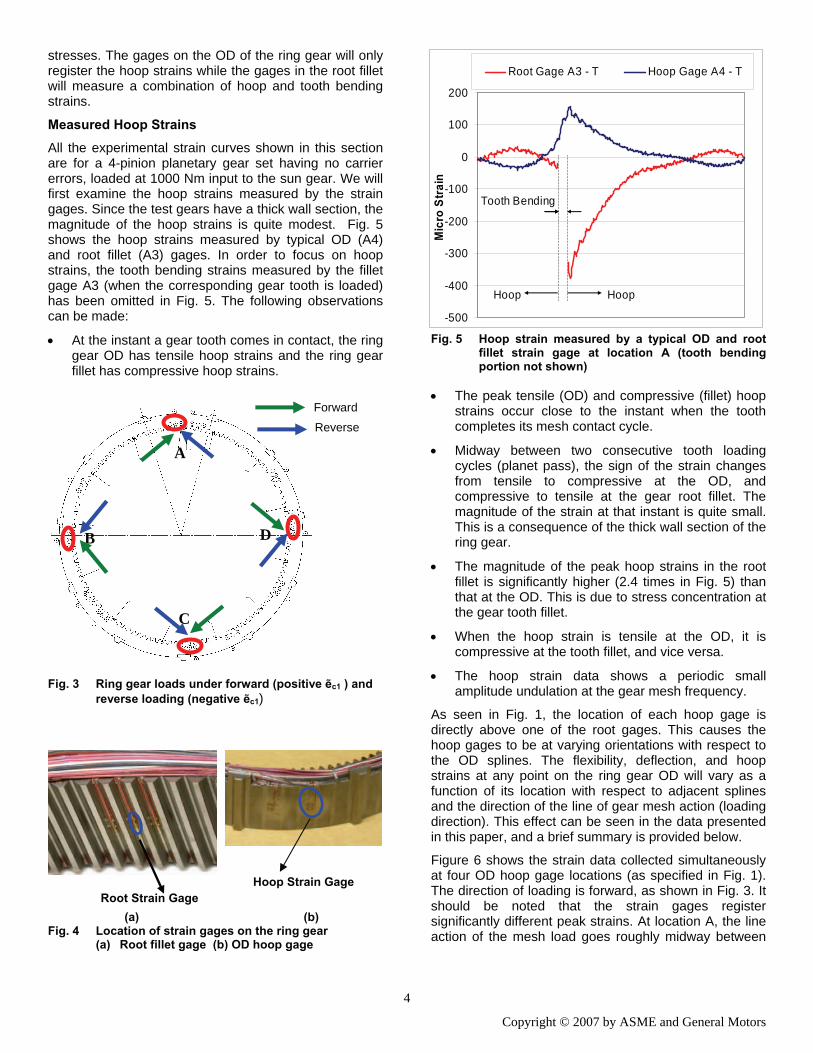
Fig. 2 GSAM model of the 5 pinion test gear set
making the contact model independent of the stiffness model. For the stiffness formulation, the model uses a combination of finite elements and the surface integral form of the Bousinessq-Cerruti solution [23] for a point load on a halfspace. The finite element model is used to compute relative deformation and stresses for points that are away from the contact zones. For points near the contact zone, the semi-analytical solution is used to compute the relative deformations. The near field semi-analytical solution and the far field FEA solution are matched at a sub-surface matching interface.
This model has extremely accurate mathematical definitions of the contacting surfaces, including micro-geometry information. The geometry and orientation of the surfaces (including misalignments) are evaluated and a contact grid laid on all mating surfaces. This contact grid is laid only in areas that have potential for contact, based on the unloaded separations between the mating surfaces. By following the outlined scheme, no assumptions are made about the area in contact, but still the computational efficiency is greatly increased as the contact grid is laid over a very small area of the mating surfaces. The contact grid is laid independent of the FEA mesh, so there is no need to remesh the FEA model at each time step. However, the contact model is updated at each mesh position.
GSAM models of the 3 to 6 planet gear sets were created using the test gear geometries, and Fig. 2 shows an example of a GSAM model of the 5 pinion test gear set.
STRAIN-TIME HISTORY
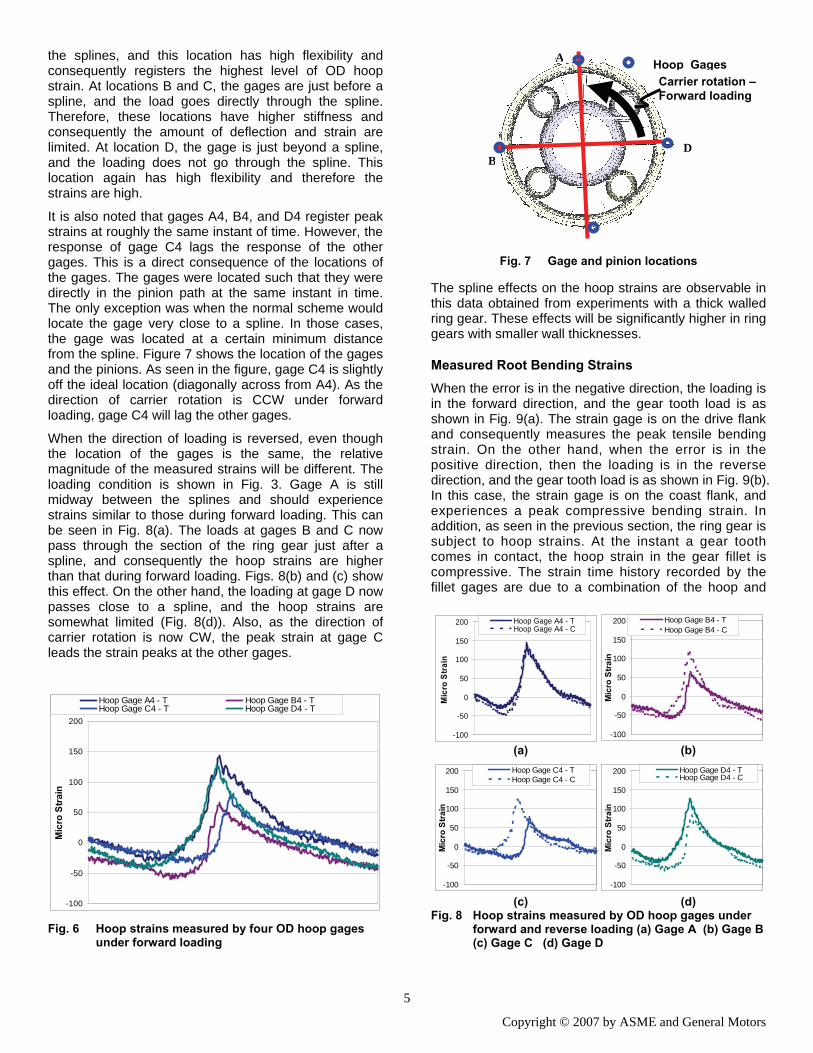
Figure 3 shows the loading direction on the ring gear under forward (negative ẽc1) and reverse (positive ẽc1) loading conditions. Fig. 4 shows the locations of the strain gages on the fillet and the outside diameter of the ring gear. The ring gear is subject to hoop stresses caused by the ring gear body deformations due to the radial component of the gear mesh forces. In addition, the gear teeth are subject to gear tooth bending
Copyright © 2007 by ASME and General Motors
stresses. The gages on the OD of the ring gear will only register the hoop strains while the gages in the root fillet will measure a combination of hoop and tooth bending strains.
Measured Hoop Strains
All the experimental strain curves shown in this section are for a 4-pinion planetary gear set having no carrier errors, loaded at 1000 Nm input to the sun gear. We will first examine the hoop strains measured by the strain gages. Since the test gears have a thick wall section, the magnitude of the hoop strains is quite modest. Fig. 5 shows the hoop strains measured by typical OD (A4) and root fillet (A3) gages. In order to focus on hoop strains, the tooth bending strains measured by the fillet gage A3 (when the corresponding gear tooth is loaded) has been omitted in Fig. 5. The following observations can be made:
• At the instant a gear tooth comes in contact, the ring gear OD has tensile hoop strains and the ring gear fillet has compressive hoop strains.
Fig. 3 Ring gear loads under forward (positive ẽc1 ) and
reverse loading (negative ẽc1)
(a) (b) Fig. 4 Location of strain gages on the ring gear
(a) Root fillet gage (b) OD hoop gage
B
A
C
D
Forward
Reverse
Root Strain Gage Hoop Strain Gage
4
-500
-400
-300
-200
-100
0
100
200
Mic
ro S
train
Root Gage A3 - T Hoop Gage A4 - T
Tooth Bending
Hoop Hoop
Fig. 5 Hoop strain measured by a typical OD and root fillet strain gage at location A (tooth bending portion not shown)
• The peak tensile (OD) and compressive (fillet) hoop
strains occur close to the instant when the tooth completes its mesh contact cycle.
• Midway between two consecutive tooth loading cycles (planet pass), the sign of the strain changes from tensile to compressive at the OD, and compressive to tensile at the gear root fillet. The magnitude of the strain at that instant is quite small. This is a consequence of the thick wall section of the ring gear.
• The magnitude of the peak hoop strains in the root fillet is significantly higher (2.4 times in Fig. 5) than that at the OD. This is due to stress concentration at the gear tooth fillet.
• When the hoop strain is tensile at the OD, it is compressive at the tooth fillet, and vice versa.
• The hoop strain data shows a periodic small amplitude undulation at the gear mesh frequency.
As seen in Fig. 1, the location of each hoop gage is directly above one of the root gages. This causes the hoop gages to be at varying orientations with respect to the OD splines. The flexibility, deflection, and hoop strains at any point on the ring gear OD will vary as a function of its location with respect to adjacent splines and the direction of the line of gear mesh action (loading direction). This effect can be seen in the data presented in this paper, and a brief summary is provided below.
Figure 6 shows the strain data collected simultaneously at four OD hoop gage locations (as specified in Fig. 1). The direction of loading is forward, as shown in Fig. 3. It should be noted that the strain gages register significantly different peak strains. At location A, the line action of the mesh load goes roughly midway between
Copyright © 2007 by ASME and General Motors
the splines, and this location has high flexibility and consequently registers the highest level of OD hoop strain. At locations B and C, the gages are just before a spline, and the load goes directly through the spline. Therefore, these locations have higher stiffness and consequently the amount of deflection and strain are limited. At location D, the gage is just beyond a spline, and the loading does not go through the spline. This location again has high flexibility and therefore the strains are high.
It is also noted that gages A4, B4, and D4 register peak strains at roughly the same instant of time. However, the response of gage C4 lags the response of the other gages. This is a direct consequence of the locations of the gages. The gages were located such that they were directly in the pinion path at the same instant in time. The only exception was when the normal scheme would locate the gage very close to a spline. In those cases, the gage was located at a certain minimum distance from the spline. Figure 7 shows the location of the gages and the pinions. As seen in the figure, gage C4 is slightly off the ideal location (diagonally across from A4). As the direction of carrier rotation is CCW under forward loading, gage C4 will lag the other gages.
When the direction of loading is reversed, even though the location of the gages is the same, the relative magnitude of the measured strains will be different. The loading condition is shown in Fig. 3. Gage A is still midway between the splines and should experience strains similar to those during forward loading. This can be seen in Fig. 8(a). The loads at gages B and C now pass through the section of the ring gear just after a spline, and consequently the hoop strains are higher than that during forward loading. Figs. 8(b) and (c) show this effect. On the other hand, the loading at gage D now passes close to a spline, and the hoop strains are somewhat limited (Fig. 8(d)). Also, as the direction of carrier rotation is now CW, the peak strain at gage C leads the strain peaks at the other gages.
-100
-50
0
50
100
150
200
Mic
ro S
train
Hoop Gage A4 - T Hoop Gage B4 - THoop Gage C4 - T Hoop Gage D4 - T
Fig. 6 Hoop strains measured by four OD hoop gages
under forward loading
5
C
DB
Hoop GagesA
Carrier rotation –Forward loading
Fig. 7 Gage and pinion locations The spline effects on the hoop strains are observable in this data obtained from experiments with a thick walled ring gear. These effects will be significantly higher in ring gears with smaller wall thicknesses.
Measured Root Bending Strains
When the error is in the negative direction, the loading is in the forward direction, and the gear tooth load is as shown in Fig. 9(a). The strain gage is on the drive flank and consequently measures the peak tensile bending strain. On the other hand, when the error is in the positive direction, then the loading is in the reverse direction, and the gear tooth load is as shown in Fig. 9(b). In this case, the strain gage is on the coast flank, and experiences a peak compressive bending strain. In addition, as seen in the previous section, the ring gear is subject to hoop strains. At the instant a gear tooth comes in contact, the hoop strain in the gear fillet is compressive. The strain time history recorded by the fillet gages are due to a combination of the hoop and
-100
-50
0
50
100
150
200M
icro
Stra
inHoop Gage B4 - THoop Gage B4 - C
-100
-50
0
50
100
150
200
Mic
ro S
train
Hoop Gage A4 - THoop Gage A4 - C
(a) (b)
-100
-50
0
50
100
150
200
Mic
ro S
train
Hoop Gage C4 - THoop Gage C4 - C
-100
-50
0
50
100
150
200
Mic
ro S
train
Hoop Gage D4 - THoop Gage D4 - C
(c) (d) Fig. 8 Hoop strains measured by OD hoop gages under
forward and reverse loading (a) Gage A (b) Gage B (c) Gage C (d) Gage D
Copyright © 2007 by ASME and General Motors
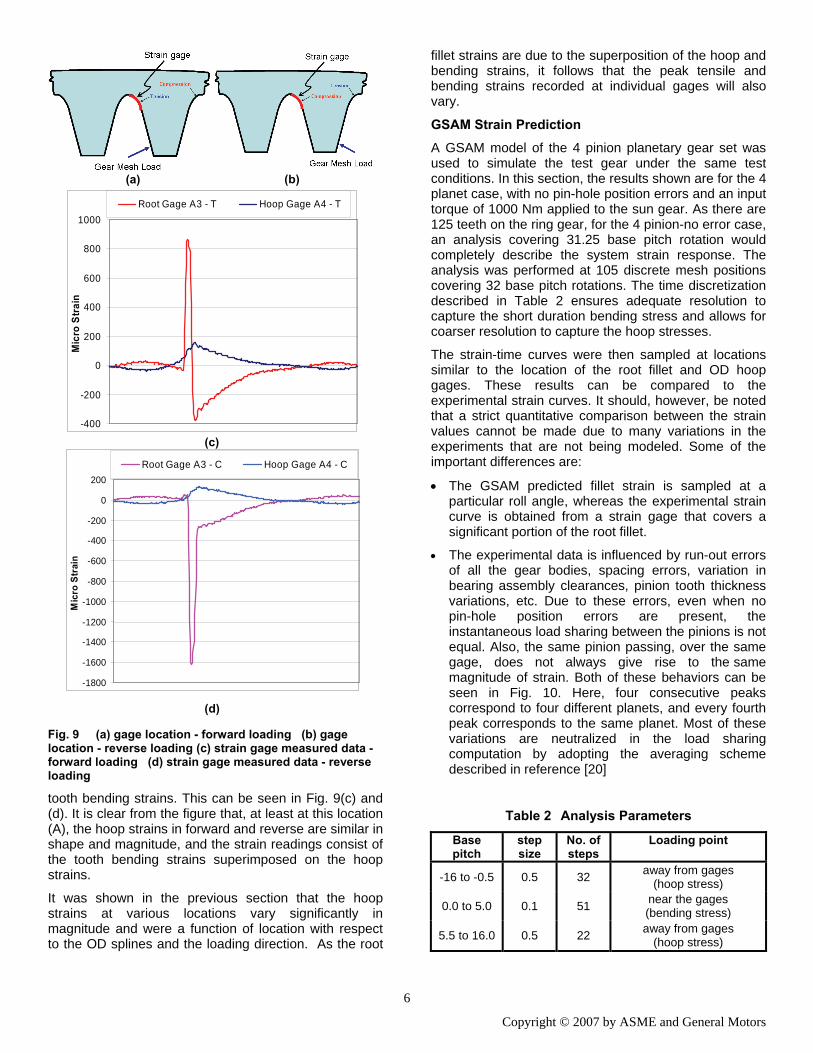
Fig. 9 (a) gage location - forward loading (b) gage location - reverse loading (c) strain gage measured data - forward loading (d) strain gage measured data - reverse loading
tooth bending strains. This can be seen in Fig. 9(c) and (d). It is clear from the figure that, at least at this location (A), the hoop strains in forward and reverse are similar in shape and magnitude, and the strain readings consist of the tooth bending strains superimposed on the hoop strains.
It was shown in the previous section that the hoop strains at various locations vary significantly in magnitude and were a function of location with respect to the OD splines and the loading direction. As the root
(b) (a)
(d)
(c) -400
-200
0
200
400
600
800
1000
Mic
ro S
train
Root Gage A3 - T Hoop Gage A4 - T
-1800
-1600
-1400
-1200
-1000
-800
-600
-400
-200
0
200
Mic
ro S
trai
n
Root Gage A3 - C Hoop Gage A4 - C
6
fillet strains are due to the superposition of the hoop and bending strains, it follows that the peak tensile and bending strains recorded at individual gages will also vary.
GSAM Strain Prediction
A GSAM model of the 4 pinion planetary gear set was used to simulate the test gear under the same test conditions. In this section, the results shown are for the 4 planet case, with no pin-hole position errors and an input torque of 1000 Nm applied to the sun gear. As there are 125 teeth on the ring gear, for the 4 pinion-no error case, an analysis covering 31.25 base pitch rotation would completely describe the system strain response. The analysis was performed at 105 discrete mesh positions covering 32 base pitch rotations. The time discretization described in Table 2 ensures adequate resolution to capture the short duration bending stress and allows for coarser resolution to capture the hoop stresses.
The strain-time curves were then sampled at locations similar to the location of the root fillet and OD hoop gages. These results can be compared to the experimental strain curves. It should, however, be noted that a strict quantitative comparison between the strain values cannot be made due to many variations in the experiments that are not being modeled. Some of the important differences are:
• The GSAM predicted fillet strain is sampled at a particular roll angle, whereas the experimental strain curve is obtained from a strain gage that covers a significant portion of the root fillet.
• The experimental data is influenced by run-out errors of all the gear bodies, spacing errors, variation in bearing assembly clearances, pinion tooth thickness variations, etc. Due to these errors, even when no pin-hole position errors are present, the instantaneous load sharing between the pinions is not equal. Also, the same pinion passing, over the same gage, does not always give rise to the same magnitude of strain. Both of these behaviors can be seen in Fig. 10. Here, four consecutive peaks correspond to four different planets, and every fourth peak corresponds to the same planet. Most of these variations are neutralized in the load sharing computation by adopting the averaging scheme described in reference [20]
Table 2 Analysis Parameters
Base pitch
step size
No. of steps
Loading point
-16 to -0.5 0.5 32 away from gages (hoop stress)
0.0 to 5.0 0.1 51 near the gages (bending stress)
5.5 to 16.0 0.5 22 away from gages (hoop stress)
Copyright © 2007 by ASME and General Motors
(a)
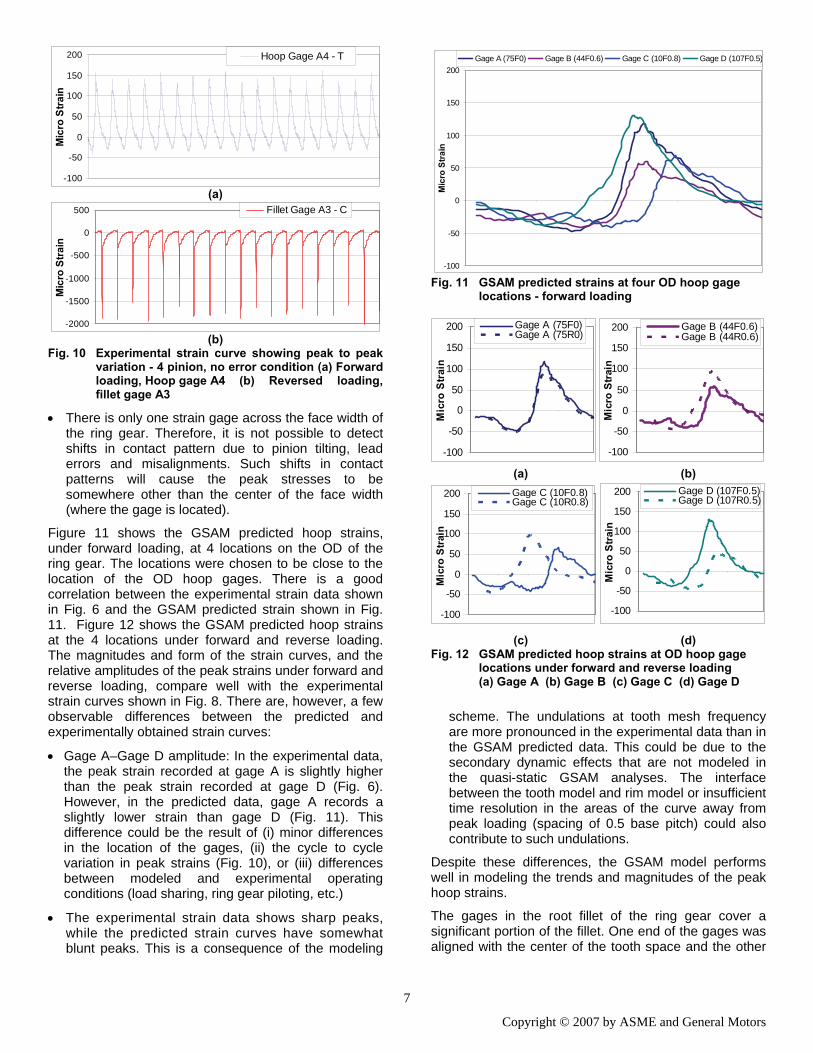
(b) Fig. 10 Experimental strain curve showing peak to peak
variation - 4 pinion, no error condition (a) Forward loading, Hoop gage A4 (b) Reversed loading, fillet gage A3
• There is only one strain gage across the face width of the ring gear. Therefore, it is not possible to detect shifts in contact pattern due to pinion tilting, lead errors and misalignments. Such shifts in contact patterns will cause the peak stresses to be somewhere other than the center of the face width (where the gage is located).
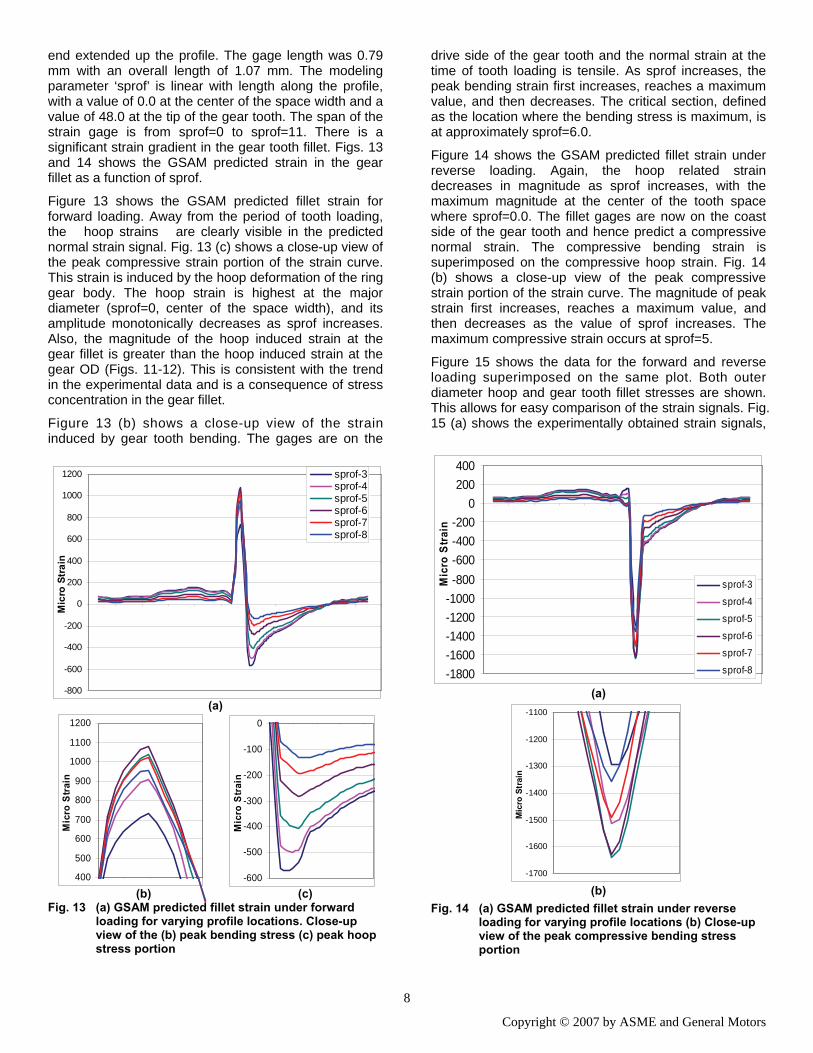
Figure 11 shows the GSAM predicted hoop strains, under forward loading, at 4 locations on the OD of the ring gear. The locations were chosen to be close to the location of the OD hoop gages. There is a good correlation between the experimental strain data shown in Fig. 6 and the GSAM predicted strain shown in Fig. 11. Figure 12 shows the GSAM predicted hoop strains at the 4 locations under forward and reverse loading. The magnitudes and form of the strain curves, and the relative amplitudes of the peak strains under forward and reverse loading, compare well with the experimental strain curves shown in Fig. 8. There are, however, a few observable differences between the predicted and experimentally obtained strain curves:
• Gage A–Gage D amplitude: In the experimental data, the peak strain recorded at gage A is slightly higher than the peak strain recorded at gage D (Fig. 6). However, in the predicted data, gage A records a slightly lower strain than gage D (Fig. 11). This difference could be the result of (i) minor differences in the location of the gages, (ii) the cycle to cycle variation in peak strains (Fig. 10), or (iii) differences between modeled and experimental operating conditions (load sharing, ring gear piloting, etc.)
• The experimental strain data shows sharp peaks, while the predicted strain curves have somewhat blunt peaks. This is a consequence of the modeling
-100
-50
0
50
100
150
200 Hoop Gage A4 - TM
icro
Stra
in
-2000
-1500
-1000
-500
0
500 Fillet Gage A3 - C
Mic
ro S
train
Fig. 11 GSAM predicted strains at four OD hoop gage locations - forward loading
(a) (b) (c) (d) Fig. 12 GSAM predicted hoop strains at OD hoop gage
locations under forward and reverse loading (a) Gage A (b) Gage B (c) Gage C (d) Gage D
scheme. The undulations at tooth mesh frequency are more pronounced in the experimental data than in the GSAM predicted data. This could be due to the secondary dynamic effects that are not modeled in the quasi-static GSAM analyses. The interface between the tooth model and rim model or insufficient time resolution in the areas of the curve away from peak loading (spacing of 0.5 base pitch) could also contribute to such undulations.
Despite these differences, the GSAM model performs well in modeling the trends and magnitudes of the peak hoop strains.
The gages in the root fillet of the ring gear cover a significant portion of the fillet. One end of the gages was aligned with the center of the tooth space and the other
-100
-50
0
50
100
150
200
Mic
ro S
train
Gage A (75F0) Gage B (44F0.6) Gage C (10F0.8) Gage D (107F0.5)
-100
-50
0
50
100
150
200 Gage A (75F0)
-100
-50
0
50
100
150
200
Mic
ro S
trai
n
Gage D (107F0.5)Gage D (107R0.5)
-100
-50
0
50
100
150
200
Mic
ro S
train
Gage C (10F0.8)Gage C (10R0.8)
-100
-50
0
50
100
150
200
Mic
ro S
trai
n
Gage B (44F0.6)Gage B (44R0.6)Gage A (75R0)
Mic
ro S
train
7
Copyright © 2007 by ASME and General Motors
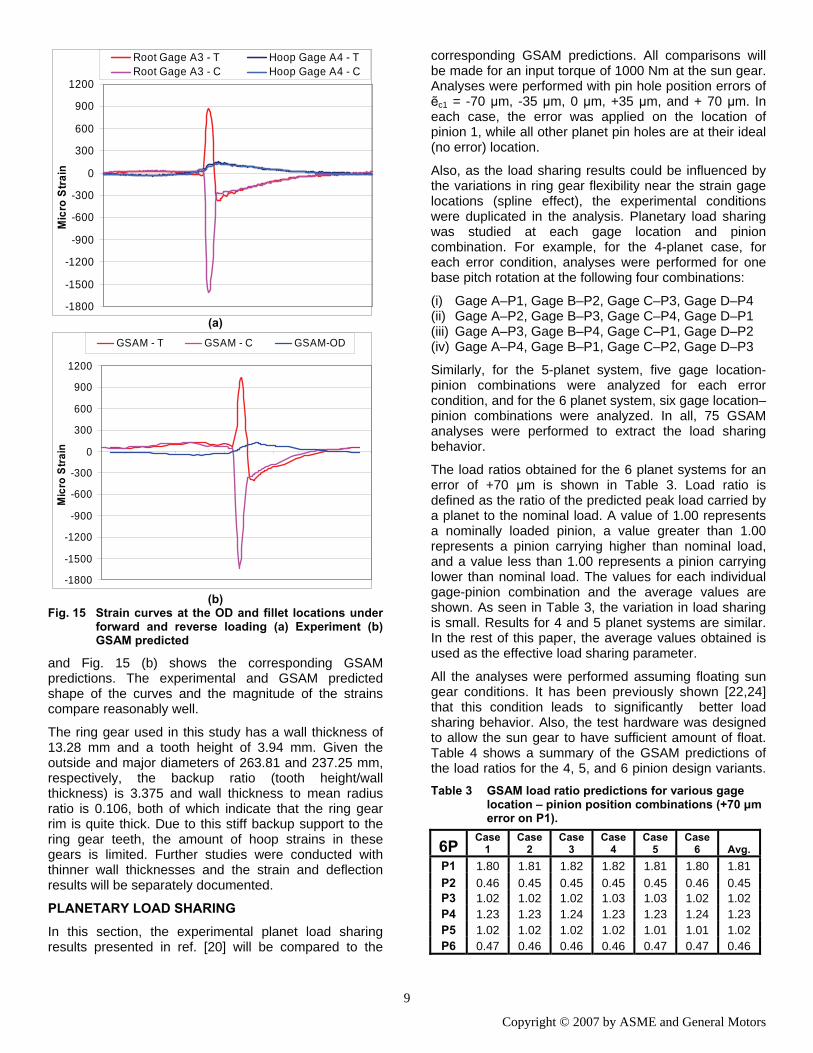
end extended up the profile. The gage length was 0.79 mm with an overall length of 1.07 mm. The modeling parameter ‘sprof’ is linear with length along the profile, with a value of 0.0 at the center of the space width and a value of 48.0 at the tip of the gear tooth. The span of the strain gage is from sprof=0 to sprof=11. There is a significant strain gradient in the gear tooth fillet. Figs. 13 and 14 shows the GSAM predicted strain in the gear fillet as a function of sprof.
Figure 13 shows the GSAM predicted fillet strain for forward loading. Away from the period of tooth loading, the hoop strains are clearly visible in the predicted normal strain signal. Fig. 13 (c) shows a close-up view of the peak compressive strain portion of the strain curve. This strain is induced by the hoop deformation of the ring gear body. The hoop strain is highest at the major diameter (sprof=0, center of the space width), and its amplitude monotonically decreases as sprof increases. Also, the magnitude of the hoop induced strain at the gear fillet is greater than the hoop induced strain at the gear OD (Figs. 11-12). This is consistent with the trend in the experimental data and is a consequence of stress concentration in the gear fillet.
Figure 13 (b) shows a close-up view of the strain induced by gear tooth bending. The gages are on the
(a) (b) (c) Fig. 13 (a) GSAM predicted fillet strain under forward
loading for varying profile locations. Close-up view of the (b) peak bending stress (c) peak hoop stress portion
-600
-500
-400
-300
-200
-100
0
Mic
ro S
trai
n
400
500
600
700
800
900
1000
1100
1200
Mic
ro S
trai
n
-800
-600
-400
-200
0
200
400
600
800
1000
1200
Mic
ro S
trai
n
sprof-3sprof-4sprof-5sprof-6sprof-7sprof-8
8
drive side of the gear tooth and the normal strain at the time of tooth loading is tensile. As sprof increases, the peak bending strain first increases, reaches a maximum value, and then decreases. The critical section, defined as the location where the bending stress is maximum, is at approximately sprof=6.0.
Figure 14 shows the GSAM predicted fillet strain under reverse loading. Again, the hoop related strain decreases in magnitude as sprof increases, with the maximum magnitude at the center of the tooth space where sprof=0.0. The fillet gages are now on the coast side of the gear tooth and hence predict a compressive normal strain. The compressive bending strain is superimposed on the compressive hoop strain. Fig. 14 (b) shows a close-up view of the peak compressive strain portion of the strain curve. The magnitude of peak strain first increases, reaches a maximum value, and then decreases as the value of sprof increases. The maximum compressive strain occurs at sprof=5.
Figure 15 shows the data for the forward and reverse loading superimposed on the same plot. Both outer diameter hoop and gear tooth fillet stresses are shown. This allows for easy comparison of the strain signals. Fig. 15 (a) shows the experimentally obtained strain signals,
-1800-1600-1400-1200-1000-800-600-400-200
0200400
(a) (b) Fig. 14 (a) GSAM predicted fillet strain under reverse
loading for varying profile locations (b) Close-up view of the peak compressive bending stress portion
Mic
ro S
trai
n
sprof-3
sprof-4sprof-5
sprof-6
sprof-7sprof-8
-1700
-1600
-1500
-1400
-1300
-1200
-1100
Mic
ro S
trai
n
Copyright © 2007 by ASME and General Motors
(a)
(b) Fig. 15 Strain curves at the OD and fillet locations under
forward and reverse loading (a) Experiment (b) GSAM predicted
and Fig. 15 (b) shows the corresponding GSAM predictions. The experimental and GSAM predicted shape of the curves and the magnitude of the strains compare reasonably well.
The ring gear used in this study has a wall thickness of 13.28 mm and a tooth height of 3.94 mm. Given the outside and major diameters of 263.81 and 237.25 mm, respectively, the backup ratio (tooth height/wall thickness) is 3.375 and wall thickness to mean radius ratio is 0.106, both of which indicate that the ring gear rim is quite thick. Due to this stiff backup support to the ring gear teeth, the amount of hoop strains in these gears is limited. Further studies were conducted with thinner wall thicknesses and the strain and deflection results will be separately documented.
PLANETARY LOAD SHARING
In this section, the experimental planet load sharing results presented in ref. [20] will be compared to the
-1800
-1500
-1200
-900
-600
-300
0
300
600
900
1200
Mic
ro S
train
Root Gage A3 - T Hoop Gage A4 - TRoot Gage A3 - C Hoop Gage A4 - C
-1800
-1500
-1200
-900
-600
-300
0
300
600
900
1200
Mic
ro S
train
GSAM - T GSAM - C GSAM-OD
9
corresponding GSAM predictions. All comparisons will be made for an input torque of 1000 Nm at the sun gear. Analyses were performed with pin hole position errors of ẽc1 = -70 μm, -35 μm, 0 μm, +35 μm, and + 70 μm. In each case, the error was applied on the location of pinion 1, while all other planet pin holes are at their ideal (no error) location.
Also, as the load sharing results could be influenced by the variations in ring gear flexibility near the strain gage locations (spline effect), the experimental conditions were duplicated in the analysis. Planetary load sharing was studied at each gage location and pinion combination. For example, for the 4-planet case, for each error condition, analyses were performed for one base pitch rotation at the following four combinations:
(i) Gage A–P1, Gage B–P2, Gage C–P3, Gage D–P4 (ii) Gage A–P2, Gage B–P3, Gage C–P4, Gage D–P1 (iii) Gage A–P3, Gage B–P4, Gage C–P1, Gage D–P2 (iv) Gage A–P4, Gage B–P1, Gage C–P2, Gage D–P3
Similarly, for the 5-planet system, five gage location-pinion combinations were analyzed for each error condition, and for the 6 planet system, six gage location–pinion combinations were analyzed. In all, 75 GSAM analyses were performed to extract the load sharing behavior.
The load ratios obtained for the 6 planet systems for an error of +70 μm is shown in Table 3. Load ratio is defined as the ratio of the predicted peak load carried by a planet to the nominal load. A value of 1.00 represents a nominally loaded pinion, a value greater than 1.00 represents a pinion carrying higher than nominal load, and a value less than 1.00 represents a pinion carrying lower than nominal load. The values for each individual gage-pinion combination and the average values are shown. As seen in Table 3, the variation in load sharing is small. Results for 4 and 5 planet systems are similar. In the rest of this paper, the average values obtained is used as the effective load sharing parameter.
All the analyses were performed assuming floating sun gear conditions. It has been previously shown [22,24] that this condition leads to significantly better load sharing behavior. Also, the test hardware was designed to allow the sun gear to have sufficient amount of float. Table 4 shows a summary of the GSAM predictions of the load ratios for the 4, 5, and 6 pinion design variants. Table 3 GSAM load ratio predictions for various gage
location – pinion position combinations (+70 μm error on P1).
6PCase
1 Case
2 Case
3 Case
4 Case
5 Case
6 Avg. P1 1.80 1.81 1.82 1.82 1.81 1.80 1.81 P2 0.46 0.45 0.45 0.45 0.45 0.46 0.45 P3 1.02 1.02 1.02 1.03 1.03 1.02 1.02 P4 1.23 1.23 1.24 1.23 1.23 1.24 1.23 P5 1.02 1.02 1.02 1.02 1.01 1.01 1.02 P6 0.47 0.46 0.46 0.46 0.47 0.47 0.46
Copyright © 2007 by ASME and General Motors
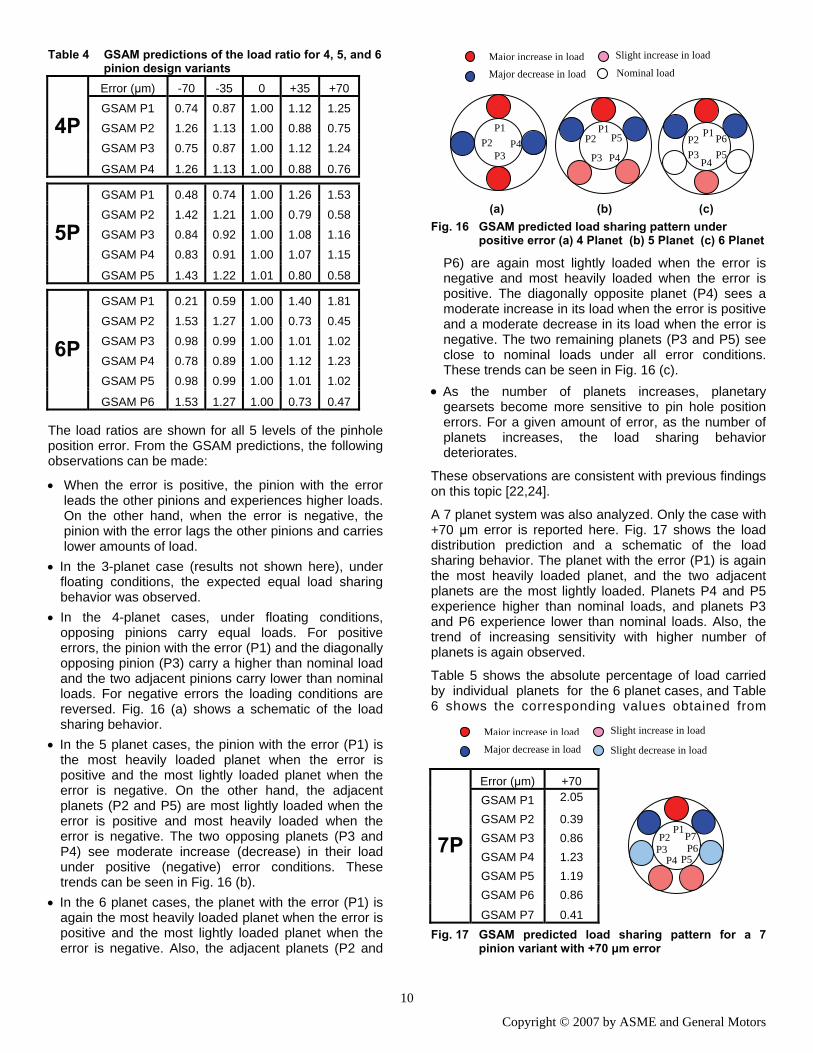
Table 4 GSAM predictions of the load ratio for 4, 5, and 6 pinion design variants Error (μm) -70 -35 0 +35 +70
GSAM P1 0.74 0.87 1.00 1.12 1.25
GSAM P2 1.26 1.13 1.00 0.88 0.75
GSAM P3 0.75 0.87 1.00 1.12 1.24 4P
GSAM P4 1.26 1.13 1.00 0.88 0.76
GSAM P1 0.48 0.74 1.00 1.26 1.53
GSAM P2 1.42 1.21 1.00 0.79 0.58
GSAM P3 0.84 0.92 1.00 1.08 1.16
GSAM P4 0.83 0.91 1.00 1.07 1.15 5P
GSAM P5 1.43 1.22 1.01 0.80 0.58
GSAM P1 0.21 0.59 1.00 1.40 1.81
GSAM P2 1.53 1.27 1.00 0.73 0.45
GSAM P3 0.98 0.99 1.00 1.01 1.02
GSAM P4 0.78 0.89 1.00 1.12 1.23
GSAM P5 0.98 0.99 1.00 1.01 1.02
6P
GSAM P6 1.53 1.27 1.00 0.73 0.47
The load ratios are shown for all 5 levels of the pinhole position error. From the GSAM predictions, the following observations can be made:
• When the error is positive, the pinion with the error leads the other pinions and experiences higher loads. On the other hand, when the error is negative, the pinion with the error lags the other pinions and carries lower amounts of load.
• In the 3-planet case (results not shown here), under floating conditions, the expected equal load sharing behavior was observed.
• In the 4-planet cases, under floating conditions, opposing pinions carry equal loads. For positive errors, the pinion with the error (P1) and the diagonally opposing pinion (P3) carry a higher than nominal load and the two adjacent pinions carry lower than nominal loads. For negative errors the loading conditions are reversed. Fig. 16 (a) shows a schematic of the load sharing behavior.
• In the 5 planet cases, the pinion with the error (P1) is the most heavily loaded planet when the error is positive and the most lightly loaded planet when the error is negative. On the other hand, the adjacent planets (P2 and P5) are most lightly loaded when the error is positive and most heavily loaded when the error is negative. The two opposing planets (P3 and P4) see moderate increase (decrease) in their load under positive (negative) error conditions. These trends can be seen in Fig. 16 (b).
• In the 6 planet cases, the planet with the error (P1) is again the most heavily loaded planet when the error is positive and the most lightly loaded planet when the error is negative. Also, the adjacent planets (P2 and
Slight increase in load Major increase in load
Nominal load Major decrease in load
P1 P2
P3 P4 P5
P4 P3
P2 P1
P6 P5
P4 P3 P2
P1
(a) (b) (c) Fig. 16 GSAM predicted load sharing pattern under
positive error (a) 4 Planet (b) 5 Planet (c) 6 Planet
P6) are again most lightly loaded when the error is negative and most heavily loaded when the error is positive. The diagonally opposite planet (P4) sees a moderate increase in its load when the error is positive and a moderate decrease in its load when the error is negative. The two remaining planets (P3 and P5) see close to nominal loads under all error conditions. These trends can be seen in Fig. 16 (c).
• As the number of planets increases, planetary gearsets become more sensitive to pin hole position errors. For a given amount of error, as the number of planets increases, the load sharing behavior deteriorates.
These observations are consistent with previous findings on this topic [22,24].
A 7 planet system was also analyzed. Only the case with +70 μm error is reported here. Fig. 17 shows the load distribution prediction and a schematic of the load sharing behavior. The planet with the error (P1) is again the most heavily loaded planet, and the two adjacent planets are the most lightly loaded. Planets P4 and P5 experience higher than nominal loads, and planets P3 and P6 experience lower than nominal loads. Also, the trend of increasing sensitivity with higher number of planets is again observed.
Table 5 shows the absolute percentage of load carried by individual planets for the 6 planet cases, and Table 6 shows the corresponding values obtained from
Slight increase in load Major increase in loadMajor decrease in load Slight decrease in load
Error (μm) +70 GSAM P1 2.05
GSAM P2 0.39 GSAM P3 0.86 GSAM P4 1.23 GSAM P5 1.19 GSAM P6 0.86
7P
GSAM P7 0.41
P7 P6
P5 P4 P3 P2
P1
Fig. 17 GSAM predicted load sharing pattern for a 7 pinion variant with +70 μm error
10
Copyright © 2007 by ASME and General Motors
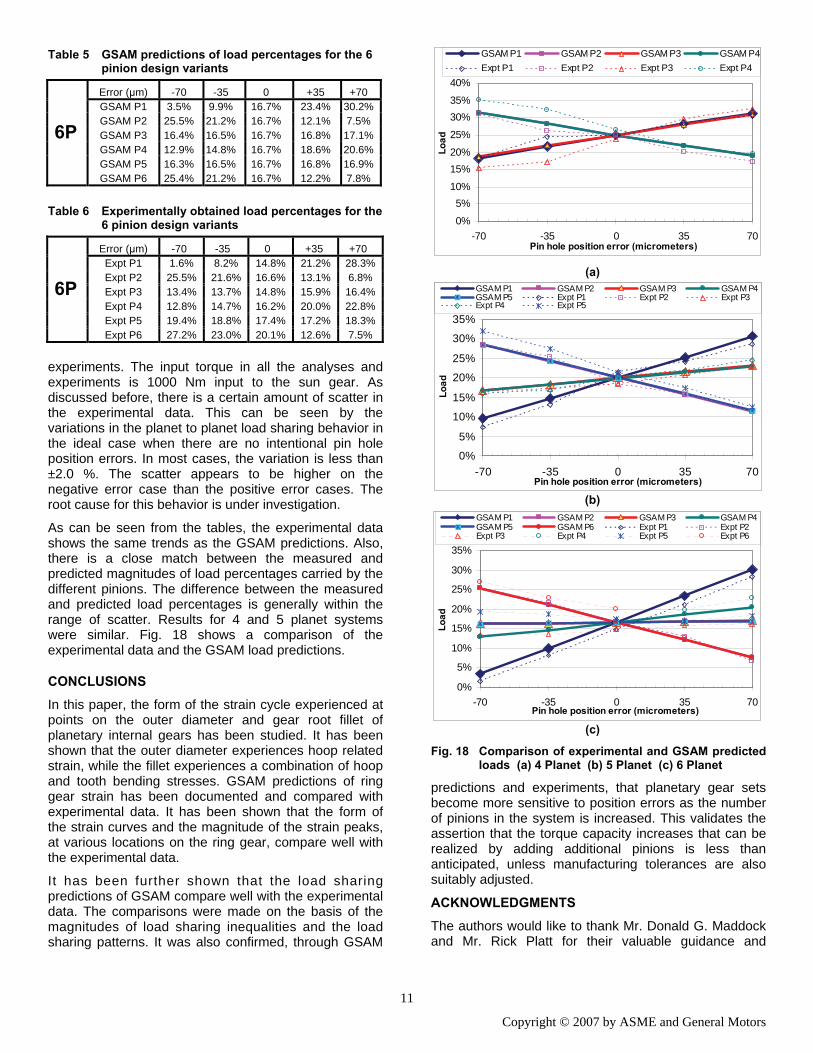
Table 5 GSAM predictions of load percentages for the 6 pinion design variants
Error (μm) -70 -35 0 +35 +70 GSAM P1 3.5% 9.9% 16.7% 23.4% 30.2% GSAM P2 25.5% 21.2% 16.7% 12.1% 7.5% GSAM P3 16.4% 16.5% 16.7% 16.8% 17.1% GSAM P4 12.9% 14.8% 16.7% 18.6% 20.6% GSAM P5 16.3% 16.5% 16.7% 16.8% 16.9%
6P
GSAM P6 25.4% 21.2% 16.7% 12.2% 7.8% Table 6 Experimentally obtained load percentages for the
6 pinion design variants
Error (μm) -70 -35 0 +35 +70 Expt P1 1.6% 8.2% 14.8% 21.2% 28.3% Expt P2 25.5% 21.6% 16.6% 13.1% 6.8% Expt P3 13.4% 13.7% 14.8% 15.9% 16.4% Expt P4 12.8% 14.7% 16.2% 20.0% 22.8% Expt P5 19.4% 18.8% 17.4% 17.2% 18.3%
6P
Expt P6 27.2% 23.0% 20.1% 12.6% 7.5%
experiments. The input torque in all the analyses and experiments is 1000 Nm input to the sun gear. As discussed before, there is a certain amount of scatter in the experimental data. This can be seen by the variations in the planet to planet load sharing behavior in the ideal case when there are no intentional pin hole position errors. In most cases, the variation is less than ±2.0 %. The scatter appears to be higher on the negative error case than the positive error cases. The root cause for this behavior is under investigation.
As can be seen from the tables, the experimental data shows the same trends as the GSAM predictions. Also, there is a close match between the measured and predicted magnitudes of load percentages carried by the different pinions. The difference between the measured and predicted load percentages is generally within the range of scatter. Results for 4 and 5 planet systems were similar. Fig. 18 shows a comparison of the experimental data and the GSAM load predictions.
CONCLUSIONS
In this paper, the form of the strain cycle experienced at points on the outer diameter and gear root fillet of planetary internal gears has been studied. It has been shown that the outer diameter experiences hoop related strain, while the fillet experiences a combination of hoop and tooth bending stresses. GSAM predictions of ring gear strain has been documented and compared with experimental data. It has been shown that the form of the strain curves and the magnitude of the strain peaks, at various locations on the ring gear, compare well with the experimental data.
It has been further shown that the load sharing predictions of GSAM compare well with the experimental data. The comparisons were made on the basis of the magnitudes of load sharing inequalities and the load sharing patterns. It was also confirmed, through GSAM
0%
5%10%
15%20%
25%
30%35%
40%
-70 -35 0 35 70Pin hole position error (micrometers)
GSAM P1
(a)
(b)
(c)
Fig. 18 Comparison of experimental and GSAM predicted loads (a) 4 Planet (b) 5 Planet (c) 6 Planet
predictions and experiments, that planetary gear sets become more sensitive to position errors as the number of pinions in the system is increased. This validates the assertion that the torque capacity increases that can be realized by adding additional pinions is less than anticipated, unless manufacturing tolerances are also suitably adjusted.
ACKNOWLEDGMENTS
The authors would like to thank Mr. Donald G. Maddock and Mr. Rick Platt for their valuable guidance and
Load
GSAM P2 GSAM P3 GSAM P4Expt P1 Expt P2 Expt P3 Expt P4
0%
5%
10%
15%
20%
25%
30%
35%
-70 -35 0 35 70Pin hole position error (micrometers)
GSAM P1 GSAM P2 GSAM P3 GSAM P4GSAM P5 Expt P1 Expt P2 Expt P3Expt P4 Expt P5
Loda
0%
5%
10%
15%
20%
25%
30%
35%
-70 -35 0 35 70Pin hole position error (micrometers)
GSAM P1 GSAM P2 GSAM P3 GSAM P4GSAM P5 GSAM P6 Expt P1 Expt P2Expt P3 Expt P4 Expt P5 Expt P6
Load
11
Copyright © 2007 by ASME and General Motors
assistance throughout this project. The contributions of Dr. Sandeep Vijayakar towards the development of GSAM are also acknowledged
REFERENCES 1. Singh, A., 2007, “Influence Of Planetary Needle Bearings
on the Performance of Single and Double Pinion Planetary Systems”, ASME Journal of Mechanical Design, 129 (1), pp. 85-94.
2. Singh, A., 2006, “Optimizing Gearset Durability in Double Pinion Planetary Transmissions” Proc. Of FISITA 2006, Paper No. F2006P290.
3. Li, S., 2002, “Gear Contact Model and Loaded Tooth Contact Analysis of a Three Dimensional, Thin-Rimmed Gear”, ASME Journal of Mechanical Design, 124 (3), pp. 511-517.
4. Guingand, M., de Vaujany, J. P., Icard, Y., 2004, “Fast Three-Dimensional Quasi-Static Analyses of Helical gears using the Finite Prism Method”, ASME Journal of Mechanical Design, 126 (6), pp. 1082-1088
5. Load Distribution Program (LDP), Gear Dynamics and Gear Noise Research Laboratory, The Ohio State University, Columbus, OH.
6. Guilbault, R., Gosselin, C., and Cloutier, L., 2005, “Express Model for Load Sharing and Stress Analysis in Helical Gears”, J. Mech. Des., 127 (6) , pp. 1161-1172.
7. Hidaka, T., Terauchi, Y., and Nohara, M., and Oshita, J., 1977, ‘‘Dynamic Behavior of Planetary Gear ~3rd Report, Displacement of Ring Gear in the Direction of Line of Action,’’ Bull. JSME, 20, pp. 1663–1672.
8. Chong, T. H., and Kubo, A., 1985, ‘‘Simple Stress Formulas for a Thin-Rimmed Spur Gear. Part 3: Examination of the Calculation Method and Stress State of Internal Spur Gear Pair,’’ ASME J. Mech., Transm., Autom. Des.,107, pp. 418–423.
9. Oda, S., and Miyachika, K., 1987, ‘‘Root Stress of Thin-Rimmed Internal Spur Gear Supported with Pins,’’ JSME Int. J., 30, pp. 646–652.
10. de Vaujany, J. P., Kim, H. C., Guingand, M., and Play, D., 1996, ‘‘Effects of Rim and Web on Stresses of Internal Cylindrical Gears,’’ Proceedings of the ASME International Power Transmission and Gearing Conference, DE-Vol. 88, pp. 73–80
11. Valco, M., 1992, “Planetary Gear Train Ring Gear and Support Structure Investigations”, Ph.D. Dissertation, Cleveland State University.
12. Kahraman, A., and Vijayakar, S., 2001, “Effect of Internal Gear Flexibility on the Quasi-Static Behavior of a Planetary Gear Set”, ASME Journal of Mechanical Design, 123, pp. 408-415.
13. Linke, H. and Jahn, C., 1997, ‘‘Bending Load on Internal Gears of Planetary Gear Sets,’’ AGMA Technical Paper, 97FTM7.
14. Krantz, T. L., 1992, ‘‘Gear Tooth Stress Measurements of Two Helicopter Planetary Stages,’’ NASA Technical Memorandum 105651, AVSCOM Technical Report 91-C-038.
15. Oswald, F. B., 1987, “Gear Tooth Stress Measurements on the UH-60A Helicopter Transmission”, NASA Technical Paper 2698
16. Botman, M., 1980, ‘‘Vibration Measurements on Planetary Gears if Aircraft Turbine Engines,’’ J. Aircr. 17, pp. 351–357.
17. Li, S., 2002, “Deformation and Bending Stress Analysis of a Three-dimensional, Thin-rimmed Gear”, ASME Journal of Mechanical Design, 124, pp. 129-135.
18. Hayashi, T., Li, Y., Hayashi, I., Endou, K., and Watanabe, W., 1986, “Measurement and some Discussions on Dynamic Load Sharing in Planetary Gears,” Bulletin of the JSME, 29, pp. 253-50.
19. Kahraman, A., 1999, ‘‘Static Load Sharing Characteristic of Transmission Planetary Gear Sets: Model and Experiment,’’ SAE Paper 1999-01-1050.
20. Ligata, H., Kahraman, A., and Singh, A., 2007, “An Experimental Study of the Influence of Manufacturing Errors on the Planetary Gear Stresses and Load Sharing”, Proc. Of ASME DETC2007 Conf., Las Vegas, NV, Sep. 2007
21. Singh, A., 2002, “Understanding the Influence of System Level Variables on Transmission Gear Performance,” Proc. 2002 Global Powertrain Congress, Ann Arbor, MI, Vol. 21, pp. 40–54.
22. Singh, A., 2005, “Application of a System Level Model to Study the Planetary Load Sharing Behavior”, ASME Journal of Mechanical Design, 127, pp. 469-476.
23. Vijayakar, S., 1991, “A Combined Surface Integral and Finite Element Solution for a Three-Dimensional Contact Problem,” Int. J. Numer. Methods Eng. 31, pp. 525–545.
24. Bodas, A. and Kahraman, A., 2004, “Influence of Carrier and Gear Manufacturing Errors on the Static Load Sharing Behavior of Planetary Gear Sets,” JSME International Journal, Series C, 47, pp.908-915.
12
Copyright © 2007 by ASME and General Motors