Embed Size (px)
Citation preview

7/ )
Molecular Beam Analyzer for Identifying Transient
Intermediates in Gaseous Reactions
M. Kaufman and C. E. Kolb+
Frick Chemical Laboratory, Princeton Uni"ersity,Princeton, New Jersey, 08540
e ABSTRACT
When using a mass spectrometer to monitor free radical and
atom intermediates in rapid gas-phase reactions, identification of
the oarent species of each ion is made difficult by fragmentation
pro.zesses that occur at electron energies necessary for optimum
ionization cross sections. Molecular beam analysis is new ap-
proach to this problem whereby molecular beam measurements are used
to characterize neutral species before they are ionized. Thus, the
trajectcry of a particle in an inhomogeneous magnetic field shows
Swhether or not it has a large magnetic moment characteristic of a
free radical, its motion in an inhomogeneoua electric field indi-
cates its symmetry and the magnitude of its electric dipoie moment,
and its velocity distribution determines its mass when tho scurce
temperature is known. Using these techniques, vvrious atom , free
radical and unstable molecular species have been identified in gases
excited by microwave discharge or as products of atom-molecule
reactions.NATIONAL TECHNICAL DDCINFORMATION SERVICE OFF PIPý.'pi.qfi"'d Va 2151 I i
APR 7j 1971
J, L tru t "tw.'-C

2.
INTRODUCTION
Research in gas phase reaction kinetics has been characterized
by great duplication of effort resulting from uncertainties in re-
action mechanisms. Mhile measurements of reactant decay rates can
provide precise determination of absolute rate constants and com-
parisons of relative product yields can provide relative rate con-
stu.nts, the conclusions of such work have often been invalidated
by discovery of inaccuracies in the assumed reaction mechanism.
Unequivocal mechanisms are best ascertained by methods that
identify intermediates and measure their variation in concentra-
tion during the course of a reaction.
Progress in this direction has already been considerable,
and techniques such as electron spin resonance, kinetic spec-
troscopy and mass spectrometry have contributed greatly to the
development of gas phase kinetics. No truly general method for
monitoring transients, however, has yet been developed. Electron
spin resonance has been successful. primarily with monaLomic and
diatomic intermediates, and spectroscopy has been limited to small
species that produce simple, well-resolved spectra. Mass spec-
trometry, due to its universal applicability anO great sensitivity,1
would appear to be most appealing for this purpose. However, its
use for the measurement of small free radical concentrations has
4

3.
presented many difficulties, of which the elimination of inter-
ferences due to dissociative ionization processes has proved to be
the most recalcitrant. Mass spectroscopists have followed two
approaches, either subtracting out interferences that contribute
at the free radical ion, or forming ions by bombardment with
electrons of insufficient energy to induce any dissociative ioni-
zation process. The former approach is only applicable when the
mole fraction of the radical is large, while the latter has re-
s ulted in greatly reduced ion intensities and has not been par-
ticularly effective in analyzing more complicated systems. In
addition, it is often difficult to eliminate contributions from
dissociative ionization of vibrationally excited species or inter-
ferences from the isotopic variations of the major reactants or
products in the system. A key feature of mass spectrometers that
have been most successful in analyzing for transients has been
the molecular beam sampling system, i.e. a collisionless path2
between the source and the ionization region. This modification
eliminates destruction of unstable intermediates on surfaces of
the apparatus and permits modulatior of the beam to discriminate
against i:'s formed from backgtound gas in the ionization chamber.
We have been developing a new approach towards greatly ex-
panding the applicability of mass spectrometry to this problem of
4.
detecting and monitoring intermediates in gaseous reactions.
Basically, our method is to employ a number of molecular beam
techniques to measure properties of the transients before they3
are ionized in the mass spectrometer. Preselection of neutral
species in the beam before ionization eliminates interferences at
the parent peak of the transient species and thus obviates the
necessity for using low energy electrons, with the resulting loss
of ionization efficiency. In addition, beam measurements could be
employed in cases where appearance potential discrimination would
be ineffective due to the possibility of breaking very weak bonds
or bonds conzaining appreciable vibrational energy. We have termed
the use of molecular beam techniques for this purpose "molecular
beam analysis".
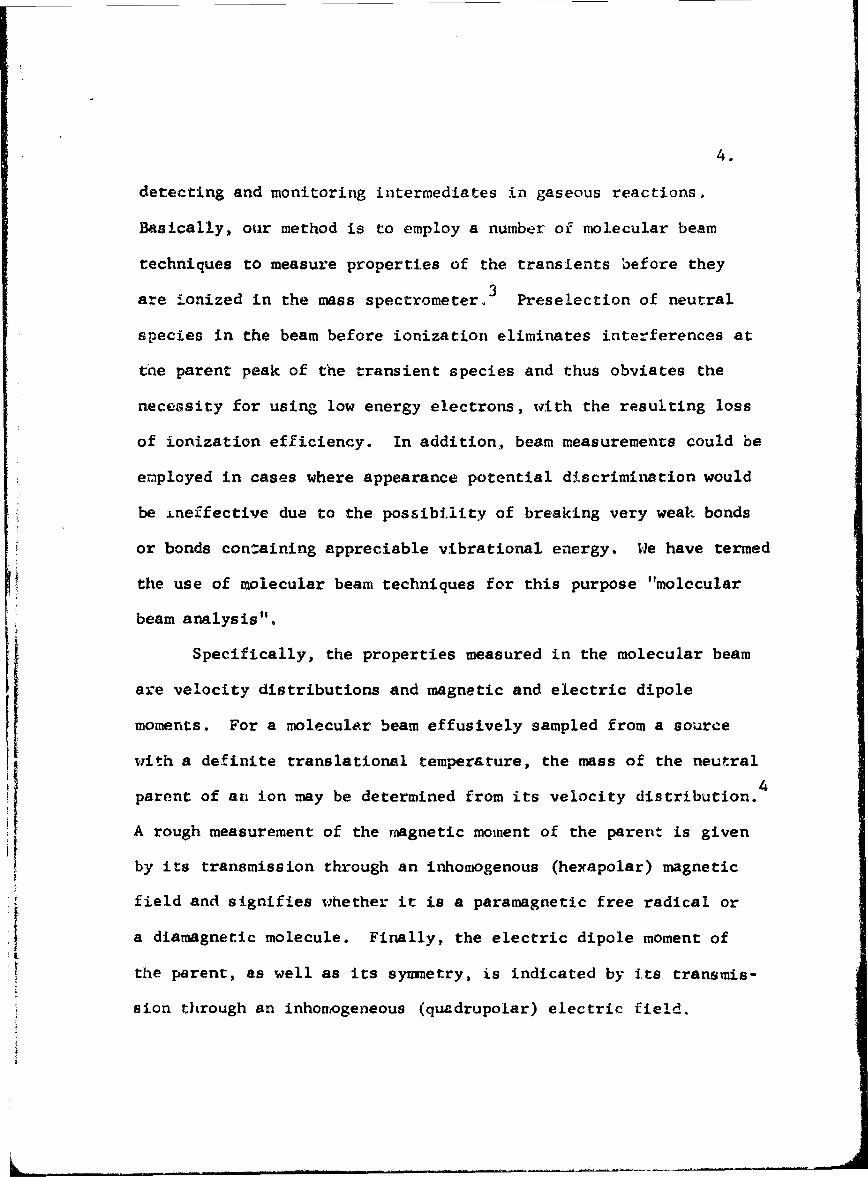
Specifically, the properties measured in the molecular beam
are velocity distributions and magnetic and electric dipole
moments. For a molecular beam effusively sampled from a source
with a definite translational temperature, the mass of the neutralS~4
parent of an ion may be determined from its velocity distribution.
A rough measurement of the magnetic moment of the parent is given
Iby its transmission through an inhomogenous (hexapolar) magnetic
field and signifies whether it is a paramagnetic free radical or
Ia diamagnetic molecule. Finally, the electric dipole moment of
the parent, as well as its symmetry, is indicated by its transmis-
sion through an inhomogeneous (quadrupolar) electric field.

5.
APPARATUS DESCRIPTION
A schematic diagram of the molecular beam analyzer is shown
in Fig. 1. Molecules effuse from a reactor into an apparatus com-
posed of four chambers, the vacuum characteristics of which are
liste-i in Table I. The detector chamber contains a high efficiency
electron bombardment ionizer and a mass spectrometer. The latter
is a 450, 15-cm radius magnetic sector instrument with variable
entrance and exit slits, and is generally oper-ated with a resolu-
tion of ca. 100. Ions are collected on a 12-stage DuMont electron
multiplier (type SPM-02-402), which provides a gain of 10 when
operated at 2.5 kV. This chamber is also fitted with a Granville-
Phillips variable leak valve which permits controlled addition
of background gas to the detector.
The beam ionizer, which is shown schematically in F. 2,
is similar to one designed by Weiss.5 Ionization occurs between
grids 1 and 2, which are electrically connected so that the poten-
tial distribution between them is established by the electron space
charge. The space-charge potential has a minimum in two dimensions
and is made to monotonically decrease in the third direction by
increasing the separation between the grids toward the exit
electrode. The ions are thus confined as they are accelerated
out of the space charge. After further acceleration the ions are

6.
Table I
Vacuum Characteristics of Molecular Beam Analyzer
Chambei Source Main Buffer Detector
Pump 285 liter/sec 1200 liter/sec 8 liter/sec 50 liter/sec,oil diffusion oil diffusion ion ion + 3600
liter/sec Tisublimation
Typical 5 x 10⁻⁶ 1 x 10- 6 3 x 10⁻⁸ 2 x 10⁻⁹
Pressure(Torr)
Beam path 3 45 20 20(to ion-in chamber(cm) izer)
i*
SWith reactor at 1 Torr and using a .01-cm diameter circular
sampling orifice.

7.
deflected onto the entrance slit of the roass spectrometer. Weiss'
original design has been modified by elimi~nating the grids from
the entrance and exit electrodes to prevent reflection or adsorp-
tion of beam molecules, and by using a tetrode rather than a
triode structure. An externally operated translational motion
is employed to position the ionizer so that the maximum number
of beam moleruleq are ionized.
The electron emitting filament is a thoriated tungsten strip,
5cm x 4mm x .02 mm, cataphoretically coated with Th0 2 and Th(N0 3 )4
to increase its emission. It is spot welded through platinum foil
to tungsten leaf springs which hold it taut when it expands
thermally. Molybdenum screws position the filament to a uniform
d stance of ca. 1-2 mmn from grid 1. No short circuits or broken
filaments have occurred with this mounting and emission has been
stable c~ver many months of constant operation. Typical operating
conditions are shown in Table Il.
l6
A small buffer chamber and a directional entrance 6enable
-i-9
the detector to be maintained in the low 10 se Torr range, while
sampling from reactors at pressures near 1 Torr. The directional
entrance is a copper EMI honeycomb grid structure, 1-cm long and
componed of 217 parallel thin-walled passages in an 0.3 cm area.
It is better than 80o transmitting for a molecular beam travelling
along its axis, but has a conductance for background gas of only

8.
Table II
Typical Ionizer Operating Conditions
Voltage drop across filament and leads 5.4 V
Filament heating current 14.0 A
Filament voltage - 100 V
Electron current to grid 1 100 mA
Electron current to grid 2 100 mA
Electron current to anode 150 mA*
Entrance electrode voltage + 330 V
Exit electrode and shield are electrically connected and
their voltage is varied to maximize th3 ion current.
*Voltages are with respect to grids 1 and 2 and the anode,
which are electrically connected and floating on an ion
accelerating voltage of ca. 2000 volts.

9.
0.2 liter/sec. The directional entrance is mounted between two
flexible metal bellows, so that it can be oriented for maximum beam
transmission. A Granville-Phillips straight through (type S) valv-!
permits the buffer and detector chambers to be isolated while the
remainder of the apparatus is opened to the atmosphere.
In the main chamber provision is made for determining
velocity distributions and magnetic and electric dipole moments.
The beatp, after collimation, encounters a rotating disk, which
has one of the three shapes shown in Fig. 3. The left-most wheel
modulates the beam for conventional phase sensitive detection.
The center disk provides short pulses of beam. By recording the
time required for particles to travel from this pulser to the
ionizer, we obtain their time-of-flight (TOF) distribution, whichi -1
is proportional to the distribution of v . A disk containing
two 1.6 mm slots and rotating at 50 cps produces beam pulses ca.
200 4sec in duration, 10 msec apart. The right-most wheel modu-
lates the beam in a pseudorandom manner, the modulation sequence
repeating after 2j5 intervals. The TOF distributicn can be ex-
tracted from the signal produced in such a manner by using corre-
lation techniques.7 The advantage of this method of determining
the TOF distribution is that the beam duty cycle is 507., as compared
with l% when employing the pulsed-beam technique. The correlation
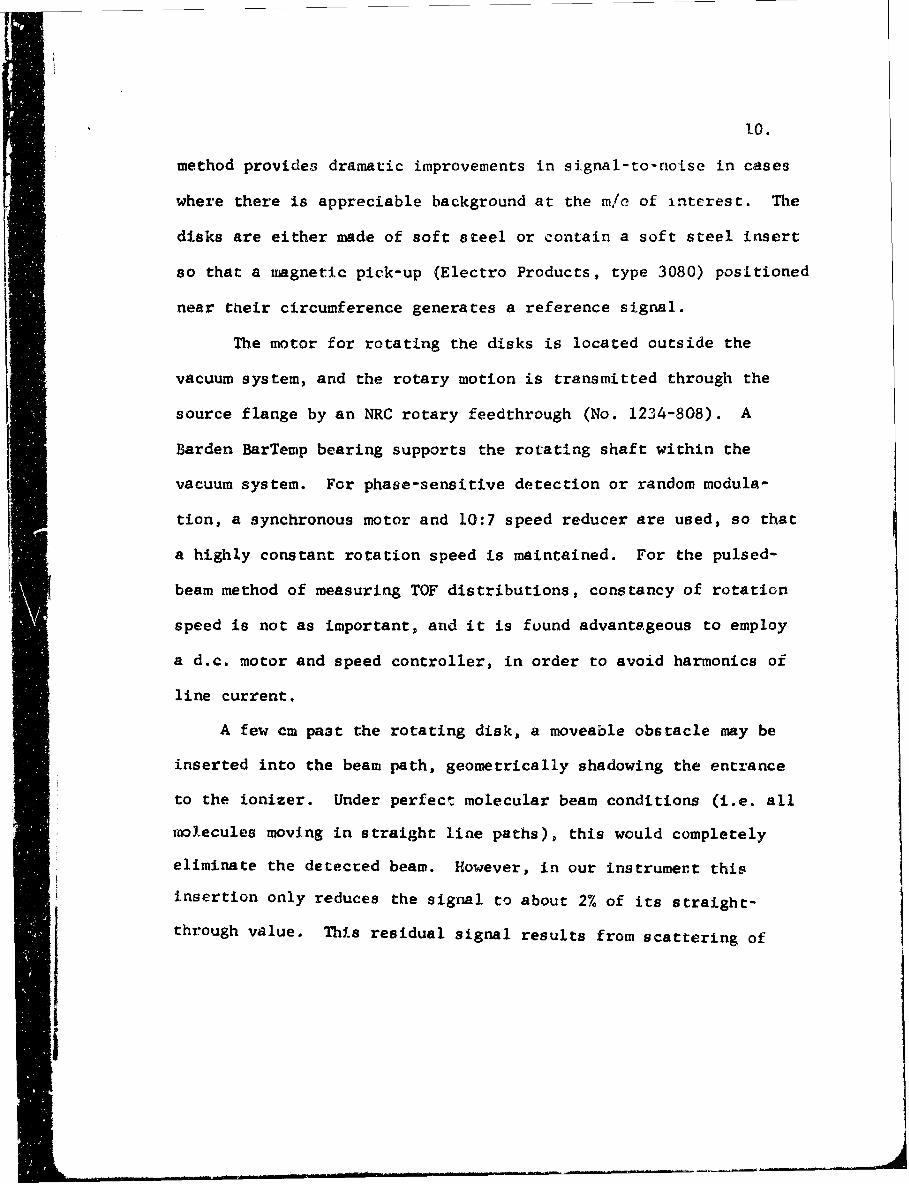
1.0.
method provides dramatic improvements in signal-to-noise in cases
where there is appreciable background at the m/e of interest. The
disks are either made of soft steel or contain a soft steel insert
so that a magnetic pick-up (Electro Products, type 3080) positioned
near their circumference generates a reference signal.
The motor for rotating the disks is located outside the
vacuum system, and the rotary motion is transmitted through the
source flange by an NRC rotary feedthrough (No. 1234-808). A
Barden BarTemp bearing supports the rotating shaft within the
vacuum system. For phase-sensitive detection or random modula-
tion, a synchronous motor and 10:7 speed reducer are used, so that
a highly constant rotation speed is maintained. For the pulsed-
beam method of measuring TOF distributions, constancy of rotation
speed is not as important, and it is found advantageous to employ
a d.c. motor and speed controller, in order to avoid harmonics of
line current.
A few cm past the rotating disk, a moveable obstacle may be
inserted into the beam path, geometrically shadowing the entrance
to the ionizer. Under perfect molecular beam conditions (i.e. all
molecules moving in straight line paths), this would completely
eliminate the detected beam. However, in our instrument this
insertion only reduces the signal to about 2% of its straight-
through value. This residual signal results from scattering of
jsatrn

1i.
beam molecules by bacground gas and various surfaces of the
apparatus. The obstacle is a 1.5 mm diameter wire, mounted off
center on the end of a rod. By rotating the rod, the wire can
be positioned for minimum beam transmission.
With the obstacle in place, magnetic or electric inhomo-
geneous fields can be used to deflect species into the detector,
if they possess appreciable magnetic or electric dipole moments,
re;pectively. The percent magnetic or electric focusing at a
given m/e is defined as the increase in current when the field is
applied, divided by the current with the field and obstacle re-
meved, x 100. The inhomogeneous electric field is constructed
from four stainless steel circular rods of 4.75 mm diameter and
9.2 cm length. A boron nitride insulator at each end holds the
rods in a quadrupole configuration with their centers equally
spaced on a circle of 9.5 mm diameter. The high voltage for the
quadrupole is provided by a Speliman 0-30 kV power supply (model
PN-30) and enters the vacuum system via an Alite high voltage
terminal (No. 3-5-ID). A 3 x 10⁸ 0 resistor in series with the
supply helps to prevent damage to the field from sparks which
occasionally occur at voltages above 20 kV. Voltages are measured
by a Keithly 6-lOC electrometer with a 6-103A high-voltage
divider probe.
L.

12.
A magnetic hexapole field may be substituted for the electric
quudrupole. The magnet (Hewlett Packard Co., part No. 349654) is
7.5 cm long with opposing poles 3 mm apart. The field near the
pole tips is ca. 7000 gauss. Since it is a permanent magnet,
comparisons of beam intensity with the field on and off must be
performed by lifting the magnet out of the beam path. A kinematic
mount is used so that each time the magnet is lowered, it is
automatically realigned on the beam axis.
the source chamber contains the reactor being sampled.
Most of the studies to date have been performed on flow systems
excited by an electric discharge (see Fig. 4). Gases flow with
a linear speed of ca. 1 meter/sec through a microwave discharge
(50-100 watts of 2450 MHz power in an Evenson-type cavity 8). The
products of the discharge may be mixed with other gases at
varying distances from the sampling orifice using a moveable inlet
that passes into the flow system via an O-ring sealed Teflon
connector. Sampling orifices are generally circular holes of
.02-0.2 ion diameter, produced by sandblasting (with an S.S.White,
model F machine). This process erodes a cone into the wall of
the tube, so that the thickness of the glass at the hole is com-
parable to its diameter, as is required for effusive flow sampling.
To make holes of diameter less than 0.1 mm, the sandblasting is
13.
discontinued before piercing the wall, and the hole is completed
with a spark from a Tesla coil. 9 Some work has been performed
using slit (ca. .05 om x 3 mm) rather than circular hole orifice.,
These are prepared by sandblasting a V-groove that almost pene-
trates the wall of the tube and then completing the slit by rubbing
abrasive slurry back and forth in the groove using a wire os razor
blade. The slit orifice greatly increases beam intensity but
somewhat aggravates the problems caused by scattered beam. They
have been successfully employed only at low (below 100 micron)
pressures,
The flow tube passes through the source chamber via O-ring
sealed "quick-connects". This arrangement along with the mounting
of the external gas handling equipment on a laboratory cart,
allows the rapid interchange of the system beinrg studied. The
source flange also incorporates a sight tube on the beam axis for
telescope alignment of the apparatus.
The various methods of processing the output signal from the
electron multiplier arp diagrammed in Fig. 5. For dc recording
of the mnss spectrum on a Heath recording electvometer, multiplier
load resistors of ]0 7, 108 or 109 n are switch selected. Modu-
1 ated beams may be phase-sensitive detected (Princeton Applited
Research model 220 lock-in amplifier and model 210 selective

14.
amplifier, witn Tektronix type 122 low-level preamplifier) in
order to greatly reduce the contribution of background gas in the
detector chamber to the mass spectrum. Measurement of time-of-
flight distributions with either the pulsed or randomly
modulated beam is achieved by using a digital memory signal
averager (Intertechnique Didac 800 Physioscope), which is syncho-
nized to the signal by a pulse from the magnetic pickup. When
recording TOF curves the multiplier load resistor is reduced to
1.5 x 10 5 0, in order to maintain a sufficiently fast time
response.
For lnw level signals it is difficult to eliminate all
spurious pickuo from the TOF curves, and the counting of individual
multiplier pulses with multiscaling is generally more successful
than signal averagirng an analol signal. Itt this mode, the indi-
vidual pulses from the multiplier are amplified (Hewlett Packard,
55,54A charge-sensitive preamplifier, and Ortek, model 485 pulse
amplifier), and pulses with greater than a preset height are
selected by a discriminator (Ortek, rodel. 421), for counting by
the signai averager. For further processing of TOF data and for
correlating the iignal pý:oduced by the pseudo-random chopper, the
memory content of the averager may be punched on cards by a link
to an IBM model 526 card punch.

15.
RESULTS AND DISCUSSION
Our early attempts .o measure velocity distributions by the
TOF method gave results grossly 'distorted from the beam-modified
Maxwellian distribution (dN = v 3exp(-mv 2/kT)dv) that is usually
the first approximation to a molecular beam velocity distribution.
Relative to the Maxwellian, the data was enhanced at low velocity,
showing that the difficulty could not be due to scattering, which
would preferentially remove slow molecules from the beam. We
suspected that ion trapping in the space charge Of the ionizing
electrons was delaying the ions since such effect had be. n re-
ported in the literature.10 A number of approaches were employed
in attempting to eliminate this distortion. The~se included:
reducing the space charge by lowering the filament emission by
a factor of 5 (with a concomitant loss of ionization efficiency),
applying negative voltage pulses to the exit electrode, applying
a steady positive (repeller) voltage to the entrance electrode,
and adding Le•kground gas to the detector chamber. Best results
were obtained with a combination of the latter two techniques.
Usually the entrance electrode was operated at + 330 volts with
respect to the grids, and He was bled into the detector chamber
to raise its pressure to ca. 2 x 10⁻⁶ Torr. At this pressure the
background gas evidently provides sufficient ions to largely
16.
neutralize the electron space charge. He is appropriate for this
purpose since it produces ions at only a few peaks in the mrss
spectrum and does not interfere with the electron emission from
the ThO2 coated filament. (The emission actually increases
slightly when the He is added.) Fig. 6 shows TOF curves for 02
at its parent ion taken with these detector conditions which mini-
mize ion trapping. M2hen allowance is made for the finite duration
of the beam pulse and length of the detector (the entrance and
exit "slits" of the TOF spectrometer), reasonable agreement with
a v 3 exp(-mrv 2 /2kT) distribution is obtained.
A quick indication of the mass of the progenitor of an ion
can be obtained from the time to the peak of the TOF curve for
that ion. Fig. 7 demonstrates that there is a linear relation
between this time and the square root of the molecular weight of
the parent, as is predicted by the beam-modified Maxwellian distri-
bution. It is not important that the line does not extrapolate
to the origin, since the signal from the magnetic pickup is not
exactly synchronized with the beam pulse. In fact, this extrapola-
tion is usually used to define t-0 for our curve fitting procedures.
Table III lists atomic, free radical and unstable molecular
intermediates that have been detected by molecular beam analysis.
This is the first reported mass spectrometric observation of the

17.
Table III
Transient Intermediates Identified by Molecular Beam Analysis
Species Estimated System Total PressurePartial Pressure (Torr)
(microns)
H 250 discharged H2 2.5
N 120 discharged N2 3.0
0 150 N + NO 4.0
F 30 discharged CF4 or SF6 1.0
Cl 30 discharged C12 1.8
Br 80 discharged Br2 0.8
1 20 0 + CF 1.9
SO 40 discharged SO 2 1.2
CIO 20 discharged C12+02 mixture 4.0
1 BrO 10 0 + Br2 1.0
10 10 0 + CF 31 2.4
OH 10 H + NO 1.6
S 20 5 discharged SO2 0.5
-CH3 20 H + CH3I 4.5
CF3 5 0 + CFI 1.1
50-100 watts of 2450 MHz microwave power.

18.
very reactive radicals BrO and 10. Also noteworthy is the de-
tection of CH3 and CF3 at ca. 0.5% concentration in the presence
of much larger concentrations of reactants that give the parent
ionsof these radicals. The paramagnetic species were all identi-
fied by magnetic focusing at their parent ionschecking that there
were no other species present that could give this response
(e.g., BrO2 and 102 in the case of BrO and 10). Magnetic focusing
is a somewhat stringent requirement, since insertion of the hexa-
pole partially blocks the scattered beam. As a result, for dia-
magnetic particles, magnetic defocusing is observed.
The synergistic effect that can be achieved when TOF analysis
is employed simultaneously with magnetic or electric focusing is
illustrated in Fig. 8. These curves were taken at m/e - 19 (F+)
with 0.5 Torr of CF in the source. With the discharge off (lower4
curve), the TOF distribution is characteristic of CF . When the
discharge is initiated (upper curve) the distribution shifts to
earlier time, indicating a large contribution from a lighter
species (M<25). The response with the magnet and stopwire in
place (center curve) shows that this light species is paramagnetic,
and confirms the presence of a large coricentration of fluorine
atoms in the products of this discharge.l1
An example where electric deflection was indispensible is
the identification of S20 in microwave discharges through SO 2 .13

19.
In this system, with 15-kV applied to the quadrupQle. ca. 507%
electric focusing was observed at m/e - 80, the parent ion of S20.
So3s which has the same parent ion mass, might be predicted to
occur in this system. It cannot, however, produce electric
focusing, since it has a planar symmetric ground state and thus
no permanent electric dipole moment. (No electric focusing was
observed for reagent SO3 , or for SO3 formed by adding discharged
02 to SO 2) If SO3 contributed to th:&s ion peak, it would dilute
t07 electric focusing of S 20. However, we would expect the
focusing of S 20 to be very similar to that observed for NOCM,
another nearly prolate symmetric top with a similar dipole moment(.e = 2.0 Debye for NO1 and 1.5 Debye for S2 0). Since NOCI shows
537% electric focusing, we conclude that SO3 cannot be the major
contributor to the m/e - 80 ion current.
These preliminary experiments are intended to prove the
feasibility and usefulness of molecular beam analysis. Although
the ultimate sensitivity of the method has not yet been determined,
some of the radicals reported were identified at less than 0.57.
concentration in systenis at total pressure of a few Torr. We
believe that this new experimental approach will find an important
role in identifying polyatomic intermediates in fairly complicated
reactions, where considerable difficulty is generally experienced

20.
using more conventional techniques.
ACKNOWLEDGEMENTS
We are grateful to A. Weisbrodt, B. Hertzler, J. Bozzelli
and J. Abbotts for their aid in various parts of this work.
L _____

21.Foo tnotes
Primary financial support for this work was received from the
Office of Naval Research under contract N0014-67-A0151-0013. Also
supported by Petroleum Research Fund Grant 1142-G2 and the Higgins
arnd Shell Funds at Princeton University.
N .D.E.A. Graduate Fellow.
1. F.P. Lossing in Mass Spectrometry, ed. by C.A. McDowell,
McGraw-Hill. (1963).
2. S.N. Foner and R.L. Hudson, J. Chem. Phys. 21, 1374 (1953).
*S.N.Foner in.Adv. in Atomic and.Molecular Physics, 2, 385 (1966).
3. D.R. Herschbach in Molecular Beams, ed. by J. Ross, Interscience
(1966), pp. 322-328; L. Wharton, R.A. Berg and W. Kleinperer, J.
Chem. Phys. 12, 2023 (1963); R.A.Berg, L. Wharton, W.Klemperer,
A. B~chler and J.L. Stauffer, J. Chem. Phys. Al, 2416 (1965).
4. N. Ramsey, Molecular Beamt, oxford (1956), p. 19.
5. R. Weiss, Rev. Sci. Instr. 32, 397 (1961).
6. G.R. Hanes, 3. Appi. Phys. 31, 2111 (1960).[
7. K. Skdld, Nuclear I. and M., §J 114 (1968); C.A. Visser,
J. 1-iolleswinkel and J. Los, Sci. Inst., 2, 488 (1970);
V.L. Hirschy, thesis, Florida State University (1969). A copy
of this thesis was kindly provided by J.P. Aldridge, who re-
ported on the technique at the Amdur Conference on the Dynamics
of Molecular Collisions, Oak Ridge (1970).
8. F.C. Fehsenfeld, K.M. Evenson and H.P. Broida, Rev. Sci. Instr.
3L6, 294 (1965).

22.
9. D.G. Andersen, R.A. Gerber and G.F. Santer, Rev. Sci. Instr.
S412 (1964).
10. F.A. Baker and J.B. Hastead, Phil. Trans. Roy. Soc. London
261A, 33 (1966); P.A. Redhead, Can. J. Phys. Aý, 1791 (1967);
J.M. Pendleburg and K.F. Smith, J. Sci. Instr. (1966), p.6.
11. Both sets of data were taken with wheel velocities of ca.
20 cps, which is considerably slower than is usually employed
for the pulsed-beam method. At this velocity our best a
priori estimate of the time resolution due to the duration of
the beam pulse and length of the detector is 600 iLsec for the
pulsed-beam mode and 450 pLsec for the random modulation mode.
As can be seen in Fig. 6, data taken by the latter technique
provides a slightly narrower TOF distribution.
12. A. Carrington, D. Levy and T.A. Miller, J. Chem. Phys. _,
4093 (1966).
13. Since some slight sulfur deposits are formed on the walls,
conditions are similar to those used to produce S 20 in
D.J. Meschi and R.J. Meyers, J. Mol. Spectry. 3, 403 (1959);
J. Am. Chem. Soc. 78, 6220 (1956).

i
23.
Figure Captions
Fig. 1: Side view of molecular beam analyzer: A-electrrnbombard-
ment ionizer: B-magnet pole tips; C-variable slits; D-
electron multiplier, E-variable leak valve; F-directional
entrance; G-flexible metal belows; H-straight-through
valve; J-pulser or modulator; K-magnetic pickup; L-motor;
_M-rotary motion feedthrough; N-bearing; P-moveable
obstacle; Q-electric quadrupole field; R-high voltage
terminal; S-reactor.
Fig. 2: Top view of electron bombardment ionizei.
Fig. 3: Left, disk for modulating the molecular beam; Center, disk
for pulsing the molecular beam; Right, disk for random !
modulation of the molecular beam.
Fig. 4, Top view of beam source: A-microwave cavity; B-moveable
inlet; C-teflon vacuum seal; D-sampling oritice; E-"quick.-
connects"; F-sight tube; G-collimator; H-light trap.
Fig. 5: Block diagram of sigral processing electronics.
Fig. 6: Time-of-flight distributionp for 02 at m/e-32. o -- pulsed
beam method,e -- random modulation method. Line is best fit
to a dN v 3exp(-mv 2/2kT)dv distr.ibution convoluted with
a 600 ýLsec square wave.

24.
Fig. 7: Dependence of time-of-flight curves on the molectilar
weight of the beam molecule: A-H 2 , B-D 2 , C-NH3 , D-H2 0,
E-Ne, F-N 2 , G-02 , H-Ar(36), I-Ar(40), J-C0 2 , K-NO2 ,
L-SO2.
Fig. 8: Time-of-flight distributions at m/e - 19.
Source contains 0.5 Torr of CF4 and is excited by a
microwave discharge in the upper two curves.

00
w~ Ai
w
a:L
w -
0 -Ch

z0.CD
W w) w U.Lw~~~ 00 -I <2
0z 0 a)
w
(D
00
CD Y
RE ) ___a
<D -
wF-0 _ _
-10
w 'au -J
w1
-J
Wa 2I-1 0
(1) w0
0CL

r()0U-
w

Bf
STOPCOCK-ý
"GLASS TUBING
FIG. 4

Iii
W W
tS - w WW 44_ ~ ~ ~ ~ L - n~1 0_ _ _ _ _
IIi 0
zz
44 44 W
0 LiiLiJ~ ___T
T i r ( J WT I(I40 -c.i
0 o w 4 0 E N

00
- 00
000
40 0000 0I- 0
0o 000
w 00 0
0e
D- 0 0
0• 00
40
0
0
00
I . . ... 1 I .... I .. I
0.00 1.0 2.0 3.0 4.0 5.0 6.0TIME (MSEC)
FIG. 6

3.0-
2.0-F00O
wD
OL
0~000
1.0 -
I~L
0 2468
FIG. 7

*00I030
4..0C0'0E
C C-is me-0 Oc 00
0�L. h.000 0*c .�0 mc0 �4-� 0U) U)(I) U)
em em
000 0I I I
00U)E
H 6 &

•° Unclassif iedS• d 5,,UritN, L 1,issthPctiorn
DOCUMENT CONTROL DATA , R & Dt I " f.I, atI. .. ' titfe, I ", I ",• , trI I -11d 11 l. ., •r tnhin nn.m t Io entered when the overall report i claslited)
I OL1k'l'qA [!P• AC I'V TY ('or()t~te ••H~ir) 20. REPOR•T SICCURI'TY CLASSlkFICATION
Princeton University[ Uncl asifledPrinceton, New Jersey 08540 2b. GROUP
Molecular Beam Analyzer for Identifying Transient Intermediates inS~Gaseous Reactions
4 ['E-CRIP1 •IVE NITES (7ý'pe of r~po,,t "•d incuI ve dat•
Technica Report - to b lished in Chemical InstrumentationS'3 AU Tý4OR(Sl (j-'Irt rijime, m:(ddle inijtial, los•t jji4nffý)
Myron J. Kaufman and Charles E. Kolb
6 REPORT DATE 7a. TO TAL NO. OF PAGES 7b. NO. OF REPS
January 1971 32 21=8. CONTRACT OR GRANT NO go. ORIGINATOR'S REPORT NUMBERIS)
ONR N0014-67-A0151-0013h. PROJECT NO 2
NR 092-531V. gh. OTHER HEPCJRT NO(S) (Any other numbers that may be assigned
this report)
!1 d.
10 DISTRIBUTION STATEMENT
Distribution of this document is unlimited
II SUPPLEMENTARY NOTES 12, SPONSORING MILITARY ACTIVITY
New Method for Monitoring Transient Power BranchIntermediates in Gas-Phase Reactions Office of Naval Research
1I ABSTRACT
When using a mass spectrometer to monitor free radical and atom in-termediates in rapid gas-phase reactions, identification of the parentspecies of each ion is made difficult by fragmentation processes thatoccur at electron energies necessary for optimum ionization cross sec-tions. Molecular beam analysis is a new approach to this problemwhereby molecular beam measurements are used to characterize neutralspecies before they are ionized. Thus, the trajectory of a particle ian inhomogeneous magnetic field shows whether or not it has a large maanetic moment characteristic of a free radical, its motion in an in-homogeneous electric field indicates its symmetry and the magnitude ofits electric dipole moment, and its velocity distribution determinesits mass when the source temperature is known. Using these techniques,various atom, free radical and unstable molecular species have beenidentified in gases excited by microwave discharge or as products ofatom-molecule reactions.
DD, FI-1473 (PA(,[ I. Unclassified-Scuritv Classification

Unclaspif iedSecurity Classification
14 INK A LtNK B L.,IN K CKEY WORDS V W' ROLE WT T
Mass spectrometer 10 3
Free radicals 8,4 3
Molecular beams 10 3
Chemical kinetics 8,4 2
Gas-phase reactions 5 2
Electric discharges 10 2
DD Nov 1 .4 7 3 (AUnclassified(PAGE 2) Security Clas fical.on