Embed Size (px)
Citation preview
Interim ResultsSix Months to 30 September 2005
8 December 2005

Interim Results to 30 September 2005
Dominique Dominique HHéériardriard DubreuilDubreuil
Interim Results to 30 September 2005
Good ResultsGood Results
Good results, in line with our objective to deliver
a significant improvement in profitability
Interim Results to 30 September 2005
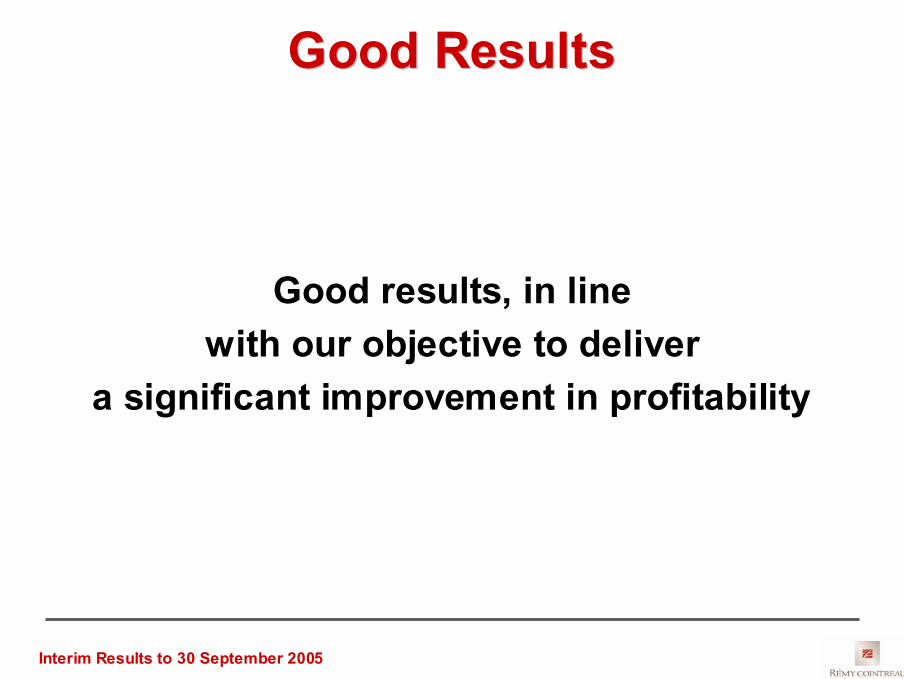
Good ResultsGood Results
Organic growth in turnover: + 4%
Operating profit on ordinary activities: + 19.6% (organic)
Net profit up by €42.9m (multiplied by 2.3)
Earnings per share: €0.95 (€0.42 at September 2004)
Reduction in debt– Down 6.3% vs March 2005– Down 13.7% vs September 2004
Interim Results to 30 September 2005
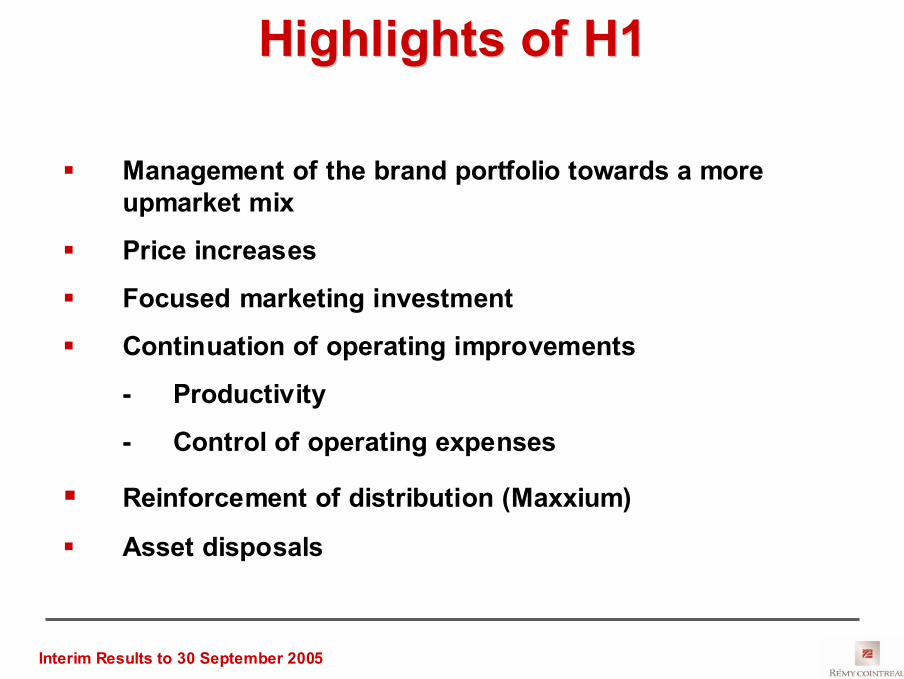
Highlights of H1Highlights of H1
Management of the brand portfolio towards a more upmarket mix
Price increases
Focused marketing investment
Continuation of operating improvements
- Productivity
- Control of operating expenses
Reinforcement of distribution (Maxxium)
Asset disposals
Interim Results to 30 September 2005
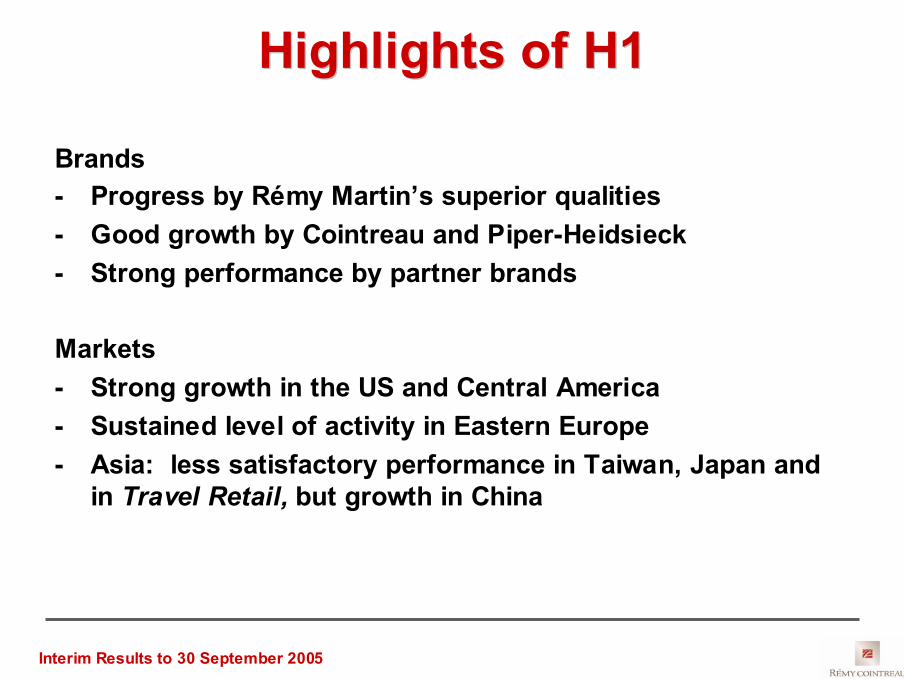
Highlights of H1Highlights of H1
Brands- Progress by Rémy Martin’s superior qualities- Good growth by Cointreau and Piper-Heidsieck- Strong performance by partner brands
Markets- Strong growth in the US and Central America- Sustained level of activity in Eastern Europe- Asia: less satisfactory performance in Taiwan, Japan and
in Travel Retail, but growth in China

Interim Results to 30 September 2005
-+ 130% 18.742.9Net profit – Group share
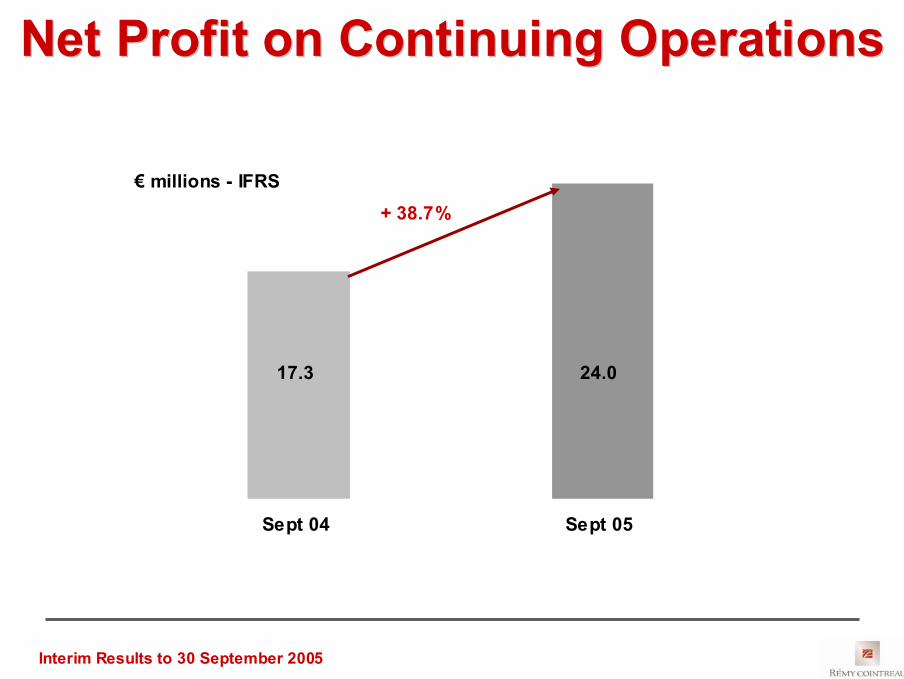
-+ 38.7%17.324.0%Profit from continuing operations
OrganicGross
-+ 27.0%50.764.4Operating profit
15.6%
60.3
386.9
Sept 04
-
+ 6.8%
+ 2.8%
Growth
+ 17.9%16.2%Operating margin
+ 19.6%
+ 4.0%
64.4Operating profit on ordinaryactivities
397.8Turnover(exc. Polish vodkas*)
Sept 05€ millions
* Sold in August 2005
Key FiguresKey FiguresNet operating profit on ordinary activities + 19.6%
Interim Results to 30 September 2005
JeanJean--Marie Marie LabordeLaborde

Interim Results to 30 September 2005
MaxxiumMaxxium
Agreement with our three partners in Summer 2005Additional €300m turnover for MaxxiumConsiderable strengthening of the Spanish, German and Canadian distribution networksJim Beam Brands retains the distribution of Courvoisier, Teacher’s and Laphroaig outside MaxxiumShareholding parity unchangedShared visionStrengthened ambitions

Interim Results to 30 September 2005
TurnoverTurnover
Sept 04 Sept 05
386.9*
(4.4) + 15.3
397.8*
Currencyimpact
Activity
€ millions - IFRS
Organic growth + 4.0%
*Excluding Polish vodkas sold in August 2005

Interim Results to 30 September 2005
By activity By geographic area
Europe 39.7% Americas 44.0%
Asia & Others16.3%
Cognac 38.7%Champagne 12.2%
Third Party Products15.1%
Liqueurs & Spirits 34.0%
TurnoverTurnover
Interim Results to 30 September 2005
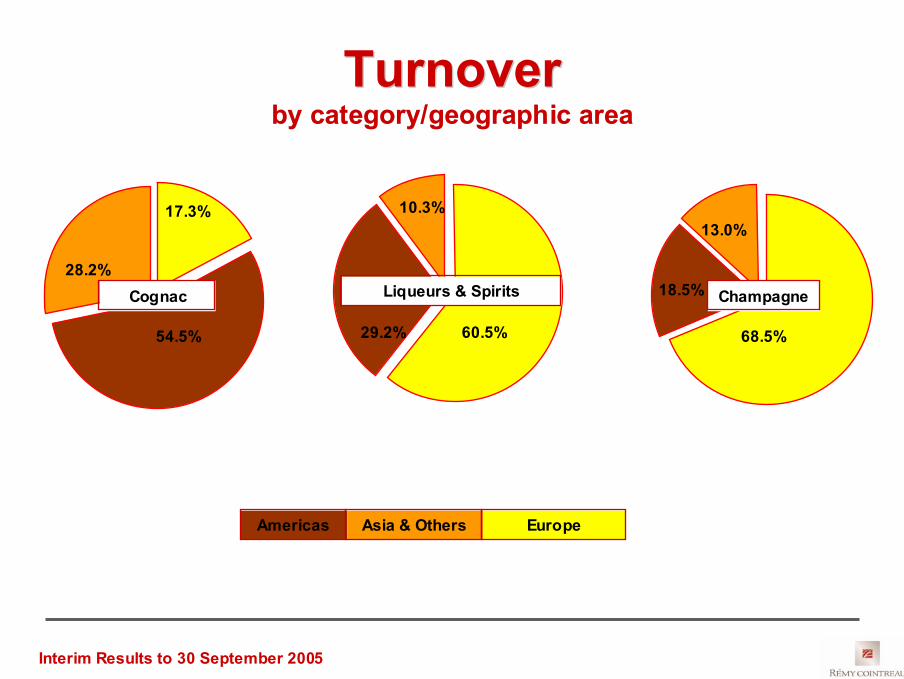
TurnoverTurnoverby category/geographic areaby category/geographic area
17.3%
28.2%
54.5%
Cognac Champagne
68.5%
13.0%
18.5%
Americas Asia & Others
Liqueurs & Spirits
60.5%29.2%
10.3%
Europe

Interim Results to 30 September 2005
Organic growth + 19.6%
60.3 64.4
Sept 04 Sept 05
Volume Price/MixCurrencyimpact
A & P Others
(8.1) + 3.3+ 4.1+ 3.0
+ 1.8
€ millions - IFRS
Operating Profit on Operating Profit on OrdinaryOrdinary ActivitiesActivities
Interim Results to 30 September 2005
17.3
€ millions - IFRS
Net Profit on Continuing OperationsNet Profit on Continuing Operations
Sept 04 Sept 05
24.0
+ 38.7%
Interim Results to 30 September 2005
Review of ActivitiesReview of Activities
Interim Results to 30 September 2005
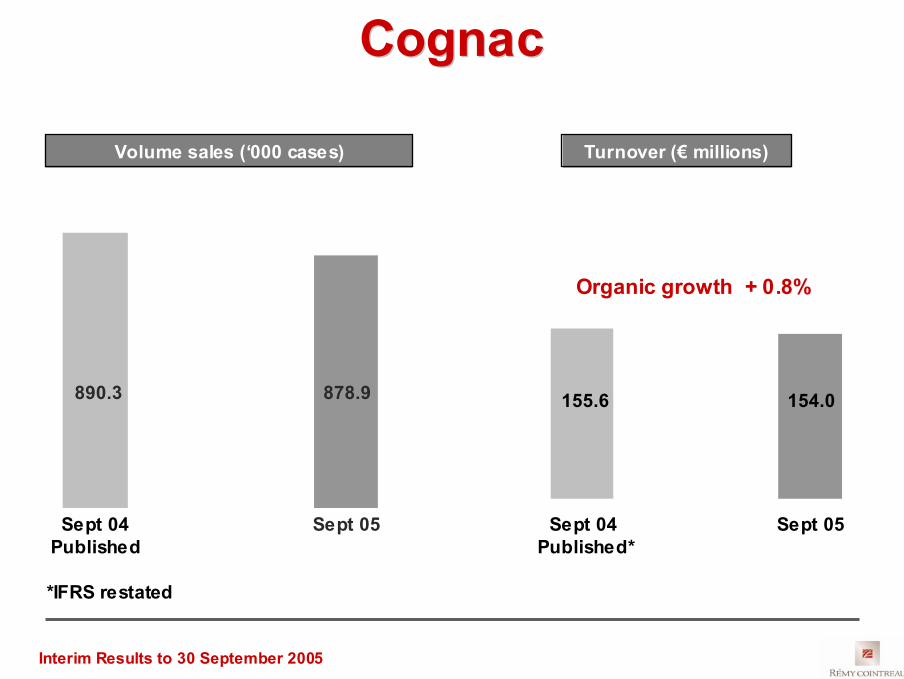
154.0155.6
Sept 04Published*
Sept 05Sept 05
890.3 878.9
CognacCognac
Turnover (€ millions)
Organic growth + 0.8%
Volume sales (‘000 cases)
Sept 04Published
*IFRS restated
Interim Results to 30 September 2005
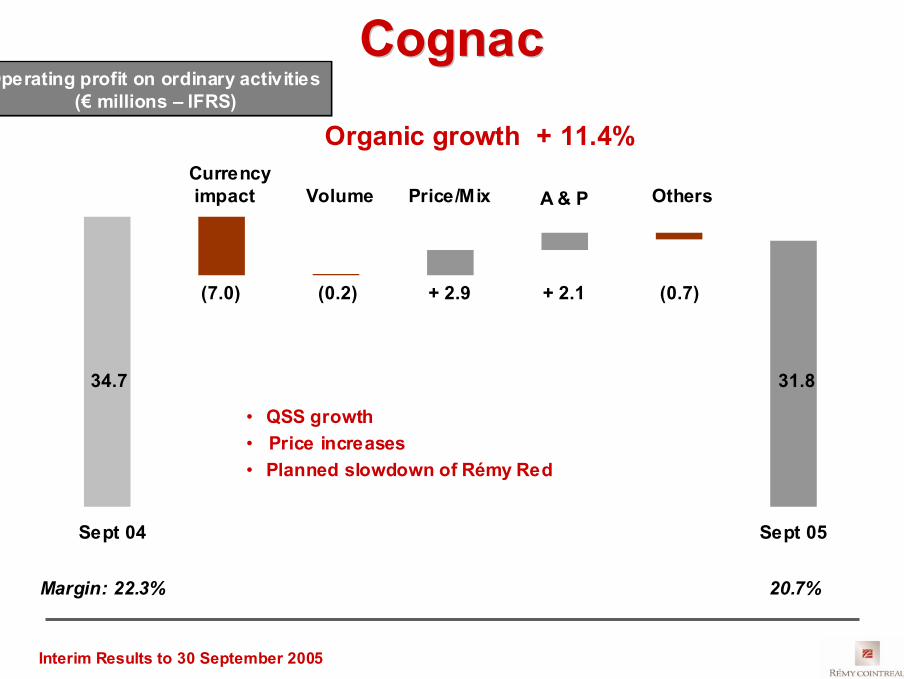
Operating profit on ordinary activities(€ millions – IFRS)
Margin: 22.3% 20.7%
CognacCognac
34.7
(7.0)
Others
Sept 04 Sept 05
+ 2.1+ 2.9
Price/Mix
(0.7)
Currencyimpact
31.8
Organic growth + 11.4%
A & P
• QSS growth• Price increases• Planned slowdown of Rémy Red
Volume
(0.2)
Interim Results to 30 September 2005
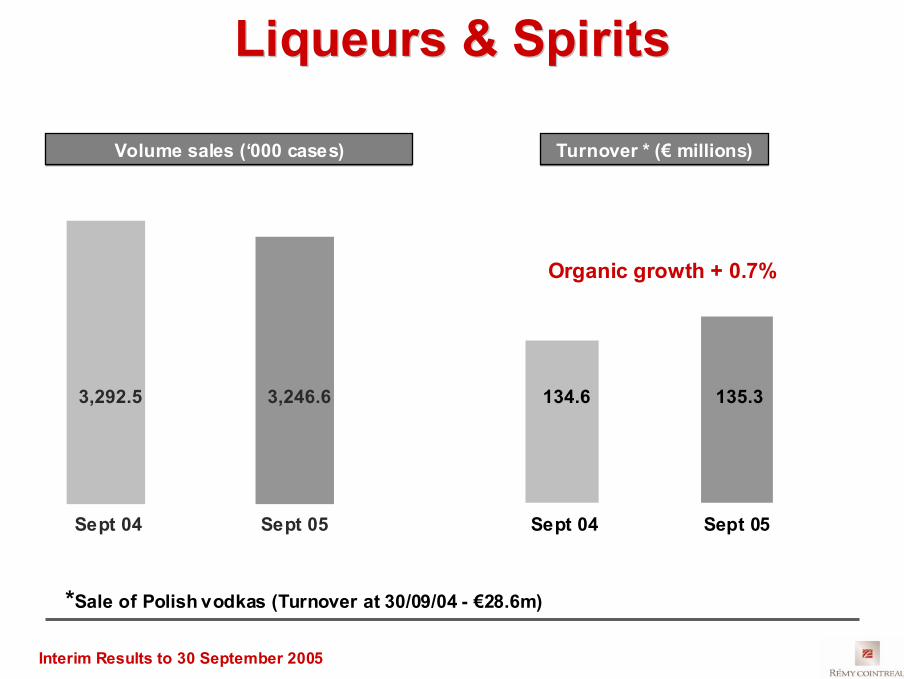
135.3
Sept 05
134.6
Sept 04Sept 05Sept 04
3,292.5 3,246.6
Liqueurs & SpiritsLiqueurs & Spirits
Turnover * (€ millions)
Organic growth + 0.7%
Volume sales (‘000 cases)
*Sale of Polish vodkas (Turnover at 30/09/04 - €28.6m)

Interim Results to 30 September 2005
Liqueurs & SpiritsLiqueurs & SpiritsOperating profit on ordinaryactivities (€ millions - IFRS
• Growth of Cointreau (Americas and Europe)• Growth of Bols Liqueurs, Saint Rémy and
Mount Gay Rum• Cost improvements
Margin: 18.3 % 21.6%
Organic growth + 20.9%
24.6
+ 1.6+ 2.6+ 1.4(0.7)
Currencyimpact
Price/MixVolume
29.2
A & P
(0.3)
Others
Sept 05Sept 04

Interim Results to 30 September 2005
332.6* 333.5
Sept 05Sept 04 (427.4 published)*
48.7
Sept 05
48.1*
Sept 04(54.0 published)*
ChampagneChampagneTurnover (€ millions)
Organic growth + 1.9%
Sales volumes (‘000 cases)
• Change in Group structure at 01/04/05: Sparkling wine business reclassified within Third Party Brands
Interim Results to 30 September 2005
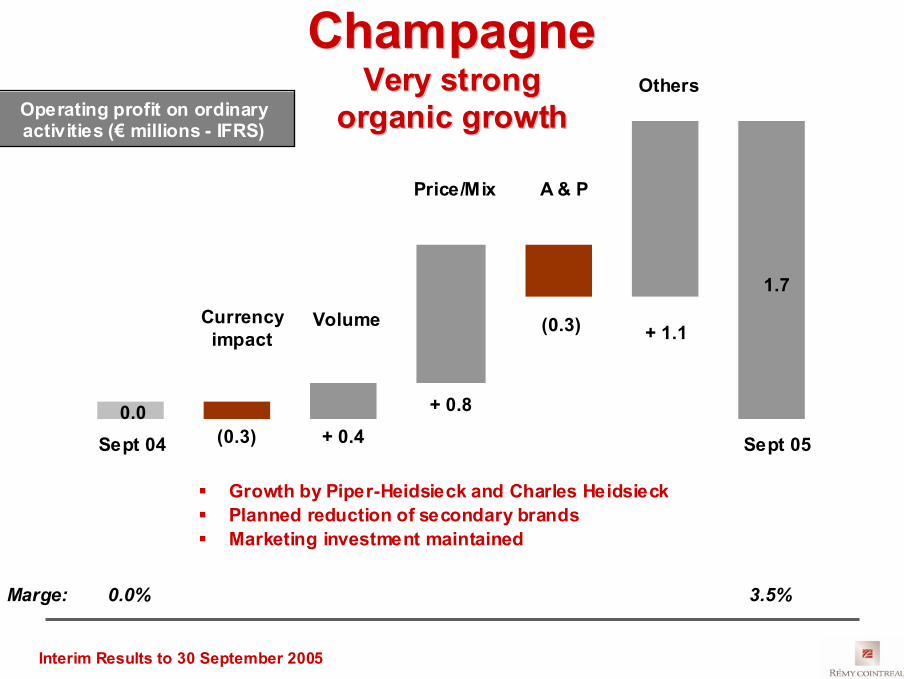
ChampagneChampagneVery strongVery strong
organic growthorganic growth
Growth by Piper-Heidsieck and Charles HeidsieckPlanned reduction of secondary brandsMarketing investment maintained
0.0
(0.3)
1.7
Sept 05(0.3)Sept 04
Volume
+ 0.8
Price/Mix
Others
+ 0.4
+ 1.1Currency
impact
A & P
Operating profit on ordinaryactivities (€ millions - IFRS)
Marge: 0.0% 3.5%

Interim Results to 30 September 2005
48.6 59.8
Sept 04 Sept 05 Sept 04
1.71.0
Sept 05
Turnover
Organic growth + 25.3%
Partner BrandsPartner Brands
€ millions - IFRS
Organic growth + 81.1%
Operating profit on ordinaryactivities
Interim Results to 30 September 2005
HervHervéé DumesnyDumesny

Interim Results to 30 September 2005
Summary of Operating ProfitSummary of Operating Profit
(5.1%)(5.1%)(41.2)(39.1)Administrative expenses
+ 46.2%+ 46.2%3.95.7Other income and expenses
(1.3%)(1.9%)(107.7)(105.6)Sales & marketing expenses
+ 3.2%(0.9%)205.3203.4Gross profit
-+ 27.0%50.764.4Operating profit
--(9.8)-Other operating expenses
15.6%
60.3
386.9
Sept 04
-
+ 6.8%
+ 2.8%
Published growth
17.9%16.2%% of turnover
+ 19.6%
+ 4.0%
Organic growth
64.4Operating profit on ordinaryactivities
397.8Turnover
Sept 05€ millions - IFRS

Interim Results to 30 September 2005
50.764.4Operating profit
(26.4)(32.5)Financial charges
17.324.0Net profit from continuing operations
1.32.3Share in profits of associated undertakings (Maxxium – Dynasty)
(8.3)
24.3
60.3
Sept. 04
(10.2)Taxation
31.9Profit before tax
64.4Operating profit from ordinary activities
Sept. 05
Net profit from Continuing OperationsNet profit from Continuing Operations(€ millions - IFRS)

Interim Results to 30 September 2005
2.815.1Net profit from discontinued operations
18.742.9Net profit – Group share
(1.4)3.8Minority interests
20.1
17.3
Sept. 04
39.1Net profit
24.0Net profit from continuing operations
Sept. 05
Net Profit Net Profit –– Group ShareGroup Share(€ millions - IFRS)
Interim Results to 30 September 2005
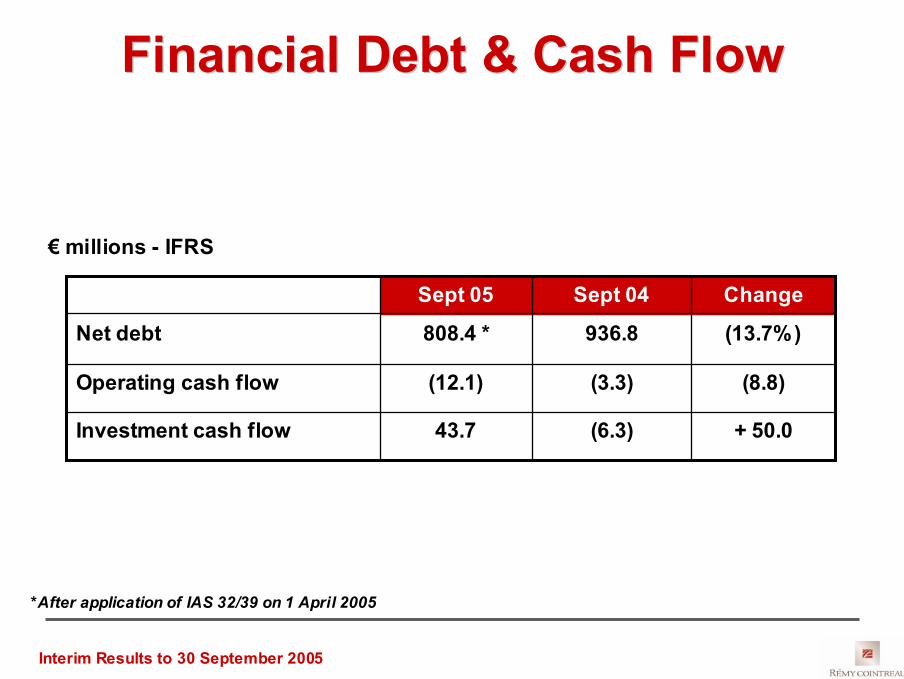
(8.8)(3.3)(12.1)Operating cash flow
+ 50.0(6.3)43.7Investment cash flow
(13.7%)936.8808.4 *Net debt
ChangeSept 04Sept 05
Financial Debt & Cash FlowFinancial Debt & Cash Flow
€ millions - IFRS
*After application of IAS 32/39 on 1 April 2005

Interim Results to 30 September 2005
Impact of IFRSImpact of IFRS
Interim Results to 30 September 2005
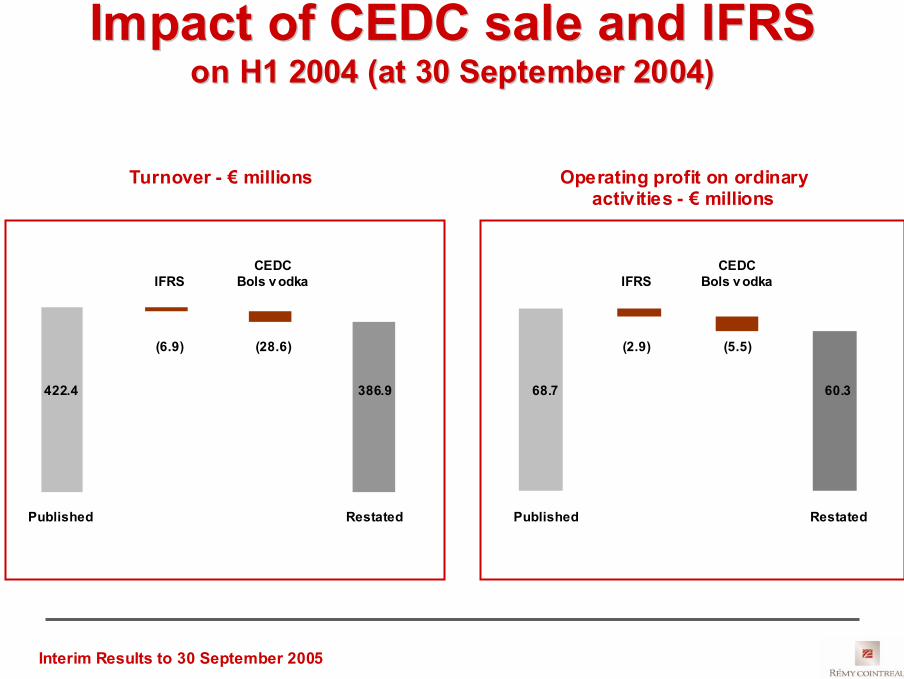
Impact of CEDC sale Impact of CEDC sale andand IFRSIFRSon H1 2004 (on H1 2004 (atat 30 30 SeptemberSeptember 2004)2004)
Turnover - € millions Operating profit on ordinaryactivities - € millions
Published Restated
422.4
(28.6)(6.9)
386.9
CEDCBols v odkaIFRS
68.7 60.3
CEDCBols v odkaIFRS
(2.9) (5.5)
Published Restated
Interim Results to 30 September 2005
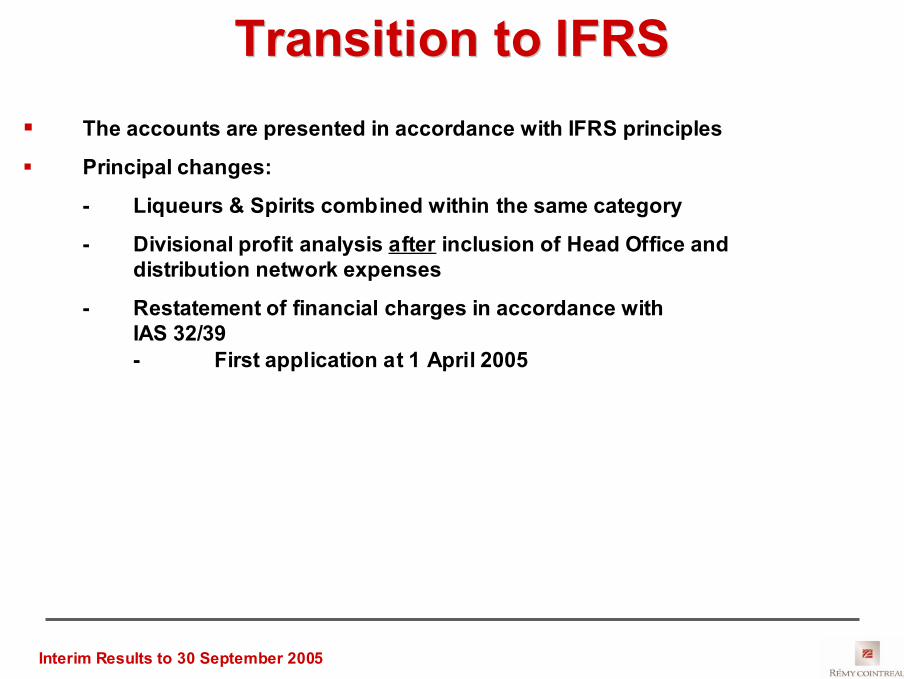
Transition to IFRSTransition to IFRSThe accounts are presented in accordance with IFRS principles
Principal changes:
- Liqueurs & Spirits combined within the same category
- Divisional profit analysis after inclusion of Head Office and distribution network expenses
- Restatement of financial charges in accordance with IAS 32/39 - First application at 1 April 2005

Interim Results to 30 September 2005
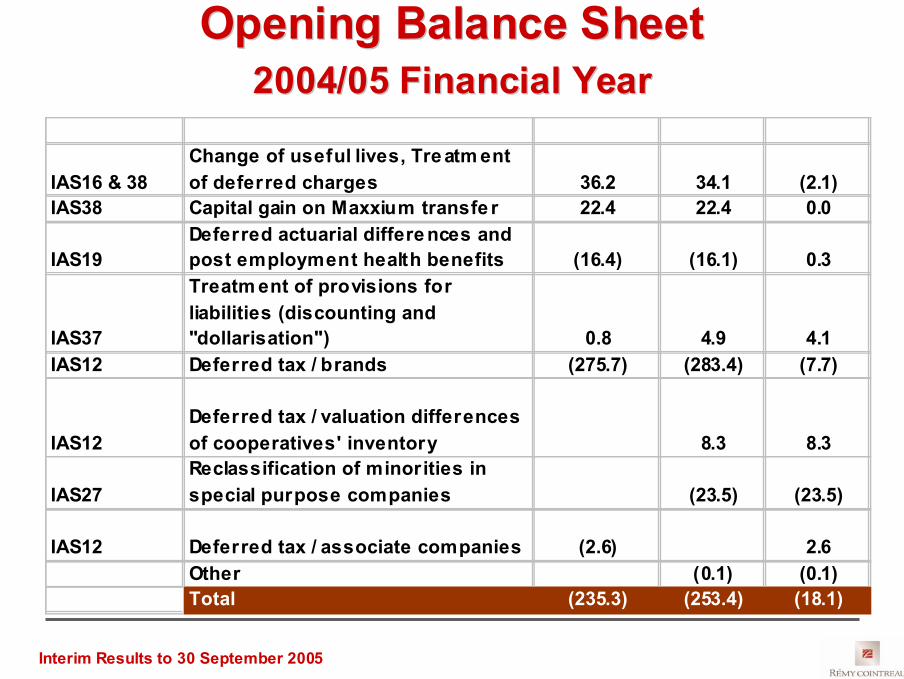
Opening Balance SheetOpening Balance Sheet2004/05 Financial Year2004/05 Financial Year
The preliminary transition Balance Sheet presented last June showed a decline of €235m in IFRS shareholders’equity at 31 March 2004 (€1,111m to €876m)
In the final transition Balance Sheet shareholders’ equity declined by €253m (€1,111m to €858m)
The difference is thus a reduction of €18m detailed as follows …
Interim Results to 30 September 2005
IAS16 & 38Change of useful lives, Tre atm ent of deferred charges 36.2 34.1 (2.1)
IAS38 Capital gain on Maxxium transfe r 22.4 22.4 0.0
IAS19Deferred actuarial differe nces and post employment health benefits (16.4) (16.1) 0.3
IAS37
Treatm ent of provisions for liabilities (discounting and "dollarisation") 0.8 4.9 4.1
IAS12 Deferred tax / brands (275.7) (283.4) (7.7)
IAS12Deferred tax / valuation differences of cooperatives' inventory 8.3 8.3
IAS27Reclassification of minorities in special purpose companies (23.5) (23.5)
IAS12 Deferred tax / associate companies (2.6) 2.6Other (0.1) (0.1)Total (235.3) (253.4) (18.1)
Opening Balance SheetOpening Balance Sheet2004/05 Financial Year2004/05 Financial Year
Interim Results to 30 September 2005
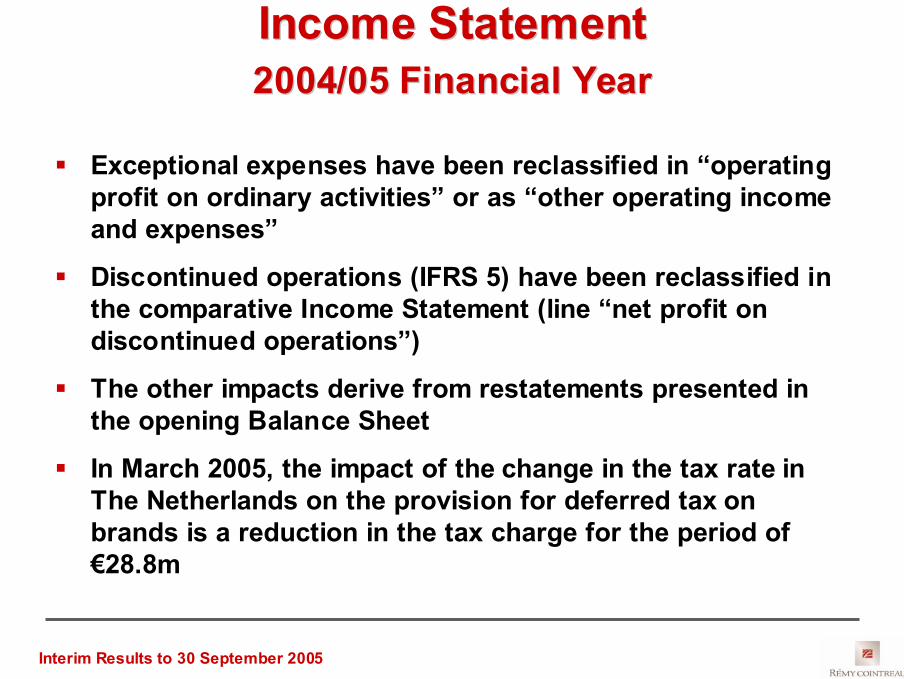
Income StatementIncome Statement2004/05 Financial Year2004/05 Financial Year
Exceptional expenses have been reclassified in “operating profit on ordinary activities” or as “other operating income and expenses”
Discontinued operations (IFRS 5) have been reclassified in the comparative Income Statement (line “net profit on discontinued operations”)
The other impacts derive from restatements presented in the opening Balance Sheet
In March 2005, the impact of the change in the tax rate in The Netherlands on the provision for deferred tax on brands is a reduction in the tax charge for the period of €28.8m
Interim Results to 30 September 2005
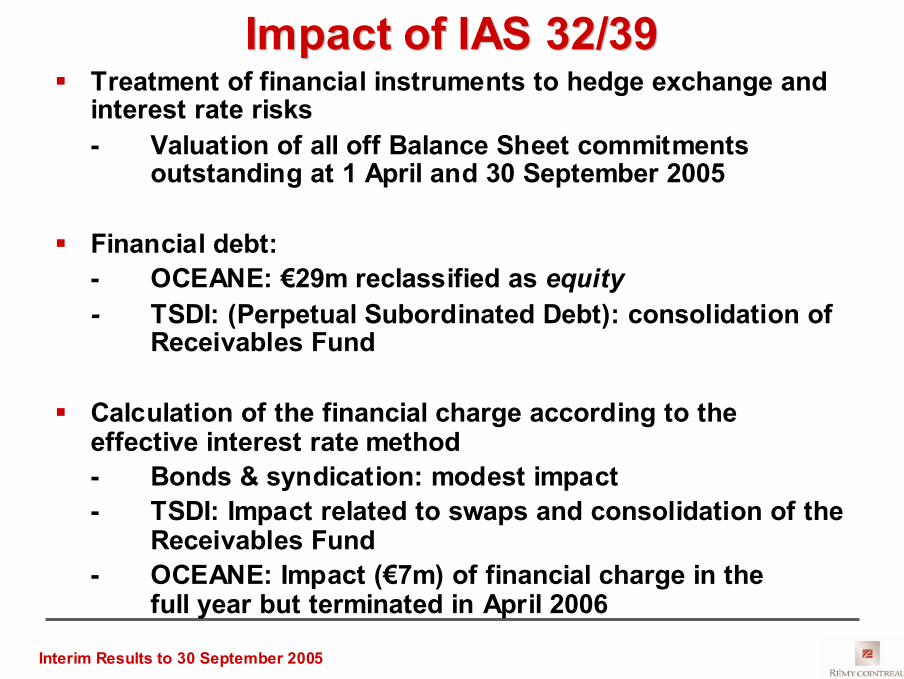
Impact of IAS 32/39Impact of IAS 32/39Treatment of financial instruments to hedge exchange and interest rate risks- Valuation of all off Balance Sheet commitments
outstanding at 1 April and 30 September 2005
Financial debt:- OCEANE: €29m reclassified as equity- TSDI: (Perpetual Subordinated Debt): consolidation of
Receivables Fund
Calculation of the financial charge according to the effective interest rate method- Bonds & syndication: modest impact- TSDI: Impact related to swaps and consolidation of the
Receivables Fund- OCEANE: Impact (€7m) of financial charge in the
full year but terminated in April 2006

Interim Results to 30 September 2005
2,353.22,473.22,422.1Total assets
20,833,633,6Cash
1,137.71,150.31,165.9Current assets
4.212.012.0Derivative financial instruments
4.86.518.7Tax recoverable
283.2286.4295.3Trade accounts receivable
845.5845.4839.9Inventories
1,194.71,289.31,222.6Non-current assets
2.14.07.2Deferred tax assets
72.610.725.2Investments
115.495.973.2Associate companies
1,004.61,178.71,117.0Tangible and intangible assets
2005IFRS standards
2004IFRS standards
2004 French standards
€ millions
Balance Balance SheetSheet atat 30 30 SeptemberSeptemberAssetsAssets
Interim Results to 30 September 2005
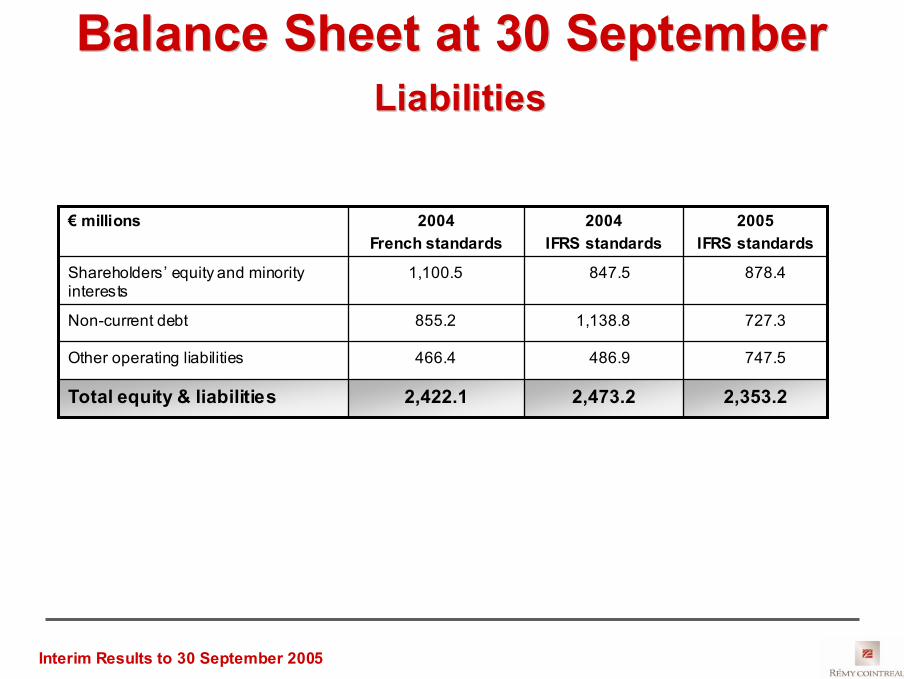
Balance Balance SheetSheet atat 30 30 SeptemberSeptemberLiabilitiesLiabilities
2,353.22,473.22,422.1Total equity & liabilities
747.5486.9466.4Other operating liabilities
727.31,138.8855.2Non-current debt
878.4847.51,100.5Shareholders’ equity and minorityinterests
2005IFRS standards
2004IFRS standards
2004French standards
€ millions
Interim Results to 30 September 2005
2005/062005/06Outlook for H2Outlook for H2

Interim Results to 30 September 2005
Resolute concentration on key brands
Positive trend in the US
Strengthening of distribution networks in China and Russia
Asset disposal programme (Bols and other non-core brands)
Outlook for H2Outlook for H2

Interim Results to 30 September 2005
2005/06 Financial Year2005/06 Financial Year
Concentration of resources on key objectives- Targeting premium brands- Priority on profitability- Disposal of non-core assets
Double-digit organic growth of operating profit on ordinary activitiesfor the financial year